Embed Size (px)
Citation preview

China Council for International
Cooperation on Environment and
Development (CCICED)
Investment, Trade, and Environment
Main Topics Report by the CCICED Task Force on
Investment, Trade, and Environment
CCICED 2011 Annual General Meeting
November 14-15, 2011
Task Force Members
Co-chairs*
Jiahua Pan, Director and Researcher, Institute for Urban Development and
Environmental Studies, Chinese Academy of Social Sciences
John M. Forgach, McKluskey Fellow, Yale University Graduate School of
Forestry & Environmental Studies, Chairman of ForestRe Ltd, UK
Task Force Members*
Shantong Li, Research fellow, Department of Development Strategy and
Regional Economy, Development Research Center of the State Council
Guomei Zhou, Deputy Director, China-ASEAN Center of Environmental
Protection Cooperation
Yansheng Zhang, Director of the Institute for International Economics
Research of the National Development and Reform Commission
Yuyan Zhang, Director and Researcher, Institute of World Economics &
Politics, Chinese Academy of Social Sciences
David Runnalls, Former President of the International Institute for Sustainable
Development; Distinguished Fellow, Centre for International Governance
Innovation; Acting Director, Sustainable Prosperity
Simon Zadek, Senior Fellow, Global Green Growth Institute; Senior Fellow,
Centre for International Governance Innovation
Motoko Aizawa, Sustainability Advisor, Business Advisory Services Vice
Presidency, International Finance Corporation
Valli Moosa, South African Member of the CCICED and Former South
African Minister of Environmental Affairs and Tourism
Ismid Hadad, Senior Advisor on Climate Finance and Carbon Trade,
Indonesia’s National Council for Climate Change
Li Lin, Deputy Representative at the World Wildlife Fund (WWF) China
Research Support Team
Ying Chen, Head and Research Fellow, Research Office of Sustainable
Development, Institute for Urban Development and Environmental Studies,
Chinese Academy of Social Sciences
Jianping Zhang, Director and Research Fellow, Institute for International
Economics Research, National Development and Reform Commission
Tao Hu, Research Fellow, Policy Research Center, Ministry of Environmental
Protection
Xia Li, Associate Research Fellow, China-ASEAN Center of Environmental
Protection Cooperation
Jianwu He, Associate Research Fellow, Development Research Center of the
State Council
Ying Zhang, PhD, Institute for Urban Development and Environmental
Studies, Chinese Academy of Social Sciences
Zhe Liu, PhD, Institute for Urban Development and Environmental Studies,
Chinese Academy of Social Sciences
Laihui Xie, PhD, the Institute of World Economics & Politics, Chinese
Academy of Social Sciences
Changyi Liu, PhD candidate, Institute for Urban Development and
Environmental Studies, Chinese Academy of Social Sciences
Coordinators
Ying Chen, Head and Research Fellow, Research Office for Sustainable
Development, Institute for Urban Development and Environmental Studies,
Chinese Academy of Social Sciences
Huihui Zhang, Project Manager, International Institute for Sustainable
Development
* Co-Chairs and Task Force members serve in their personal capacities.
Background
Significant progress has been made in achieving sustainable development in China,
but there are still many challenges ahead. In this study we examine the impact of
international investment and trade on the environment and analyze how China could
leverage its international trade and investment activities to advance a “green shift” of
the economy.
The China Council for International Cooperation on Environment and Development
(CCICED) has carried out numerous related studies over the years, including research
into the illegal trade of endangered species in China; China’s application for accession
to the World Trade Organization (WTO) and its impact on the environment;
international environmental certification standards; environment-related non-tariff
trade barriers; and an environmental analysis of the value chain of certain
commodities.
However, as the country increases its global presence, the nature of its trade is
evolving. China must carefully measure how it can mitigate the current and potential
environmental impacts of this changing landscape. China must also manage a rapidly
growing volume of goods traded and produced through its investment activities. The
impacts on the environment are continuously changing, and the role of these activities
vis-à-vis sustainable development is becoming more complex to understand by the
day.
The rules of the game must also be constantly examined; the non-stop review of
regulations and their environmental provisions has made compliance more
challenging. It is important to pay close attention to this rule-making process as some
of the new measures could lead to new rounds of green protectionism. Following
these changing policy dynamics is essential for a country like China, which is not
only a late-comer to the business of international investment and trade, but has
become one of the major players in international trade and investment. In such a
dynamic context, China must rapidly identify the changing opportunities to
implement new trading and investment policies that will help accelerate its shift
towards the green development goals it has established for itself.
As energy and natural resources become increasingly scarce and expensive, it is
imperative that China make use of its strategic position as a large emerging economy
in transition to engage in the green transformation process. This engagement will help
the country achieve clean, sustainable, and competitive economic development. As it
engages in the process of “going global,” China must embrace its responsibilities as a
leading player and become a proactive actor in promoting its environmental programs
both at home and abroad.
China’s policies for absorbing foreign direct investment (FDI) have started to change.

However, a much greater research effort is needed to understand the principles,
measures, and effects of its actions in terms of hosting FDI and making foreign
investments (outward direct investment – ODI). The process has already started as
China has taken some actions to regulate ODI, and some Chinese firms going abroad
are adopting voluntary corporate social responsibility (CSR)1 measures that conform
to international investment standards. Nevertheless there is still much to do. China
should carefully study existing international practices in order to select, improve,
adapt, and adopt those that will help the country excel in environmental stewardship.
The Task Force explored the green shift in FDI in China, China’s ODI, and China’s
international trade. In terms of FDI and the environment, the main issue is
determining what sort of investment should be encouraged and what policy measures
should be adopted to ensure that FDI contributes to the green shift and sustainable
development. With respect to ODI, the main question revolves around what policies
China should develop to strengthen its CSR and environmental performance, and
improve the reputation of its overseas enterprises and the country itself. In an effort to
arrive at reliable conclusions and sound recommendations, the Task Force
endeavoured to obtain first-hand information and materials, carrying out field trips in
countries where China’s ODI and trade are more concentrated, specifically Indonesia,
South Africa, and Zambia.
Over and above the need to manage domestic policies on the subject, China should
evaluate rules and standards relating to international investment, trade, and the
environment and help redesign them as necessary to promote a green transformation.
China should not only safeguard its own economic and environmental interests, but
through active engagement and leadership, the country should contribute to the
improvement of global governance. How to balance self-interest with global needs is
an important question for China to resolve. With the promotion of globalization and
China’s continuous emergence as a major economic power, the country will assume
ever larger responsibilities and face growing pressure from the international
community. Therefore, China should become proactive and help develop the
international rules on investment, trade, and environment. It should voice its position
on behalf of the interests of developing countries, and work towards playing a role in
the development of the latter. In this sense, the Task Force has focused on studying
how and where China can participate in the making of international rules, as it tries to
promote better international cooperation.
This research project seeks to describe the current state of Chinese international trade
and investment activities, and understand how they will affect the drive toward its
sustainable development and green shift goals. The study aims to provide realistic and
user-friendly recommendations that can be implemented to accelerate and expand the
positive contribution of investment and trade to the environment while the economy 1 Canada’s Department of Foreign Affairs and International Trade defines corporate social responsibility (CSR) as
“the way companies integrate social, environmental, and economic concerns into their values and operations in a
transparent and accountable manner.”
evolves. In this process, the Task Force also explored how China could cooperate with
trading partners and investment rivals to promote bilateral green shift opportunities.
Finally, the Task Force focused on how China could carry out multilateral cooperation
with the international community in the fields of investment and trade, helping
establish and improve relevant systems and mechanisms to promote a global green
shift.
The Investment, Trade and Environment Task Force, formally launched in June 2010,
held four plenary working meetings, three Chinese member meetings, and two
overseas field trips. It participated in the November 2010 CCICED Annual General
Meeting where it submitted an interim report; and participated in three CCICED
Secretariat and Chief Advisors Joint Working Meetings and reported on the progress
of the project. The five special topic reports of the main research document have been
subject to three revisions, forming five special topic reports, one summary report, one
policy suggestion, and two overseas research reports. Through the 18 months of
research and writing by the Chinese and overseas teams, the project report is being
submitted to the 2011 CCICED Annual General Meeting in the form of research
reports and policy recommendations.
Contents
CHAPTER 1 INVESTMENT, TRADE AND ENVIRONMENT: OVERVIEW ............................... 1
1.1 INTRODUCTION .............................................................................................................................. 1
1.1.1 Overall Framework of the report ............................................................................................ 1
1.1.2 Current Status of Import & Export Trade and the Environment in China ............................... 3
1.1.3 Foreign Direct Investment (FDI) and Outward Direct Investment (ODI) ............................... 5
1.1.4 Discharge and Treatment of Major Pollutants ........................................................................ 9
1.2 ENVIRONMENTAL IMPACT OF TRADE: ANALYSIS BASED ON INPUT-OUTPUT MODEL ................ 11
1.2.1 Sectoral Distribution of Pollutant Discharge ........................................................................ 12
1.2.2 Analysis of Embedded CO2 in China’s Foreign Trade ........................................................... 15
1.3 IMPACT OF ENVIRONMENTAL POLICY ON INVESTMENT AND TRADE: ON THE BASIS OF CGE
MODEL ............................................................................................................................................... 21
1.3.1 Introduction to the CGE Model ......................................................................................... 21
1.3.2 Environmental Policy Scenarios ........................................................................................... 27
1.3.3 Analysis of Results of Environmental Policy Simulation ....................................................... 28
CHAPTER 2 A STUDY ON THE ENVIRONMENTAL IMPACT OF FOREIGN DIRECT
INVESTMENT ..................................................................................................................................... 45
2.1 INTRODUCTION ............................................................................................................................ 45
2.1.1 Background Introduction ....................................................................................................... 45
2.1.2 Objectives .............................................................................................................................. 46
2.1.3 Literature Review .................................................................................................................. 47
2.2 CURRENT STATUS OF FOREIGN DIRECT INVESTMENT IN CHINA ............................................... 53
2.2.1 Definition of Foreign Direct Investment ................................................................................ 53
2.2.2 Current Status of Foreign Direct Investment and its Main Characteristics .......................... 54
2.3 SOCIAL AND ENVIRONMENTAL IMPACTS OF CHINA'S FOREIGN DIRECT INVESTMENT ............ 59
2.3.1 Environmental Policy Related to Foreign Direct Investment ................................................ 59
2.3.2 Development Stages and Environmental Impacts of Foreign Investment.............................. 62
2.3.3 Analysis on the Comprehensive Effect of Foreign Direct Investment .................................... 66
2.4 INTERNATIONAL COMPARATIVE STUDY ...................................................................................... 78
2.4.1 Comparison of FDI in Brazil, India and China .................................................................... 78
2.4.2 Comparison of Foreign Investment in China and the United States ..................................... 81
2.5 CASE STUDY ................................................................................................................................. 84
Case 1: Comparison of Transnational Corporations’ Environmental Information Disclosure and
Corporate Social Responsibility in China and in Other Regions ................................................... 84
Case 2: Attempting to Promote New Environmental Management Measures—Walmart’s Green
Supply Chain .................................................................................................................................. 89
2.6 OPPORTUNITIES AND CHALLENGES FACING FOREIGN INVESTMENT ........................................ 91
2.6.1 Opportunities Facing Foreign Investment in China .............................................................. 91
2.6.2 Challenges Confronting Foreign Direct Investment .............................................................. 92
2.7 MAIN CONCLUSION AND POLICY SUGGESTIONS ........................................................................ 94
2.7.1 Main Conclusion ................................................................................................................... 94
2.7.2 Policy Suggestions ................................................................................................................ 95
CHAPTER 3 ENVIRONMENTAL AND SOCIAL IMPACTS OF CHINESE ODI ON HOST
COUNTRIES ...................................................................................................................................... 100
3.1 THE CURRENT STATE OF CHINA’S ODI AND FUTURE TRENDS ................................................ 100
3.1.1 Current State of China’s ODI .............................................................................................. 100
3.1.2 China’s ODI Structure ......................................................................................................... 101
3.1.3 Future Trends in Chinese ODI ............................................................................................ 103
3.2 SOCIAL AND ENVIRONMENTAL IMPACTS OF CHINA’S ODI ...................................................... 105
3.2.1 Social Impacts and Challenges of China’s ODI .................................................................. 105
3.2.2 Social influence and major challenges concerning China’s foreign investment .................. 107
3.2.3 Environmental Impacts and Major Challenges of China’s ODI .......................................... 110
Environmental Impact on Forest and Biodiversity ....................................................................... 110
3.3 RELATED ROLES PLAYED BY MAJOR STAKEHOLDERS IN REDUCING THE SOCIAL AND
ENVIRONMENTAL IMPACTS OF ODI ................................................................................................ 112
3.3.1 China’s ODI Enterprises ..................................................................................................... 112
3.3.2 Central and Local Governments of Host Countries: Sharing Responsibility for Regulation
and Enforcement .......................................................................................................................... 113
3.3.3 Central and Local Governments of China: Sharing Responsibility for the Environment ... 114
3.3.4 Non-Governmental Organizations ...................................................................................... 114
3.3.5 Media .................................................................................................................................. 114
3.4 EXAMPLES OF THE POSITIVE CONTRIBUTIONS OF CHINESE ODI ........................................... 115
3.4.1 China’s ODI in the Natural Resource Sector ...................................................................... 115
3.4.2 China’s ODI in the New Energy Sector ............................................................................... 115
3.4.3 China’s ODI in the Infrastructure Sector ............................................................................ 116
3.4.4 China’s ODI in the Forestry and Agriculture Sector ........................................................... 116
3.4.5 Field Trip Research in Indonesia, South Africa, and Zambia ............................................. 117
3.5 POLICY INTENTION .................................................................................................................. 118
3.5.1 China should combine its “Going Global” strategy with the promotion of social
development in the host country while strengthening at the same time its environmental protection.
..................................................................................................................................................... 118
3.5.2 China should formulate more relevant policies and regulations that help enterprises promote
green oversea investment. ............................................................................................................ 119
3.5.3 Increasing transparency, strengthening PR, communication and cultural exchange to
improve international image ........................................................................................................ 120
3.5.4 Establishing China’s oversea investment promotion organization and evaluating system,
helping government to better supervise oversea operating activates of SOE of large scale and
SME .............................................................................................................................................. 121
3.5.5 Promoting oversea investment enterprises to better exercise corporate social responsibility
..................................................................................................................................................... 122
3.5.6. Establish a “sustainable development fund” ..................................................................... 123
3.6 CONCLUSION .............................................................................................................................. 124
CHAPTER 4 CHINA’S PARTICIPATION IN THE FORMULATION OF RELEVANT
INTERNATIONAL RULES FOR ENVIRONMENTAL PROTECTION ................................... 125
4.1 DEVELOPMENT OF RELEVANT INTERNATIONAL RULES ........................................................... 125
4.2 ENVIRONMENTAL PROVISIONS IN INTERNATIONAL INVESTMENT AGREEMENTS ................... 127
4.2.1 An Overview of Global Investment Governance ................................................................. 128
4.2.2 Environmental Provisions in International Investment Rules ............................................. 131
4.2.3 Environmentally-Relevant International Investment Rules: China’s Participation ............. 136
4.3 ENVIRONMENTAL PROVISIONS IN INTERNATIONAL TRADE RULES ......................................... 143
4.3.1 Overview of International Trade Rules and International Environmental Rules ................ 143
4.3.2 Environmental Provision in GATT and Other Trade Treaties ............................................. 144
4.3.3 Possible Environmental Provisions in Future WTO Agreements ........................................ 146
4.3.4 WTO Rules on Environmental Products: China’s Active Role ............................................ 147
4.4 CLIMATE CHANGE, INTERNATIONAL INVESTMENT, TRADE, AND CHINA’S INVOLVEMENT .... 150
4.4.1 International Negotiation Process and Governance System to Address Climate Change ... 150
4.4.2 Climate Change and International Investments .................................................................. 152
4.4.3 Climate Change and International Trade ............................................................................ 161
4.4.4 China’s Status, Role, and Strategic Choices ........................................................................ 164
CHAPTER 5 CHINA’S GREEN TRANSFORMATION THROUGH INVESTMENT AND
TRADE ................................................................................................................................................ 167
5.0 INTRODUCTION:CHINA IN THE WORLD’S ECONOMY.............................................................. 167
5.1 ACHIEVEMENTS AND OBJECTIVES OF CHINA’S GREEN TRANSFORMATION ............................ 170
5.1.1 Achievements in Eleventh Five-Year Plan Period (2006-2010) .......................................... 170
5.1.2 Objectives of Twelfth Five-Year Plan (2011–2015) ............................................................. 171
5.1.3 Difficulties and Challenges ................................................................................................. 173
5.2 IMPACT OF INVESTMENT AND TRADE POLICIES ON CHINA’S GREEN TRANSFORMATION ...... 177
5.2.1 Impact of Foreign Investment Policy on China’s Green Transformation ............................ 177
5.2.2 Impact of “Going Global” on China’s Green Transformation ............................................ 180
5.2.3 Impact of Trade Policy on China’s Green Transformation ............................................... 181
5.3 FACILITATING GREEN TRANSFORMATION THROUGH INVESTMENT AND TRADE .................... 183
5.3.1 Facilitating China’s Green Transformation Through Foreign Investment .......................... 184
5.3.2 Facilitating Green Transformation of China and Host Countries Through China’s ODI ... 185
5.3.3 Facilitating China’s Green Transformation Through Foreign Trade .................................. 186
5.3.4 Facilitating Green Transformation of China and the Rest of the World Through China’s
Participation in Formulation of International Rules ................................................................... 187
5.4 FACILITATING GREEN TRANSFORMATION THROUGH ADJUSTMENTS OF INVESTMENT AND
TRADE POLICIES.............................................................................................................................. 188
Chapter 1 Investment, Trade and Environment: Overview
1.1 Introduction
1.1.1 Overall Framework of the report
In the past three decades of reform and opening up to the rest of the world, China has
achieved a remarkable development success that has gained worldwide attention.
China’s GDP is now the second largest in the world, while total import and export
volumes puts it in first place globallv. However, high energy-consumption industries
have continued to develop through industrialization, and high costs and high pollution
have continued to accompany low output, low technology, and low profitability.
Furthermore, with the deepening of the economic globalization, global environmental
problems have become increasingly prominent, thereby posing severe challenges for
the achievement of sustainable development and human well-being. Pollution, climate
change, and ongoing energy crisis have prompted discussions worldwide and have
significant implications for research into investment, trade and environment.
The relationship between trade and environment is a complex matter that involves
many dimensions. Generally speaking, trade liberalization will influence the
environment in the following five ways (OECD, 1994):
Scale Effects
Scale effects refer to the impact that the change of economic scale has on the
environment as a result of trade liberalization. It is believed that trade liberalization
will promote economic growth, leading to an expansion of economic scale. On the
one hand, this may accelerate energy consumption and the excessive emission of
pollutants, thereby creating more pressure on the environment; on the other hand, it
may also bring forth an increase of national wealth and the improvement of people’s
living standards, and hence enhance people’s awareness of, and commitment to,
environmental improvement.
Structural Effects
Structural effects refer to the impact that trade liberalization has on the environment
through its influence on the economic structure. Trade liberalization facilitates
specialization in the division of labour, which brings about the transformation of
economic structures, as countries have to fall on their respective specialties to
participate in international competition. Trade liberalization may encourage the
industrial structure to evolve from being dominated by the high-pollution first and
second tier industries to being driven by the third tier industry, which produces
relatively few pollutants. Actually, trade liberalization has brought forth tremendous
environmental improvement in many developing countries. However, trade
liberalization may also result in the misuse of resources in some countries, as they
might export end to export excess amounts of natural resources and depend too much
on high-pollution industries, which can lead to environmental degradation. For
instance, many developing countries have blindly expanded the export volume of
natural resources and have supplied raw materials to developed countries without
considering fully the related environmental costs in the pricing of the materials.
Technology Effects
Trade liberalization has accelerated the spread of technology among countries. New
technologies usually bring forth increased productivity and produce the same output
with fewer inputs and less pollution. However, it might also facilitate the transfer of
outdated, hazardous technologies and techniques from developed countries to
developing ones.
Product Effects
As with technology effects, trade liberalization accelerates the flow of products
among countries. A country might have access to more environmentally friendly
products through its trade, and make up for the domestic scarcity of natural resources.
Meanwhile, trade liberalization may also cause the opposite effect. For instance,
developed countries sometimes transfer unwanted waste to developing countries.
Regulatory Effects
Regulatory effects refer to the impact that trade liberalization has on the environment
due to its influence on the environmental policy, measures, and the formulation and
implementation of related standards. Trade liberalization might prompt a country to
improve its environmental performance by perfecting its environmental regulation,
strengthening its environmental measures, and enhancing its environmental standards.
Meanwhile, global trade regulation that comes with trade liberation may also impose
certain limits on the freedom and ability of a country to implement environmental
policies based on its own circumstances. In order to be more competitive
internationally, certain countries may seek to lower their environmental standards and
fall prey to the “prisoner’s dilemma.”
The five effects described above could lead to environmental improvement or
degradation, depending to a great degree on whether there is a developed market and
proper, effective regulation.
The relationship between investment and the environment is also complex and
multi-faceted. The environmental impact of foreigh direct investment (FDI), in
particular, is a hot topic that has attracted extensive attention. On the one hand, FDI
may result in a rise of pollution in the host country, and the flow of FDI from
countries or areas with strict environmental regulations to those with relatively loose
regulations may result in a transfer of high-pollution industries and hence aggravate
the pollution problems in the countries that receive FDI. On the other hand, the
advanced technologies that FDI brings to the host countries often enhance the
resource utilization efficiency and promote the recycling of resources. As a result,
fewer inputs are required to produce the same output with less pollution.
This first section of this report report divides its exploration of the complex
relationship among trade, investment, and the environment into the following
subsections: first, an analysis is presented on the current status of foreign trade and
interntional investment in China; in the second subsection, embedded pollutants in
foreign trade are analyzed on the basis of the input-output model, so as to gain an
insight into the relationship between foreign trade and the environment; and finally, a
computable general equilibrium (CGE)-based simulation is conducted to
comprehensively investigate how to implement policies to facilitate the optimization
of industrial, foreign trade, and investment structures to achieve environmental
improvement.
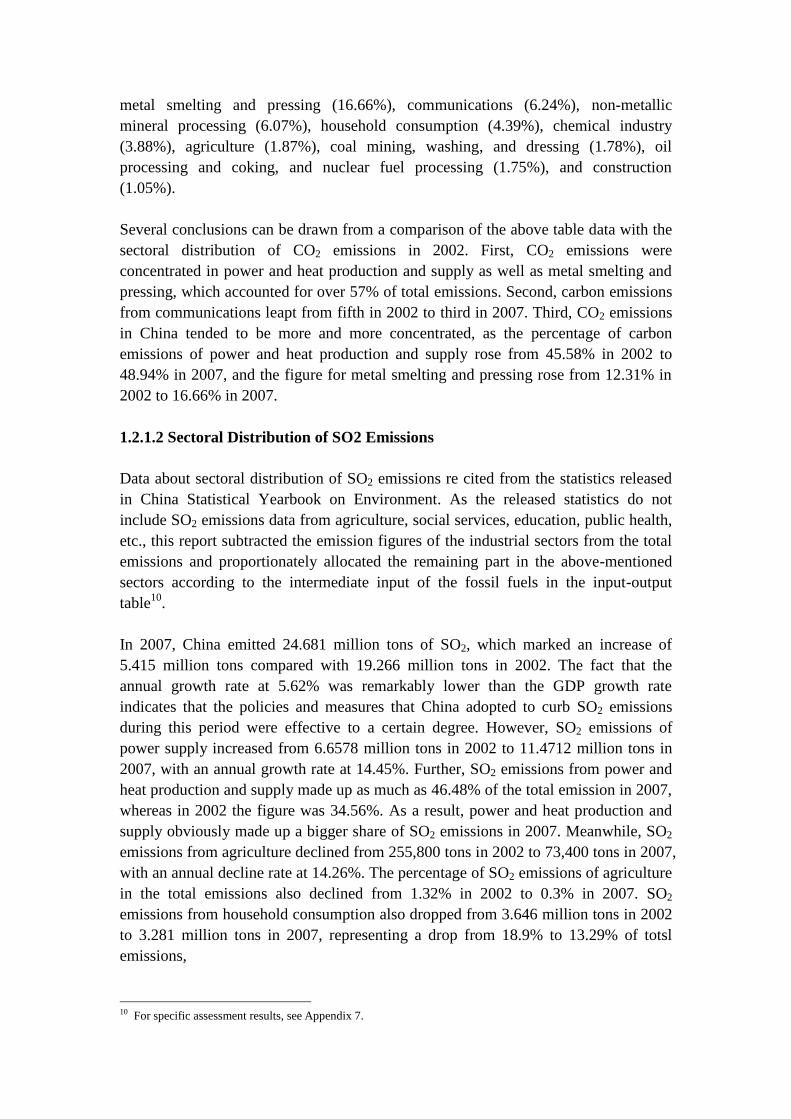
1.1.2 Current Status of Import & Export Trade and the Environment in China
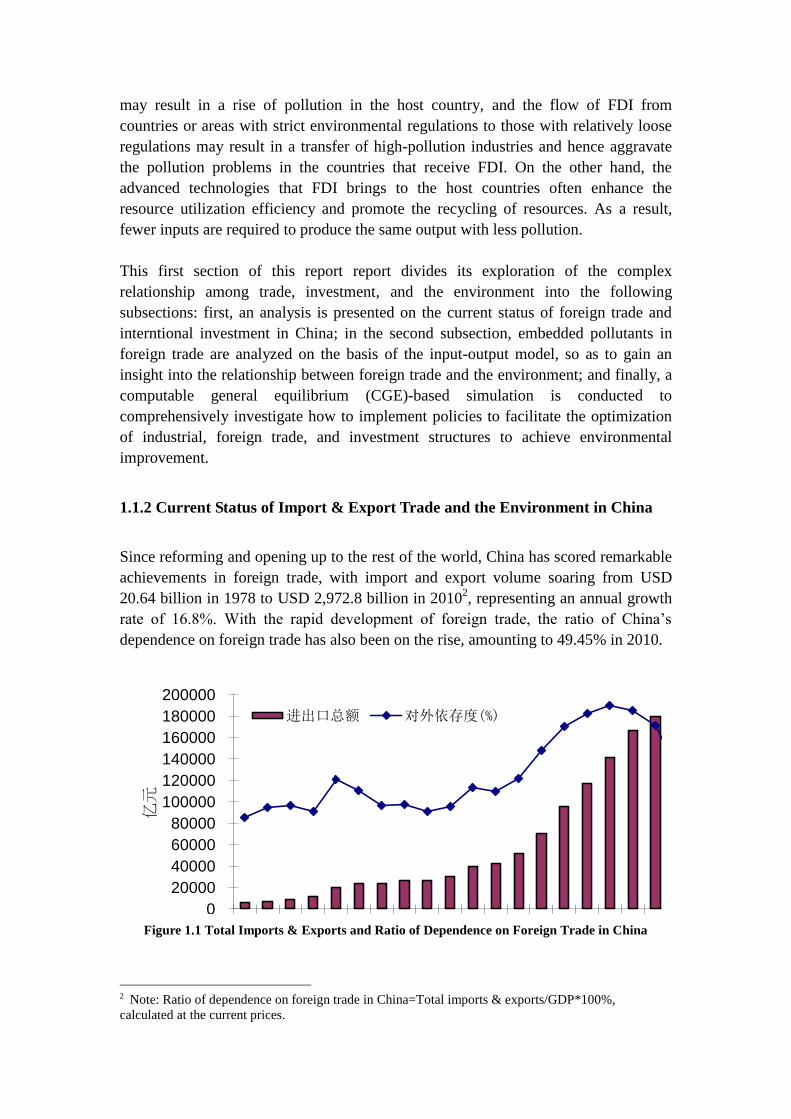
Since reforming and opening up to the rest of the world, China has scored remarkable
achievements in foreign trade, with import and export volume soaring from USD
20.64 billion in 1978 to USD 2,972.8 billion in 20102, representing an annual growth
rate of 16.8%. With the rapid development of foreign trade, the ratio of China’s
dependence on foreign trade has also been on the rise, amounting to 49.45% in 2010.
0
10
20
30
40
50
60
70
0
20000
40000
60000
80000
100000
120000
140000
160000
180000
200000
1990
1991
1992
1993
1994
1995
1996
1997
1998
1999
2000
2001
2002
2003
2004
2005
2006
2007
2008
2009
%
亿元
进出口总额 对外依存度(%)
Figure 1.1 Total Imports & Exports and Ratio of Dependence on Foreign Trade in China
2 Note: Ratio of dependence on foreign trade in China=Total imports & exports/GDP*100%,
calculated at the current prices.
1 Note: Ratio of dependence on foreign trade in China=Total imports & exports/GDP*100%,
calculated at the current prices.
Source: Statistical Yearbook of China 2010.
进出口总额 Total Imports & Exports
对外依存度 Ratio of Dependence on Foreign Trade
纵轴:
亿元 100,000,000 RMB
Considering the availability of data, we mainly referred to the input-output table of 34
sectors and the energy consumption statistics of related sectors in 2002 and 2007, and
divided the sectors into high, medium, and low energy-consumption sectors according
to the energy consumption intensity of the industry.
As is shown in Table 1.1, high energy-consumption sectors accounted for USD
197.168 billion of exports in 2007, which represented 16.21% of the total volume.
The exports of medium and low energy-consumption sectors were USD 275.65 billion
and USD 743.87 billion, which respectively accounted for 22.66% and 61.14% of the
total export volume. Compared with 2002, the proportion of high energy-consumption
exports in the total volume increased from 15.95% in 2002 to 16.21% in 2007; that of
medium energy-consumption exports dropped from 28.03% in 2002 to 22.66% in
2007; and that of low energy-consumption exports rose from 56.92% in 2002 to
61.14% in 2007.
Table 1.1 Distribution of Energy Consumption in Export Sectors (2002 and 2007)
(Unit: USD 100,000,000)
Sectors 2002 2007
Exports Percentage(%) Exports Percentage(%)
High Energy-Consumption
Sector 487.65 15.05 1,971.68 16.21
Medium
Energy-Consumption Sector
908.42 28.03 2,756.50 22.66
Low
Energy-Consumption Sector
1,844.70 56.92 7,438.70 61.14
Total 3,240.77 100.00 12,166.88 100.00
Source: The present authors’ calculation.
As shown in Table 1.2, high energy-consumption sectors accounted for USD 283.171
billion of imports in 2007, which represented 29.70% of the total volume. The imports
of medium and low energy-consumption sectors were USD 171.408 billion and USD
499.028 billion, which accounted for 17.97% and 52.33% of the total import volume
respectively. Compared with 2002, the proportion of high energy-consumption
imports in the total volume increased from 27.81% in 2002 to 29.69% in 2007, while
that of medium energy-consumption imports rose from 17.55% in 2002 to 17.97% in
2007, and that of low energy-consumption imports dropped from 54.65% in 2002 to
52.33% in 2007.
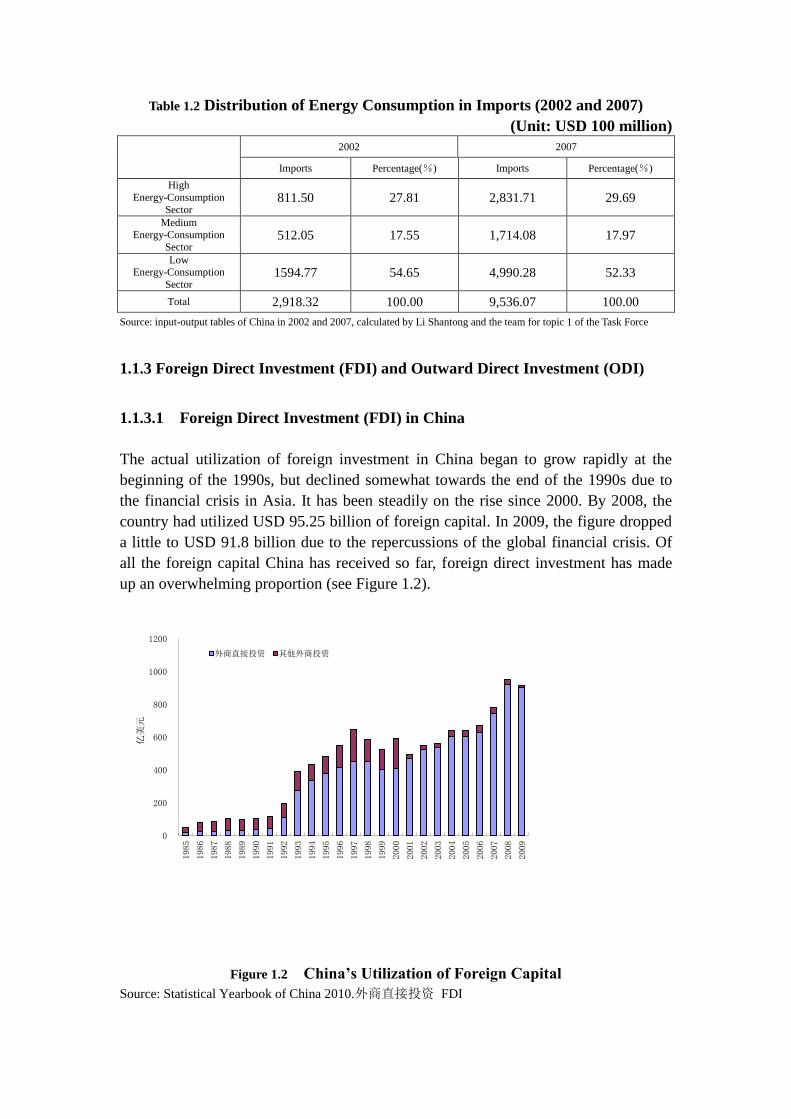
Table 1.2 Distribution of Energy Consumption in Imports (2002 and 2007)
(Unit: USD 100 million)
2002 2007
Imports Percentage(%) Imports Percentage(%)
High
Energy-Consumption
Sector 811.50 27.81 2,831.71 29.69
Medium Energy-Consumption
Sector 512.05 17.55 1,714.08 17.97
Low Energy-Consumption
Sector 1594.77 54.65 4,990.28 52.33
Total 2,918.32 100.00 9,536.07 100.00
Source: input-output tables of China in 2002 and 2007, calculated by Li Shantong and the team for topic 1 of the Task Force
1.1.3 Foreign Direct Investment (FDI) and Outward Direct Investment (ODI)
1.1.3.1 Foreign Direct Investment (FDI) in China
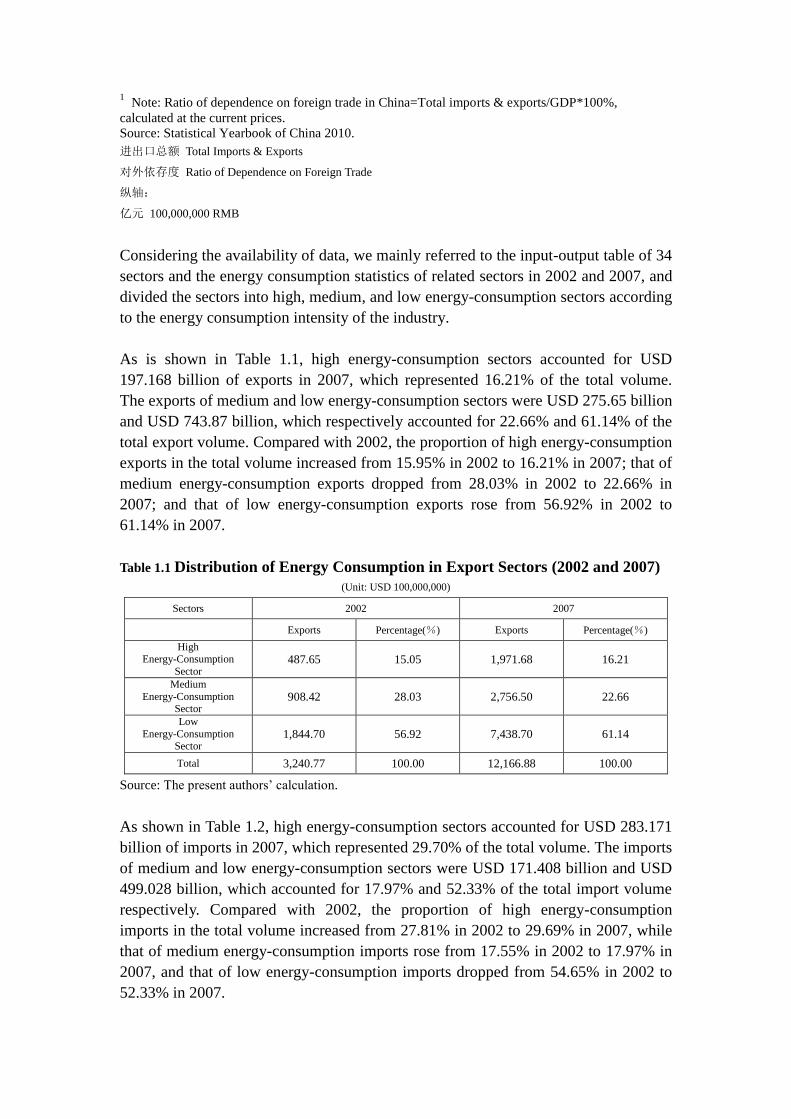
The actual utilization of foreign investment in China began to grow rapidly at the
beginning of the 1990s, but declined somewhat towards the end of the 1990s due to
the financial crisis in Asia. It has been steadily on the rise since 2000. By 2008, the
country had utilized USD 95.25 billion of foreign capital. In 2009, the figure dropped
a little to USD 91.8 billion due to the repercussions of the global financial crisis. Of
all the foreign capital China has received so far, foreign direct investment has made
up an overwhelming proportion (see Figure 1.2).
0
200
400
600
800
1000
1200
1985
1986
1987
1988
1989
1990
1991
1992
1993
1994
1995
1996
1997
1998
1999
2000
2001
2002
2003
2004
2005
2006
2007
2008
2009
亿美元
外商直接投资 其他外商投资
Figure 1.2 China’s Utilization of Foreign Capital
Source: Statistical Yearbook of China 2010.外商直接投资 FDI
其他外商投资 Other Forms of Foreign Investment
纵轴:
亿美元 USD 100,000,000
In terms of sectoral distribution, FDI is mainly concentrated in manufacturing. In
2009, USD 46.8 billion went into manufacturing, accounting for 51.95% of total FDI.
The second biggest investment target is the real estate industry, which attracted USD
16.8 billion of FDI, accounting for 18.65% of the total FDI. The FDI that went into
power, gas, and water production and supply reached USD 2.112 billion, accounting
for 2.34% of the total FDI.
In terms of the utilized FDI in 20083, mining (USD 572 million), textiles (USD 1.823
billion), chemical materials and products manufacturing (USD 4.123 billion), and
power, gas, and water production and supply (USD 1.696 billion) represented USD
8.214 of FDI in total, accounting for 8.89% of the total (USD 92.4 billion), and all of
these are high energy-consumption sectors. In 2007, mining (489 million USD),
textiles (1.843 billion USD), chemical materials and products manufacturing (USD
2.886 billion), and power, gas, and water production and supply (USD 1.072 billion)
utilized USD 6.29 billion of FDI in total, accounting for 8.41% of the total (USD
74.77 billion). Compared with 2007, 2008 saw an increase of utilized FDI in all the
above sectors in various degrees except for textile industry. However, the four sectors
occupied a lower percentage of the total FDI in 2008.
1.1.3.2 China’s ODI
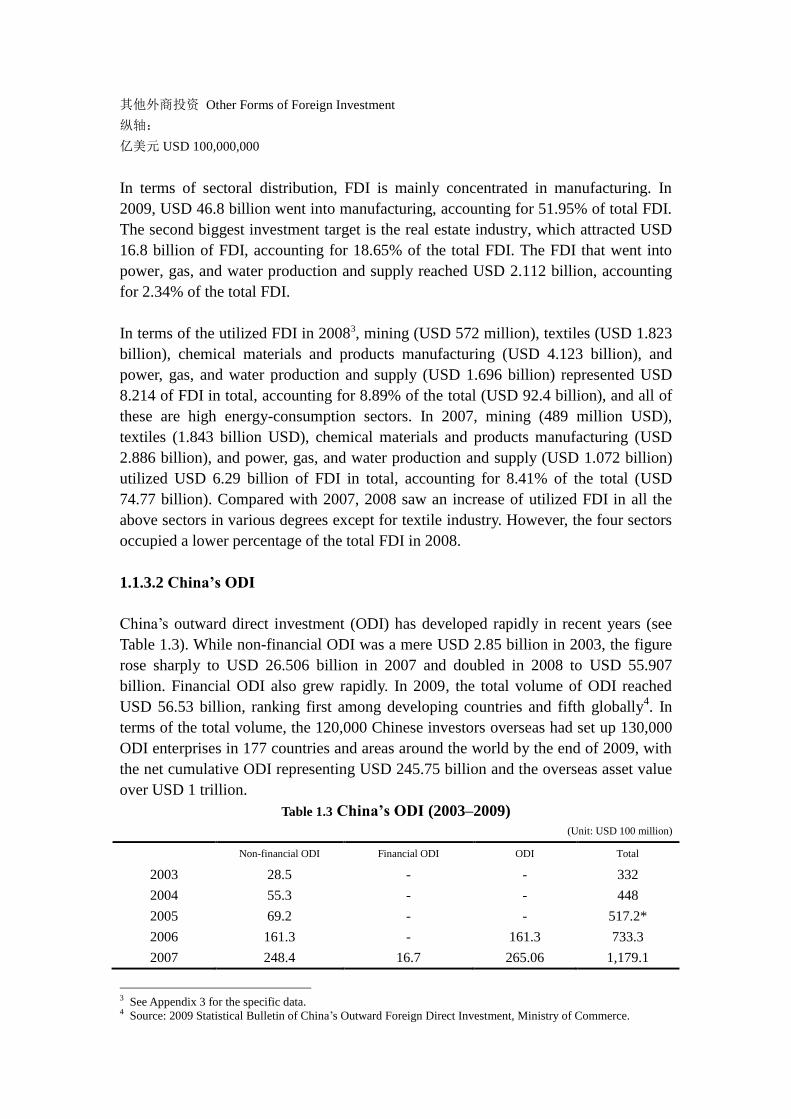
China’s outward direct investment (ODI) has developed rapidly in recent years (see
Table 1.3). While non-financial ODI was a mere USD 2.85 billion in 2003, the figure
rose sharply to USD 26.506 billion in 2007 and doubled in 2008 to USD 55.907
billion. Financial ODI also grew rapidly. In 2009, the total volume of ODI reached
USD 56.53 billion, ranking first among developing countries and fifth globally4. In
terms of the total volume, the 120,000 Chinese investors overseas had set up 130,000
ODI enterprises in 177 countries and areas around the world by the end of 2009, with
the net cumulative ODI representing USD 245.75 billion and the overseas asset value
over USD 1 trillion.
Table 1.3 China’s ODI (2003–2009)
(Unit: USD 100 million)
Non-financial ODI Financial ODI ODI Total
2003 28.5 - - 332
2004 55.3 - - 448
2005 69.2 - - 517.2*
2006 161.3 - 161.3 733.3
2007 248.4 16.7 265.06 1,179.1
3 See Appendix 3 for the specific data. 4 Source: 2009 Statistical Bulletin of China’s Outward Foreign Direct Investment, Ministry of Commerce.
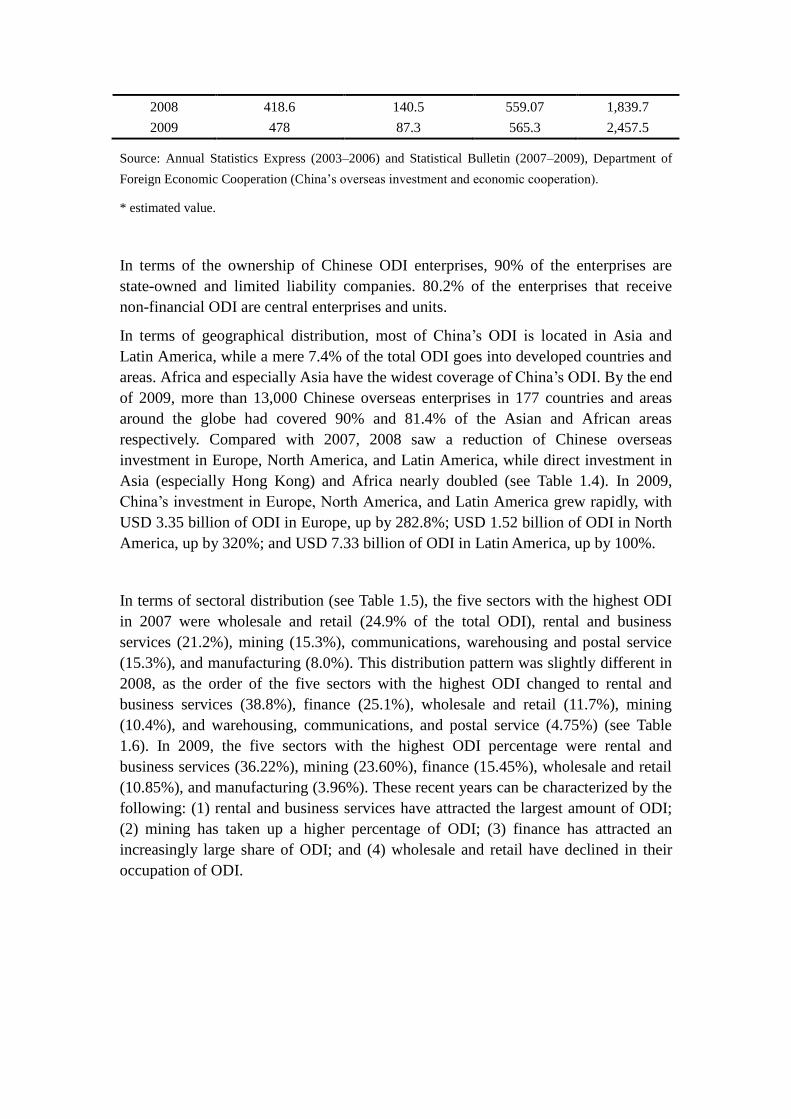
2008 418.6 140.5 559.07 1,839.7
2009 478 87.3 565.3 2,457.5
Source: Annual Statistics Express (2003–2006) and Statistical Bulletin (2007–2009), Department of
Foreign Economic Cooperation (China’s overseas investment and economic cooperation).
* estimated value.
In terms of the ownership of Chinese ODI enterprises, 90% of the enterprises are
state-owned and limited liability companies. 80.2% of the enterprises that receive
non-financial ODI are central enterprises and units.
In terms of geographical distribution, most of China’s ODI is located in Asia and
Latin America, while a mere 7.4% of the total ODI goes into developed countries and
areas. Africa and especially Asia have the widest coverage of China’s ODI. By the end
of 2009, more than 13,000 Chinese overseas enterprises in 177 countries and areas
around the globe had covered 90% and 81.4% of the Asian and African areas
respectively. Compared with 2007, 2008 saw a reduction of Chinese overseas
investment in Europe, North America, and Latin America, while direct investment in
Asia (especially Hong Kong) and Africa nearly doubled (see Table 1.4). In 2009,
China’s investment in Europe, North America, and Latin America grew rapidly, with
USD 3.35 billion of ODI in Europe, up by 282.8%; USD 1.52 billion of ODI in North
America, up by 320%; and USD 7.33 billion of ODI in Latin America, up by 100%.
In terms of sectoral distribution (see Table 1.5), the five sectors with the highest ODI
in 2007 were wholesale and retail (24.9% of the total ODI), rental and business
services (21.2%), mining (15.3%), communications, warehousing and postal service
(15.3%), and manufacturing (8.0%). This distribution pattern was slightly different in
2008, as the order of the five sectors with the highest ODI changed to rental and
business services (38.8%), finance (25.1%), wholesale and retail (11.7%), mining
(10.4%), and warehousing, communications, and postal service (4.75%) (see Table
1.6). In 2009, the five sectors with the highest ODI percentage were rental and
business services (36.22%), mining (23.60%), finance (15.45%), wholesale and retail
(10.85%), and manufacturing (3.96%). These recent years can be characterized by the
following: (1) rental and business services have attracted the largest amount of ODI;
(2) mining has taken up a higher percentage of ODI; (3) finance has attracted an
increasingly large share of ODI; and (4) wholesale and retail have declined in their
occupation of ODI.
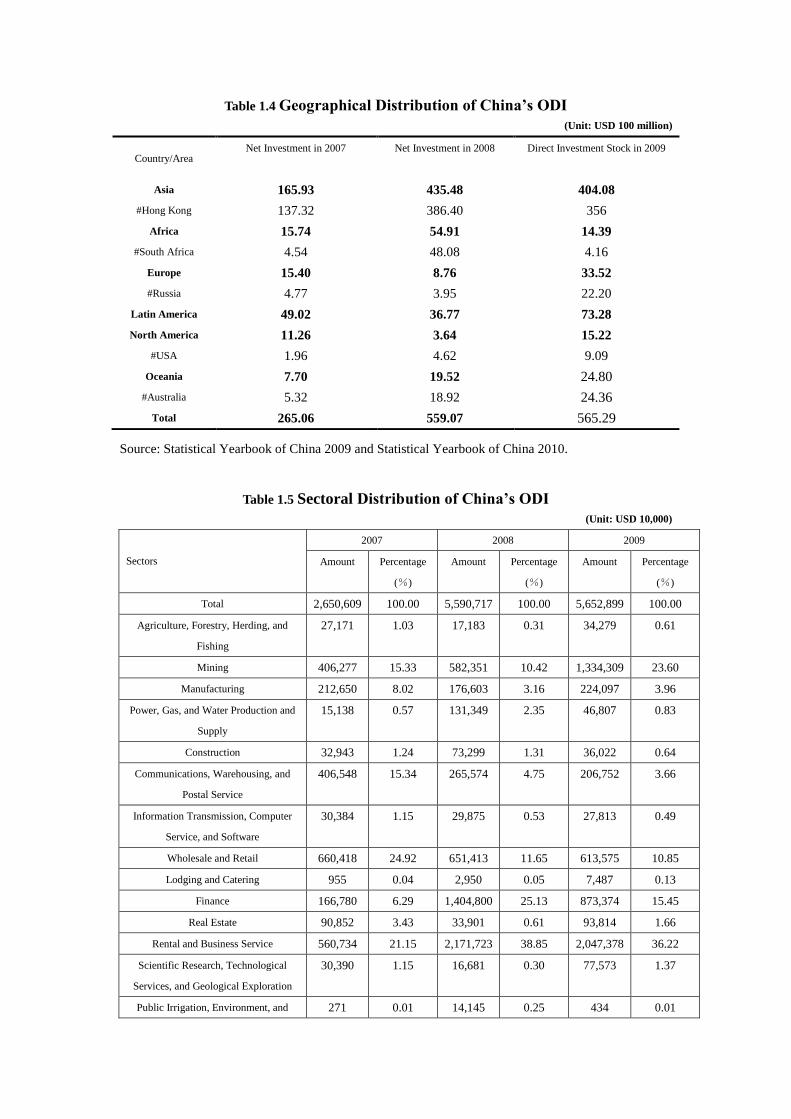
Table 1.4 Geographical Distribution of China’s ODI
(Unit: USD 100 million)
Country/Area Net Investment in 2007
Net Investment in 2008
Direct Investment Stock in 2009
Asia 165.93 435.48 404.08
#Hong Kong 137.32 386.40 356
Africa 15.74 54.91 14.39
#South Africa 4.54 48.08 4.16
Europe 15.40 8.76 33.52
#Russia 4.77 3.95 22.20
Latin America 49.02 36.77 73.28
North America 11.26 3.64 15.22
#USA 1.96 4.62 9.09
Oceania 7.70 19.52 24.80
#Australia 5.32 18.92 24.36
Total 265.06 559.07 565.29
Source: Statistical Yearbook of China 2009 and Statistical Yearbook of China 2010.
Table 1.5 Sectoral Distribution of China’s ODI
(Unit: USD 10,000)
Sectors
2007 2008 2009
Amount Percentage
(%)
Amount Percentage
(%)
Amount Percentage
(%)
Total 2,650,609 100.00 5,590,717 100.00 5,652,899 100.00
Agriculture, Forestry, Herding, and
Fishing
27,171 1.03 17,183 0.31 34,279 0.61
Mining 406,277 15.33 582,351 10.42 1,334,309 23.60
Manufacturing 212,650 8.02 176,603 3.16 224,097 3.96
Power, Gas, and Water Production and
Supply
15,138 0.57 131,349 2.35 46,807 0.83
Construction 32,943 1.24 73,299 1.31 36,022 0.64
Communications, Warehousing, and
Postal Service
406,548 15.34 265,574 4.75 206,752 3.66
Information Transmission, Computer
Service, and Software
30,384 1.15 29,875 0.53 27,813 0.49
Wholesale and Retail 660,418 24.92 651,413 11.65 613,575 10.85
Lodging and Catering 955 0.04 2,950 0.05 7,487 0.13
Finance 166,780 6.29 1,404,800 25.13 873,374 15.45
Real Estate 90,852 3.43 33,901 0.61 93,814 1.66
Rental and Business Service 560,734 21.15 2,171,723 38.85 2,047,378 36.22
Scientific Research, Technological
Services, and Geological Exploration
30,390 1.15 16,681 0.30 77,573 1.37
Public Irrigation, Environment, and 271 0.01 14,145 0.25 434 0.01
Sectors
2007 2008 2009
Amount Percentage
(%)
Amount Percentage
(%)
Amount Percentage
(%)
Public Facility Administration
Resident Services and Other Services 7,621 0.29 16,536 0.30 26,773 0.47
Education 892 0.03 154 0.00 245 0.00
Public Health, Social Security, and
Social Welfare
75 0.00 191 0.00
Culture, Sports, and Entertainment 510 0.02 2,180 0.04 1,976 0.03
Public Administration and Social
Organization
0 0.00 0 0.00 0 0.00
Source: Statistical Yearbook of China 2009 and Statistical Yearbook of China 2010.
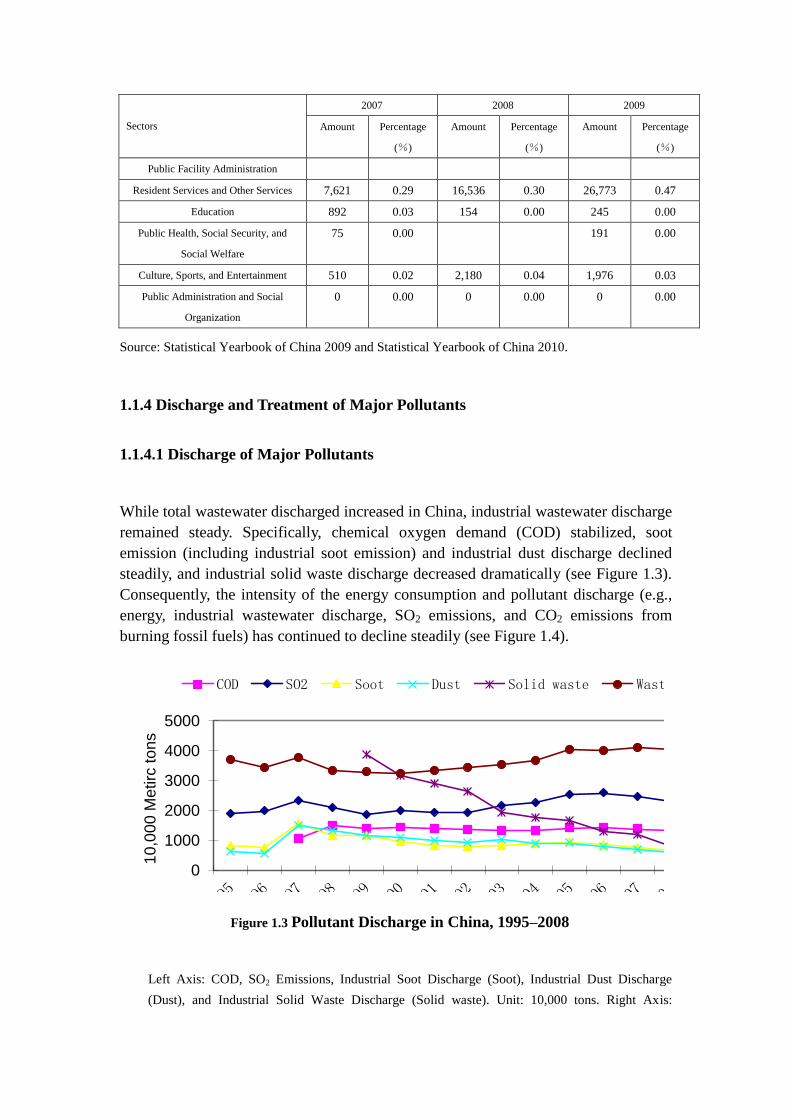
1.1.4 Discharge and Treatment of Major Pollutants
1.1.4.1 Discharge of Major Pollutants
While total wastewater discharged increased in China, industrial wastewater discharge
remained steady. Specifically, chemical oxygen demand (COD) stabilized, soot
emission (including industrial soot emission) and industrial dust discharge declined
steadily, and industrial solid waste discharge decreased dramatically (see Figure 1.3).
Consequently, the intensity of the energy consumption and pollutant discharge (e.g.,
energy, industrial wastewater discharge, SO2 emissions, and CO2 emissions from
burning fossil fuels) has continued to decline steadily (see Figure 1.4).
0
50
100
150
200
250
300
0
1000
2000
3000
4000
50001
00
Mill
ion
Metr
ic t
on
s
10
,00
0 M
etirc
to
ns
COD SO2 Soot Dust Solid waste Waste water
Figure 1.3 Pollutant Discharge in China, 1995–2008
Left Axis: COD, SO2 Emissions, Industrial Soot Discharge (Soot), Industrial Dust Discharge
(Dust), and Industrial Solid Waste Discharge (Solid waste). Unit: 10,000 tons. Right Axis:
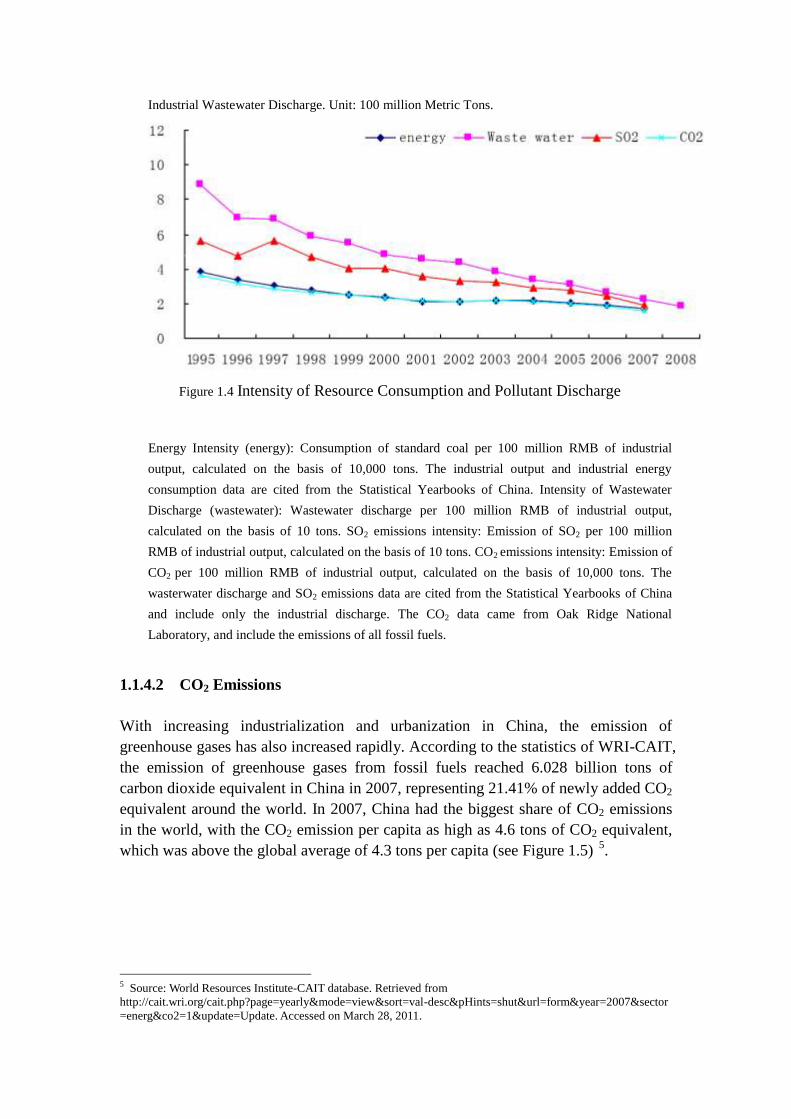
Industrial Wastewater Discharge. Unit: 100 million Metric Tons.
Figure 1.4 Intensity of Resource Consumption and Pollutant Discharge
Energy Intensity (energy): Consumption of standard coal per 100 million RMB of industrial
output, calculated on the basis of 10,000 tons. The industrial output and industrial energy
consumption data are cited from the Statistical Yearbooks of China. Intensity of Wastewater
Discharge (wastewater): Wastewater discharge per 100 million RMB of industrial output,
calculated on the basis of 10 tons. SO2 emissions intensity: Emission of SO2 per 100 million
RMB of industrial output, calculated on the basis of 10 tons. CO2 emissions intensity: Emission of
CO2 per 100 million RMB of industrial output, calculated on the basis of 10,000 tons. The
wasterwater discharge and SO2 emissions data are cited from the Statistical Yearbooks of China
and include only the industrial discharge. The CO2 data came from Oak Ridge National
Laboratory, and include the emissions of all fossil fuels.
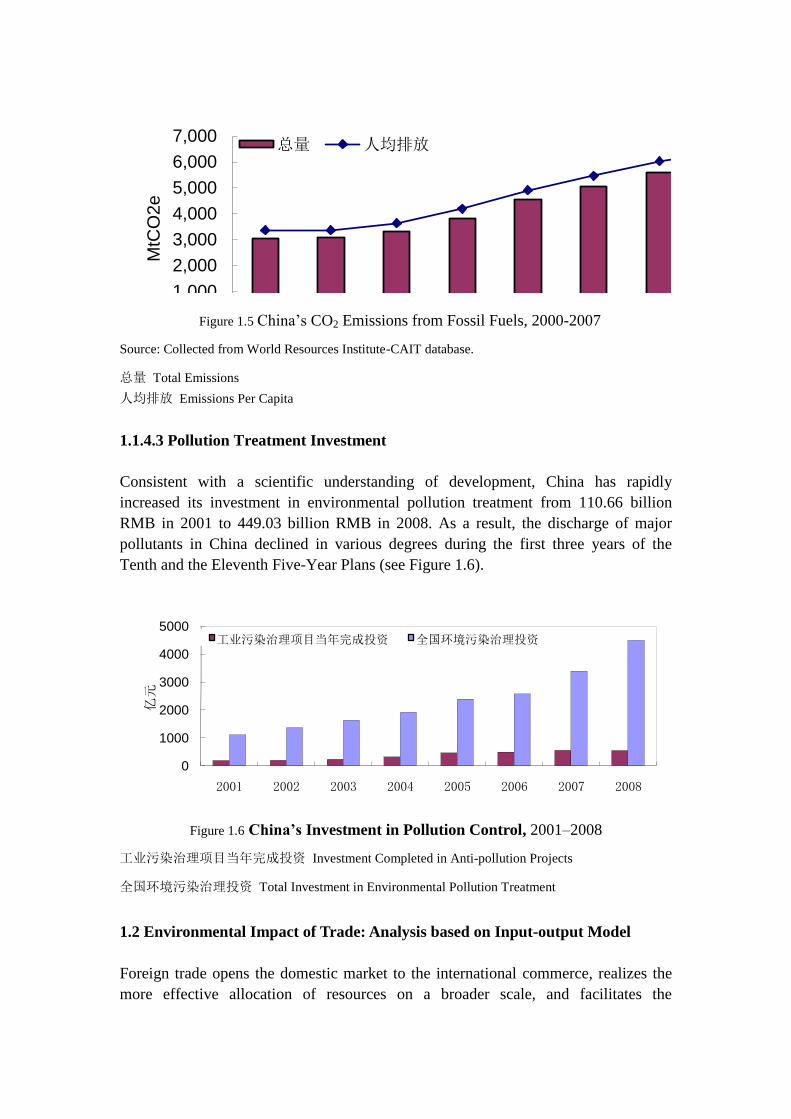
1.1.4.2 CO2 Emissions
With increasing industrialization and urbanization in China, the emission of
greenhouse gases has also increased rapidly. According to the statistics of WRI-CAIT,
the emission of greenhouse gases from fossil fuels reached 6.028 billion tons of
carbon dioxide equivalent in China in 2007, representing 21.41% of newly added CO2
equivalent around the world. In 2007, China had the biggest share of CO2 emissions
in the world, with the CO2 emission per capita as high as 4.6 tons of CO2 equivalent,
which was above the global average of 4.3 tons per capita (see Figure 1.5) 5
.
5 Source: World Resources Institute-CAIT database. Retrieved from
http://cait.wri.org/cait.php?page=yearly&mode=view&sort=val-desc&pHints=shut&url=form&year=2007§or
=energ&co2=1&update=Update. Accessed on March 28, 2011.
0.0
1.0
2.0
3.0
4.0
5.0
0
1,000
2,000
3,000
4,000
5,000
6,000
7,000
2000 2001 2002 2003 2004 2005 2006 2007
Metr
ic t
on
s
MtC
O2e
总量 人均排放
Figure 1.5 China’s CO2 Emissions from Fossil Fuels, 2000-2007
Source: Collected from World Resources Institute-CAIT database.
总量 Total Emissions
人均排放 Emissions Per Capita
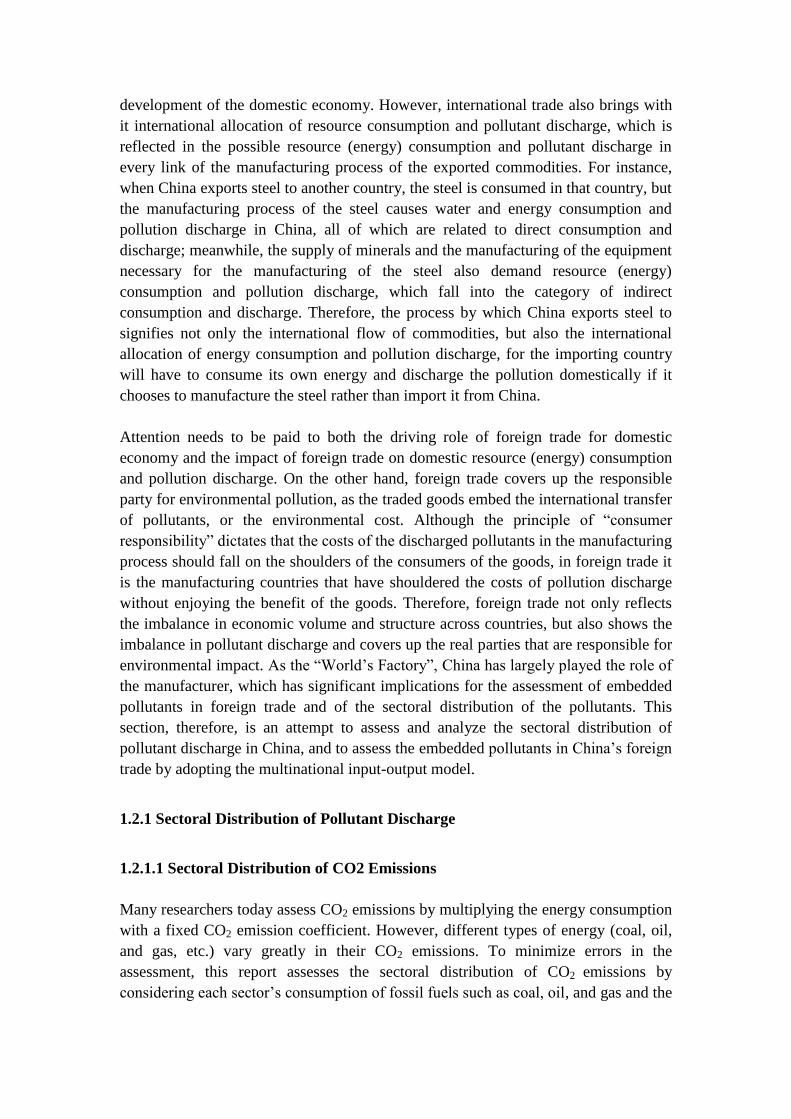
1.1.4.3 Pollution Treatment Investment
Consistent with a scientific understanding of development, China has rapidly
increased its investment in environmental pollution treatment from 110.66 billion
RMB in 2001 to 449.03 billion RMB in 2008. As a result, the discharge of major
pollutants in China declined in various degrees during the first three years of the
Tenth and the Eleventh Five-Year Plans (see Figure 1.6).
0
1000
2000
3000
4000
5000
2001 2002 2003 2004 2005 2006 2007 2008
亿元
工业污染治理项目当年完成投资 全国环境污染治理投资
Figure 1.6 China’s Investment in Pollution Control, 2001–2008
工业污染治理项目当年完成投资 Investment Completed in Anti-pollution Projects
全国环境污染治理投资 Total Investment in Environmental Pollution Treatment
1.2 Environmental Impact of Trade: Analysis based on Input-output Model
Foreign trade opens the domestic market to the international commerce, realizes the
more effective allocation of resources on a broader scale, and facilitates the
development of the domestic economy. However, international trade also brings with
it international allocation of resource consumption and pollutant discharge, which is
reflected in the possible resource (energy) consumption and pollutant discharge in
every link of the manufacturing process of the exported commodities. For instance,
when China exports steel to another country, the steel is consumed in that country, but
the manufacturing process of the steel causes water and energy consumption and
pollution discharge in China, all of which are related to direct consumption and
discharge; meanwhile, the supply of minerals and the manufacturing of the equipment
necessary for the manufacturing of the steel also demand resource (energy)
consumption and pollution discharge, which fall into the category of indirect
consumption and discharge. Therefore, the process by which China exports steel to
signifies not only the international flow of commodities, but also the international
allocation of energy consumption and pollution discharge, for the importing country
will have to consume its own energy and discharge the pollution domestically if it
chooses to manufacture the steel rather than import it from China.
Attention needs to be paid to both the driving role of foreign trade for domestic
economy and the impact of foreign trade on domestic resource (energy) consumption
and pollution discharge. On the other hand, foreign trade covers up the responsible
party for environmental pollution, as the traded goods embed the international transfer
of pollutants, or the environmental cost. Although the principle of “consumer
responsibility” dictates that the costs of the discharged pollutants in the manufacturing
process should fall on the shoulders of the consumers of the goods, in foreign trade it
is the manufacturing countries that have shouldered the costs of pollution discharge
without enjoying the benefit of the goods. Therefore, foreign trade not only reflects
the imbalance in economic volume and structure across countries, but also shows the
imbalance in pollutant discharge and covers up the real parties that are responsible for
environmental impact. As the “World’s Factory”, China has largely played the role of
the manufacturer, which has significant implications for the assessment of embedded
pollutants in foreign trade and of the sectoral distribution of the pollutants. This
section, therefore, is an attempt to assess and analyze the sectoral distribution of
pollutant discharge in China, and to assess the embedded pollutants in China’s foreign
trade by adopting the multinational input-output model.
1.2.1 Sectoral Distribution of Pollutant Discharge
1.2.1.1 Sectoral Distribution of CO2 Emissions
Many researchers today assess CO2 emissions by multiplying the energy consumption
with a fixed CO2 emission coefficient. However, different types of energy (coal, oil,
and gas, etc.) vary greatly in their CO2 emissions. To minimize errors in the
assessment, this report assesses the sectoral distribution of CO2 emissions by
considering each sector’s consumption of fossil fuels such as coal, oil, and gas and the
CO2 emission coefficient6 of the fuels. This is also one of the objectives of this report.
The data of the sectoral consumption of fossil energy (coal, oil and gas, etc.) are cited
from Energy Statistics Yearbook and Statistical Yearbook of China. On the basis of
the data, CO2 emissions from coal, oil, and gas in each sector can be calculated, and
the sum total of the CO2 emissions of all the fossil fuels is then taken for the CO2
emission of the sector as a whole.
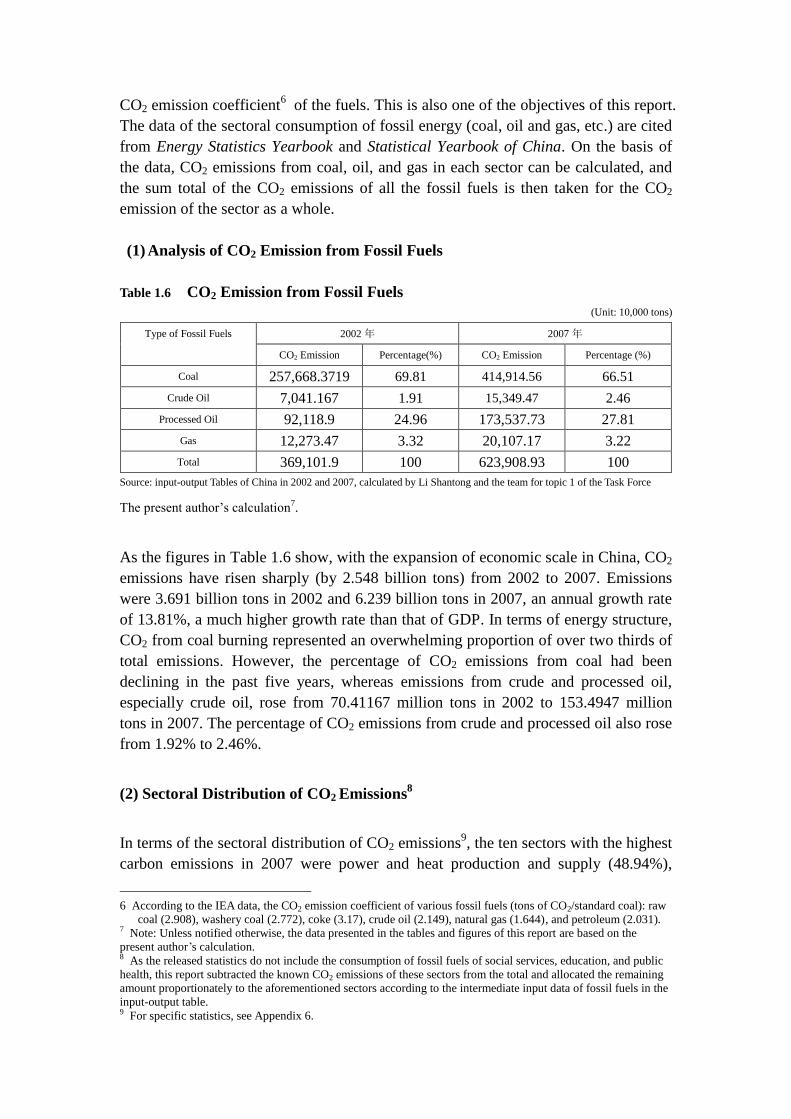
(1) Analysis of CO2 Emission from Fossil Fuels
Table 1.6 CO2 Emission from Fossil Fuels
(Unit: 10,000 tons)
Type of Fossil Fuels 2002 年 2007 年
CO2 Emission Percentage(%) CO2 Emission Percentage (%)
Coal 257,668.3719 69.81 414,914.56 66.51
Crude Oil 7,041.167 1.91 15,349.47 2.46
Processed Oil 92,118.9 24.96 173,537.73 27.81
Gas 12,273.47 3.32 20,107.17 3.22
Total 369,101.9 100 623,908.93 100
Source: input-output Tables of China in 2002 and 2007, calculated by Li Shantong and the team for topic 1 of the Task Force
The present author’s calculation7.
As the figures in Table 1.6 show, with the expansion of economic scale in China, CO2
emissions have risen sharply (by 2.548 billion tons) from 2002 to 2007. Emissions
were 3.691 billion tons in 2002 and 6.239 billion tons in 2007, an annual growth rate
of 13.81%, a much higher growth rate than that of GDP. In terms of energy structure,
CO2 from coal burning represented an overwhelming proportion of over two thirds of
total emissions. However, the percentage of CO2 emissions from coal had been
declining in the past five years, whereas emissions from crude and processed oil,
especially crude oil, rose from 70.41167 million tons in 2002 to 153.4947 million
tons in 2007. The percentage of CO2 emissions from crude and processed oil also rose
from 1.92% to 2.46%.
(2) Sectoral Distribution of CO2 Emissions8
In terms of the sectoral distribution of CO2 emissions9, the ten sectors with the highest
carbon emissions in 2007 were power and heat production and supply (48.94%),
6 According to the IEA data, the CO2 emission coefficient of various fossil fuels (tons of CO2/standard coal): raw
coal (2.908), washery coal (2.772), coke (3.17), crude oil (2.149), natural gas (1.644), and petroleum (2.031). 7 Note: Unless notified otherwise, the data presented in the tables and figures of this report are based on the
present author’s calculation. 8 As the released statistics do not include the consumption of fossil fuels of social services, education, and public
health, this report subtracted the known CO2 emissions of these sectors from the total and allocated the remaining
amount proportionately to the aforementioned sectors according to the intermediate input data of fossil fuels in the
input-output table. 9 For specific statistics, see Appendix 6.
metal smelting and pressing (16.66%), communications (6.24%), non-metallic
mineral processing (6.07%), household consumption (4.39%), chemical industry
(3.88%), agriculture (1.87%), coal mining, washing, and dressing (1.78%), oil
processing and coking, and nuclear fuel processing (1.75%), and construction
(1.05%).
Several conclusions can be drawn from a comparison of the above table data with the
sectoral distribution of CO2 emissions in 2002. First, CO2 emissions were
concentrated in power and heat production and supply as well as metal smelting and
pressing, which accounted for over 57% of total emissions. Second, carbon emissions
from communications leapt from fifth in 2002 to third in 2007. Third, CO2 emissions
in China tended to be more and more concentrated, as the percentage of carbon
emissions of power and heat production and supply rose from 45.58% in 2002 to
48.94% in 2007, and the figure for metal smelting and pressing rose from 12.31% in
2002 to 16.66% in 2007.
1.2.1.2 Sectoral Distribution of SO2 Emissions
Data about sectoral distribution of SO2 emissions re cited from the statistics released
in China Statistical Yearbook on Environment. As the released statistics do not
include SO2 emissions data from agriculture, social services, education, public health,
etc., this report subtracted the emission figures of the industrial sectors from the total
emissions and proportionately allocated the remaining part in the above-mentioned
sectors according to the intermediate input of the fossil fuels in the input-output
table10
.
In 2007, China emitted 24.681 million tons of SO2, which marked an increase of
5.415 million tons compared with 19.266 million tons in 2002. The fact that the
annual growth rate at 5.62% was remarkably lower than the GDP growth rate
indicates that the policies and measures that China adopted to curb SO2 emissions
during this period were effective to a certain degree. However, SO2 emissions of
power supply increased from 6.6578 million tons in 2002 to 11.4712 million tons in
2007, with an annual growth rate at 14.45%. Further, SO2 emissions from power and
heat production and supply made up as much as 46.48% of the total emission in 2007,
whereas in 2002 the figure was 34.56%. As a result, power and heat production and
supply obviously made up a bigger share of SO2 emissions in 2007. Meanwhile, SO2
emissions from agriculture declined from 255,800 tons in 2002 to 73,400 tons in 2007,
with an annual decline rate at 14.26%. The percentage of SO2 emissions of agriculture
in the total emissions also declined from 1.32% in 2002 to 0.3% in 2007. SO2
emissions from household consumption also dropped from 3.646 million tons in 2002
to 3.281 million tons in 2007, representing a drop from 18.9% to 13.29% of totsl
emissions,
10 For specific assessment results, see Appendix 7.
The ten sectors with the highest SO2 emissions in 2007 were power and heat
production and supply (46.47%), household consumption (13.29%), metal smelting
and pressing (9.35%), non-metallic mineral product processing (7.39%), chemical
industry (5.61%), communications (4.28%), oil processing (2.65%), paper-making
and printing (2.01%), food industry (1.72%), and textiles (1.12%).
The following conclusions can be drawn from the shift in the sectoral distribution
pattern of SO2 emissions from 2002 to 2007. First, SO2 emissions were concentrated
in power and heat production and supply, as well as household consumption, which
made up over 60% of the total SO2 emission in 2007, and over 53% of total SO2
emissions in 2002. Second, SO2 emissions from power and heat production and
supply increased from 2002 to 2007, whereas emissions from household consumption
decreased over the same period. This might be explained by the following factors:
The abrupt increase of demand for power in recent years caused the rapid increase of
power production, whereas more and more residents burn coal for fuel, resulting in a
reduction of the SO2 emissions. Further, SO2 emissions in China have tended to be
concentrated, as the percentage of SO2 emissions from power and heat production and
supply rose from 34.56% in 2002 to 46.47% in 2007.
1.2.2 Analysis of Embedded CO2 in China’s Foreign Trade
This report adopts the multinational (multiregional) input-output model to assess
embedded CO2. For the specific assessment method, see the Appendix.
1.2.2.1 Embedded CO2 in China’s Imports and Exports in 2007 and 2002
In 2007, embedded CO2 emissions in China’s exports reached 1.984 billion tons,
whereas the figure for China’s imports was 603 million tons, making the CO2 surplus
embedded in China’s foreign trade 1.381 billion tons in 200711
. The CO2 surplus and
the embedded CO2 in exports are equivalent respectively to 23% and 33.26% of total
CO2 emissions in 2007. In terms of the comparative relation between imports and
exports, exports in 2007 were 27.59% higher than imports, whereas the embedded
CO2 in the exports was 3.29 times higher than the CO2 in imports. In terms of the
discharge intensity of the embedded CO2, the embedded CO2 in exports was as high
as 16.31 tons per USD 10,000, whereas the embedded CO2 in imports was only 6.33
tons per USD 10,000. In other words, the discharge intensity of the embedded CO2 in
exports was 2.58 times higher than in imports.
11 The difference between the embedded CO2 in exports and imports is the “embedded ” surplus of CO2 emission.
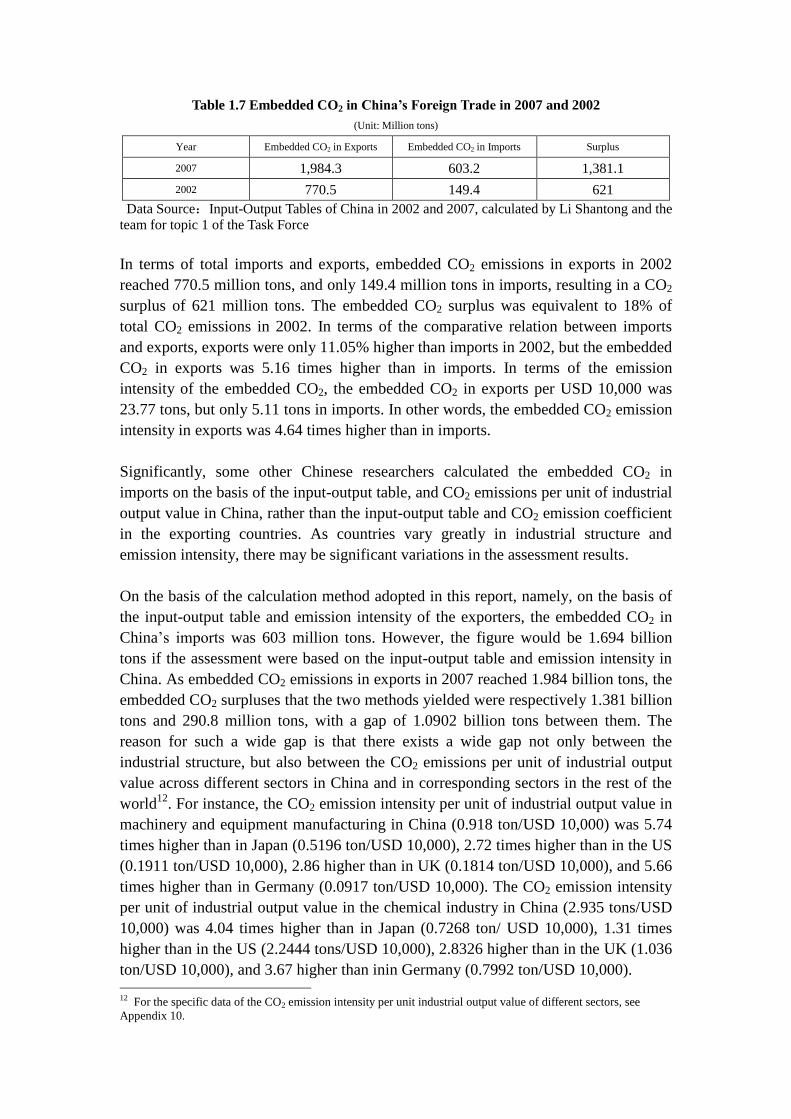
Table 1.7 Embedded CO2 in China’s Foreign Trade in 2007 and 2002
(Unit: Million tons)
Year Embedded CO2 in Exports Embedded CO2 in Imports Surplus
2007 1,984.3 603.2 1,381.1
2002 770.5 149.4 621
Data Source:Input-Output Tables of China in 2002 and 2007, calculated by Li Shantong and the
team for topic 1 of the Task Force
In terms of total imports and exports, embedded CO2 emissions in exports in 2002
reached 770.5 million tons, and only 149.4 million tons in imports, resulting in a CO2
surplus of 621 million tons. The embedded CO2 surplus was equivalent to 18% of
total CO2 emissions in 2002. In terms of the comparative relation between imports
and exports, exports were only 11.05% higher than imports in 2002, but the embedded
CO2 in exports was 5.16 times higher than in imports. In terms of the emission
intensity of the embedded CO2, the embedded CO2 in exports per USD 10,000 was
23.77 tons, but only 5.11 tons in imports. In other words, the embedded CO2 emission
intensity in exports was 4.64 times higher than in imports.
Significantly, some other Chinese researchers calculated the embedded CO2 in
imports on the basis of the input-output table, and CO2 emissions per unit of industrial
output value in China, rather than the input-output table and CO2 emission coefficient
in the exporting countries. As countries vary greatly in industrial structure and
emission intensity, there may be significant variations in the assessment results.
On the basis of the calculation method adopted in this report, namely, on the basis of
the input-output table and emission intensity of the exporters, the embedded CO2 in
China’s imports was 603 million tons. However, the figure would be 1.694 billion
tons if the assessment were based on the input-output table and emission intensity in
China. As embedded CO2 emissions in exports in 2007 reached 1.984 billion tons, the
embedded CO2 surpluses that the two methods yielded were respectively 1.381 billion
tons and 290.8 million tons, with a gap of 1.0902 billion tons between them. The
reason for such a wide gap is that there exists a wide gap not only between the
industrial structure, but also between the CO2 emissions per unit of industrial output
value across different sectors in China and in corresponding sectors in the rest of the
world12
. For instance, the CO2 emission intensity per unit of industrial output value in
machinery and equipment manufacturing in China (0.918 ton/USD 10,000) was 5.74
times higher than in Japan (0.5196 ton/USD 10,000), 2.72 times higher than in the US
(0.1911 ton/USD 10,000), 2.86 higher than in UK (0.1814 ton/USD 10,000), and 5.66
times higher than in Germany (0.0917 ton/USD 10,000). The CO2 emission intensity
per unit of industrial output value in the chemical industry in China (2.935 tons/USD
10,000) was 4.04 times higher than in Japan (0.7268 ton/ USD 10,000), 1.31 times
higher than in the US (2.2444 tons/USD 10,000), 2.8326 higher than in the UK (1.036
ton/USD 10,000), and 3.67 higher than inin Germany (0.7992 ton/USD 10,000). 12 For the specific data of the CO2 emission intensity per unit industrial output value of different sectors, see
Appendix 10.
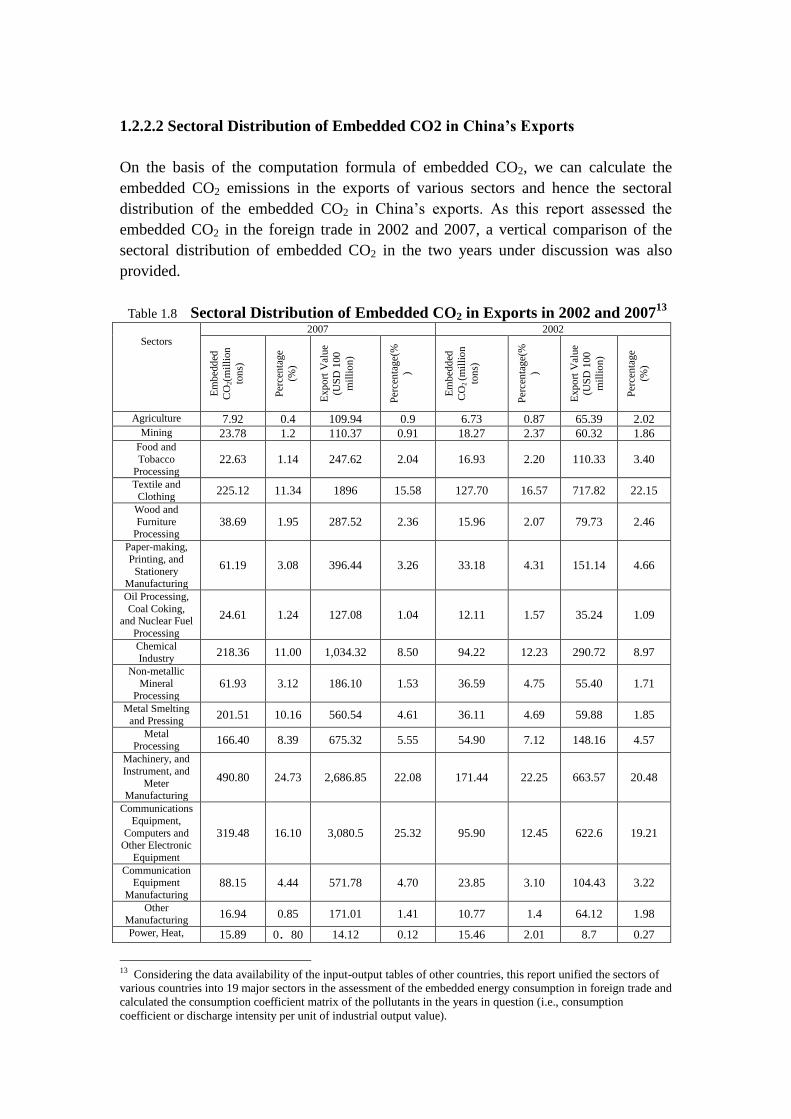
1.2.2.2 Sectoral Distribution of Embedded CO2 in China’s Exports
On the basis of the computation formula of embedded CO2, we can calculate the
embedded CO2 emissions in the exports of various sectors and hence the sectoral
distribution of the embedded CO2 in China’s exports. As this report assessed the
embedded CO2 in the foreign trade in 2002 and 2007, a vertical comparison of the
sectoral distribution of embedded CO2 in the two years under discussion was also
provided.
Table 1.8 Sectoral Distribution of Embedded CO2 in Exports in 2002 and 200713
Sectors
2007 2002
Em
bed
ded
CO
2(m
illi
on
ton
s)
Per
cen
tage
(%)
Exp
ort
Val
ue
(US
D 1
00
mil
lio
n)
Per
cen
tage(
%
)
Em
bed
ded
CO
2 (m
illi
on
ton
s)
Per
cen
tage(
%
)
Exp
ort
Val
ue
(US
D 1
00
mil
lio
n)
Per
cen
tage
(%)
Agriculture 7.92 0.4 109.94 0.9 6.73 0.87 65.39 2.02
Mining 23.78 1.2 110.37 0.91 18.27 2.37 60.32 1.86
Food and
Tobacco
Processing 22.63 1.14 247.62 2.04 16.93 2.20 110.33 3.40
Textile and Clothing
225.12 11.34 1896 15.58 127.70 16.57 717.82 22.15
Wood and
Furniture Processing
38.69 1.95 287.52 2.36 15.96 2.07 79.73 2.46
Paper-making,
Printing, and
Stationery Manufacturing
61.19 3.08 396.44 3.26 33.18 4.31 151.14 4.66
Oil Processing,
Coal Coking, and Nuclear Fuel
Processing
24.61 1.24 127.08 1.04 12.11 1.57 35.24 1.09
Chemical
Industry 218.36 11.00 1,034.32 8.50 94.22 12.23 290.72 8.97
Non-metallic
Mineral
Processing 61.93 3.12 186.10 1.53 36.59 4.75 55.40 1.71
Metal Smelting
and Pressing 201.51 10.16 560.54 4.61 36.11 4.69 59.88 1.85
Metal
Processing 166.40 8.39 675.32 5.55 54.90 7.12 148.16 4.57
Machinery, and
Instrument, and
Meter Manufacturing
490.80 24.73 2,686.85 22.08 171.44 22.25 663.57 20.48
Communications
Equipment,
Computers and Other Electronic
Equipment
319.48 16.10 3,080.5 25.32 95.90 12.45 622.6 19.21
Communication Equipment
Manufacturing 88.15 4.44 571.78 4.70 23.85 3.10 104.43 3.22
Other
Manufacturing 16.94 0.85 171.01 1.41 10.77 1.4 64.12 1.98
Power, Heat, 15.89 0.80 14.12 0.12 15.46 2.01 8.7 0.27
13 Considering the data availability of the input-output tables of other countries, this report unified the sectors of
various countries into 19 major sectors in the assessment of the embedded energy consumption in foreign trade and
calculated the consumption coefficient matrix of the pollutants in the years in question (i.e., consumption
coefficient or discharge intensity per unit of industrial output value).
Gas and Water
Production and Supply
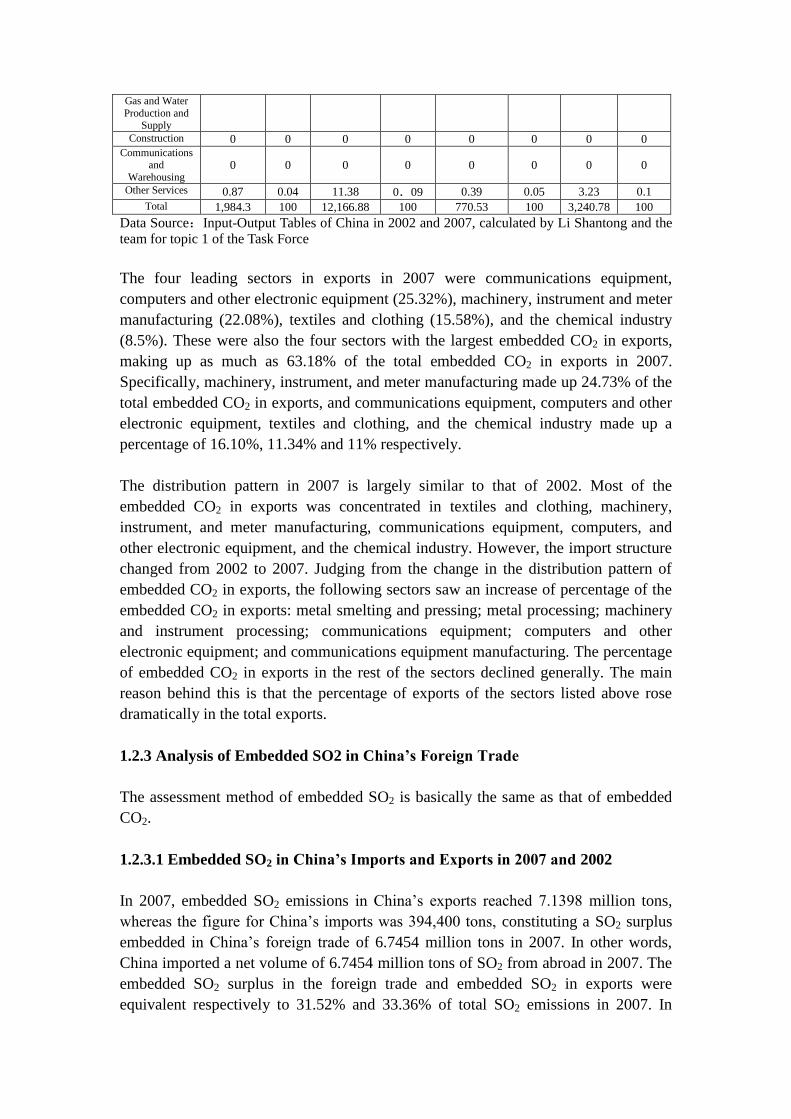
Construction 0 0 0 0 0 0 0 0
Communications and
Warehousing 0 0 0 0 0 0 0 0
Other Services 0.87 0.04 11.38 0.09 0.39 0.05 3.23 0.1
Total 1,984.3 100 12,166.88 100 770.53 100 3,240.78 100
Data Source:Input-Output Tables of China in 2002 and 2007, calculated by Li Shantong and the
team for topic 1 of the Task Force
The four leading sectors in exports in 2007 were communications equipment,
computers and other electronic equipment (25.32%), machinery, instrument and meter
manufacturing (22.08%), textiles and clothing (15.58%), and the chemical industry
(8.5%). These were also the four sectors with the largest embedded CO2 in exports,
making up as much as 63.18% of the total embedded CO2 in exports in 2007.
Specifically, machinery, instrument, and meter manufacturing made up 24.73% of the
total embedded CO2 in exports, and communications equipment, computers and other
electronic equipment, textiles and clothing, and the chemical industry made up a
percentage of 16.10%, 11.34% and 11% respectively.
The distribution pattern in 2007 is largely similar to that of 2002. Most of the
embedded CO2 in exports was concentrated in textiles and clothing, machinery,
instrument, and meter manufacturing, communications equipment, computers, and
other electronic equipment, and the chemical industry. However, the import structure
changed from 2002 to 2007. Judging from the change in the distribution pattern of
embedded CO2 in exports, the following sectors saw an increase of percentage of the
embedded CO2 in exports: metal smelting and pressing; metal processing; machinery
and instrument processing; communications equipment; computers and other
electronic equipment; and communications equipment manufacturing. The percentage
of embedded CO2 in exports in the rest of the sectors declined generally. The main
reason behind this is that the percentage of exports of the sectors listed above rose
dramatically in the total exports.
1.2.3 Analysis of Embedded SO2 in China’s Foreign Trade
The assessment method of embedded SO2 is basically the same as that of embedded
CO2.
1.2.3.1 Embedded SO2 in China’s Imports and Exports in 2007 and 2002
In 2007, embedded SO2 emissions in China’s exports reached 7.1398 million tons,
whereas the figure for China’s imports was 394,400 tons, constituting a SO2 surplus
embedded in China’s foreign trade of 6.7454 million tons in 2007. In other words,
China imported a net volume of 6.7454 million tons of SO2 from abroad in 2007. The
embedded SO2 surplus in the foreign trade and embedded SO2 in exports were
equivalent respectively to 31.52% and 33.36% of total SO2 emissions in 2007. In
comparing imports and exports, exports in 2007 were higher than the imports by
27.59%, but the embedded SO2 in the exports was 18.10 times higher than in the
imports. In terms of the discharge intensity of the embedded SO2, the embedded SO2
in exports was as high as 0.0587 ton per USD 10,000, whereas the embedded SO2 in
imports was only 0.0041 ton per USD 10,000. In other words, the discharge intensity
of the embedded SO2 in exports was 14.19 times than in in imports.
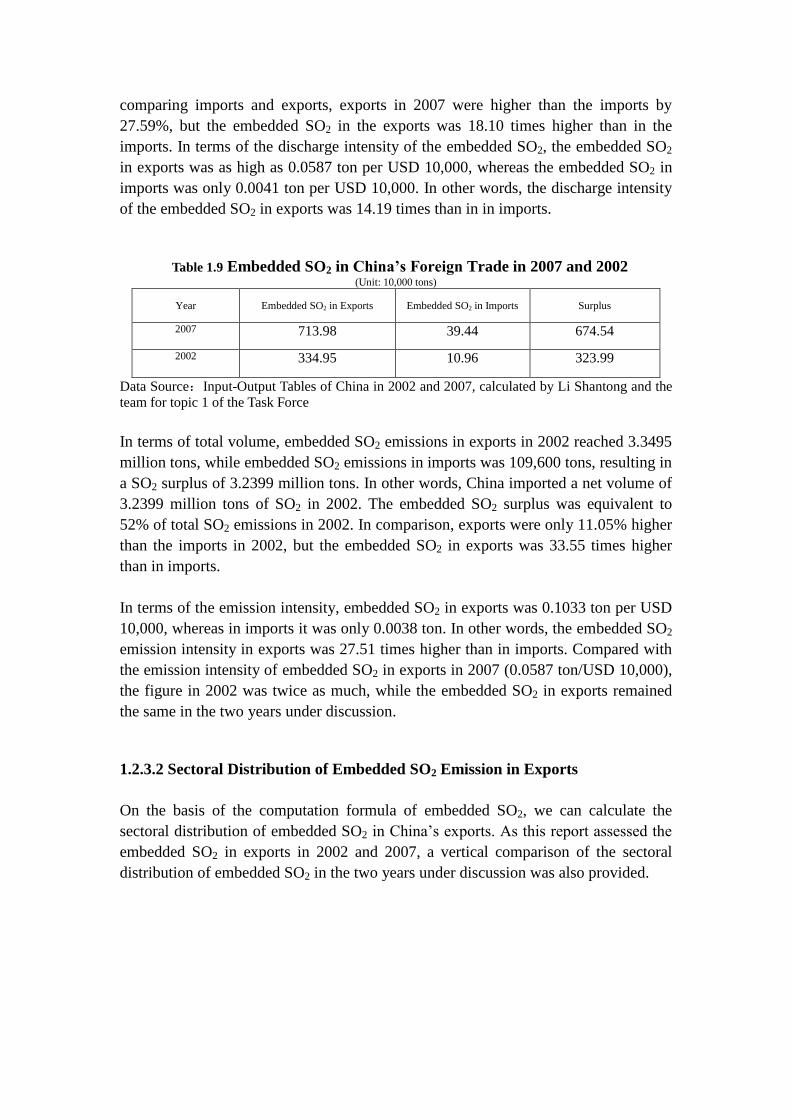
Table 1.9 Embedded SO2 in China’s Foreign Trade in 2007 and 2002 (Unit: 10,000 tons)
Year Embedded SO2 in Exports Embedded SO2 in Imports Surplus
2007 713.98 39.44 674.54
2002 334.95 10.96 323.99
Data Source:Input-Output Tables of China in 2002 and 2007, calculated by Li Shantong and the
team for topic 1 of the Task Force
In terms of total volume, embedded SO2 emissions in exports in 2002 reached 3.3495
million tons, while embedded SO2 emissions in imports was 109,600 tons, resulting in
a SO2 surplus of 3.2399 million tons. In other words, China imported a net volume of
3.2399 million tons of SO2 in 2002. The embedded SO2 surplus was equivalent to
52% of total SO2 emissions in 2002. In comparison, exports were only 11.05% higher
than the imports in 2002, but the embedded SO2 in exports was 33.55 times higher
than in imports.
In terms of the emission intensity, embedded SO2 in exports was 0.1033 ton per USD
10,000, whereas in imports it was only 0.0038 ton. In other words, the embedded SO2
emission intensity in exports was 27.51 times higher than in imports. Compared with
the emission intensity of embedded SO2 in exports in 2007 (0.0587 ton/USD 10,000),
the figure in 2002 was twice as much, while the embedded SO2 in exports remained
the same in the two years under discussion.
1.2.3.2 Sectoral Distribution of Embedded SO2 Emission in Exports
On the basis of the computation formula of embedded SO2, we can calculate the
sectoral distribution of embedded SO2 in China’s exports. As this report assessed the
embedded SO2 in exports in 2002 and 2007, a vertical comparison of the sectoral
distribution of embedded SO2 in the two years under discussion was also provided.
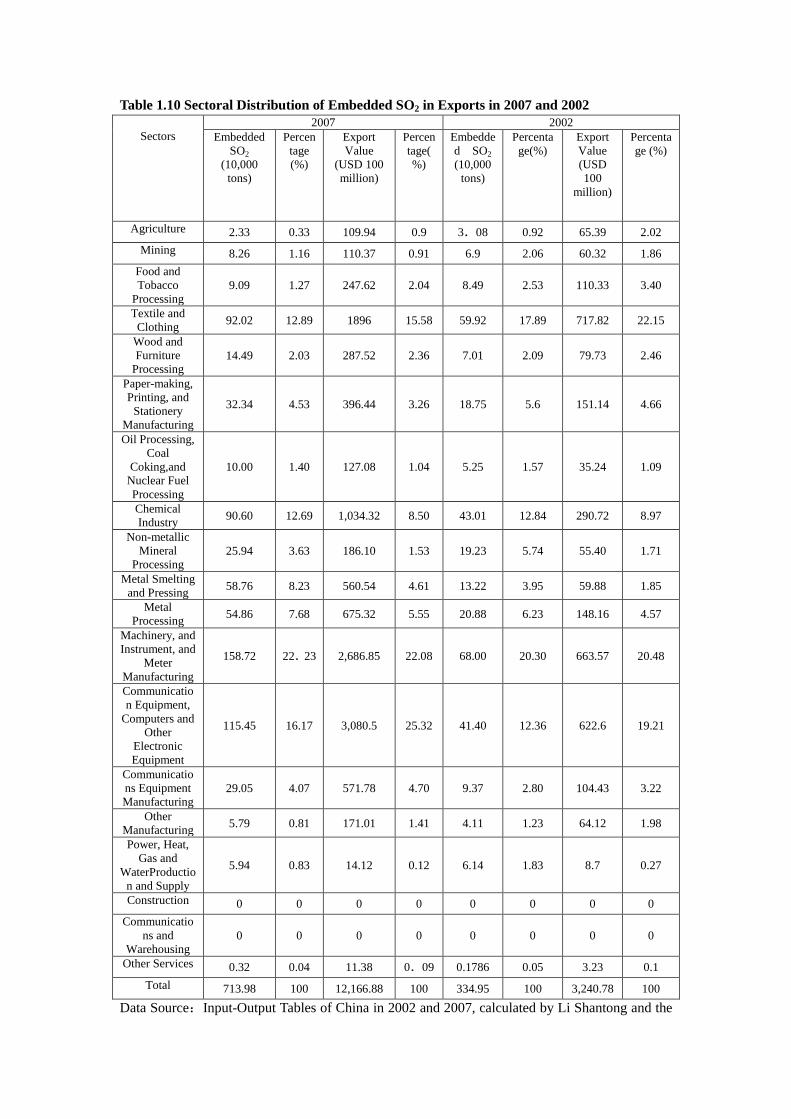
Table 1.10 Sectoral Distribution of Embedded SO2 in Exports in 2007 and 2002
Sectors
2007 2002
Embedded
SO2
(10,000
tons)
Percen
tage
(%)
Export
Value
(USD 100
million)
Percen
tage(
%)
Embedde
d SO2
(10,000
tons)
Percenta
ge(%)
Export
Value
(USD
100
million)
Percenta
ge (%)
Agriculture 2.33 0.33 109.94 0.9 3.08 0.92 65.39 2.02
Mining 8.26 1.16 110.37 0.91 6.9 2.06 60.32 1.86
Food and
Tobacco
Processing
9.09 1.27 247.62 2.04 8.49 2.53 110.33 3.40
Textile and
Clothing 92.02 12.89 1896 15.58 59.92 17.89 717.82 22.15
Wood and
Furniture
Processing 14.49 2.03 287.52 2.36 7.01 2.09 79.73 2.46
Paper-making,
Printing, and
Stationery
Manufacturing
32.34 4.53 396.44 3.26 18.75 5.6 151.14 4.66
Oil Processing,
Coal
Coking,and
Nuclear Fuel
Processing
10.00 1.40 127.08 1.04 5.25 1.57 35.24 1.09
Chemical
Industry 90.60 12.69 1,034.32 8.50 43.01 12.84 290.72 8.97
Non-metallic
Mineral
Processing 25.94 3.63 186.10 1.53 19.23 5.74 55.40 1.71
Metal Smelting
and Pressing 58.76 8.23 560.54 4.61 13.22 3.95 59.88 1.85
Metal
Processing 54.86 7.68 675.32 5.55 20.88 6.23 148.16 4.57
Machinery, and
Instrument, and
Meter
Manufacturing
158.72 22.23 2,686.85 22.08 68.00 20.30 663.57 20.48
Communicatio
n Equipment,
Computers and
Other
Electronic
Equipment
115.45 16.17 3,080.5 25.32 41.40 12.36 622.6 19.21
Communicatio
ns Equipment
Manufacturing 29.05 4.07 571.78 4.70 9.37 2.80 104.43 3.22
Other
Manufacturing 5.79 0.81 171.01 1.41 4.11 1.23 64.12 1.98
Power, Heat,
Gas and
WaterProductio
n and Supply
5.94 0.83 14.12 0.12 6.14 1.83 8.7 0.27
Construction 0 0 0 0 0 0 0 0
Communicatio
ns and
Warehousing 0 0 0 0 0 0 0 0
Other Services 0.32 0.04 11.38 0.09 0.1786 0.05 3.23 0.1
Total 713.98 100 12,166.88 100 334.95 100 3,240.78 100
Data Source:Input-Output Tables of China in 2002 and 2007, calculated by Li Shantong and the

team for topic 1 of the Task Force
In 2007, the five leading sectors in exports were communications equipment,
computers, and other electronic equipment (25.32%), machinery, instrument, and
meter manufacturing (22.08%), textiles and clothing (15.58%), the chemical industry
(8.5%), and metal processing (5.5%). These were also the five sectors with the largest
embedded SO2 in exports, making up as much as 71.66% of the total embedded SO2
in exports in 2007. Specifically, machinery, instrument, and meter manufacturing
made up 22.23% of the total embedded SO2 in exports, and communications
equipment, computers, and other electronic equipment; textiles and clothing; chemical
industry; and metal processing took up a percentage of 16.17%, 12.89%, 12.69%, and
7.68% respectively.
The distribution pattern in 2007 was somewhat similar to that in 2002. However, the
following sectors saw an increase in percentage of embedded SO2 in exports: metal
smelting and pressing; metal processing; machinery, instrument, and meter
manufacturing; communications equipment computers, and other electronic
equipment ; and communications equipment manufacturing. The percentage of the
embedded SO2 in exports in the rest of the sectors generally declined. The main
reason behind this change is that the percentage of exports of the sectors listed above
rose dramatically within total exports.
1.3 Impact of Environmental Policy on Investment and Trade: on the basis of
CGE Model
1.3.1 Introduction to the CGE Model
There are four models generally adopted in the empirical research on environment and
energy policies (Li Shantong & Zhai Fan, 2001): project-scale model (such as LEAP
model, etc.); partial equilibrium model; computable general equilibrium model (CGE
model); and integrated evaluation model. Since the outbreak of the first oil crisis in
the 1970s, Hudson & Jorgenson (1975) developed the first CGE model applicable to
energy policy analysis. Later, the CGE model began to be adopted in the analysis of
energy and environmental policy (such as Bergman, 1990; Burniaux, 1992; Kopp,
1990; Manne, 1977, and others). The advantage of the CGE model lies in its
consistency with the microeconomic theory, the detailed structural characteristics, and
the general equilibrium characteristics. Its general equilibrium framework enables it
to describe the interaction among multiple markets and institutions and to assess the
direct and indirect impacts of a specific policy, as well as the impact of the policy in
question on the overall economy. Another characteristic of the CGE model is that it
usually represents the actual policy mechanism in a relatively detailed way, which is
convenient for the analysis of many actual issues in policy-making. In recent years,
the CGE model has become the primary choice in the analysis of energy and
environmental tax policies.
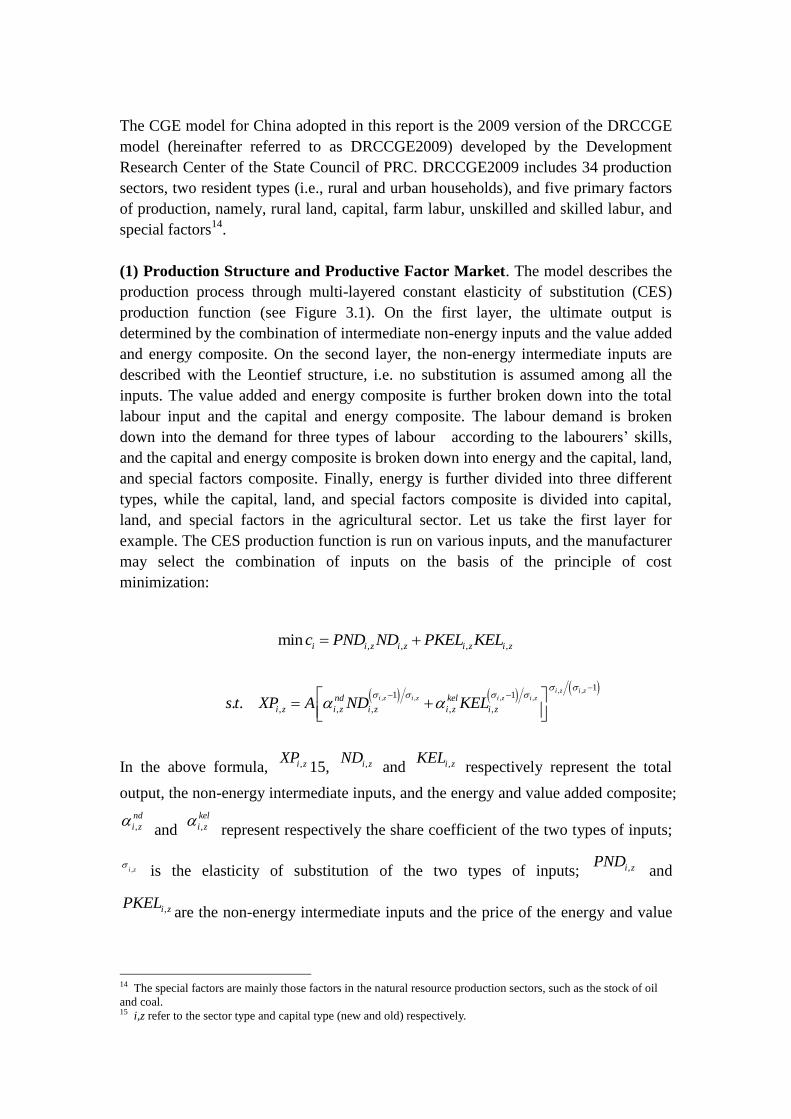
The CGE model for China adopted in this report is the 2009 version of the DRCCGE
model (hereinafter referred to as DRCCGE2009) developed by the Development
Research Center of the State Council of PRC. DRCCGE2009 includes 34 production
sectors, two resident types (i.e., rural and urban households), and five primary factors
of production, namely, rural land, capital, farm labur, unskilled and skilled labur, and
special factors14
.
(1) Production Structure and Productive Factor Market. The model describes the
production process through multi-layered constant elasticity of substitution (CES)
production function (see Figure 3.1). On the first layer, the ultimate output is
determined by the combination of intermediate non-energy inputs and the value added
and energy composite. On the second layer, the non-energy intermediate inputs are
described with the Leontief structure, i.e. no substitution is assumed among all the
inputs. The value added and energy composite is further broken down into the total
labour input and the capital and energy composite. The labour demand is broken
down into the demand for three types of labour according to the labourers’ skills,
and the capital and energy composite is broken down into energy and the capital, land,
and special factors composite. Finally, energy is further divided into three different
types, while the capital, land, and special factors composite is divided into capital,
land, and special factors in the agricultural sector. Let us take the first layer for
example. The CES production function is run on various inputs, and the manufacturer
may select the combination of inputs on the basis of the principle of cost
minimization:
, , , ,min i i z i z i z i zc PND ND PKEL KEL
, ,, , , ,
11 1
, , , , ,. . i z i z
i z i z i z i znd kel
i z i z i z i z i zs t XP A ND KEL
In the above formula, ,i zXP15, ,i zND
and ,i zKEL respectively represent the total
output, the non-energy intermediate inputs, and the energy and value added composite;
,
nd
i z and ,
kel
i z represent respectively the share coefficient of the two types of inputs;
,i z
is the elasticity of substitution of the two types of inputs; ,i zPND and
,i zPKELare the non-energy intermediate inputs and the price of the energy and value
14 The special factors are mainly those factors in the natural resource production sectors, such as the stock of oil
and coal. 15 i,z refer to the sector type and capital type (new and old) respectively.
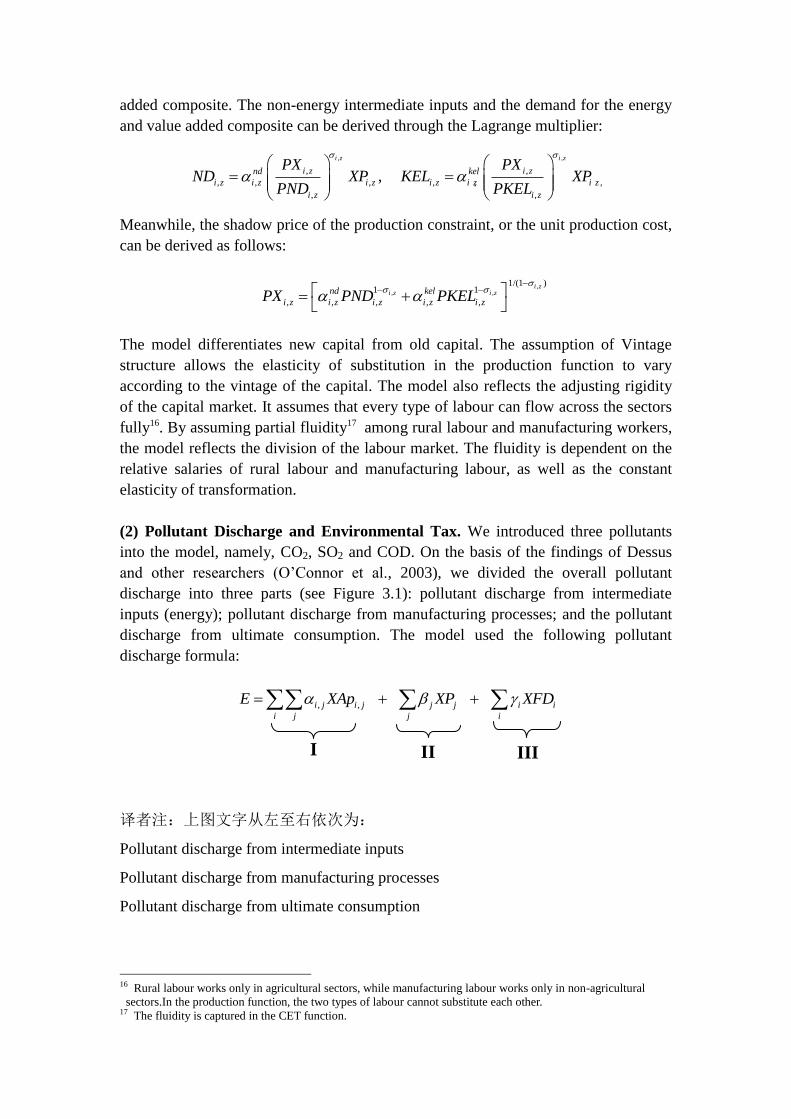
added composite. The non-energy intermediate inputs and the demand for the energy
and value added composite can be derived through the Lagrange multiplier:
,
,
, , ,
,
i z
i znd
i z i z i z
i z
PXND XP
PND
,
,
,
, , ,
,
i z
i zkel
i z i z i z
i z
PXKEL XP
PKEL
Meanwhile, the shadow price of the production constraint, or the unit production cost,
can be derived as follows:
,
, ,
1/(1 )1 1
, , , , ,
i zi z i znd kel
i z i z i z i z i zPX PND PKEL
The model differentiates new capital from old capital. The assumption of Vintage
structure allows the elasticity of substitution in the production function to vary
according to the vintage of the capital. The model also reflects the adjusting rigidity
of the capital market. It assumes that every type of labour can flow across the sectors
fully16. By assuming partial fluidity17 among rural labour and manufacturing workers,
the model reflects the division of the labour market. The fluidity is dependent on the
relative salaries of rural labour and manufacturing labour, as well as the constant
elasticity of transformation.
(2) Pollutant Discharge and Environmental Tax. We introduced three pollutants
into the model, namely, CO2, SO2 and COD. On the basis of the findings of Dessus
and other researchers (O’Connor et al., 2003), we divided the overall pollutant
discharge into three parts (see Figure 3.1): pollutant discharge from intermediate
inputs (energy); pollutant discharge from manufacturing processes; and the pollutant
discharge from ultimate consumption. The model used the following pollutant
discharge formula:
译者注:上图文字从左至右依次为:
Pollutant discharge from intermediate inputs
Pollutant discharge from manufacturing processes
Pollutant discharge from ultimate consumption
16 Rural labour works only in agricultural sectors, while manufacturing labour works only in non-agricultural
sectors.In the production function, the two types of labour cannot substitute each other. 17 The fluidity is captured in the CET function.
, , i j i j j j i i
i j j i
E XAp XP XFD
I
III
II
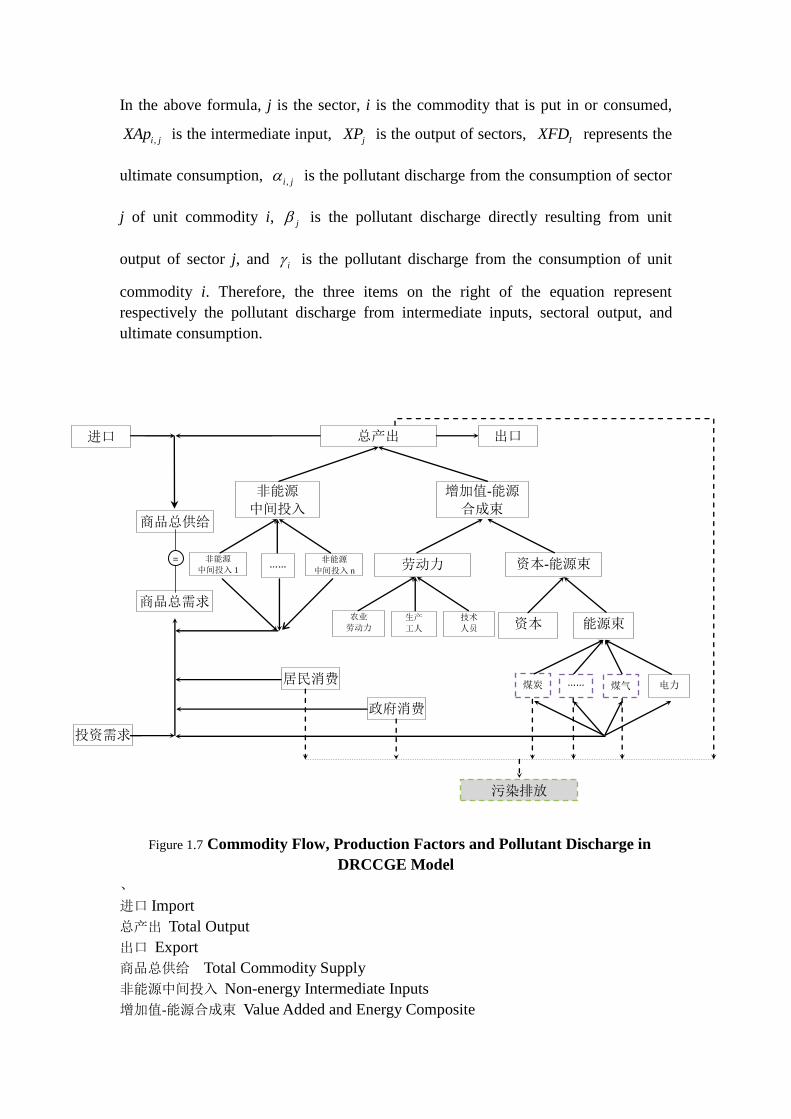
In the above formula, j is the sector, i is the commodity that is put in or consumed,
,i jXAp is the intermediate input, jXP is the output of sectors, IXFD represents the
ultimate consumption, ,i j is the pollutant discharge from the consumption of sector
j of unit commodity i, j is the pollutant discharge directly resulting from unit
output of sector j, and i is the pollutant discharge from the consumption of unit
commodity i. Therefore, the three items on the right of the equation represent
respectively the pollutant discharge from intermediate inputs, sectoral output, and
ultimate consumption.
Figure 1.7 Commodity Flow, Production Factors and Pollutant Discharge in
DRCCGE Model
、
进口 Import
总产出 Total Output
出口 Export
商品总供给 Total Commodity Supply
非能源中间投入 Non-energy Intermediate Inputs
增加值-能源合成束 Value Added and Energy Composite
非能源
中间投入 1
总产出
非能源
中间投入
增加值-能源
合成束
资本
劳动力 资本-能源束
能源束
…… 非能源
中间投入 n
农业
劳动力
生产
工人
技术
人员
煤炭 …… 电力 煤气
进口
商品总供给
出口
投资需求
居民消费
政府消费
污染排放
商品总需求
=
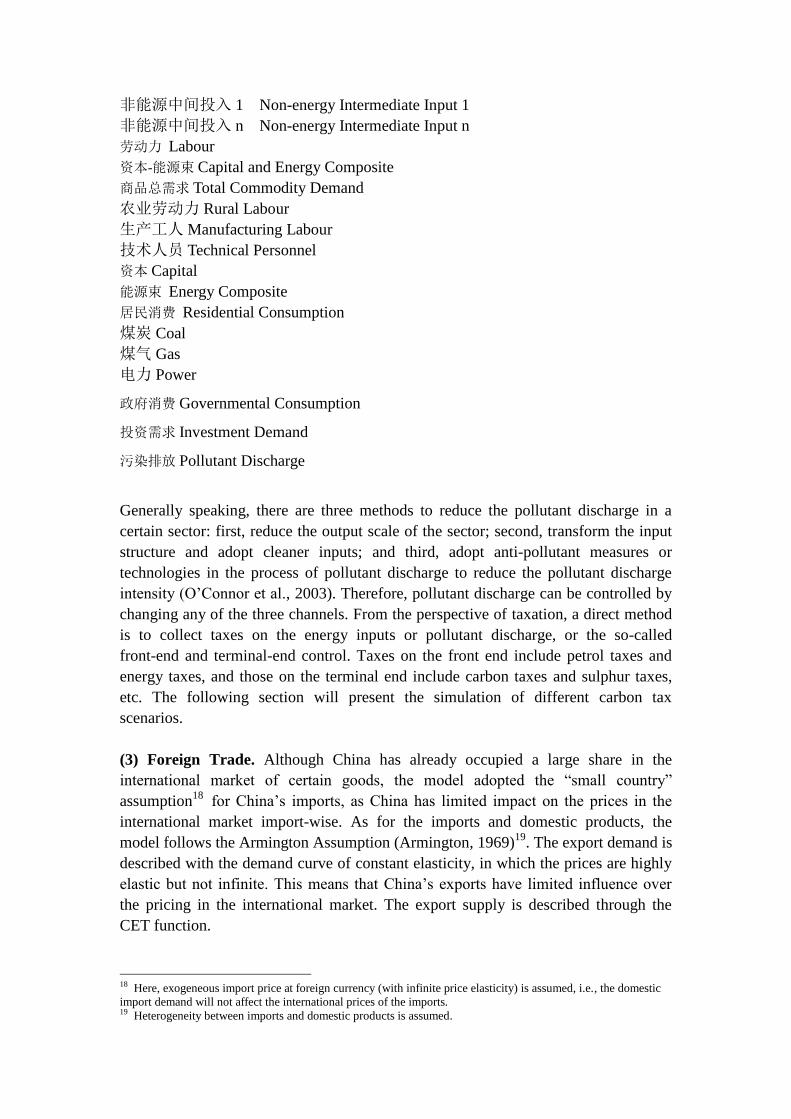
非能源中间投入 1 Non-energy Intermediate Input 1
非能源中间投入 n Non-energy Intermediate Input n
劳动力 Labour
资本-能源束 Capital and Energy Composite
商品总需求 Total Commodity Demand
农业劳动力 Rural Labour
生产工人 Manufacturing Labour
技术人员 Technical Personnel
资本 Capital
能源束 Energy Composite
居民消费 Residential Consumption
煤炭 Coal
煤气 Gas
电力 Power
政府消费 Governmental Consumption
投资需求 Investment Demand
污染排放 Pollutant Discharge
Generally speaking, there are three methods to reduce the pollutant discharge in a
certain sector: first, reduce the output scale of the sector; second, transform the input
structure and adopt cleaner inputs; and third, adopt anti-pollutant measures or
technologies in the process of pollutant discharge to reduce the pollutant discharge
intensity (O’Connor et al., 2003). Therefore, pollutant discharge can be controlled by
changing any of the three channels. From the perspective of taxation, a direct method
is to collect taxes on the energy inputs or pollutant discharge, or the so-called
front-end and terminal-end control. Taxes on the front end include petrol taxes and
energy taxes, and those on the terminal end include carbon taxes and sulphur taxes,
etc. The following section will present the simulation of different carbon tax
scenarios.
(3) Foreign Trade. Although China has already occupied a large share in the
international market of certain goods, the model adopted the “small country”
assumption18
for China’s imports, as China has limited impact on the prices in the
international market import-wise. As for the imports and domestic products, the
model follows the Armington Assumption (Armington, 1969)19
. The export demand is
described with the demand curve of constant elasticity, in which the prices are highly
elastic but not infinite. This means that China’s exports have limited influence over
the pricing in the international market. The export supply is described through the
CET function.
18 Here, exogeneous import price at foreign currency (with infinite price elasticity) is assumed, i.e., the domestic
import demand will not affect the international prices of the imports. 19 Heterogeneity between imports and domestic products is assumed.
(4) Income Distribution and Domestic Demand. Household income comes from
capital, labour, and land income, as well as profit distributed by enterprises, and the
transfer payments from the government and overseas parties. Residents’ disposable
income is spent on the consumption of goods and services and on savings. Different
from the former DRCCGE models, this model adopts AIDADS consumption
expenditure function in the place of ELES expenditure function. AIDADS function
can be regarded as an extension of the LES function, or the latter as an exceptional
case of the former. AIDADS function changes the constant marginal propensity to
consume (MPC) in LES function into an income function, i.e., a function of the
endogeneous variable of MPC and income variable, which can better capture the
impact of income variation on the structure/mode of consumption.
Revenue of enterprises comes from capital income. After deducting the taxes and the
distributed profit to residents, the revenue turns into business savings for new
investment and depreciation. Government revenue comes from various taxes. After
deducting the subsidies and transfer payments, the revenue is used for governmental
consumption and public investment. Governmental consumption and investment
demand are described in fixed charge share function. The intermediate demand,
household consumption and other ultimate demands constitute the total demand of
Armington composite commodities.
(5) Market Equilibrium and Macro-closure. It is assumed that all commodity
markets are cleared through prices. In the model, the actual governmental expenditure
is exogeneous, all the tax rates and transfer payments are fixed, and the actual
governmental savings are endogeneous. The sum total of all investment expenditure is
equal to the sum total of all kinds of savings, including the retained profit of
enterprises, household savings, governmental savings, and foreign capital inflow. The
model adopts the neoclassic closure principle, i.e., the total investment is determined
endogeneously by all the components of the savings; in other words, the model is
driven by savings. The exchange rate is the price factor in the model, and the foreign
accounts achieve equilibrium through the variations of actual exchange rates.
(6) Dynamic Feature and Model Data. DRCCGE2009 has a simple recursive
dynamic structure20
. The dynamic feature is reflected in the following aspects: (1) the
quantitative growth of production factors; (2) the increase of TFP and the propensity
for technological progress; and (3) the vintage structure of capital. In the model, the
growth rate of population, labour and productivity is exogeneous, and the growth rate
of capital is determined endogeneously by the relation between savings and
investment in the model. The base year of the model is 2007, and the main source of
the data is the Social Accounting Matrix, or SAM in 2007.
20 It is assumed that economic subjects base their decisions on the static expectations of pricing and quantity.
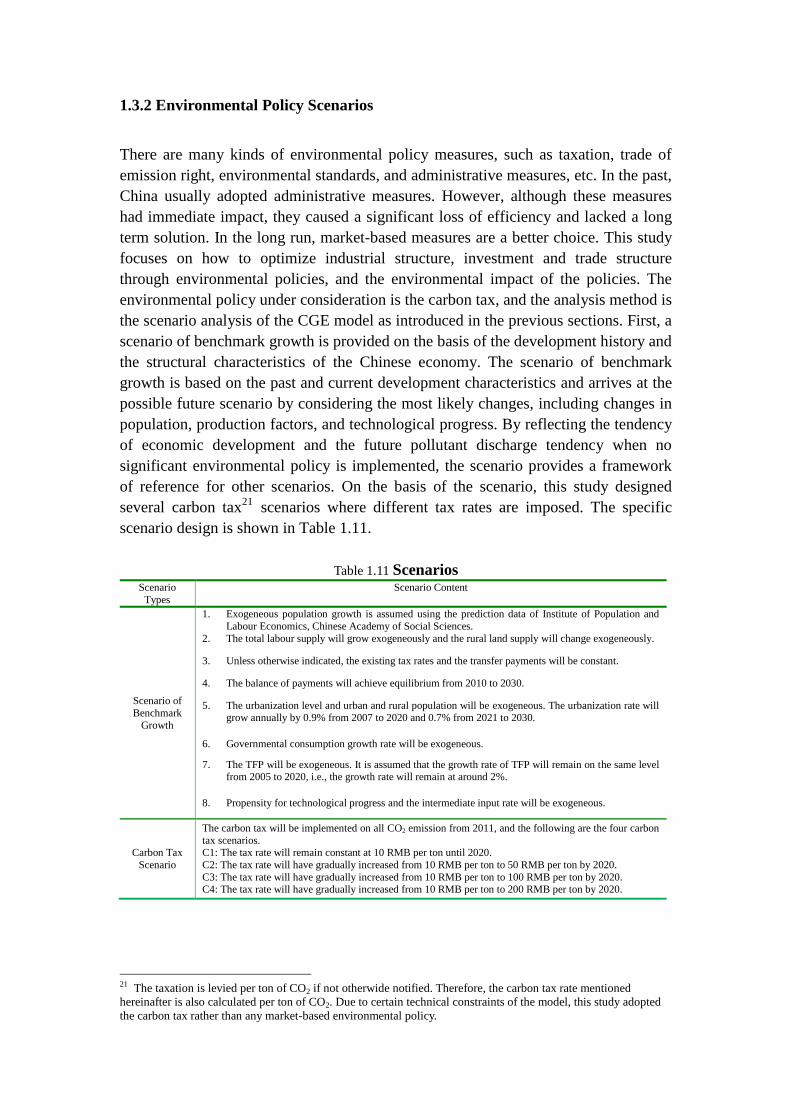
1.3.2 Environmental Policy Scenarios
There are many kinds of environmental policy measures, such as taxation, trade of
emission right, environmental standards, and administrative measures, etc. In the past,
China usually adopted administrative measures. However, although these measures
had immediate impact, they caused a significant loss of efficiency and lacked a long
term solution. In the long run, market-based measures are a better choice. This study
focuses on how to optimize industrial structure, investment and trade structure
through environmental policies, and the environmental impact of the policies. The
environmental policy under consideration is the carbon tax, and the analysis method is
the scenario analysis of the CGE model as introduced in the previous sections. First, a
scenario of benchmark growth is provided on the basis of the development history and
the structural characteristics of the Chinese economy. The scenario of benchmark
growth is based on the past and current development characteristics and arrives at the
possible future scenario by considering the most likely changes, including changes in
population, production factors, and technological progress. By reflecting the tendency
of economic development and the future pollutant discharge tendency when no
significant environmental policy is implemented, the scenario provides a framework
of reference for other scenarios. On the basis of the scenario, this study designed
several carbon tax21
scenarios where different tax rates are imposed. The specific
scenario design is shown in Table 1.11.
Table 1.11 Scenarios Scenario
Types
Scenario Content
Scenario of
Benchmark
Growth
1. Exogeneous population growth is assumed using the prediction data of Institute of Population and
Labour Economics, Chinese Academy of Social Sciences.
2. The total labour supply will grow exogeneously and the rural land supply will change exogeneously.
3. Unless otherwise indicated, the existing tax rates and the transfer payments will be constant.
4. The balance of payments will achieve equilibrium from 2010 to 2030.
5. The urbanization level and urban and rural population will be exogeneous. The urbanization rate will grow annually by 0.9% from 2007 to 2020 and 0.7% from 2021 to 2030.
6. Governmental consumption growth rate will be exogeneous.
7. The TFP will be exogeneous. It is assumed that the growth rate of TFP will remain on the same level from 2005 to 2020, i.e., the growth rate will remain at around 2%.
8. Propensity for technological progress and the intermediate input rate will be exogeneous.
Carbon Tax
Scenario
The carbon tax will be implemented on all CO2 emission from 2011, and the following are the four carbon
tax scenarios. C1: The tax rate will remain constant at 10 RMB per ton until 2020.
C2: The tax rate will have gradually increased from 10 RMB per ton to 50 RMB per ton by 2020.
C3: The tax rate will have gradually increased from 10 RMB per ton to 100 RMB per ton by 2020. C4: The tax rate will have gradually increased from 10 RMB per ton to 200 RMB per ton by 2020.
21 The taxation is levied per ton of CO2 if not otherwide notified. Therefore, the carbon tax rate mentioned
hereinafter is also calculated per ton of CO2. Due to certain technical constraints of the model, this study adopted
the carbon tax rather than any market-based environmental policy.
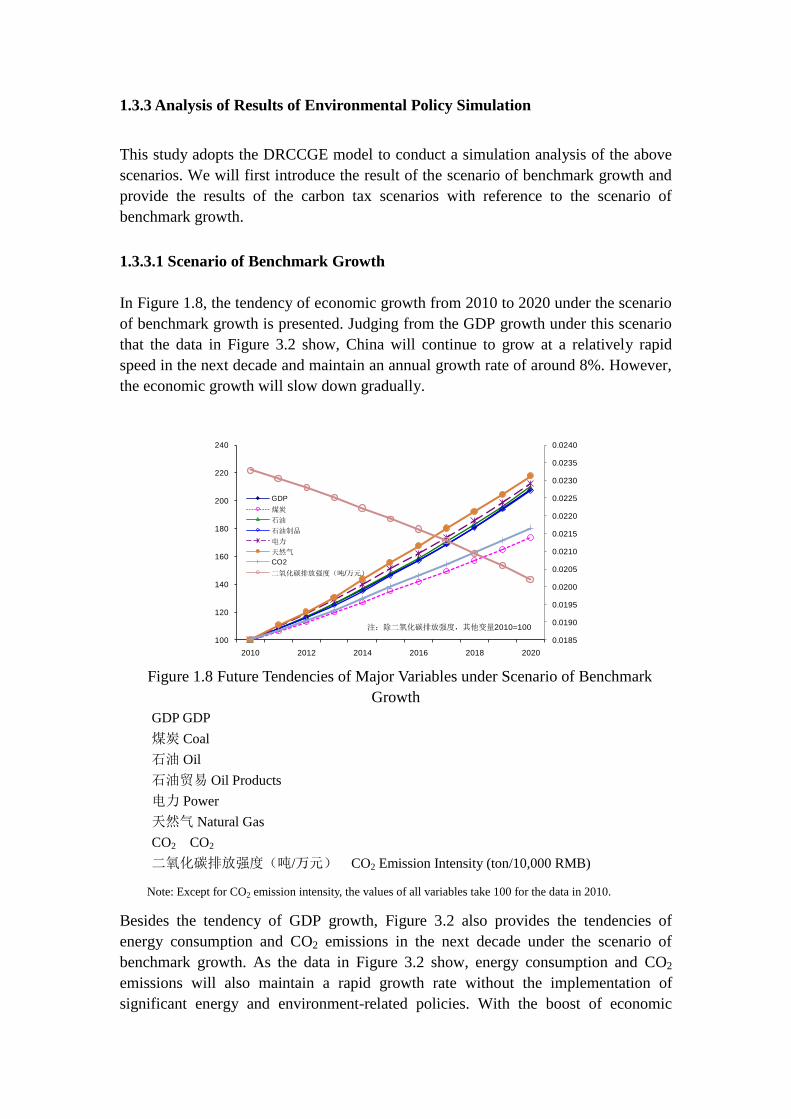
1.3.3 Analysis of Results of Environmental Policy Simulation
This study adopts the DRCCGE model to conduct a simulation analysis of the above
scenarios. We will first introduce the result of the scenario of benchmark growth and
provide the results of the carbon tax scenarios with reference to the scenario of
benchmark growth.
1.3.3.1 Scenario of Benchmark Growth
In Figure 1.8, the tendency of economic growth from 2010 to 2020 under the scenario
of benchmark growth is presented. Judging from the GDP growth under this scenario
that the data in Figure 3.2 show, China will continue to grow at a relatively rapid
speed in the next decade and maintain an annual growth rate of around 8%. However,
the economic growth will slow down gradually.
0.0185
0.0190
0.0195
0.0200
0.0205
0.0210
0.0215
0.0220
0.0225
0.0230
0.0235
0.0240
100
120
140
160
180
200
220
240
2010 2012 2014 2016 2018 2020
GDP
煤炭
石油
石油制品
电力
天然气
CO2
二氧化碳排放强度(吨/万元)
注:除二氧化碳排放强度,其他变量2010=100
Figure 1.8 Future Tendencies of Major Variables under Scenario of Benchmark
Growth
GDP GDP
煤炭 Coal
石油 Oil
石油贸易 Oil Products
电力 Power
天然气 Natural Gas
CO2 CO2
二氧化碳排放强度(吨/万元) CO2 Emission Intensity (ton/10,000 RMB)
Note: Except for CO2 emission intensity, the values of all variables take 100 for the data in 2010.
Besides the tendency of GDP growth, Figure 3.2 also provides the tendencies of
energy consumption and CO2 emissions in the next decade under the scenario of
benchmark growth. As the data in Figure 3.2 show, energy consumption and CO2
emissions will also maintain a rapid growth rate without the implementation of
significant energy and environment-related policies. With the boost of economic
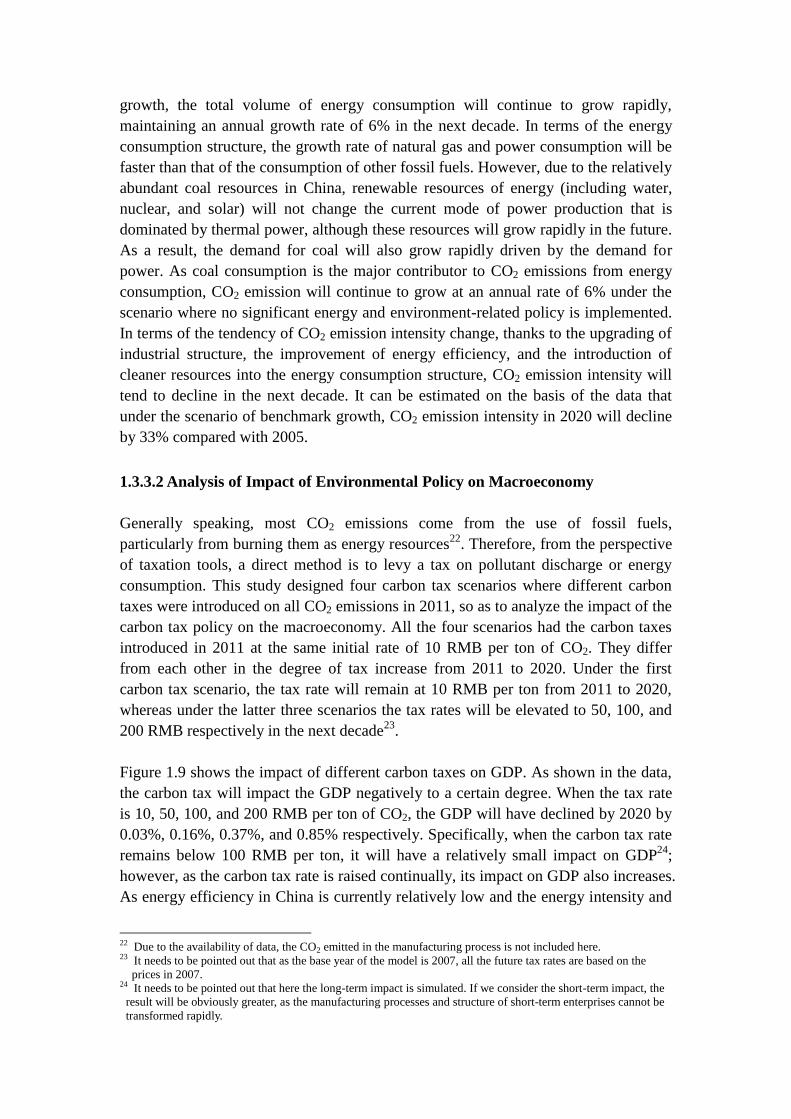
growth, the total volume of energy consumption will continue to grow rapidly,
maintaining an annual growth rate of 6% in the next decade. In terms of the energy
consumption structure, the growth rate of natural gas and power consumption will be
faster than that of the consumption of other fossil fuels. However, due to the relatively
abundant coal resources in China, renewable resources of energy (including water,
nuclear, and solar) will not change the current mode of power production that is
dominated by thermal power, although these resources will grow rapidly in the future.
As a result, the demand for coal will also grow rapidly driven by the demand for
power. As coal consumption is the major contributor to CO2 emissions from energy
consumption, CO2 emission will continue to grow at an annual rate of 6% under the
scenario where no significant energy and environment-related policy is implemented.
In terms of the tendency of CO2 emission intensity change, thanks to the upgrading of
industrial structure, the improvement of energy efficiency, and the introduction of
cleaner resources into the energy consumption structure, CO2 emission intensity will
tend to decline in the next decade. It can be estimated on the basis of the data that
under the scenario of benchmark growth, CO2 emission intensity in 2020 will decline
by 33% compared with 2005.
1.3.3.2 Analysis of Impact of Environmental Policy on Macroeconomy
Generally speaking, most CO2 emissions come from the use of fossil fuels,
particularly from burning them as energy resources22
. Therefore, from the perspective
of taxation tools, a direct method is to levy a tax on pollutant discharge or energy
consumption. This study designed four carbon tax scenarios where different carbon
taxes were introduced on all CO2 emissions in 2011, so as to analyze the impact of the
carbon tax policy on the macroeconomy. All the four scenarios had the carbon taxes
introduced in 2011 at the same initial rate of 10 RMB per ton of CO2. They differ
from each other in the degree of tax increase from 2011 to 2020. Under the first
carbon tax scenario, the tax rate will remain at 10 RMB per ton from 2011 to 2020,
whereas under the latter three scenarios the tax rates will be elevated to 50, 100, and
200 RMB respectively in the next decade23
.
Figure 1.9 shows the impact of different carbon taxes on GDP. As shown in the data,
the carbon tax will impact the GDP negatively to a certain degree. When the tax rate
is 10, 50, 100, and 200 RMB per ton of CO2, the GDP will have declined by 2020 by
0.03%, 0.16%, 0.37%, and 0.85% respectively. Specifically, when the carbon tax rate
remains below 100 RMB per ton, it will have a relatively small impact on GDP24
;
however, as the carbon tax rate is raised continually, its impact on GDP also increases.
As energy efficiency in China is currently relatively low and the energy intensity and
22 Due to the availability of data, the CO2 emitted in the manufacturing process is not included here. 23 It needs to be pointed out that as the base year of the model is 2007, all the future tax rates are based on the
prices in 2007. 24 It needs to be pointed out that here the long-term impact is simulated. If we consider the short-term impact, the
result will be obviously greater, as the manufacturing processes and structure of short-term enterprises cannot be
transformed rapidly.
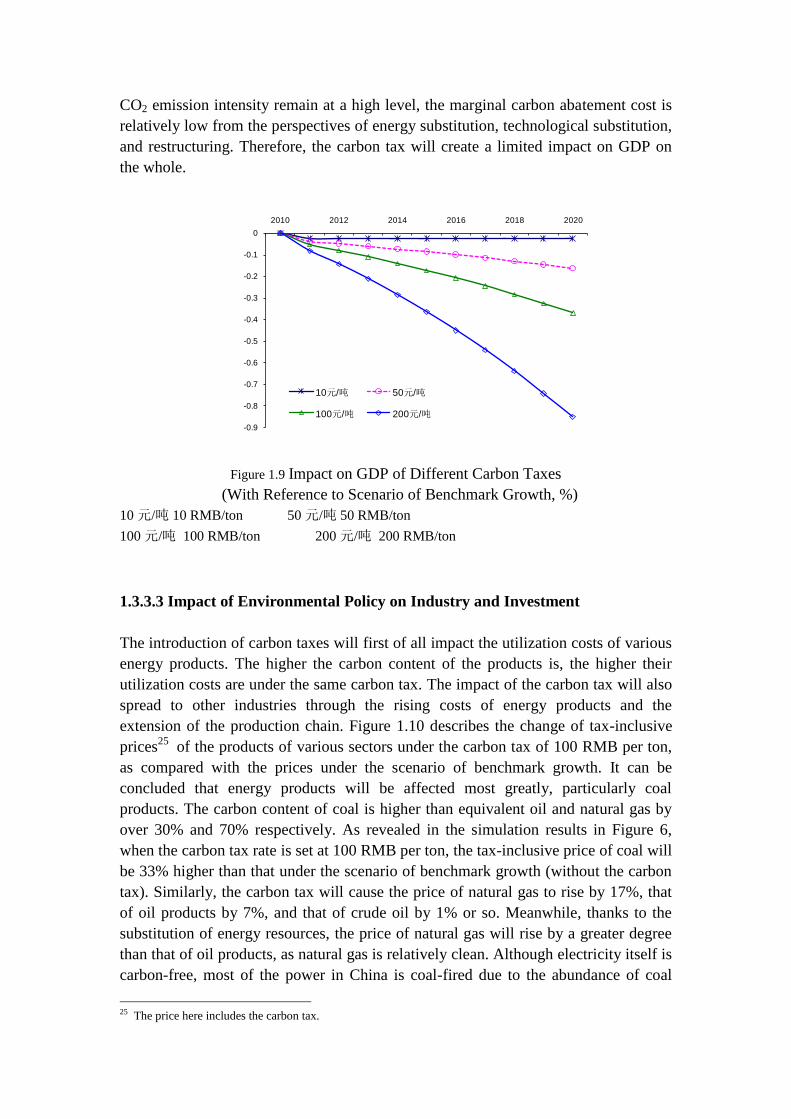
CO2 emission intensity remain at a high level, the marginal carbon abatement cost is
relatively low from the perspectives of energy substitution, technological substitution,
and restructuring. Therefore, the carbon tax will create a limited impact on GDP on
the whole.
-0.9
-0.8
-0.7
-0.6
-0.5
-0.4
-0.3
-0.2
-0.1
0
2010 2012 2014 2016 2018 2020
10元/吨 50元/吨
100元/吨 200元/吨
Figure 1.9 Impact on GDP of Different Carbon Taxes
(With Reference to Scenario of Benchmark Growth, %)
10 元/吨 10 RMB/ton 50 元/吨 50 RMB/ton
100 元/吨 100 RMB/ton 200 元/吨 200 RMB/ton
1.3.3.3 Impact of Environmental Policy on Industry and Investment
The introduction of carbon taxes will first of all impact the utilization costs of various
energy products. The higher the carbon content of the products is, the higher their
utilization costs are under the same carbon tax. The impact of the carbon tax will also
spread to other industries through the rising costs of energy products and the
extension of the production chain. Figure 1.10 describes the change of tax-inclusive
prices25
of the products of various sectors under the carbon tax of 100 RMB per ton,
as compared with the prices under the scenario of benchmark growth. It can be
concluded that energy products will be affected most greatly, particularly coal
products. The carbon content of coal is higher than equivalent oil and natural gas by
over 30% and 70% respectively. As revealed in the simulation results in Figure 6,
when the carbon tax rate is set at 100 RMB per ton, the tax-inclusive price of coal will
be 33% higher than that under the scenario of benchmark growth (without the carbon
tax). Similarly, the carbon tax will cause the price of natural gas to rise by 17%, that
of oil products by 7%, and that of crude oil by 1% or so. Meanwhile, thanks to the
substitution of energy resources, the price of natural gas will rise by a greater degree
than that of oil products, as natural gas is relatively clean. Although electricity itself is
carbon-free, most of the power in China is coal-fired due to the abundance of coal
25 The price here includes the carbon tax.
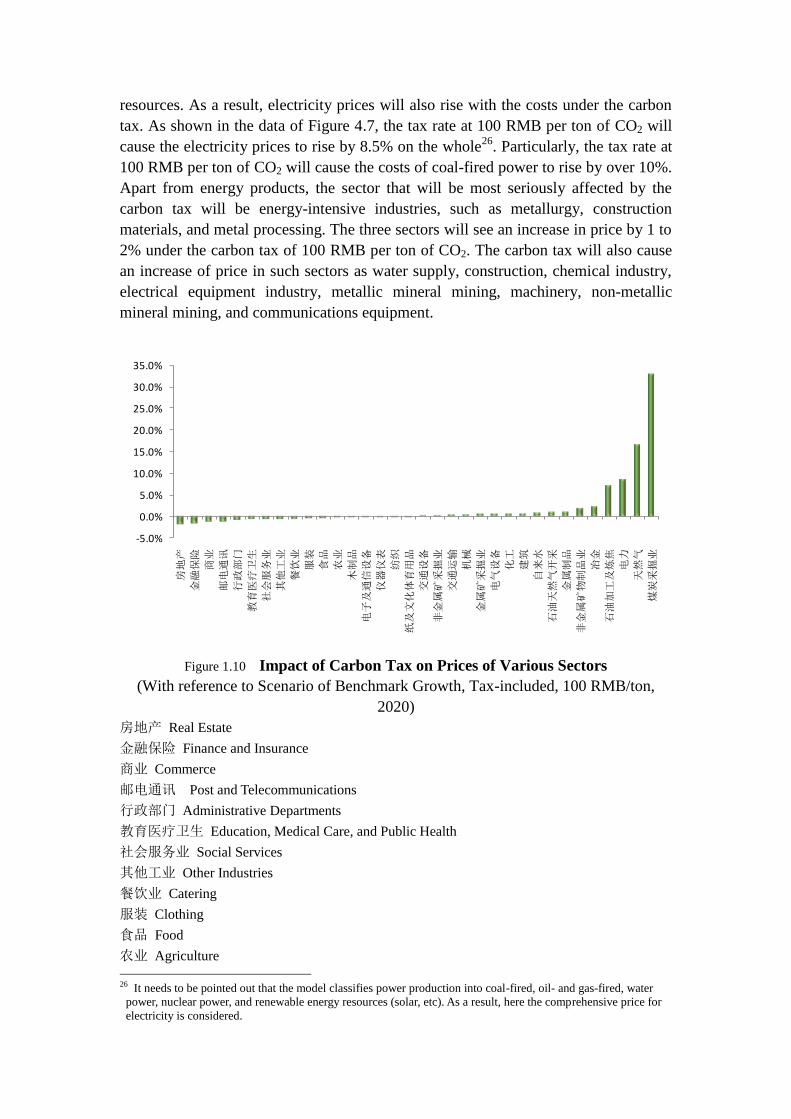
resources. As a result, electricity prices will also rise with the costs under the carbon
tax. As shown in the data of Figure 4.7, the tax rate at 100 RMB per ton of CO2 will
cause the electricity prices to rise by 8.5% on the whole26
. Particularly, the tax rate at
100 RMB per ton of CO2 will cause the costs of coal-fired power to rise by over 10%.
Apart from energy products, the sector that will be most seriously affected by the
carbon tax will be energy-intensive industries, such as metallurgy, construction
materials, and metal processing. The three sectors will see an increase in price by 1 to
2% under the carbon tax of 100 RMB per ton of CO2. The carbon tax will also cause
an increase of price in such sectors as water supply, construction, chemical industry,
electrical equipment industry, metallic mineral mining, machinery, non-metallic
mineral mining, and communications equipment.
-5.0%
0.0%
5.0%
10.0%
15.0%
20.0%
25.0%
30.0%
35.0%
房地
产
金融
保险
商业
邮电
通讯
行政
部门
教育
医疗
卫生
社会
服务
业
其他
工业
餐饮
业
服装
食品
农业
木制
品
电子
及通
信设
备
仪器
仪表
纺织
纸及
文化
体育
用品
交通
设备
非金
属矿
采掘
业
交通
运输
机械
金属
矿采
掘业
电气
设备
化工
建筑
自来
水
石油
天然
气开
采
金属
制品
非金
属矿
物制
品业
冶金
石油
加工
及炼
焦
电力
天然
气
煤炭
采掘
业
Figure 1.10 Impact of Carbon Tax on Prices of Various Sectors
(With reference to Scenario of Benchmark Growth, Tax-included, 100 RMB/ton,
2020)
房地产 Real Estate
金融保险 Finance and Insurance
商业 Commerce
邮电通讯 Post and Telecommunications
行政部门 Administrative Departments
教育医疗卫生 Education, Medical Care, and Public Health
社会服务业 Social Services
其他工业 Other Industries
餐饮业 Catering
服装 Clothing
食品 Food
农业 Agriculture
26 It needs to be pointed out that the model classifies power production into coal-fired, oil- and gas-fired, water
power, nuclear power, and renewable energy resources (solar, etc). As a result, here the comprehensive price for
electricity is considered.
木制品 Wood Processing
电子及通讯设备 Electronic and Telecommunication Equipment Manufacturing
仪器仪表 Instrument and Meter Manufacturing
纺织 Textiles
纸及文化体育用品 Paper-making and Other Stationery Manufacturing
交通设备 Communications Equipment
非金属矿采掘业交通运输 Non-metallic Mineral Mining Communications
机械 Machinery
金属矿采掘业 Metallic Mineral Mining
电气设备 Electric Equipment Manufacturing
化工 Chemical Industry
建筑 Construction
自来水 Water Supply
石油天然气开采 Oil and Gas Production
金属制品 Metal Processing
非金属了矿物制品 Non-metallic Mineral Processing
冶金 Metallurgy
石油加工及炼焦 Oil Processing and Coking
电力 Power
天然气 Natural Gas
煤炭采掘业 Coal Mining
On the other hand, the introduction of the carbon tax will cause a fall in the prices of
such technology-intensive and labour-intensive manufacturing sectors as textiles,
clothing, electronics, and food processing. The main reason behind this is that the
decrease in the prices of production factors will cause the costs to drop. The carbon
tax will trigger the income effect and result in a fall in demand, which will further
trigger the decrease of the prices of production factors. When the falling level of the
prices of the production factors compensates the rising level of the prices of the
intermediate input products, the overall costs of these sectors will tend to decline. As
all service sectors, with the exception of communications, are low in energy intensity,
the costs of all services except communications will decline by various degrees. Last,
the prices in the agricultural sector will also decrease, for the same reasons affecting
the services and some manufacturing sectors.
Figure 1.11 hows the change of output (or the demand for the output) of various
sectors when the carbon tax is set at 100 RMB per ton of CO2, with reference to the
scenario of benchmark growth. As the change in prices reflects the change in
demand-supply relation of the products, the change of output of the sectors is largely
similar to that of prices. First, the greatest impact will still be on the output of energy
production sectors, but the impact will be manifested in two different directions. First,
the output of fossil energy production and fossil-fuelled power production will
plummet dramatically. As shown in the figure, the output of coal, gas, oil and oil
products will decline by 13%, 9%, and 3% respectively under the scenario where a
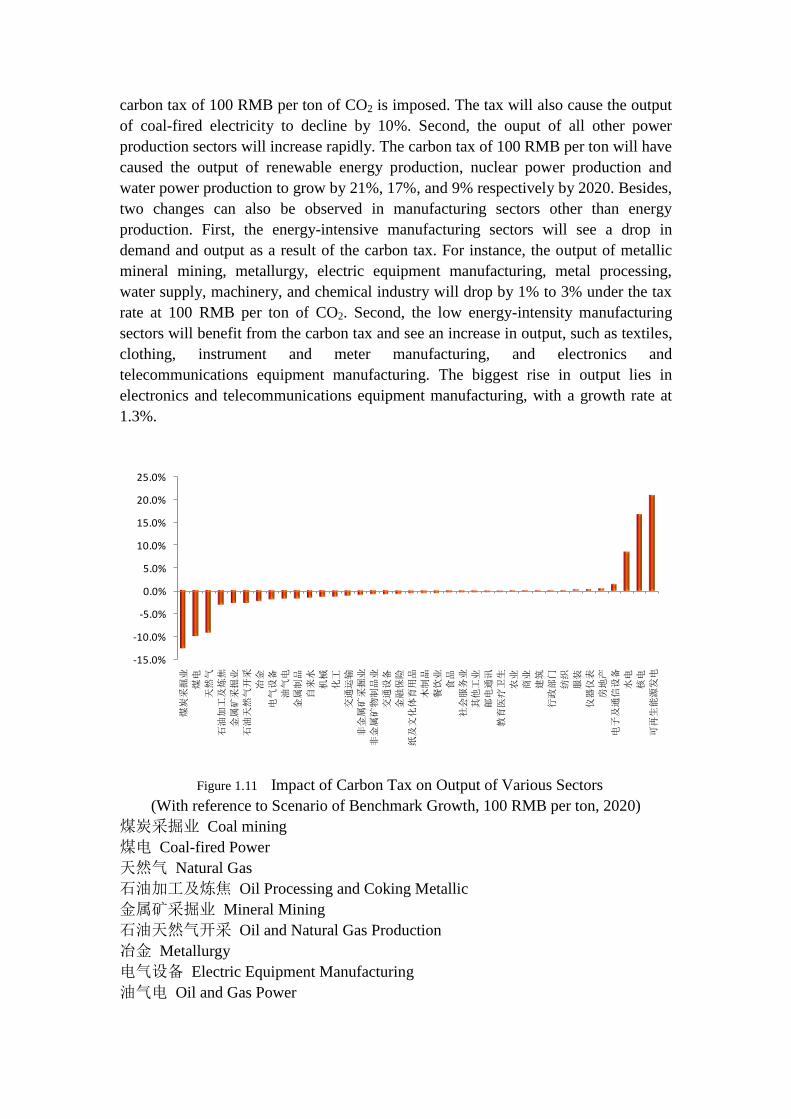
carbon tax of 100 RMB per ton of CO2 is imposed. The tax will also cause the output
of coal-fired electricity to decline by 10%. Second, the ouput of all other power
production sectors will increase rapidly. The carbon tax of 100 RMB per ton will have
caused the output of renewable energy production, nuclear power production and
water power production to grow by 21%, 17%, and 9% respectively by 2020. Besides,
two changes can also be observed in manufacturing sectors other than energy
production. First, the energy-intensive manufacturing sectors will see a drop in
demand and output as a result of the carbon tax. For instance, the output of metallic
mineral mining, metallurgy, electric equipment manufacturing, metal processing,
water supply, machinery, and chemical industry will drop by 1% to 3% under the tax
rate at 100 RMB per ton of CO2. Second, the low energy-intensity manufacturing
sectors will benefit from the carbon tax and see an increase in output, such as textiles,
clothing, instrument and meter manufacturing, and electronics and
telecommunications equipment manufacturing. The biggest rise in output lies in
electronics and telecommunications equipment manufacturing, with a growth rate at
1.3%.
-15.0%
-10.0%
-5.0%
0.0%
5.0%
10.0%
15.0%
20.0%
25.0%
煤炭
采掘
业
煤电
天然
气
石油
加工
及炼
焦
金属
矿采
掘业
石油
天然
气开
采
冶金
电气
设备
油气
电
金属
制品
自来
水
机械
化工
交通
运输
非金
属矿
采掘
业
非金
属矿
物制
品业
交通
设备
金融
保险
纸及
文化
体育
用品
木制
品
餐饮
业
食品
社会
服务
业
其他
工业
邮电
通讯
教育
医疗
卫生
农业
商业
建筑
行政
部门
纺织
服装
仪器
仪表
房地
产
电子
及通
信设
备
水电
核电
可再
生能
源发
电
Figure 1.11 Impact of Carbon Tax on Output of Various Sectors
(With reference to Scenario of Benchmark Growth, 100 RMB per ton, 2020)
煤炭采掘业 Coal mining
煤电 Coal-fired Power
天然气 Natural Gas
石油加工及炼焦 Oil Processing and Coking Metallic
金属矿采掘业 Mineral Mining
石油天然气开采 Oil and Natural Gas Production
冶金 Metallurgy
电气设备 Electric Equipment Manufacturing
油气电 Oil and Gas Power
金属制品 Metal Processing
自来水 Water Supply
机械 Machinery
化工 Chemical Industry
交通运输 Communications
非金属矿采掘业 Non-metallic Mineral Mining
非金属矿物制品业 Non-metallic Mineral Processing
交通设备 Communications Equipment Manufacturing
金融保险 Finance and Insurance
纸及文化体育用品 Paper-making and Stationery Manufacturing
木制品 Wood Processing
餐饮业 Catering
食品 Food
社会服务业 Social Services
其他工业 Other Manufacturing
邮电通讯 Post & Telecommunciations
教育医疗卫生 Education, Medical Care, and Public Health
农业 Agriculture
商业 Commerce
建筑 Construction
行政部门 Administrative Departments
纺织 Textile
服装 Clothing
仪器仪表 Instrument and Meter Manufacturing
房地产 Real Estate
电子及通讯设备 Electronics and Telecommunications Equipment Manufacturing
水电 Water Power
核电 Nuclear Power
可再生能源发电 Renewable Energy Resources
The majority of service and agricultural sectors, with the exception of real estate
industry, will see a decrease of output as a result of the carbon tax. However, the
impact on most of the sectors will be limited. A major reason for the impact is the
income effect. As the carbon tax will lead to a decrease in actual household income,
and the demand for services is relatively elastic, the drop in income will bring forth a
decline in demand and ultimately in ouput of the sectors.
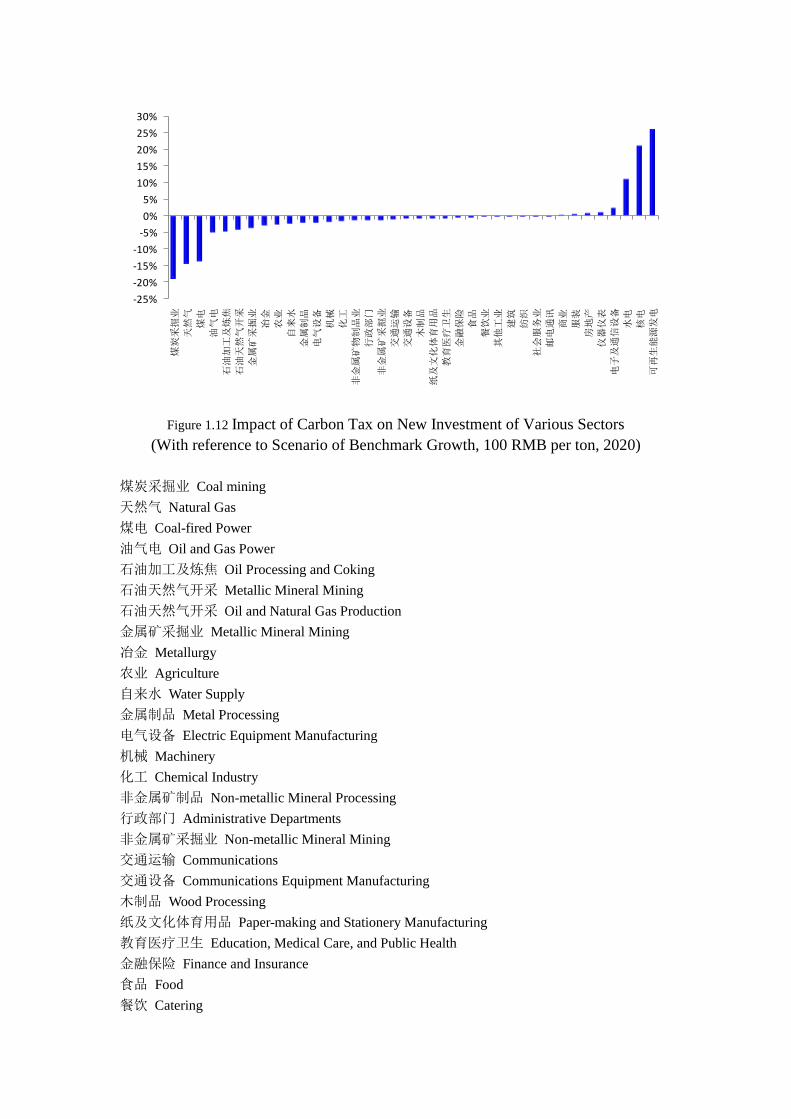
-25%
-20%
-15%
-10%
-5%
0%
5%
10%
15%
20%
25%
30%
煤炭
采掘
业
天然
气
煤电
油气
电
石油
加工
及炼
焦
石油
天然
气开
采
金属
矿采
掘业
冶金
农业
自来
水
金属
制品
电气
设备
机械
化工
非金
属矿
物制
品业
行政
部门
非金
属矿
采掘
业
交通
运输
交通
设备
木制
品
纸及
文化
体育
用品
教育
医疗
卫生
金融
保险
食品
餐饮
业
其他
工业
建筑
纺织
社会
服务
业
邮电
通讯
商业
服装
房地
产
仪器
仪表
电子
及通
信设
备
水电
核电
可再
生能
源发
电
Figure 1.12 Impact of Carbon Tax on New Investment of Various Sectors
(With reference to Scenario of Benchmark Growth, 100 RMB per ton, 2020)
煤炭采掘业 Coal mining
天然气 Natural Gas
煤电 Coal-fired Power
油气电 Oil and Gas Power
石油加工及炼焦 Oil Processing and Coking
石油天然气开采 Metallic Mineral Mining
石油天然气开采 Oil and Natural Gas Production
金属矿采掘业 Metallic Mineral Mining
冶金 Metallurgy
农业 Agriculture
自来水 Water Supply
金属制品 Metal Processing
电气设备 Electric Equipment Manufacturing
机械 Machinery
化工 Chemical Industry
非金属矿制品 Non-metallic Mineral Processing
行政部门 Administrative Departments
非金属矿采掘业 Non-metallic Mineral Mining
交通运输 Communications
交通设备 Communications Equipment Manufacturing
木制品 Wood Processing
纸及文化体育用品 Paper-making and Stationery Manufacturing
教育医疗卫生 Education, Medical Care, and Public Health
金融保险 Finance and Insurance
食品 Food
餐饮 Catering
其他产业 Other Manufacturing
建筑 Construction
纺织 Textile
社会服务 Social Services
邮电通讯 Post and Telecommunciations
商业 Commerce
服装 Clothing
房地产 Real Estate
仪器仪表 Instrument and Meter Manufacturing
电子及通讯设备 Electronics and Telecommunications Equipment Manufacturing
水电 Water Power
核电 Nuclear Power
可再生能源发电 Renewable Energy Resources
The change of product demand triggers a change in the demand for capital and
investment of various sectors. Figure 1.12 shows the change of new investments of
various sectors when the tax is levied at 100 RMB per ton of CO2 in 2020, with
reference to the scenario of benchmark growth. As shown in Figure 3.6, the change of
new investments in various sectors is largely similar to the change of output/demand
of the sectors, but there are certain variations due to the fact that the change in
investment is not only related to product demand of the sectors, but also to the change
of the relative pricing of the other production factors. The carbon tax will lead to a
reallocation of capital and investment across various sectors on the whole. First,
similar to the case with sectoral output, the greatest impact of the carbon tax will be
on energy production sectors, which is also reflected in two aspects. First, the new
investment in the fossil energy production and fossil-fuelled power production will
plummet dramatically compared with the carbon-tax-free situation. As shown in the
figure, the output of coal, gas, and oil and oil processing production sectors will
decrease by 19%, 15%, and 4% respectively when the carbon tax is levied at 100
RMB per ton of CO2. Specifically, the demand for new investment in these three
sectors will decline by 5 billion, 4 billion, and 2 billion RMB respectively27
, and
coal-fired power production will see a decline of demand for new investment by 14%
as a result of the carbon tax. On the other hand, all the other power production sectors
will usher in tremendous investment opportunities and see a rapid increase in demand
for new inevestment. By 2020, the carbon tax at 100 RMB per ton of CO2 will lead to
an increase in demand for new investment of 26%, 21%, and 11% in renewable
energy resources, nuclear power, and water power respectively, and the
non-fossil-fuelled power production sectors as a whole will usher in a demand for
new investment of nearly 40 billion RMB. Second, those manufacturing sectors apart
from energy production will also develop in two directions. First, the energy intensive
manufacturing sectors will see a decline in demand for new investment as a result of
the carbon tax, such as metallic mineral mining, metallurgy, water supply, metal
processing, electric equipment manufacturing, machinery, chemical industry,
27 Prices in 2007.
non-metallic mineral processing, non-metallic mineral mining, and so forth. Under the
carbon tax rate of 100 RMB per ton of CO2, demand for new investment in these
sectors will decrease by 1% to 4%. On the other hand, those manufacturing sectors
with low energy intensity will benefit from the carbon tax and see an increase of
demand for new investment, such as clothing, instrument and meter manufacturing,
and electronics and telecommunications equipment manufacturing. Electronics and
telecommunications equipment manufacturing will see the biggest rise in output,
scoring a growth rate of 2.4%. It is also worth pointing out that for certain
labour-intensive manufacturing sectors such as textile, the drop in labour cost will
lead to the substitution of capital by labour, which will result in a drop in demand for
new investment to a certain degree.
According to the simulation result, most service sectors and the agricultural sectors,
with the exception of commerce and real estate, will see a decrease in demand for new
investment. Apart from the decline of product demand, the decrease of labour cost
due to the drop in total demand is also a significant contributing factor.
The impact of the carbon tax on future FDI can be assessed in the following two ways.
On the one hand, it will depend on how strictly China and other countries will
implement their future environmental policies. If China implements a relatively strict
environmental policy, e.g., the simulated carbon tax policy presented in this study,
whereas the other developing countries or some developed countries do not
implement similar policies, FDI will inevitably flow into those countries with looser
environmental policies (in other words, lower environmental costs). Certainly, this
transfer is not only dependent on the environmental policy, but also on many other
factors, such as investment environment, human resource costs, and others. On the
other hand, the environmental policy will also affect the domestic allocation of FDI,
i.e., the policy will result in a reallocation of FDI across different sectors. For instance,
the FDI in the sectors with a drop in the demand for new investment is likely to flow
into those sectors with an increase in the demand for new investment. Due to the
unavailability of data of the difference in energy consumption and pollutant discharge
between enterprises with FDI and domestically-funded enterprises, we cannot conduct
a specific analysis of the impact of the environmental policy on the FDI of a certain
sector. Another point worth of our attention is that even in those sectors with high
energy intensity and pollutant discharge intensity, environmental policy will bring
forth opportunities of development for those FDI-funded enterprises that perform
better than domestically-funded enterprises in energy efficiency and pollutant
discharge reduction.
1.3.3.4 Impact of Environmental Policy on Foreign Trade
In regards to foreign trade, the carbon tax will change the cost of domestic products,
affect their competitiveness in the international market, and ultimately affect imports
and exports. In terms of the total imports and exports, the simulation results indicate
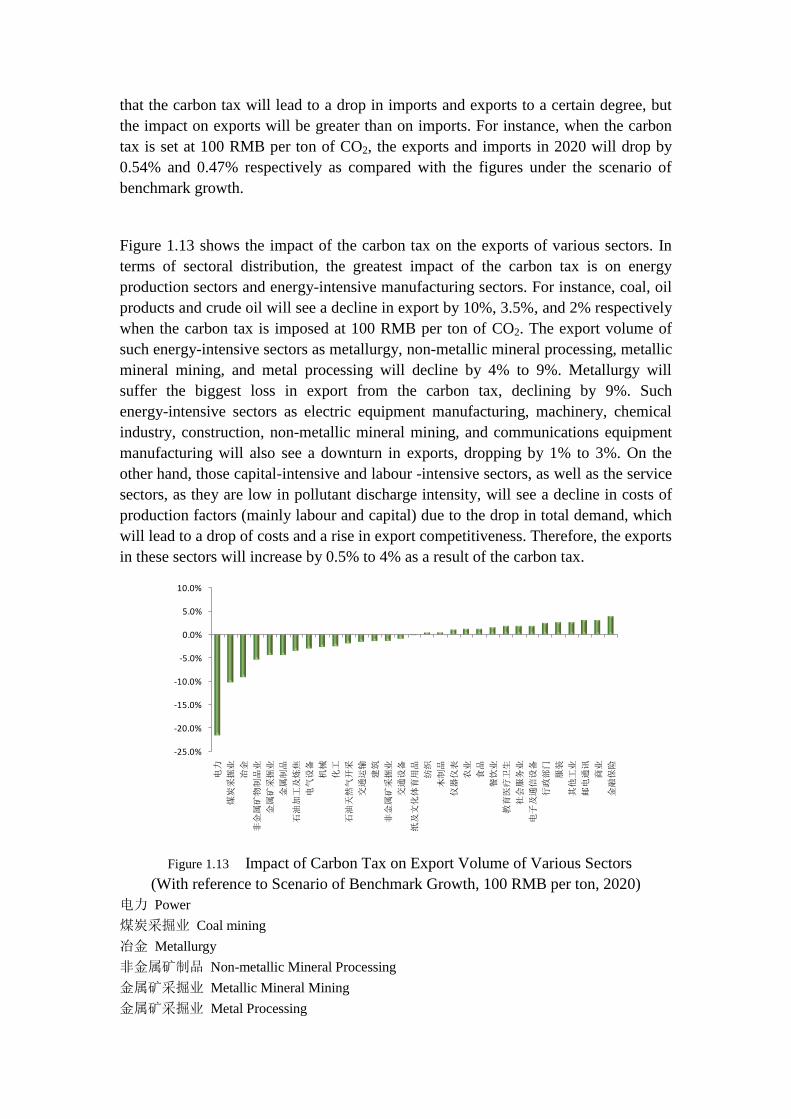
that the carbon tax will lead to a drop in imports and exports to a certain degree, but
the impact on exports will be greater than on imports. For instance, when the carbon
tax is set at 100 RMB per ton of CO2, the exports and imports in 2020 will drop by
0.54% and 0.47% respectively as compared with the figures under the scenario of
benchmark growth.
Figure 1.13 shows the impact of the carbon tax on the exports of various sectors. In
terms of sectoral distribution, the greatest impact of the carbon tax is on energy
production sectors and energy-intensive manufacturing sectors. For instance, coal, oil
products and crude oil will see a decline in export by 10%, 3.5%, and 2% respectively
when the carbon tax is imposed at 100 RMB per ton of CO2. The export volume of
such energy-intensive sectors as metallurgy, non-metallic mineral processing, metallic
mineral mining, and metal processing will decline by 4% to 9%. Metallurgy will
suffer the biggest loss in export from the carbon tax, declining by 9%. Such
energy-intensive sectors as electric equipment manufacturing, machinery, chemical
industry, construction, non-metallic mineral mining, and communications equipment
manufacturing will also see a downturn in exports, dropping by 1% to 3%. On the
other hand, those capital-intensive and labour -intensive sectors, as well as the service
sectors, as they are low in pollutant discharge intensity, will see a decline in costs of
production factors (mainly labour and capital) due to the drop in total demand, which
will lead to a drop of costs and a rise in export competitiveness. Therefore, the exports
in these sectors will increase by 0.5% to 4% as a result of the carbon tax.
-25.0%
-20.0%
-15.0%
-10.0%
-5.0%
0.0%
5.0%
10.0%
电力
煤炭
采掘
业
冶金
非金
属矿
物制
品业
金属
矿采
掘业
金属
制品
石油
加工
及炼
焦
电气
设备
机械
化工
石油
天然
气开
采
交通
运输
建筑
非金
属矿
采掘
业
交通
设备
纸及
文化
体育
用品
纺织
木制
品
仪器
仪表
农业
食品
餐饮
业
教育
医疗
卫生
社会
服务
业
电子
及通
信设
备
行政
部门
服装
其他
工业
邮电
通讯
商业
金融
保险
Figure 1.13 Impact of Carbon Tax on Export Volume of Various Sectors
(With reference to Scenario of Benchmark Growth, 100 RMB per ton, 2020)
电力 Power
煤炭采掘业 Coal mining
冶金 Metallurgy
非金属矿制品 Non-metallic Mineral Processing
金属矿采掘业 Metallic Mineral Mining
金属矿采掘业 Metal Processing
石油加工及炼焦 Oil Processing and Coking
电气设备 Electric Equipment Manufacturing
机械 Machinery
化工 Chemical Industry
石油天然气开采 Oil and Natural Gas Production
交通运输 Communications
建筑 Construction
非金属矿采掘业 Non-metallic Mineral Mining
交通设备 Communications Equipment Manufacturing
纸及文化体育用品 Paper-making and Stationery Manufacturing
纺织 Textiles
木制品 Wood Processing
仪器仪表 Instrument and Meter Manufacturing
农业 Agriculture
食品 Food
餐饮 Catering
教育医疗卫生 Education, Medical Care, and Public Health
社会服务业 Social Services
电子及通讯设备 Electronics and Telecommunications Equipment Manufacturing
行政部门 Administrative Departments
服装 Clothing
其他工业 Other Manufacturing
邮电通讯 Post and Telecommunciations
商业 Commerce
金融保险 Finance and Insurance
As revealed in the simulation results, the impact of the carbon tax on imports seems to
be the mirror reflection of that on exports. Figure 1.14 shows the impact of the carbon
tax on the imports of various sectors. First, the impact of the carbon tax on the import
of fossil-fuelled energy production sectors is somewhat similar to that on the export,
but the underlying reasons are different. As imported fossil energy resources will
result in CO2 emissions in the same way as domestic fossil energy resources, the
carbon tax will be imposed on the utilization of both without distinction. As a result,
the domestic demand for fossil energy resources will drastically decline due to the
carbon tax, leading to a dive in the import of these resources. When the carbon tax is
levied at the rate of 100 RMB per ton of CO2, the import volume of coal, crude oil
and oil products will decline by 10%, 3%, and 2% respectively. Secondly, the import
volume of energy-intensive sectors will rise. For instance, the import volume of
metallurgy, non-metallic mineral processing, and metal processing will increase by
over 2%. Last, the import of the low energy intensive manufacturing sectors, service
sectors and agricultural sectors will decline as a result of the carbon tax, but the
impact will be generally limited. The main reason for the decline in import is that the
domestic goods in these sectors will be more competitive than imported goods as the
production factors become cheaper domestically.
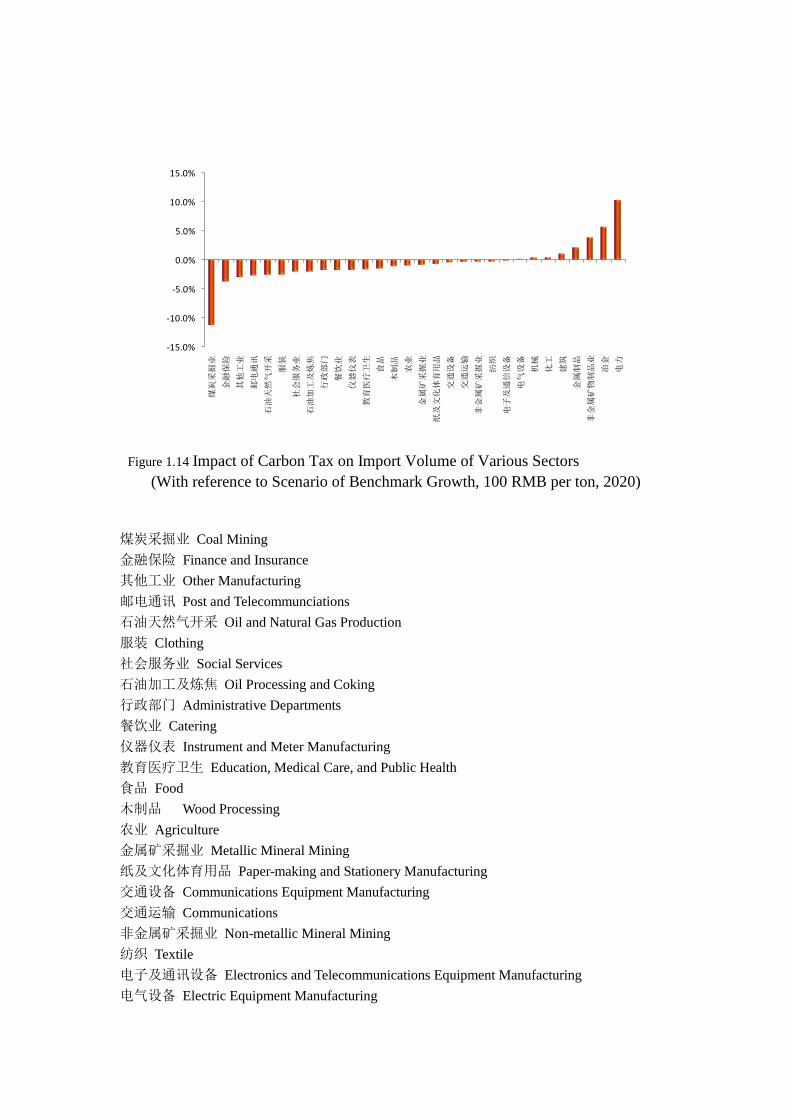
-15.0%
-10.0%
-5.0%
0.0%
5.0%
10.0%
15.0%
煤炭
采掘
业
金融
保险
其他
工业
邮电
通讯
石油
天然
气开
采
服装
社会
服务
业
石油
加工
及炼
焦
行政
部门
餐饮
业
仪器
仪表
教育
医疗
卫生
食品
木制
品
农业
金属
矿采
掘业
纸及
文化
体育
用品
交通
设备
交通
运输
非金
属矿
采掘
业
纺织
电子
及通
信设
备
电气
设备
机械
化工
建筑
金属
制品
非金
属矿
物制
品业
冶金
电力
Figure 1.14 Impact of Carbon Tax on Import Volume of Various Sectors
(With reference to Scenario of Benchmark Growth, 100 RMB per ton, 2020)
煤炭采掘业 Coal Mining
金融保险 Finance and Insurance
其他工业 Other Manufacturing
邮电通讯 Post and Telecommunciations
石油天然气开采 Oil and Natural Gas Production
服装 Clothing
社会服务业 Social Services
石油加工及炼焦 Oil Processing and Coking
行政部门 Administrative Departments
餐饮业 Catering
仪器仪表 Instrument and Meter Manufacturing
教育医疗卫生 Education, Medical Care, and Public Health
食品 Food
木制品 Wood Processing
农业 Agriculture
金属矿采掘业 Metallic Mineral Mining
纸及文化体育用品 Paper-making and Stationery Manufacturing
交通设备 Communications Equipment Manufacturing
交通运输 Communications
非金属矿采掘业 Non-metallic Mineral Mining
纺织 Textile
电子及通讯设备 Electronics and Telecommunications Equipment Manufacturing
电气设备 Electric Equipment Manufacturing
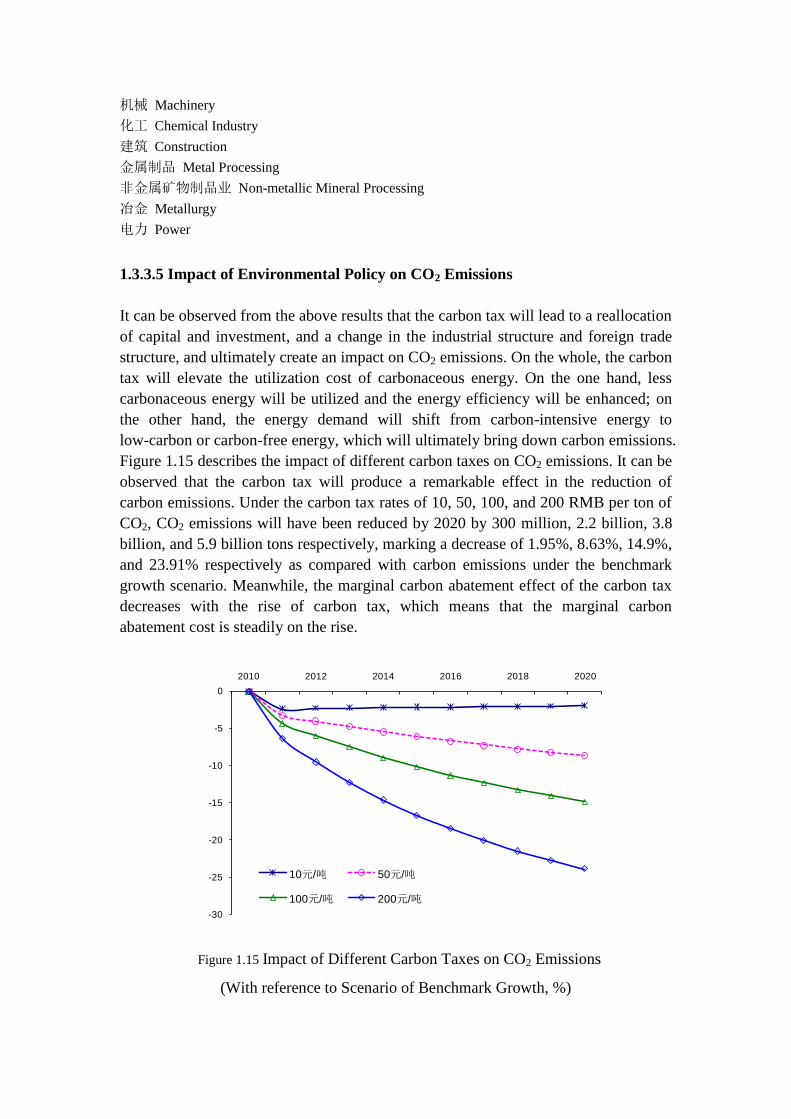
机械 Machinery
化工 Chemical Industry
建筑 Construction
金属制品 Metal Processing
非金属矿物制品业 Non-metallic Mineral Processing
冶金 Metallurgy
电力 Power
1.3.3.5 Impact of Environmental Policy on CO2 Emissions
It can be observed from the above results that the carbon tax will lead to a reallocation
of capital and investment, and a change in the industrial structure and foreign trade
structure, and ultimately create an impact on CO2 emissions. On the whole, the carbon
tax will elevate the utilization cost of carbonaceous energy. On the one hand, less
carbonaceous energy will be utilized and the energy efficiency will be enhanced; on
the other hand, the energy demand will shift from carbon-intensive energy to
low-carbon or carbon-free energy, which will ultimately bring down carbon emissions.
Figure 1.15 describes the impact of different carbon taxes on CO2 emissions. It can be
observed that the carbon tax will produce a remarkable effect in the reduction of
carbon emissions. Under the carbon tax rates of 10, 50, 100, and 200 RMB per ton of
CO2, CO2 emissions will have been reduced by 2020 by 300 million, 2.2 billion, 3.8
billion, and 5.9 billion tons respectively, marking a decrease of 1.95%, 8.63%, 14.9%,
and 23.91% respectively as compared with carbon emissions under the benchmark
growth scenario. Meanwhile, the marginal carbon abatement effect of the carbon tax
decreases with the rise of carbon tax, which means that the marginal carbon
abatement cost is steadily on the rise.
-30
-25
-20
-15
-10
-5
0
2010 2012 2014 2016 2018 2020
10元/吨 50元/吨
100元/吨 200元/吨
Figure 1.15 Impact of Different Carbon Taxes on CO2 Emissions
(With reference to Scenario of Benchmark Growth, %)
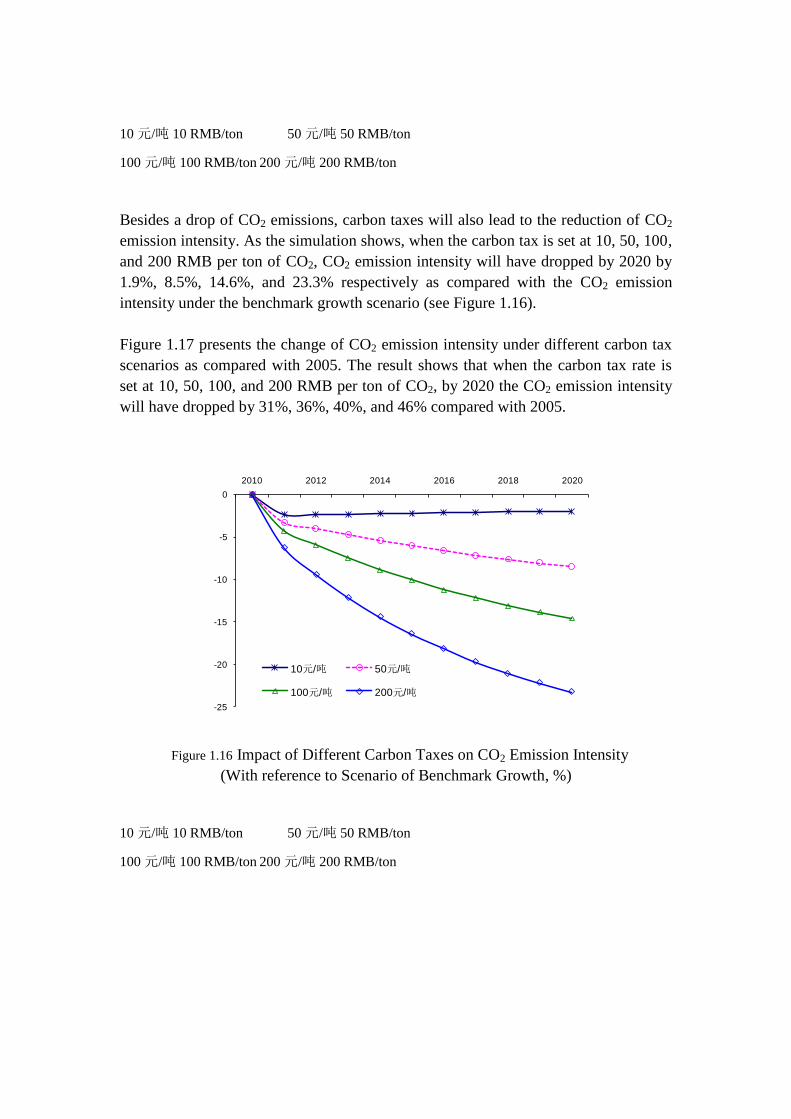
10 元/吨 10 RMB/ton 50 元/吨 50 RMB/ton
100 元/吨 100 RMB/ton 200 元/吨 200 RMB/ton
Besides a drop of CO2 emissions, carbon taxes will also lead to the reduction of CO2
emission intensity. As the simulation shows, when the carbon tax is set at 10, 50, 100,
and 200 RMB per ton of CO2, CO2 emission intensity will have dropped by 2020 by
1.9%, 8.5%, 14.6%, and 23.3% respectively as compared with the CO2 emission
intensity under the benchmark growth scenario (see Figure 1.16).
Figure 1.17 presents the change of CO2 emission intensity under different carbon tax
scenarios as compared with 2005. The result shows that when the carbon tax rate is
set at 10, 50, 100, and 200 RMB per ton of CO2, by 2020 the CO2 emission intensity
will have dropped by 31%, 36%, 40%, and 46% compared with 2005.
-25
-20
-15
-10
-5
0
2010 2012 2014 2016 2018 2020
10元/吨 50元/吨
100元/吨 200元/吨
Figure 1.16 Impact of Different Carbon Taxes on CO2 Emission Intensity
(With reference to Scenario of Benchmark Growth, %)
10 元/吨 10 RMB/ton 50 元/吨 50 RMB/ton
100 元/吨 100 RMB/ton 200 元/吨 200 RMB/ton
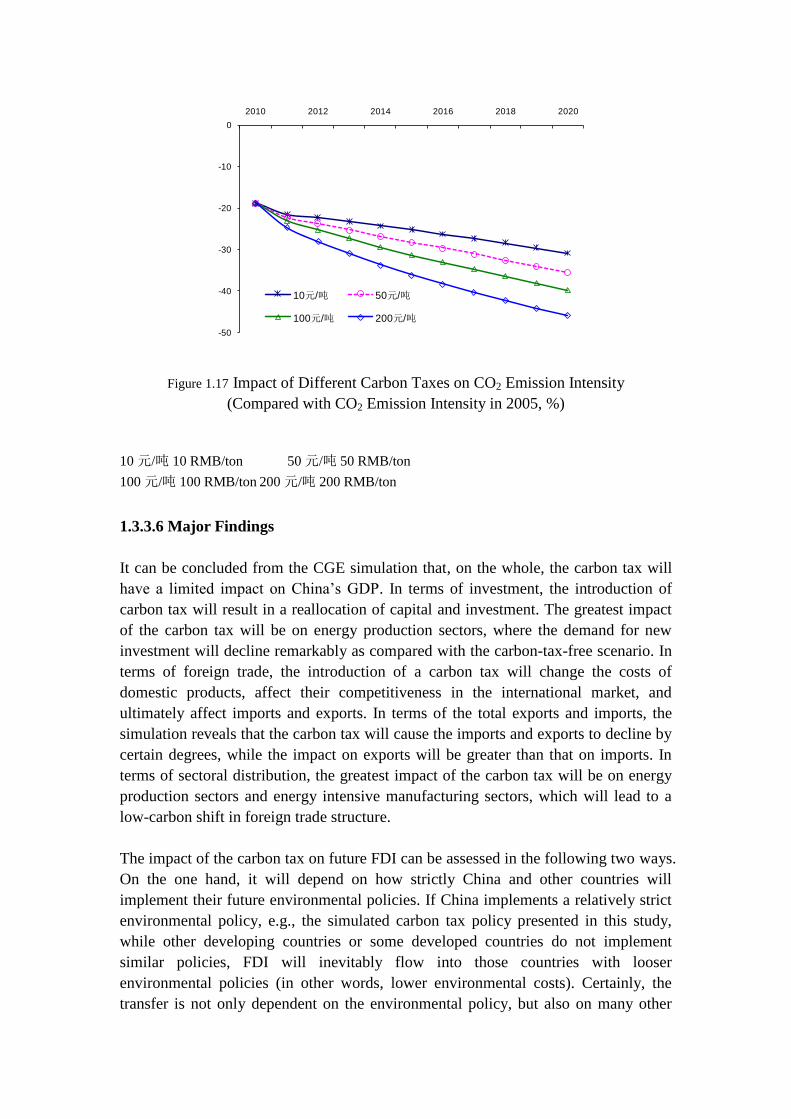
-50
-40
-30
-20
-10
0
2010 2012 2014 2016 2018 2020
10元/吨 50元/吨
100元/吨 200元/吨
Figure 1.17 Impact of Different Carbon Taxes on CO2 Emission Intensity
(Compared with CO2 Emission Intensity in 2005, %)
10 元/吨 10 RMB/ton 50 元/吨 50 RMB/ton
100 元/吨 100 RMB/ton 200 元/吨 200 RMB/ton
1.3.3.6 Major Findings
It can be concluded from the CGE simulation that, on the whole, the carbon tax will
have a limited impact on China’s GDP. In terms of investment, the introduction of
carbon tax will result in a reallocation of capital and investment. The greatest impact
of the carbon tax will be on energy production sectors, where the demand for new
investment will decline remarkably as compared with the carbon-tax-free scenario. In
terms of foreign trade, the introduction of a carbon tax will change the costs of
domestic products, affect their competitiveness in the international market, and
ultimately affect imports and exports. In terms of the total exports and imports, the
simulation reveals that the carbon tax will cause the imports and exports to decline by
certain degrees, while the impact on exports will be greater than that on imports. In
terms of sectoral distribution, the greatest impact of the carbon tax will be on energy
production sectors and energy intensive manufacturing sectors, which will lead to a
low-carbon shift in foreign trade structure.
The impact of the carbon tax on future FDI can be assessed in the following two ways.
On the one hand, it will depend on how strictly China and other countries will
implement their future environmental policies. If China implements a relatively strict
environmental policy, e.g., the simulated carbon tax policy presented in this study,
while other developing countries or some developed countries do not implement
similar policies, FDI will inevitably flow into those countries with looser
environmental policies (in other words, lower environmental costs). Certainly, the
transfer is not only dependent on the environmental policy, but also on many other
factors, such as investment environment and human resource costs, among others. On
the other hand, the environmental policy will also affect the domestic allocation of
FDI, i.e., the policy will result in a reallocation of FDI across different sectors. For
instance, the FDI in the sectors with a drop in the demand for new investment is likely
to flow into those sectors with an increase in the demand for new investment. Due to
the unavailability of data of the difference in energy consumption and pollutant
discharge between enterprises with FDI and domestically-funded enterprises, we
cannot conduct a specific analysis of the impact of the environmental policy on the
FDI in a certain sector. Another point worthy of our attention is that even in those
sectors with high energy intensity and high pollutant discharge intensity, the
environmental policy will bring forth opportunities of development for those
FDI-funded enterprises that perform better than domestically-funded enterprises in
energy efficiency and pollutant discharge reduction.
The carbon tax will create a remarkable effect in the reduction of carbon emission.
Under the carbon tax rates of 10, 50, 100, and 200 RMB per ton of CO2, CO2
emissions will have been reduced by 2020 by 300 million , 2.2 billion, 3.8 billion, and
5.9 billion tons respectively, marking a decrease of 1.95%, 8.63%, 14.9%, and
23.91% respectively as compared with the carbon emissions under the scenario of
benchmark growth. Besides a drop in CO2 emissions, carbon taxes will also lead to
the reduction of CO2 emission intensity. As the simulation shows, when the carbon
tax is set at 10, 50, 100, and 200 RMB per ton of CO2, CO2 emission intensity will
have dropped by 2020 by 1.9%, 8.5%, 14.6%, and 23.3% respectively as compared
with the CO2 emission intensity under the benchmark growth scenario.
In conclusion, the introduction of a carbon tax will not impact China’s macroeconomy
to a significant degree, but may promote the investment and trade to develop in a way
that is conducive to environmental improvement.
45
Chapter 2 A Study on the Environmental Impact of Foreign
Direct Investment
2.1 Introduction
2.1.1 Background Introduction
Accelerated economic globalization has brought the world economy into the era of
global competition. As a form of international capital flow, international direct
investment is one of the important channels for optimizing resource allocation and
promoting the improvement of productivity worldwide. With the rapid and healthy
development of the Chinese economy and deepening of reform and opening up to the
rest of the world, attracting foreign capital has become an important aspect of China’s
participation in economic globalization. By the end of December 2009, China had
approved over 660 thousand foreign-invested enterprises in total and the amount of
foreign direct investment absorbed had reached USD 997.4 billion, remaining the
developing country absorbing the largest amount of foreign investment for 17 years in
a row28
. Even in 2008 and 2009, when the world was swept by the financial crisis, the
size of foreign direct investment in China just dropped only slightly.
Investment by foreign enterprises in China is a win-win situation. As an important
funding source of fixed assets in China, foreign direct investment promotes, to
varying degrees, economic development, expansion of employment opportunities,
improvement of employment quality, and an increase of government income in China.
At the same time, foreign enterprises also enjoy the benefits resulting from China’s
rapid development. According to a survey report published by the US-China Business
Council in 2011, nearly 90% of US companies acknowledge that their earning
performance in China is equal to or higher than their overall global earning
performance.
However, China is currently faced with a series of environmental problems. The
current economic growth trend features huge demand for energy and resources while
the ecosystems are loosing their capacity to support this due to the compression and
compounding of the demand. The strategic adjustment of the industrial structure, trade
structure, and market structure in China is imperative. Under the emissions reduction
objective of the “Twelfth Five-Year Plan”, the total control objectives of four
constraining indexes of chemical oxygen demand, sulfur dioxide, ammonia nitrogen,
28 Source of data: Ministry of Commerce website.
46
and nitric oxide have been reduced by 8%, 8%, 10%, and 10% respectively from those
of 2010. Compared with the “Double 10” objective in the “Eleventh Five-Year Plan”,
the emissions reduction reality in the next five years will be tougher. Due to the
complexity of the pollution problems, enterprises—especially pollution-intensive
enterprises—as major contributors to pollution, should be responsible for reducing
pollution so as to promote sustainable development in China. Most foreign enterprises,
especially large transnational corporations, as important driving forces for economic
development in China, have more advanced management experience,
environmentally-friendly technology, and environmental management ideas, and are
fully able to play a more active role in China’s green transformation. Against such a
backdrop, foreign-invested enterprises should also re-examine and re-orient their
mode of investment and operation, so as to grasp the huge space and strategic
opportunities presented by China’s future development.
2.1.2 Objectives
Foreign direct investment is a “double-edged sword” for host countries. With the
large-scale inflow of foreign direct investment into sectors such as manufacturing,
natural resources, and infrastructure construction, the environmental pressure incurred
by foreign direct investment is also further expanding. What impact has foreign
investment exerted on China’s environment? Compared with other countries, is
China’s current environmental policy more lenient? The focus of study in this paper
will be in terms of foreign capital utilization, how China should grasp opportunities to
promote domestic industrial structural adjustment and realize shift to a green economy
through measures such as policy guidance and the development of environmental
standards. The major objectives in this section of this paper include:
1. To systematically review and examine the sustainability of China’s policy for
attracting foreign investment over three decades of reform and opening up to the rest
of the world.
2. To analyze how to further guide foreign investment flow through policy
orientation so as to maximize the positive role foreign investment can play in China’s
shift to a green economy against the backdrop of green development and economic
structural adjustment in China.
3. Study how to take advantage of the halo effect and the spillover effect of
foreign investment, so as to improve the upgrading of Chinese enterprises’
environmental management and deployment of environmentally-friendly technologies,
47
and help China improve the development of the market system for sustainable
development.
2.1.3 Literature Review
When people first faced the issue of trade and environment in the 1970s, the main
analyses mostly focused on how environmental policies would affect free trade. With
the trend toward economic globalization, the globalization of environmental problems
was significant. In the 1990s, the relationship between FDI and the environment
became a popular research focus (Pearson, 1993). In view of the current research
literature, the studies on FDI and environment mainly focus on the following issues:
(1) Whether FDI’s environmental impact and “Inverse U Curve” hypothesis can
be validated in practice; whether economic benefit brought to the host country by the
introduction of FDI must be realized at the cost of the environment of the host
country.
(2) Whether FDI and the “Pollution Havens” hypothesis holds, and whether
developing countries have become the “Havens” for developed countries to transfer
their pollution-intensive industries.
(3) Whether developing countries’ “racing towards the environmental standard
baseline” will lead to further deterioration of their ecological environment, giving rise
to the dilemma of “immiserizing growth”.
(4) Whether there is positive correlation between the stringency of environmental
regulations of a country and the entry of FDI.
(5) The relationship between strategic environmental policy and the international
flow of FDI.
2.1.3.1 FDI and the “Inverse U Curve” Hypothesis
In the mid-1950s, Simon Kuznets, in his study of economic growth and income
difference, proposed the following hypothesis (Kuznets, 1955)29
: economic inequality
increases over time while a country is developing, and then after a certain average
income is attained, inequality begins to decrease. This hypothesis represents an
inverse U relationship, which has been subsequently validated by a large amount of
29 Kuznets, S. Economic Growth and Income Inequality. American Economic Review, 1955, 45 (1).
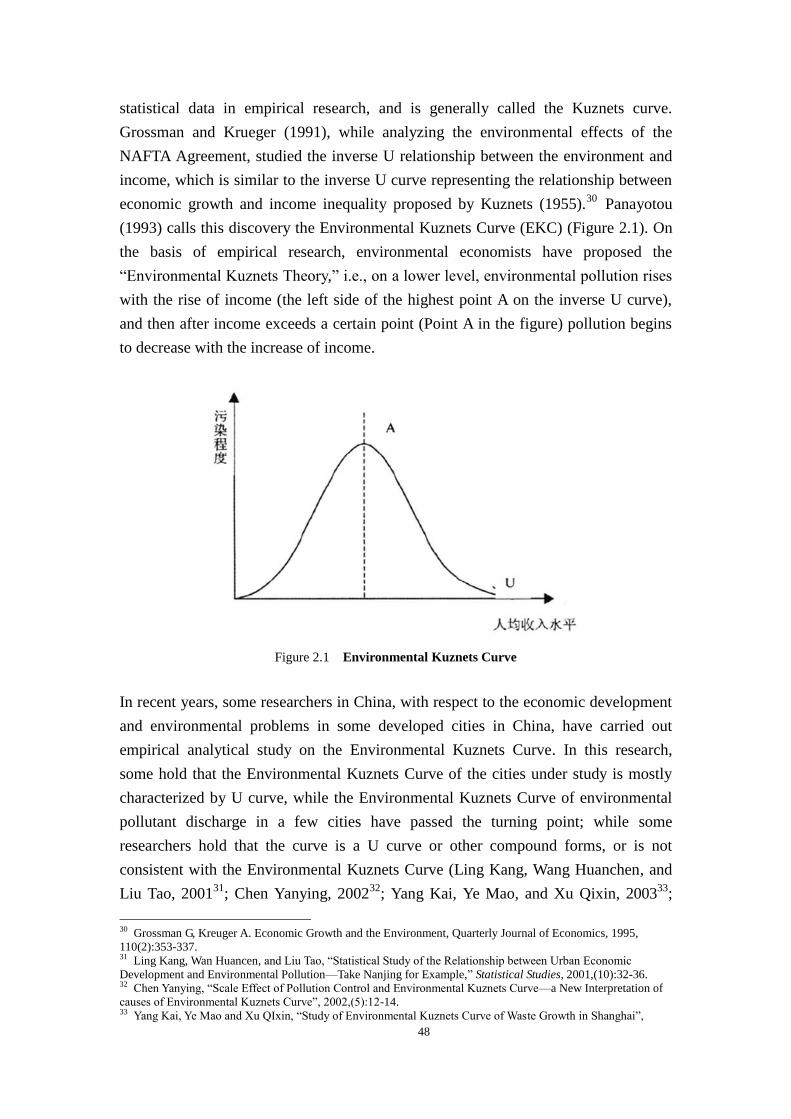
48
statistical data in empirical research, and is generally called the Kuznets curve.
Grossman and Krueger (1991), while analyzing the environmental effects of the
NAFTA Agreement, studied the inverse U relationship between the environment and
income, which is similar to the inverse U curve representing the relationship between
economic growth and income inequality proposed by Kuznets (1955).30
Panayotou
(1993) calls this discovery the Environmental Kuznets Curve (EKC) (Figure 2.1). On
the basis of empirical research, environmental economists have proposed the
“Environmental Kuznets Theory,” i.e., on a lower level, environmental pollution rises
with the rise of income (the left side of the highest point A on the inverse U curve),
and then after income exceeds a certain point (Point A in the figure) pollution begins
to decrease with the increase of income.
Figure 2.1 Environmental Kuznets Curve
In recent years, some researchers in China, with respect to the economic development
and environmental problems in some developed cities in China, have carried out
empirical analytical study on the Environmental Kuznets Curve. In this research,
some hold that the Environmental Kuznets Curve of the cities under study is mostly
characterized by U curve, while the Environmental Kuznets Curve of environmental
pollutant discharge in a few cities have passed the turning point; while some
researchers hold that the curve is a U curve or other compound forms, or is not
consistent with the Environmental Kuznets Curve (Ling Kang, Wang Huanchen, and
Liu Tao, 200131
; Chen Yanying, 200232
; Yang Kai, Ye Mao, and Xu Qixin, 200333
;
30 Grossman G, Kreuger A. Economic Growth and the Environment, Quarterly Journal of Economics, 1995,
110(2):353-337. 31 Ling Kang, Wan Huancen, and Liu Tao, “Statistical Study of the Relationship between Urban Economic
Development and Environmental Pollution—Take Nanjing for Example,” Statistical Studies, 2001,(10):32-36. 32 Chen Yanying, “Scale Effect of Pollution Control and Environmental Kuznets Curve—a New Interpretation of
causes of Environmental Kuznets Curve”, 2002,(5):12-14. 33 Yang Kai, Ye Mao and Xu QIxin, “Study of Environmental Kuznets Curve of Waste Growth in Shanghai”,
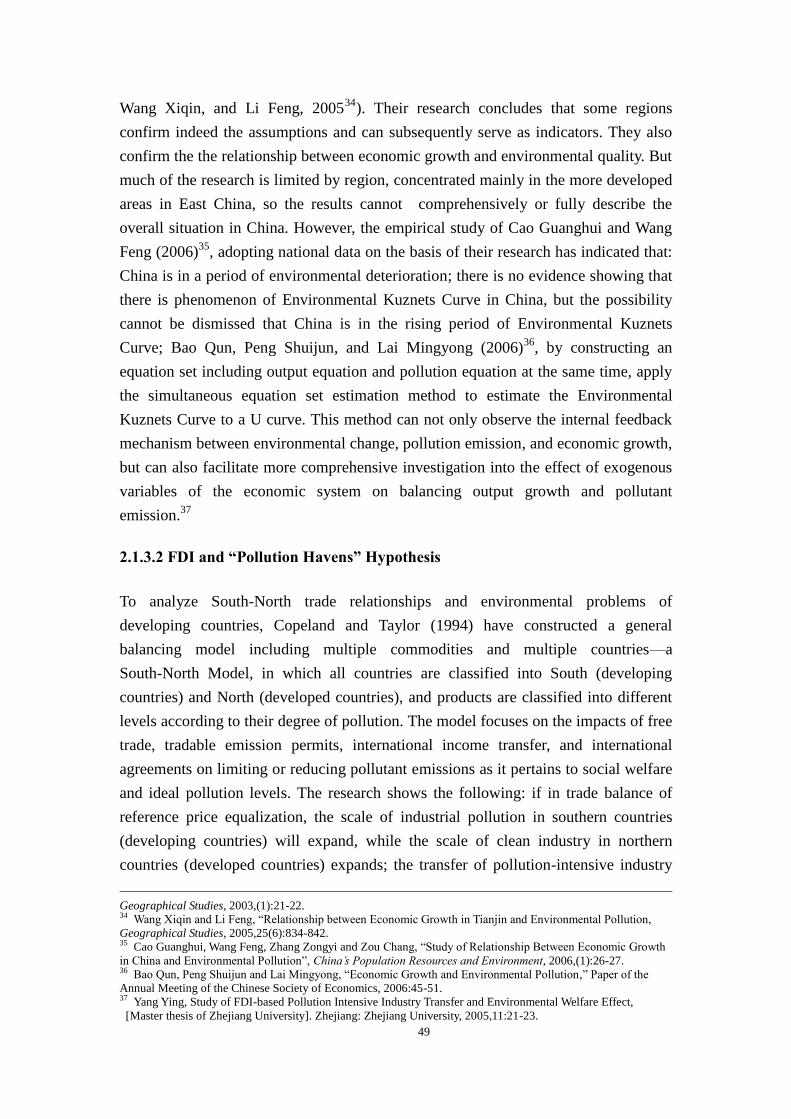
49
Wang Xiqin, and Li Feng, 200534
). Their research concludes that some regions
confirm indeed the assumptions and can subsequently serve as indicators. They also
confirm the the relationship between economic growth and environmental quality. But
much of the research is limited by region, concentrated mainly in the more developed
areas in East China, so the results cannot comprehensively or fully describe the
overall situation in China. However, the empirical study of Cao Guanghui and Wang
Feng (2006)35
, adopting national data on the basis of their research has indicated that:
China is in a period of environmental deterioration; there is no evidence showing that
there is phenomenon of Environmental Kuznets Curve in China, but the possibility
cannot be dismissed that China is in the rising period of Environmental Kuznets
Curve; Bao Qun, Peng Shuijun, and Lai Mingyong (2006)36
, by constructing an
equation set including output equation and pollution equation at the same time, apply
the simultaneous equation set estimation method to estimate the Environmental
Kuznets Curve to a U curve. This method can not only observe the internal feedback
mechanism between environmental change, pollution emission, and economic growth,
but can also facilitate more comprehensive investigation into the effect of exogenous
variables of the economic system on balancing output growth and pollutant
emission.37
2.1.3.2 FDI and “Pollution Havens” Hypothesis
To analyze South-North trade relationships and environmental problems of
developing countries, Copeland and Taylor (1994) have constructed a general
balancing model including multiple commodities and multiple countries—a
South-North Model, in which all countries are classified into South (developing
countries) and North (developed countries), and products are classified into different
levels according to their degree of pollution. The model focuses on the impacts of free
trade, tradable emission permits, international income transfer, and international
agreements on limiting or reducing pollutant emissions as it pertains to social welfare
and ideal pollution levels. The research shows the following: if in trade balance of
reference price equalization, the scale of industrial pollution in southern countries
(developing countries) will expand, while the scale of clean industry in northern
countries (developed countries) expands; the transfer of pollution-intensive industry
Geographical Studies, 2003,(1):21-22. 34 Wang Xiqin and Li Feng, “Relationship between Economic Growth in Tianjin and Environmental Pollution,
Geographical Studies, 2005,25(6):834-842. 35 Cao Guanghui, Wang Feng, Zhang Zongyi and Zou Chang, “Study of Relationship Between Economic Growth
in China and Environmental Pollution”, China’s Population Resources and Environment, 2006,(1):26-27. 36 Bao Qun, Peng Shuijun and Lai Mingyong, “Economic Growth and Environmental Pollution,” Paper of the
Annual Meeting of the Chinese Society of Economics, 2006:45-51. 37 Yang Ying, Study of FDI-based Pollution Intensive Industry Transfer and Environmental Welfare Effect,
[Master thesis of Zhejiang University]. Zhejiang: Zhejiang University, 2005,11:21-23.
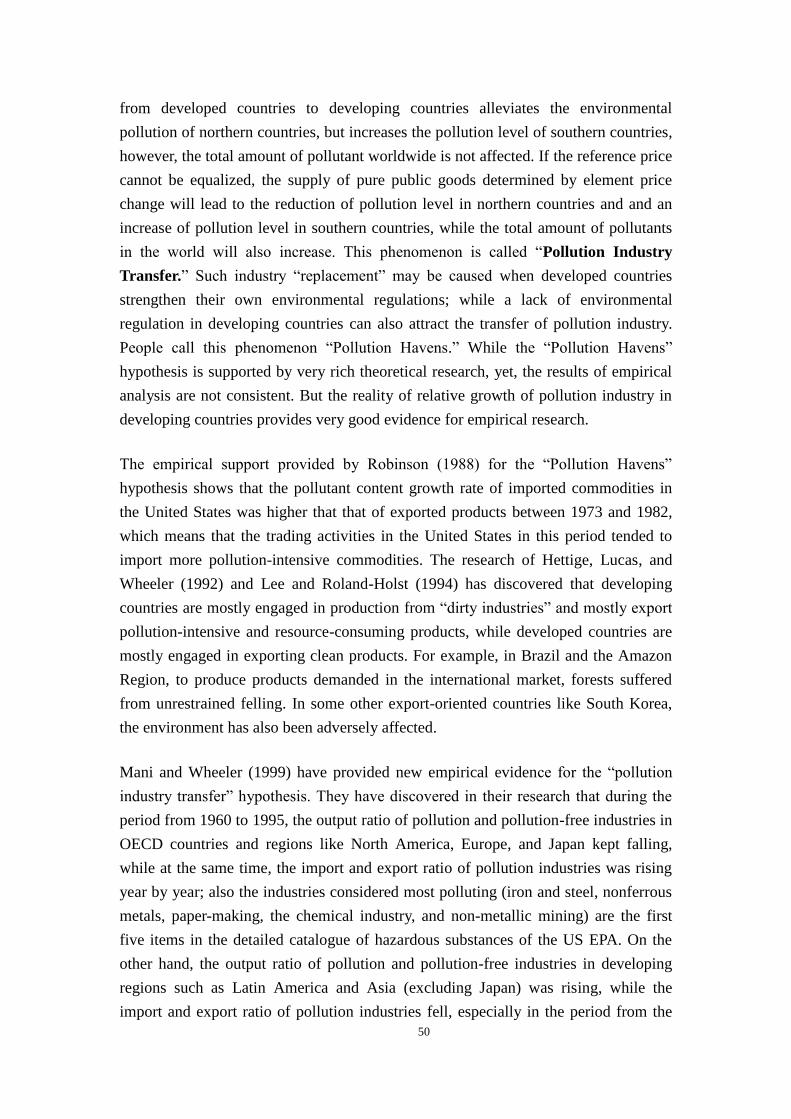
50
from developed countries to developing countries alleviates the environmental
pollution of northern countries, but increases the pollution level of southern countries,
however, the total amount of pollutant worldwide is not affected. If the reference price
cannot be equalized, the supply of pure public goods determined by element price
change will lead to the reduction of pollution level in northern countries and and an
increase of pollution level in southern countries, while the total amount of pollutants
in the world will also increase. This phenomenon is called “Pollution Industry
Transfer.” Such industry “replacement” may be caused when developed countries
strengthen their own environmental regulations; while a lack of environmental
regulation in developing countries can also attract the transfer of pollution industry.
People call this phenomenon “Pollution Havens.” While the “Pollution Havens”
hypothesis is supported by very rich theoretical research, yet, the results of empirical
analysis are not consistent. But the reality of relative growth of pollution industry in
developing countries provides very good evidence for empirical research.
The empirical support provided by Robinson (1988) for the “Pollution Havens”
hypothesis shows that the pollutant content growth rate of imported commodities in
the United States was higher that that of exported products between 1973 and 1982,
which means that the trading activities in the United States in this period tended to
import more pollution-intensive commodities. The research of Hettige, Lucas, and
Wheeler (1992) and Lee and Roland-Holst (1994) has discovered that developing
countries are mostly engaged in production from “dirty industries” and mostly export
pollution-intensive and resource-consuming products, while developed countries are
mostly engaged in exporting clean products. For example, in Brazil and the Amazon
Region, to produce products demanded in the international market, forests suffered
from unrestrained felling. In some other export-oriented countries like South Korea,
the environment has also been adversely affected.
Mani and Wheeler (1999) have provided new empirical evidence for the “pollution
industry transfer” hypothesis. They have discovered in their research that during the
period from 1960 to 1995, the output ratio of pollution and pollution-free industries in
OECD countries and regions like North America, Europe, and Japan kept falling,
while at the same time, the import and export ratio of pollution industries was rising
year by year; also the industries considered most polluting (iron and steel, nonferrous
metals, paper-making, the chemical industry, and non-metallic mining) are the first
five items in the detailed catalogue of hazardous substances of the US EPA. On the
other hand, the output ratio of pollution and pollution-free industries in developing
regions such as Latin America and Asia (excluding Japan) was rising, while the
import and export ratio of pollution industries fell, especially in the period from the
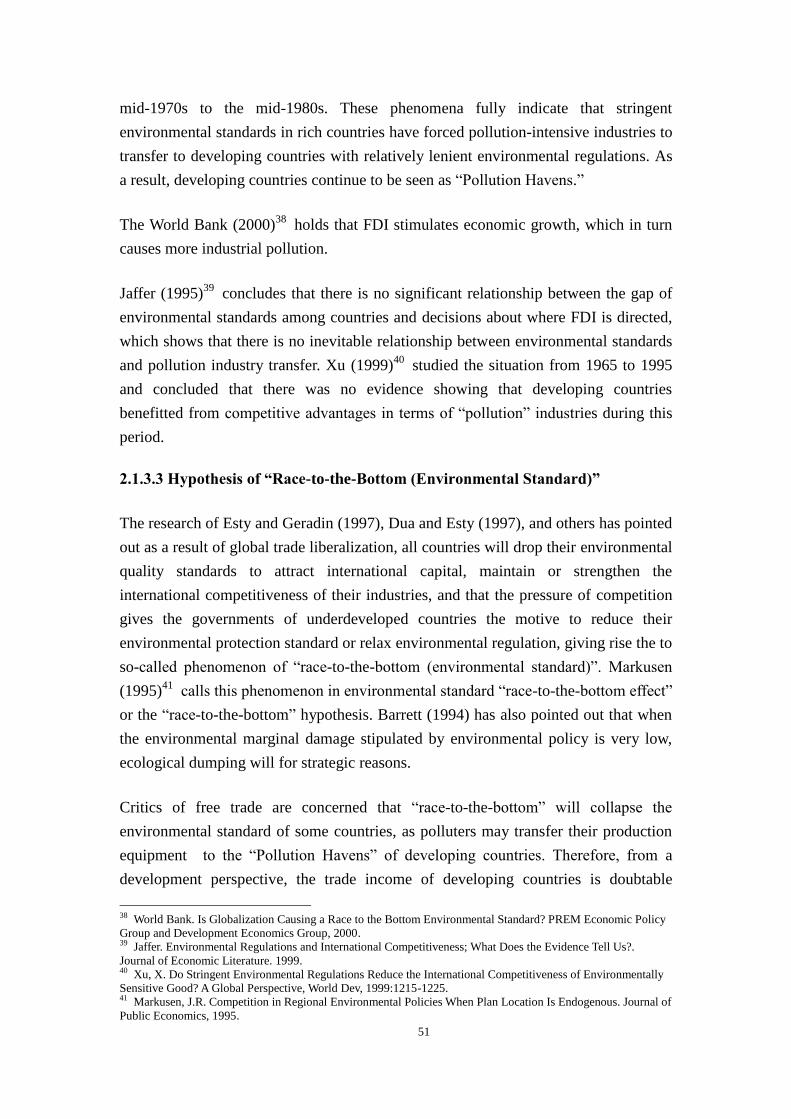
51
mid-1970s to the mid-1980s. These phenomena fully indicate that stringent
environmental standards in rich countries have forced pollution-intensive industries to
transfer to developing countries with relatively lenient environmental regulations. As
a result, developing countries continue to be seen as “Pollution Havens.”
The World Bank (2000)38
holds that FDI stimulates economic growth, which in turn
causes more industrial pollution.
Jaffer (1995)39
concludes that there is no significant relationship between the gap of
environmental standards among countries and decisions about where FDI is directed,
which shows that there is no inevitable relationship between environmental standards
and pollution industry transfer. Xu (1999)40
studied the situation from 1965 to 1995
and concluded that there was no evidence showing that developing countries
benefitted from competitive advantages in terms of “pollution” industries during this
period.
2.1.3.3 Hypothesis of “Race-to-the-Bottom (Environmental Standard)”
The research of Esty and Geradin (1997), Dua and Esty (1997), and others has pointed
out as a result of global trade liberalization, all countries will drop their environmental
quality standards to attract international capital, maintain or strengthen the
international competitiveness of their industries, and that the pressure of competition
gives the governments of underdeveloped countries the motive to reduce their
environmental protection standard or relax environmental regulation, giving rise the to
so-called phenomenon of “race-to-the-bottom (environmental standard)”. Markusen
(1995)41
calls this phenomenon in environmental standard “race-to-the-bottom effect”
or the “race-to-the-bottom” hypothesis. Barrett (1994) has also pointed out that when
the environmental marginal damage stipulated by environmental policy is very low,
ecological dumping will for strategic reasons.
Critics of free trade are concerned that “race-to-the-bottom” will collapse the
environmental standard of some countries, as polluters may transfer their production
equipment to the “Pollution Havens” of developing countries. Therefore, from a
development perspective, the trade income of developing countries is doubtable
38 World Bank. Is Globalization Causing a Race to the Bottom Environmental Standard? PREM Economic Policy
Group and Development Economics Group, 2000. 39 Jaffer. Environmental Regulations and International Competitiveness; What Does the Evidence Tell Us?.
Journal of Economic Literature. 1999. 40 Xu, X. Do Stringent Environmental Regulations Reduce the International Competitiveness of Environmentally
Sensitive Good? A Global Perspective, World Dev, 1999:1215-1225. 41 Markusen, J.R. Competition in Regional Environmental Policies When Plan Location Is Endogenous. Journal of
Public Economics, 1995.
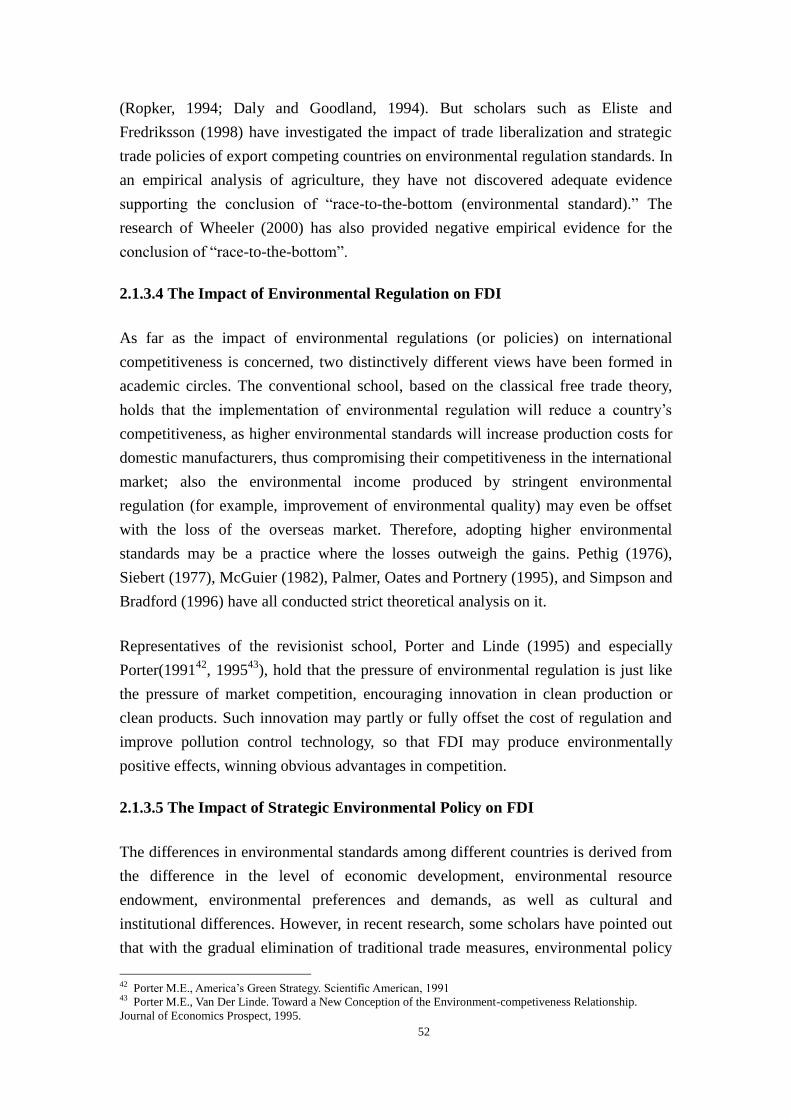
52
(Ropker, 1994; Daly and Goodland, 1994). But scholars such as Eliste and
Fredriksson (1998) have investigated the impact of trade liberalization and strategic
trade policies of export competing countries on environmental regulation standards. In
an empirical analysis of agriculture, they have not discovered adequate evidence
supporting the conclusion of “race-to-the-bottom (environmental standard).” The
research of Wheeler (2000) has also provided negative empirical evidence for the
conclusion of “race-to-the-bottom”.
2.1.3.4 The Impact of Environmental Regulation on FDI
As far as the impact of environmental regulations (or policies) on international
competitiveness is concerned, two distinctively different views have been formed in
academic circles. The conventional school, based on the classical free trade theory,
holds that the implementation of environmental regulation will reduce a country’s
competitiveness, as higher environmental standards will increase production costs for
domestic manufacturers, thus compromising their competitiveness in the international
market; also the environmental income produced by stringent environmental
regulation (for example, improvement of environmental quality) may even be offset
with the loss of the overseas market. Therefore, adopting higher environmental
standards may be a practice where the losses outweigh the gains. Pethig (1976),
Siebert (1977), McGuier (1982), Palmer, Oates and Portnery (1995), and Simpson and
Bradford (1996) have all conducted strict theoretical analysis on it.
Representatives of the revisionist school, Porter and Linde (1995) and especially
Porter(199142
, 199543
), hold that the pressure of environmental regulation is just like
the pressure of market competition, encouraging innovation in clean production or
clean products. Such innovation may partly or fully offset the cost of regulation and
improve pollution control technology, so that FDI may produce environmentally
positive effects, winning obvious advantages in competition.
2.1.3.5 The Impact of Strategic Environmental Policy on FDI
The differences in environmental standards among different countries is derived from
the difference in the level of economic development, environmental resource
endowment, environmental preferences and demands, as well as cultural and
institutional differences. However, in recent research, some scholars have pointed out
that with the gradual elimination of traditional trade measures, environmental policy
42 Porter M.E., America’s Green Strategy. Scientific American, 1991 43 Porter M.E., Van Der Linde. Toward a New Conception of the Environment-competiveness Relationship.
Journal of Economics Prospect, 1995.
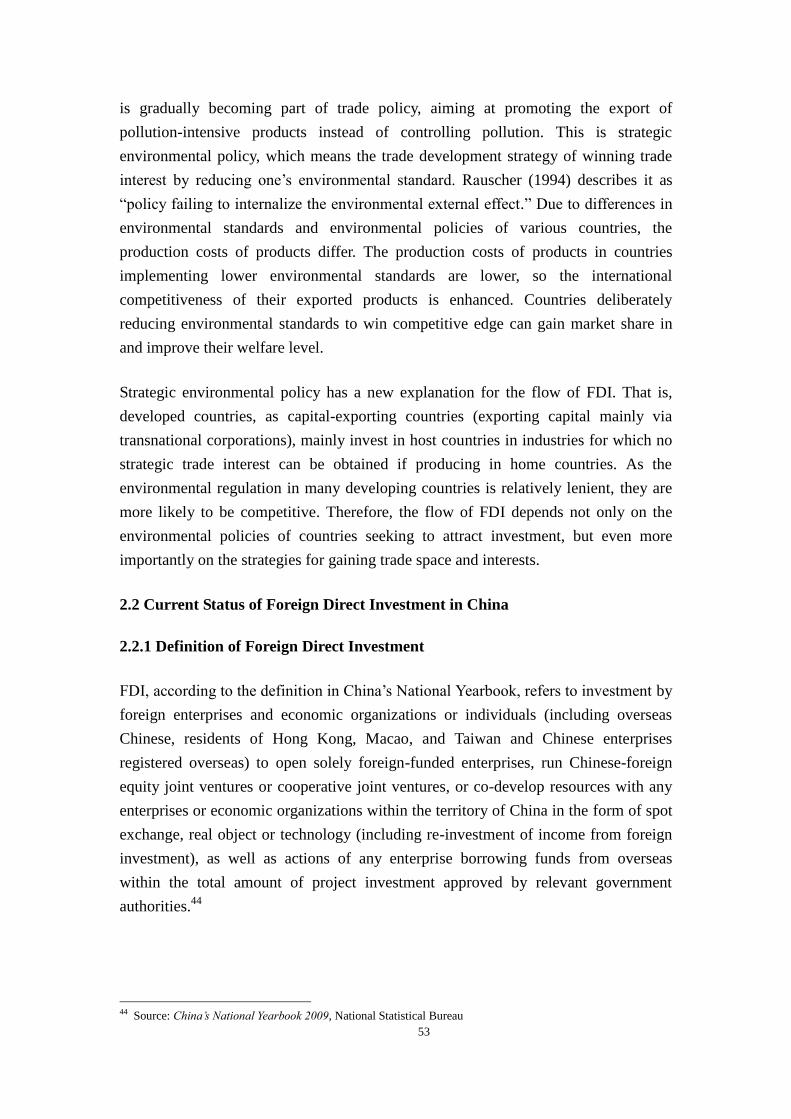
53
is gradually becoming part of trade policy, aiming at promoting the export of
pollution-intensive products instead of controlling pollution. This is strategic
environmental policy, which means the trade development strategy of winning trade
interest by reducing one’s environmental standard. Rauscher (1994) describes it as
“policy failing to internalize the environmental external effect.” Due to differences in
environmental standards and environmental policies of various countries, the
production costs of products differ. The production costs of products in countries
implementing lower environmental standards are lower, so the international
competitiveness of their exported products is enhanced. Countries deliberately
reducing environmental standards to win competitive edge can gain market share in
and improve their welfare level.
Strategic environmental policy has a new explanation for the flow of FDI. That is,
developed countries, as capital-exporting countries (exporting capital mainly via
transnational corporations), mainly invest in host countries in industries for which no
strategic trade interest can be obtained if producing in home countries. As the
environmental regulation in many developing countries is relatively lenient, they are
more likely to be competitive. Therefore, the flow of FDI depends not only on the
environmental policies of countries seeking to attract investment, but even more
importantly on the strategies for gaining trade space and interests.
2.2 Current Status of Foreign Direct Investment in China
2.2.1 Definition of Foreign Direct Investment
FDI, according to the definition in China’s National Yearbook, refers to investment by
foreign enterprises and economic organizations or individuals (including overseas
Chinese, residents of Hong Kong, Macao, and Taiwan and Chinese enterprises
registered overseas) to open solely foreign-funded enterprises, run Chinese-foreign
equity joint ventures or cooperative joint ventures, or co-develop resources with any
enterprises or economic organizations within the territory of China in the form of spot
exchange, real object or technology (including re-investment of income from foreign
investment), as well as actions of any enterprise borrowing funds from overseas
within the total amount of project investment approved by relevant government
authorities.44
44 Source: China’s National Yearbook 2009, National Statistical Bureau

54
2.2.2 Current Status of Foreign Direct Investment and its Main Characteristics
With the acceleration of economic globalization, international trade and foreign
investment based on transnational corporations continue to expand. China is one of
the most active host countries in receiving FDI. In 2010, China ranked the second in
the world and second among developing countries in terms of amount of foreign
investment absorbed. Currently, foreign investment in China has the following
prominent characteristics:
First, broad sources. Over 170 countries and regions worldwide have investment
enterprises in China. In terms of actual accumulated investment, half comes from
Hong Kong, Macao, and Taiwan, one quarter comes from developed countries such as
Europe, America, and Japan, and about one tenth comes from Southeastern Asian
countries and some free ports. In 2010, the actual foreign investment from Hong Kong,
Macao, and Taiwan amounted to USD 74.832 billion, accounting for 70.77% of the
total amount of absorbed foreign investment nationwide. Twenty-seven countries of
the EU newly established 1,688 enterprises in China in 2010, an increase of 6.97%
over the previous year; and the actual amount of foreign investment was USD 6.589
billion, an increase of 10.71% over the previous year. The United States established
1,576 new enterprises in China, a decrease of 0.76% from the previous year; but the
actual amount of foreign investment was USD 4.052 billion, an increase of 13.31%
over the previous year.
In 2010, the top ten countries/regions investing in China (according to the actual
amount of foreign investment) were: Hong Kong (USD 67.474 billion); Taiwan (USD
6.701 billion); Singapore (USD 5.657 billion); Japan (USD 4.242 billion); the United
States (USD 4.052 billion); South Korea (USD 2.693 billion); the United Kingdom
(USD 1.642 billion); France (USD 1.239 billion); Holland (USD 952 million); and
Germany (USD 933 million). These top ten countries/regions accounted for 90.1% of
the actual foreign investment in China in 2010.
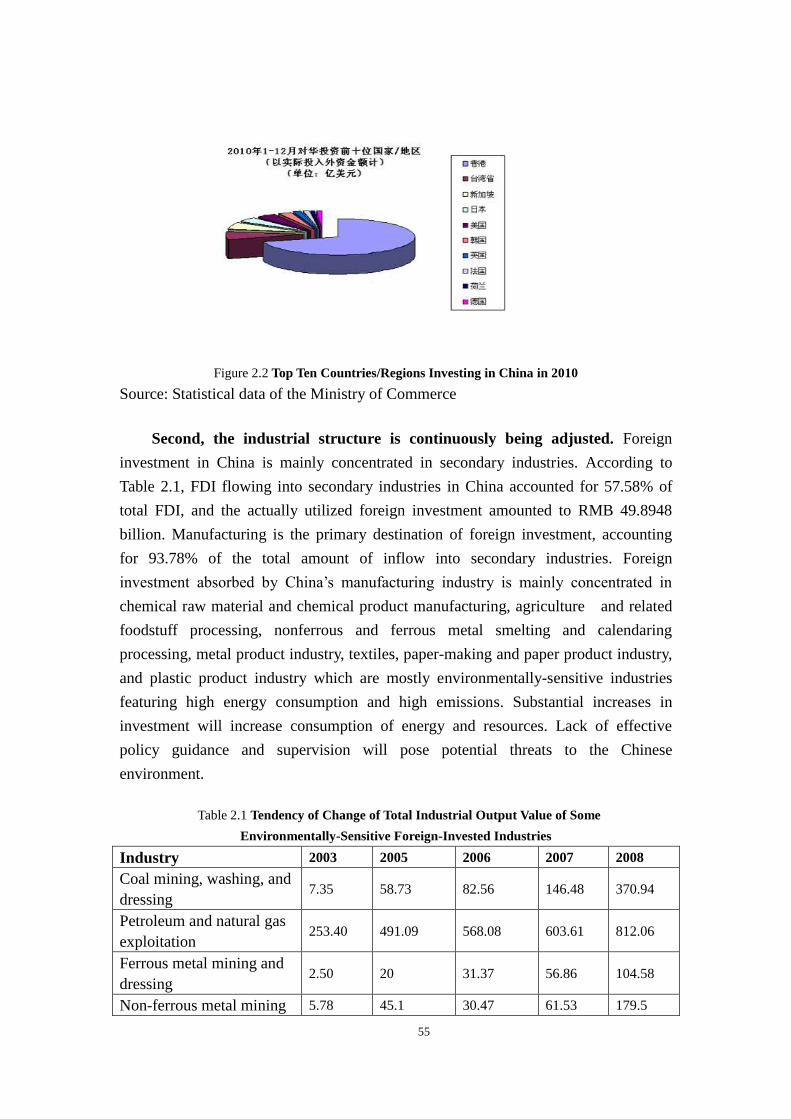
55
Figure 2.2 Top Ten Countries/Regions Investing in China in 2010
Source: Statistical data of the Ministry of Commerce
Second, the industrial structure is continuously being adjusted. Foreign
investment in China is mainly concentrated in secondary industries. According to
Table 2.1, FDI flowing into secondary industries in China accounted for 57.58% of
total FDI, and the actually utilized foreign investment amounted to RMB 49.8948
billion. Manufacturing is the primary destination of foreign investment, accounting
for 93.78% of the total amount of inflow into secondary industries. Foreign
investment absorbed by China’s manufacturing industry is mainly concentrated in
chemical raw material and chemical product manufacturing, agriculture and related
foodstuff processing, nonferrous and ferrous metal smelting and calendaring
processing, metal product industry, textiles, paper-making and paper product industry,
and plastic product industry which are mostly environmentally-sensitive industries
featuring high energy consumption and high emissions. Substantial increases in
investment will increase consumption of energy and resources. Lack of effective
policy guidance and supervision will pose potential threats to the Chinese
environment.
Table 2.1 Tendency of Change of Total Industrial Output Value of Some
Environmentally-Sensitive Foreign-Invested Industries
Industry 2003 2005 2006 2007 2008
Coal mining, washing, and
dressing 7.35 58.73 82.56 146.48 370.94
Petroleum and natural gas
exploitation 253.40 491.09 568.08 603.61 812.06
Ferrous metal mining and
dressing 2.50 20 31.37 56.86 104.58
Non-ferrous metal mining 5.78 45.1 30.47 61.53 179.5
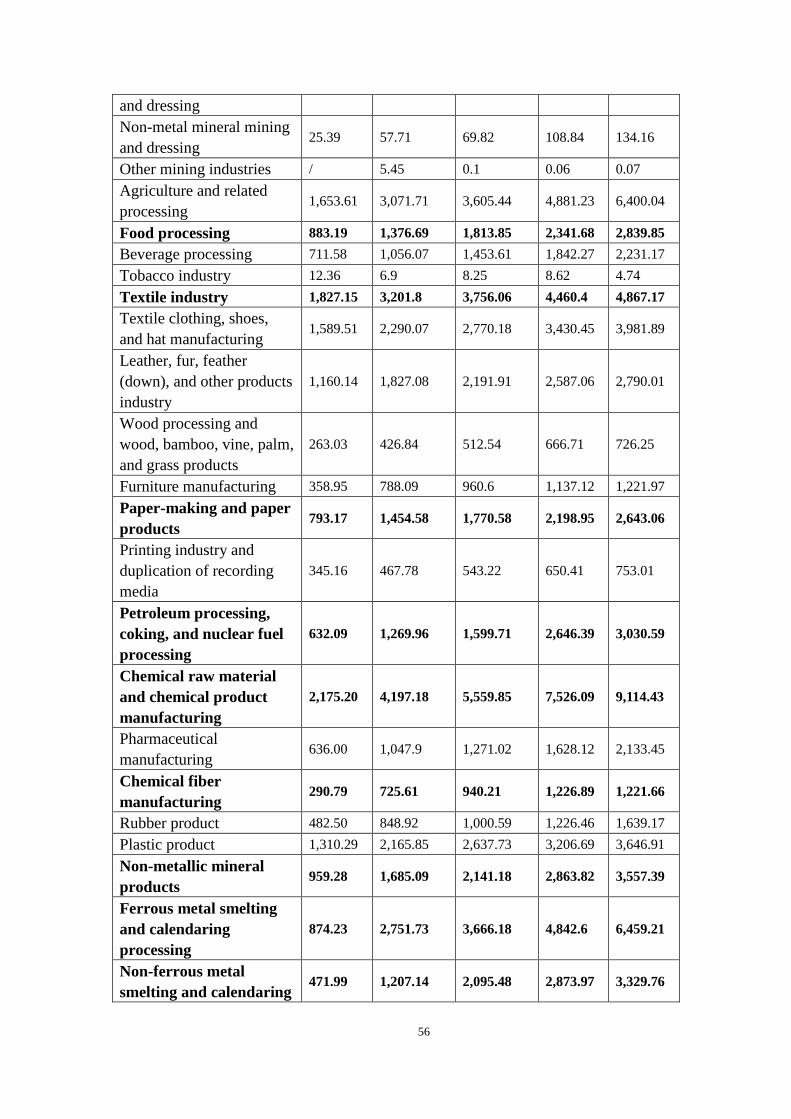
56
and dressing
Non-metal mineral mining
and dressing 25.39 57.71 69.82 108.84 134.16
Other mining industries / 5.45 0.1 0.06 0.07
Agriculture and related
processing 1,653.61 3,071.71 3,605.44 4,881.23 6,400.04
Food processing 883.19 1,376.69 1,813.85 2,341.68 2,839.85
Beverage processing 711.58 1,056.07 1,453.61 1,842.27 2,231.17
Tobacco industry 12.36 6.9 8.25 8.62 4.74
Textile industry 1,827.15 3,201.8 3,756.06 4,460.4 4,867.17
Textile clothing, shoes,
and hat manufacturing 1,589.51 2,290.07 2,770.18 3,430.45 3,981.89
Leather, fur, feather
(down), and other products
industry
1,160.14 1,827.08 2,191.91 2,587.06 2,790.01
Wood processing and
wood, bamboo, vine, palm,
and grass products
263.03 426.84 512.54 666.71 726.25
Furniture manufacturing 358.95 788.09 960.6 1,137.12 1,221.97
Paper-making and paper
products 793.17 1,454.58 1,770.58 2,198.95 2,643.06
Printing industry and
duplication of recording
media
345.16 467.78 543.22 650.41 753.01
Petroleum processing,
coking, and nuclear fuel
processing
632.09 1,269.96 1,599.71 2,646.39 3,030.59
Chemical raw material
and chemical product
manufacturing
2,175.20 4,197.18 5,559.85 7,526.09 9,114.43
Pharmaceutical
manufacturing 636.00 1,047.9 1,271.02 1,628.12 2,133.45
Chemical fiber
manufacturing 290.79 725.61 940.21 1,226.89 1,221.66
Rubber product 482.50 848.92 1,000.59 1,226.46 1,639.17
Plastic product 1,310.29 2,165.85 2,637.73 3,206.69 3,646.91
Non-metallic mineral
products 959.28 1,685.09 2,141.18 2,863.82 3,557.39
Ferrous metal smelting
and calendaring
processing
874.23 2,751.73 3,666.18 4,842.6 6,459.21
Non-ferrous metal
smelting and calendaring 471.99 1,207.14 2,095.48 2,873.97 3,329.76
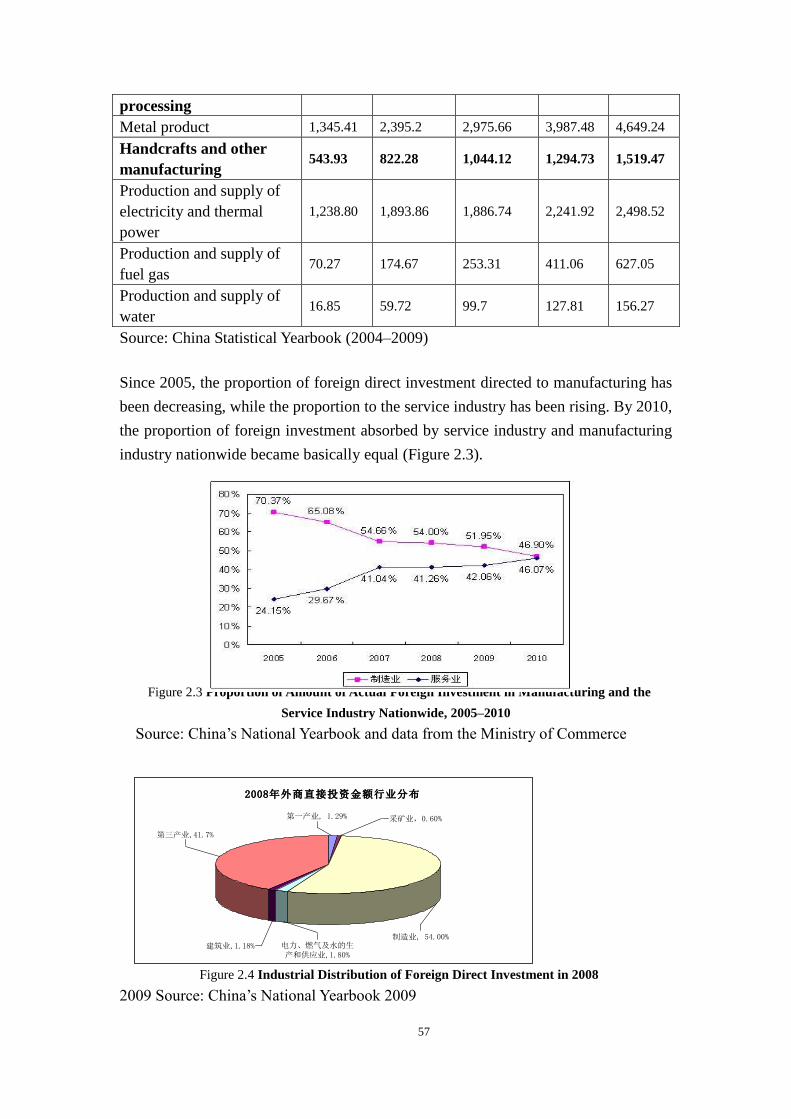
57
processing
Metal product 1,345.41 2,395.2 2,975.66 3,987.48 4,649.24
Handcrafts and other
manufacturing 543.93 822.28 1,044.12 1,294.73 1,519.47
Production and supply of
electricity and thermal
power
1,238.80 1,893.86 1,886.74 2,241.92 2,498.52
Production and supply of
fuel gas 70.27 174.67 253.31 411.06 627.05
Production and supply of
water 16.85 59.72 99.7 127.81 156.27
Source: China Statistical Yearbook (2004–2009)
Since 2005, the proportion of foreign direct investment directed to manufacturing has
been decreasing, while the proportion to the service industry has been rising. By 2010,
the proportion of foreign investment absorbed by service industry and manufacturing
industry nationwide became basically equal (Figure 2.3).
Figure 2.3 Proportion of Amount of Actual Foreign Investment in Manufacturing and the
Service Industry Nationwide, 2005–2010
Source: China’s National Yearbook and data from the Ministry of Commerce
Figure 2.4 Industrial Distribution of Foreign Direct Investment in 2008
2009 Source: China’s National Yearbook 2009
2008年外商直接投资金额行业分布
第一产业, 1.29%
制造业, 54.00%
采矿业,0.60%
电力、燃气及水的生产和供应业,1.80%
建筑业,1.18%
第三产业,41.7%
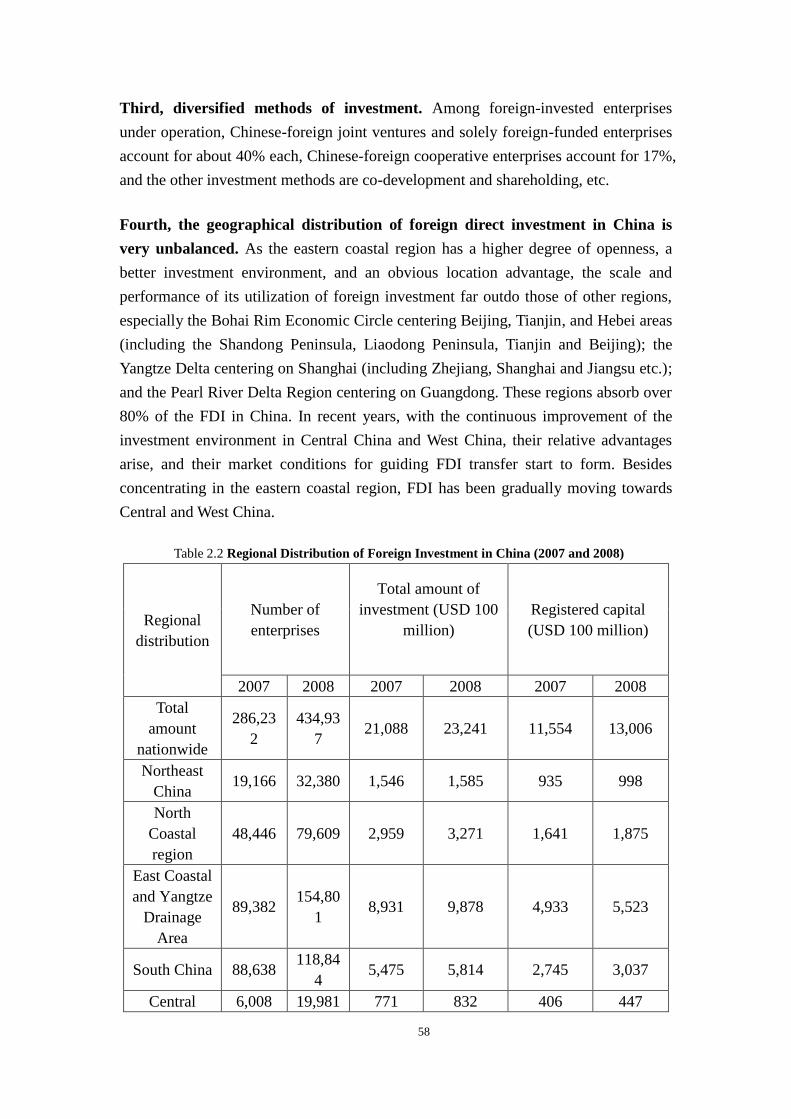
58
Third, diversified methods of investment. Among foreign-invested enterprises
under operation, Chinese-foreign joint ventures and solely foreign-funded enterprises
account for about 40% each, Chinese-foreign cooperative enterprises account for 17%,
and the other investment methods are co-development and shareholding, etc.
Fourth, the geographical distribution of foreign direct investment in China is
very unbalanced. As the eastern coastal region has a higher degree of openness, a
better investment environment, and an obvious location advantage, the scale and
performance of its utilization of foreign investment far outdo those of other regions,
especially the Bohai Rim Economic Circle centering Beijing, Tianjin, and Hebei areas
(including the Shandong Peninsula, Liaodong Peninsula, Tianjin and Beijing); the
Yangtze Delta centering on Shanghai (including Zhejiang, Shanghai and Jiangsu etc.);
and the Pearl River Delta Region centering on Guangdong. These regions absorb over
80% of the FDI in China. In recent years, with the continuous improvement of the
investment environment in Central China and West China, their relative advantages
arise, and their market conditions for guiding FDI transfer start to form. Besides
concentrating in the eastern coastal region, FDI has been gradually moving towards
Central and West China.
Table 2.2 Regional Distribution of Foreign Investment in China (2007 and 2008)
Regional
distribution
Number of
enterprises
Total amount of
investment (USD 100
million)
Registered capital
(USD 100 million)
2007 2008 2007 2008 2007 2008
Total
amount
nationwide
286,23
2
434,93
7 21,088 23,241 11,554 13,006
Northeast
China 19,166 32,380 1,546 1,585 935 998
North
Coastal
region
48,446 79,609 2,959 3,271 1,641 1,875
East Coastal
and Yangtze
Drainage
Area
89,382 154,80
1 8,931 9,878 4,933 5,523
South China 88,638 118,84
4 5,475 5,814 2,745 3,037
Central 6,008 19,981 771 832 406 447
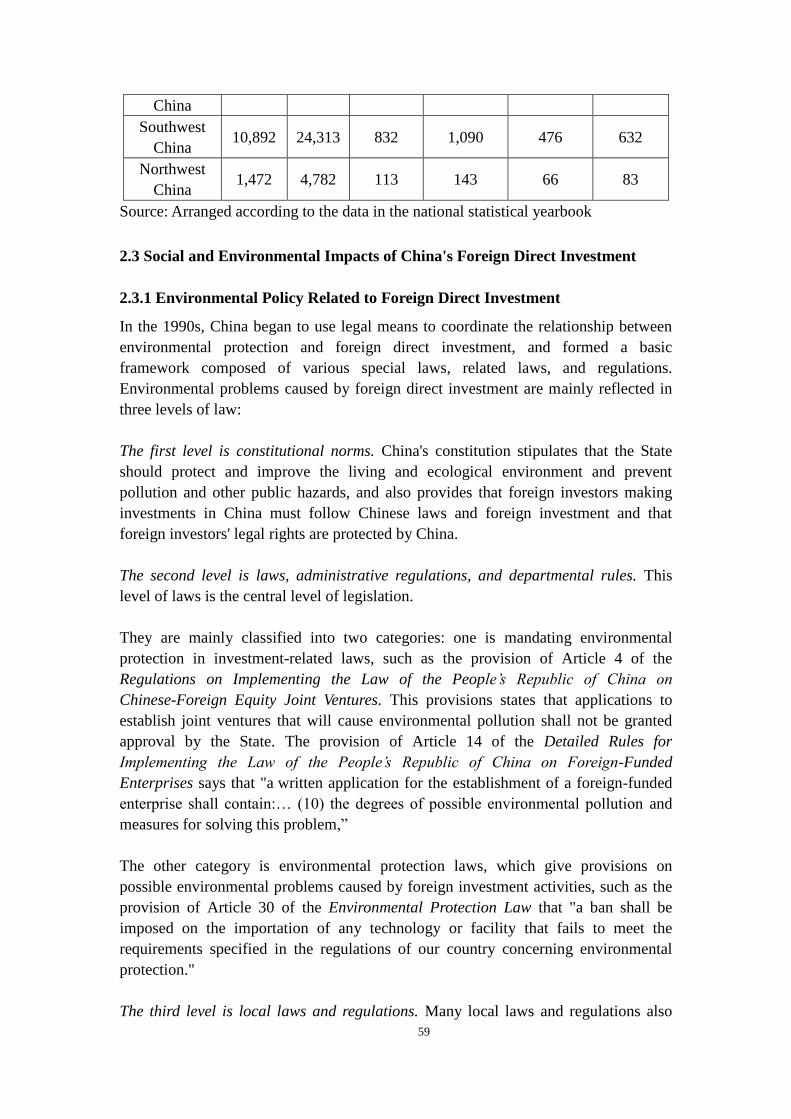
59
China
Southwest
China 10,892 24,313 832 1,090 476 632
Northwest
China 1,472 4,782 113 143 66 83
Source: Arranged according to the data in the national statistical yearbook
2.3 Social and Environmental Impacts of China's Foreign Direct Investment
2.3.1 Environmental Policy Related to Foreign Direct Investment
In the 1990s, China began to use legal means to coordinate the relationship between
environmental protection and foreign direct investment, and formed a basic
framework composed of various special laws, related laws, and regulations.
Environmental problems caused by foreign direct investment are mainly reflected in
three levels of law:
The first level is constitutional norms. China's constitution stipulates that the State
should protect and improve the living and ecological environment and prevent
pollution and other public hazards, and also provides that foreign investors making
investments in China must follow Chinese laws and foreign investment and that
foreign investors' legal rights are protected by China.
The second level is laws, administrative regulations, and departmental rules. This
level of laws is the central level of legislation.
They are mainly classified into two categories: one is mandating environmental
protection in investment-related laws, such as the provision of Article 4 of the
Regulations on Implementing the Law of the People’s Republic of China on
Chinese-Foreign Equity Joint Ventures. This provisions states that applications to
establish joint ventures that will cause environmental pollution shall not be granted
approval by the State. The provision of Article 14 of the Detailed Rules for
Implementing the Law of the People’s Republic of China on Foreign-Funded
Enterprises says that "a written application for the establishment of a foreign-funded
enterprise shall contain:… (10) the degrees of possible environmental pollution and
measures for solving this problem,”
The other category is environmental protection laws, which give provisions on
possible environmental problems caused by foreign investment activities, such as the
provision of Article 30 of the Environmental Protection Law that "a ban shall be
imposed on the importation of any technology or facility that fails to meet the
requirements specified in the regulations of our country concerning environmental
protection."
The third level is local laws and regulations. Many local laws and regulations also

60
address the coordination of environmental protection and local investment. For
example, Regulations of Shanghai Municipality of Environmental Problem,
Regulation of Sichuan Province on Encouraging Foreign Investment, Regulations on
the Import of Technology to the Xiamen Special Economic Zone, etc., in which
specific pronouncements are made about environmental protection and investment,
and foreign investors investing should comply with the provisions of local laws and
regulations.
Table 2.3 China’s Environment-related Investment Laws
Name of laws and
regulations Departments and dates Related content
Detailed Rules for
Implementing the
Law of the People’s
Republic of China
on
Chinese-Foreign
Cooperative Joint
Ventures
Approved by the State
Council on August 7,
1995, and promulgated
by Decree [1995] No. 6
of the Ministry of
Foreign Trade and
Economic Cooperation
on September 4, 1995
Article 9. Applications on the
establishment of joint ventures
will not be approved under any
one of the following
circumstances: … (3) The
proposed joint venture would
cause pollution to the environment
Detailed Rules for
Implementing the
Law of the People’s
Republic of China
on
Chinese-Foreign
Equity Joint
Ventures
Amended and
promulgated by Decree
[2001] No. 311 of the
State Council on July 22,
2001
Article 5. Applicants to establish
joint ventures shall not be granted
approval if the project involves
any of the following
conditions: ...... (4) Causing
environmental pollution
Detailed Rules for
Implementing the
Law of the People’s
Republic of China
on Foreign-Funded
Enterprises
Amended and
promulgated by Decree
[2001] No. 301 of the
State Council on April
12, 2001
Article 3. A foreign-funded
enterprise to be established must
benefit the development of China’s
national economy and be capable
of gaining remarkable economic
results. The state encourages
foreign-funded enterprises to use
advanced technology and
equipment, engage in the
development of new products,
realize the upgrading of products
and the replacement of old
products with new ones,
economize energy and raw
materials, and it is also encouraged
to establish foreign-funded
enterprises that are
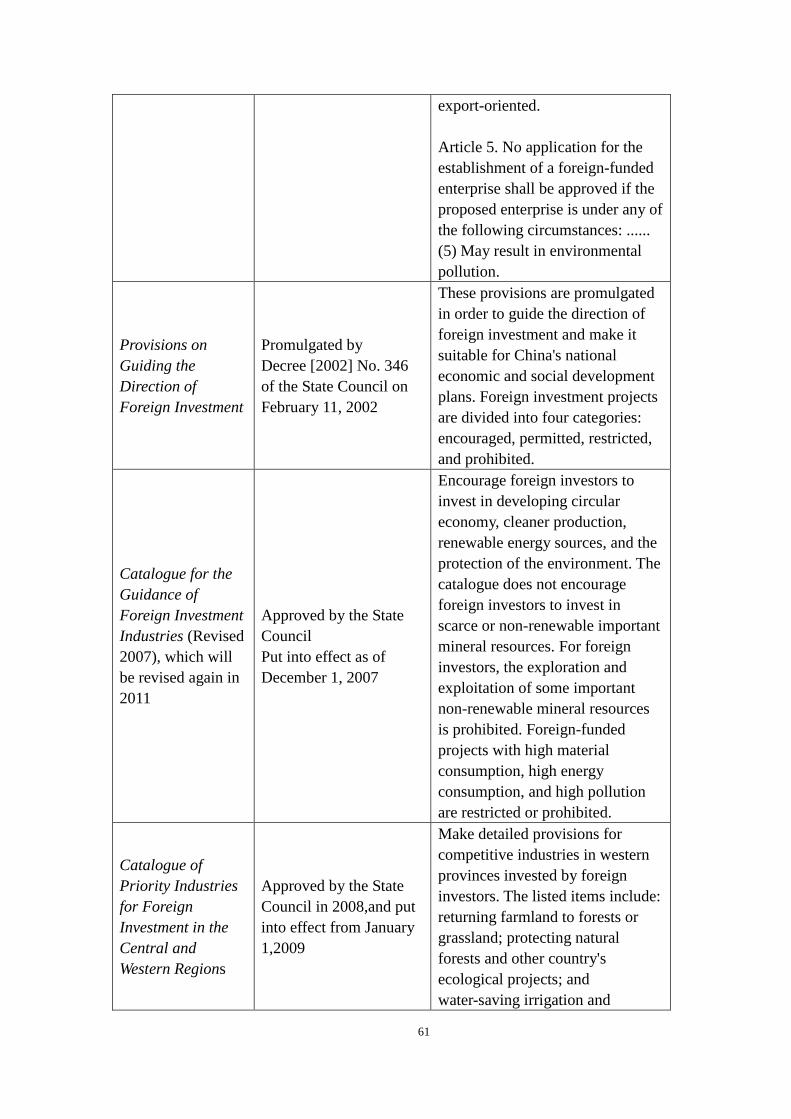
61
export-oriented.
Article 5. No application for the
establishment of a foreign-funded
enterprise shall be approved if the
proposed enterprise is under any of
the following circumstances: ......
(5) May result in environmental
pollution.
Provisions on
Guiding the
Direction of
Foreign Investment
Promulgated by
Decree [2002] No. 346
of the State Council on
February 11, 2002
These provisions are promulgated
in order to guide the direction of
foreign investment and make it
suitable for China's national
economic and social development
plans. Foreign investment projects
are divided into four categories:
encouraged, permitted, restricted,
and prohibited.
Catalogue for the
Guidance of
Foreign Investment
Industries (Revised
2007), which will
be revised again in
2011
Approved by the State
Council
Put into effect as of
December 1, 2007
Encourage foreign investors to
invest in developing circular
economy, cleaner production,
renewable energy sources, and the
protection of the environment. The
catalogue does not encourage
foreign investors to invest in
scarce or non-renewable important
mineral resources. For foreign
investors, the exploration and
exploitation of some important
non-renewable mineral resources
is prohibited. Foreign-funded
projects with high material
consumption, high energy
consumption, and high pollution
are restricted or prohibited.
Catalogue of
Priority Industries
for Foreign
Investment in the
Central and
Western Regions
Approved by the State
Council in 2008,and put
into effect from January
1,2009
Make detailed provisions for
competitive industries in western
provinces invested by foreign
investors. The listed items include:
returning farmland to forests or
grassland; protecting natural
forests and other country's
ecological projects; and
water-saving irrigation and
62
water-saving technology for dry
farming, development and
application of conservation tillage
technology, mining, ecosystem
restoration, reconstruction
projects, and other fields for
promoting environmental
protection and construction.
2.3.2 Development Stages and Environmental Impacts of Foreign Investment
Since China began to open up, foreign-invested enterprises as the main form of using
foreign direct investment, have gone from non-existence to a position of great size
and strength. The increse of foreign-funded enterprises in China, on the one hand, has
made an indelible contribution to China's economic development and has created
many jobs; on the other hand, it has also produced negative effects, such as market
segmentation and pollution transfer, and foreign investment has different
environmental and social impacts at different stages of development. Depending on
the period, China's FDI absorption policy and the development of foreign investors,
the development of foreign investment can be divided into four stages:
The first stage is initial stage (1979–1985). In 1979, the second session of the Fifth
National People's Congress passed and promulgated China's first FDI law – The Law
of the People’s Republic of China on Chinese-foreign Equity Joint Ventures marking
the legalization of foreign investment. Early in the days of reform and opening up, as
many of China’s FDI policies were not completely clear, foreign investment in China
was basically exploratory. At this stage, due to the backwardness of China's
infrastructure, foreign investment was mainly concentrated on China's four special
economic zones (Shenzhen, Zhuhai, Shantou, and Xiamen). Nationwide investment
from foreign countries had not expanded fully and the total investment was on a small
scale, and thus the impacts on the environment were less significant.
The second stage is the rapid development stage (1986–1994). Since the late 1980s,
foreign investment expanded from the coastal regions to include all regions and all
industries. In October 1986, the State Council formulated and promulgated the
Provisions on the Encouragement of Foreign Investment to give preferential treatment
to export-oriented foreign-invested enterprises and foreign-invested advanced
technology enterprises. Since then, foreign investment began to flow into China and a
large amount of FDI was directed to manufacturing, the chemical industry, and other
pollution-intensive sectors, and because the government did not restrict the investment
structure, it led to the transfer of pollution-intensive industries to China, which had an
impact on China’s environment.
The third stage is the adjustment and improvement stage (1995–2005). In order to
put foreign investment in line with China's industrial policies, FDI policy started to be
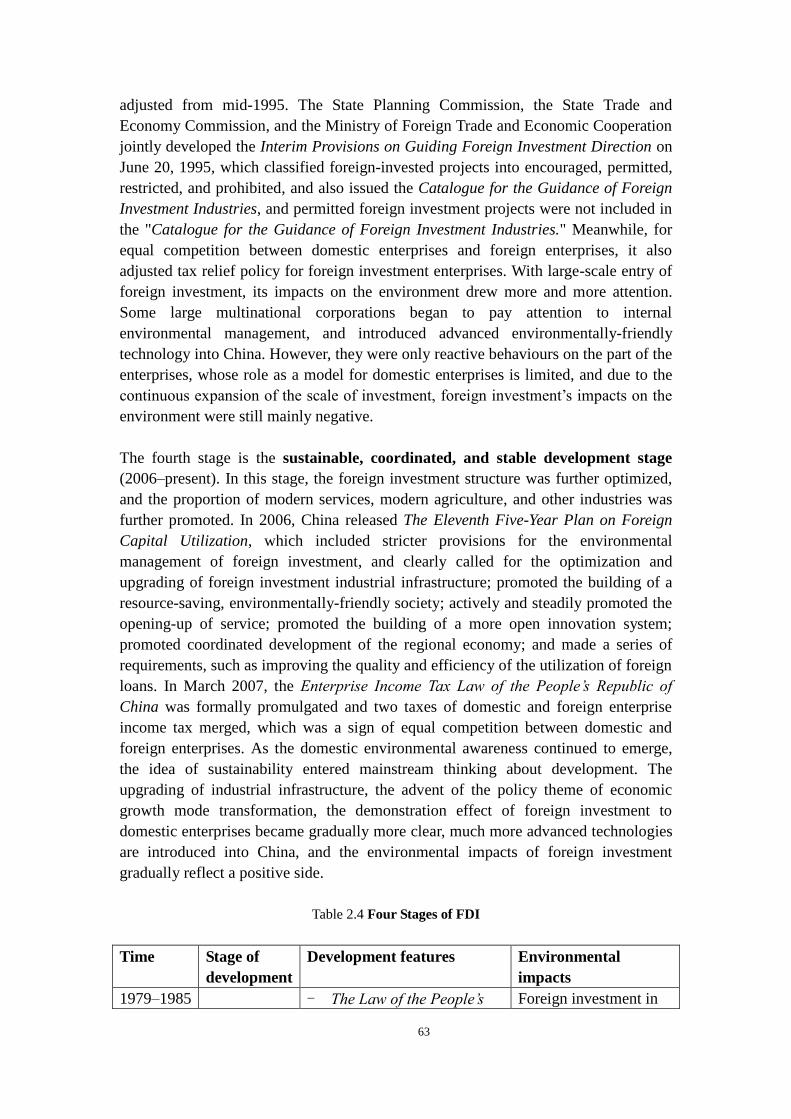
63
adjusted from mid-1995. The State Planning Commission, the State Trade and
Economy Commission, and the Ministry of Foreign Trade and Economic Cooperation
jointly developed the Interim Provisions on Guiding Foreign Investment Direction on
June 20, 1995, which classified foreign-invested projects into encouraged, permitted,
restricted, and prohibited, and also issued the Catalogue for the Guidance of Foreign
Investment Industries, and permitted foreign investment projects were not included in
the "Catalogue for the Guidance of Foreign Investment Industries." Meanwhile, for
equal competition between domestic enterprises and foreign enterprises, it also
adjusted tax relief policy for foreign investment enterprises. With large-scale entry of
foreign investment, its impacts on the environment drew more and more attention.
Some large multinational corporations began to pay attention to internal
environmental management, and introduced advanced environmentally-friendly
technology into China. However, they were only reactive behaviours on the part of the
enterprises, whose role as a model for domestic enterprises is limited, and due to the
continuous expansion of the scale of investment, foreign investment’s impacts on the
environment were still mainly negative.
The fourth stage is the sustainable, coordinated, and stable development stage
(2006–present). In this stage, the foreign investment structure was further optimized,
and the proportion of modern services, modern agriculture, and other industries was
further promoted. In 2006, China released The Eleventh Five-Year Plan on Foreign
Capital Utilization, which included stricter provisions for the environmental
management of foreign investment, and clearly called for the optimization and
upgrading of foreign investment industrial infrastructure; promoted the building of a
resource-saving, environmentally-friendly society; actively and steadily promoted the
opening-up of service; promoted the building of a more open innovation system;
promoted coordinated development of the regional economy; and made a series of
requirements, such as improving the quality and efficiency of the utilization of foreign
loans. In March 2007, the Enterprise Income Tax Law of the People’s Republic of
China was formally promulgated and two taxes of domestic and foreign enterprise
income tax merged, which was a sign of equal competition between domestic and
foreign enterprises. As the domestic environmental awareness continued to emerge,
the idea of sustainability entered mainstream thinking about development. The
upgrading of industrial infrastructure, the advent of the policy theme of economic
growth mode transformation, the demonstration effect of foreign investment to
domestic enterprises became gradually more clear, much more advanced technologies
are introduced into China, and the environmental impacts of foreign investment
gradually reflect a positive side.
Table 2.4 Four Stages of FDI
Time Stage of
development
Development features Environmental
impacts
1979–1985 - The Law of the People’s Foreign investment in
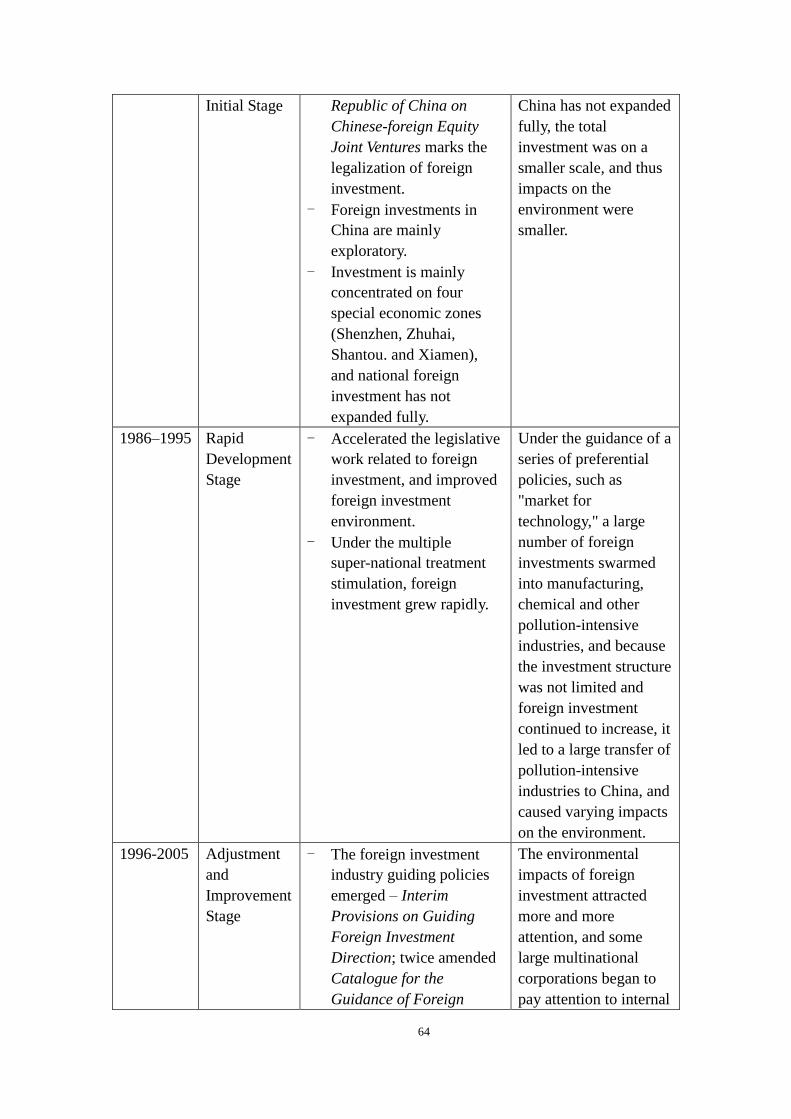
64
Initial Stage Republic of China on
Chinese-foreign Equity
Joint Ventures marks the
legalization of foreign
investment.
- Foreign investments in
China are mainly
exploratory.
- Investment is mainly
concentrated on four
special economic zones
(Shenzhen, Zhuhai,
Shantou. and Xiamen),
and national foreign
investment has not
expanded fully.
China has not expanded
fully, the total
investment was on a
smaller scale, and thus
impacts on the
environment were
smaller.
1986–1995 Rapid
Development
Stage
- Accelerated the legislative
work related to foreign
investment, and improved
foreign investment
environment.
- Under the multiple
super-national treatment
stimulation, foreign
investment grew rapidly.
Under the guidance of a
series of preferential
policies, such as
"market for
technology," a large
number of foreign
investments swarmed
into manufacturing,
chemical and other
pollution-intensive
industries, and because
the investment structure
was not limited and
foreign investment
continued to increase, it
led to a large transfer of
pollution-intensive
industries to China, and
caused varying impacts
on the environment.
1996-2005 Adjustment
and
Improvement
Stage
- The foreign investment
industry guiding policies
emerged – Interim
Provisions on Guiding
Foreign Investment
Direction; twice amended
Catalogue for the
Guidance of Foreign
The environmental
impacts of foreign
investment attracted
more and more
attention, and some
large multinational
corporations began to
pay attention to internal
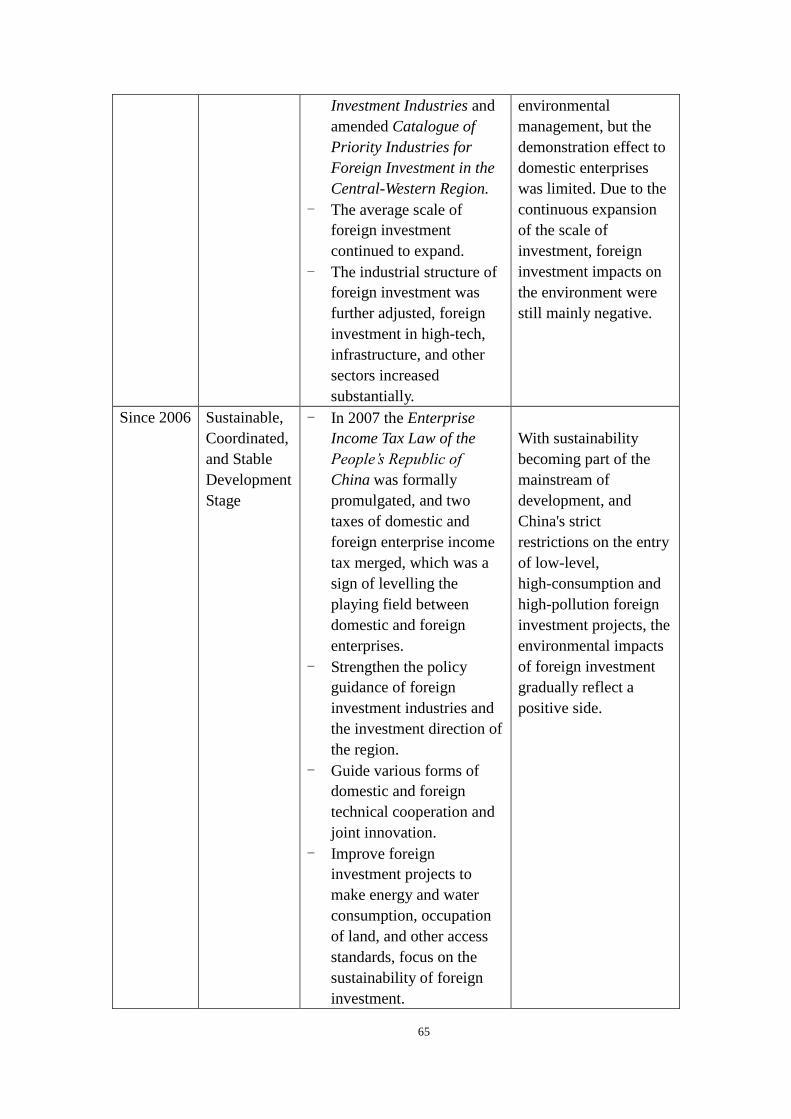
65
Investment Industries and
amended Catalogue of
Priority Industries for
Foreign Investment in the
Central-Western Region.
- The average scale of
foreign investment
continued to expand.
- The industrial structure of
foreign investment was
further adjusted, foreign
investment in high-tech,
infrastructure, and other
sectors increased
substantially.
environmental
management, but the
demonstration effect to
domestic enterprises
was limited. Due to the
continuous expansion
of the scale of
investment, foreign
investment impacts on
the environment were
still mainly negative.
Since 2006 Sustainable,
Coordinated,
and Stable
Development
Stage
- In 2007 the Enterprise
Income Tax Law of the
People’s Republic of
China was formally
promulgated, and two
taxes of domestic and
foreign enterprise income
tax merged, which was a
sign of levelling the
playing field between
domestic and foreign
enterprises.
- Strengthen the policy
guidance of foreign
investment industries and
the investment direction of
the region.
- Guide various forms of
domestic and foreign
technical cooperation and
joint innovation.
- Improve foreign
investment projects to
make energy and water
consumption, occupation
of land, and other access
standards, focus on the
sustainability of foreign
investment.
With sustainability
becoming part of the
mainstream of
development, and
China's strict
restrictions on the entry
of low-level,
high-consumption and
high-pollution foreign
investment projects, the
environmental impacts
of foreign investment
gradually reflect a
positive side.
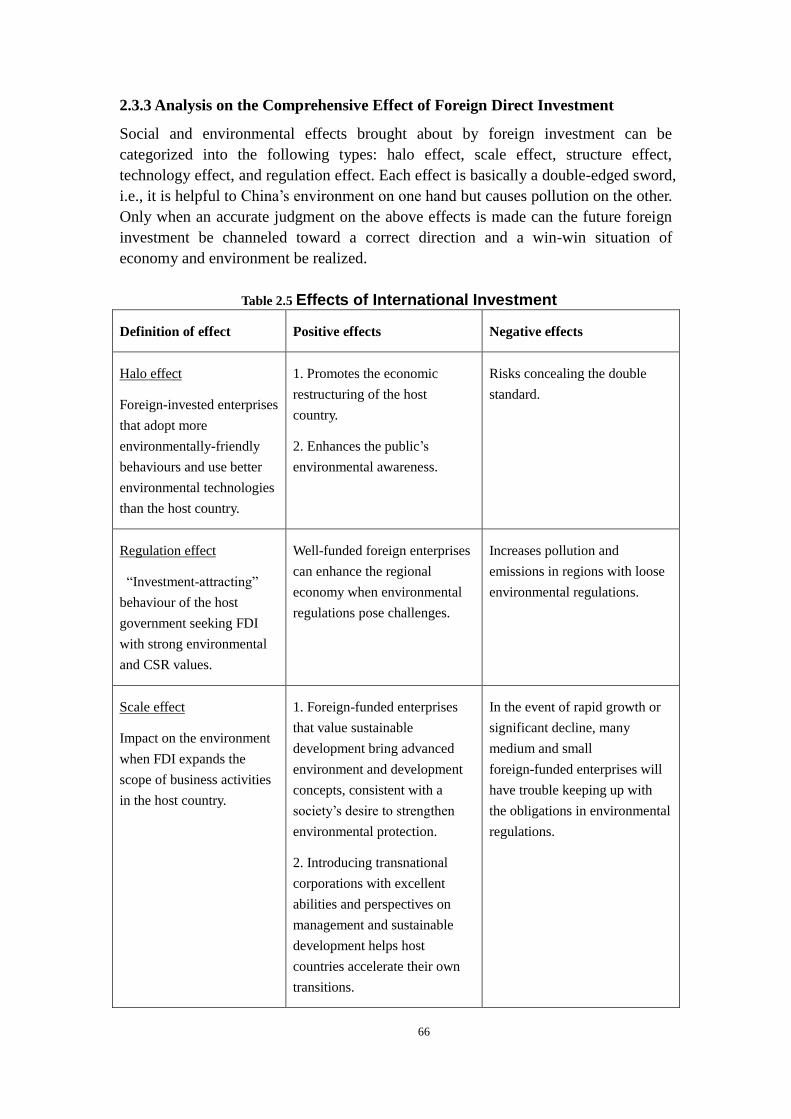
66
2.3.3 Analysis on the Comprehensive Effect of Foreign Direct Investment
Social and environmental effects brought about by foreign investment can be
categorized into the following types: halo effect, scale effect, structure effect,
technology effect, and regulation effect. Each effect is basically a double-edged sword,
i.e., it is helpful to China’s environment on one hand but causes pollution on the other.
Only when an accurate judgment on the above effects is made can the future foreign
investment be channeled toward a correct direction and a win-win situation of
economy and environment be realized.
Table 2.5 Effects of International Investment
Definition of effect Positive effects Negative effects
Halo effect
Foreign-invested enterprises
that adopt more
environmentally-friendly
behaviours and use better
environmental technologies
than the host country.
1. Promotes the economic
restructuring of the host
country.
2. Enhances the public’s
environmental awareness.
Risks concealing the double
standard.
Regulation effect
“Investment-attracting”
behaviour of the host
government seeking FDI
with strong environmental
and CSR values.
Well-funded foreign enterprises
can enhance the regional
economy when environmental
regulations pose challenges.
Increases pollution and
emissions in regions with loose
environmental regulations.
Scale effect
Impact on the environment
when FDI expands the
scope of business activities
in the host country.
1. Foreign-funded enterprises
that value sustainable
development bring advanced
environment and development
concepts, consistent with a
society’s desire to strengthen
environmental protection.
2. Introducing transnational
corporations with excellent
abilities and perspectives on
management and sustainable
development helps host
countries accelerate their own
transitions.
In the event of rapid growth or
significant decline, many
medium and small
foreign-funded enterprises will
have trouble keeping up with
the obligations in environmental
regulations.
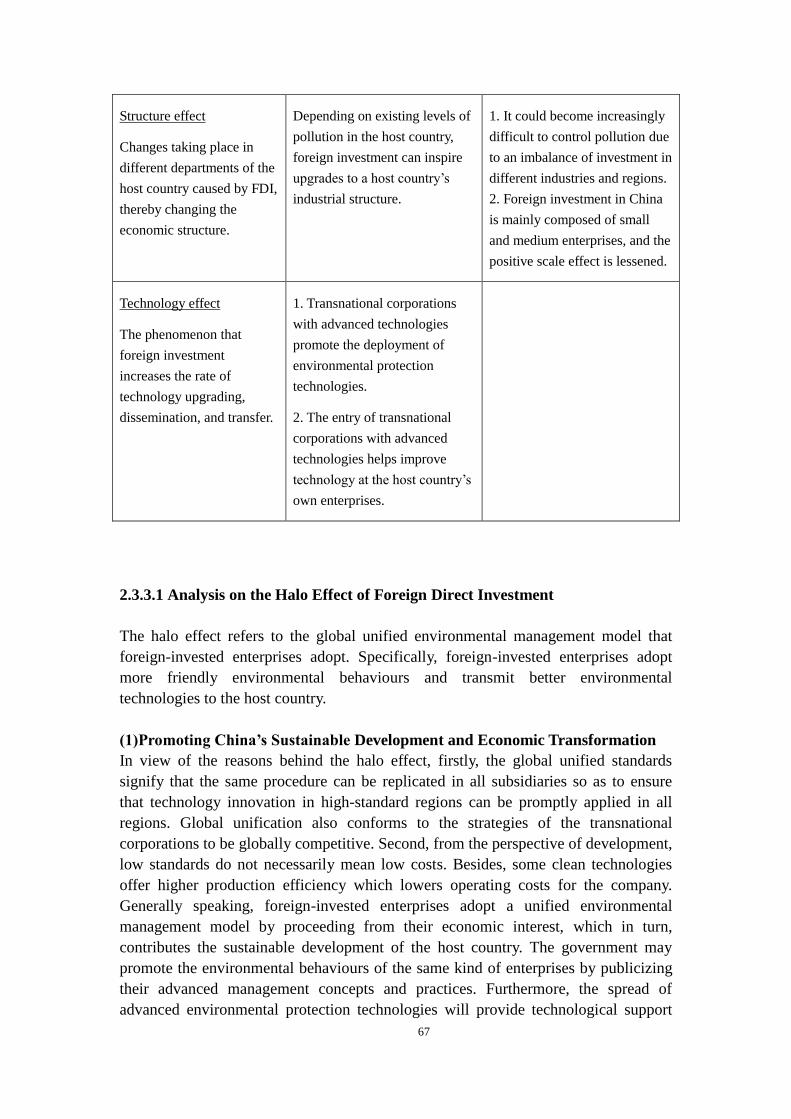
67
Structure effect
Changes taking place in
different departments of the
host country caused by FDI,
thereby changing the
economic structure.
Depending on existing levels of
pollution in the host country,
foreign investment can inspire
upgrades to a host country’s
industrial structure.
1. It could become increasingly
difficult to control pollution due
to an imbalance of investment in
different industries and regions.
2. Foreign investment in China
is mainly composed of small
and medium enterprises, and the
positive scale effect is lessened.
Technology effect
The phenomenon that
foreign investment
increases the rate of
technology upgrading,
dissemination, and transfer.
1. Transnational corporations
with advanced technologies
promote the deployment of
environmental protection
technologies.
2. The entry of transnational
corporations with advanced
technologies helps improve
technology at the host country’s
own enterprises.
2.3.3.1 Analysis on the Halo Effect of Foreign Direct Investment
The halo effect refers to the global unified environmental management model that
foreign-invested enterprises adopt. Specifically, foreign-invested enterprises adopt
more friendly environmental behaviours and transmit better environmental
technologies to the host country.
(1)Promoting China’s Sustainable Development and Economic Transformation
In view of the reasons behind the halo effect, firstly, the global unified standards
signify that the same procedure can be replicated in all subsidiaries so as to ensure
that technology innovation in high-standard regions can be promptly applied in all
regions. Global unification also conforms to the strategies of the transnational
corporations to be globally competitive. Second, from the perspective of development,
low standards do not necessarily mean low costs. Besides, some clean technologies
offer higher production efficiency which lowers operating costs for the company.
Generally speaking, foreign-invested enterprises adopt a unified environmental
management model by proceeding from their economic interest, which in turn,
contributes the sustainable development of the host country. The government may
promote the environmental behaviours of the same kind of enterprises by publicizing
their advanced management concepts and practices. Furthermore, the spread of
advanced environmental protection technologies will provide technological support
68
for China’s economic transformation.
Specifically, the role of FDI in promoting China’s sustainable development and
economic transformation is mainly reflected in the following thoughts:
i) The technology “spillover effect” brought about by FDI will be the driving force for
Chinese enterprises to be more engaged in the research and development of advanced
technology and environmentally-friendly technology. Some transnational corporations
with a high awareness of corporate environmental responsibility also serve as a model
for local enterprises.
ii) FDI is beneficial to the accumulation of China’s human resources which will
provide infinite momentum for sustainable development. Human resources have
become the most important resources in present-day society and also the most
competitive resources. Of the foreign-invested enterprises, quite a number of them are
focused on human resource management and capcity building. And the majority of
transnational corporations will build a talent-training mechanism for training local
employees in the host county. The more advanced technology the company is engaged
in, the more funds will be required for training people. Local workers who are
familiar with international practice and who are specialized in technologies can
become the leaders of China’s economic sustainable development.
iii) Attracting high-quality and high-tech foreign-funded enterprises will promote
industrial restructuring and the green transformation of China’s economy. The
invisible technology transfer of multinational enterprises and the forced technology
innovation of local companies will together boost China’s industrial structure and
promote the sustainable development in China.
(2) Promoting Corporate Social Responsibility and Environmental Awareness
Through the halo effect, foreign-invested enterprises can create good social reputation
and avoid pressure from special interest groups. In addition, because of the need to
enhance the additional value of the product, the company will appropriately publicize
its good environmental performance, which will, to some extent, improve the public’s
environmental awareness. The public will have knowledge of this corporate
environmental target. More importantly, through comparison with other national or
small and medium-sized enterprises of the same kind, the relevant enterprises will be
faced with double pressure: one relating to corporate reputation; the other is of the
corporate performance. If there exists no significant difference in the quality or the
price for the same kind of product, the public is bound to choose the products from
companies that pay more attention to environmental protection. This would
effectively promote good environmental behaviour in the company and, indeed,
throughout an industry.
69
In the context of economic globalization, corporate social responsibility (CSR)
gradually becomes the focus of all stakeholders. An enterprise that seeks to be socially
responsible should play a role in safeguarding the rights and interests of employees
and customers, protecting the environment, saving energy and reducing emissions,
ensuring product quality, maintaining partnerships within the supply chain, advancing
technologies, etc. Foreign-invested enterprises, particularly the large transnational
corporations from developed countries in Europe and the United States, see CSR as a
corporate culture to publicize, which sets an example for Chinese companies. In 2008,
the Ministry of Commerce issued Guidelines of Foreign-invested Enterprises
Fulfilling Social Responsibilities (draft) which set up the bottom line for the
transnational corporations to fulfill CSR in China and also signifies that the Chinese
government attaches great importance to foreign-funded enterprises fulfilling their
CSR. At present, an increasing number of local Chinese enterprises have begun to
integrate CSR into their management strategies and policies.
With the promotion of CSR, the public has become increasingly aware of
environmental issues. An increasing number of enterprises have participated in public
environmental education to publicize their environmental-friendly image give them a
competitive edge.
(3) Risk of Concealing a Double Standard
Due to the halo effect of foreign-invested enterprises, the public generally views
favourably the products, CSR efforts, and environment behaviour of foreign
enterprises. The fact is, though, that the government and the public know little about
the environmental management model and the final implementation of the
environmental standards adopted by the foreign-invested enterprises. As long as the
pollutant emission standards are in line with the China’s national laws and regulations,
the company can keep operating.
2.3.3.2 Analysis on the Management Effect of Foreign Direct Investment
Management effect refers to the “investment-attracting” behaviour of the host
government, particularly the foreign investment impact caused by the environmental
management policy.
Environmental regulation refers to the aggregation of various environmental
protection policies and measures, such as environmental standards, pollution emission
regulations, and expense input of treatment, that a country and region formulates and
implements with the objective of protecting the environment. Environmental
regulation mainly influences the choice of location of foreign investment in polluting
industries. As other conditions remain unchanged, it is more economical to run a
business in a country with loose environmental regulations or poor law enforcement
capacity than in a country with strict regulations. Specifically, in a country with strict

70
regulation, the operator is forced to input a large amount of extra resources into
non-productive activities, such as environmental auditing, waste treatment, and
dealing with environmental disputes. Therefore, the production efficiency may be
negatively influenced. While in a country with loose environmental regulations, the
company may use obsolete production facilities, outdated technologies, and products
that have been forbidden in the country with strict regulation, thus the costs incurred
by the company are further reduced and the life cycle of the products is extended, and
the profit of the company is thereby increased. As far as China is concerned, due to
the large gaps in economic development among regions, some regions carry out
stricter environment standards, which leads to different environment effects.
For those regions with relatively high pressure of environmental regulation, the cost
of foreign investment in polluting industries is expected to be increased; hence its
proportion is to be brought down, the regional economic structure level will be
enhanced, and the regulation effect will have a positive effect on the environment.
While in regions where the environment is loosely regulated, foreign investment in
polluting industries will increasingly move in, hence regional pollution emissions will
increase. In terms of the overall regional distribution of foreign investment, in 2008,
the increasing rate of total investment amount in central and southwestern regions was
higher than that of eastern coastal regions (Table 2).
2.3.3.3 Analysis on the Scale Effect of Foreign Direct Investment
The scale effect refers to the impact on environment when FDI expands the scope of
business activities in the host country.
(1) Intensification of the Inherent Conflict between Investment and
Environmental Protection due to the Increase of Foreign Direct Investment
The scale effect leads to the increase of economic aggregate, which calls for more
resource inputs and thus emits more by-product contamination. In this way, it
aggravates environmental pollution. Economic development versus environmental
protection is the inherent conflict in the traditional social developmental pattern. At
the very beginning of the opening up of China’s market economy, the introduction of
foreign investment, as a major measure to stimulate economic growth, has long been
adopted by the government. An abundant and low-cost labour force in China, along
with the government’s long-term export-oriented policy to foreign-invested
enterprises, leads to the increase of foreign-invested enterprises’ total production,
which has made a significant contribution to the development of foreign trade and
export growth of China (Table 3). However, with the expansion of investment scale,
environmental problems gradually become obstacles limiting the development of
China. How to coordinate the attraction of foreign investment alongside the
achievement of environmental protection is a thorny problem for the Chinese
government.
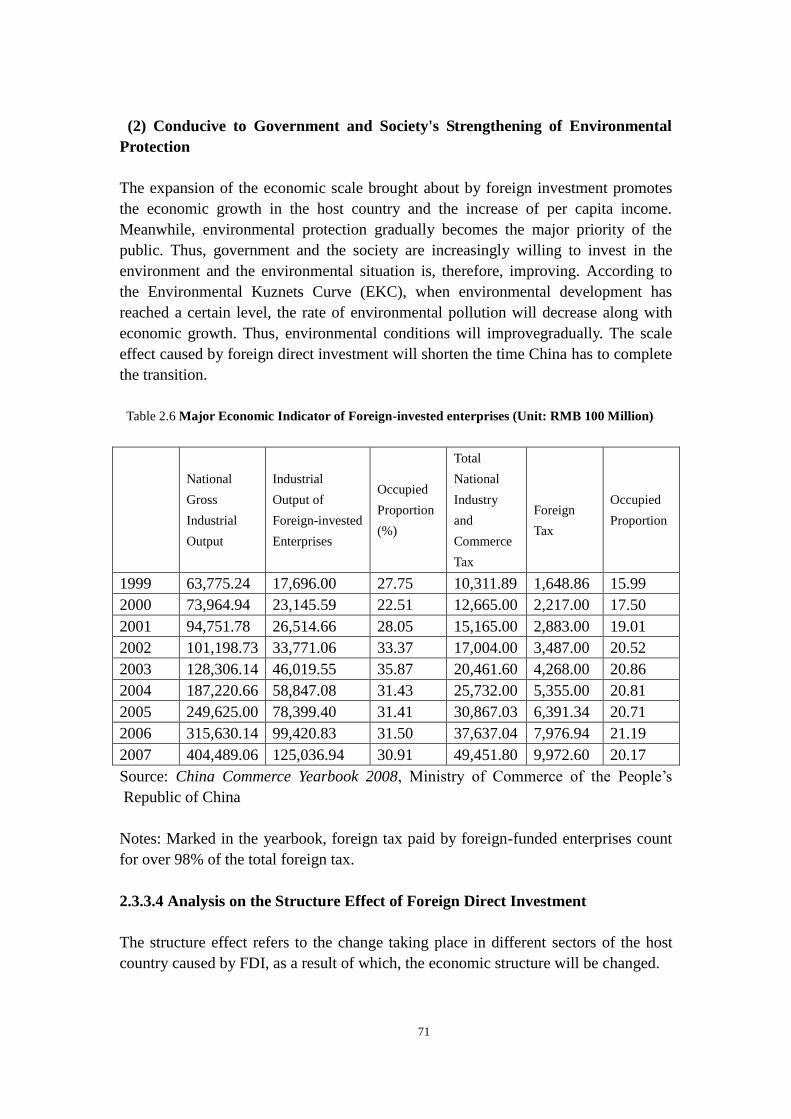
71
(2) Conducive to Government and Society's Strengthening of Environmental
Protection
The expansion of the economic scale brought about by foreign investment promotes
the economic growth in the host country and the increase of per capita income.
Meanwhile, environmental protection gradually becomes the major priority of the
public. Thus, government and the society are increasingly willing to invest in the
environment and the environmental situation is, therefore, improving. According to
the Environmental Kuznets Curve (EKC), when environmental development has
reached a certain level, the rate of environmental pollution will decrease along with
economic growth. Thus, environmental conditions will improvegradually. The scale
effect caused by foreign direct investment will shorten the time China has to complete
the transition.
Table 2.6 Major Economic Indicator of Foreign-invested enterprises (Unit: RMB 100 Million)
National
Gross
Industrial
Output
Industrial
Output of
Foreign-invested
Enterprises
Occupied
Proportion
(%)
Total
National
Industry
and
Commerce
Tax
Foreign
Tax
Occupied
Proportion
1999 63,775.24 17,696.00 27.75 10,311.89 1,648.86 15.99
2000 73,964.94 23,145.59 22.51 12,665.00 2,217.00 17.50
2001 94,751.78 26,514.66 28.05 15,165.00 2,883.00 19.01
2002 101,198.73 33,771.06 33.37 17,004.00 3,487.00 20.52
2003 128,306.14 46,019.55 35.87 20,461.60 4,268.00 20.86
2004 187,220.66 58,847.08 31.43 25,732.00 5,355.00 20.81
2005 249,625.00 78,399.40 31.41 30,867.03 6,391.34 20.71
2006 315,630.14 99,420.83 31.50 37,637.04 7,976.94 21.19
2007 404,489.06 125,036.94 30.91 49,451.80 9,972.60 20.17
Source: China Commerce Yearbook 2008, Ministry of Commerce of the People’s
Republic of China
Notes: Marked in the yearbook, foreign tax paid by foreign-funded enterprises count
for over 98% of the total foreign tax.
2.3.3.4 Analysis on the Structure Effect of Foreign Direct Investment
The structure effect refers to the change taking place in different sectors of the host
country caused by FDI, as a result of which, the economic structure will be changed.
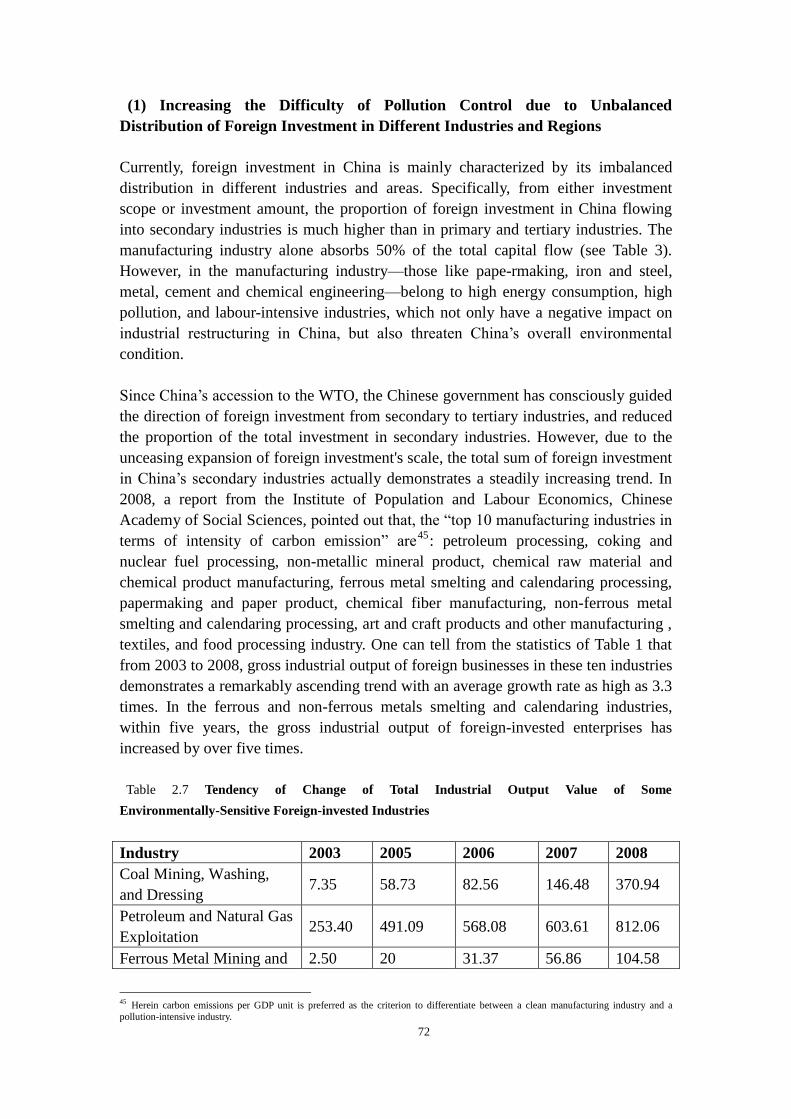
72
(1) Increasing the Difficulty of Pollution Control due to Unbalanced
Distribution of Foreign Investment in Different Industries and Regions
Currently, foreign investment in China is mainly characterized by its imbalanced
distribution in different industries and areas. Specifically, from either investment
scope or investment amount, the proportion of foreign investment in China flowing
into secondary industries is much higher than in primary and tertiary industries. The
manufacturing industry alone absorbs 50% of the total capital flow (see Table 3).
However, in the manufacturing industry—those like pape-rmaking, iron and steel,
metal, cement and chemical engineering—belong to high energy consumption, high
pollution, and labour-intensive industries, which not only have a negative impact on
industrial restructuring in China, but also threaten China’s overall environmental
condition.
Since China’s accession to the WTO, the Chinese government has consciously guided
the direction of foreign investment from secondary to tertiary industries, and reduced
the proportion of the total investment in secondary industries. However, due to the
unceasing expansion of foreign investment's scale, the total sum of foreign investment
in China’s secondary industries actually demonstrates a steadily increasing trend. In
2008, a report from the Institute of Population and Labour Economics, Chinese
Academy of Social Sciences, pointed out that, the “top 10 manufacturing industries in
terms of intensity of carbon emission” are45
: petroleum processing, coking and
nuclear fuel processing, non-metallic mineral product, chemical raw material and
chemical product manufacturing, ferrous metal smelting and calendaring processing,
papermaking and paper product, chemical fiber manufacturing, non-ferrous metal
smelting and calendaring processing, art and craft products and other manufacturing ,
textiles, and food processing industry. One can tell from the statistics of Table 1 that
from 2003 to 2008, gross industrial output of foreign businesses in these ten industries
demonstrates a remarkably ascending trend with an average growth rate as high as 3.3
times. In the ferrous and non-ferrous metals smelting and calendaring industries,
within five years, the gross industrial output of foreign-invested enterprises has
increased by over five times.
Table 2.7 Tendency of Change of Total Industrial Output Value of Some
Environmentally-Sensitive Foreign-invested Industries
Industry 2003 2005 2006 2007 2008
Coal Mining, Washing,
and Dressing 7.35 58.73 82.56 146.48 370.94
Petroleum and Natural Gas
Exploitation 253.40 491.09 568.08 603.61 812.06
Ferrous Metal Mining and 2.50 20 31.37 56.86 104.58
45
Herein carbon emissions per GDP unit is preferred as the criterion to differentiate between a clean manufacturing industry and a
pollution-intensive industry.
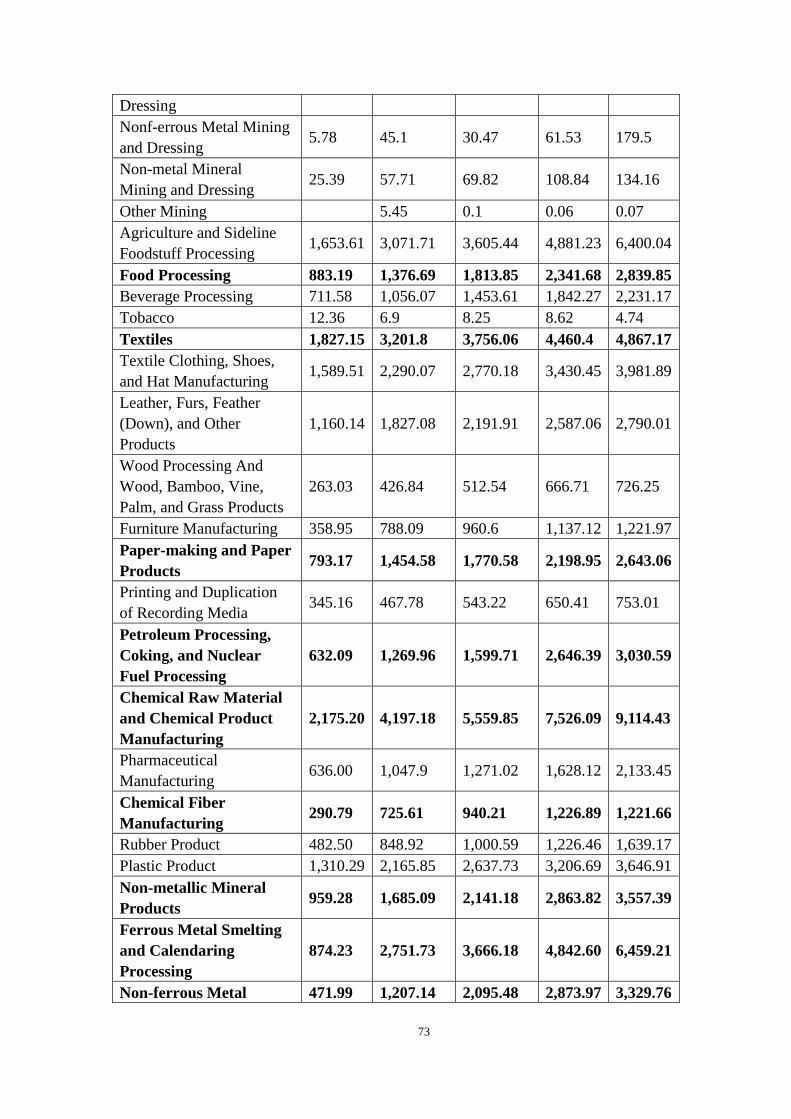
73
Dressing
Nonf-errous Metal Mining
and Dressing 5.78 45.1 30.47 61.53 179.5
Non-metal Mineral
Mining and Dressing 25.39 57.71 69.82 108.84 134.16
Other Mining 5.45 0.1 0.06 0.07
Agriculture and Sideline
Foodstuff Processing 1,653.61 3,071.71 3,605.44 4,881.23 6,400.04
Food Processing 883.19 1,376.69 1,813.85 2,341.68 2,839.85
Beverage Processing 711.58 1,056.07 1,453.61 1,842.27 2,231.17
Tobacco 12.36 6.9 8.25 8.62 4.74
Textiles 1,827.15 3,201.8 3,756.06 4,460.4 4,867.17
Textile Clothing, Shoes,
and Hat Manufacturing 1,589.51 2,290.07 2,770.18 3,430.45 3,981.89
Leather, Furs, Feather
(Down), and Other
Products
1,160.14 1,827.08 2,191.91 2,587.06 2,790.01
Wood Processing And
Wood, Bamboo, Vine,
Palm, and Grass Products
263.03 426.84 512.54 666.71 726.25
Furniture Manufacturing 358.95 788.09 960.6 1,137.12 1,221.97
Paper-making and Paper
Products 793.17 1,454.58 1,770.58 2,198.95 2,643.06
Printing and Duplication
of Recording Media 345.16 467.78 543.22 650.41 753.01
Petroleum Processing,
Coking, and Nuclear
Fuel Processing
632.09 1,269.96 1,599.71 2,646.39 3,030.59
Chemical Raw Material
and Chemical Product
Manufacturing
2,175.20 4,197.18 5,559.85 7,526.09 9,114.43
Pharmaceutical
Manufacturing 636.00 1,047.9 1,271.02 1,628.12 2,133.45
Chemical Fiber
Manufacturing 290.79 725.61 940.21 1,226.89 1,221.66
Rubber Product 482.50 848.92 1,000.59 1,226.46 1,639.17
Plastic Product 1,310.29 2,165.85 2,637.73 3,206.69 3,646.91
Non-metallic Mineral
Products 959.28 1,685.09 2,141.18 2,863.82 3,557.39
Ferrous Metal Smelting
and Calendaring
Processing
874.23 2,751.73 3,666.18 4,842.60 6,459.21
Non-ferrous Metal 471.99 1,207.14 2,095.48 2,873.97 3,329.76
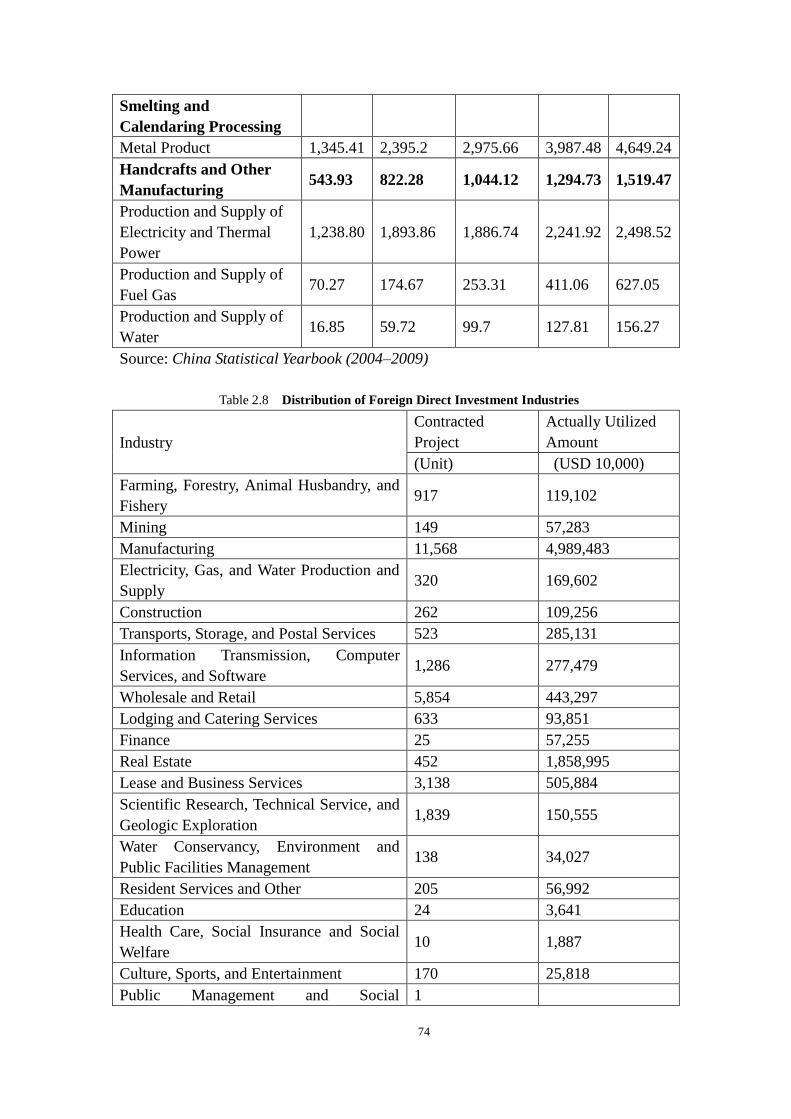
74
Smelting and
Calendaring Processing
Metal Product 1,345.41 2,395.2 2,975.66 3,987.48 4,649.24
Handcrafts and Other
Manufacturing 543.93 822.28 1,044.12 1,294.73 1,519.47
Production and Supply of
Electricity and Thermal
Power
1,238.80 1,893.86 1,886.74 2,241.92 2,498.52
Production and Supply of
Fuel Gas 70.27 174.67 253.31 411.06 627.05
Production and Supply of
Water 16.85 59.72 99.7 127.81 156.27
Source: China Statistical Yearbook (2004–2009)
Table 2.8 Distribution of Foreign Direct Investment Industries
Industry
Contracted
Project
Actually Utilized
Amount
(Unit) (USD 10,000)
Farming, Forestry, Animal Husbandry, and
Fishery 917 119,102
Mining 149 57,283
Manufacturing 11,568 4,989,483
Electricity, Gas, and Water Production and
Supply 320 169,602
Construction 262 109,256
Transports, Storage, and Postal Services 523 285,131
Information Transmission, Computer
Services, and Software 1,286 277,479
Wholesale and Retail 5,854 443,297
Lodging and Catering Services 633 93,851
Finance 25 57,255
Real Estate 452 1,858,995
Lease and Business Services 3,138 505,884
Scientific Research, Technical Service, and
Geologic Exploration 1,839 150,555
Water Conservancy, Environment and
Public Facilities Management 138 34,027
Resident Services and Other 205 56,992
Education 24 3,641
Health Care, Social Insurance and Social
Welfare 10 1,887
Culture, Sports, and Entertainment 170 25,818
Public Management and Social 1
75
Organizations
International Organizations 6
Source: China Statistical Yearbook (2009)
Due to the higher degree of openness in the eastern coastal areas of China, the
traditional advantages of labour force and market are attracting most of the enterprises
investing in China, which further intensifies the imbalance of regional economic
development. Besides, the gradual expansion of investment scale has placed
tremendous pressure on the resource environment of these regions. In recent years,
with the improvement of soft investment environment in the central-western region,
foreign investment reveals the trend to transfer from the east to the central west region.
But it is notable that while the central-west region, particularly the remote west
mountainous areas, are blessed with abundant natural resources in energy, mineral
products, land, and other features, their ecological environment is vulnerable.
Therefore, correct and reasonable policy guidance for foreign investment is of
significant importance.
(2) Positive Scale Effect Difficult to Appear due to the Main Body of Investment
formed by Small and Medium-Sized Enterprises
According to the differentiation criteria for foreign-invested enterprises by the
Ministry of Commerce, projects with contracted foreign investment of over USD 10
million are considered large-scale enterprises or large-scale investment projects. By
the end of 2003, the number of foreign-invested large-scale enterprises was 14,562,
counting for 3.31% of the accumulative total number of items. Contracted foreign
investment amounted to USD 474.987 billion, accounting for 50.36% of the
accumulative total sum. Medium-sized and small projects with amounts invested
below USD 10 million enjoy as high as 96.69% of the amount in foreign investment
utilization project, accounting for 49.64% of total contracted capital of China. Seen
from an average investment amount of a single foreign-invested project, contracted
foreign investment amounted to USD 20.027 million, and the amount of foreign
investment in actual use is USD 1.0778 million. Apparently, in China, the scale of
foreign-invested enterprises is generally small, that is, it is mainly composed of
medium-sized and small enterprise projects.
Although many transnational corporations have introduced advanced technology into
China, many foreign-invested enterprises with relatively less capital still adopt the
backward or obsolete technologies of their own countries, which places significant
stress on China’s environment. Even the technology adopted by some foreign-invested
enterprises is above the average domestic level, it is not at the internationally
advanced level, which means that its resource efficiency and environmental
performance fall behind the advanced technology in the developed countries. Since
production facilities formed by investment in the fields of energy, industry,
infrastructure, and other fields is characterized by high capital intensity, high emission
76
intensity, long working life, etc., the lock-in effect of technological input makes many
enterprises unable to use more advanced technology at once, which delays technical
upgrading and innovation of Chinese industry.
(3) Improvement of the Overall Pollution Industry Structure of China due to
Foreign Investment
The structure effect of foreign direct investment depends on pollution degree of a new
department compared with the original department, that is, it depends on the
comparison of relative pollution degree between the expanding department and the
contracting one. If structural adjustment leads to pollution-intensive specialized
productive departments, it will cause negative impact on the environment and vice
versa. Distribution structure of foreign-invested industry and that of national industry
can be compared by the establishment of the index (Production value of
foreign-invested pollution-intensive enterprises46
/ Production value of
foreign-invested cleanness-intensive enterprises)/ (Production value of national
invested pollution-intensive enterprises/ Production value of national invested
cleanness-intensive enterprises).
Research shows that compared with pollution-intensive industry, foreign-invested
cleanness-intensive enterprises enjoy higher productivity and more obvious
comparative advantage. At the same time, the distribution structure of foreign-funded
pollution-intensive enterprise is better than that of China. Therefore, foreign
investment can improve the industrial structure of overall pollution in China.47
2.3.3.5 Analysis on the Technology Effect of Foreign Direct Investment
The technology effect refers to the phenomenon that foreign investment increases the
rate of technology upgrading, pervasion and transfer.
(1) Conducive to the Spread of Environmental Protection Technology and
Promoting the Pervasion of Environmental Technology
FDI enterprises, especially those multinational corporations committing to the global
strategy, tend to utilize identical technology in every country, which comprises an
important part of their competitive strategy. The technology they use is not only
merely based on the current management system, but also grounded on the
46
According to the definition and features of pollution-intensive industry, the provisions of other various national regulations and the
actual influence on environment by some industrial departments and in the consideration of the practical situation in China,
pollution-intensive industries include: coal mining and processing industry; petroleum exploitation, processing and coking petroleum
chemical industry; ferrous metals mining and dressing and smelting industry; nonferrous metals mining and dressing and smelting
industry; some non metal mineral mining and dressing industry and some non metal mineral products; vegetable oil processing and sugar
baking in food processing industry; fermented products, preserved food products and condiment products manufacturing in food
processing industry; alcohol and potable spirit production in beverage manufacturing; printing and dyeing textile industry; shoemaking (cloth shoes excluded) industry; leather, furs, down and other manufacturing; papermaking and paper products industry; thermal power
industry; chemical raw materials and chemical products industry; pharmaceutical manufacturing; chemical fiber manufacturing; rubber
products: some plastic products; some metallic products: some engineering products manufacturing; some electrical machinery and
equipment ; some products of electronic and telecommunication equipment manufacturing, etc.
3. Jin Yi,, 2008, Environmental Protection Research on China’s Utilization of Foreign Direct Investment, Master’s thesis.
77
development of management system. Hence, they pay much attention to the
transformation of current technology and the introduction of new environmental
technology to reduce the pollution to the environment. For example, upon the
establishment of Beijing Panda P&G Cleaning Products Co., Ltd, this company has
conducted a series of technology transformation in reducing dust pollution, increasing
the degree of process automation and upgrading products to be environment friendly
products. It also spent nearly USD 2 million importing foreign advanced equipment
to establish a modern sewage plant so as to reduce the company’s pollution to the
environment.48
(2) Promotion of the Popularization of Environment-Friendly Products
The entry of the large amount of foreign investment can promote China's economic
development to a certain degree. From the perspective of economics, environment
quality is a kind of normal goods, the demand of which increases with the increase of
income. When the income increases, inhabitants of a certain country will have the
demand for better environmental quality and purchase more environment friendly
products, so as to raise the competitiveness of environment friendly technology.
Hence it further promotes the development of China's environmental industry.
Attracted by the large potential environmental market in China, foreign investors have
invested in establishing some environmental enterprises. Not only do they provide
sources of fund and advanced technological equipment for the protection and
management of environment in China, but they also quicken the structural adjustment
and optimization of environmental industry and products. At the same time, they meet
the huge demand of environmental market and effectively reduce the environmental
pollution. The comparatively high environmental consciousness and advanced
environmental management method of foreign-invested enterprises have a positive
learning demonstration effect for their Chinese partners to improve the environmental
consciousness and environmental management level. In this way they enhance the
competitiveness of Chinese enterprises.
(3) Promotion of the Progress of Technology in Chinese Enterprises due to
Advanced Technology of Foreign Enterprises
Foreign-invested enterprises introduce new products and new technology. They are
the model of domestic enterprises, as well as the major source of the pervasion of new
technology and new products. Especially in the development of clean technology
industry, the leading role of foreign-invested enterprises is very obvious. Chinese
enterprises are constantly improving their learning and innovation ability so as to
greatly upgrade environmental technology and raise management level of domestic
enterprises. The other way round, with the promotion of Chinese enterprises,
industrial investment factors of foreign enterprises are showing the transition from
4. Yan Fulei, 2008, Research on the Relationship between FDI and China’s Environmental Protection, Mater’s thesis
78
labour-intensive and capital-intensive industry to technology-intensive and
cleanness-intensive industry. The level of technology is increasing and it can match
various investment patterns.
2.4 International Comparative Study
2.4.1 Comparison of FDI in Brazil, India and China
Against the international backdrop of economic globalization, China, Brazil and India
have gradually realized that participation in the course of globalization is a sufficient
and necessary condition for developing their economies. They have actively grasped
opportunities and launched a series of FDI attracting policies meeting their national
conditions. As a result, the total amount of the FDI they have absorbed is rising, and
they have become countries most attractive for FDI in the world. However, as
developing countries, in the course of FDI absorption, unsound economic system and
market structure lead to many structural and institutional risks in economic operation.
Therefore, how to absorb FDI and what kinds of FDI to be absorbed are of great
significance for further promoting economic growth.
2.4.1.1 Comparison of Policies for FDI Absorption
Among various factors attracting FDI, besides uncertain regional factors such as the
resource endowment, stability of political and economic policies and economic
development level of the host country, the host country’s policy for attracting foreign
investment plays a very important role. We may say that the government’s policy
orientation for attracting foreign investors directly decides foreign investors’
contributing to greet investment. China, Brazil and India have their specific features
in terms of foreign investment policies.
Like China, Brazil is also a large country with a rich resource endowment. However,
the proportion of investment in resource industries is far lower than that in China,
which is closely related to its industry policy orientation. To maximally utilize the
opportunities resulting from globalization, the Brazilian government started to
actively expand the proportion of service industry and infrastructure in national
economy as early as the mid 1990s, guiding FDI to shift to sectors such as service
industry, energy, communication, finance and transportation. At present, Brazil’s
investment policy is the freest among the three countries. According to the evaluation
report of an international financial company on over 20 emerging markets in the
world, Brazil is rated as “a market that can be freely accessed”, which also creates
good investment environment for the development of the tertiary industry.
79
India’s FDI policy attaches most importance to efficiency among the three countries.
Though India’s national conditions are similar to those of China, and its national
development strategy is also very much like that of China. However, compared with
India, China features higher government intervention, and government has more
advantage over India in terms of economic environment and infrastructure
construction, which cause a large amount of manufacturing industry to flow into
China. At the same time, the service industry, which is also labour-intensive industry,
develops vigorously in India. Besides, India’s highly efficient financial market,
advanced IT technology and better English command of Indian people provide a
hotbed for growth of the service industry.
China’s effort and scale in attracting FDI and FDI’s contribution to national economy
are all the largest. From the 1980s to the present, the Chinese government has
promulgated over 500 laws and regulations concerning foreign-related economy, and
established a great amount of infrastructure, creating excellent environment for
foreign investor’s investment and setting up factories in China. As a result, China’s
FDI utilization far outperforms the other two countries. Among the three countries,
the Chinese government has the best preferential treatment for foreign investment,
and therefore has the largest scale of foreign investment absorption. Compared with
Brazil, the development course of FDI in China is shorter, and the attention to
sustainability in FDI attracting orientation also came later. Consequently, foreign
investment in China focuses on pollution intensive industries such as manufacturing
and mining, with larger impact on the environment.
From the above analysis, it can be seen that Brazil’s FDI introduction was several
decades than China, and therefore Brazil paid attention to sustainable development
earlier. Under the guidance of government investment industry directions, FDI
structural transformation has been basically completed, and foreign investment in
Brazil is mainly concentrated in low pollution industries such as service, energy,
communication, finance and transportation. India’s national conditions are similar to
those of China, and its national development strategy is also very much like that of
China. However, compared with India, China features higher government intervention,
and government has more advantage over India in terms of economic environment
and infrastructure construction, which cause a large amount of manufacturing industry
with higher requirements on rigid investment environment to flow into China.
Meanwhile, the service industry, which is also a labour-intensive industry, sees
prosperous development in India. Different policy orientations of the three countries
have led to distribution of FDI in different industries and also made FDI cause
different extents of impact on the environment of the three countries.
80
2.4.1.2 Comparison of Developmental Courses of FDI Attraction
In early period of FDI attraction, China had weaker economic development. China,
for a time, created excellent economic growth momentum and stable political
environment and successfully attracted a large amount of FDI in the “manufacturing
outsourcing” of developed countries by relying on its low-price labour cost,
preferential FDI absorption policy, thus successfully squeezing into the
“internationalization chain” and becoming a link. Manufacturing in Chinese GDP
accounts for about 30%; thus China known as the “World’s Factory” is criticized for
“exchanging environment for economy”, and China’s shift to a green economy also
becomes an issue that foreign enterprises to invest in China must consider.
Different from the course of economic development in China, India did not carry out
structural shift and upgrading according to the trajectory of developing from primary,
secondary to tertiary industry in terms of the evolution course of its industrial
structure, but according to the industrial structural pattern of primary, tertiary and
secondary industries. According to statistical data, industry only accounts for 22.25 of
GDP in India, while service industry accounts for 51.2%. In the IT service area, in
particular, India is becoming the “background office” for more and more European
and American enterprises. Compared with manufacturing industry, service industry
itself is a technology and knowledge intensive industry, and the main competitiveness
of service enterprises is reflected in soft technology and intangible assets. Therefore,
whether in terms of structural effort or technical effect, the environmental impact
caused by FDI on India is far less than that on China.
Brazil has undergone the course of transforming from mining, manufacturing to
finance and electricity industries in the course of FDI utilization. Before the 1990s,
Brazil’s foreign investment was mainly concentrated in the mining sector and
manufacturing sector. Since the 1990s, besides the manufacturing sector, financial
service sector and information and communication sector have been more and more
favored by foreign investors. The proportion of FDI in various sectors of Brazil is
respectively: service sector 73.2%, industry 23.8% and agriculture, husbandry and
mining 3%. The causes for such change are: new technology revolution exerts major
impact on the industrial structure of developed countries so that the role of Brazil as a
raw material supply base is gradually diminishing, and developed countries’
investment interest in Brazil’s mining sector is gradually dropping; the Brazil
government, to accelerate industrialization and attract foreign investment and
advanced technology, formulates some policies favorable for foreign investment;
emerging industries (for example, information and high-tech industry) keep
81
developing and disseminating worldwide, and the financial service and IT sector of
Brazil are opened to the outside, which have increased developed countries’
investment effort in these sectors of Brazil. At present, foreign investment in Brazil
mainly focuses on industries with huge potentiality for development such as
telecommunication, finance, electricity and Internet. As such industries require less
consumption of natural resources and have less pollution, they exert less pressure on
the environment than manufacturing. The increase of investment in high-tech
industries will produce positive influence on the environment.
From the above analysis, we can see that Brazil attached great importance to
technology introduction and technical transfer from the very beginning of FDI
introduction. The primary, tertiary and secondary industry structure development
pattern in India, to some extent, determines that its tertiary industry is most attractive
for FDI. However, in the beginning of FDI introduction in China, as the economic
base was weak and more emphasis was given to the growth of market scale, foreign
investment in China mainly focuses on primary product manufacturing with high
sensitivity to the environment.
2.4.2 Comparison of Foreign Investment in China and the United States
China and the United States are respectively the developing country and the
developed country absorbing the most FDI in the world. As the largest developed
country in the world, the United States not only conducts a large amount of foreign
investment but also actively use foreign investment. It is not only the largest capital
exporting country in the world but also the most attractive and largest investment
market in the world, with significant performance in attracting foreign investment.
China, as the developing country absorbing the most FDI in the world, has huge gap
from the United States in terms of foreign capital stock, industrial pattern or FDI
attracting policy. Different market environment and policy orientation have led to
different impact of FDI on the environment.
2.4.2.1 Comparison of Location Advantages
The big gap between China and the United States in terms of economic development
level has caused the two countries to have different location advantages in attracting
foreign investment. For the United States, its economic and technological
development level is high and the competitiveness of its domestic enterprises is very
strong. Therefore, it tends to adopt a liberal and open policy for foreign investment,
and treat equally enterprises involving or created by foreign investment and domestic
enterprises according to law, practicing no-difference treatment. Its liberal investment
82
environment, convenient corporate operation mechanism, limited and predictable
policy system and appropriate taxation burden are causes why the United States
attracts foreign investment. In addition, the United States has excellent infrastructure
and stable policy and laws, which are very attractive for global investors.
As an emerging developing country, China’s main advantages are reflected in: first,
China has rapid economic growth speed, and especially in the general economic
slowdown worldwide, the stable growth of Chinese economy is especially
eye-catching; second, China has a huge market, as China is the country with the
largest population in the world, featuring the largest potentiality for market
development; third, China has rich labour resources, with low labour cost and
improving labour quality.
The difference in location advantages has caused difference in foreign investment’s
emphasis in these two countries. As domestic enterprises have higher degree of
modernization and powerful competitiveness in the United States, the motive of FDI
by most foreign investors in North America is to occupy market, acquire technology
and information and avoid trade friction, and as a result there is more investment in
industries such as service, automobile and high technology. In China, however, the
basic motive for the entry of much foreign investment is to seek low cost production
or acquire rich natural resources, and as a result, China becomes an important product
part production and processing base for many countries, and manufacturing and
natural resource mining account for a larger proportion in FDI.
2.4.2.2 Policy Comparison
In the United States, as the market mechanism has been well developed and domestic
enterprises have very strong competitiveness, the government authorities pay more
attention to the market nature of investment and its policy on foreign investment aims
at providing foreign investors with a fair, transparent and liberal investment
environment and excellent infrastructure, to attract foreign investment with efficient
and high-quality government service and liberal investment environment. It generally
tends to tends to adopt a liberal and open policy for foreign investment, and treat
equally enterprises involving or created by foreign investment and domestic
enterprises according to law. Foreign capital can freely enter the investment areas like
domestic capital in the United States. There is no special restriction on investment
industry areas, investment ratio, term or transfer. There is some restriction only on
investment in some special fields involving national safety (national defense and
transportation etc.) or the investment of some specific countries (generally referring to
83
enemy countries). But on the whole, such restriction does not constitute barrier or
problem generally facing foreign investors.
Though the US government has created a relatively liberal environment for the entry
of foreign investment, yet it does not mean that it follows foreign investors
completely or that foreign investors can invest in any project anywhere, but it
establishes excellent infrastructure by preferential policy, efficient service and urban
planning and investing in a huge amount of money, so as to attract the projects and
enterprises it needs to settle in “development areas” and strive to promote “cluster
economy”. There are “development areas” generally in cities of the United States, as
platform for development of foreign investors. On this basis, the US government
attaches great importance to the micro management of foreign-funded enterprises, and
its foreign investment policy is basically implemented with a mature law and
regulation system. In this way, there are laws to go by and laws must be observed,
freeing foreign investors from worries.
Compared with the United States, FDI started later in China. Foreign investment was
not formally included into the track of development of national economy until the
inception of reform and opening-up in 1979. In the early period of foreign investment
inflow, as there was a huge gap between the overall conditions of economic
development in China and those of advanced countries in the world, China issued a
series of super-national preferential policies aiming at attracting foreign investment, in
an attempt to make up for the deficiency in investment environment caused by
backward infrastructure. In the early period of foreign investment inflow, the
government’s effective intervention and other systems played an important role in
attracting FDI. However, the government’s excessive intervention has led to a series
of adverse effect, for example, the leaning of central policy caused vicious
competition for FDI in various places, and some places attached importance to the
amount of FDI absorbed but neglected quality, which often caused labour-intensive,
natural resource intensive and pollution intensive industries to be transferred to China,
thus resulting in the consumption of a large amount of resources and tremendous
destruction of ecological environment, substantially weakening the sustainability of
the foreign investment introduction strategy.
Since1995, though China’s foreign investment policies have been adjusted, more
attention has been given to the sustainability of the environment in FDI attracting
policy and foreign invested industries and FDI flow direction have been specified by
the method of combining encouragement and limitation, yet, China’s foreign
investment policies still lay more emphasis on introduction, lack late project
84
management, regulation on foreign-invested enterprises is weak, and infrastructure
equipment is not sound enough, which still lead problems such as low quality of FDI
introduced.
On the whole, the investment policies of the United States place more emphasis on
establishing a long-term stable investment environment. The government aims at
providing foreign investors with a fair, transparent and liberal investment environment
and excellent infrastructure by creating a liberal environment, limited and predictable
policy system and efficient and high-quality government service. Investors must
observe various legal provisions in the United States, including its environmental
standards and environment-related legal provisions. The high degree of market
orientation also forces enterprises to attach importance to the sustainability of
investment; otherwise they would be eliminated by the market. Whereas China’s
investment attracting policies mainly aimed at attracting extensive short-term benefits
against the backdrop of local governments’ blind pursuit of GDP, and some of them
were even launched at the cost of national assets and environmental destruction. The
relative disconnection between investment laws and environment, lack of late project
management and weak regulation over foreign-funded enterprises are important
causes for unreasonable FDI structure and serious environmental destruction in China.
2.5 Case Study
Case 1: Comparison of Transnational Corporations’ Environmental Information
Disclosure and Corporate Social Responsibility in China and in Other Regions
(1) Comparison of Shell’s Performance of Environmental Responsibilities in China
and Overseas
Environmental Information Disclosure49
The sustainable development report is an important channel for Shell’s active
disclosure of its environmental information, and how Shell’s environmental standard
is implemented is directly reflected in the reports publicized on the websites of its
branch companies. However, a careful comparison of the 2008 sustainable
development reports of Shell China and Shell’s companies in other countries and
regions can discover that the contents of report of Shell China are simpler, without
global vision or description of technological innovation and application from the
perspective of global energy sustainable exploitation. Data support is lacking for
49 This part is based on the disclosures in 2008 Annual Reports.
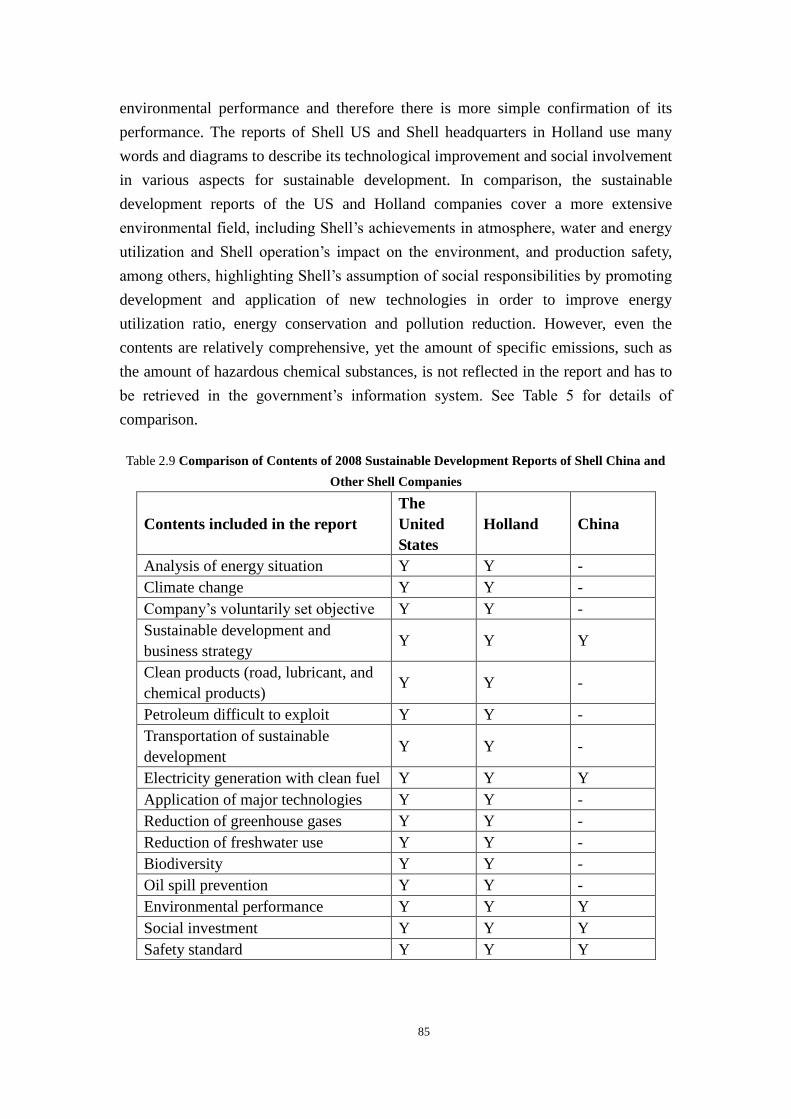
85
environmental performance and therefore there is more simple confirmation of its
performance. The reports of Shell US and Shell headquarters in Holland use many
words and diagrams to describe its technological improvement and social involvement
in various aspects for sustainable development. In comparison, the sustainable
development reports of the US and Holland companies cover a more extensive
environmental field, including Shell’s achievements in atmosphere, water and energy
utilization and Shell operation’s impact on the environment, and production safety,
among others, highlighting Shell’s assumption of social responsibilities by promoting
development and application of new technologies in order to improve energy
utilization ratio, energy conservation and pollution reduction. However, even the
contents are relatively comprehensive, yet the amount of specific emissions, such as
the amount of hazardous chemical substances, is not reflected in the report and has to
be retrieved in the government’s information system. See Table 5 for details of
comparison.
Table 2.9 Comparison of Contents of 2008 Sustainable Development Reports of Shell China and
Other Shell Companies
Contents included in the report
The
United
States
Holland China
Analysis of energy situation Y Y -
Climate change Y Y -
Company’s voluntarily set objective Y Y -
Sustainable development and
business strategy Y Y Y
Clean products (road, lubricant, and
chemical products) Y Y -
Petroleum difficult to exploit Y Y -
Transportation of sustainable
development Y Y -
Electricity generation with clean fuel Y Y Y
Application of major technologies Y Y -
Reduction of greenhouse gases Y Y -
Reduction of freshwater use Y Y -
Biodiversity Y Y -
Oil spill prevention Y Y -
Environmental performance Y Y Y
Social investment Y Y Y
Safety standard Y Y Y
86
Environmental Pollution Incidents and Disclosure
According to disclosure of media and public investigation, Shell China has not fully
implemented its idea of sustainable development in its course of operation, and has
not timely disclosed incidents of pollutant discharges exceeding stipulated standards.
Shell China was subject to an incident of sanitary wastewater exceeding stipulated
standard in Shanghai China in 2008-2009, and failed to disclose the incident within
the stipulated time. Under the pressure of non-governmental organizations, Shell
China publicized an announcement on its website to describe the results of
investigation and treatment of the incident. Shell Road Engineering (Shanghai) Co.,
Ltd. is a company in which Shell holds 75% shares. On April 28, 2008, Shanghai
Minhang Environmental Protection Bureau, in its regular check of the company,
discovered that the detected COD data in the sanitary sewage of the plant area were
higher than the emission value stipulated by the State. The announcement finally
pointed out that in Shell’s business operation, “environmental management shall be
further strengthened, and relevant environmental management laws and regulations
shall be strictly followed, regular self inspection shall be carried out to timely discover,
solve and report any problem.”
Besides, Shaanxi Yulin media disclosed that in August 2009 Shell Changbei Natural
Gas Treatment Plant did not use its special sewage treatment plant but employed
people to take sewage outside the plant to dump to a desert beside a highway, and was
caught by environmental protection law enforcement personnel on the site.
In the United States, Shell has also been subject to penalty for violation of
environmental law. In October 2009, Shell Oil Co. Station reached an agreement with
the California government in the United States for its violation of California’s law on
underground fuel storage and hazardous wastes that Shell would pay civil
compensation and pay compensation for investigation cost to the California
government and organizations of various levels, amounting to over USD 19 million.
Besides compensation, Shell agreed to take immediate steps to strengthen warning
monitoring and employee training and upgrade the oil station’s ability of hazardous
waste management and emergency response. 50
Before this incident, in March 2005, an inspector discovered that the operators of a
Shell station located at 30245 Agoura Road in Agoura Hills failed to properly conduct
and maintain secondary containment testing and monitoring for its gasoline tanks. The
50 Source of information: Pacific Auto Net: http://drivers.pcauto.com.cn/yongpin/rhy/news/0911/1013268.html。
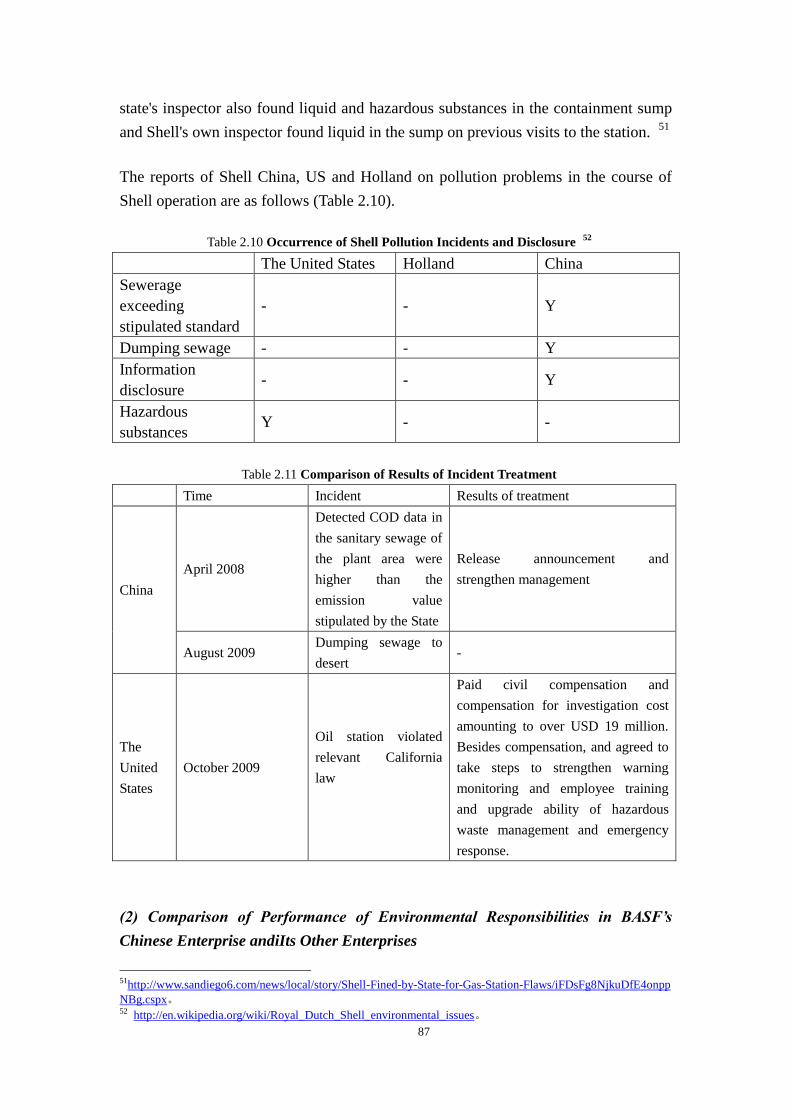
87
state's inspector also found liquid and hazardous substances in the containment sump
and Shell's own inspector found liquid in the sump on previous visits to the station. 51
The reports of Shell China, US and Holland on pollution problems in the course of
Shell operation are as follows (Table 2.10).
Table 2.10 Occurrence of Shell Pollution Incidents and Disclosure 52
The United States Holland China
Sewerage
exceeding
stipulated standard
- - Y
Dumping sewage - - Y
Information
disclosure - - Y
Hazardous
substances Y - -
Table 2.11 Comparison of Results of Incident Treatment
Time Incident Results of treatment
China
April 2008
Detected COD data in
the sanitary sewage of
the plant area were
higher than the
emission value
stipulated by the State
Release announcement and
strengthen management
August 2009 Dumping sewage to
desert -
The
United
States
October 2009
Oil station violated
relevant California
law
Paid civil compensation and
compensation for investigation cost
amounting to over USD 19 million.
Besides compensation, and agreed to
take steps to strengthen warning
monitoring and employee training
and upgrade ability of hazardous
waste management and emergency
response.
(2) Comparison of Performance of Environmental Responsibilities in BASF’s
Chinese Enterprise andiIts Other Enterprises
51http://www.sandiego6.com/news/local/story/Shell-Fined-by-State-for-Gas-Station-Flaws/iFDsFg8NjkuDfE4onpp
NBg.cspx。 52 http://en.wikipedia.org/wiki/Royal_Dutch_Shell_environmental_issues。
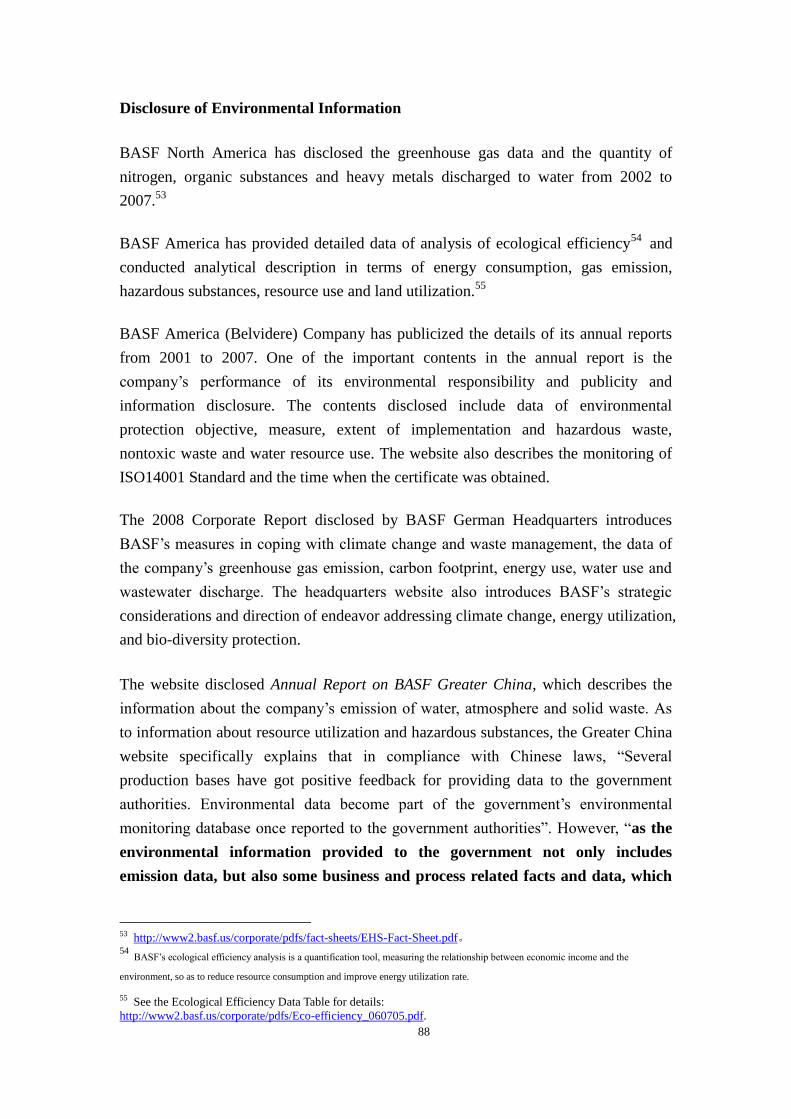
88
Disclosure of Environmental Information
BASF North America has disclosed the greenhouse gas data and the quantity of
nitrogen, organic substances and heavy metals discharged to water from 2002 to
2007.53
BASF America has provided detailed data of analysis of ecological efficiency54
and
conducted analytical description in terms of energy consumption, gas emission,
hazardous substances, resource use and land utilization.55
BASF America (Belvidere) Company has publicized the details of its annual reports
from 2001 to 2007. One of the important contents in the annual report is the
company’s performance of its environmental responsibility and publicity and
information disclosure. The contents disclosed include data of environmental
protection objective, measure, extent of implementation and hazardous waste,
nontoxic waste and water resource use. The website also describes the monitoring of
ISO14001 Standard and the time when the certificate was obtained.
The 2008 Corporate Report disclosed by BASF German Headquarters introduces
BASF’s measures in coping with climate change and waste management, the data of
the company’s greenhouse gas emission, carbon footprint, energy use, water use and
wastewater discharge. The headquarters website also introduces BASF’s strategic
considerations and direction of endeavor addressing climate change, energy utilization,
and bio-diversity protection.
The website disclosed Annual Report on BASF Greater China, which describes the
information about the company’s emission of water, atmosphere and solid waste. As
to information about resource utilization and hazardous substances, the Greater China
website specifically explains that in compliance with Chinese laws, “Several
production bases have got positive feedback for providing data to the government
authorities. Environmental data become part of the government’s environmental
monitoring database once reported to the government authorities”. However, “as the
environmental information provided to the government not only includes
emission data, but also some business and process related facts and data, which
53 http://www2.basf.us/corporate/pdfs/fact-sheets/EHS-Fact-Sheet.pdf。 54
BASF’s ecological efficiency analysis is a quantification tool, measuring the relationship between economic income and the
environment, so as to reduce resource consumption and improve energy utilization rate.
55 See the Ecological Efficiency Data Table for details:
http://www2.basf.us/corporate/pdfs/Eco-efficiency_060705.pdf.
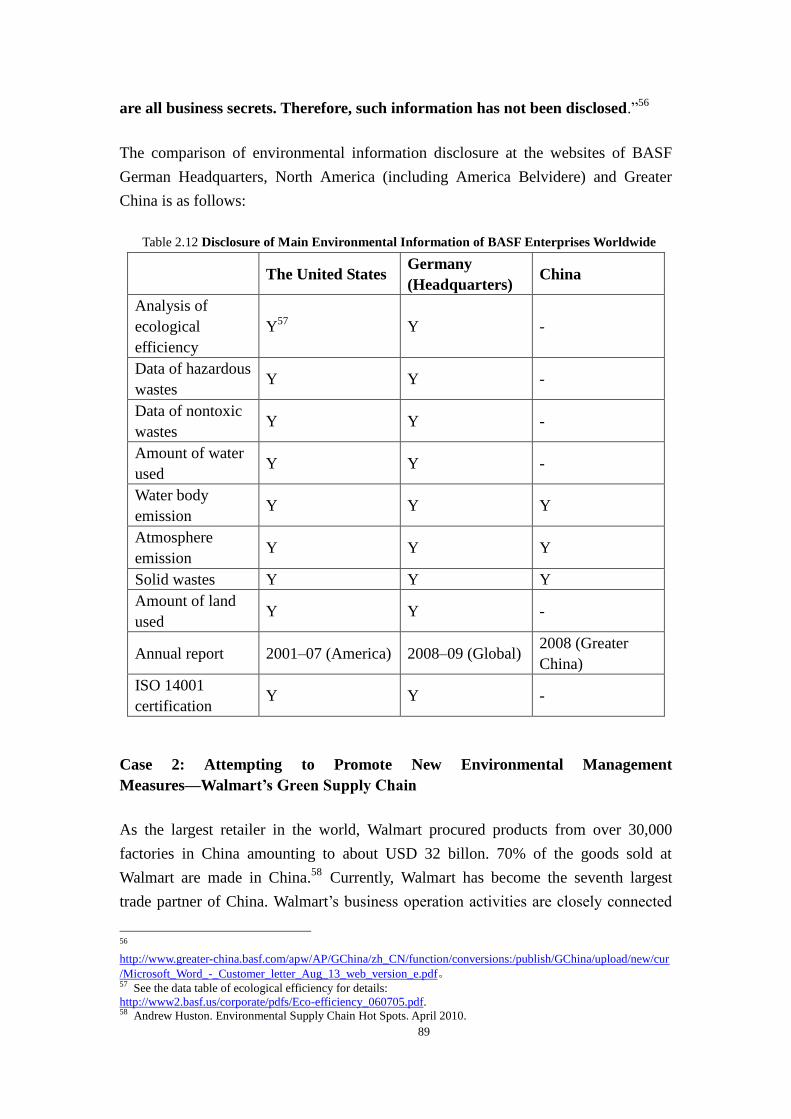
89
are all business secrets. Therefore, such information has not been disclosed.”56
The comparison of environmental information disclosure at the websites of BASF
German Headquarters, North America (including America Belvidere) and Greater
China is as follows:
Table 2.12 Disclosure of Main Environmental Information of BASF Enterprises Worldwide
The United States Germany
(Headquarters) China
Analysis of
ecological
efficiency
Y57
Y -
Data of hazardous
wastes Y Y -
Data of nontoxic
wastes Y Y -
Amount of water
used Y Y -
Water body
emission Y Y Y
Atmosphere
emission Y Y Y
Solid wastes Y Y Y
Amount of land
used Y Y -
Annual report 2001–07 (America) 2008–09 (Global) 2008 (Greater
China)
ISO 14001
certification Y Y -
Case 2: Attempting to Promote New Environmental Management
Measures—Walmart’s Green Supply Chain
As the largest retailer in the world, Walmart procured products from over 30,000
factories in China amounting to about USD 32 billon. 70% of the goods sold at
Walmart are made in China.58
Currently, Walmart has become the seventh largest
trade partner of China. Walmart’s business operation activities are closely connected
56
http://www.greater-china.basf.com/apw/AP/GChina/zh_CN/function/conversions:/publish/GChina/upload/new/cur
/Microsoft_Word_-_Customer_letter_Aug_13_web_version_e.pdf。 57 See the data table of ecological efficiency for details:
http://www2.basf.us/corporate/pdfs/Eco-efficiency_060705.pdf. 58 Andrew Huston. Environmental Supply Chain Hot Spots. April 2010.
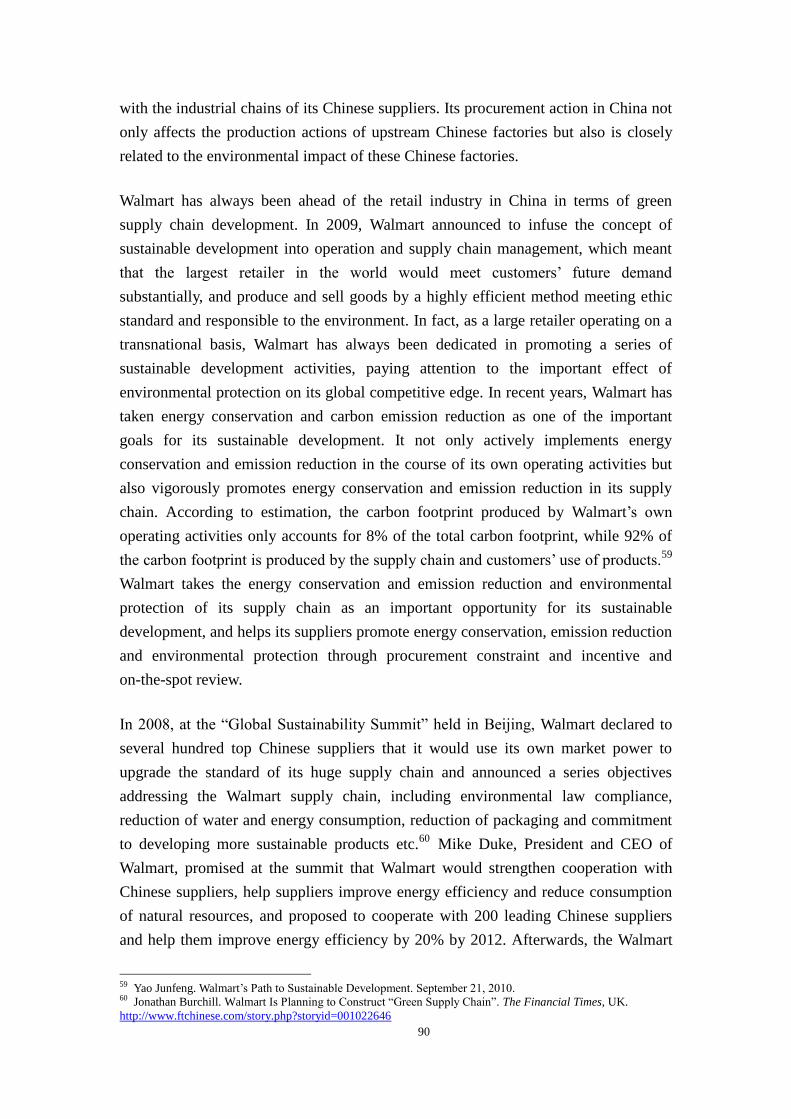
90
with the industrial chains of its Chinese suppliers. Its procurement action in China not
only affects the production actions of upstream Chinese factories but also is closely
related to the environmental impact of these Chinese factories.
Walmart has always been ahead of the retail industry in China in terms of green
supply chain development. In 2009, Walmart announced to infuse the concept of
sustainable development into operation and supply chain management, which meant
that the largest retailer in the world would meet customers’ future demand
substantially, and produce and sell goods by a highly efficient method meeting ethic
standard and responsible to the environment. In fact, as a large retailer operating on a
transnational basis, Walmart has always been dedicated in promoting a series of
sustainable development activities, paying attention to the important effect of
environmental protection on its global competitive edge. In recent years, Walmart has
taken energy conservation and carbon emission reduction as one of the important
goals for its sustainable development. It not only actively implements energy
conservation and emission reduction in the course of its own operating activities but
also vigorously promotes energy conservation and emission reduction in its supply
chain. According to estimation, the carbon footprint produced by Walmart’s own
operating activities only accounts for 8% of the total carbon footprint, while 92% of
the carbon footprint is produced by the supply chain and customers’ use of products.59
Walmart takes the energy conservation and emission reduction and environmental
protection of its supply chain as an important opportunity for its sustainable
development, and helps its suppliers promote energy conservation, emission reduction
and environmental protection through procurement constraint and incentive and
on-the-spot review.
In 2008, at the “Global Sustainability Summit” held in Beijing, Walmart declared to
several hundred top Chinese suppliers that it would use its own market power to
upgrade the standard of its huge supply chain and announced a series objectives
addressing the Walmart supply chain, including environmental law compliance,
reduction of water and energy consumption, reduction of packaging and commitment
to developing more sustainable products etc.60
Mike Duke, President and CEO of
Walmart, promised at the summit that Walmart would strengthen cooperation with
Chinese suppliers, help suppliers improve energy efficiency and reduce consumption
of natural resources, and proposed to cooperate with 200 leading Chinese suppliers
and help them improve energy efficiency by 20% by 2012. Afterwards, the Walmart
59 Yao Junfeng. Walmart’s Path to Sustainable Development. September 21, 2010. 60 Jonathan Burchill. Walmart Is Planning to Construct “Green Supply Chain”. The Financial Times, UK.
http://www.ftchinese.com/story.php?storyid=001022646
91
Global Procurement Office initiated the “Walmart Energy Efficiency Upgrading
Project” in 2009, proposing to help Chinese suppliers improve energy use efficiency,
reduce energy cost and improve enterprise competitiveness and sustainable
development ability.”61
According to data, since 2009, over 300 suppliers from different industries such as
toys, furniture, shoes, garments and electronics have participated in the project.
Compared with 2007, 135 factories participating in the project have achieved energy
efficiency upgrading of above 10%, and the total energy saved has reached 80 million
KW, equivalent to reducing the carbon dioxide emission of 70 thousand tons, and
equivalent to reducing the carbon emission of about 12 thousand cars driving one year
regularly.62
2.6 Opportunities and Challenges Facing Foreign Investment
2.6.1 Opportunities Facing Foreign Investment in China
1. Since the outbreak of the financial crisis, the effective coping measures of
the Chinese government has maintained a stable investment environment,
providing a relatively safe harbor. Effective coping with the financial crisis has
made China remain one of the most attractive countries for FDI. In a predictable
period in the future, the stable and tremendous market of China will still maintain the
attraction for FD. Most transnational corporations are firmly convinced that the
Chinese market and investment prospect are promising. According to the survey of the
United Nations Conference on Trade and Development on several hundred
transnational corporations, in terms of regional flow of international capital, China
and other emerging economies will still be places that various corporations vie for.
2. With the further implementation of China’s policies and measures for
encouraging the use of foreign investment, the positive effect will come out
gradually. In 2010, the State Council launched “Several Opinions on Further
Managing Matters Regarding Utilization of Foreign Investment”, and various
departments of the Central Government and local governments at various levels
successively launched policies and measures on implementing “Several Opinions”,
which have played an active role in stabilizing and enhancing investors’ confidence.
With the further implementation of supporting policies and measures for “Several
Opinions”, the positive effect will come out gradually.
61 How Retailers “Play with” Green Supply China, International Business Daily 62 Spearheading Sustainable Development and Co-Constructing Green Supply Chain, Impression Walmart, Vol. 4,
2010
92
3. The potentiality of central and western regions of China for absorbing
foreign investment will be further increased. The soft and hard environments for
investment in central and western regions keep improving, the consumption market is
increasingly expanding, industrial supports are gradually perfecting, and development
of industrial concentration areas are accelerating; in view of the rising element costs
in the eastern region, obvious comprehensive cost advantages can be found in central
and western regions. At the same time, a large amount of low-end labourers are
returning from the east to the central and western regions, and the development of
economy and society in the central and western regions is also attracting more
high-quality human resources, which upgrade the element endowment of the central
and western regions. All these will vigorously promote the central and western regions
to undertake industrial transfer of manufacturing and develop producer service
industry.
4. Strategic adjustment of economic structure provides new hotspots for
foreign investment. After the start of the period of the “Twelfth Five-Year Plan”,
accelerating the strategic adjustment of economic structure will become the main
direction for China’s shift of economic development pattern. The reconstruction and
upgrading of manufacturing industry, vigorous development of service industry and
cultivation of strategic emerging industries, among others, will provide new growth
points for China’s absorption of foreign investment. Currently, various major
economies in the world are redoubling their effort to promote a new round of
technological revolution and industrial adjustment. In the course of cultivating some
emerging industries, China has participated or is forming the ability to participate in
world competition and higher level of international labour division. Compared with
developed countries, China features still low comprehensive cost and expanding
market space, and contains excellent opportunities for attracting overseas investors in
emerging high-end manufacturing industry and producer service industry. In 2010, the
State Council promulgated the “Decision on Accelerating the Cultivation and
Development of Strategic Emerging Industries”. The plans for development of seven
major strategic emerging industries will be gradually launched in 2011. In the
industrial policy orientation of the future period, foreign investment will be guided to
high-end manufacturing industry, high-tech industry, modern service industry, new
energy and energy conservation and environmental protection industry. All these will
provide new space of development for foreign investment in China.
2.6.2 Challenges Confronting Foreign Direct Investment
While China remains to be the most attract host country for FDI, foreign investment is
93
also confronted with a series of challenges here.
1. Chinese economy is confronted with various challenges compounded by
external environmental domestic economic restructuring. With China’s further
integration into world economy, global economic risks will exert larger influence on
China. In 2011, China will continue to be confronted with problems such as unceasing
trade disputes, upward pressure on the Renminbi, imported inflation and inflow of hot
money. From the perspective of domestic situation, the effect of heavy investment
coping with the financial crisis is gradually diminishing, the cultivation of
consumption ability still needs a period of time, liquidity risk is worth considering,
and the inner drive for economic growth is to be activated; at the same time, economic
restructuring is still going on with hardship, long-term problems and short-term
problems are interweaved, institutional conflicts and structural problems are piled up,
macro control becomes more difficult and unpredictable phenomena increase.
2. Operating costs in China are rising. Inflation pressure, sustained RMB
appreciation tendency, and rising labour cost as well as other factors have been raising
foreign investor’s operating cost in China. Since 2010, many provinces and cities
have raised their minimum wage standard, and have once been subject to the “tide of
wage hike”. In eastern regions where foreign-invested enterprises are concentrated,
labour cost rise will be a long-term tendency. Giving comprehensive consideration to
these factors, foreign-invested enterprise with low added value may possibly invest in
central and western regions with lower cost and enjoying regional preferential policies,
or transfer to neighboring countries and regions with cost advantage and preferential
policy.
3. With industrial structural adjustment in China, the international
investment competition confronting China may be further intensified. On one
hand, China is still a large country of labour-intensive manufacturing, low added
value processing and manufacturing industries will be still one of the main areas of
foreign investment within a short and medium term, while some neighboring
countries and other emerging economies with similar element endowment and
industrial structure with China will become China’s rivals for investment absorption
in labour-intensive processing and manufacturing fields. On the other hand, major
developing economies have successively put forward in their strategies for economic
development that they should reinvigorate manufacturing industry, and vigorously
develop new energy, energy conservation and environmental protection, high-end
manufacturing, strategic emerging industry. Therefore China is confronted with
intensive international competition in terms of attracting foreign investment in these
94
high value-added industries.
4. With the further improvement and maturing of China’s market
mechanism, various “super national treatments” that foreign-funded enterprises
enjoy will end or have already ended, which raise higher requirements on
foreign-funded enterprises. At the beginning of opening-up, due to lack of both
technology and fund, China adopted taxation preferential policies for foreign-funded
enterprises; as a result, China became a hot destination for foreign investors,
foreign-funded enterprises pursuing profit won tremendous profit in China, and
foreign investment also became an important aid for the economic development in
China. However, under the intense competition of preferential policies of various
places, some foreign-funded projects attracted were actually transferring
environmental and resource pressures to China. Behind the foreign investment heat is
hidden the trouble of constant extensive growth of economy. Besides, unfair market
competition has also seriously damaged fair market environment, and it is imperative
to eliminate “super national treatment”. In March 2007, the Corporate Income Tax
Law of the People’s Republic of China was formally promulgated, and the income tax
of domestic enterprises and foreign-funded enterprises is combined, which became a
symbol for equal competition of domestic enterprises and foreign-funded enterprises,
signifying that China’s economic restructuring path is irreversible and also that China
is shifting from the pursuit of quantity to the pursuit of quality in terms of foreign
investment absorption. With China’s established policy of welcoming foreign
investment and attracting foreign investment, the development direction of foreign
investment in China will surely change.
2.7 Main Conclusion and Policy Suggestions
2.7.1 Main Conclusion
1. Over three decades since the start of foreign investment absorption, the inflow
of foreign capital has made positive contribution to China’s environment and
development, particularly to environmental management and environmental
technology.
2. Absorbing industries with high risk of pollution has also confronted China’s
environmental development with more green challenges. Compared with countries
with similar economic development conditions such as India and Brazil, we discover
that absorbing different types of foreign investment leads to different effect of green
development. China, which has absorbed more traditional manufacturing industry,
95
while becoming the “world factory”, is also confronted with more serious
environmental challenges.
3. China has become an important destination of absorbing transnational
corporations. Some advanced ideas of transnational corporations have further
improved the environmental protection awareness of Chinese society and public and
promoted the society’s extensive concern with and involvement in environmental
issues; and introduced corporate social/environmental responsibilities into China.
However, as there is still a gap between Chinese domestic standard and high standard
of developed countries, transnational corporations still fail to be truly consistent or
treat equally without discrimination in China, as compared with their international
environmental responsibility (mainly according to the comparison of transnational
corporations’ corporate social responsibility reports in different regions).
4. The uneven distribution of foreign investment in industries and regions has
increased the difficulty of pollution governance. The environmental advantage of
foreign investment in sensitive industries is weakened. Take the chemical industry for
example. In the recent five years, the pollution of foreign investment has been
increasing, and continuous increase of foreign investment in chemical industry, to
some extent, does not meet China’s environment and development policy orientation
of “energy conservation, emission reduction and green development”.
5. Foreign investment will continue to be an important driving force of Chinese
economy, but we should not blindly overestimate the influence of foreign investment
on Chinese enterprises. In fact, FDI cannot truly foster domestic enterprises, and the
reinvigoration of national industries in China must rely on longer-term our own efforts.
Foreign investment should provide important support for preventing the constant
inflow of backward technology and optimizing economic growth structure.
6. Voluntary environmental management measure, as a brand new environmental
management method, is still at the starting period in China. Foreign investment’s rich
experience and “spillover effect” can be used to effectively promote the development
and progress of voluntary environmental management measures in China.
2.7.2 Policy Suggestions
1. Supplement and improve details relating to foreign investment’s
environmental behaviors in the Detailed Rules for Implementing the Law of the
People’s Republic of China on Chinese-Foreign Cooperative Joint Ventures, the
96
Regulations on Implementing the Law of the People’s Republic of China on
Chinese-Foreign Equity Joint Ventures and the Detailed Rules for Implementing
the Law of the People’s Republic of China on Foreign-Funded Enterprises, and
gradually improve the environmental law system relevant to foreign investment
Currently, in Chinese laws on foreign investment, no dedicated environmental
protection law on foreign investment has been established, and the constraints of
foreign investor’s environmental behaviors in China are scattered in investment laws.
Documents such as the Regulations on Guiding the Direction of Foreign Investment
and the Catalogue for the Guidance of Foreign Investment Industries only provide
directional guidance to foreign investment, without involving specific environmental
behaviors. Unsound legal system has left greater degree of freedom to environmental
behaviors of foreign investment. The difference of environmental standards between
China and the home countries of foreign investment have also resulted into the
inability to promote foreign-funded enterprises’ advanced technologies and ideas.
Therefore, China should, with reference to the environmental legislation experience of
developed countries, gradually establish measures for administrating foreign
investment’s environmental behaviors meeting international norms and national
conditions of China as soon as possible, supplement and improve details relevant to
foreign investment’s environmental behaviors on the basis of the Detailed Rules for
Implementing the Law of the People’s Republic of China on Chinese-Foreign
Cooperative Joint Ventures, the Regulations on Implementing the Law of the People’s
Republic of China on Chinese-Foreign Equity Joint Ventures and the Detailed Rules
for Implementing the Law of the People’s Republic of China on Foreign-Funded
Enterprises, and promulgate supporting detailed rules for implementation, to give
legal guidance for environmental behaviors of foreign-invested enterprises in China.
2. Launch the “Twelfth Five-Year Plan” for Utilizing Foreign Investment as soon
as possible, incorporates environmental behaviors of foreign investment into the
plan and promote China’s green shift
The “Twelfth Five-Year Plan” has clearly proposed the strategic direction and
requirements for green development: in face of the intensifying resource and
environment constraints, China must enhance crisis awareness, establish the green and
low carbon development concept, focusing on energy conservation and emission
reduction, improve the incentive and constraint mechanism, accelerate the
construction of energy conserving and environmentally friendly production methods
and consumption modes, strengthen the ability of sustainable development and
improve the level of ecological civilization. As an important force for promoting
97
economic growth in China, foreign investment has made outstanding contribution to
promoting economic growth in China. However, as mostly the primary industrial
chain is involved and management demonstration is better than technological
dissemination, if “further restructuring” is not realized in the course of attracting FDI,
such kind of investment absorption itself cannot be sustained. It may be said that at
present stage, China’s shift to green economy is more important than growth, and also
more crucial to China’s future development.
Therefore, the government should formulate the “Twelfth Five-Year Plan” for
Utilizing Foreign Investment as soon as possible, incorporate the sustainable
development of foreign investment into the plan as an important content, and
determine the guiding thoughts, strategic goals, key tasks and corresponding policies
and measures through planning. In the meanwhile, the government should further
open up the field of high technology, encourage foreign investment to transfer to
high-tech industries, and strictly restrict “high energy consumption, high pollution and
resource exporting” and low level and excessive production capacity expansion
projects. Only when the objective of promoting economic restructuring by foreign
investment is determined and investment quality is stressed that China will remain
invincible in the battle of economic structural adjustment.
3. Guide the direction of foreign investment flow, optimize industrial structure
and channel foreign investment to fields such as modern agriculture, high
technology, advanced manufacturing, energy conservation and environmental
protection, new energy, and modern service industries
Currently, steady and rapid development is maintained for Chinese economy, and the
shift of development pattern and economic structural adjustment are entering a critical
period. In October 2010, the State Council launched the Decision on Accelerating the
Fostering and Development of Strategic Emerging Industries, clearly determining that
package policies would be launched in terms of finance and taxation to accelerate the
fostering and development of strategic emerging industries, on the basis of major
technological breakthroughs and major development demands, promote in-depth
integration of emerging technologies and emerging industries, and on the basis of
continuing to strengthen and expand the high-tech industry, foster and develop
strategic emerging industries into leading and mainstay industries.
In the course of introducing foreign investment, China should highlight the major
objective of accelerating the shift of economic development pattern, promote foreign
investment development to shift from stressing scale and speed to stressing quality
98
and efficiency, and guide foreign investment to invest more in fields such as modern
agriculture, high technology, advanced manufacturing, energy conservation and
environmental protection, new energy and modern service industry. At the same time,
the country should encourage foreign investment to participate in the restructuring of
traditional industries, encourage and support foreign investment to restructure
traditional industries such as automobile and machinery manufacturing with high
technology and applicable advanced technology, and establish competitive market
structure in the link of investment introduction, so as to promote foreign investment to
accelerate the transfer of core technology and actively promote product upgrading.
Furthermore, it should guide foreign investment policy to combine with the objective
of coordinated development of regional economy, and make full use of regional
development strategies such as Great Development of Western Region to encourage
foreign investment in central and western regions and guide clean, low carbon and
green foreign investment to central and western regions.
4. Gradually eliminate the “super national treatment” of foreign-funded
enterprises, and create a fair market competition environment to complete the
shift of foreign investment policy from quantity to quality
While launching encouraging policies, China should restrict the shift of foreign
investment to general manufacturing and heavy chemical industry. “Super national
treatment” for labour intensive industries such as textiles and garment, and household
electrical appliance such as colour TV, washing machine, cell phone and telephone
and general telecommunication equipment industries. While creating a fair market
competition environment, it should launch supporting measures to strictly restrict
foreign investment in industries whose domestic production capacity is already
excessive. For heavy chemical industry rapidly shifting to China by foreign
investment, it should pay attention to resource conservation and environmental
protection of such industries, raise the access threshold for foreign investment to enter
such industries as appropriate, and restrict the inflow of funds to such industries.
5. Formulate the Policy Guidelines for Encouraging Foreign Direct Investment in
Green Technologies, and use policies such as taxation ad soft loans to promote
the introduction of truly advanced green technologies
The international financial crisis has made the issue of China’s shift of economic
development pattern more prominent. In the course of promoting adjustment of
industrial structure, the country must realize that vigorous development of green
technologies is the only way out for resolving the resource and environmental
99
constraints in economic and social development of China. Therefore, in the course of
investment introduction, it should, combining with documents such as the Catalogue
for the Guidance of Foreign Investment Industries, formulate the Policy Guideline for
Encouraging Foreign Direct Investment in Green Technologies, and by methods of tax
reduction and loan provision, encourage local governments and enterprises to
introduce international green technologies such as new energy technology, energy
conservation and environmental protection technology and circular economy
technology, to promote the upgrading of green technologies in China.
6. Introduce innovative and voluntary environmental management measures
(1) Further improve and strengthen the system and mechanism of
corporate environmental responsibility and introduce “international fair”
corporate environmental information disclosure
As a developing country, China’s environmental standard and environmental
responsibility system still have some gap from those of developed countries.
Foreign-funded enterprises, especially influential transnational corporations, have
richer experience in assumption of corporate environmental responsibility.
Compulsive introduction of environmental information disclosure system which is the
same with that of their home countries in the course of foreign investment in China
will not only play a powerful role of demonstration for Chinese enterprises but also
exert positive influence on the awakening of environmental awareness of Chinese
enterprises and conscious establishment of system and mechanism for corporate
environmental responsibility.
(2) Promote green supply chain and promote international green investment
In the course of investment introduction, China should give full play to enterprises’
initiative to promote development of green supply chain, and through opening up of
important links of industrial chain, avoid inadequate structural adjustment motive
resulting from simple reliance on technological innovation, and by promoting the
green shift of the complete industrial chain of the whole strategic emerging industries,
achieve the purpose of attracting international green investment and promoting the
green shift of the whole society.
100
Chapter 3 Environmental and Social Impacts of Chinese ODI
on Host Countries
The Chinese government started to promote ODI and cooperation in 1990s. With the rapid
growth of China’s outward direct investment (ODI), the country’s enterprises have
drawn more attention on the world stage. At present China holds USD 3.2 trillion in
reserves and reaches USD 4,000 in per capita GDP, which means that China has
entered the large-scale outward investment stage according to international investment
theory. At the same time, considerable environmental and social impacts of Chinese
enterprises’ investment on host countries have aroused more and more international
attention. With the increased awareness of environmental protection in host countries,
governance of natural resources and increased attention to corporate social
responsibility by the international community, China’s ODI needs to concern itself
with environmental issues and the potential social benefits to host countries. With the
increased awareness of environmental protection by host countries, continuous proper
utilization of natural resources by international community and the growing concern
about corporate social responsibility, Chinese ODI is faced with larger and larger
social and environmental pressure and needs to be more concerned with
environmental protection and social development needs of host countries. The
pressure is and also will be the largest challenge of sustainable development faced by
Chinese ODI, which demands urgent and in-depth discussion and research on
measures and policies.
This chapter analyzes and discusses how to treat China’s image, including perceptions
of its ODI by media and other parties; whether Chinese overseas enterprises only
comply with lower environmental standards in host countries; whether a large number
of medium-sized and small Chinese overseas enterprises pollute the local environment
of the host countries; and how well Chinese overseas enterprises have performed
vis-à-vis minimum wage standards, medical care, welfare measures, and local
employment.
3.1 The Current State of China’s ODI and Future Trends
3.1.1 Current State of China’s ODI
China experiences many diversified changes in the global economy and fast ODI
development. Table 1 shows the increase of Chinese ODI since 1990. Its growth
pattern in the new century is remarkable, especially since the “Go-Global” policy
proposed by Chinese government, which promotes the increase of ODI. China’s
volume of ODI increased from USD 33 to 230 billion during 2003–2009,
approximately a seven-fold increase. By the end of 2009, 12,000 domestic Chinese
investors had created 13,000 directly-invested enterprises in 177 countries around the
world, totaling USD 245.75 billion in investments. These were broken down into
USD 76.92 billion in equity investment (31.3% of the total), USD 81.62 billion in
reinvested earnings (33.2% of the total), and USD 87.21 billion in other types of
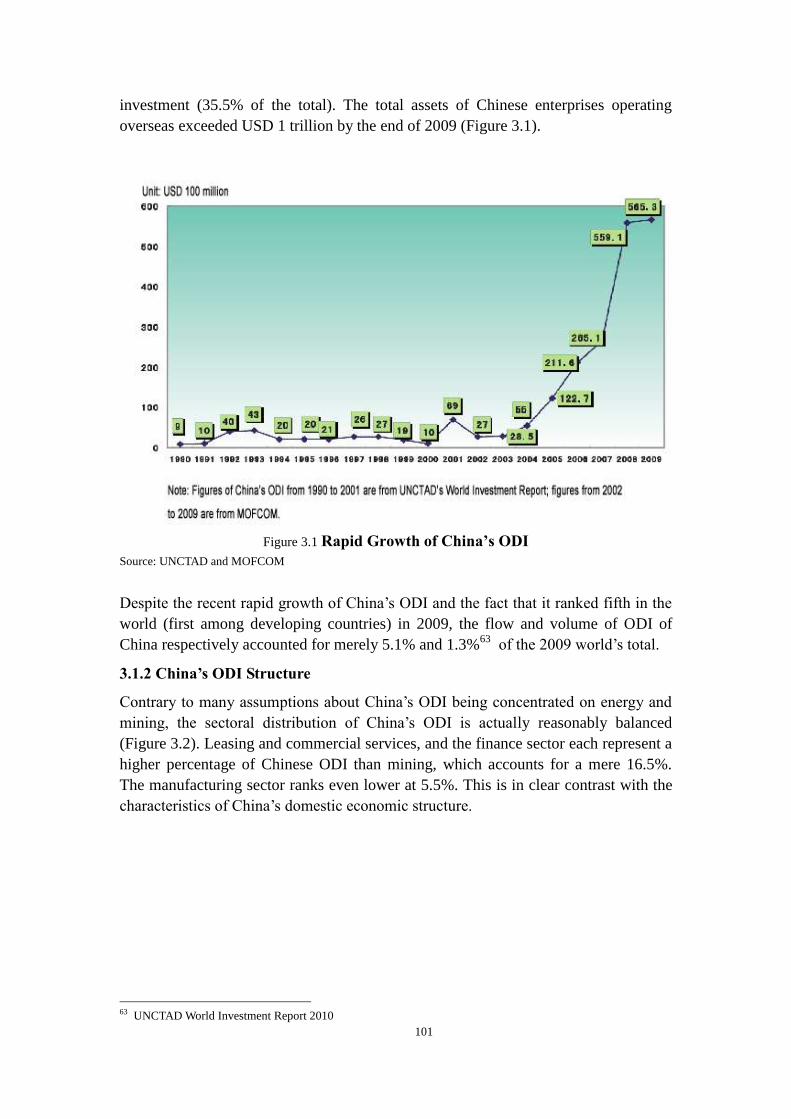
101
investment (35.5% of the total). The total assets of Chinese enterprises operating
overseas exceeded USD 1 trillion by the end of 2009 (Figure 3.1).
Figure 3.1 Rapid Growth of China’s ODI
Source: UNCTAD and MOFCOM
Despite the recent rapid growth of China’s ODI and the fact that it ranked fifth in the
world (first among developing countries) in 2009, the flow and volume of ODI of
China respectively accounted for merely 5.1% and 1.3%63
of the 2009 world’s total.
3.1.2 China’s ODI Structure
Contrary to many assumptions about China’s ODI being concentrated on energy and
mining, the sectoral distribution of China’s ODI is actually reasonably balanced
(Figure 3.2). Leasing and commercial services, and the finance sector each represent a
higher percentage of Chinese ODI than mining, which accounts for a mere 16.5%.
The manufacturing sector ranks even lower at 5.5%. This is in clear contrast with the
characteristics of China’s domestic economic structure.
63 UNCTAD World Investment Report 2010
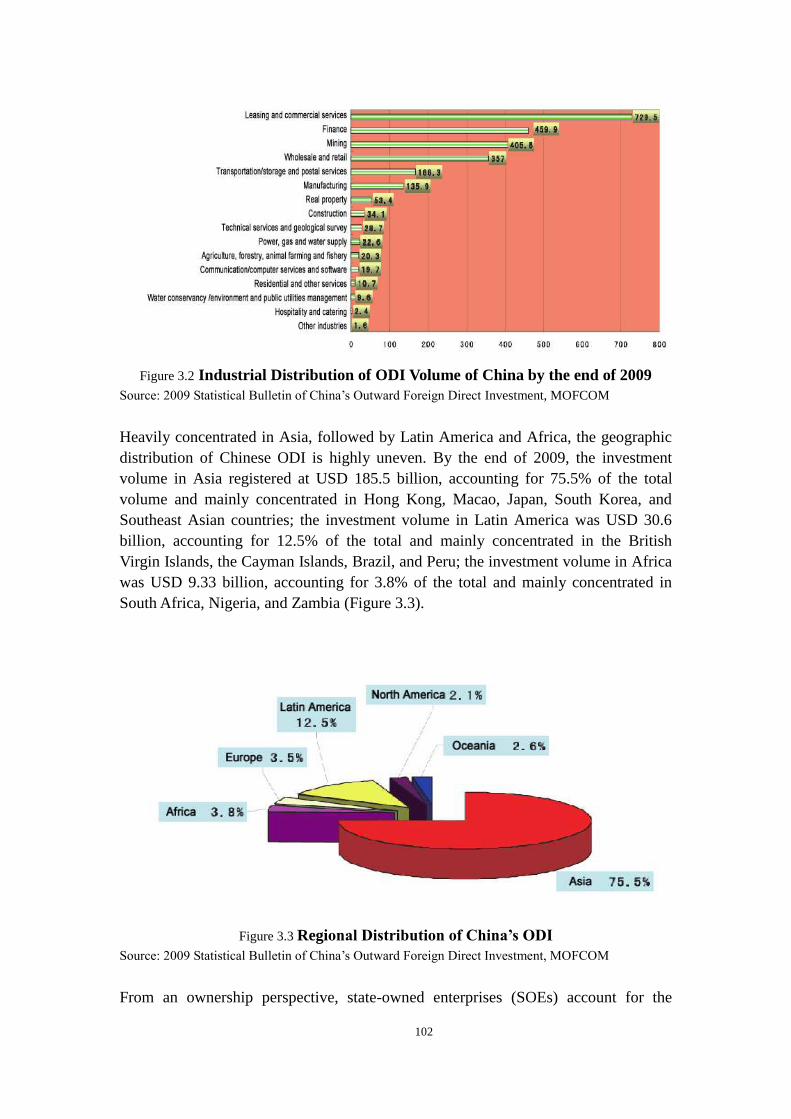
102
Figure 3.2 Industrial Distribution of ODI Volume of China by the end of 2009
Source: 2009 Statistical Bulletin of China’s Outward Foreign Direct Investment, MOFCOM
Heavily concentrated in Asia, followed by Latin America and Africa, the geographic
distribution of Chinese ODI is highly uneven. By the end of 2009, the investment
volume in Asia registered at USD 185.5 billion, accounting for 75.5% of the total
volume and mainly concentrated in Hong Kong, Macao, Japan, South Korea, and
Southeast Asian countries; the investment volume in Latin America was USD 30.6
billion, accounting for 12.5% of the total and mainly concentrated in the British
Virgin Islands, the Cayman Islands, Brazil, and Peru; the investment volume in Africa
was USD 9.33 billion, accounting for 3.8% of the total and mainly concentrated in
South Africa, Nigeria, and Zambia (Figure 3.3).
Figure 3.3 Regional Distribution of China’s ODI
Source: 2009 Statistical Bulletin of China’s Outward Foreign Direct Investment, MOFCOM
From an ownership perspective, state-owned enterprises (SOEs) account for the
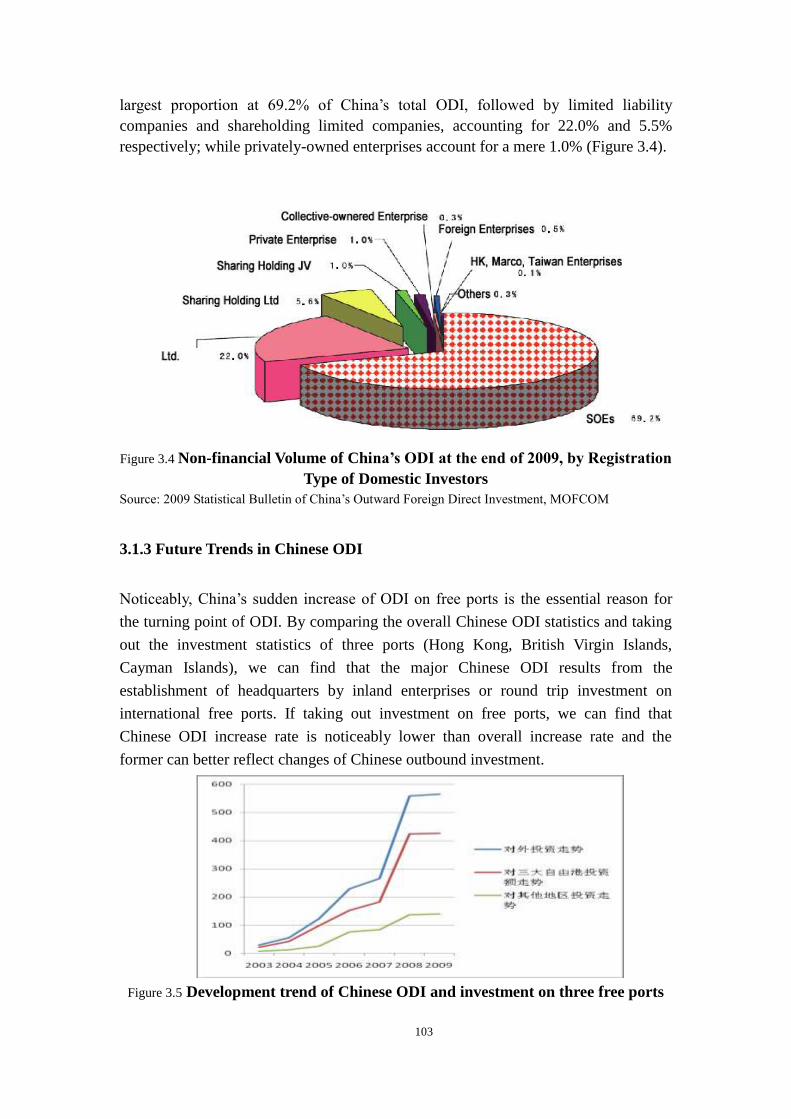
103
largest proportion at 69.2% of China’s total ODI, followed by limited liability
companies and shareholding limited companies, accounting for 22.0% and 5.5%
respectively; while privately-owned enterprises account for a mere 1.0% (Figure 3.4).
Figure 3.4 Non-financial Volume of China’s ODI at the end of 2009, by Registration
Type of Domestic Investors
Source: 2009 Statistical Bulletin of China’s Outward Foreign Direct Investment, MOFCOM
3.1.3 Future Trends in Chinese ODI
Noticeably, China’s sudden increase of ODI on free ports is the essential reason for
the turning point of ODI. By comparing the overall Chinese ODI statistics and taking
out the investment statistics of three ports (Hong Kong, British Virgin Islands,
Cayman Islands), we can find that the major Chinese ODI results from the
establishment of headquarters by inland enterprises or round trip investment on
international free ports. If taking out investment on free ports, we can find that
Chinese ODI increase rate is noticeably lower than overall increase rate and the
former can better reflect changes of Chinese outbound investment.
Figure 3.5 Development trend of Chinese ODI and investment on three free ports
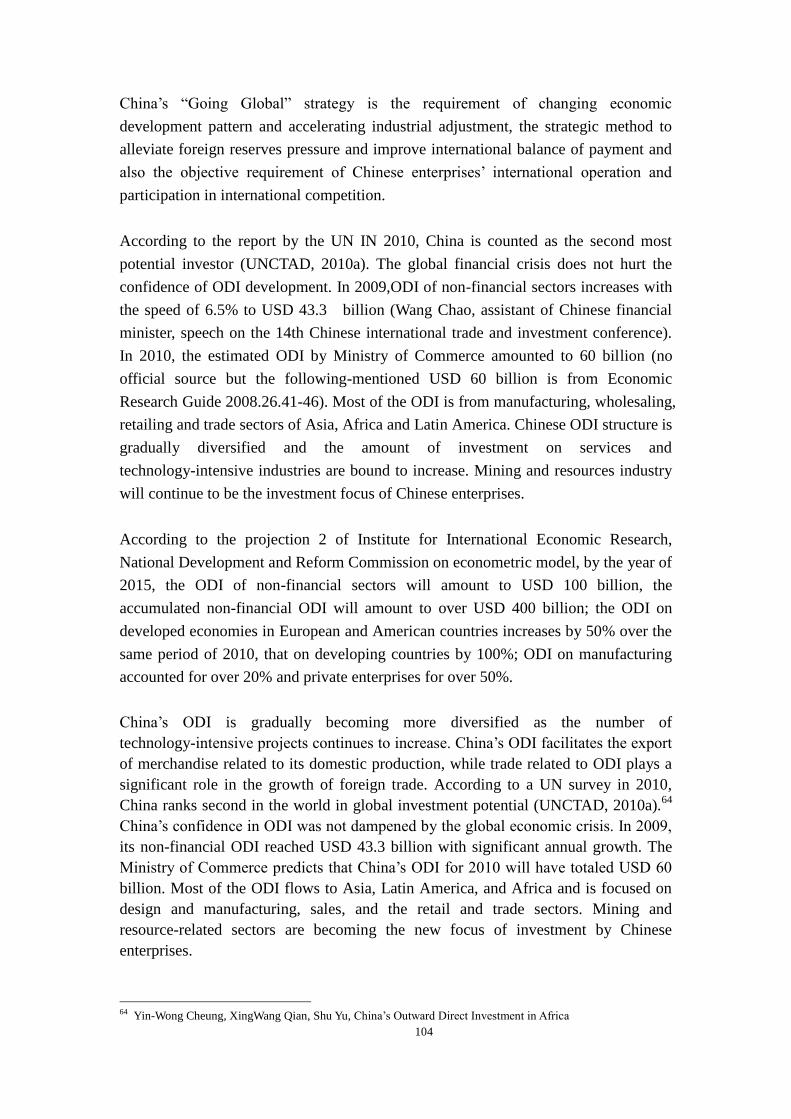
104
China’s “Going Global” strategy is the requirement of changing economic
development pattern and accelerating industrial adjustment, the strategic method to
alleviate foreign reserves pressure and improve international balance of payment and
also the objective requirement of Chinese enterprises’ international operation and
participation in international competition.
According to the report by the UN IN 2010, China is counted as the second most
potential investor (UNCTAD, 2010a). The global financial crisis does not hurt the
confidence of ODI development. In 2009,ODI of non-financial sectors increases with
the speed of 6.5% to USD 43.3 billion (Wang Chao, assistant of Chinese financial
minister, speech on the 14th Chinese international trade and investment conference).
In 2010, the estimated ODI by Ministry of Commerce amounted to 60 billion (no
official source but the following-mentioned USD 60 billion is from Economic
Research Guide 2008.26.41-46). Most of the ODI is from manufacturing, wholesaling,
retailing and trade sectors of Asia, Africa and Latin America. Chinese ODI structure is
gradually diversified and the amount of investment on services and
technology-intensive industries are bound to increase. Mining and resources industry
will continue to be the investment focus of Chinese enterprises.
According to the projection 2 of Institute for International Economic Research,
National Development and Reform Commission on econometric model, by the year of
2015, the ODI of non-financial sectors will amount to USD 100 billion, the
accumulated non-financial ODI will amount to over USD 400 billion; the ODI on
developed economies in European and American countries increases by 50% over the
same period of 2010, that on developing countries by 100%; ODI on manufacturing
accounted for over 20% and private enterprises for over 50%.
China’s ODI is gradually becoming more diversified as the number of
technology-intensive projects continues to increase. China’s ODI facilitates the export
of merchandise related to its domestic production, while trade related to ODI plays a
significant role in the growth of foreign trade. According to a UN survey in 2010,
China ranks second in the world in global investment potential (UNCTAD, 2010a).64
China’s confidence in ODI was not dampened by the global economic crisis. In 2009,
its non-financial ODI reached USD 43.3 billion with significant annual growth. The
Ministry of Commerce predicts that China’s ODI for 2010 will have totaled USD 60
billion. Most of the ODI flows to Asia, Latin America, and Africa and is focused on
design and manufacturing, sales, and the retail and trade sectors. Mining and
resource-related sectors are becoming the new focus of investment by Chinese
enterprises.
64 Yin-Wong Cheung, XingWang Qian, Shu Yu, China’s Outward Direct Investment in Africa
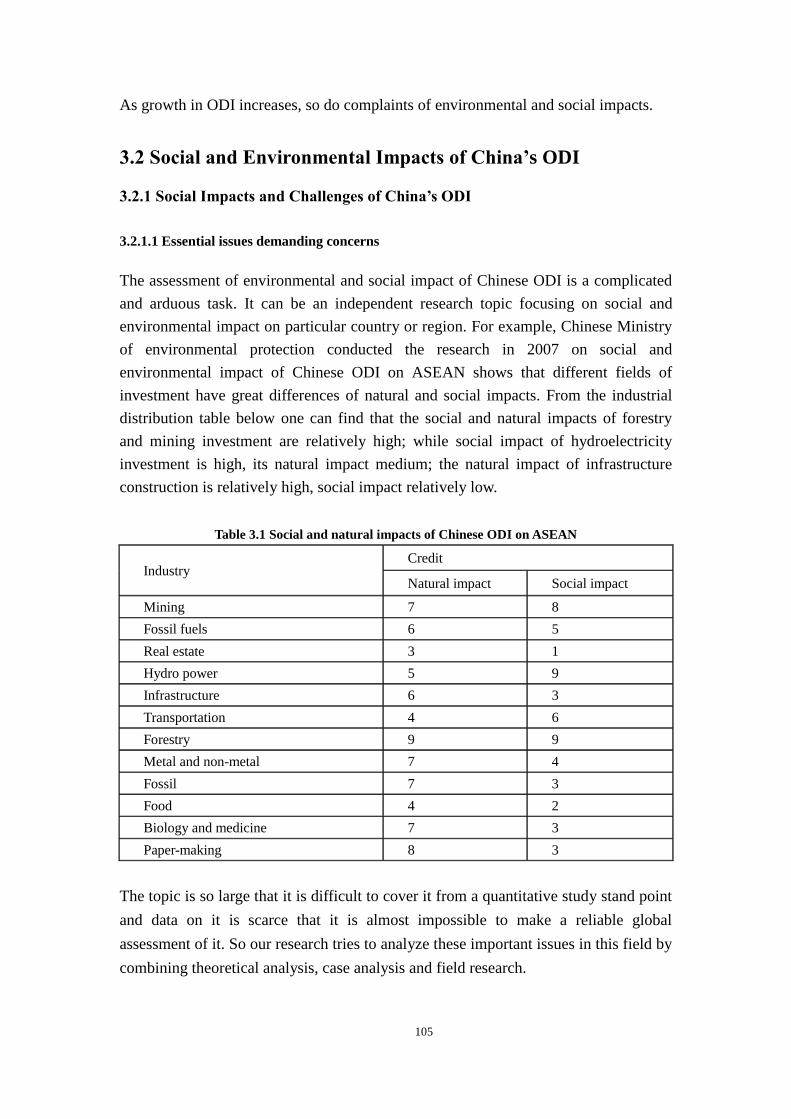
105
As growth in ODI increases, so do complaints of environmental and social impacts.
3.2 Social and Environmental Impacts of China’s ODI
3.2.1 Social Impacts and Challenges of China’s ODI
3.2.1.1 Essential issues demanding concerns
The assessment of environmental and social impact of Chinese ODI is a complicated
and arduous task. It can be an independent research topic focusing on social and
environmental impact on particular country or region. For example, Chinese Ministry
of environmental protection conducted the research in 2007 on social and
environmental impact of Chinese ODI on ASEAN shows that different fields of
investment have great differences of natural and social impacts. From the industrial
distribution table below one can find that the social and natural impacts of forestry
and mining investment are relatively high; while social impact of hydroelectricity
investment is high, its natural impact medium; the natural impact of infrastructure
construction is relatively high, social impact relatively low.
Table 3.1 Social and natural impacts of Chinese ODI on ASEAN
Industry Credit
Natural impact Social impact
Mining 7 8
Fossil fuels 6 5
Real estate 3 1
Hydro power 5 9
Infrastructure 6 3
Transportation 4 6
Forestry 9 9
Metal and non-metal 7 4
Fossil 7 3
Food 4 2
Biology and medicine 7 3
Paper-making 8 3
The topic is so large that it is difficult to cover it from a quantitative study stand point
and data on it is scarce that it is almost impossible to make a reliable global
assessment of it. So our research tries to analyze these important issues in this field by
combining theoretical analysis, case analysis and field research.
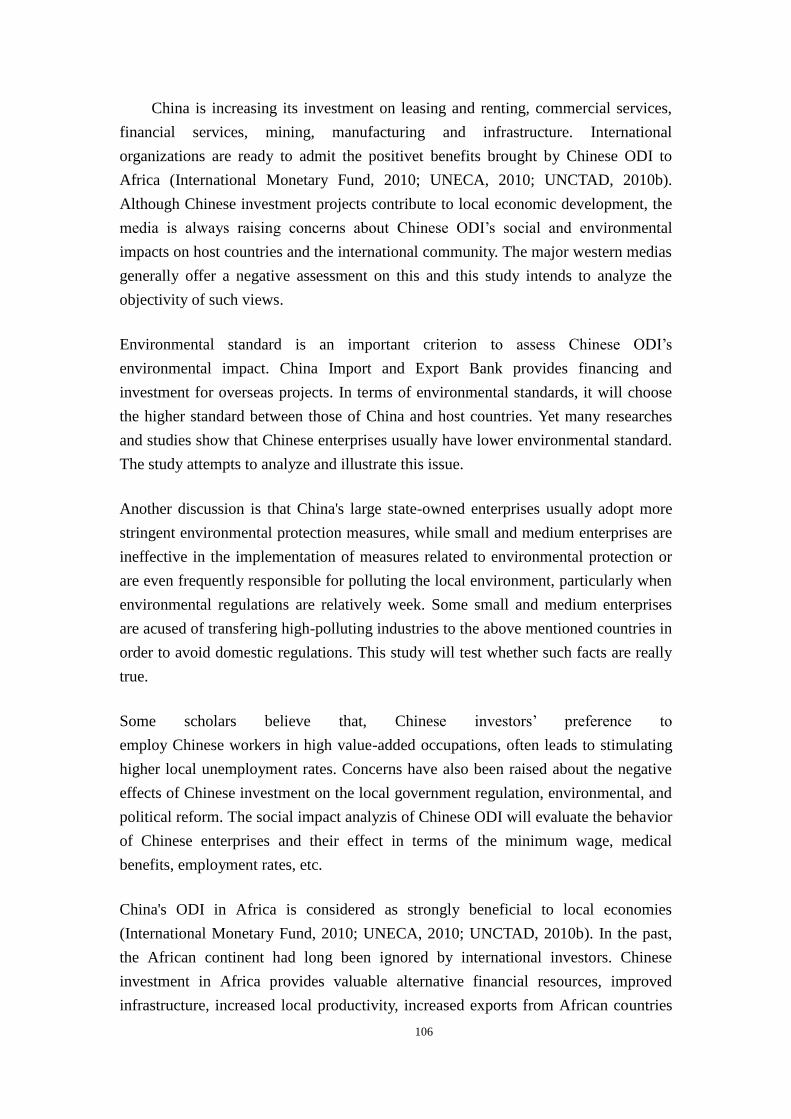
106
China is increasing its investment on leasing and renting, commercial services,
financial services, mining, manufacturing and infrastructure. International
organizations are ready to admit the positivet benefits brought by Chinese ODI to
Africa (International Monetary Fund, 2010; UNECA, 2010; UNCTAD, 2010b).
Although Chinese investment projects contribute to local economic development, the
media is always raising concerns about Chinese ODI’s social and environmental
impacts on host countries and the international community. The major western medias
generally offer a negative assessment on this and this study intends to analyze the
objectivity of such views.
Environmental standard is an important criterion to assess Chinese ODI’s
environmental impact. China Import and Export Bank provides financing and
investment for overseas projects. In terms of environmental standards, it will choose
the higher standard between those of China and host countries. Yet many researches
and studies show that Chinese enterprises usually have lower environmental standard.
The study attempts to analyze and illustrate this issue.
Another discussion is that China's large state-owned enterprises usually adopt more
stringent environmental protection measures, while small and medium enterprises are
ineffective in the implementation of measures related to environmental protection or
are even frequently responsible for polluting the local environment, particularly when
environmental regulations are relatively week. Some small and medium enterprises
are acused of transfering high-polluting industries to the above mentioned countries in
order to avoid domestic regulations. This study will test whether such facts are really
true.
Some scholars believe that, Chinese investors’ preference to
employ Chinese workers in high value-added occupations, often leads to stimulating
higher local unemployment rates. Concerns have also been raised about the negative
effects of Chinese investment on the local government regulation, environmental, and
political reform. The social impact analyzis of Chinese ODI will evaluate the behavior
of Chinese enterprises and their effect in terms of the minimum wage, medical
benefits, employment rates, etc.
China's ODI in Africa is considered as strongly beneficial to local economies
(International Monetary Fund, 2010; UNECA, 2010; UNCTAD, 2010b). In the past,
the African continent had long been ignored by international investors. Chinese
investment in Africa provides valuable alternative financial resources, improved
infrastructure, increased local productivity, increased exports from African countries
107
and improvement of people's living standards. China's African ODI contributes to
economic development and diversification in the manufacturing, mining, construction
and other areas of trade. It also creates a great number of jobs. Africa will become an
importa and typical case study for this area.
The study questionnaire showed that although 94% of respondents believed that
Chinese enterprises investing overseas promote local economic development, but 40%
of the people thought that Chinese enterprises caused problems, mainly ecological and
environmental deterioration and pollution, followed by reducing local employment
and slow development of local enterprise.
3.2.2 Social influence and major challenges concerning China’s foreign
investment
China’s ODI has created a large number of job opportunities for host countries,
but there is still room for improvement in the employment structure it provides.
In Cambodia and Vietnam, investment by the Chinese in manufacturing is
concentrated in labour-intensive manufacturing. In Cambodia, the 27 Chinese
manufacturers surveyed have a total of 26,439 employees, 98% of whom are
Cambodian. In Vietnam, the 33 Chinese enterprises surveyed have provided a total of
10,020 jobs, 95% of which are held by Vietnamese65
. The labour structure within an
enterprise may vary according to the level of technical intensity. In Cambodia, local
employees account for less than 30% of the intermediate and senior positions as most
of the senior executives are Chinese. This situation can be attributed to Chinese
investors’ belief that local candidates are lacking in skills and experience. Therefore,
the clothing industry and Asian enterprises have come to a consensus that Chinese
nationals should constitute a large proportion of supervisors. However,
communication difficulties and cultural differences between these Chinese nationals
and local Cambodian workers sometimes lead to labour unrest and strikes, and
Chinese supervisors cannot easily solve these problems. The case in Vietnam is the
opposite, as 63% of supervisory positions are held by Vietnamese. The major
difference between Chinese enterprises operating in Cambodia and Vietnam is the gap
of education level between these two countries. In Vietnam, Chinese enterprises
would rather employ Vietnamese than expensive overseas Chinese as executives as it
costs less for to train their Vietnamese employees for these executive positions.
Governments of many countries require Chinese enterprises to provide a certain
65
EU-China Civil Society Forum, The Impact of Chinese Outward Investment, Published on 2 March, 2011,
Viewed on 13 Oct, 2011:
http://www.eu-china.net/.../11-03-02_Impact%20of%20chinese%20outward%20investment.pdf
108
proportion of employment opportunities for local workers. For example, the host
country of the national stadium project in Costa Rica demanded that the project be
completed within one year and that no Chinese workers should be involved. (In the
end, only Chinese workers were employed and the stadium was finished in two
years).66
Many countries hoped that Chinese investment could create employment
opportunities for the country, but the quality of labour and labour productivity differ
from country to country, which often leads to failed expectations. Many countries ask
the Chinese investment enterprises to provide a certain percentage of local staff
employment but such demands are oftgen difficult to fulfill. Chinese investment in
India mainly focused on road construction, infrastructure and power plant
construction. However, inorder to increase employment rates for local residents, the
Indian government decided to restrict labour inflows, especially from China. New
immigration policies required that every Chinese employee with a work visa to return
to China after completing the work project. Chinese investors who are doing business
in mining and forestry in the Russian were required to hire local engineers and drivers.
But these people often cannot guarantee to work on time, because of frequent drinking.
Chinese investors had to employ Chinese workers to finish the work while they had
already employed Russian workers.
In terms of wage and social security, the host country and the international media
often complain about low wages of Chinese enterprises and inadequate social
protections. This research group found in Africa that the wages of Chinese invested
enterprises were quite variable depending on the industry and the region. In the
mining industry, the wage provided by Chinese invested enterprises was in some cases
higher than the host country's minimum wage, sucha as was seen in Zambia. The TF
found that the mining workers were firly satisfied about their wages in a private
conversation. At the same time, Chinese investors provided better health care systems
for the miners, in which the whole family of one worker could obtain medical
assistance. However, in the case of the textile industry in South Africa, both Chinese
investment enterprises and other countries’ investment enterprises provided wages
that were lower than the minimum wage in South Africa. This shows that the wage
levels of workers are closely related to industry profitability and industry wage levels,
and the wages of different country’s enterprises in the same industry can also be
different, but this difference is relatively limited, not substantially different.
The cultural challenges faced by Chinese enterprises pose a major barrier to
their development. Chinese enterprises investing overseas are faced with an
unknown environment featuring totally different commercial practices, not to mention
managerial, financial, and cultural rules that differ from those on China’s in green
field investment as well as mergers and acquisitions (M&A). For example, studies of
M&A of Chinese enterprises in Germany show that the most important factors in
66
Older Entry, Costa Rica Insight, viewed on October 13, 2011, http:// costaricainsights.wordpress.com/page/2/
109
managing overseas acquisitions are staff integration and narrowing the cultural gap
between Chinese investors and the corporate protocols in Germany67
. In order to
improve purchasing volume, SOEs need try to cater to their culture and know the
society, environment and legal supervision in the host country.
In Zambia, many of the local complaints from community and labour representatives
centered around misunderstandings and social disputes occurring between Chinese
and local people due to a lack of dialogue and cultural exchange. These seemingly
superficial crises often led to deep resentment, xenophobia and hysterical media
accounts that were based it would appear on misperception and a lack of
communication. In order to improve the performance of an acquisition, Chinese
enterprises must make a special effort to better integrate with their host community in
order to prevent and resolve cultural differences; and create links with the local
society, its stakeholders, its government and NGO representatives, as well as the
country’s environment, labour, and regulatory officials.
The performance of ODI may vary greatly depending on circumstances, and even
well-planned direct investment projects may be confronted with unexpected
difficulties due to differences in culture and management practices. For example, TCL
found itself in a very difficult situation after its acquisition of Alcatel in France due to
unexpected problems in managing local staff; Shougang Group was challenged by
strikes and conflicts between investors and labour in South America; Shanghai
Automobile Industrial Corporation (SAIC) also had similar experiences after its
acquisition of Ssangyong Automobile in South Korea in 2004 and failed in its
negotiation with the labour union on wages.
Likewise, during the TF field trip to Indonesia, the team visited the
Pertamina-Petrochina joint oil desulfurization unit in Bojonegoro, East Java. While
the company had serious accidents in the past, management was proud to show that it
had reduced its accident rate to zero since the arrival of the Chinese partner.
Nevertheless, they had suffered a lot of complaints from the field as Chinese drilling
rig equipment had no safety notices in either English or Bahasa Indonesia (Indonesia’s
official language). A small detail considering the size of the investment, but it led to
false allegations that the equipment was not safe and performed below par. The local
media amplified these issues creating the false image that Chinese drilling rigs were
of low quality and Petrochina’s drilling teams were not concerned with worker safety.
China’s ODI enterprises suffer from a lack of expertise, experience and
preparation. Poor confidence and inadequate experience in cross-border investment
in a strictly regulated environment with complicated market administration have
proven the lack of necessary expertise of Chinese enterprises. Examples include the
joint-venture of SAIC and Ssangyong Automobile in South Korea and the recycled
67
Kay, Li Kuen Andrew, International Exhibition Organizers in China and Their Performance, The Hong Kong
Polytechnic University, Published in June 2007, http://www.cpexhibition.com/introd/Kay%20DBA.pdf
110
steel plate project operated by Baosteel in Brazil. However, although increasing
globalization has exposed the limited expertise of Chinese enterprises in large-scale
Western-style acquisitions, many destinations of Chinese ODI—especially Africa and
Asia—still feature weak organizational structures, flawed intellectual property rights
protection, government intervention, and different corporate management systems.
Western multinationals are comfortable operating in stable markets with transparent
regulations, while their Chinese counterparts are better equipped to operate in more
complicated and unclear regulatory frameworks. This could be considered one of the
unique advantage’s that have helped China develop innovative and country specific
relationships with African countries. Its business expansion in that continent has
become a strong example of its “Going Global” strategy.
China is still suffering from the negative effects of its ambiguous definition of
property rights, a lack of a clearly defined regulatory mechanism for the private sector,
flawed corporate governance, and inadequate experience in international business.
Private enterprises in China are relatively weak in seizing ODI opportunities. Their
senior management need to be trained to enhance corporate governance in line with
international practices. In countries with mature institutional systems, the costs of
contracts and other legal supports are relatively low, making them effective in
building relationships, yet Chinese enterprises need more time to be adopting them.
Their global presence will inspire changes in Chinese enterprises, especially those
who have entered developed countries and compete in high-end product markets.
How should Chinese enterprises establish their own identity on a global scale,
designing suitable business models adapted to the realities of different countries while
enhancing corporate governance both at home and abroad? How should Chinese
enterprises improve the quality of their products and services as well as corporate
governance while competing for market share and developing an institutional system
in China? What modern governance system is suitable for the trajectory of
development in China? These questions will exert profound influence on the
development of Chinese enterprises in the foreseeable future.
3.2.3 Environmental Impacts and Major Challenges of China’s ODI
Environmental Impact on Forest and Biodiversity
Research into the environmental impacts of China’s ODI considers the exploitation of
natural resources and the degradation of biodiversity. For example, China’s
investments in Southeast Asia and Africa are concentrated in
environmentally-sensitive sectors (e.g., petroleum and gas extraction, mining,
hydropower, and forestry) and infrastructure projects (e.g., highways, railways,
electric-power and transmission lines). The Kunming-Bangkok Highway, an
important corridor for trade and investment and a facilitator of interaction between
China and Southeast Asian countries, is significant for economic prosperity and
111
development. However, environmentalists believe the highway has damaged local
biodiversity. A Chinese enterprise built a rubber plantation in the “Golden Triangle,”
to help Burma and Laos replace the cultivation of cash crops and illegal logging in an
opium-based economy, as the governments try to eradicate drug abuse and poverty.
However, similar allegations of local biodiversity damage have also been leveled
against the Chinese. There is clearly a need to study how to better assess those
projects.
China is the second largest importer of timber in the world. Chinese logging
companies have expanded around Southeast Asia, West Africa, and in the Amazon
region. Approximately one third of such imports is intended for processing and
re-export to G8 countries. Exports from Africa to China have been rising quickly, and
it is estimated that 70% of these exports are from Gabon and Equatorial Guinea.
Russia has also become an increasingly important source of timber to China. Illegal
logging and certification are of great concern to the international community68
.
During the TF visit to the East Kalimantan region of Indonesia, the team assessed the
impacts of China’s growing trade in coal and palm oil; China is Indonesia’s second
buyer of palm oil. Increasing demand for the oil, coal and the lucrative nature of the
international market, combined with weak public governance at the domestic level
promote illegal logging, deforestation, and the rapid conversion of forest land into
coal mining and palm oil plantations in Indonesia. This type of coal and palm-oil
operation has caused massive ecological damage and adverse social-economic
impacts to the region and to local communities. Yet, China is more interested in
importing the raw natural resources for domestic processing, while leaving the
responsibility of the upstream impacts of this business, such as illegal logging and
degraded forests, entirely in the hands of the host country
Challenges in Environmental Standards Compliance
A pre-project evaluation of environmental impact; the implementation of
environmental measures during a project; and environmental assessment after
completion are required for all projects funded or financed by the China
Export-Import Bank69
. China’s environmental standards are compared with those of
the host country, and the higher standards are adopted.
Research conducted by the CCICED team in Zambia found that the energy
consumption of copper production per MT in Luanshaya Copper Mines—in which
China Nonferrous Metal Mining (Group) Co. is investing—is 186 MTce with the
application of the most advanced technology and equipment from Australia. At the
68
Prof. Sun Siheng, State Forestry Administration, A Guide on Sustainable Management and Utilization of
Oversea Forest by Chinese Enterprises, Published on 8 September, 2010 69
China Intelligent Online, China Environmental Protection Industry Overview, Published on 2008, Viewed on
13 Oct, 2011, http://www.slideshare.net/chinaintel/china-environmental-protection-industry-report-2008
112
same time, the energy consumption of copper production per MTce is 260 MT of
standard coal equivalent at China-Yunnan Copper Co., Ltd. and Jiangxi Copper Co.,
Ltd. This case shows that environmental standards adopted by the enterprise in Africa
appear superior to the standards applied in China.
Many well-known Chinese enterprises, managing environmental concerns, have taken
the initiative to adopt ISO14000 environmental standards and the ISO26000 guiding
principles of social responsibility. However, problems in compliance with
environmental standards may exist with some medium-sized and smaller enterprises
(SMEs) due to their limited environmental awareness, economic strength or other
reasons. While some developing countries in Asia, Africa, and Latin America are
developing stronger environmental awareness, with environmental standards that are
increasingly aligned with the international mainstream, the environmental behavior of
Chinese SMEs still often lags behind such mainstream levels. Whether the companies
are large, medium, or small-sized, they are representing Chinese interests and respect
for the environment should be part of their way of doing business. This should be the
case regardless of whether or not the Chinese government provides foreign aid,
capacity development, or other assistance to the developing host country.
3.3 Related Roles Played by Major Stakeholders in Reducing the
Social and Environmental Impacts of ODI
3.3.1 China’s ODI Enterprises
When it comes to the adoption of modern social and environmental approaches to
their ODI activities, Chinese enterprises still appear to be 15–20 years behind their
western counterparts. This is perhaps due to the more active role of influential NGOs
in the west. At present, Chinese some enterprises are making a considerable effort to
invest in environmental enhancement and projects to advance social well-being, yet
there is a major gap in capacity and roles between state-owned and private enterprises.
Generally speaking, the social and environmental performance of large state-owned
enterprises is somewhat better. Considering that over 70% of Chinese ODI comes
from large state-owned enterprises and only 1% from medium- and small-sized
enterprises, it is easy to conclude that the overall environmental and social impact of
Chinese ODI is largely in the hands of the government.
In recent years, China has actively promoted policies that stress the adoption of social
and environmental commitments by FDI and ODI enterprises. For example, in 2007,
China’s import and export bank (EXIMBANK) promulgated the “Guiding opinions
on the environment and social evaluations of EXIMBANK loan projects.” That same
year, the China Banking Regulatory Commission printed and distributed “Opinions on
consolidating the corporate social responsibilities of the banking industry and
financial institutions,” requiring that large-scale banks abide by the 10 basic principles
113
of CSR advanced by the UN Global Compact. The Commission also asked these
banks to prepare CSR reports to articulate their activities. In 2007, the Ministry of
Environmental Protection, together with the People’s Bank of China and the China
Banking Regulatory Commission issued documents that established China’s Green
Credit Policy. The International Finance Corporation (IFC) Performance Standards
and the Equator Principles were identified as international guidance documents that
Chinese banks can refer to in their implementation of the Green Credit Policy.
In addition,in order to encourage the enterprises to engage in CSR activities, in
December 2007, the state-owned Assets Supervision and Administration Commission
of the State Council distributed the “Guiding opinions on the exercising of corporate
social responsibilities by state-owned enterprises,” and proposed that as Chinese
enterprises “go global,” they should help host countries modernize and implement
their environmental regulations. The international trend towards more environmental
considerations in international agreements is quite clear and China should be fully
engaged in contributing to its development.
3.3.2 Central and Local Governments of Host Countries: Sharing Responsibility
for Regulation and Enforcement
Chinese enterprises generally abide by the laws and regulations of the host countries
in which they invest, hence it is the central and local governments of the host
countries that should play the major role in regulation. A Canadian governmental
official, while analyzing the positive and negative impacts of China’s investment in
the mining sector of Canada, said that China-based overseas investors are beginning
to learn to abide by local laws and regulations with no apparent difference from other
industrialized countries70
. In the bidding efforts for investment in Rio Tinto in
February 2009, the president of Chinalco endorsed the sustainable development
pledge of Rio Tinto71
. In Indonesia, the local Regent of Bojonegoro, East Java, told
the TF team visiting Petrochina’s oil exploration operations that they were taking
voluntary actions in relocating schools and communities as well as financing mobile
libraries for the local populations (together with EXXON-Mobil) in order to spare
them from the pollution and dangers of living in close proximity to oil desulfurization
plants and crude oil production wells. These actions were very much appreciated and
widely recognized by the local communities.
On the other hand, there are reports of Chinese enterprises, especially small private
enterprises, turning a blind eye to environmental requirements or bribing local
70 Prof. Sun Siheng, State Forestry Administration, A Guide on Sustainable Management and Utilization of
Oversea Forest by Chinese Enterprises, Published on September 8, 2010 71 UNCTAD, World Investment Report 2009,Published in 2009, United Nation Publication, ISBN
978-92-1-112775-1, http://www.unctad.org/en/docs/wir2009_en.pdf
114
officials. An increasing number of NGOs and civil society organizations criticize
Chinese enterprises for failing to comply with local laws and regulations. The solution
requires, in part, the application of a transparent and accountable system to the public
in the host country and improvement in the administrative capacity of host
governments to enforce their laws and regulations.
3.3.3 Central and Local Governments of China: Sharing Responsibility for the
Environment
As China positions itself to become a major global player, central and local
governments are beginning to require Chinese enterprises to improve their
environmental performance and enhance their social contribution in an effort to
safeguard China’s image and promote sustainable global investment and business.
Progress in policy-making, legislation, and standardization in China is an important
driving force for Chinese enterprises to meet environmental and social goals. In
particular, the Chinese government requires enterprises to conduct clean production
auditing on a regular basis, which effectively improves their environmental
performance. And Chinese enterprises, state-owned and private, are actively engaged
in improving their governance and ameliorating their environmental and social
impacts at the urging of government. A positive example is that China’s Forestry
Administration issued A Guide on Sustainable Overseas Forests Management and
Utilization by Chinese Enterprises to provide guidance on investment and operations
of China’s ODI in host countries in consideration of sustainable development,
environmental protection, and CSR.
3.3.4 Non-Governmental Organizations
Non-governmental organizations may monitor ODI and ensure that these investments
will not exert negative impact on local environment and society. Of all Chinese ODI
activities, two major areas are of particular concern: natural resources, such as coal,
wood, petroleum, natural gas, etc.; and construction projects, such as building
highways, hydro-dams, water supply reservoirs, electric-power and distribution
systems, public housing, etc. Both types of investment have important social and
environmental impacts. Therefore, enterprises must exert the utmost diligence in
avoiding such impacts, compensate for any damage by restoring and rehabilitating
damaged sites, and offer additional compensatory facilities such as new schools and
hospitals that can somewhat mitigate impacts. These proactive steps in a “going
global” project are likely to be acknowledged by the beneficiaries of such investments
and lead to a more positive perception of China by the residents of the host country.
Local stakeholder organizations and international NGOs may play a role monitoring
such actions and controlling malevolent or corrupt and defamatory media campaigns
against Chinese interests.
3.3.5 Media
The strong and committed environmental governance efforts of some Chinese
enterprises involved in ODI projects have produced quite visible positive results as
115
Chinese enterprises assume greater CSR initiatives. For example, the China
International Marine Containers (Group) Ltd. has adopted the UN Global Compact
Environment Statement; China National Petroleum, Sinopec, and CNOOC have
adopted a series of rigorous environmental protection standards; and the Industrial
Bank of China has become the first Chinese bank to adopt the Equator Principles. Yet
international media tend to focus mostly on criticizing the environmental performance
of China’s outward investments, which raises suspicions about the country’s strategy
of “going global.” Furthermore, there is little coverage about Chinese ODI in the
Chinese media, and even less coverage about the environmental and social impacts of
such investments. An improved Chinese media focus on the efforts made by Chinese
enterprises to minimize their negative environmental impacts will help create a more
accurate image of Chinese ODI and help reduce the negative perceptions transmitted
by the international media.
3.4 Examples of the Positive Contributions of Chinese ODI
3.4.1 China’s ODI in the Natural Resource Sector
The investment by Chinese state-owned enterprises in the natural resource mining and
petroleum sectors of some South American countries has had significant impacts on
local societies, economies, and their environment. At first, those impacts tended to be
negative, but as the firms adjusted their CSR strategies and policies, positive impacts
began to gradually manifest themselves. Andes Petroleum Ecuador Ltd., a joint
venture of CNPC and SINOPEC, for instance, is a symbol of China’s cooperation
with the central government of Ecuador. The company plays an active role in the
alleviation of tensions between the local government and its residents. Shougang
Hierro Peru S.A.A. has also reversed its early negative impact on the social
development of the Peruvian community where it operates by deciding to adopt a
proactive approach to addressing local social issues it used to ignore.72
In Indonesia,
on the other hand, the TF team witnessed considerable environmental degradation
related to surface coal mining activities in East Kalimantan intended to supply
Chinese trade. Over 24% of imported coal in China in 2009 was from Indonesia, and
Kalimantan accounts for a majority of coal production in Indonesia. In 2005, East
Kalimantan’s share was 51.7% and South Kalimantan was 41.2%. Significant
production increases in recent years have occurred to supply the export market at
more than 75% of national coal production. Most of that goes to China, which is
blamed for the resulting environment damage to Indonesia.
3.4.2 China’s ODI in the New Energy Sector
China’s ODI enjoys great opportunity in the new energy sector. In Africa and
developing countries elsewhere, Chinese low-carbon technologies and products are
particularly competitive with advantages ranging from low costs, limited
infrastructure requirements, low emissions, and high economic returns. Compared
72 Julie Jiang & Jonathan Sinton, Oversea Investments by Chinese Oil Company, International Energy Agency,
Published in February, 2011, http://www.iea.org
116
with advanced technologies and products in western countries, Chinese companies are
better equipped to facilitate green development and the required economic shift in
developing countries. Installing a Chinese low-carbon solar water heater is one-third
the cost of installing an average water heater. Likewise the extensive palm oil
plantations being stimulated by China’s appetite for vegetable oils could also provide
a unique resource for renewable energy through biodiesel applications. The TF team
visited a small, privately-owned Chinese steam boiler and electric turbine producer on
the outskirts of Jakarta (ZUG POWER GROUP, PT. ZUG Industry Indonesia). The
firm was anxious to receive some form of incentive to produce small off-grid power
plants that would use their equipment and supply renewable energy to isolated
communities. The new energy resource sector will become an increasingly important
target for Chinese ODI.
3.4.3 China’s ODI in the Infrastructure Sector
The cost for Chinese enterprises to invest in the infrastructure sector is up to 50% less
than it is for their European and American competitors. At present, Chinese investors
are interested in water storage projects, especially hydro-dam construction projects in
Southeast Asia and the Middle East, including the Stung Cheay Areng Dam on Cheay
Areng River in Cambodia, the Shweili Dam Project in Myanmar, the Aswan Dam
Project in Egypt, and others. Although dams and water reservoirs will generate
agricultural benefits, they also create an impact on the local environment and society.
It should be noted that the investor and property owner of dam projects are usually the
host country governments rather than Chinese enterprises, which are mainly involved
in construction and finance. For those mid- and small-scale hydropower projects with
a capacity below 60 MW, Chinese investors are the key players as developed
countries have decided not to explore this market. As a result, Chinese project builders
are often the target of media and NGO criticism when in fact the responsibility for the
project is mostly in the hands of the host countries, and only very rarely in those of
the Chinese investors and contractors.
3.4.4 China’s ODI in the Forestry and Agriculture Sector
Old growth forest exploration causes loss of native forest-related biodiversity and
promotes the disappearance of local culture. A Chinese enterprise built agro-forestry
projects in the “Golden Triangle,” an area on the boundary between Thailand, Burma,
and Laos, to help replace the opium-based economy with cash crops and commercial
timber. This ODI project is killing two birds with one stone, as it aims to control the
drug flow into China while cracking down on drug abuse in the host country. There
are approximately 40 Chinese enterprises (including eight major rubber companies)
operating in Northern Laos under the guidance of anti-drug policies.
A positive management model in forestry will also promote the healthy development
of the forest ecological system. For instance, a Chinese enterprise in British Columbia,
Canada, has harvested mature and post-mature forests in compliance with the law
117
regarding reforestation, thereby meeting governmental standards73
. Managers of
Chinese enterprises have gradually grasped the complex nature of the forest
ecological system, and the activities of Chinese enterprises have also triggered
extensive interest among local residents in the forestry sector. Take another Chinese
enterprise in Russia for example. After purchasing the Far East Forest company in
Russia, it managed the firm’s logging activities through sustainable harvesting
methods which reduced the amount of waste wood logged annually; and recycled
low-value wood for sawdust and chips for pulp/paper making, thereby enhancing the
efficiency rate of the resources. Similarly, two Chinese enterprises have located their
headquarters respectively in Indonesia and Brazil and built overseas factories to
process wood into pulp. Lands for cultivation of the timber supplies are secondary,
low-return, and infertile forestlands where the wood coverage is below 20 m3 per acre.
These enterprises conscientiously fulfill their pledge to protect biodiversity in high
conservation value forests as in all typical forest ecosystems.
3.4.5 Field Trip Research in Indonesia, South Africa, and Zambia
In order to get first-hand information, the Task Force carried out field trips to
Indonesia, South Africa, and Zambia (see Annex 1 and 2 of this report for a detailed
and illustrated account of the separate field trips) . In general, China’s ODI seemed to
be greatly appreciated by local governments. It is also welcomed as China’s ODI is
also seen as an opportunity to help achieve local sustainable development targets.
Both the scope of trade and investment as well as its rapid pace of development has
accelerated greatly in recent years, placing new challenges before China’s ambitions.
If Chinese enterprises want to improve the performance of acquisition, China needs to
bridge the cultural difference and be familiar with social, environmental, legal and
regulatory system of host countries. 13
In Indonesia, China’s ODI enterprises have demonstrated some very good practices,
which have led to the construction of new schools, new housing developments,
hospitals, and road infrastructure. However, when compared with other ODI, China’s
investments are generally less well accepted than western investments. They often
rank lower than even Indian and Japanese investments. One of the reasons seemed to
be that Chinese investors rarely invest downstream into the markets when they are
exploring for minerals or oil & gaz, for instance. They will extract the resources and
ship them away. As an example, Indian investors, instead, are more inclined to invest
downstream building local fertilizer plants or LNG bottled gas distribution networks.
Indian investors integrate more into the economy and society. SMEs’ improper
practices are generally responsible for damaging the reputation of China’s ODI,
although certainly problems are not restricted to SMEs. The lack of communication
by some Chinese ODI enterprises, large and small, and their tendency to live in an
isolated way inside the host communities are further reasons why some have difficulty
in gaining acceptance and admiration. The case of Indonesia was somewhat different
73 Prof. Sun Siheng, State Forestry Administration, A Guide on Sustainable Management and Utilization of
Oversea Forest by Chinese Enterprises, Published on September 8, 2010
118
as the team observed many instances where Indonesians, Indonesian-Chinese and
Chinese overseas entrepreneurs share common cultural roots, cuisine, and living
habits, which did, in fact, facilitate dialogue.
In South Africa and Zambia, the image of China’s ODI also aroused some concerns.
The Task Force team visiting South Africa read about media stories denouncing the
behavior of “bad Chinese” investors. Indeed, it was later discovered that they were
Asians, but not Chinese. China is far away from Africa and so the lack of cultural
communication led to many misperceptions and caused needless stress. Most of
China’s ODI enterprises are state-owned enterprises running under a top-down
management system. While they do not develop sufficient connections with other
local powerful organizations, such as the labour unions, other stakeholder groups, or
NGOs, they pay greater attention to maintaining good and strong relations with local
government representatives. The lack of communication with these local community
and social organizations is one of the great hurdles faced by China’s ODI enterprises.
China’s ODI enterprises should be better equipped to overcome such hurdles before
going global. In one of the South African site visits of the TF delegation, the
highly-efficiency fully integrated PET recycling operation established by Chinese
investors (Sen Li Da) made important contributions to solidifying China’s positive
image with the local population as it helped create jobs and clean up the environment.
The environmental protection industry is expected to become a promising area for
Chinese ODI.
3.5 Policy intention
Chinese foreign investment will not only help to meet the goals of the Twelfth
Five-Year Plan, but it can also help boost green development and transformation in
host countries In fact it will be consistent with the development goals of the host
country, the Millennium Development Goals and other relevant international
sustainable development goals.
3.5.1 China should combine its “Going Global” strategy with the promotion of
social development in the host country while strengthening at the same time its
environmental protection.
In the implementation of the “Going Global” strategy, the expansion of foreign aid,
building of infrastructure, hospitals and schools all promote social development,
which has successfully formed a positive development model which in Asia, Africa
and Latin America has achieved a high degree of success. With China's growing
economic strength, the country will continue to promote the implementation of its
Going-Global strategy, which will require that it also gradually expand the scale of its
foreign aid. This is especially important for some developing countries where it will
be able to provide much needed social assistance and preferential loans, making
China's overseas investment not just a for profit business activity, but also a
contributor to promoting the host country's environmental protection and social
119
progress. Construction of special economic zones can also be used in a similar manner.
By applying the SAR methodology, China can build factories, help resettle workers,
reprocess SAR environmental pollutants, all of which is not only beneficial to the
urbanization process and social progress of host country, but helps build as well a
good working environment, conducive to reducing costs and risks of Chinese
enterprise’s ODI.
3.5.2 China should formulate more relevant policies and regulations that help
enterprises promote green oversea investment.
China is in urgent need of setting up regulations and guidelines for green foreign
investment, aid, loans, and establishing and adding policy guidelines and regulations
for the "Going Global" enterprises so that China's maintains a high degree of
consistency in its "green development" strategies. In particular, the central
government needs to establish regulations on environmental protection issues for
overseas investors, build up a more transparent, user friendly operating national
standard, as well as clear implementation procedures, methods of supervision and
public appeal systems. China should develop "measurable, reportable and
manageable" statistics and evaluation system while gradually establishing tighter
standards in cooperation with developed countries. The government needs to develop
environmental guidelines for foreign-invested enterprises, taking the environmental
impact assessment, protection agreements, compensation for ecological damage,
corporate social responsibility and other factors into the investment decision-making
and management processes. Such action should contribute to improve the "soft
power” of our country on the international stage,
New "corporate social responsibility guidelines" (CSR) should be established so that
China's own standards and internationally recognized corporate social responsibility
elements remain consistent. The guideline should emphasize the developing areas
with environmental, social and sustainable development not supervised by China, or
those whose regulatory levels are lower than the internationally recognized standards.
The guideline should encourage Chinese ODI to undertake environmental and social
responsibility, allign environmental and social issues in the country with those of the
country. Voluntary regulations making, active implementation of environmental and
social responsibility should be encouraged in the bankiong and financial services
areas, research and development, tax and fiscal policy, etc. Domestic departments
should punish Chinese enterprises which do not comply with corporate social
responsibility regulations and damage the image and reputation of overseas
companies. For example, in issuing permits and inspection qualifications to overseas
investment enterprises, the competent authorities should consider suspending or
revoking the license status of foreign investors,who do not apply and observe
corporate social responsibility rules.
Through the improvement of policies and regulations, the behavior of Chinese foreign
investors could be standardized, enabling Chinese enterprises to maintain corporate
120
social responsibility standards in the process of "going out". Enterprises should invest
and carry out production within the local laws, regulations and policies. Enterprises
should obey the local ecological environment protection laws and regulations,
especially in the exploration of resources, enterprises should take effective measures
to prevent impact on the local ecological environment; enterprises who implement the
"Going Global" strategy should negotiate with the government on the percentage of
local staff, and they should shoulder responsibilities while they contribute to the
development of the country.
3.5.3 Increasing transparency, strengthening PR, communication and cultural
exchange to improve international image
Overall, China's ODI has been welcomed warmly, but often because of lack of
communication and promotional investment behavior, it draws negative perceptions.
In particular the Western mainstream media's assessment of China's overseas
investment is rather negative. China's overseas investment policies and related
processes need to work on increasing transparency of their actions and efforts should
be made to facilate their understanding and appreciation by the international
community. During the overseas inspection, the group witnessed a number of overseas
Chinese companies taking positive action, but there is little public awareness of these
actions by the host country. For example, the China Nonferrous Metals Group copper
smelting business case in the Zambian Copper Belt region, near Kitwe, is a state of
the art modern industrial operation, established and managed with exemplary social
and environmental considerations, yet little is publicly known about it.
Openness and transparency will promote Chinese foreign investment enterprises to
develop good relationship with local stakeholders, businesses, community groups and
citizen representatives, and to help safeguard the interests of Chinese investors. If they
are properly run, these activities will not only ensure that foreign investment from
China is widely trusted in the host country, but also help China's overseas investments
get relative fair evaluations. Chinese overseas investment enterprises should integrate
themselves into the host society, be consistent with local stakeholders’ interests, and
improve the quality of products and services provided to the host country with special
emphasis on environmental protection and sustainable development. These actions
require fully-prepared investment managers, better implementation policies and better
communication and exchange of ideas.
Chinese overseas investment enterprises should be fully prepared for the "going
global" policies, and play active roles in green development in the host country. China
should encourage foreign investment to go in the direction of great development
potential and green investment with huge potential. It should systematically improve
communication, eliminate prejudice and discrimination. China could clearly play an
important role in the green transformation of the host country, especially in the case of
green transformation in developing countries. China should set up more channels to
121
obtain information and feedbacks on Chinese foreign trade and overseas investment.
It is necessary for the Chinese government to coordinate various departments, and
work with commercial, economic offices of their Embassies, together with
educational institutions, business associations and NGOs. The government should
collect overseas information, good and bad, and announce the results in a timely
fashion. China should learn from successful cases of other nations and absorb the
experience of other multinational enterprises in sustainable development.
China should jointly establish a new dialogue platform with host countries that will
help solve specific operational hurdles. The TF representatives who visited the three
foreign countries have put forward this demand quite strongly. The platform should be
independent and permanent. Its purpose is to facilitate exchange of information by
strengthtening exchanges between China and host countries and enhance mutual
understanding of issues that are commonly addressed by both, goals of China's
overseas investment behavior and its impact. This platform can be built in or out of
the traditional and formal international mechanisms (such as "China-Africa
Cooperation Forum" and "ASEAN plus China's multilateral cooperation platform")
and promote the barrier-free exchange between countries, help promote understanding
of people from all walks of life, enhance commercial exchanges and strengthen
communication ties in areas of the environment, education, social and cultural aspects.
People in the host country should have more opportunity to participate in such
dialogue
3.5.4 Establishing China’s oversea investment promotion organization and
evaluating system, helping government to better supervise oversea operating
activates of SOE of large scale and SME
China should learn from the successful experience of developed countries and
establish overseas investment promotion agencies. China should promote the
implementation of the “Going Global” strategy, at the same time assess its impact on
local environmental, social, economic and poverty impact, and develop international
training, seminars, information and data communication, public participation and
assistance programs. It can, for isntance, consider using corporate social responsibility
(CSR) performances to rate its overseas investment corporations. The establishment
of such a framework can benefit from the experience of the Ministry of Commerce,
the NDRC, SASAC, the Ministry of Environmental Protection, Bureau of Forestry
and the CBRC, to learn from their experience facing environmental and social
standards by overseas investment enterprises. The host country and China could
122
consider joint performance evaluation and rating of foreign-invested enterprises in
accordance with corporate social responsibility.
This information must be publicly available in the country and the host country. China
should provide more policy incentives to enterprises, which take more social
responsibility, such as tax breaks, preferential financing or customs clearance and so
on. The information should be shared in assessment by Ministry of Environmental
Protection, Customs, Industry and Commerce Bureau, Taxation, the CBRC, embassies
and consulates in China and the host countries’ reliable civil society groups. China
should try to carry out regulation and supervision from the "going global" state-owned
enterprises. Dialogue platform will also be able to encourage other national
governments to regulate and supervise investment enterprises. The Chinese
government should encourage Chinese investment in SMEs in the host country to
obtain legal status, and ensure they have a reasonable ability to operate in foreign
countries. Chinese government should require SMEs to register their business
activities in the local Chinese consulate or embassy upon arrival in the host country.
Their behaviors abroad must meet national requirements and should be easier to
supervise.
3.5.5 Promoting oversea investment enterprises to better exercise corporate
social responsibility
China needs to work together with the international community and businesses and
guide foreign investment to promote the green transformation on the basis of
non-discrimination. Chinese overseas investment should try to bear a relatively higher
standard of corporate social responsibility. If the host country of China's overseas
investment is a developing country, the ODI enterprise should at least abide by
relevant Chinese laws and regulations when the standard provided by local
environmental law is lower than international advanced levels. Domestic companies
with oversea business should take appropriate measures to protect the environment,
and shoulder more corporate social responsibility, in order to improve the quality of
overseas investment. Based on China's overseas investment goals and green
development, China should not only maintain its current growth patterns, but it must
also guarantee that its overseas enterprises assume and observe social responsibility
and environmental sustainability standards, which will benefit the people and the
economy of the host country. China's state-owned enterprises can play an active role
in this process.
Active use of market instruments to improve the compan’s management
environmental awareness and capacity.
123
As the main actors of China's foreign investment, enterprises should strengthen their
management’s awareness of environmental issues, improve management capacity,
focus on environmental behavior and the establishment of some demonstration
projects. Chinese enterprises should invest in the establishment of prevention system
to avoid adverse social and environmental impact, and not just depende on post-fact
remedial action. For this purpose, such entities as the Export-Import Bank,
Development Bank, China Investment Co. Ltd. and other Chinese policy financial
institutions should be strengthened in terms of CSR and environmenat;l awareness.
They should provide specific development assistance, to help develop credit,
micro-financing, and general hand-holding supposrt through the development of
strategic plans which must be spread thoughout their branch and gency networks.
Chinese and the international NGOs active in in China's foreign investment and
environmental protection, can play an active role in this green and CSR
transformation. The governmnet of China should encourage these organisation s to
particpate in the going global process.
The training of overseas investors must be intensidied in order to continue to
improve their control of the investment risk as well as the social and
environmental impacts of their actions.
To encourage enterprises to conduct overseas operations and to better fulfill corporate
social responsibility, governments and relevant organizations should provide training
for foreign-invested enterprises. Chinese enterprises should be prepared to increase
their awareness of the environmenatl issues at stake, improve their capacity to
preserve their own image, avoid risks, and shoulder corporate and social responsibility.
More importantly they should be encourages to make the necessary communication
and exchange of information, in order to identify and promote best practices of
Chinese enterprises overseas investment. Through these information-sharing activities
and capacity building processes, one can expand the reach of the going global and
green shift to a greater number of firms that just those planning to go overseas.
3.5.6. Establish a “sustainable development fund”
Permanent Flong term financial solutions must be created to help mitigate the
negative impact of the development and utilization of natural resources, especially
when these activities lead to the depletion of resources being explored. There are
many of such funds in operation at present, some of which provide the affected local
population with alternative development programs, while others set up savings
accounts for future generations to use once the resources are gone. Such funds can be
established by the host country, local communities and investors together. The Fund
124
will typically accumulate capital from royalties and should have a third party
management trust structure acting as an independent professional body to take
responsibility for the growth and preservation of the capital, which belongs to the
people of the host country. Some of the profits from the operations must be reserved
for site restoration, but that should not be confused with Sustainable Fund purposes,
which arr to offer alternative sources of living for the population once the resources
are exhausted. There are a number of successful cases in existence, which can serve as
reference models. They are, among others, the Norwegian Investment Fund for
developing countries (Norfund) or the Alaska Permanent Fund (APFC). In many cases,
these funds can help improve the image of the investors, because they adopt
transparent management metods, are profitable and comply with the wishes of the
community. The Fund's income and dividends are usually used to promote industrial
diversification and poverty reduction, provide housing and education, and improve
health care, environmental protection, green transformation and human and social
development in resources-developed areas of host countries. Chinese enterprises
committed to green investment and sustainable development, should voluntarily
propose to establish and operate "Sustainable Development Funds" that will help
promote the sustaionability of Chinese green ODI.
3.6 Conclusion
China’s investment process should not be based just on profits. It should also aim to
improve local employment rates, promote local sustainable development, and protect
the local environment while still respecting the host country’s cultural traditions and
social norms. Besides improving the quality of products and services exported, China
should pay more attention to job creation, enhancement of local benefits and
protection of the local environment, community, and wildlife. Some major Chinese
enterprises are very much aware of the environmental and social impacts on
investment destinations while some medium- and small-sized enterprises still fail to
address such issues due to lack of attention, limited resources, and poor capacity.
Thus based on case studies and on the literature available on China’s ODI, one
concludes that good and bad environmental and social performances co-exist in
China’s ODI. The reduction of negative environmental and social impacts of China’s
trade and investment must rely on joint efforts by China and its ODI host countries. It
is therefore important to enhance the sense of social responsibility of overseas
enterprises through education and training, and to design with the appropriate
authorities legitimate guiding principles for overseas environmental protection and
social responsibility so that sustainable development would be ensured in the
communities where Chinese ODI is absorbed.
125
Chapter 4 China’s Participation in the Formulation of
Relevant International Rules for Environmental Protection
4.1 Development of Relevant International Rules
The coordination of relations between investment, trade and the environment requires
not only the regulation of domestic policies but also guidance and mandate for
international coordination. Domestic policies and international rules are mutually
coordinative and complementary. Currently there exist multitudes of multilateral or
bilateral international rules in investment, trade and environmental fields, which play
the role of guidance and coordination of mutual relations.
International investment rules, represented by bilateral investment agreements as well
as international trade rules, represented by WTO and Free Trade Agreements (FTA),
are the major international rules for standardization and coordination of investment,
trade and environmental relations. Other international environmental rules
mechanisms are those such as the Montreal Protocol on Substances that Deplete the
Ozone Layer and the Kyoto Protocol on Climate Change. They exert much influence
on the scale and direction of investment or trade, which are beneficial or harmful to
the environment through limits on environmental capacity.
At present, relevant international rules are in a crucial period of development. In terms
of investment rules, the number of bilateral and regional investment agreements is
growing rapidly, while the multilateral investment rules are not yet in shape. In terms
of trade rules, the Development Round that the WTO initiated in 2001, identifies the
environmental issue as a core issue on the agenda. Yet no breakthrough has been made
in the negotiations. In terms of environmental rules, no agreement targeting at
long-term limitation on carbon emission has been achieved, while the first
commitment period of Kyoto Protocol is approaching its end. Therefore, from these
perspectives, the active participation of China is required for the development of
related international rules for a considerable period in the future. The sustainable
development of China as well as the world at large is closely related to the direction
of development of these international rules.
China has signed more than 50 international environmental conventions, covering
areas such as ozone protection, chemicals and hazardous waste, climate change,
biodiversity protection and nuclear and radiation safety. China has eliminated about
100,000 tons of output and 110,000 tons of consumption volume for consumption of
ozone substances, sharing 50% of that with all the developing countries. China
126
published the China Action Plan for Biodiversity Protection and established an area of
natural conservation zones being about 15% of its total land area; it also took the lead
in formulating the national implementation program for the Stockholm Convention
and completely eliminated nine types of pesticide POPs such as DDT; China also took
the lead, among the developing countries, in formulating the National Plan for
Response to Climate Change, making unremitting efforts to adequately respond to
climate change.
China is a major power in international trade and investment as well as an important
participant in the international rules making in relevant fields. As a major developing
country with rising global influence, China is no longer merely a rule-taker but
gradually becoming a rule-maker. In participating in the formulation of relevant
international rules, China must, on one hand, take the initiative in safeguarding its
own interests in economic development and environmental conservation, while on the
other hand contribute to improvement in global governance. The coordination of
interests between these two aspects has become a major challenge for China at
present. This is the core issue to be addressed in this chapter.
In recent years, China has been confronted with numerous investment and trade
disputes, which especially involve fields related to environmental protection. For
example, high anti-dumping taxes imposed by EU on China’s export of energy-saving
light bulbs, anti-subsidy investigation launched by the United States on the subsidy
for new energy development, lawsuits filed by EU and the United States on export
limits of charcoal export from China, etc. These disputes reflect the environmental
impact of China’s increasing focus on investment and trade as well as the need for
development of international rules in relevant fields to facilitate sustainable
development of China and the world at large.
This chapter aims at arriving at certain policy proposals based on the previous studies
through an overview of interests and responsibilities, opportunities and challenges of
China in relevant rule-making so as to help the Chinese government to balance the
relationship between investment and environment more successfully, which may
enable China to play a more active and creative role in relevant international
rule-making processes.
China also faces a growing number of trade disputes, with a substantial number
related to environmental protection. For example, the export of Chinese energy-saving
rights generated high anti-dumping duties levied by the EU74, and subsidies directed
74 Xinhua News: The Case of Chinese Exported Energy-saving Bulbs Reflects Conflicts of anti-dunmping policy
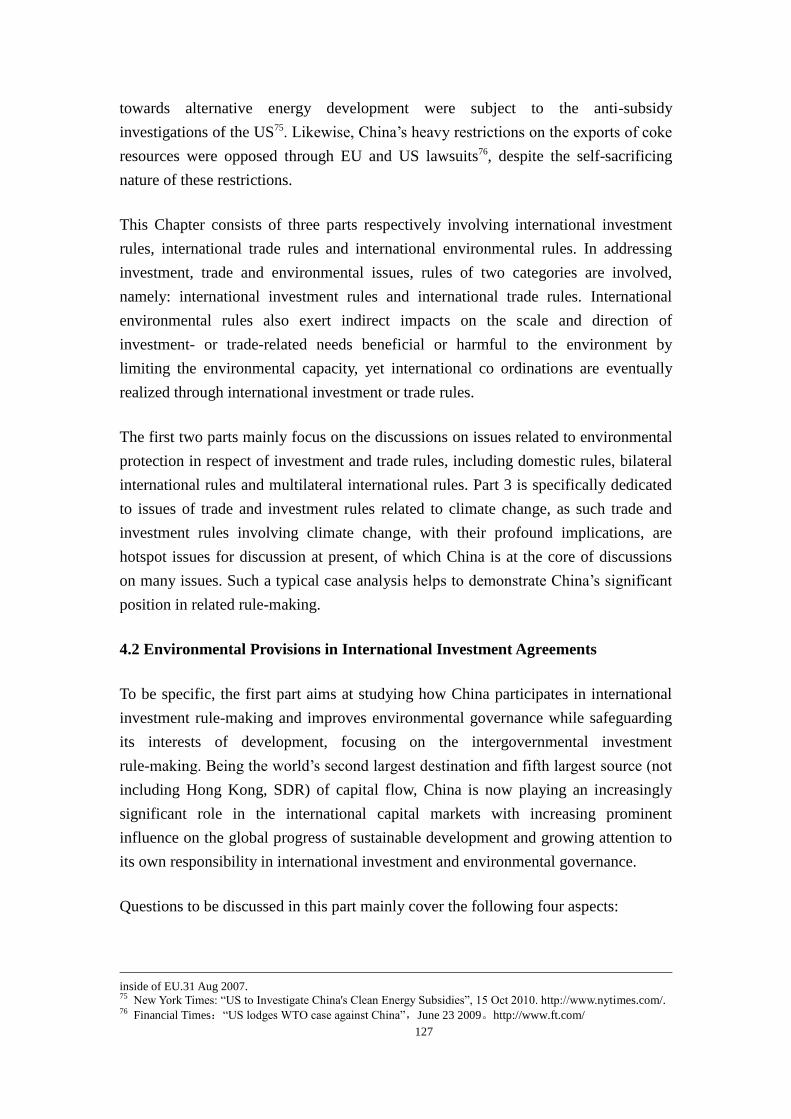
127
towards alternative energy development were subject to the anti-subsidy
investigations of the US75. Likewise, China’s heavy restrictions on the exports of coke
resources were opposed through EU and US lawsuits76, despite the self-sacrificing
nature of these restrictions.
This Chapter consists of three parts respectively involving international investment
rules, international trade rules and international environmental rules. In addressing
investment, trade and environmental issues, rules of two categories are involved,
namely: international investment rules and international trade rules. International
environmental rules also exert indirect impacts on the scale and direction of
investment- or trade-related needs beneficial or harmful to the environment by
limiting the environmental capacity, yet international co ordinations are eventually
realized through international investment or trade rules.
The first two parts mainly focus on the discussions on issues related to environmental
protection in respect of investment and trade rules, including domestic rules, bilateral
international rules and multilateral international rules. Part 3 is specifically dedicated
to issues of trade and investment rules related to climate change, as such trade and
investment rules involving climate change, with their profound implications, are
hotspot issues for discussion at present, of which China is at the core of discussions
on many issues. Such a typical case analysis helps to demonstrate China’s significant
position in related rule-making.
4.2 Environmental Provisions in International Investment Agreements
To be specific, the first part aims at studying how China participates in international
investment rule-making and improves environmental governance while safeguarding
its interests of development, focusing on the intergovernmental investment
rule-making. Being the world’s second largest destination and fifth largest source (not
including Hong Kong, SDR) of capital flow, China is now playing an increasingly
significant role in the international capital markets with increasing prominent
influence on the global progress of sustainable development and growing attention to
its own responsibility in international investment and environmental governance.
Questions to be discussed in this part mainly cover the following four aspects:
inside of EU.31 Aug 2007. 75 New York Times: “US to Investigate China's Clean Energy Subsidies”, 15 Oct 2010. http://www.nytimes.com/. 76 Financial Times:“US lodges WTO case against China”,June 23 2009。http://www.ft.com/
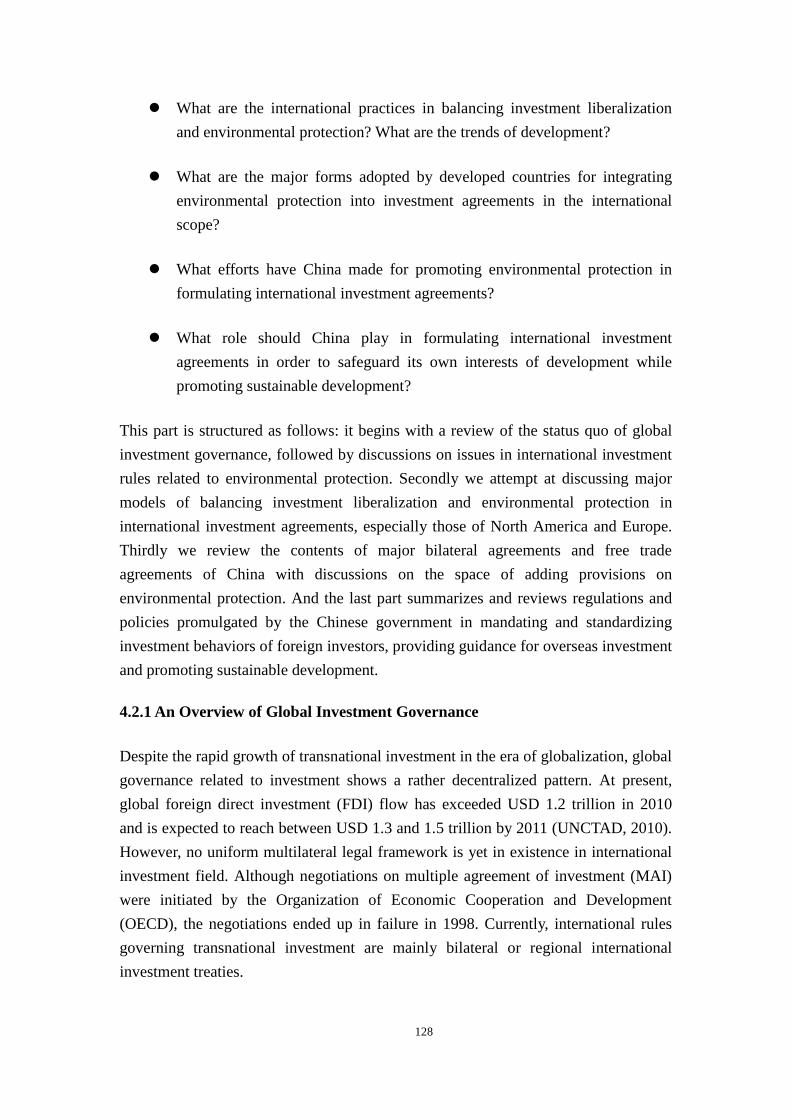
128
What are the international practices in balancing investment liberalization
and environmental protection? What are the trends of development?
What are the major forms adopted by developed countries for integrating
environmental protection into investment agreements in the international
scope?
What efforts have China made for promoting environmental protection in
formulating international investment agreements?
What role should China play in formulating international investment
agreements in order to safeguard its own interests of development while
promoting sustainable development?
This part is structured as follows: it begins with a review of the status quo of global
investment governance, followed by discussions on issues in international investment
rules related to environmental protection. Secondly we attempt at discussing major
models of balancing investment liberalization and environmental protection in
international investment agreements, especially those of North America and Europe.
Thirdly we review the contents of major bilateral agreements and free trade
agreements of China with discussions on the space of adding provisions on
environmental protection. And the last part summarizes and reviews regulations and
policies promulgated by the Chinese government in mandating and standardizing
investment behaviors of foreign investors, providing guidance for overseas investment
and promoting sustainable development.
4.2.1 An Overview of Global Investment Governance
Despite the rapid growth of transnational investment in the era of globalization, global
governance related to investment shows a rather decentralized pattern. At present,
global foreign direct investment (FDI) flow has exceeded USD 1.2 trillion in 2010
and is expected to reach between USD 1.3 and 1.5 trillion by 2011 (UNCTAD, 2010).
However, no uniform multilateral legal framework is yet in existence in international
investment field. Although negotiations on multiple agreement of investment (MAI)
were initiated by the Organization of Economic Cooperation and Development
(OECD), the negotiations ended up in failure in 1998. Currently, international rules
governing transnational investment are mainly bilateral or regional international
investment treaties.
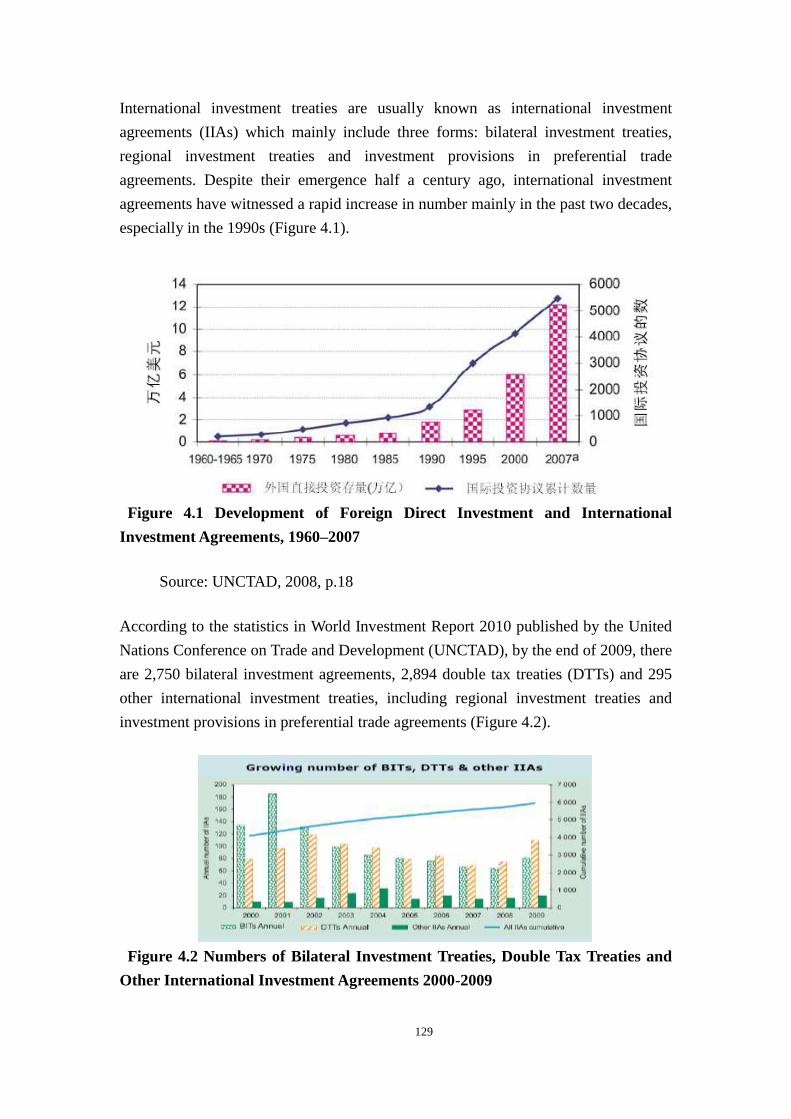
129
International investment treaties are usually known as international investment
agreements (IIAs) which mainly include three forms: bilateral investment treaties,
regional investment treaties and investment provisions in preferential trade
agreements. Despite their emergence half a century ago, international investment
agreements have witnessed a rapid increase in number mainly in the past two decades,
especially in the 1990s (Figure 4.1).
Figure 4.1 Development of Foreign Direct Investment and International
Investment Agreements, 1960–2007
Source: UNCTAD, 2008, p.18
According to the statistics in World Investment Report 2010 published by the United
Nations Conference on Trade and Development (UNCTAD), by the end of 2009, there
are 2,750 bilateral investment agreements, 2,894 double tax treaties (DTTs) and 295
other international investment treaties, including regional investment treaties and
investment provisions in preferential trade agreements (Figure 4.2).
Figure 4.2 Numbers of Bilateral Investment Treaties, Double Tax Treaties and
Other International Investment Agreements 2000-2009
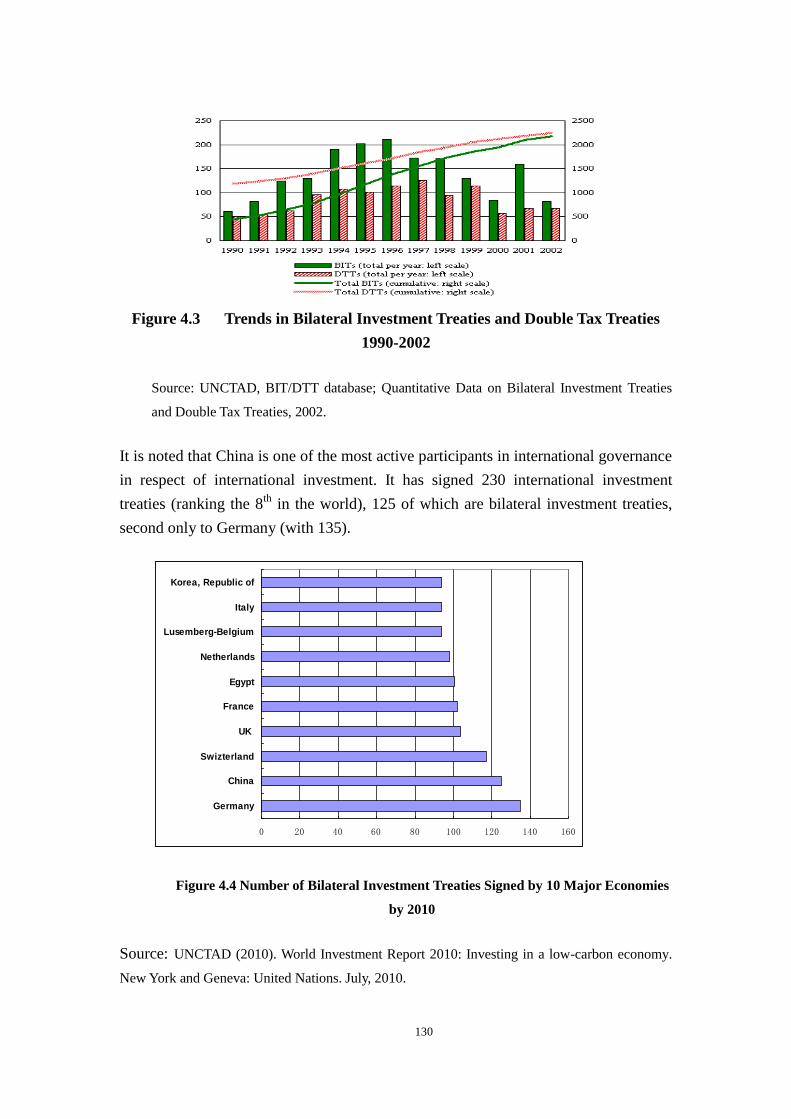
130
Figure 4.3 Trends in Bilateral Investment Treaties and Double Tax Treaties
1990-2002
Source: UNCTAD, BIT/DTT database; Quantitative Data on Bilateral Investment Treaties
and Double Tax Treaties, 2002.
It is noted that China is one of the most active participants in international governance
in respect of international investment. It has signed 230 international investment
treaties (ranking the 8th
in the world), 125 of which are bilateral investment treaties,
second only to Germany (with 135).
0 20 40 60 80 100 120 140 160
Germany
China
Swizterland
UK
France
Egypt
Netherlands
Lusemberg-Belgium
Italy
Korea, Republic of
Figure 4.4 Number of Bilateral Investment Treaties Signed by 10 Major Economies
by 2010
Source: UNCTAD (2010). World Investment Report 2010: Investing in a low-carbon economy.
New York and Geneva: United Nations. July, 2010.
131
Up to now, China has signed international investment treaties with most of the world’s
major economies, with the exception of only a small number of developed countries
such as the United States and Canada.
4.2.2 Environmental Provisions in International Investment Rules
The relationship between transnational investment and environment has always
attracted much attention from the very beginning. Especially in the past decade or so,
the integration of environmental provisions has become an important trend in
international investment treaties.
In 1976, OECD released Declaration on International Investment and Multinational
Enterprises as an annex of OECD Guidelines for Multinational Enterprises. In 1982,
Nairobi Declaration requires all multinational enterprises to take environmental
protection into consideration while using industrial means and technologies of
production and disseminating these technologies to other countries. Agenda 21 passed
on 1992 Rio Earth Summit requires all multinational enterprises to perform their
corporate social responsibility (CSR) and promote cleaner and more efficient means
of production, including waste reuse, recycling and minimizing. Three principles in
Global Compact released by the United Nations in 1999 involve environmental
responsibilities of multinational enterprises.
As these international treaties lack in executive and binding power, numerous
international investment treaties have emerged in recent years to alleviate the conflicts
between investment liberalization and environmental protection. In this sense, the
integration of environmental issues into international investment treaties is a new
trend.
First, Article 3 of Trade-Related Investment Measures (TRIMs) stipulates that all
exceptions under GATT 1994 shall apply, as appropriate, to the provisions of this
Agreement. This is very important as it indicates that exceptions under GATT 1994
also possess binding power for environmental issues emerging in international
investment.
Besides, a more crucial legal practice is based on North America Free Trade
Agreement (NAFTA) adopted in 1993. From then on, the three member states of
NAFTA have become active facilitators of integrating environmental terms into
bilateral investment treaties. Terms related to corporate social responsibility (CSR) in
IIAs started to emerge in the Introduction and Investment chapters of NAFTA in the
132
mid-1990s. This model of NAFTA is adopted later by other countries.
Third, in 1995, the Organization of Economic Cooperation and Development (OECD)
initiated negotiations on Multilateral Agreement on Investment, directly adopting
OECD Guidelines for Multinational Enterprises as its annex. According to the latest
updated version of OECD Guidelines for Multinational Enterprises, a specific chapter
on Environment is included, requiring multinational enterprise to establish and
maintain a system of environmental management appropriate to the enterprise (Article
1), provide information on the potential environment impacts of the activities of the
enterprise (Article 2), prepare an appropriate environmental impact assessment
(Article 3), take effective measures to prevent or minimize environmental damage
(Article 4), maintain contingency plans for accidents and emergencies and maintain
mechanisms for immediate reporting to the competent authorities (Article 5),
continually seek to improve corporate environmental performance (Article 6), provide
adequate education and training to workers in environmental health (Article 7) and
contribute to the development of environmentally meaningful and economically
efficient public policy (Article 8).
Similar language is adopted in recent agreements or integrated into BIT models of
other developed countries (such as Japan, Belgium, Finland, Holland and Sweden).
Recently, similar texts on the environment are included in investment treaties between
Japan and the Republic of Korea (2002) and Vietnam (2003) but not in the nine
treaties (between 1988 and 1998) signed at an earlier date (OECD, 2008).
Obviously, the practice of integrating language of environmental protection into
bilateral investment treaties (BITs) is initiated by certain developed countries such as
the United States. Such practice aims at preventing countries from attracting
international capital flow at the cost of environmental interests, which is especially
likely to happen in developing countries.
Generally speaking, models of integrating environmental provisions in FTA and
bilateral investment treaties mainly include: preface clauses, specific environmental
clauses, environmental exception and exemption clauses, dispute resolution clauses,
clauses on relations between effect of investment treaties and environmental treaties,
etc.
In concrete terms, North American countries and West European countries have
formed their respective models in respect of discussions on environmental protection
issues in bilateral investment treaties.
133
North American Model
As the world’s first free trade agreement signed between developed and developing
countries, the North American Free Trade Agreement (NAFTA) is also the first
intergovernmental agreement with environmental clauses integrated. The three
member states of NAFTA have thus become active initiators of integrating
environmental clauses in bilateral investment treaties.
As a supplement of NAFTA, North American Agreement on Environmental
Cooperation (NAAEC) has stipulated clear environmental obligations for the signing
parties, including exception clauses related to environmental issues, such as in Article
1106 on requirements for enforcement where Parties are explicated prohibited from
lowering environmental standards to attract foreign investment.
Since 1994, environmental clauses are included in the models of bilateral investment
treaties signed between Canada and the United States. Mexico has systematically
adopted similar clauses in treaties signed with Latin American and North American
countries (although European countries are not included).
On the other hand, the North American model of bilateral investment treaties has
taken environmental issues into consideration at an early date. In recent years, both
Canada and the United States have developed bilateral investment treaty texts with
clarification of the relations between environment and investment and environmental
rights and obligations of relevant signing parties.
For instance, bilateral investment treaties of Canada have specific stipulations in
environmental obligations:
Article 7, Requirements for Enforcement stipulates that “environmental
exception” must be permitted.
Article 11, Health, Safety and Environmental Measures stipulates that signing
parties are prohibited from lowering environmental standards to attract
investment.
Article 10, Special General Exception Clauses stipulates that signing parties
may adopt environmental policy measures provided that such measures do
not constitute arbitrary, unjustifiable or disguised discrimination of trade and
investment, which is similar with Article XX, General Agreement on Tariffs
134
and Trade, 1994, with implications that in order to satisfy certain
environmental objectives, contracting parties may deviate from obligation
requirements in investment treaties including national treatment principle,
most favored nation treatment principle, enforcement requirements,
collection regulations, etc.
Based on the study of bilateral investment treaties signed by the United States and
Canada, it is noted that environmental clauses are integrated in most bilateral
investment treaties signed with developing countries since 1994. As is shown in Table
1, requirements of environmental protection are included in the texts in 9 of the 50
BITs signed by the United States and in 9 of the 28 BITs signed by Canada since
1994.
Table 4.1 Bilateral Investment Agreements of the United States
and Canada Including Environmental Clauses
NAFTA Member States BITs Partners (And Years)
The United States Azerbaijan(2000); Bahrain(1999);
Croatia(1996); Salvador(1999);
Nicaragua(1995); Rwanda(2008);
Trinidad and Tobago(1994);
Uruguay(2005); Uzbekistan(1994 ).
Canada Croatia (1997); Czech Republic(2009);
Barbados(1996); Latvia(2009) ; Peru
(2006); Trinidad and Tobago (1995);
Romania(2009); Slovakia(2010);
Salvador(1999)。
Mexico Cuba (2001); Switzerland (1995)。
Source: UNCTAD Database and Task Force team statistics
Generally speaking, North American countries are active in integrating environmental
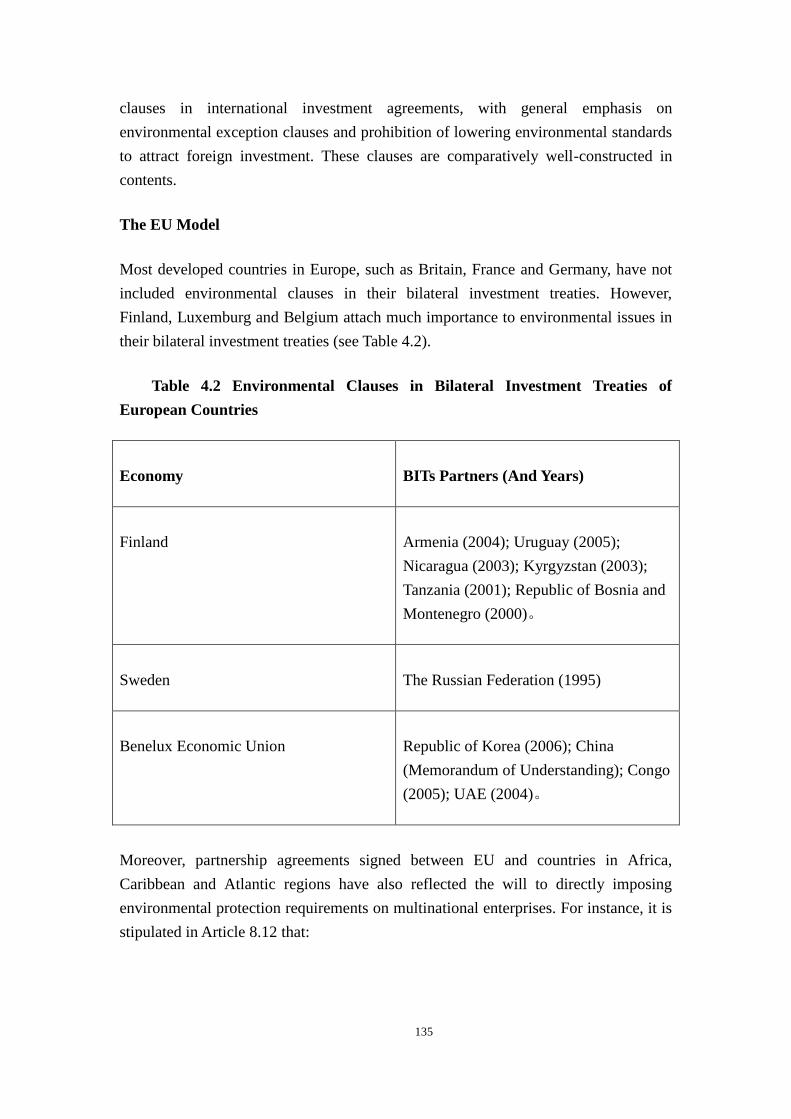
135
clauses in international investment agreements, with general emphasis on
environmental exception clauses and prohibition of lowering environmental standards
to attract foreign investment. These clauses are comparatively well-constructed in
contents.
The EU Model
Most developed countries in Europe, such as Britain, France and Germany, have not
included environmental clauses in their bilateral investment treaties. However,
Finland, Luxemburg and Belgium attach much importance to environmental issues in
their bilateral investment treaties (see Table 4.2).
Table 4.2 Environmental Clauses in Bilateral Investment Treaties of
European Countries
Economy BITs Partners (And Years)
Finland Armenia (2004); Uruguay (2005);
Nicaragua (2003); Kyrgyzstan (2003);
Tanzania (2001); Republic of Bosnia and
Montenegro (2000)。
Sweden The Russian Federation (1995)
Benelux Economic Union Republic of Korea (2006); China
(Memorandum of Understanding); Congo
(2005); UAE (2004)。
Moreover, partnership agreements signed between EU and countries in Africa,
Caribbean and Atlantic regions have also reflected the will to directly imposing
environmental protection requirements on multinational enterprises. For instance, it is
stipulated in Article 8.12 that:
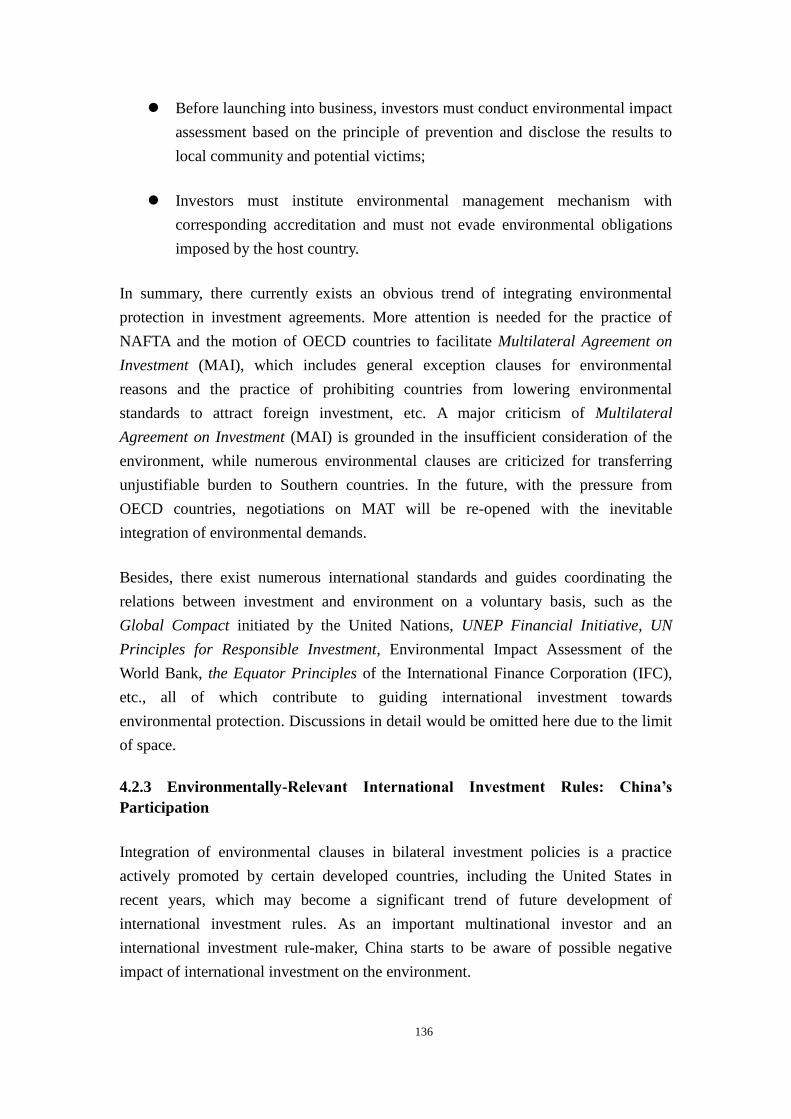
136
Before launching into business, investors must conduct environmental impact
assessment based on the principle of prevention and disclose the results to
local community and potential victims;
Investors must institute environmental management mechanism with
corresponding accreditation and must not evade environmental obligations
imposed by the host country.
In summary, there currently exists an obvious trend of integrating environmental
protection in investment agreements. More attention is needed for the practice of
NAFTA and the motion of OECD countries to facilitate Multilateral Agreement on
Investment (MAI), which includes general exception clauses for environmental
reasons and the practice of prohibiting countries from lowering environmental
standards to attract foreign investment, etc. A major criticism of Multilateral
Agreement on Investment (MAI) is grounded in the insufficient consideration of the
environment, while numerous environmental clauses are criticized for transferring
unjustifiable burden to Southern countries. In the future, with the pressure from
OECD countries, negotiations on MAT will be re-opened with the inevitable
integration of environmental demands.
Besides, there exist numerous international standards and guides coordinating the
relations between investment and environment on a voluntary basis, such as the
Global Compact initiated by the United Nations, UNEP Financial Initiative, UN
Principles for Responsible Investment, Environmental Impact Assessment of the
World Bank, the Equator Principles of the International Finance Corporation (IFC),
etc., all of which contribute to guiding international investment towards
environmental protection. Discussions in detail would be omitted here due to the limit
of space.
4.2.3 Environmentally-Relevant International Investment Rules: China’s
Participation
Integration of environmental clauses in bilateral investment policies is a practice
actively promoted by certain developed countries, including the United States in
recent years, which may become a significant trend of future development of
international investment rules. As an important multinational investor and an
international investment rule-maker, China starts to be aware of possible negative
impact of international investment on the environment.
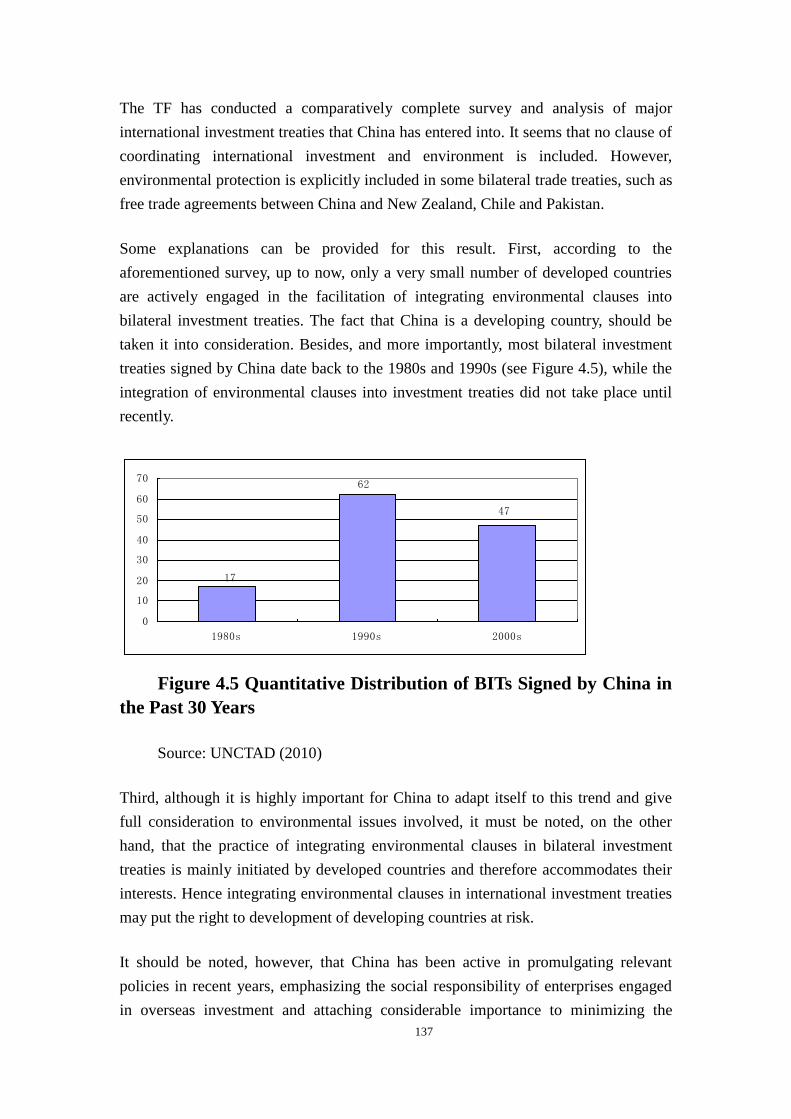
137
The TF has conducted a comparatively complete survey and analysis of major
international investment treaties that China has entered into. It seems that no clause of
coordinating international investment and environment is included. However,
environmental protection is explicitly included in some bilateral trade treaties, such as
free trade agreements between China and New Zealand, Chile and Pakistan.
Some explanations can be provided for this result. First, according to the
aforementioned survey, up to now, only a very small number of developed countries
are actively engaged in the facilitation of integrating environmental clauses into
bilateral investment treaties. The fact that China is a developing country, should be
taken it into consideration. Besides, and more importantly, most bilateral investment
treaties signed by China date back to the 1980s and 1990s (see Figure 4.5), while the
integration of environmental clauses into investment treaties did not take place until
recently.
Figure 4.5 Quantitative Distribution of BITs Signed by China in
the Past 30 Years
Source: UNCTAD (2010)
Third, although it is highly important for China to adapt itself to this trend and give
full consideration to environmental issues involved, it must be noted, on the other
hand, that the practice of integrating environmental clauses in bilateral investment
treaties is mainly initiated by developed countries and therefore accommodates their
interests. Hence integrating environmental clauses in international investment treaties
may put the right to development of developing countries at risk.
It should be noted, however, that China has been active in promulgating relevant
policies in recent years, emphasizing the social responsibility of enterprises engaged
in overseas investment and attaching considerable importance to minimizing the
62
17
47
0
10
20
30
40
50
60
70
1980s 1990s 2000s
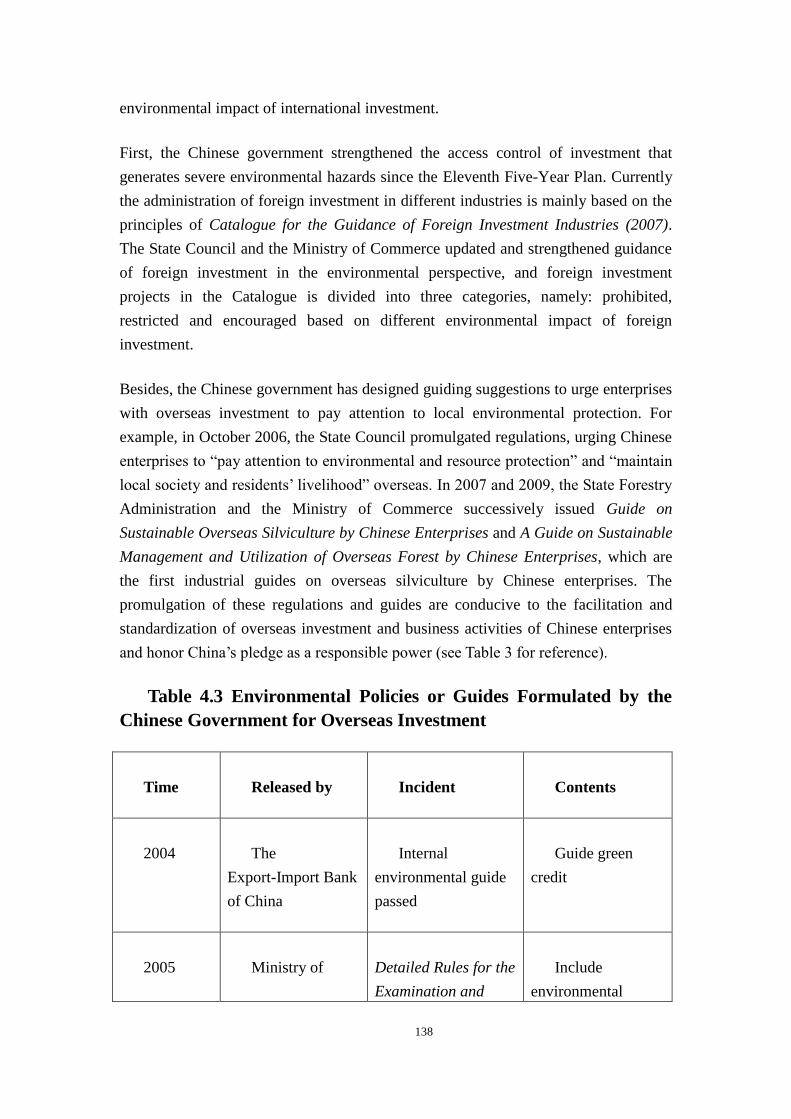
138
environmental impact of international investment.
First, the Chinese government strengthened the access control of investment that
generates severe environmental hazards since the Eleventh Five-Year Plan. Currently
the administration of foreign investment in different industries is mainly based on the
principles of Catalogue for the Guidance of Foreign Investment Industries (2007).
The State Council and the Ministry of Commerce updated and strengthened guidance
of foreign investment in the environmental perspective, and foreign investment
projects in the Catalogue is divided into three categories, namely: prohibited,
restricted and encouraged based on different environmental impact of foreign
investment.
Besides, the Chinese government has designed guiding suggestions to urge enterprises
with overseas investment to pay attention to local environmental protection. For
example, in October 2006, the State Council promulgated regulations, urging Chinese
enterprises to “pay attention to environmental and resource protection” and “maintain
local society and residents’ livelihood” overseas. In 2007 and 2009, the State Forestry
Administration and the Ministry of Commerce successively issued Guide on
Sustainable Overseas Silviculture by Chinese Enterprises and A Guide on Sustainable
Management and Utilization of Overseas Forest by Chinese Enterprises, which are
the first industrial guides on overseas silviculture by Chinese enterprises. The
promulgation of these regulations and guides are conducive to the facilitation and
standardization of overseas investment and business activities of Chinese enterprises
and honor China’s pledge as a responsible power (see Table 3 for reference).
Table 4.3 Environmental Policies or Guides Formulated by the
Chinese Government for Overseas Investment
Time Released by Incident Contents
2004 The
Export-Import Bank
of China
Internal
environmental guide
passed
Guide green
credit
2005 Ministry of Detailed Rules for the
Examination and
Include
environmental
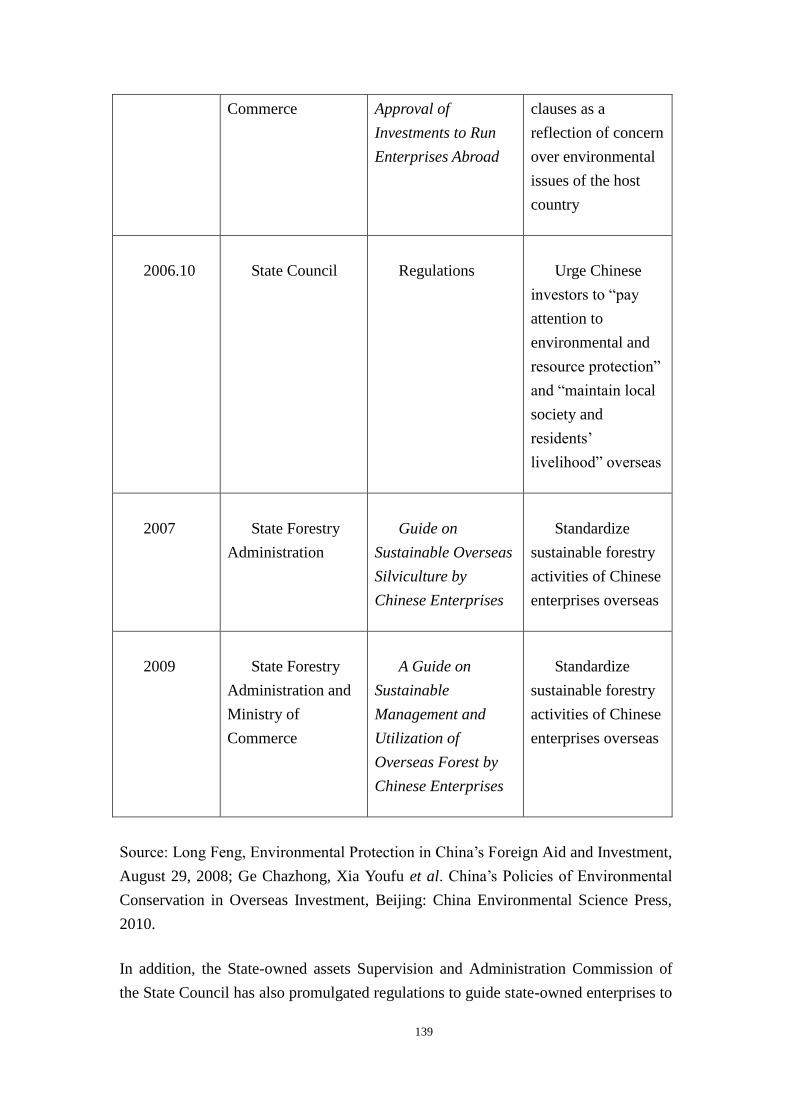
139
Commerce Approval of
Investments to Run
Enterprises Abroad
clauses as a
reflection of concern
over environmental
issues of the host
country
2006.10 State Council Regulations Urge Chinese
investors to “pay
attention to
environmental and
resource protection”
and “maintain local
society and
residents’
livelihood” overseas
2007 State Forestry
Administration
Guide on
Sustainable Overseas
Silviculture by
Chinese Enterprises
Standardize
sustainable forestry
activities of Chinese
enterprises overseas
2009 State Forestry
Administration and
Ministry of
Commerce
A Guide on
Sustainable
Management and
Utilization of
Overseas Forest by
Chinese Enterprises
Standardize
sustainable forestry
activities of Chinese
enterprises overseas
Source: Long Feng, Environmental Protection in China’s Foreign Aid and Investment,
August 29, 2008; Ge Chazhong, Xia Youfu et al. China’s Policies of Environmental
Conservation in Overseas Investment, Beijing: China Environmental Science Press,
2010.
In addition, the State-owned assets Supervision and Administration Commission of
the State Council has also promulgated regulations to guide state-owned enterprises to
140
assume their social responsibility, including environmental protection and resource
conservation, thus building a solid foundation for overseas investment endeavors of
state-owned enterprises. To encourage enterprises to honor their corporate social
responsibility (CSR), the State-owned assets Supervision and Administration
Commission of the State Council issued The Guideline on Fulfilling Social
Responsibility by Central Enterprises, which serves as a guide and standardization of
environmental and social conducts of Chinese enterprises in overseas investment,
proposing that Chinese enterprises, when “going global”, should communicate the
successful experience of China and facilitate the formulation of environmental
policies of host countries.
At the end of 2007, only 11 state-owned enterprises released social responsibility
reports and sustainable development reports; while by 2010, this number has reached
35. Some enterprises have issued country-specific reports; for example, Sinosteel
Corporation published Sustainability Africa Report and China National Petroleum
Corporation (CNPC) issued Sustainability Kazakhstan Report. COSCO was rated A+
by Global Reporting Initiative (GRI) and won Corporate Social Responsibility Award
of UN Global Compact. China Guodian Corporation issued the first guiding proposal
for the performance of corporate social responsibility in China, hence facilitating the
establishment of a comprehensive social responsibility system and guiding the
enterprise to carry out its social responsibility in a systematic fashion. China Mobile
has also designed and implemented strategic social responsibility management and is
the first and only Chinese enterprise ranking among Dow Jones Sustainability
Indexes.
Third, Chinese financial regulatory institutions are vigorously promoting green credit
and sustainable development, which is expected to exert increasing influence on
overseas business. Environmental considerations of financial departments for China’s
overseas investment are equally important. Financial departments, especially the
Export-Import Bank of China and China Development Bank, have established specific
standards on green credits for overseas investment.
Considering the possible role of financial institutions in promoting environmental
protection, since 2007, the State Council, the Ministry of Environmental Protection,
the People’s Bank of China and China Banking Regulatory Commission have
successively issued a series of policies and regulations, requiring the overall
enhancement of green credit in the financial sector.
Moreover, in support of the energy conservation and emission reduction objectives set
141
at the beginning of the Eleventh Five-Year Plan, the financial sector has obviously
strengthened the credit support for industries related to energy conservation and
emission reduction. In the first half of 2007, the State Environmental Protection
Administration (now Ministry of Environmental Protection) jointly issued a document
with the People’s Bank of China, facilitating corporate environmental protection
information sharing service, including corporate environmental information database,
for firsthand information and technical support for the implementation of green credit.
Based on these efforts, on July 12, 2007, the State Environmental Protection
Administration, the People’s Bank of China and China Banking Regulatory
Commission issued a document, demanding for credit restrictions on enterprises that
failed to comply with industrial policies and environmental protection requirements,
especially for curbing blind expansion of high-energy-consuming and high-pollution
enterprises through green credit. China Banking Regulatory Commission also issued
Guiding Opinions on the Credit Work for Energy Conservation and Emission
Reduction, etc. aiming at urging banking institutions to circumvent from credit risks
and facilitate policy implementation for energy conservation and emission reduction.
In addition, in November 2007, China Banking Regulatory Commission issued
Guiding Opinions on Strengthening Social Responsibilities of Banking and Financial
Institutions, requiring large banking institutions to assume their social responsibilities
and those with qualified conditions should release social responsibility report on the
basis of the 10 Fundamental Principles of UN Global Compact. In January 2008, the
State Environmental Protection Administration signed an agreement with
International Finance Corporation aiming at launching joint research projects,
providing guidance for green credit in line with China’s reality and providing
technical support for deepening green credit mechanism. On January 12, 2009, China
Banking Regulatory Commission issued Guiding Opinions on the Social
Responsibilities of Financial Institutions to urge the banking industry to assume its
social responsibilities and promote harmonious and sustainable economic, social and
environmental development.
The Export-Import Bank of China is one of the first banks in China engaged in
environmental economic policies and practices, with the issuance of Guiding
Opinions on Environmental and Social Evaluation of Loan Projects of China Export
and Import Bank On August 28, 2007. However, compared to international financial
institutions in respect of environmental policies of development, the environmental
standards of China EXIM Bank appears comparatively low with rather simplistic
guidance for practice and short history of implementation. At present, many renowned
Chinese enterprises, including National Development Bank, have released social
142
responsibility report.
Besides, China Merchants Bank has been outstanding in policies, measures and
information disclosure in environmental protection. In terms of environment-related
policymaking, it has promulgated Green Financial and Credit Policies and Marketing
Guide of Renewable Energy Sector and issued Credit Policies 2009 with rigorous
access criteria for high-energy-consumption and high-pollution (known as “Two
High”) industries; in terms of responsible departments and staff, it has clarified
departments responsible for environmental protection and their respective tasks and
functions; while in terms of loans for “two-high” industries, the loan balance was
disclosed with a drop of 1.95 percentage points compared to the year before;
especially in terms of overseas investment, China Merchants Bank clearly requires the
compliance with international environmental standards in overseas investment process
in all industries involved (including petroleum and natural gas, mining, processing
and manufacturing, renewable energy, overseas trade, etc.).
Moreover, Industrial Bank, Industrial and Commercial Bank of China and Shanghai
Pudong Development Bank each delivers excellent performance in related fields.
Industrial Bank is by far the only bank in China that has adopted the Equator
Principles.
Generally speaking, environmental protection is integrated in numerous investment
regulatory policies in China, despite the loosely-constructed and fragmented policy
measures and much space for improvement in implementation and supervision. It may
be stated that there still exists certain gap between the importance attached to
environmental issues in domestic investment policies and the rapid development of
international environment and that work in related areas needs to be strengthened. For
instance, Catalogue for the Guidance of Foreign Investment Industries should be
more detailed with more emphasis on environmental impact assessment and
environmental and resource taxation. Work related to green credit should be
strengthened in the financial sector and more large banks may be encouraged to adopt
the Equator Principles. Large state-owned enterprises should strengthen their
performance of social responsibilities with more attention given to environmental
protection and information disclosure.
143
4.3 Environmental Provisions in International Trade Rules
4.3.1 Overview of International Trade Rules and International Environmental
Rules
Generally speaking, the International Trading System is a complete system of rules for
trading, while the Environmental Management System is a complete system of rules
for environmental protection. The International Trade Rules aims to promote the
liberalization of economic activities, while the Environmental Management Rules
aims to restrict the liberalization of economic activities. The two serve for different
objectives and essentially differ from each other, but consequently influence each
other. It is such features that lead to the possible potential conflict between the two as
well as cause the two to be consonant with each other. Therefore, it is necessary to
seek a reasonable joint point between the trade rules and environmental management
rules.
The environmental provisions in the existing International Trade Rules basically focus
on WTO. Except for the particular ones (such as North American Free Trade
Agreement (NAFTA)), other Regional Trade Agreements (RTAs) and bilateral Free
Trade Agreements (FTAs) generally fail to include any separate environmental
provisions. China has signed multi-lateral and bilateral FTAs with more than 30
counties, but at present, none of the trades thereof are linked to the subject of
environment. Instead, the cooperation on environment appears often as an attachment
to the protocol on FTAs.
In the meanwhile, trade development has not been completely excluded in numerous
international environmental conventions, of which some have also set up the
“Committee on Trade and Environment” and provided the specific trade obligations
(STOs), taking trade an important measure to fulfilling the environmental convention.
For instance, CITES (Convention on International Trade in Endangered Species) has
especially specified such trade measures as restriction of ivory trade.
In general, the international organizations have attached great importance to the
coordination between the trade rules and the environmental rules. This charter will
first describes the environmental provisions of WTO system and its predecessor,
GATT, and relevant agreements, then comments on the Doha Round Negotiation now
under process environmental provisions likely to be formed in the future, and finally
proposes for China to actively participate in formulating the international rules of
WTO on environmental goods so to promote the environment protection.
144
4.3.2 Environmental Provision in GATT and Other Trade Treaties
Exceptional provisions of WTO Rules, relating to environmental protection, are
mostly concentrated in Paragraphs (b) and (g) of Article XX of GATT. According to
the provisions of Article XX (General Exceptions) of the General Agreement on
Tariffs and Trade 1994, “subject to the requirement that such measures are not applied
in manner which would constitute a means of arbitrary or unjustifiable discrimination
between countries where the same conditions prevail, or a disguised restriction on
international trade, nothing in this Agreement shall be construed to prevent the
adoption or enforcement by any contracting party of measures: (b) necessary to
protect human, animal or plant life or health; (g) relating to the conservation of
exhaustible natural resources if such measures are made effective in conjunction with
restrictions on domestic production or consumption.”
Provisions of other WTO agreements, involving environmental protection, are
represented in GATT. The Preface to the Agreement Establishing World Trade
Organization differs from the Preface to GATT 1947, by restricting the primary
objective of “full use of the world’s natural resources” in the Preface to GATT 1947
and changing “full use” into “optimal use” so that the optimal use of the world
resources should be consistent with sustainable development. It has defined the
sustainable development and environmental protection as one of the objects of the
new multilateral trade system.
Provisions, relating to environment and trade, of other agreements than GATT
include:
(1) Agreement on Technical Barriers to Trade (TBT): its preface provides “no
country should be prevented from taking measures necessary to ensure the quality of
its exports, or for the protection of human, animal or plant life or health, of the
environment, or for the prevention of deceptive practices, at the levels it considers
appropriate, subject to the requirement that they are not applied in a manner which
would constitute a means of arbitrary or unjustifiable discrimination between
countries where the same conditions prevail or a disguised restriction on international
trade, and are otherwise in accordance with the provisions of this Agreement”.
(2) Agreement on the Application of Sanitary and Phytosanitary Measures (SPS
Agreement): this agreement has further described the provisions on recommended
measures to protect animal and plant life or health and applied higher as well as more
specific material obligation on its members. However, in terms of application, SPS
145
Agreement is narrower than Para. (b) of Article XX. Article 2 of this agreement
provides the basic rights and obligations: “members shall ensure that any sanitary or
phytosanitary measure is not maintained without sufficient scientific evidence, except
as provided for in paragraph 7 of Article 5.” Paragraph 7 of Article 5 provides: “in
cases where relevant scientific evidence is insufficient, a Member may provisionally
adopt sanitary or phytosanitary measures on the basis of available pertinent
information, including that from the relevant international organizations as well as
from sanitary or phytosanitary measures applied by other Members. In such
circumstances, Members shall seek to obtain the additional information necessary for
a more objective assessment of risk and review the sanitary or phytosanitary measure
accordingly within a reasonable period of time.” This article has actually introduced
the preventive principle of the Environmental Law and grants its members with the
right to provisionally adopt the preventive measures.
(3) Agreement on Subsidies and Countervailing Measures (SCM Agreement):
according the provision of Subparagraph (c) of its Article 2, under certain conditions,
members can subsidize any company with a heavier economic burden due to
implementation of the new environmental regulations. Action shall be taken against
any subsidy with the objective to protect environment only in the following
circumstances: such subsidy benefits import that damages the interest of one industry
in the importing country, or benefits the industry of one country, but damages the
rights entitled to other countries according to GATT or trade interests of other
countries.
(4) Agreement on Agriculture: this agreement shows direct concerns on the
subject issue of environment, by admitting the “Green-box Policy” implemented by
many countries: i.e., such domestic support measures of countries as ecological
environment protection programme and direct green subsidies for farmers are not to
be eliminated. However, two conditions shall be additionally complied with:
governmental products with definite objectives and funds raised from the public are
supported; such projects will not provide any help to producers in terms of prices.
(5) Agreement On Trade-related Aspects of Intellectual Property Right (TRIPS):
Article 27 of TRIPS provides some circumstances relating to environment protection
and for refusing to grant any patent right: to protect human, animal or plant life or
health or to avoid serious prejudice to the environment, members must prevent
commercial application of some inventions, such as diagnostic, therapeutic and
surgical methods for the treatment of humans or animals.
146
(6) General Agreement on Trade in Services (GATS): Article 6 of GATS provides
that each member to any agreement shall ensure that the general applicable measures
affecting trade in services are implemented in a reasonable, just and objective manner.
Such measures are generally deemed also including environmental protection.
Copying Article XX, its Article 14 also provides the general exceptions, of which Para.
(b) allows its members to adopt any measures necessary to protect human, animal or
plant life or health, subject to the requirement that such measures are not applied in a
manner which would constitute a means of arbitrary or unjustifiable discrimination
between countries where the same conditions prevail or a disguised restriction on
trade in services.
4.3.3 Possible Environmental Provisions in Future WTO Agreements
Establishment of environment-related articles and provisions in WTO rules has
adequately indicated that sustainable development and environmental protection are
one of the objectives for the new multilateral trading system, as has also determined
environment, in the new WTO Doha Round Negotiation, as a major subject matter.
In 1995 when World Trade Organization (WTO), the Committee on Trade and
Environment (CTE), under the General Council, for discussions of ten environmental
issues, including:
1. Relationship between WTO rules specific trade rules set out in multilateral
environmental agreements (MEAs);
2. Relationship between WTO rules and environmental policy;
3. a. Relationship between WTO rules and environmental tax; b. relationship
between WTO rules and environmental requirements for goods;
4. Trade measures of environmental management and trade rules of
environmental policy;
5. Relationship between dispute settlement mechanism of WTO dispute
settlement mechanism of MEA;
6. a. Impact of environmental measures on market access of the developing
countries; b. elimination of environmental benefits of trade restriction;
7. Export of domestically prohibited goods;
147
8. Relationship between environment and TRIPs;
9. Relationship between environment and trade in services;
10. Others.
In November 2001, the Ministerial Conference in Doha granted CTE with the special
authority to start the negotiations on trade and environment. Such authorization for
issues of trade and environment are particularly represented in paragraphs 31 and 32
of the Doha Ministerial Declaration, as follows:
• 31.1 Studies and negotiations on the relationship between existing WTO rules
and specific trade obligations set out in multilateral environmental
agreements (MEAs)
• 31.2 Observer status of MEA Secretariat
• 31.3 Studies and negotiations on the reduction or, as appropriate, elimination
of tariff and non-tariff barriers to environment goods and services
• 32.1 Studies and negotiations on the effect of environmental measures on
market access
• 32.2 Countermeasures of the Agreement on Trade-Related Aspects of
Intellectual Property Rights for trade and environment and position study
• 32.3 Studies and counterproposals on labeling requirements in negotiations on
trade and environment
4.3.4 WTO Rules on Environmental Products: China’s Active Role
China should play an active role in making international rules in terms of its WTO
based environmental interests. The current WTO-CTE’s environmental goods and
services (EGS) negotiations are driven by trade interests rather than environmental
ones. They are based on national agendas, and therefore lack a global perspective and
are quite poor in terms of any coordination with Multilateral Environmental
Agreements (MEAs). They lack an integral awareness of China’s national and
departmental interests, suggesting that the country’s environmental interests have not
been sufficiently considered. Hence, it is suggested that China should better prepare
its international negotiations strategies to gain environmental benefits alongside its
148
trade and industrial development interests.
In light of the diversity and complexity of China’s economic development and the
urgency of environmental needs, it is necessary to discard the too simplified
dichotomy of international trade for developing countries and developed countries.
The environmental goods and services listed by this study reflect China’s economic
benefits (industrial benefits and trade benefits); environmental benefits; and social
benefits. China is especially competitive in all three categories of environmental
products, and will become more competitive over time. There are also interesting
alignments of interests to be explored with other developing countries.
WTO expects to promote Doha Round CTE-Negotiations on Environmental Goods
and Services for representing the demands of all the member countries. The most
important issue is how WTO members will react for the challenge of global
environment. In addition to the conventional dispute cases on trade and environment
within WTO, more and more new cases are coming out, absolutely most of which are
related to China, e.g., case on restricted export of raw materials, case on restricted
export of rare earth elements and case on subsidies for blowers. These cases have not
been included in the list of Doha Round Negotiations, but the judgment made by
WTO Committees will lead a strong effect on formulation of the future rules.
Being authorized by Doha Ministerial Conference, WTO started the negotiations on
31.1, 31.2 and 31.3 of the Doha Development Agenda (DDA). Of all the subjects for
negotiation, DDA 31.3 for opening up environmental goods and services is one of the
most important. The directory of goods is under formulation according to the interests
of WTO members, but even up to now, WTO has not provided a clear definition of
environmental goods and services. What is most important is how to integrate
environmental interests, especially global environmental interests, into the system of
WTO as a new rule.
On April 21, 2011, WTO Director-General Pascal Lamy and chairpersons of different
negotiation groups published reports on different issues of negotiation and existing
negotiation case documents over the last decade since Doha Round started. Chairman
of WTO/CTE, Ambassador Manuel Teehankee also presented a report to the Trade
Negotiation Committee (TNC) (WTO, TN/TE/20).
The report provided TNC with the latest progress of CTE Special Session (CTESS).
Regarding the environmental goods in DDA 31(iii), it made a special summary of the
report (TN/TE/19) made by the chairman, in March 2010, to TNC, which provides a
149
summary list of environmental goods. The reference scope of quality
environmental-friendly products included in its Appendix II.A provided for members
is based on Customs HS-6 submitted by members, just as what has been represented
in Appendix II to the report to TNC in March 2010 as well as JOB/TE/3/Rev.1
(January 5, 2011) and subsequent submittals.
Section 8 of the report mentioned particularly Appendix II to the report (TN/TE/19) to
TNC in March 2010 and JOB/TE/3/Rev.1 (January 5, 2011). It was reaffirmed that
environmental goods can be classified into six major categories: air pollution control,
renewable energies, waste management and sewage treatment, environmental
protection technology, carbon capture and storage.
This part aims to comment on the classification of environmental goods reported by
WTO chairman, and propose, in view of environmental needs, our framework for
classification of environmental goods, with which to theoretically resolve the problem
of classifying environmental goods as well as practically promote the WTO
negotiations on environmental goods in a proper manner.
With the common view and efforts of the international society, the demand for
resolving global environmental problems will definitely continue to increase. What is
most typical is the issue on ozone depletion. Due to the special institutional
arrangement for elimination and reduction of ozone substances, especially with the
support of effective financial mechanism, developing countries have made significant
contributions in reduction of ODS, while China contributes to the total reduction of
the world by over 50%.
Facing the current situation of global environmental protection that is still severe, all
countries in the world shall continue to advance the process of cooperation on global
environment. The developed countries shall fulfill their commitments and obligations
to provide the developing countries with aid for environmental development and
funds and technologies for fulfilling the international conventions. The developing
countries are also willing to continue to, in line with the “common but differential
responsibilities” principle, to join hands with the international society in responding to
the challenge of global environment.
In our opinion, the current WTO-CTE negotiations on EGS are driven by interests of
trading, instead of environmental demand, purely for national interests, but without
global vision and harmony with MEAs. However, at present, the status of Chinese
negotiations are short of overall understanding of national interest, departmental
150
interests influence the integrated interests of the state and environmental interests are
not adequately represented.
4.4 Climate Change, International Investment, Trade, and
China’s Involvement
Global climate change has been a fixture in international headlines in recent years, but
still the challenge of construing of a fair and effective international climate change
response after 2012—the end of the Kyoto Protocol commitment period—is still far
from resolved. The international climate system involves a wide range of processes,
frameworks, and mechanisms characterized by statements, laws, agreements,
decisions, and standards. Some are legally binding; others are voluntary. Some
countries have attached great importance to the commitments made at various
international climate meetings, and have indeed change domestic policy to reflect
them.
4.4.1 International Negotiation Process and Governance System to Address
Climate Change
As a global environmental problem, global climate change is one of the most daunting
challenges that the human society is collectively faced with. With international
climate course in constant development and international climate regime still under
construction, international actions in combating climate change shall inevitably exert
significant and far-reaching influence on international trade, international investment
and even the entire global economic and political pattern. As a major developing
country and a major contributor to greenhouse gas emissions, China holds a crucial
position in international climate negotiations and will inevitably assume increasing
international obligations. Therefore, China must actively participant in the
formulation of related international rules in respect to climate change with special
attention to issues related to climate change and international trade and investment to
safeguard long-term interests of China while contributing to the global transformation
of green economy.
Since the commencement of international climate negotiations in 1990, the
international climate course has undergone 20 years of vicissitudes. In 1992, the
United Nations Framework Convention on Climate Change (UNFCCC, or FCCC in
short) was adopted in Rio Conference and was open for signing; on March 21, 1994,
UNFCCC officially entered into effect, legally establishing the ultimate objectives
151
and a series of fundamental principles of the Convention. UNFCCC is by far the most
important international environmental regime with the most extensive participation
and the most profound implications.
Kyoto Protocol is an important legal document that aims at implementing the
objectives and fundamental principles established in UNFCCC, which, for the first
time, stipulated quantitative emission reduction targets with legally binding power for
the First Commitment Period (2008—2012) for Annex I countries (developed
countries and economies in transition) while introducing three market-based flexible
mechanisms to facilitate international climate cooperation. In addition, Kyoto
Protocol has reiterated the general obligations of all signatory parties of UNFCCC
and the obligations of signatory parties of Annex II to provide new additional funds
for developing countries and to conduct technical transfer. International climate
negotiations were challenged with complications and difficulties due to the
announcement of withdrawal of the United States and the procrastination of certain
signatory parties before Kyoto Protocol officially entered into effect on February 16,
2005, thanks to the tremendous endeavors waged by the international community. The
11th Conference of the Parties of UNFCCC convened in Montreal, Canada decided to
launch a new round of negotiations on post-2012 international climate regime, turning
a new leaf in international climate course.
The Bali Roadmap was concluded in the 13th Conference of the Parties of UNFCCC
convened in Bali, Indonesia, where the basic pattern of parallel “dual-track” progress
in international climate negotiations through negotiation model of two ad hoc working
groups, namely Ad hoc Working Group—Kyoto Protocol (AWG-KP) for emission
reduction target in follow-up period of commitment of Annex I countries and Ad hoc
Working Group for long-term cooperation action (AWG-LCA), while defining the
timetable of the conclusion of an international climate convention during the 15th
Conference of Signatory Parties convened in Copenhagen by the end of 2009.
However, despite certain political consensus and mid-term emission reduction goals
proposed by various countries, the Copenhagen Climate Conference has obviously
failed to fully accomplish this historical mission.
After the difficulties and setbacks of the Copenhagen Conference, Cancun Agreement
was finally inked through difficult compromises at the 16th Conference of the Parties
of UNFCCC convened in Cancun, Mexico at the end of 2010. This hard-won result
played a critical role in restoring the confidence in collaboration of the international
community in addressing the climate change. However, a reality that must be
recognized is that Cancun Protocol features more procedural and institutional
152
arrangements that material contents, leaving numerous challenges to follow-up
negotiations, indicating that there is still a long way to go before the critical task of
building an equitable and effective international climate regime is finally achieved.
However, reduction of greenhouse gas emissions, development of low-carbon
economy and facilitating the global transition towards green economy has become an
inevitable trend of world economic development, and low-carbon technical innovation
has become a crucial part of new international competitiveness in the future.
The international climate regime consists of numerous key factors, and Bali Roadmap
has proposed five key issues of negotiations under UNFCCC, namely: shared vision,
mitigation, adaptation, technology and fund; however, the international climate
regime is not limited to negotiations and related legal documents under UNFCCC and
Kyoto Protocol, but a general term for various international rules in the field of
climate change for standardized international actions in response to climate change on
a global scope with a highly extensive coverage, including related international
multilateral and bilateral cooperation mechanisms outside the Protocol framework,
international agreements on a specific field (such as renewable energies), relevant
standards formulated by international trade associations, etc. Such international rules
may be in the form of statement, law, agreement, standard, etc., either with legal
binding force or on a voluntary basis. With the guidance or constraint of the
international climate regime, all countries have attached much importance to these
issues, translating international obligations into domestic policies proceeding from
reality, designing national strategies in addressing the climate change and
promulgating multitudes of climate-related policies.
4.4.2 Climate Change and International Investments
The international climate regime is closely related with international investment and
trade featuring two-way interaction. The climate change may cause changes in
comparative advantages of certain countries through direct impact, and different
climate policies adopted by different countries may influence international investment
and trade pattern, hence modifying the size and direction of international investment
and trade; while such investment and trade may facilitate or hamper international
climate actions in turn. In the global transition towards green economy, potential
conflicts and frictions between climate change and international investment and trade
policies in the course of global transition towards green economy, and relevant cases
have occurred in reality, requiring the coordination of international climate regime
and international investment and trade rules in an effort to reduce frictions and create
a win-win situation.
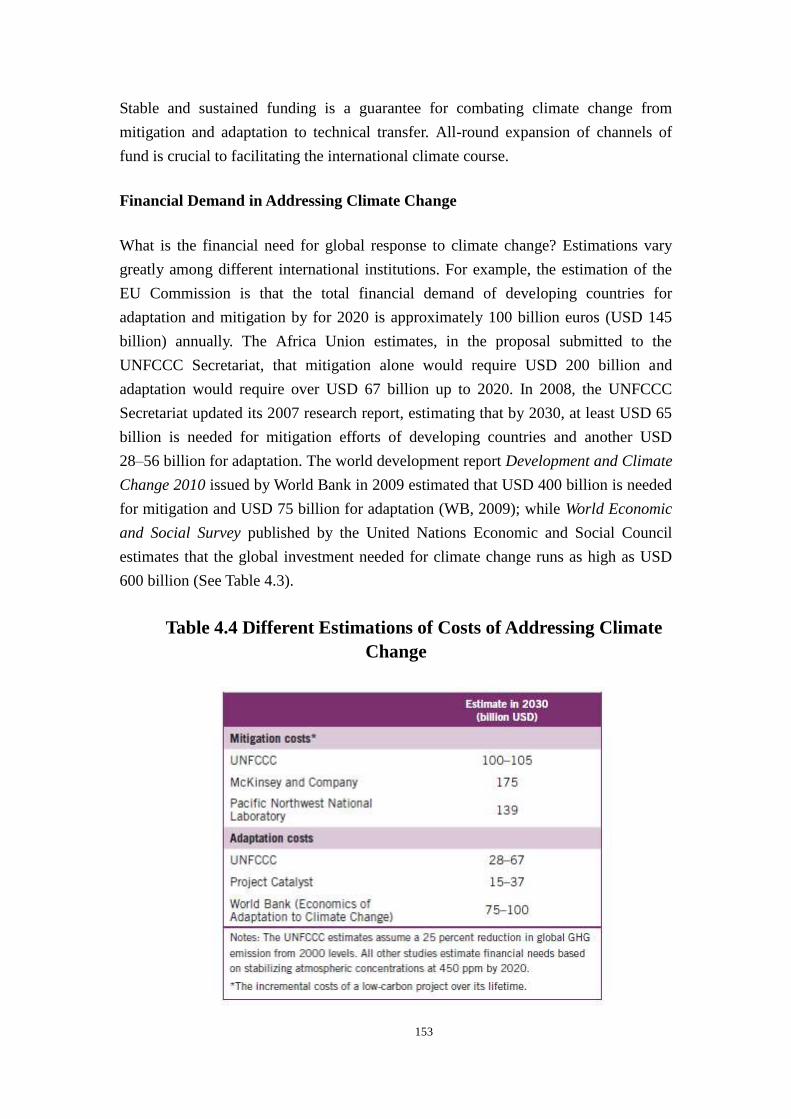
153
Stable and sustained funding is a guarantee for combating climate change from
mitigation and adaptation to technical transfer. All-round expansion of channels of
fund is crucial to facilitating the international climate course.
Financial Demand in Addressing Climate Change
What is the financial need for global response to climate change? Estimations vary
greatly among different international institutions. For example, the estimation of the
EU Commission is that the total financial demand of developing countries for
adaptation and mitigation by for 2020 is approximately 100 billion euros (USD 145
billion) annually. The Africa Union estimates, in the proposal submitted to the
UNFCCC Secretariat, that mitigation alone would require USD 200 billion and
adaptation would require over USD 67 billion up to 2020. In 2008, the UNFCCC
Secretariat updated its 2007 research report, estimating that by 2030, at least USD 65
billion is needed for mitigation efforts of developing countries and another USD
28–56 billion for adaptation. The world development report Development and Climate
Change 2010 issued by World Bank in 2009 estimated that USD 400 billion is needed
for mitigation and USD 75 billion for adaptation (WB, 2009); while World Economic
and Social Survey published by the United Nations Economic and Social Council
estimates that the global investment needed for climate change runs as high as USD
600 billion (See Table 4.3).
Table 4.4 Different Estimations of Costs of Addressing Climate
Change
154
Source: Pew Centre on Global Climate Change: Strengthening International Climate Finance.
December 2010. http://www.pewclimate.org/.
International Public Finance for Climate
At present, international investment for climate change consists of two main parts:
public finance and market-based private sector investment. Sources of public finance
are mainly the four financial mechanisms under the existing UNFCCC and Kyoto
Protocol (see Figure 1):
Global Environmental Fund: initiated in 1990 and managed jointly by World
Bank, United Nations Development Program (UNDP) and United Nations
Environmental Program (UNEP) for investment in 4 key fields: bio-diversity, climate
change, international waters and ozone layer. GEF has provided approximately USD
2.8 billion for climate change projects since 1991, accounting for 31% of its total
financial power.
Adaptation Fund (AF): financial mechanism under Kyoto Protocol, mainly
from 2% of profits of Clean Development Mechanism (CDM) projects launched by
developing countries and additional funds provided by non-signatory developed
countries such as the United States. The current size of Adaptation Fund is merely
USD 3.6 million annually, which is expected to reach between USD 80 and 300
million in future if CDM projects are in sound operation.
Special Climate Change Fund (SCCF): voluntary donation under UNFCCC.
Up to 2009, pledged donations reached approximately USD 120 million, of which
about USD 90 million has been paid in.
Least Developed Country Fund (LDCF): voluntary donation under UNFCCC
mainly targeted at funding capacity building and other related activities of the least
developed countries in climate change. Up to 2009, pledged donations reached
approximately USD 180 million, if which about USD 120 million has been paid in.
The public finance also includes multilateral financial mechanism on the exterior of
UNFCCC framework. For instance, the Climate Investment Fund (CIF) was initiated,
funded by Britain, Japan and the United States and managed by World Bank, with an
estimated fund of USD 7 to 12 billion, including three specialized funds, namely:
Clean Technology Fund, Forest Investment Fund and Adaptation/ Climate Elasticity
Demonstration Fund, and a Strategic Climate Fund, providing support for mitigation
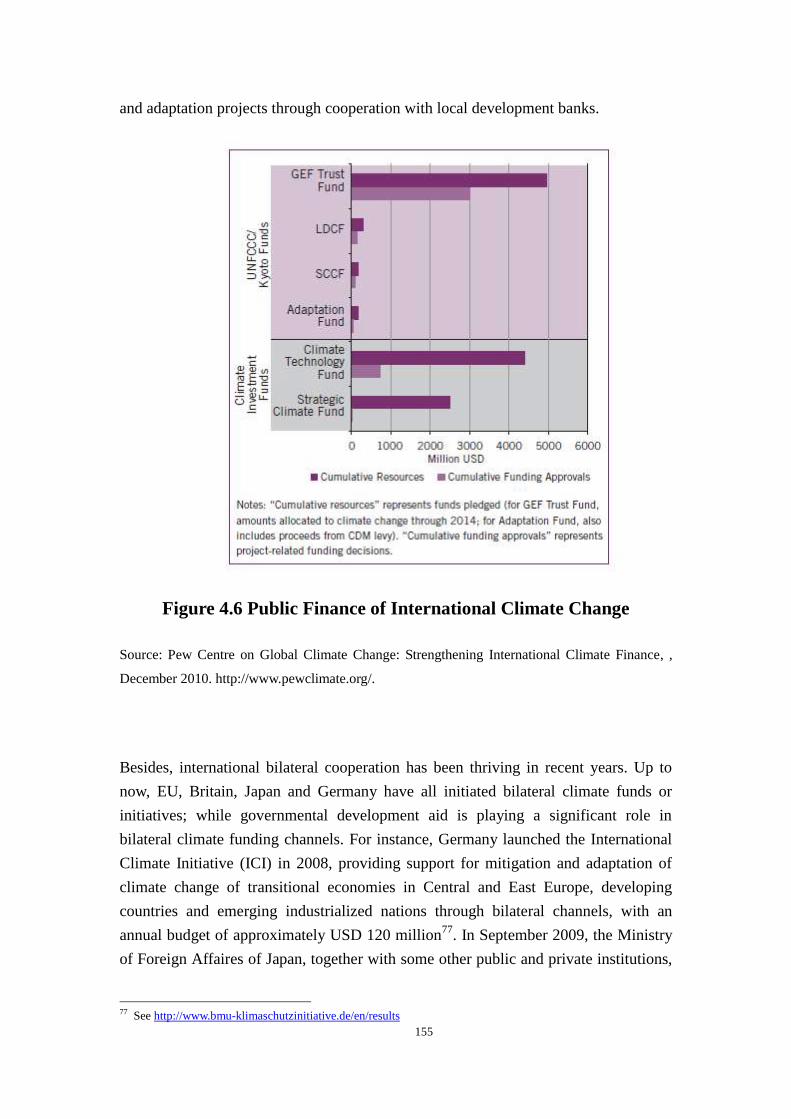
155
and adaptation projects through cooperation with local development banks.
Figure 4.6 Public Finance of International Climate Change
Source: Pew Centre on Global Climate Change: Strengthening International Climate Finance, ,
December 2010. http://www.pewclimate.org/.
Besides, international bilateral cooperation has been thriving in recent years. Up to
now, EU, Britain, Japan and Germany have all initiated bilateral climate funds or
initiatives; while governmental development aid is playing a significant role in
bilateral climate funding channels. For instance, Germany launched the International
Climate Initiative (ICI) in 2008, providing support for mitigation and adaptation of
climate change of transitional economies in Central and East Europe, developing
countries and emerging industrialized nations through bilateral channels, with an
annual budget of approximately USD 120 million77
. In September 2009, the Ministry
of Foreign Affaires of Japan, together with some other public and private institutions,
77 See http://www.bmu-klimaschutzinitiative.de/en/results
156
launched and operated Hayotama Initiative, aiming at providing support for the
economic development of developing countries having adopted emission reduction
measures and countries highly vulnerable to climate change. Japan’s pledge for the
Fast Initiated Fund is also part of the Initiative as the country pledges to provide USD
15 billion for the Fast-Start Fund by 2012, of which USD 11 billion comes from the
public sector. On November 30, 2009, the 12th EU-China Summit further enhanced
China-EU relationship in combating climate change. EU pledged to provide as much
as 57 million euros for development and demonstration projects of CCS technologies,
advanced near-zero-emission power generation technologies, etc.
From a holistic perspective, public funding is still in severe shortage and remains
faced with massive financial needs. Therefore, while rationalizing the uses of existing
funds, making every effort to expand financial channels and collecting more funds has
become the key to facilitating international climate cooperation. In this regard,
considerable differences in perspectives and positions exist between developed and
developing countries, as the latter emphasize that the public finance is the main
channel of international financing and that developed countries must perform their
financial obligations stipulated in UNFCCC and provide additional public finance for
the actions of developing countries to combat climate change, demanding for the
establishment of new financial obligations and improving financial management;
while the former emphasize on improved performance of the role of market
mechanism, advocating for the establishment of global carbon market for fundraising
and providing policy-based incentives to guide the private sector to invest in key areas
facilitative to climate change mitigation and adaptation.
”G77 plus China” has put forward an initiative related to financial mechanism in
international climate negotiations, demanding that developed countries should provide
“sufficient, foreseeable and additional to official development aid” funds for
developing countries of a size that equals 0.5%-1% of GDP of developed countries,
i.e. approximately USD 240 to 280 billion, with the establishment of an executive
institution under the Conference of Signing Parties of UNFCCC reporting to the
Conference, adding that the financial operations must be extensively representative
and transparent. Such a proposal represents the demand of the numerous developing
countries yet no positive response has been given by developed countries up to now.
Progress in international negotiations on financial issues has been achieved during the
Copenhagen Conference, as developed countries pledged to provide USD 30 billion in
the Fast Initiating Period 2010–2012 and defined the long-term target of an annual
funding of USD 100 billion by 2020. Decision on the establishment of World Green
157
Fund was made and negotiations on fundraising, financial management and utilization
are currently in progress. From a longer perspective, there still exist considerable
uncertainties in the sharing of financial obligations of various countries and the
implementation of funding, and the situation is far from optimistic.
International Carbon Market
Three flexible mechanisms, namely Joint Implementation (JI), Emission Trading (ET)
and the Clean Development Mechanism (CDM), are introduced in Kyoto Protocol,
among which CDM opens up new funding channels for developing countries while
reducing emission reduction costs for developed countries through project-based
cooperation between developed and developing countries. Besides, a voluntary
trading market untagged to international emission reduction pledges is created where
organizations and institutions purchase emission reduction on a voluntary basis as a
trade-off of their carbon emissions. However, compared to CNM market, its trading
volume is rather miniscule. According to World Bank data78
, in 2009, the CDM
market witnessed a trade volume of 211MtCO2 valued at USD 2.678 billion.
At present, international climate negotiations are in a stalemate with a nebulous future
for the development of CDM. CDM is obviously flawed with its low efficiency of
operation, lack of transparency and consistency in decision-making process,
complicacies of all procedures from project verification and signature for approval
with inadequate uncertainly, uneven regional distribution of projects, difficulty in the
verification of additionality, prices prone to market impact, uncertainties in rules after
2012, etc79
. Other researches show doubt on the capability of emission trading system
to realize global greenhouse gas emission reduction, its effectiveness in facilitating
technical transfer and the feasibility of the pledge to guide investment towards new
low-carbon technologies despite a certain volume of capital liquidity80
.
Low-Carbon Investment by Private Sector
The World Investment Report 2010 published by the United Nations Conference on
Trade and Development (UNCTAD) defines the transfer of low-carbon technologies,
practices and products to host countries through foreign direct investment or
78 World Bank (201078). State and trends of the carbon market.
http://siteresources.worldbank.org/INTCARBONFINANCE/Resources/State_and_Trends_of_the_Carbon_Market
_2010_low_res.pdf 79 Duan Maosheng, 2010 Clean Development Mechanism: Current Development and Future Reform, published in
Report on Combating Climate Change (2010) Challenges of Cancun and Actions of China. Social Sciences
Academic Press p.85-97. 80 Friends of the Earth (FOE), 2009. A dangerous obsession: The evidence against carbon trading and for real
solutions to avoid a climate crunch.
158
multinational enterprises as low-carbon foreign direct investment, including
investment in low-carbon processes and low-carbon products and services. The
former refers to the reduction of greenhouse gas emissions in the production process,
such as improving the operational quality of multinational enterprises and enhancing
the global supply chain of enterprises. The latter refers to the use of related products
or services to reduce emissions, such as electric buses, energy-saving home
appliances, massive transit systems, technical solutions of new greenhouse gas
emission circulation system designed for local companies, etc. The report estimates
that international low-carbon investment features enormous potentials and rapidly
expanding scale. It is estimated by UNDP that the FDI capital flow in three major
low-carbon industries including renewable energies and energy efficiency, etc. has
reached USD 9 billion, that low-carbon investment accounts for 10% of global FDI
capital flow, of which at least 40% is directed towards developing countries through
multinational enterprises81
.
Attracting foreign low-carbon development is a double-edged sword for developing
countries: on one hand, it helps to bring advanced technologies and funds and
facilitates fundraising; on the other hand, it may exert negative impact on the
economic and industrial development of developing countries, such as weakening the
competitiveness of domestic enterprises, dependence on foreign technologies, etc.
When addressing these negative impacts, inappropriate measures such as protective
policies or standards adopted by developing countries may cause potential conflict
with principles of international investment treaties such as national treatment, most
favored nation treatment, indirect taxation, equal and fair treatment, etc, even
incurring WTO disputes.82
In order to build up their capacity to attract foreign low-carbon investment,
developing countries should improve domestic environment, remove institutional and
policy barriers for low-carbon investment by private sector and coordinate the
relationship between foreign investment expansion and domestic economic growth on
one hand, and receive guidance from relevant international rules on the other. At
present, direct provisions standardizing international low-carbon investment are not
yet included in the international climate regime, yet the United Nations Convention on
81 The three areas are respectively alternate/renewable energy power generation, recycling and manufacturing of
environmental-friendly technical products. 82 Miles, K. (2008). International investment law and climate change: Issues in the transition to a low carbon
world. Paper presented at Inaugural Conference of the Society for International Economic Law, Geneva; Marshall,
F., Cosbey, A., & Murphy, D. (2010). Climate Change and International Investment Agreements: Obstacles or
opportunities? IISD Paper.

159
Trade and Development (UNCTAD) has stated that international investment policies
should be integrated into post-2012 framework of international climate change
regime, which is the direction of long-term development.
It is noted that some international organizations have attempted to build relevant
standards to encourage and guide overseas low-carbon investment. For example, at
Copenhagen Conference, the Association of Chartered Certified Accountants (ACCA)
required enterprises to adopt carbon accounting standards so that investors,
shareholders and staff are more likely to take carbon emission and greenhouse gas
management measures. In August 2010, the International Commission Synthesis
Report (IIRC) released the motion on post-crisis commercial report reforms,
analyzing the potential impact of climate change and other issues on corporate
financial health, which is supported by International Accounting Standards Board
(IASB) and U.S. Financial Accounting Standards Board (FASB); these two
institutions are responsible for formulating rules for financial reports in EU and in
North America. Once the factor of climate change is integrated into the rules of
financial report, changes will occur in market values of enterprises involved and those
in possession of more carbon assets will possess more financial strength. It is
estimated that if rules of financial report are revised, approximately 145 Chinese
enterprises respectively engaged in energy, power and aviation industries would be
financially affected.
More concretely, there are two major obstacles confronted by the private sector in
low-carbon investment.
(1) Regulatory risks in low-carbon investment83. The private sector plays an
important role in the implementation of Kyoto Protocol and will play an even more
prominent role in international climate change regime in post-2012 period.
Nevertheless, changes caused by regulated rules facilitating renewable energies and
energy efficiency and flexible mechanism under KP. There are several obstacles
affecting foreign low-carbon investment activities, including the instability of energy
and climate rules in developing countries and transitional economies, as changes in
relevant rules are very likely to hurt the economic interests of foreign investors due to
the capital intensity and prolonged time for return on investment of energy and
low-carbon investment.
83
Boute, A. (2009). The Potential Contribution of International Investment Protection Law to Combat Climate
Change. (May, 27 2009). Journal of Energy and Natural Resources Law, 2009. Available at SSRN:
http://ssrn.com/abstract=1410587; Marshall, F., Cosbey, A., & Murphy, D. (2010). Climate Change and
International Investment Agreements: Obstacles or opportunities? IISD Paper.
160
Regulatory risk refers to the probability of sink cost incurred by changes in existing
investment rules by public authorities. Impact of regulatory risk is more severe in
developing countries and transitional economics as investors are more sensitive to the
investment atmosphere.
Developing countries and transitional economies are beginning to support plans
facilitating the development of renewable energies and energy efficiency; yet these
policies are equally likely to incur regulatory risks, hence producing negative impact
on investment decision-making.
In other words, for foreign investors, a stable investment environment is crucial to
reduce social transfer cost and risk premiums.
(2) Environmental regulation may violate investment rules84
. The exclusion of
protecting the investment mechanism for low-carbon investment indicates the
existence of potential regulatory risk and uncertainty in foreign investment returns.
However, bilateral, multilateral and departmental investment treaties aim at ensuring
the stability of investment environment. Opposition to taxation, fair treatment,
national treatment and most favored nation treatment are all targeted at protecting
foreign investors. Yet these rules may be challenged by the environmental rules of the
host country.
a) Indirect taxation from environmental rules. International rules allow taxation
on foreign commodities under the following three conditions: the commodity in
question is intended for public purpose; the commodity is non-discriminatory and
non-hegemony in nature; the commodity is compensated. When compensation occurs,
the property right is reduced or the property interests are interfered without formal
transfer of ownership. In this case, environmental rules lead to indirect taxation.
b) Equitable treatment principle. If there is any adjustment in the above rules,
claims of unequal treatment would influence investment decisions. Therefore,
investors would challenge the introduction of more stringent climate change
regulation rules.
c) Regulatory chill. The interaction between the freedom of international
investment and environmental protection may cause capital overflow and regulatory
chill, which may in turn cause environmental standards to relax as host countries may
84
Miles, K. (2008). International investment law and climate change: Issues in the transition to a low carbon
world. Paper presented at Inaugural Conference of the Society for International Economic Law, Geneva.
161
relax their domestic environmental standards out of concerns for reduced investment.
Generally speaking, some measures are applicable to reduce the potential conflict
between international investment rules and climate change mitigation measures. An
important means is to modify the way o environmental rules are involved in
investment; another means is to provide a new understanding of fair treatment
principle. Yet before these means are implemented in reality, the host country may
facilitate the transition towards low-carbon economy by reducing regulatory risks.
4.4.3 Climate Change and International Trade
The impacts of climate policies on international trade are of great concern to the
international community as they can lead to serious competitiveness issues and trade
frictions around, subsidies, carbon tariffs, the liberalization of low-carbon products,
and other contentious issues.
Based on the United Nations Framework Convention on Climate Change’s (UNFCCC)
principle of “common but differentiated responsibilities,” developed countries and
developing countries should assume different emissions reduction obligations. In
terms of carbon leakage and competitiveness, developed countries in Europe and
America have proposed to address the developing countries’ competitive advantages
in international trade and increased emissions to be compensated through carbon
tariffs and other offsetting measures. These include the EU’s decision to incorporate
aviation emissions into the EU’s trading system (EU–ETS) in 2012, a unilateral action
that has caused great dispute in the international community and which will seriously
affect China’s aviation industry. The legitimacy of carbon tariffs under the WTO
remains undetermined. Developed and developing countries have different positions,
and there exist different opinions even within the EU. This could all lead to potential
conflict at the intersection of the international climate system and international trade
rules.
Climate change is closely related to international trade. In the field of climate change
and international trade, key issues of international concern is not only the impact of
climate policies on international trade, such as possible carbon leakage and
competitiveness concerns incurred by differentiated climate policies among countries
but also effects of trade policies on emissions, such as carbon tariffs, liberalization of
low-carbon products, etc.
Carbon Leakage, Competitiveness and Carbon Tariffs
162
A fundamental principle of UNFCCC is common but differentiated responsibilities.
To this end, different obligations are stipulated between developed countries and
developing countries. Since the withdrawal of the United States from Kyoto Protocol
in 2002, some scholars have expressed concerns over the consequences of some major
powers’ refusal to participate in emission reduction: first, it may weaken the
competitiveness of countries performing their emission reduction obligations; second,
emissions by countries lacking in emission reduction may increase, hence weakening
the effectiveness of emission reduction efforts of countries fulfilling their obligations,
i.e. the incurrence of carbon leakage. In recent years, a number of developed countries
in Europe and North America proposed the so-called “carbon tariff” measures, i.e.
imposing carbon tariffs on imported products with reference to the intensity of carbon
emissions or requiring importers to purchase carbon quotas based on the quantity of
imported commodities in the name of reducing carbon leakage, safeguarding the
effectiveness of global climate policies and protecting the competitiveness of their
domestic industries. In Article 10 (b) of Climate and Energy Package passed by EU in
December 2008, the imposition of carbon tariffs is defined as a feasible policy to
solve the carbon leakage problem85. The American Clean Energy and Security Act
passed by the U.S, Congress in June 2009 also explicitly stipulates that the United
States shall implement border adjustment measures or carbon tariffs from 2020 in an
effort to effectively control carbon leakage.
Carbon tariffs may appear in different forms. The tariff based on commercial carbon
emission is known as carbon tariff in a strict sense, while other policies may
practically influence the flow of international trade even though they do not appear in
the form of tariffs, which are known as carbon tariffs in a broad sense. For example,
the announcement of EU to integrate aviation emissions into EUETS by 2012, which
has attracted much attention from the international community, indicates that airlines
with destinations in EU countries must purchase carbon credit. Besides, an increasing
number of enterprises impose discrimination on products and services based on
embedded carbon in products and services through voluntary carbon labeling or
similar measures. The imposition of carbon tariffs in whichever form will cast
inevitable impact on numerous developing countries, especially China.
At present, no definite conclusion is yet made regarding the legitimacy of carbon
tariffs under WTO. Developed and developing countries are in drastically conflicting
positions on this issue, and different opinions exist even within EU. There are
mounting possibilities of potential conflicts in practice between international climate
85 See http://eur-lex.europa.eu/LexUriServ/LexUriServ.do?uri=CONSLEG:2003L0087:20090625:EN:PDF。
163
regime and international trade rules.
Liberalization of Low-Carbon Products and Subsidy Policies
In recent years, various incentives are designed by countries to encourage the
development of renewable energies, and international trade frictions triggered by
low-carbon products and technologies are increasing in number. An earlier case was
the high anti-dumping tax imposed by EU on energy-saving light bulbs manufactured
in China since 2001, followed by a 1-year prolongation ruled by the EU Commission
in 2007 when the policy expired. In fact, this energy-saving light bulb account for
merely one quarter of the market demand in EU, which prioritizes the enhancement of
energy efficiency, thus protecting the interests of a small number of enterprises (such
as Siemens). Another example took place in September 2009 when manufacturers of
PV components in Germany lobbied the German government and the EU Commission
to launch an anti-dumping investigation of PV cells manufactured in China, claiming
that the Ministry of Finance of China subsidized PV power plant projects at 50% of
the total investment, which means direct subsidies were granted to PV enterprises in
China. In fact, Germany is one of the first countries to provide policy support for PV
power plants. Faced with Chinese manufacturers’ competitiveness of lower costs,
developed countries have instituted trade barriers in the PV sector to protect the
interests of domestic enterprises. A more recent case is the lawsuit filed by the United
Steelworkers of America against China subsidizing the export of wind farm
equipment which has caused unfair competition, and the United States launched a
countervailing duty investigation of China’s clean energy sector based on Article 301.
Trade liberalization of low-carbon products and services constitutes one of the key
topics in the Doha Round of WTO. Trade liberalization has positive implications on
mitigation of climate change as well as increased trade volume between developed
and developing countries. Yet the negotiations are in a stalemate as severe conflicts
exist between the positions of developed countries and their developing counterparts
due to concerns over their respective interests.
Intellectual Property Right (IPR) and Technical Transfer
It is commonly acknowledged that technology plays a key role in international
response to climate change. However, due to severely conflicting standpoints of
various parties, progress in technical issues has been very slow in the international
climate negotiations, among which intellectual property right is a focal point.

164
Developed countries hold that it is enterprises rather than the government that possess
the intellectual property right of low-carbon technologies, and that related rules of IPR
protection must not be violated, proclaiming the role of the private sector and the
market so as to translate the obligations of technical transfer explicitly stipulated in
UNFCCC into technical trade in business model. Meanwhile, developed countries
emphasize that developing countries are also responsible for ameliorating the
domestic institutional environment which is unfriendly to technical transfer and
removing major obstacles hampering the absorption, digestion and application of
environmentally-friendly technologies.
Developing countries, on the other hand, emphasize that the objects of technical
transfer under UNFCCC are environmentally non-hazardous technologies related to
adaptation and mitigation of climate change whose application will generate global
benefits, while some technologies merely feature global environmental benefits and
some even pursue such global benefits at the cost of interests of the host country.
Besides, technical transfer under UNFCCC is an obligation of developed countries
and an important reflection of “common but differentiated responsibilities, thus
should be on a free or favored basis rather than transfer activities on a purely business
basis. Regarding intellectual property rights, although developing countries
acknowledge the necessity of IPR protection to facilitate investment in technologies
by the private sector, yet due to the special properties of environmentally-friendly
technologies and the urgency to address the climate change, it would be inappropriate
to implement IPR protection measures such as patent arrangement identical with
general commercial technologies; instead, new methods to overcome these obstacles
should be pursued, such as compulsory patent approval, common technical research
and contribution of patent, etc.
Effective financial mechanism is the most fundamental guarantee for successful
technical transfer. Developing countries call for a global technology fund to be
established to facilitate technical development and transfer relying on non-market
multilateral public finance. To this end, relevant parties in Copenhagen Agreement
have agreed on the establishment of a technology mechanism facilitating technical
development and transfer; yet the creation of new mechanisms and institutions cannot
essentially solve problems and functions, procedures of implementation and executive
power of such a mechanism must be clarified in the follow-up negotiations.
4.4.4 China’s Status, Role, and Strategic Choices
As is seen from above, international trade and investment rules are particularly
165
important for the climate issue, and China, as a major participant and one of the
emitters, should integrate itself in the rulemaking process. With rising political and
economic power as well as increasingly prominent status of China in the international
arena, voices exaggerating China’s strength and demanding it for more international
obligations are constantly heard. Such pressure comes from developed countries and
certain developing countries as well, and some Chinese nationals, filled with pride of
the tremendous achievement of the country, have become rather arrogant. In this
regard, we should be aware of the fact that China is still in a process of urbanization
and industrialization without fundamental changes in its identity as a developing
country. For China to become a responsible major power, it must first be clearly aware
of its position as a developing country before actively fulfilling its international
responsibilities accordingly.
As a major developing country, China still has a long way to go before ascending to
world power in a real sense, and poverty elimination and economic development are
still the priorities of the country. Balanced social development, well-constructed and
comprehensive social security system, structuring of a fair distribution system and
efficient administrative system, coordination between development and population,
resources and environment and facilitation of industrial upgrading are all daunting
challenges that must be addressed in the course of development. The target of
reducing carbon density by 40%-45% by 2020 on the basis of 2005 is a voluntary
target of mitigation that China has set proceeding from its national reality and a
solemn pledge to the international community as a responsible major power. China
shall proclaim the truth through its own efforts that China’s development requires a
peaceful and stable international environment and its development is contributive to
global peace and stability.
In regard of facilitating financing for environmental-friendly and low-carbon projects
and formulating standards for low-carbon products and services, China should provide
more incentives on the domestic side to attract low-carbon investment and facilitate
trade and investment liberalization of low-carbon products and services
(technologies). On the other hand, we should oppose to tariff or non-tariff trade
discrimination based on embedded emissions. It may serve the interests of China to
introduce environmental responsibilities or climate-friendly principles into BITs while
it is necessary to open tariff-related discussions in WTO and UNFCCC in a timely
manner.
Therefore, China must actively participate in international climate negotiations,
strengthen international cooperation and play a more active and constructive role in
166
structuring international climate regime. Special attention should be given to the
relationship between climate and international trade and investment, study and
analyze its potential influence on China, clarify China’s standpoint and strategies in
international negotiations in related issues and actively participate in international
rulemaking so as to safeguard China’s long-term interests and contribute to the global
transition of green and low-carbon economy.
Considering China’s prominent position in the international society and its status in
international trade and investment, the future development and trend in this regard are
most influential to China and China cannot be excluded from the scene. However, to
participate in relevant international rulemaking and safeguard its interests, an accurate
and clear review of the abovementioned issues as well as an in-depth analysis of their
impact on China must be completed so as to determine China’s standpoint and
strategies in international negotiations on related issues. Key issues in several aspects
are selected respectively in the fields of international trade and investment for detailed
analysis below.
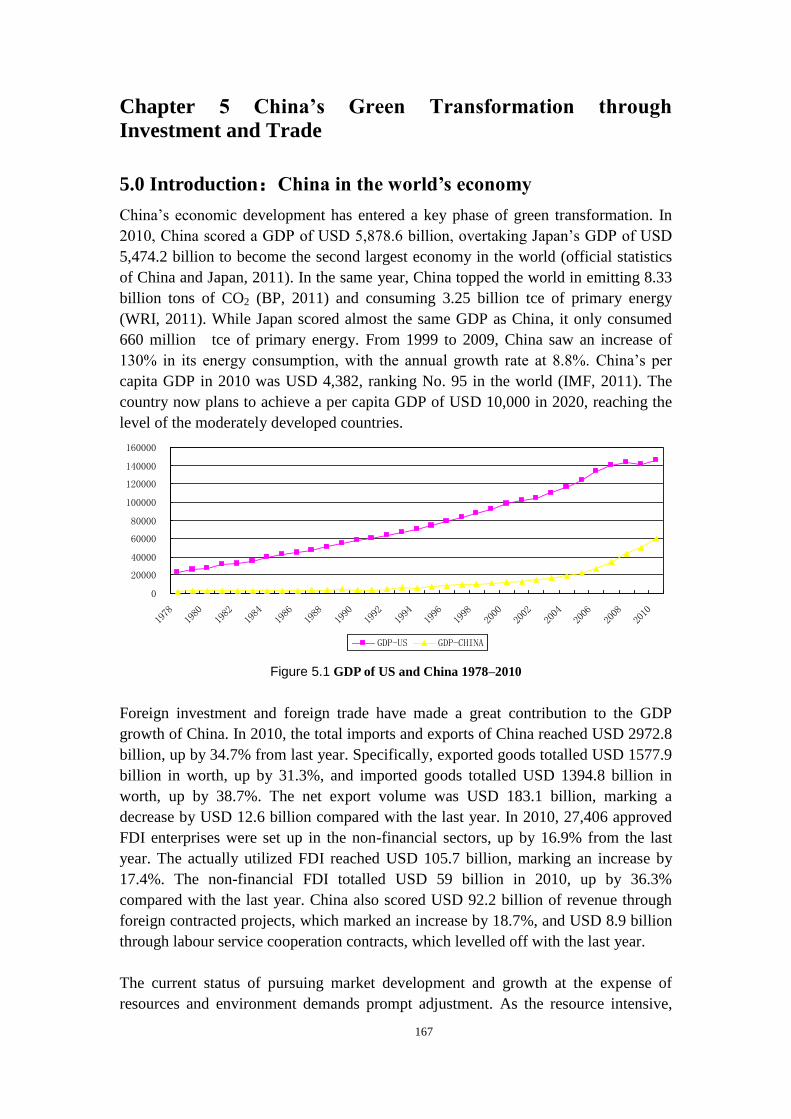
167
Chapter 5 China’s Green Transformation through
Investment and Trade
5.0 Introduction:China in the world’s economy
China’s economic development has entered a key phase of green transformation. In
2010, China scored a GDP of USD 5,878.6 billion, overtaking Japan’s GDP of USD
5,474.2 billion to become the second largest economy in the world (official statistics
of China and Japan, 2011). In the same year, China topped the world in emitting 8.33
billion tons of CO2 (BP, 2011) and consuming 3.25 billion tce of primary energy
(WRI, 2011). While Japan scored almost the same GDP as China, it only consumed
660 million tce of primary energy. From 1999 to 2009, China saw an increase of
130% in its energy consumption, with the annual growth rate at 8.8%. China’s per
capita GDP in 2010 was USD 4,382, ranking No. 95 in the world (IMF, 2011). The
country now plans to achieve a per capita GDP of USD 10,000 in 2020, reaching the
level of the moderately developed countries.
0
20000
40000
60000
80000
100000
120000
140000
160000
1978
1980
1982
1984
1986
1988
1990
1992
1994
1996
1998
2000
2002
2004
2006
2008
2010
GDP-US GDP-CHINA
Figure 5.1 GDP of US and China 1978–2010
Foreign investment and foreign trade have made a great contribution to the GDP
growth of China. In 2010, the total imports and exports of China reached USD 2972.8
billion, up by 34.7% from last year. Specifically, exported goods totalled USD 1577.9
billion in worth, up by 31.3%, and imported goods totalled USD 1394.8 billion in
worth, up by 38.7%. The net export volume was USD 183.1 billion, marking a
decrease by USD 12.6 billion compared with the last year. In 2010, 27,406 approved
FDI enterprises were set up in the non-financial sectors, up by 16.9% from the last
year. The actually utilized FDI reached USD 105.7 billion, marking an increase by
17.4%. The non-financial FDI totalled USD 59 billion in 2010, up by 36.3%
compared with the last year. China also scored USD 92.2 billion of revenue through
foreign contracted projects, which marked an increase by 18.7%, and USD 8.9 billion
through labour service cooperation contracts, which levelled off with the last year.
The current status of pursuing market development and growth at the expense of
resources and environment demands prompt adjustment. As the resource intensive,
168
energy intensive and pollution intensive products with low added value make up a
large proportion in the export structure in China, they will bring forth net losses to
China’s environment. Therefore, a major theme of China’s future development will be
how to realize the green transformation through investment and foreign trade. The
green transformation is a strategic choice in China’s adjustment of growth path and a
necessary solution to realize sustainable, environment-friendly development. It is
foreseeable that investment and foreign trade will become a driving force for the
green transformation in China.
Green transformation is a comprehensive concept that combines low carbon economy,
ecological economy, and recycling economy. OECD defines green growth as “a way
to pursue economic growth and development, while preventing environmental
degradation, biodiversity loss, and unsustainable natural resource use” 86. On the basis
of this definition and under the guidance of the Twelfth Five-Year Plan, we may
define China’s green transformation as a shift from the imbalanced, uncoordinated,
and unsustainable mode of economic development towards balanced, coordinated, and
sustainable mode of economic development, so as to loosen and eliminate the
resource and environmental constraints on economic development 87 . This is a
transformation from the traditional mode to the intensive mode of economic
development. In order to develop the economy along the balanced, coordinated and
sustainable track, it is vitally important to utilize investment, foreign trade and
environmental measures. The misuse of these measures may result in lack of balance,
coordination, and sustainability, whereas the appropriate designing and utilization of
the measures will provide the boost and guarantee for the green transformation.
The global green transformation is of tremendous significance. It can not only reduce
the emission of greenhouse gases, deal with extreme weather conditions caused by
climate change proactively, and reduce the related losses, but also bring forth
enormous potential income. Green transformation serves the fundamental interests of
all countries in their economic and social development. China and the rest of the
world need to recognize the significance of green development and transformation as
early as possible, and formulate corresponding development strategies to promote
South-South and South-North cooperation and achieve common development. OECD
has conducted a simulation analysis on the basis of the ENV-Linkages model on the
objectives, actions and income potential in the greenhouse gas emission reduction
projects of various countries. While US promised to reduce its greenhouse gas
emission by 17% in 2020 on the basis of the emission in 2005, the objective
simulation revealed a deviation of -5.5% from the base year, which was 11.5% higher
than the promised objective. China promised to reduce its greenhouse gas emission by
40% to 45% in 2020 on the basis of the emission in 2005, whereas the objective
simulation revealed a deviation of 62.3% from the base year, which was 102.3% to
107.3% higher than its promise objective. Therefore, both China and US have
86 OECD Ministerial Meeting, May 27-28, 2010. 87 P.5, The 12th Five-year Plan. “3-noes”.
169
overestimated their greenhouse gas emission reduction capabilities and made highly
optimistic promises. This adds both difficulties and impetus for the green
transformation. Green transformation goes hand in hand with the national interest.
According to the same OECD report, the potential income of the green transformation
of US is USD 253 billion, and for China the figure is USD 81.9 billion. The earlier
countries recognize the necessity and importance of green transformation, analyze the
focuses and intricacies, and identify a reasonable path to green transformation, the
earlier will they formulate green development strategy, rise to the challenge and
benefit from it.
Western countries have noticed China’s increasing strength in the competition for the
overseas resources and market as a result of its growth in economic and trade
activities. In criticizing China’s investment in Africa, German Minister Niebel for
Economic Cooperation and Development said, “I call the Chinese practice of
‘no-interference’ indulgence. Germany will pay more attention to human rights and
fighting corruption.” 88 When the US Secretary of State Hilary Clinton visited Africa,
she even warned in her speech to “keep a vigilant watch for China’s
‘neocolonialism’.” 89 Obviously, Western countries have paid close attention to
China’s investment and trade activities and are powerful opponents in our
international economic and trade development.
In his keynote report at the 17th
CPC National Congress90, Chairman Hu Jintao
pointed out, “we must pursue comprehensive, balanced and sustainable development.
In accordance with the overall arrangements for the cause of socialism with Chinese
characteristics, we will promote all-round economic, political, cultural and social
development, coordinate all links and aspects of our modernization drive, and balance
the relations of production with the productive forces and the superstructure with the
economic base. We must adopt an enlightened approach to development that results in
expanded production, a better life and sound ecological and environmental conditions,
and build a resource-conserving and environment-friendly society that coordinates
growth rate with the economic structure, quality and efficiency, and harmonizes
economic growth with the population, resources and the environment, so that our
people will live and work under sound ecological and environmental conditions and
our economy and society will develop in a sustainable way.” In his evaluation of the
achievements of the 11th
five-year plan and introduction of the objectives in the 12th
five-year plan, Chairman Hu put forward the idea to promote and achieve green
transformation through adjustments of the investment and trade policies.
The trend of Global Green Transformation is quite obvious. The up-coming Rio+20
UN conference will further promote green global transformation, which will be 88 Global Times. 5 Dec. 2010. 89 Reuters. 11 Jun. 2011. 90 Chairman Hu Jintao’s keynote report at the 17th CPC National Congress:
http://news.xinhuanet.com/newscenter/2007-10/24/content_6938568.htm
170
another step after Copenhagen, Cancun, and Durban for the world to move towards
Green. China has inner motivations in green transformation. During the Copenhagen
Conference, the Chinese government committed the its 40-45 targets to the world, and
will implement these low carbon, green policies in its 12th and 13th five year
plans.These whole series of international agreements and domestic policies will have
strong impacts on investment and trade, change their stucture and promote the
Chinese economy towards green. First, large volume of investments will be guided
towards new energy sectors; second, international trade protection appears in the form
of Carbon Tarriff; third, greenhouse gazes are going to be treated as local pollutants,
which will promote industrial upgrading and economic transformation.
5.1 Achievements and Objectives of China’s Green
transformation
A review of the achievements and the accomplished objectives during the 11th
five-year plan can reveal the intricacies and challenges in China’s future green
transformation, as the green transformation is mainly guided by the five-year plans
throughout all the development phases. During the 11th
five-year plan period, China
has scored outstanding achievements in environmental protection, but it will still face
agreat number of challenges and hurdles in the future.
5.1.1 Achievements in Eleventh Five-Year Plan Period (2006-2010)
The 11th
five-year plan set down the development objective of building a
resource-conserving, environment-friendly society. Specifically, the plan laid down 7
environmental objectives, 6 of which have been accomplished on time. The following
table shows the major achievements in environmental protection during the Eleventh
Five-Year Plan period. China’s utilization of wind and solar power is growing at a far
faster speed than that of developed countries. Currently the emphasis of China’s
economic growth has gradually shifted from expansion of quantity to enhancement of
quality. The significance of manufacturing will decline continuously while the
services will rise in proportion. To maintain the same economic growth speed will
demand far less energy consumption. Therefore, although greenhouse gas emission in
China will increase with its economic development, but it is unlikely to grow at the
rate of 10% or more.
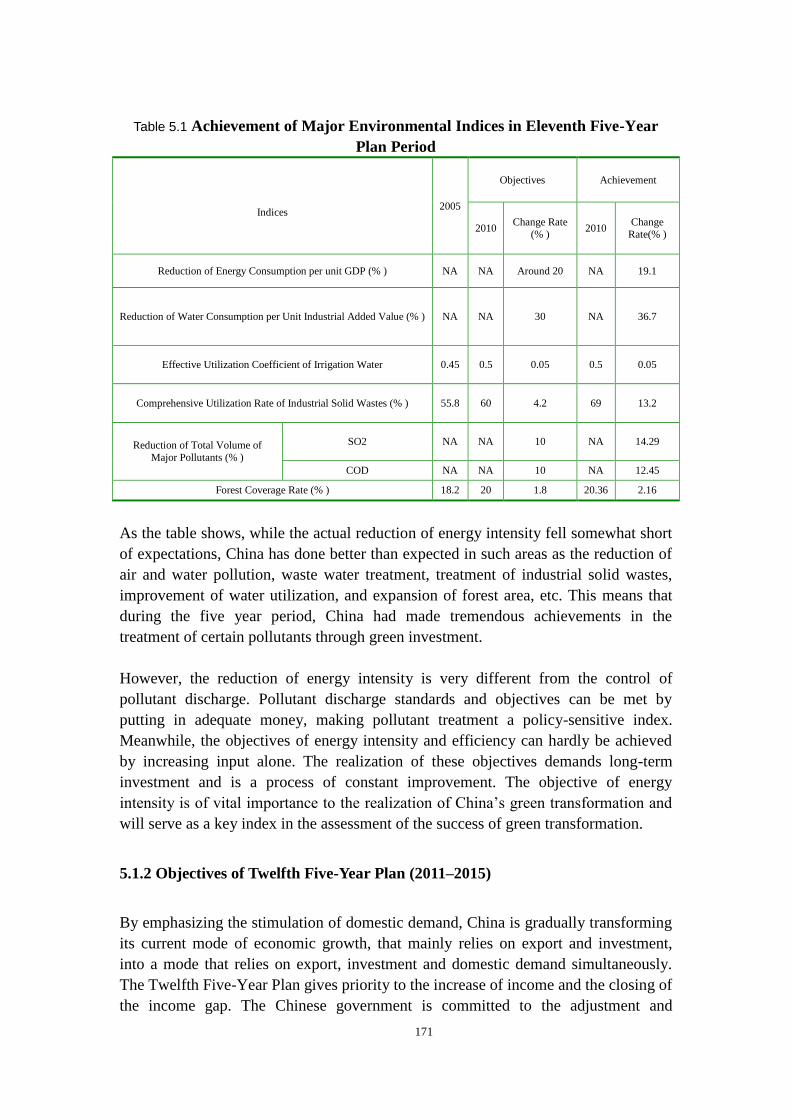
171
Table 5.1 Achievement of Major Environmental Indices in Eleventh Five-Year
Plan Period
Indices 2005
Objectives Achievement
2010 Change Rate
(% ) 2010
Change
Rate(% )
Reduction of Energy Consumption per unit GDP (% ) NA NA Around 20 NA 19.1
Reduction of Water Consumption per Unit Industrial Added Value (% ) NA NA 30 NA 36.7
Effective Utilization Coefficient of Irrigation Water 0.45 0.5 0.05 0.5 0.05
Comprehensive Utilization Rate of Industrial Solid Wastes (% ) 55.8 60 4.2 69 13.2
Reduction of Total Volume of
Major Pollutants (% )
SO2 NA NA 10 NA 14.29
COD NA NA 10 NA 12.45
Forest Coverage Rate (% ) 18.2 20 1.8 20.36 2.16
As the table shows, while the actual reduction of energy intensity fell somewhat short
of expectations, China has done better than expected in such areas as the reduction of
air and water pollution, waste water treatment, treatment of industrial solid wastes,
improvement of water utilization, and expansion of forest area, etc. This means that
during the five year period, China had made tremendous achievements in the
treatment of certain pollutants through green investment.
However, the reduction of energy intensity is very different from the control of
pollutant discharge. Pollutant discharge standards and objectives can be met by
putting in adequate money, making pollutant treatment a policy-sensitive index.
Meanwhile, the objectives of energy intensity and efficiency can hardly be achieved
by increasing input alone. The realization of these objectives demands long-term
investment and is a process of constant improvement. The objective of energy
intensity is of vital importance to the realization of China’s green transformation and
will serve as a key index in the assessment of the success of green transformation.
5.1.2 Objectives of Twelfth Five-Year Plan (2011–2015)
By emphasizing the stimulation of domestic demand, China is gradually transforming
its current mode of economic growth, that mainly relies on export and investment,
into a mode that relies on export, investment and domestic demand simultaneously.
The Twelfth Five-Year Plan gives priority to the increase of income and the closing of
the income gap. The Chinese government is committed to the adjustment and

172
balancing of the economic structure and the promotion of social fairness, so that the
majority of Chinese population would enjoy the benefits of economic development.
Green transformation is one of the highlights of the Twelfth Five-Year Plan. The
following table lists out the specific objectives on green transformation in the Twelfth
Five-Year Plan.
Table 5.2 Green Transformation Objectives in Twelfth Five-Year Plan
Indices 2010 2015 Change Rate
(% ) Nature
Proportion of Non-fossil Fuels in Primary Energy
Consumption (% ) 8.3 11.4 3.1 Binding
Reduction of Energy Consumption per Unit GDP (% ) NA NA
16 Binding
Reduction of CO2 Emission per Unit GDP (% )
NA NA
17 Binding
Reduction of Water Consumption per Unit Industrial Added
Value (% )
NA NA
30 Binding
Effective Utilization Coefficient of Irrigation Water 0.5 0.53 0.03 Prospective
Reduction of
Total Volume
of Major Pollutants (% )
SO2 NA NA 8
Binding
COD NA NA 8
Ammonia Nitrogen NA NA
10
Nitrogen Oxide NA NA
10
Forest Expansion
Forest Coverage (% ) 20.36 21.66 1.3 Binding
Forest Reserves (100 million cubic meters) 137 143 6
The objectives set down in the Twelfth Five-Year Plan provide an important
guarantee for China to achieve the 40-45 objectives. Chinese government plans to
reduce its carbon dioxide emission by 40% to 45% in 2020 as compared with 2005,
increase the proportion of non-fossil fuels in primary energy consumption to 15%,
expand the forest cover by 400 million hectares, and enhance the forest reserves by
1.3 billion cubic meters. Compared with the Eleventh Five-Year Plan, the Twelfth
Five-Year Plan added certain key binding indexes to promote green transformation,
such as the proportion of non-fossil fuels in primary energy consumption, and the
reduction of emission of CO2, ammonia nitrogen and nitrogen oxide, etc. The Twelfth
Five-Year Plan includes 11 indices of green transformation, 10 of which are binding.
The focus and the most difficult part of the indices is the energy-related objectives,
such as the proportion of non-fossil fuels in primary energy consumption, the
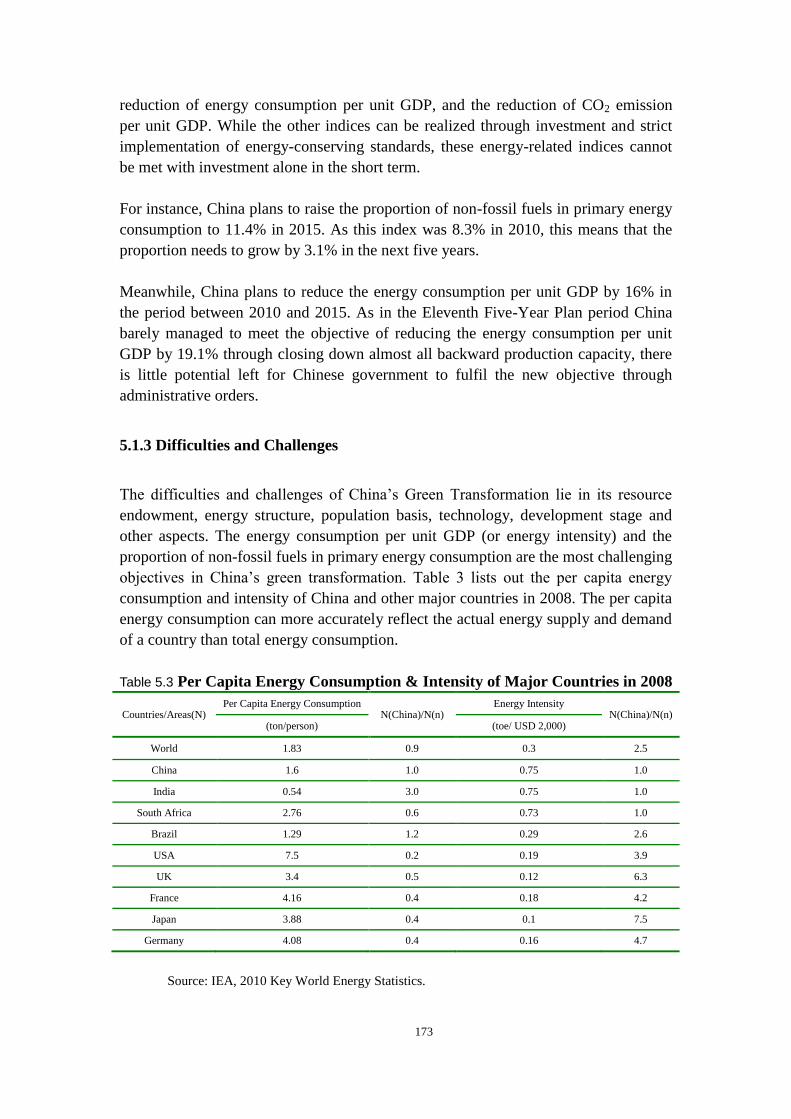
173
reduction of energy consumption per unit GDP, and the reduction of CO2 emission
per unit GDP. While the other indices can be realized through investment and strict
implementation of energy-conserving standards, these energy-related indices cannot
be met with investment alone in the short term.
For instance, China plans to raise the proportion of non-fossil fuels in primary energy
consumption to 11.4% in 2015. As this index was 8.3% in 2010, this means that the
proportion needs to grow by 3.1% in the next five years.
Meanwhile, China plans to reduce the energy consumption per unit GDP by 16% in
the period between 2010 and 2015. As in the Eleventh Five-Year Plan period China
barely managed to meet the objective of reducing the energy consumption per unit
GDP by 19.1% through closing down almost all backward production capacity, there
is little potential left for Chinese government to fulfil the new objective through
administrative orders.
5.1.3 Difficulties and Challenges
The difficulties and challenges of China’s Green Transformation lie in its resource
endowment, energy structure, population basis, technology, development stage and
other aspects. The energy consumption per unit GDP (or energy intensity) and the
proportion of non-fossil fuels in primary energy consumption are the most challenging
objectives in China’s green transformation. Table 3 lists out the per capita energy
consumption and intensity of China and other major countries in 2008. The per capita
energy consumption can more accurately reflect the actual energy supply and demand
of a country than total energy consumption.
Table 5.3 Per Capita Energy Consumption & Intensity of Major Countries in 2008
Countries/Areas(N) Per Capita Energy Consumption
N(China)/N(n) Energy Intensity
N(China)/N(n) (ton/person) (toe/ USD 2,000)
World 1.83 0.9 0.3 2.5
China 1.6 1.0 0.75 1.0
India 0.54 3.0 0.75 1.0
South Africa 2.76 0.6 0.73 1.0
Brazil 1.29 1.2 0.29 2.6
USA 7.5 0.2 0.19 3.9
UK 3.4 0.5 0.12 6.3
France 4.16 0.4 0.18 4.2
Japan 3.88 0.4 0.1 7.5
Germany 4.08 0.4 0.16 4.7
Source: IEA, 2010 Key World Energy Statistics.
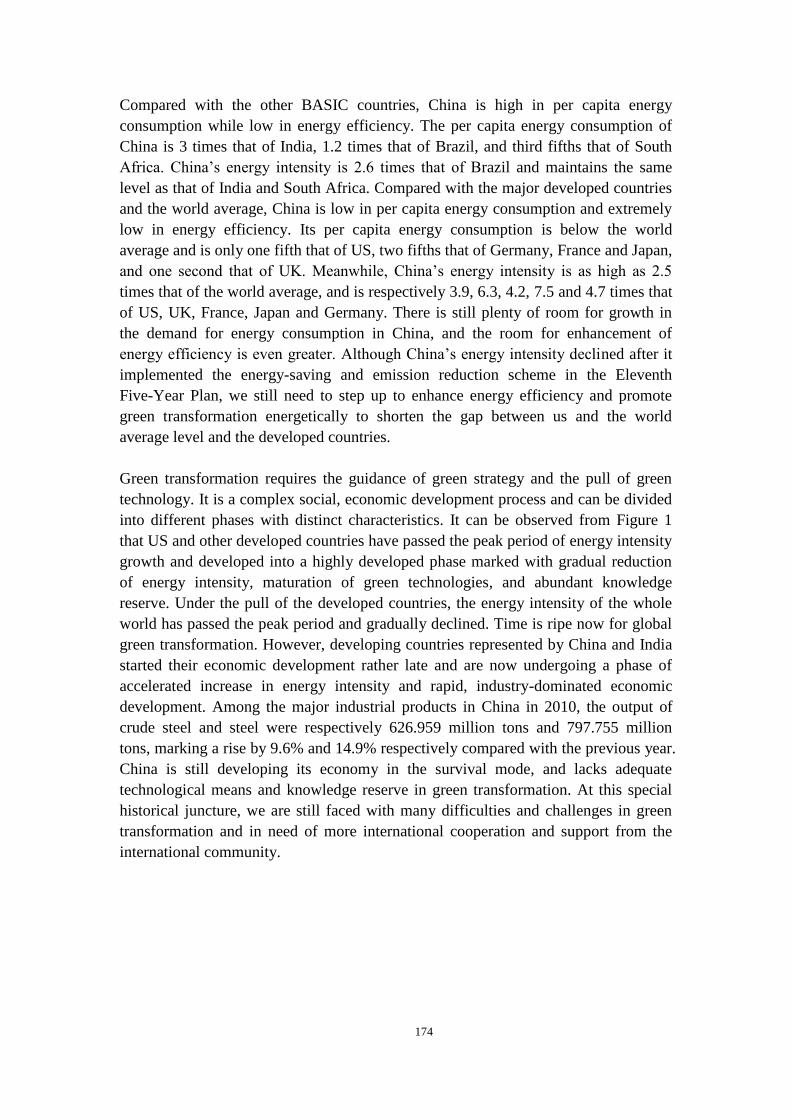
174
Compared with the other BASIC countries, China is high in per capita energy
consumption while low in energy efficiency. The per capita energy consumption of
China is 3 times that of India, 1.2 times that of Brazil, and third fifths that of South
Africa. China’s energy intensity is 2.6 times that of Brazil and maintains the same
level as that of India and South Africa. Compared with the major developed countries
and the world average, China is low in per capita energy consumption and extremely
low in energy efficiency. Its per capita energy consumption is below the world
average and is only one fifth that of US, two fifths that of Germany, France and Japan,
and one second that of UK. Meanwhile, China’s energy intensity is as high as 2.5
times that of the world average, and is respectively 3.9, 6.3, 4.2, 7.5 and 4.7 times that
of US, UK, France, Japan and Germany. There is still plenty of room for growth in
the demand for energy consumption in China, and the room for enhancement of
energy efficiency is even greater. Although China’s energy intensity declined after it
implemented the energy-saving and emission reduction scheme in the Eleventh
Five-Year Plan, we still need to step up to enhance energy efficiency and promote
green transformation energetically to shorten the gap between us and the world
average level and the developed countries.
Green transformation requires the guidance of green strategy and the pull of green
technology. It is a complex social, economic development process and can be divided
into different phases with distinct characteristics. It can be observed from Figure 1
that US and other developed countries have passed the peak period of energy intensity
growth and developed into a highly developed phase marked with gradual reduction
of energy intensity, maturation of green technologies, and abundant knowledge
reserve. Under the pull of the developed countries, the energy intensity of the whole
world has passed the peak period and gradually declined. Time is ripe now for global
green transformation. However, developing countries represented by China and India
started their economic development rather late and are now undergoing a phase of
accelerated increase in energy intensity and rapid, industry-dominated economic
development. Among the major industrial products in China in 2010, the output of
crude steel and steel were respectively 626.959 million tons and 797.755 million
tons, marking a rise by 9.6% and 14.9% respectively compared with the previous year.
China is still developing its economy in the survival mode, and lacks adequate
technological means and knowledge reserve in green transformation. At this special
historical juncture, we are still faced with many difficulties and challenges in green
transformation and in need of more international cooperation and support from the
international community.
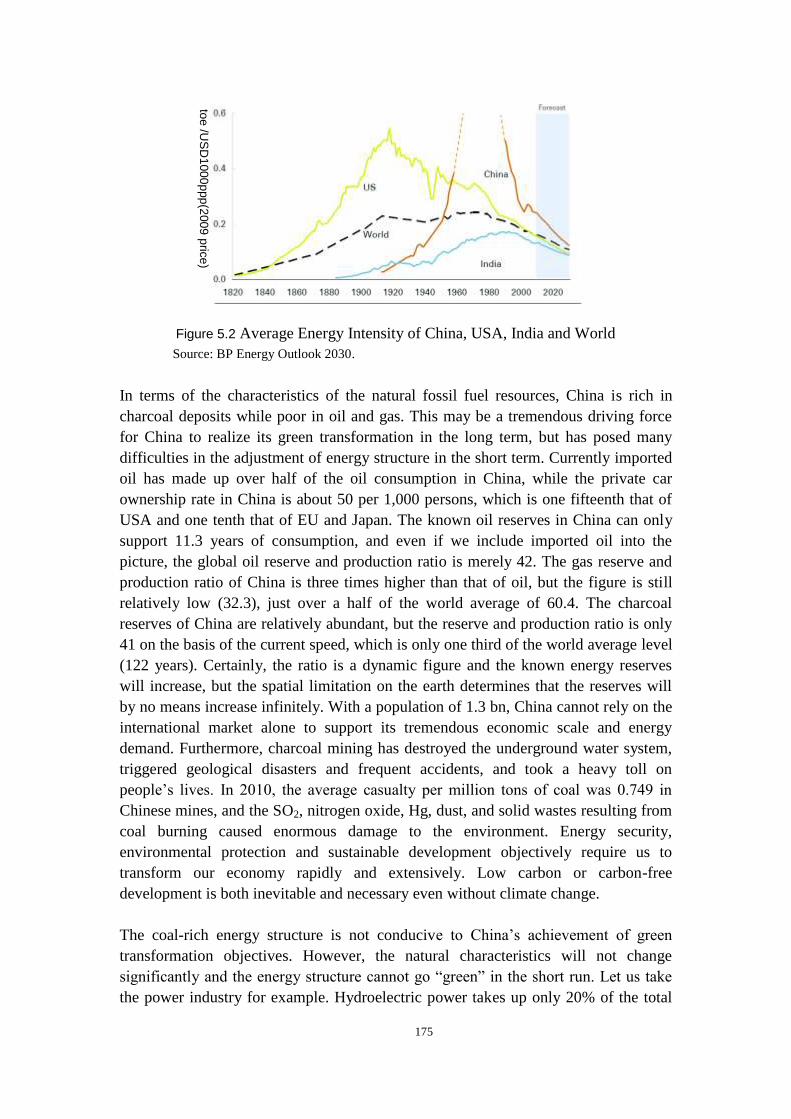
175
Figure 5.2 Average Energy Intensity of China, USA, India and World
Source: BP Energy Outlook 2030.
In terms of the characteristics of the natural fossil fuel resources, China is rich in
charcoal deposits while poor in oil and gas. This may be a tremendous driving force
for China to realize its green transformation in the long term, but has posed many
difficulties in the adjustment of energy structure in the short term. Currently imported
oil has made up over half of the oil consumption in China, while the private car
ownership rate in China is about 50 per 1,000 persons, which is one fifteenth that of
USA and one tenth that of EU and Japan. The known oil reserves in China can only
support 11.3 years of consumption, and even if we include imported oil into the
picture, the global oil reserve and production ratio is merely 42. The gas reserve and
production ratio of China is three times higher than that of oil, but the figure is still
relatively low (32.3), just over a half of the world average of 60.4. The charcoal
reserves of China are relatively abundant, but the reserve and production ratio is only
41 on the basis of the current speed, which is only one third of the world average level
(122 years). Certainly, the ratio is a dynamic figure and the known energy reserves
will increase, but the spatial limitation on the earth determines that the reserves will
by no means increase infinitely. With a population of 1.3 bn, China cannot rely on the
international market alone to support its tremendous economic scale and energy
demand. Furthermore, charcoal mining has destroyed the underground water system,
triggered geological disasters and frequent accidents, and took a heavy toll on
people’s lives. In 2010, the average casualty per million tons of coal was 0.749 in
Chinese mines, and the SO2, nitrogen oxide, Hg, dust, and solid wastes resulting from
coal burning caused enormous damage to the environment. Energy security,
environmental protection and sustainable development objectively require us to
transform our economy rapidly and extensively. Low carbon or carbon-free
development is both inevitable and necessary even without climate change.
The coal-rich energy structure is not conducive to China’s achievement of green
transformation objectives. However, the natural characteristics will not change
significantly and the energy structure cannot go “green” in the short run. Let us take
the power industry for example. Hydroelectric power takes up only 20% of the total
toe
/US
D1
00
0p
pp
(200
9 p
rice
)
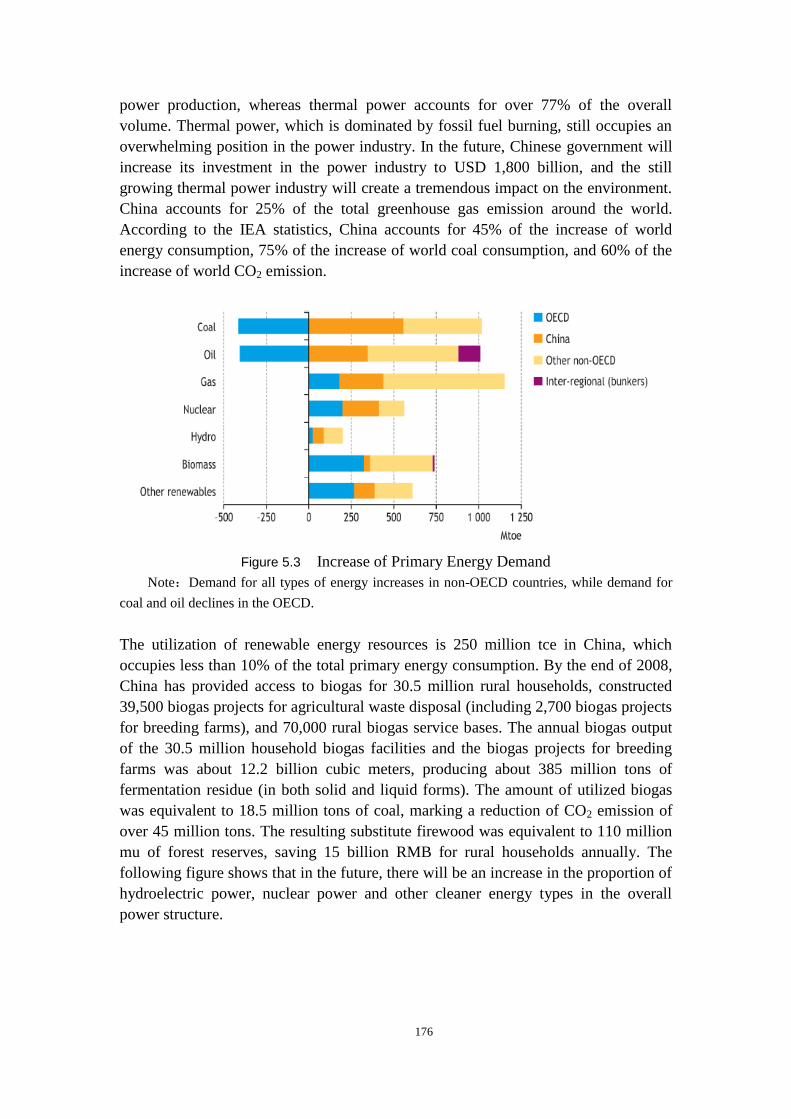
176
power production, whereas thermal power accounts for over 77% of the overall
volume. Thermal power, which is dominated by fossil fuel burning, still occupies an
overwhelming position in the power industry. In the future, Chinese government will
increase its investment in the power industry to USD 1,800 billion, and the still
growing thermal power industry will create a tremendous impact on the environment.
China accounts for 25% of the total greenhouse gas emission around the world.
According to the IEA statistics, China accounts for 45% of the increase of world
energy consumption, 75% of the increase of world coal consumption, and 60% of the
increase of world CO2 emission.
Figure 5.3 Increase of Primary Energy Demand
Note:Demand for all types of energy increases in non-OECD countries, while demand for
coal and oil declines in the OECD.
The utilization of renewable energy resources is 250 million tce in China, which
occupies less than 10% of the total primary energy consumption. By the end of 2008,
China has provided access to biogas for 30.5 million rural households, constructed
39,500 biogas projects for agricultural waste disposal (including 2,700 biogas projects
for breeding farms), and 70,000 rural biogas service bases. The annual biogas output
of the 30.5 million household biogas facilities and the biogas projects for breeding
farms was about 12.2 billion cubic meters, producing about 385 million tons of
fermentation residue (in both solid and liquid forms). The amount of utilized biogas
was equivalent to 18.5 million tons of coal, marking a reduction of CO2 emission of
over 45 million tons. The resulting substitute firewood was equivalent to 110 million
mu of forest reserves, saving 15 billion RMB for rural households annually. The
following figure shows that in the future, there will be an increase in the proportion of
hydroelectric power, nuclear power and other cleaner energy types in the overall
power structure.
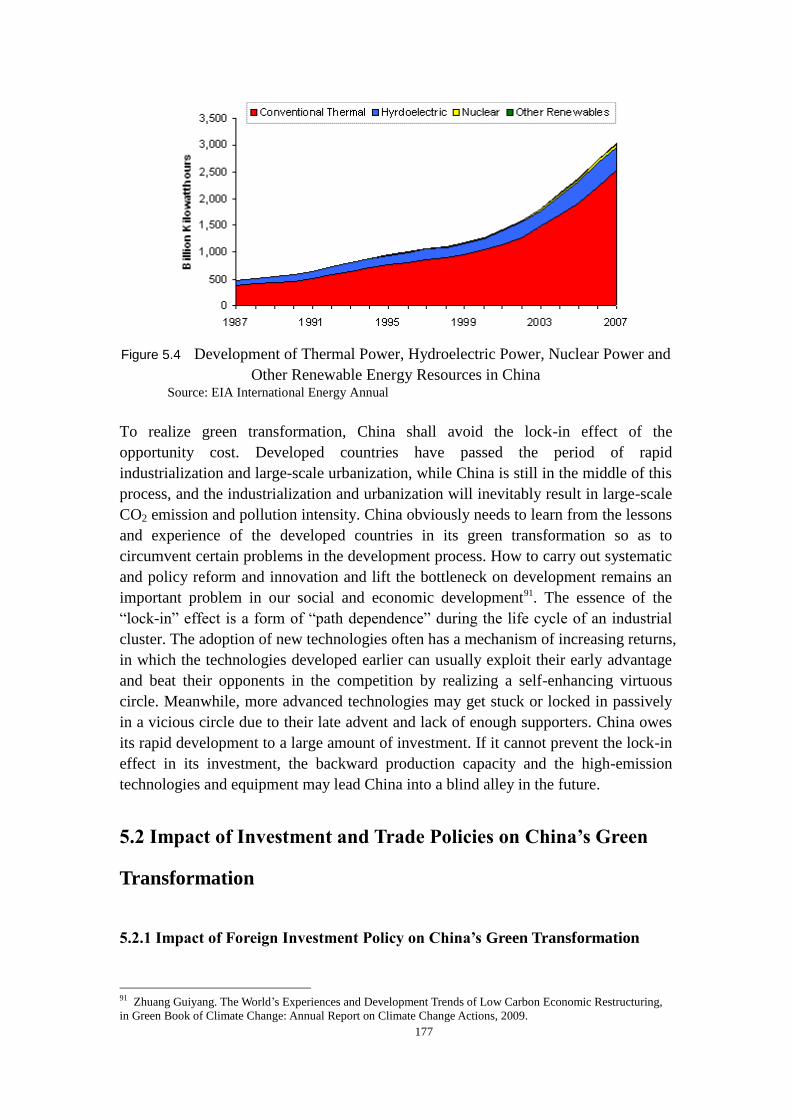
177
Figure 5.4 Development of Thermal Power, Hydroelectric Power, Nuclear Power and
Other Renewable Energy Resources in China Source: EIA International Energy Annual
To realize green transformation, China shall avoid the lock-in effect of the
opportunity cost. Developed countries have passed the period of rapid
industrialization and large-scale urbanization, while China is still in the middle of this
process, and the industrialization and urbanization will inevitably result in large-scale
CO2 emission and pollution intensity. China obviously needs to learn from the lessons
and experience of the developed countries in its green transformation so as to
circumvent certain problems in the development process. How to carry out systematic
and policy reform and innovation and lift the bottleneck on development remains an
important problem in our social and economic development91. The essence of the
“lock-in” effect is a form of “path dependence” during the life cycle of an industrial
cluster. The adoption of new technologies often has a mechanism of increasing returns,
in which the technologies developed earlier can usually exploit their early advantage
and beat their opponents in the competition by realizing a self-enhancing virtuous
circle. Meanwhile, more advanced technologies may get stuck or locked in passively
in a vicious circle due to their late advent and lack of enough supporters. China owes
its rapid development to a large amount of investment. If it cannot prevent the lock-in
effect in its investment, the backward production capacity and the high-emission
technologies and equipment may lead China into a blind alley in the future.
5.2 Impact of Investment and Trade Policies on China’s Green
Transformation
5.2.1 Impact of Foreign Investment Policy on China’s Green Transformation
91 Zhuang Guiyang. The World’s Experiences and Development Trends of Low Carbon Economic Restructuring,
in Green Book of Climate Change: Annual Report on Climate Change Actions, 2009.
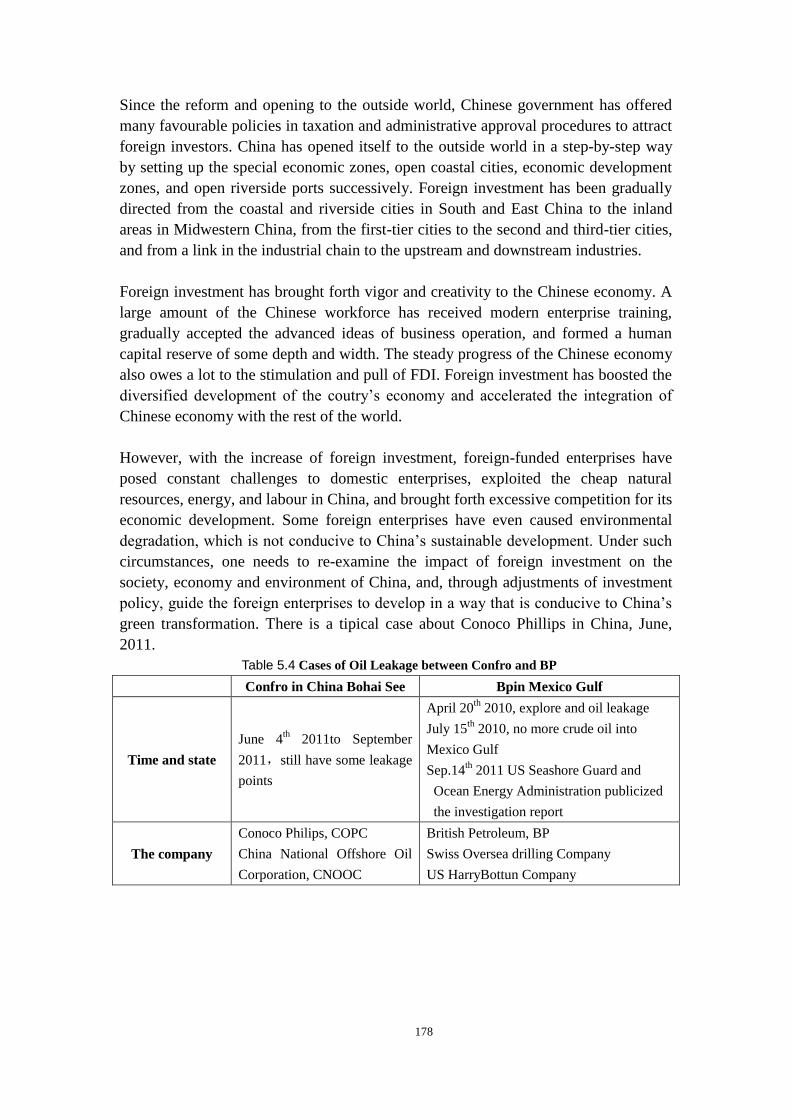
178
Since the reform and opening to the outside world, Chinese government has offered
many favourable policies in taxation and administrative approval procedures to attract
foreign investors. China has opened itself to the outside world in a step-by-step way
by setting up the special economic zones, open coastal cities, economic development
zones, and open riverside ports successively. Foreign investment has been gradually
directed from the coastal and riverside cities in South and East China to the inland
areas in Midwestern China, from the first-tier cities to the second and third-tier cities,
and from a link in the industrial chain to the upstream and downstream industries.
Foreign investment has brought forth vigor and creativity to the Chinese economy. A
large amount of the Chinese workforce has received modern enterprise training,
gradually accepted the advanced ideas of business operation, and formed a human
capital reserve of some depth and width. The steady progress of the Chinese economy
also owes a lot to the stimulation and pull of FDI. Foreign investment has boosted the
diversified development of the coutry’s economy and accelerated the integration of
Chinese economy with the rest of the world.
However, with the increase of foreign investment, foreign-funded enterprises have
posed constant challenges to domestic enterprises, exploited the cheap natural
resources, energy, and labour in China, and brought forth excessive competition for its
economic development. Some foreign enterprises have even caused environmental
degradation, which is not conducive to China’s sustainable development. Under such
circumstances, one needs to re-examine the impact of foreign investment on the
society, economy and environment of China, and, through adjustments of investment
policy, guide the foreign enterprises to develop in a way that is conducive to China’s
green transformation. There is a tipical case about Conoco Phillips in China, June,
2011.
Table 5.4 Cases of Oil Leakage between Confro and BP
Confro in China Bohai See Bpin Mexico Gulf
Time and state
June 4th 2011to September
2011,still have some leakage
points
April 20th
2010, explore and oil leakage
July 15th
2010, no more crude oil into
Mexico Gulf
Sep.14th 2011 US Seashore Guard and
Ocean Energy Administration publicized
the investigation report
The company
Conoco Philips, COPC
China National Offshore Oil
Corporation, CNOOC
British Petroleum, BP
Swiss Oversea drilling Company
US HarryBottun Company
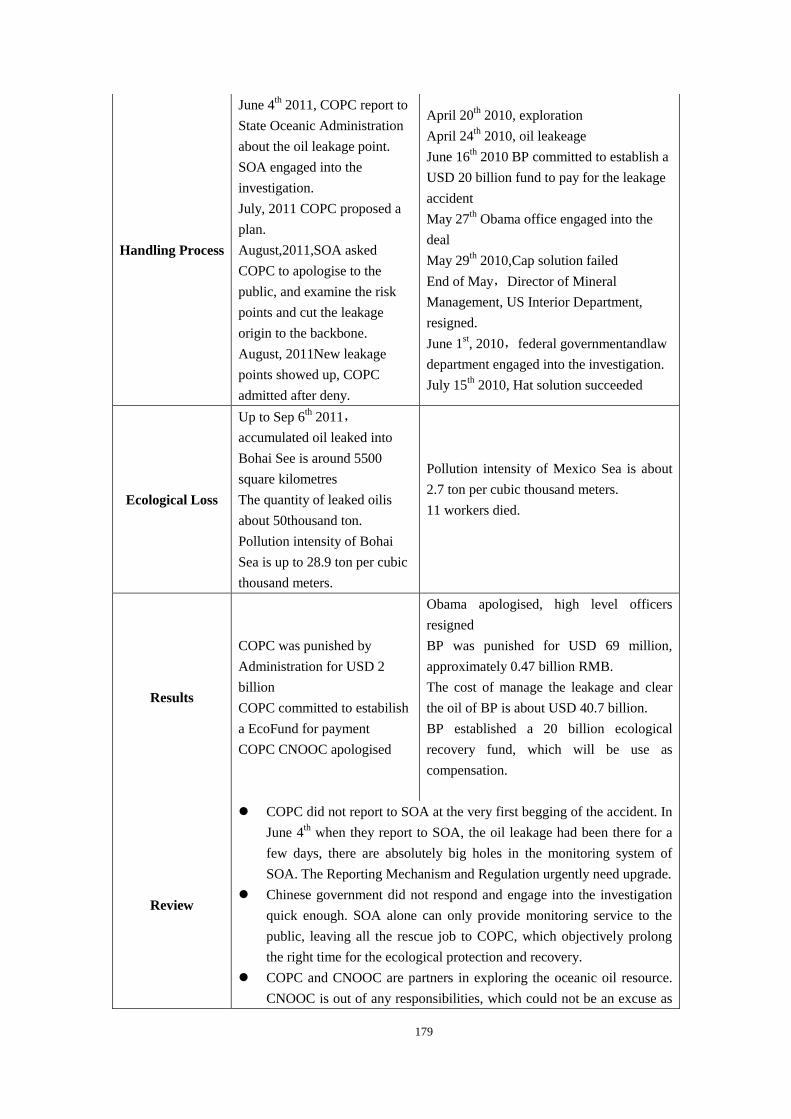
179
Handling Process
June 4th 2011, COPC report to
State Oceanic Administration
about the oil leakage point.
SOA engaged into the
investigation.
July, 2011 COPC proposed a
plan.
August,2011,SOA asked
COPC to apologise to the
public, and examine the risk
points and cut the leakage
origin to the backbone.
August, 2011New leakage
points showed up, COPC
admitted after deny.
April 20th
2010, exploration
April 24th
2010, oil leakeage
June 16th 2010 BP committed to establish a
USD 20 billion fund to pay for the leakage
accident
May 27th
Obama office engaged into the
deal
May 29th
2010,Cap solution failed
End of May,Director of Mineral
Management, US Interior Department,
resigned.
June 1st, 2010,federal governmentandlaw
department engaged into the investigation.
July 15th
2010, Hat solution succeeded
Ecological Loss
Up to Sep 6th 2011,
accumulated oil leaked into
Bohai See is around 5500
square kilometres
The quantity of leaked oilis
about 50thousand ton.
Pollution intensity of Bohai
Sea is up to 28.9 ton per cubic
thousand meters.
Pollution intensity of Mexico Sea is about
2.7 ton per cubic thousand meters.
11 workers died.
Results
COPC was punished by
Administration for USD 2
billion
COPC committed to estabilish
a EcoFund for payment
COPC CNOOC apologised
Obama apologised, high level officers
resigned
BP was punished for USD 69 million,
approximately 0.47 billion RMB.
The cost of manage the leakage and clear
the oil of BP is about USD 40.7 billion.
BP established a 20 billion ecological
recovery fund, which will be use as
compensation.
Review
COPC did not report to SOA at the very first begging of the accident. In
June 4th
when they report to SOA, the oil leakage had been there for a
few days, there are absolutely big holes in the monitoring system of
SOA. The Reporting Mechanism and Regulation urgently need upgrade.
Chinese government did not respond and engage into the investigation
quick enough. SOA alone can only provide monitoring service to the
public, leaving all the rescue job to COPC, which objectively prolong
the right time for the ecological protection and recovery.
COPC and CNOOC are partners in exploring the oceanic oil resource.
CNOOC is out of any responsibilities, which could not be an excuse as
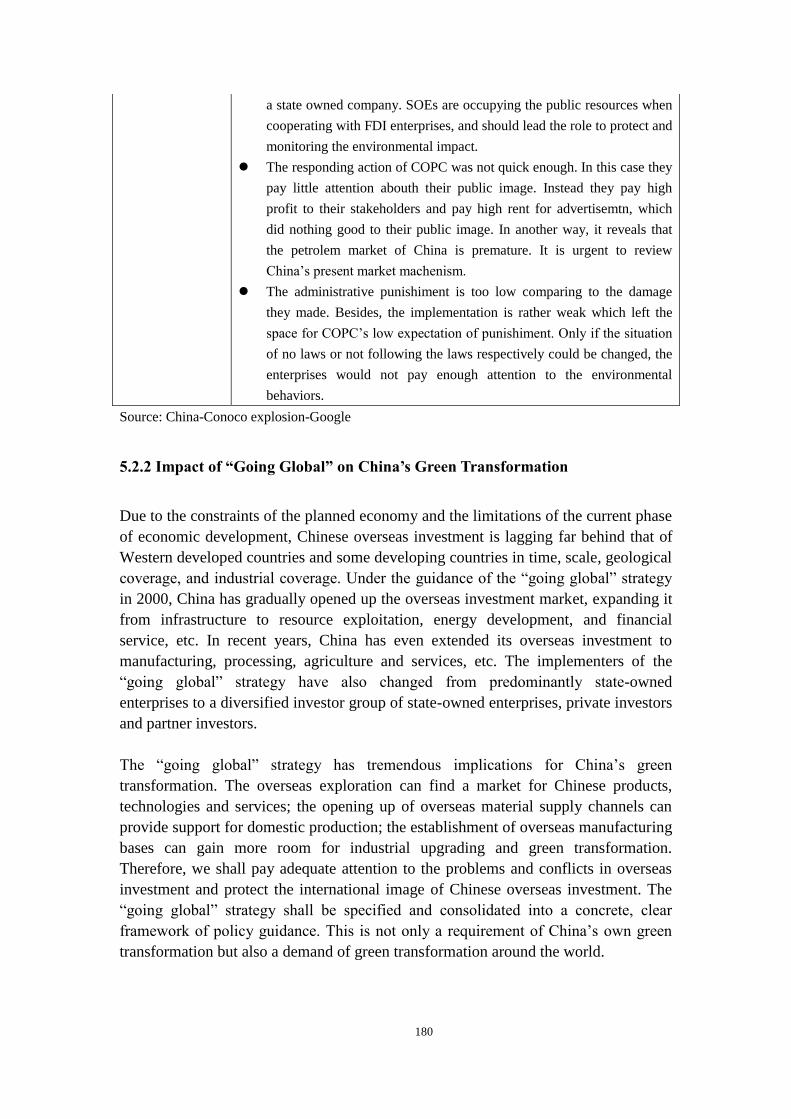
180
a state owned company. SOEs are occupying the public resources when
cooperating with FDI enterprises, and should lead the role to protect and
monitoring the environmental impact.
The responding action of COPC was not quick enough. In this case they
pay little attention abouth their public image. Instead they pay high
profit to their stakeholders and pay high rent for advertisemtn, which
did nothing good to their public image. In another way, it reveals that
the petrolem market of China is premature. It is urgent to review
China’s present market machenism.
The administrative punishiment is too low comparing to the damage
they made. Besides, the implementation is rather weak which left the
space for COPC’s low expectation of punishiment. Only if the situation
of no laws or not following the laws respectively could be changed, the
enterprises would not pay enough attention to the environmental
behaviors.
Source: China-Conoco explosion-Google
5.2.2 Impact of “Going Global” on China’s Green Transformation
Due to the constraints of the planned economy and the limitations of the current phase
of economic development, Chinese overseas investment is lagging far behind that of
Western developed countries and some developing countries in time, scale, geological
coverage, and industrial coverage. Under the guidance of the “going global” strategy
in 2000, China has gradually opened up the overseas investment market, expanding it
from infrastructure to resource exploitation, energy development, and financial
service, etc. In recent years, China has even extended its overseas investment to
manufacturing, processing, agriculture and services, etc. The implementers of the
“going global” strategy have also changed from predominantly state-owned
enterprises to a diversified investor group of state-owned enterprises, private investors
and partner investors.
The “going global” strategy has tremendous implications for China’s green
transformation. The overseas exploration can find a market for Chinese products,
technologies and services; the opening up of overseas material supply channels can
provide support for domestic production; the establishment of overseas manufacturing
bases can gain more room for industrial upgrading and green transformation.
Therefore, we shall pay adequate attention to the problems and conflicts in overseas
investment and protect the international image of Chinese overseas investment. The
“going global” strategy shall be specified and consolidated into a concrete, clear
framework of policy guidance. This is not only a requirement of China’s own green
transformation but also a demand of green transformation around the world.
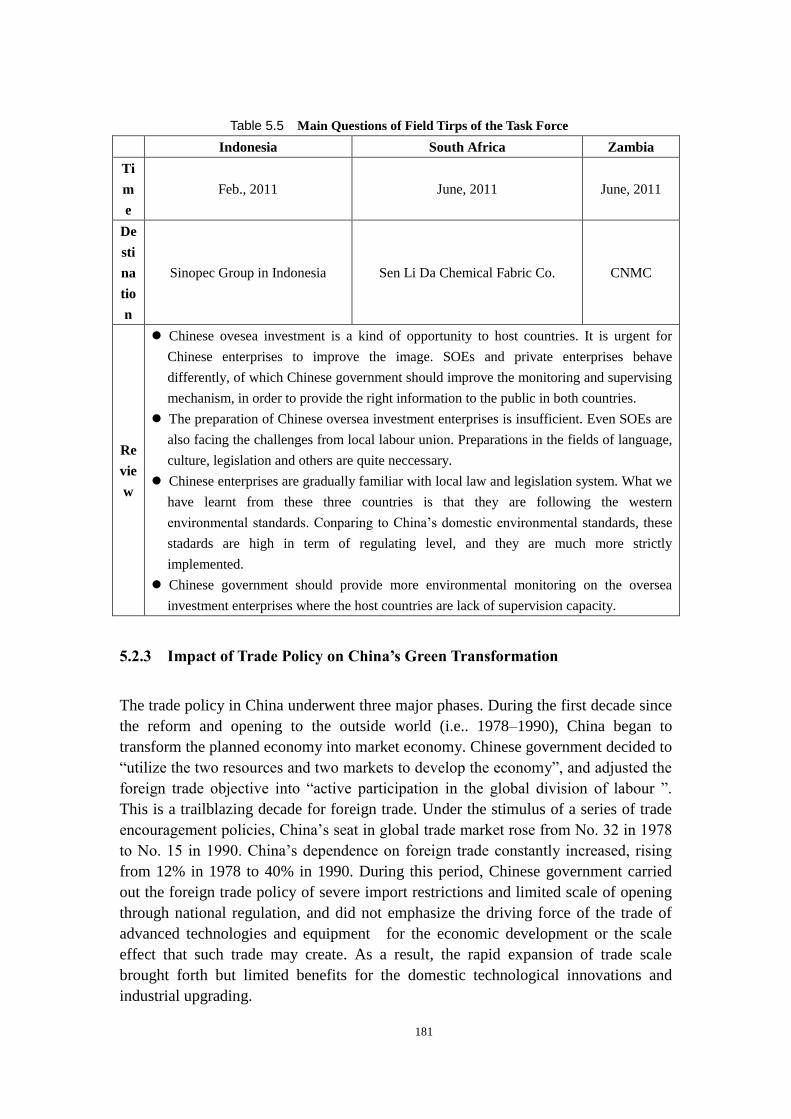
181
Table 5.5 Main Questions of Field Tirps of the Task Force
Indonesia South Africa Zambia
Ti
m
e
Feb., 2011 June, 2011 June, 2011
De
sti
na
tio
n
Sinopec Group in Indonesia Sen Li Da Chemical Fabric Co. CNMC
Re
vie
w
Chinese ovesea investment is a kind of opportunity to host countries. It is urgent for
Chinese enterprises to improve the image. SOEs and private enterprises behave
differently, of which Chinese government should improve the monitoring and supervising
mechanism, in order to provide the right information to the public in both countries.
The preparation of Chinese oversea investment enterprises is insufficient. Even SOEs are
also facing the challenges from local labour union. Preparations in the fields of language,
culture, legislation and others are quite neccessary.
Chinese enterprises are gradually familiar with local law and legislation system. What we
have learnt from these three countries is that they are following the western
environmental standards. Conparing to China’s domestic environmental standards, these
stadards are high in term of regulating level, and they are much more strictly
implemented.
Chinese government should provide more environmental monitoring on the oversea
investment enterprises where the host countries are lack of supervision capacity.
5.2.3 Impact of Trade Policy on China’s Green Transformation
The trade policy in China underwent three major phases. During the first decade since
the reform and opening to the outside world (i.e.. 1978–1990), China began to
transform the planned economy into market economy. Chinese government decided to
“utilize the two resources and two markets to develop the economy”, and adjusted the
foreign trade objective into “active participation in the global division of labour ”.
This is a trailblazing decade for foreign trade. Under the stimulus of a series of trade
encouragement policies, China’s seat in global trade market rose from No. 32 in 1978
to No. 15 in 1990. China’s dependence on foreign trade constantly increased, rising
from 12% in 1978 to 40% in 1990. During this period, Chinese government carried
out the foreign trade policy of severe import restrictions and limited scale of opening
through national regulation, and did not emphasize the driving force of the trade of
advanced technologies and equipment for the economic development or the scale
effect that such trade may create. As a result, the rapid expansion of trade scale
brought forth but limited benefits for the domestic technological innovations and
industrial upgrading.
182
During the 1990s (1990-2000), China adjusted its foreign trade policy objective into
“promoting economic growth”. However, the pull of foreign trade on China’s
economic growth was realized solely through expanded export. China intensified its
efforts to encourage exports and implemented such measures as raising export tax
rebates, retaining foreign exchange, and depreciating RMB considerably, etc. These
policies created immediate effects. Under the stimulus of the policies, China rapidly
expanded its export scale. The provision of abundant export subsidies enabled export
enterprises to make profits by selling their products overseas, sometimes even below
the break-even point. However, the overall foreign exchange reserves declined rather
than increased, and the export enterprises did not learn advanced technologies or
management expertise in the foreign trade. The trade policy that aimed solely at the
promotion of economic growth could not help enterprises to achieve green
transformation. On the contrary, the exported goods embedded a lot of resources and
energy, which even negatively affected China’s economic development.
Since its entry into WTO in 2001, China has steadily implemented its promises to
lower tariffs, eliminate import quotas, simplify administrative procedures and open its
market. By 2010, China has fulfilled all the promises it has made upon its entry into
WTO. In 2010, China scored an import and export volume of USD 2,972.76 billion,
marking a 34.7% increase over the same period the previous year. Specifically, the
exports reached USD 1,577.93 billion, up by 31.3% and ranking No.1 in the world;
the imports reached USD 1,394.83 billion, up by 38.7% and ranking third in the world.
Through the long-term surplus in foreign trade, China has accumulated a large foreign
exchange reserve and exported a large amount of natural resources and embedded
energy. Meanwhile, China is subject to the most numerous anti-dump investigations
in the world. The negative impact of trade on China’s sustainable development has
been constantly on the rise and caught the attention from all sides. Therefore, China
needs to draw lessons from the failures in the past, recognize the impact of
globalization on the sustainable development of Chinese economy, and reassess the
role and influence of product competitiveness, brand awareness, and embedded
energy in trade. The trend of economic development towards globalization and
diversification requires more specific and concrete trade policies. In the face of such
challenges as the repercussions of global financial crisis, the economic recovery, the
rise of green barriers, the increase of global energy and resource costs, and the fierce
competition, China should adjust its international trade policy proactively to facilitate
green transformation.
China’s green transformation has made the country one of the major seriously
engaged green global competitiors. It has also brought important new developing
opportunities to the global society. China’s green transformation is facing some
severe competition. After entering WTO, its international traders are continuously
facing double accusations of anti-dumping and anti-subsidies. The going out strategy
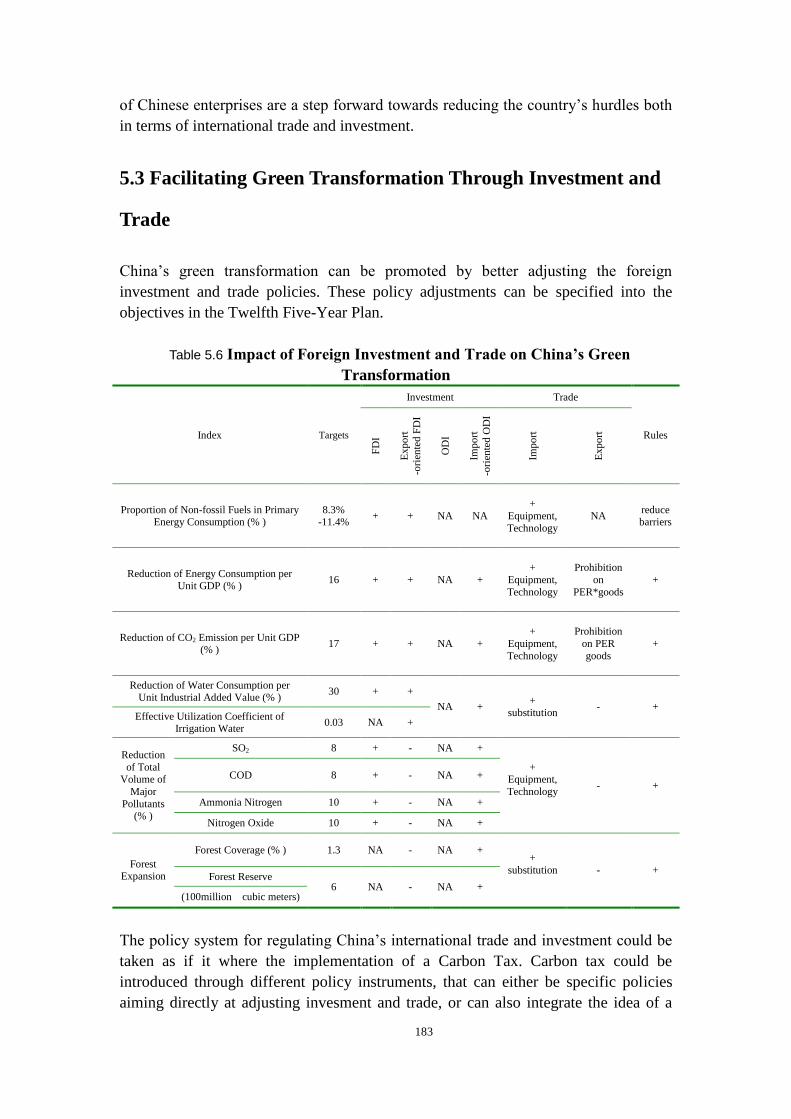
183
of Chinese enterprises are a step forward towards reducing the country’s hurdles both
in terms of international trade and investment.
5.3 Facilitating Green Transformation Through Investment and
Trade
China’s green transformation can be promoted by better adjusting the foreign
investment and trade policies. These policy adjustments can be specified into the
objectives in the Twelfth Five-Year Plan.
Table 5.6 Impact of Foreign Investment and Trade on China’s Green
Transformation
Index Targets
Investment Trade
Rules
FD
I
Exp
ort
-ori
ente
d F
DI
OD
I
Imp
ort
-ori
ente
d O
DI
Imp
ort
Exp
ort
Proportion of Non-fossil Fuels in Primary Energy Consumption (% )
8.3% -11.4%
+ + NA NA
+
Equipment,
Technology
NA reduce barriers
Reduction of Energy Consumption per Unit GDP (% )
16 + + NA +
+
Equipment,
Technology
Prohibition
on
PER*goods
+
Reduction of CO2 Emission per Unit GDP (% )
17 + + NA +
+
Equipment,
Technology
Prohibition
on PER
goods
+
Reduction of Water Consumption per Unit Industrial Added Value (% )
30 + +
NA + +
substitution - +
Effective Utilization Coefficient of Irrigation Water
0.03 NA +
Reduction
of Total Volume of
Major
Pollutants (% )
SO2 8 + - NA +
+ Equipment,
Technology
- + COD 8 + - NA +
Ammonia Nitrogen 10 + - NA +
Nitrogen Oxide 10 + - NA +
Forest Expansion
Forest Coverage (% ) 1.3 NA - NA + +
substitution
- + Forest Reserve
6 NA - NA + (100million cubic meters)
The policy system for regulating China’s international trade and investment could be
taken as if it where the implementation of a Carbon Tax. Carbon tax could be
introduced through different policy instruments, that can either be specific policies
aiming directly at adjusting invesment and trade, or can also integrate the idea of a
184
carbon tax into the macroeconomic policies. This implementation can be done either
in the form of a carbon tax, or in the form of an exchange rate adjustment. Among
other policy options used to influence investment and trade.
5.3.1 Facilitating China’s Green Transformation Through Foreign Investment
Since its reform and opening to the outside world, China has greatly benefited from
FDI, which propted growth, technological advances and social development. FDI has
played a particularly significant role in China’s administrative improvement and
technological advances in the field of environmental protection. Foreign investment
will continue to be an important pulling force for the economic growth and
transformation in China.
Foreign investors are the first to perceive the trend of China’s green transformation. In
2010, the country received a total volume of USD 105.74 billion of non-financial FDI,
up by 17.4% compared with the previous year. Specifically, the FDI that went into
manufacturing and the production and supply of power, gas, and water totalled USD
52.71 billion, marking an increase of 6% and 0.6% respectively, both well below the
GDP growth rate. The FDI that went into communications, warehousing and postal
service, information transmission, computer service and software, wholesale and retail,
real estate, rental and business services, residential service and other services totalled
USD 44.5 billion, accounting for a robust annual increase rate of -11.2%, 10.7%,
22.4%, 42.8%, 17.3%, and 29.4% respectively. The secondary and tertiary industries
attracted 49.8% and 42.1% of the FDI respectively. Foreign investment in China has
begun a shift from the secondary industry to the tertiary industry.
The flow of foreign investment into the service industry can bring advanced
management philosophy and expertise to the corresponding sectors in China, lead the
industry-wide improvement of service quality and management standard, and create a
positive environmental influence by promoting energy conservation and pollution
abatement. As Table 4 shows, the growth of foreign investment in the service industry
in China will promote the achievement of such green transformation objectives as the
reduction of energy consumption per unit GDP, the reduction of CO2 emission per
unit GDP, the reduction of water consumption per unit industrial added value, and the
reduction of the total volume of four major pollutants, etc.
If foreign investment is directed to the field of new energy, it will directly elevate the
proportion of non-fossil fuels in primary energy consumption and help solve one of
the major problems in the green transformation objectives of the Twelfth Five-Year
Plan.
On the other hand, the foreign enterprises are also predominantly export-oriented,
which can stimulate the demand, provide more employment opportunities, pull market
development and boost technological progress. The FDI enterprises in the field of new
185
energy, in particular, will open up market opportunities and provide broad
development space for the sectors related to non-fossil fuels by exporting
energy-saving, environment-friendly products. However, attention needs to be paid to
control the threshold limits for the high-energy-consumption, high-pollution and
resource-related products and sectors, so as to avoid the environmental degradation
and ecological destruction resulting from the investment and export practices of FDI
enterprises. In 2010, foreign-funded enterprises in China scored an export volume of
USD 862.3 billion, up by 28.3% compared with the previous year, whereas the other
enterprises only exported USD 481.3 billion worth of goods, slightly over a half of the
volume of FDI enterprises. The export of high-energy-consumption, high-pollution,
and resource-related products will inevitably increase the discharge of major
pollutants. The export of forest products will also negatively affect the forest-related
index. Besides, the high-energy-consumption, high-pollution and resource-related
products embed a large amount of virtual water and other resources that are hard to
price, and increasing the export of such products will add further pressure on our
ecological system and hinder the green transformation.
5.3.2 Facilitating Green Transformation of China and Host Countries Through
China’s ODI
China’s ODI will create a positive influence on the sustainable development and
green transformation of the local economy, society and environment. However, it
cannot influence China’s green transformation directly. It is only the import-oriented
ODI that will promote the green transformation in China. In 2010, China scored a
total volume of USD 59 billion in ODI, marking a rapid annual increase by 36.3%.
The absolute ODI volume was about half that of the FDI in China and fell short
compared with the scale of our economy and the overall energy consumption. There is
still plenty of room for development from the perspective of investment balance.
China’s ODI is concentrated in such fields as resources, energy, raw materials, and
agricultural products, which are highly complementary to the country’s domestic
economy. In 2009, the increase of crude oil imports in China made up 60% of the
total increase in the world. The import of such products can facilitate the further
implementation of the resource conservation, water source nourishing, land protection,
and other aspects of environmental protection. The overseas resources, especially the
mineral resources, are high in grade terms and processed with advanced technologies.
They can compensate for such problems as the large proportion of unproductive
mines, backward technologies, low production efficiency, and high pollutant
discharge in China. For instance, the copper from the Zambian Copper Belt,,is very
rich with an average ore content of 2% to 13%. This means that those Chinese
enterprises that “go global” can have access to copper resources with a copper content
of at least 2% or over, whereas the domestic copper mines are mostly poor with an ore
content quite below 2%. The import-oriented Chinese ODI is not only conducive to
186
the realization of all the aforementioned green transformation objectives that foreign
investment can help to achieve, but can also increase forest cover and reserves from
the perspective of resource and energy substitution while enhancing the effective
utilization coefficient of irrigation water by importing from overseas energy sources,
minerals, timber, food and other raw materials.
On the other hand, the Chinese ODI enterprises that “go global”, within the large
state-owned enterprise and central enterprise system, may carefully and systematically
study the local environmental standards and legal systems. With such learnings, they
will be better prepared to promote the development and green transformation of the
state-owned enterprises back home, spread the technologies and philosophies to the
related sectors, and facilitate technological diffusion and the green transformation of
the industry.
5.3.3 Facilitating China’s Green Transformation Through Foreign Trade
Similar to the export-oriented FDI and import-oriented ODI, independent foreign
trade can create a direct and extensive effect on the facilitation of China’s green
transformation.
Foreign trade involves a wider range of partners and a richer variety of imported and
exported goods. The imported raw materials can complement the domestic material
market. In 2010, China imported 239 million tons of crude oil, up by 17.5% over the
same period of the previous year. As the foreign trade dependence approached 55%,
the oil security problem was exacerbated. The crude oil imported from the Middle
East and Africa made up 60% of the total imports of China. In the soft commodity
bean market, imported beans have occupied one third of the market share. As
genetically modified beans are cheap with a high extraction rate, and their import
embeds virtual water that alleviates the burden on the arable land in China, the import
of beans can facilitate the industrial transformation. It has certainly seriously affected
the non-genetically modified beans, but this is an inevitable temporary difficulty
arising from the industrial transformation process. China’s policy makers shall take
the impact of the competition into full consideration. Meanwhile, attention needs to be
paid to the import and export of virtual resources and energy in foreign trade. Due to
China’s role of world factory and the predominance of low-added-value,
high-carbon-intensity exports, a lot of embedded CO2 has been transferred and
consumed abroad with the exports. According to the statistics of Tyndall Center for
Climate Change in 2007, China exported a net volume of embedded CO2 of 1.1
billion tons per year. This means that one fourth of the greenhouse gas emission in
China was exported.
Different from the export-oriented FDI, independent export provides but a weak pull
to the industrial development and creates little effect on the development of non-fossil
187
energy and the achievement of other green transformation objectives. On the other
hand, different from the import-oriented ODI, independent import can choose to
directly import those efficient, energy-saving, and environment-friendly technologies
and equipment without considering the investment policy and market threshold, etc,
of the host countries. The introduction of these technologies and equipment to the
domestic market will directly and indirectly reduce the proportion of non-fossil fuels
in primary energy consumption, promote the upgrading and transformation of the
related sectors, and facilitate China’s green transformation through the technology
effect and the structure effect. The import part of foreign trade can facilitate the
realization of all the green transformation objectives in the Twelfth Five-Year Plan.
5.3.4 Facilitating Green Transformation of China and the Rest of the World
Through China’s Participation in Formulation of International Rules
While foreign investment and trade have made tremendous contribution to the
development of China, China’s growing dependence on foreign trade creates an
energy security problem that is worthy of our careful consideration. There is an
increasing need for China to cooperate with the other countries. China needs the rest
the world, and vice versa. Among the major imported commodities of China in 2010,
imported beans reached 54.8 million tons, up by 28.8%, and totalled USD 25.1
billion in value, up by 33.5%. China’s primary energy consumption reached 3.25
billion tce in 2010, marking an annual increase rate of 6.3%. The imported coal and
crude oil reached respectively 165 million and 239 million tons, marking a yearly
increase of 30.9% and 17.5% respectively. The import of processed oil reached 37
billion tons, down by 0.1% over the previous year.
Despite the rapid increase of the foreign trade volume, China has no control over the
rates in the world material market and has been put into the position of price taker. Let
us consider the importation of crude oil for example. In 2010, China imported 239
million tons of crude oil, up by 17.5%; the total value reached USD 135.2 billion, up
by 51.4%. The increase of imports came with a higher rather than a lower price. The
tension in North Africa in 2010 caused the oil price to shoot up, as China had to spend
USD 50 to 60 million more per day than the case prior to the latest price adjustment.
China spends USD 61 a barrel on the average every year, totalling USD 400 million
every day. Such a trade situation of large import quantity at a high price serves to
demonstrate that China is by no means a “neocolonialist” country.
While China is by no means a colonialist country, it is constantly subject to challenges
in the international arena. For instance, in Jan. 2009, US Customs and Border
Protection declared that certain solar panels equipped with a type of diodes fell into
the category of “electric motors and generators” (HTS8501.31) in HTS, rather than
“diodes, transistors, and similar semiconductor devices” (HTS8541.40). The
re-categorization imposed a tariff of 2.5% on each of these panels, while according to
the categorization of HTS8541.40, these panels should have been tariff-free. This
188
decision is in conflict with the free trade principles surrounding environmental goods
and services as defined by the USA under the Doha talks. In 2009, the USA imported
USD 100 million of electric motors and generators (HTS8501.31), accounting for
17.9% of the USD 800 million of US’s total import in this category, and 21.1% of the
USD 700 million of China’s total export in this category. As another example of this,
on June 23, 2009, the USA and EU requested a revision of a trade dispute settlement
with China and claimed that China’s export restrictions protected Chinese enterprises
and gave European and American enterprises a competitive disadvantage. WTO ruled
in July 2011 that China violated the international trade rule by restricting the export of
nine industrial raw materials. The materials include bauxite, coke, fluorite,
magnesium, manganese, metallic silicon, silicon carbide, yellow phosphorus, and zinc,
some of which are widely used in steel industry, aluminium processing, automobile
manufacturing and chemical industry. The decision will give an advantage to
European countries and USA in the disputes over the prevention of China’s export
restrictions of rare earth materials. The known rare earth reserves of China are at 52
million tons, making up 90% of the total reserves on the earth and contributing about
80% of the rare earth consumption around the world. While the USA and France also
have abundant rare earth resources, they have closed down their own rare earth mines
and relied on China’s export of rare earth.
It can be concluded from these two examples that China will have to incorporate a
strong knowledge of the international rules in order to protect its trade interests and
maintain a certain advantage in international trade. This not only means studying
closely the existing international rules, but also actively participating in the process of
the formulation of the rules and becoming a stakeholder in the formulation.
5.4 Facilitating Green Transformation Through Adjustments of
Investment and Trade Policies
First, establish the image of China as a responsible developing power, guide and
regulate investment and trade activities with the green transformation objectives,
and clarify China’s role as the leader and promoter of global green
transformation rather than a follower and recipient of it.
Green transformation has always accompanied the industrialization and urbanization
progress in China. However, in the Eleventh Five-Year Plan period, there was a shift
in China’s role in the global green transformation from a follower and recipient to a
leader and promoter.
The shift of China’s role stems from many factors. (1) The speed and scale of the
urbanization and industrialization process in China shows that there is no existing
model of development for us to follow; (2) the passive acceptance of green
189
transformation can no longer satisfy the demand of the sustainable development of
China and the rest of the world; (3) the expectations of the international community
for China have been raised; (4) as an integral part of economic globalization, China
needs to utilize two resources and two markets to facilitate its economic restructuring;
(5) China has already played the actual role of world leader in many of its
transformation practices.
Investment and trade are the pulling forces and carriers of this transformation. If
China played more or less the role of follower and recipient of green transformation
when it welcomed foreign capital and technologies into the country, since the reform
and opening to the outside world, it must assume the role of leader and promoter of
green transformation when it “goes global” with its investment and technologies in
the 21st century. During the Eleventh Five-Year Plan period, China implemented the
policies of attracting foreign investment and going global simultaneously and
basically achieved the periodical objectives of green transformation. The green
transformation practices in the Twelfth Five-Year Plan requires that China be a more
active leader and promoter of green transformation when it attracts FDI and when it
goes global.
The practices of China’s green transformation have also been widely recognized in
the international community. China is in the forefront of green development, taking a
lead internationally in renewable energy resource utilization, many traditional
manufacturing sectors, and ecological protection, etc. The green transformation
objectives set down in the Twelfth Five-Year Plan have actually set up a model for the
global green transformation. The clarification of China’s leading and promoting role
in green transformation is an effective response to the doubts of the international
community over China’s image and could serve to rectify various misperceptions of
China. However, China’s assumption of the leading role in global green
transformation does not mean that China will shoulder the same responsibility as
developed countries. The principle of collective yet differential responsibility is also
suitable for green transformation. China still remains a developing country.
Secondly, change the ideas and guide the foreign investment to develop in a way
conducive to China’s green transformation and sustainable development.
The sectoral and geographic distribution of foreign investment is not even. A large
amount of foreign investment went into resource and environment-sensitive industries
and is gradually shifting to the underdeveloped or backward areas in Middle and West
China, creating tremendous difficulties for the pollution treatment in China. Foreign
enterprises in China mainly follow Chinese environmental standards, which are below
the environmental standards in developed countries and international standards to a
certain degree. The favourable policies to attract foreign investment in pollution
intensive industries and high energy and resource consumption industries have been
left behind the times. Therefore, following suggestions are put forward:
190
(1) Formulate a policy guideline on foreign investment attraction and direct
foreign investment to the promotion of China’s green transformation. Compared
with engaging foreign investment solely in the promotion of economic growth,
employing it as a facilitator of China’s green transformation creates a more positive
effect on Chinese economy and will play a more vital role in the future development
of China. China’s green transformation requires that it break away from the blind
pursuit of foreign investment and change its role as a passive recipient. Rather, it
needs to guide, regulate and promote foreign investment according to its
transformation objectives. The development of China is still in need of a large amount
of overseas investment, and the provision of policy guidance to direct the flow of
foreign investment will enhance the energy efficiency and carbon productivity.
(2) Strengthen the regulation of FDI in China and establish a related
environmental monitoring and reporting mechanism. China shall have a dynamic
control of the contribution of FDI to green transformation, track its performance, and
impose severe punishments for enterprises that cause environmental pollution and
harm the ecosystem. It shall reform the evaluation index system of the local
governments by setting up an ecological performance evaluation index and including
the ecological quality index into foreign investment evaluation, with particular
emphasis on the protection, treatment and monitoring of environmental resources. The
reformed evaluation system can enable the local governments to carry out their social,
economic and political functions in a coherent way, and overcome short-sightedness
in the approval of foreign investment projects and the regulation of enterprise
behaviour.
(3) Guide the flow of foreign investment in China to optimize the industrial
structure and elevate the market threshold standard. China shall reduce or abolish
the preferential tax policies for foreign investment in the coastal areas and increase the
preferential tax policies for foreign investment in certain inland cities; abolish
industry-wide preferential tax policies and increase preferential tax policies for
emerging strategic industries; abolish the preferential tax policies for low-added-value
industries, and increase preferential tax policies for high-added-value high-tech
industries. It shall demand the FDI that is flowing into the heavy industry sector in
China start to conserve energy and protect the environment while restraining foreign
investment from flowing into traditional manufacturing and high-pollution sectors.
Abolish the super-preferential policies for foreign investment in such labour
-intensive, pollution-intensive sectors as textile, clothing, and household appliance
manufacturing, etc, and withdraw its encouragement of FDI into sectors suffering
from overcapacity. China should impose stricter administrative examination
procedures in certain areas, sectors, and centers of industrial chains, accepting foreign
investment on a selective basis. It shall impose the strictest industrial technology
demands and environmental protection standards in energy-intensive,
resource-intensive, and pollution-intensive industries, raise the penalty for violation of
191
the standards, and adopt measures to ban or rectify the enterprises where the case is
serious, so as to facilitate environmental protection through the punitive policies.
(4) Implement policies related to the cultivation of strategic emerging industries
and facilitate the introduction of green technologies through FDI. China shall
appropriately subsidize technological transfer and the introduction of cutting-edge
equipment, guide the direction and structure of foreign investment in the country, and
make full use of the advanced overseas product concepts and technologies to make
them serve its overall objectives and the development of priority sectors, so as to
facilitate the industrial restructuring. China shall emphasize the importance of green
technologies and promote the introduction of them through FDI. It shall open up all
the vital links in the industrial chains and avoid inadequacies in the restructuring drive
resulting from sole reliance on technological innovation. It shall promote the green
transformation of the society as a whole by facilitating the green transformation of
entire industrial chains of the strategic emerging sectors.
(5) Strengthen the environmental responsibility of foreign enterprises and
encourage the establishment of “fair-to-all” environmental information release
systems. As a developing country, China still has a long way to go in terms of the
environmental standards and environmental responsibility system compared with
developed countries. Foreign enterprises, particularly influential multinational ones,
are more experienced in fulfilling their environmental commitment. If they can adopt
mandatorily environmental information release mechanisms for their branches in
China, similar to what they do at home, it will set up a significant model for Chinese
enterprises and create a positive influence in stimulating the environmental awareness
of Chinese enterprises and the self-motivated establishment of environmental
responsibility systems and mechanisms of enterprises.
Thirdly, take the initiative to encourage China’s ODI to facilitate the green
transformation of China and the host countries.
China has prepared adequate technologies and funding resources for its ODI, however,
it still lags in “soft” preparations, such as better nkoledge of local languages, codes,
ideologies, social customs, industrial culture, and means of communication, which are
all very inadequate. This handicap affects the thorough development and expansion of
China’s ODI in many negative ways. The bureaucratic practices of state-owned
enterprises and their reticent mode of behaviour have posed serious barriers to
Chinese investment and trade in their effort to integrate into the local economy.
State-owned enterprises and private enterprises behave rather differently in China’s
overseas investment, and the bad conduct of some private enterprises may damage the
overall image of Chinese investment and trade. State-owned enterprises attach greater
importance to environmental protection and follow the local laws strictly. Therefore,
the environmental issue is not a major problem in their investment and trade.
However, a small number of private enterprises randomly dumped and buried the
192
wastes and waste on the roadside, and hence created a bad social influence even if the
environmental impact was limited. Some few private enterprises even attempted to
evade liability by such means as bribery, forgery of accounting fraud. They employed
illegal labour , etc, which created very bad social effects. China’s ODI is faced with
the latecomer disadvantage in other developing countries. Chinese enterprises entered
the international investment market later than their European and American
counterparts and occupy a disadvantageous position in terms of their access to
resources. On the other hand, the technological systems and management measures
that Chinese enterprises developed independently on the basis of the relatively low
development level and the backward infrastructure conditions are more valuable for
developing countries. Therefore, one can make the following suggestions:
(1) Fully recognize the dual function of enterprises that “go global” as the
promoter of domestic and global green transformation. Although China’s ODI
cannot directly influence the domestic green transformation, it can play an important
role in facilitating the achievement of the Twelfth Five-Year Plan objectives and
green transformation. The import-oriented ODI can substitute the
high-energy-consumption industries back home with the import of resources, energy,
and energy-intensive, resource-intensive products and therefore indirectly enhance the
energy efficiency and carbon productivity. Such an environmental effect of overseas
investment calls for appropriate policy guidance. Close attention should be paid to the
import-oriented overseas investment, as it involves the adjustment of both investment
policies and trade policies and will arouse the concerns of the international
community.
(2) Strengthen the policy guidance for the overseas investment enterprises. The
related departments and ministries shall formulate and improve the laws, regulations,
policies and standards on “going global”. To encourage enterprises to go global and
explore “two resources and two markets”, China needs to formulate related
regulations and establish corresponding standards. The Ministries of Commerce,
Foreign Affairs and Education, as well as the SACAC and NDRC, need to coordinate
with each other in the formulation of the standards and guidelines on the preparations,
consultation, training, financing and information follow-up of enterprises that “go
global”.
(3) Strengthen the administration of Chinese ODI enterprises. China should
carry out proactive regulation and supervision over the enterprises that “go global”
and impose stricter qualification examination of ODI enterprises. As regards the
overseas investment of large and medium-scale state-owned enterprises, it should
carry out a strict examination of projects and register and track the geographical and
sectoral distribution of the investment, so as to avoid the wasteful competition
between Chinese enterprises. Furthermore, China we should monitor the enterprises,
and limit the number and sectoral distribution of investment projects, so as to control
the number of competitors and the sectors into which ODI flow. While it should
193
encourage the overseas investment of medium and small-sized private enterprises in
principle, it needs to strengthen its communication with the host governments and
examine with the local Chinese embassy the corresponding qualifications of these
enterprises before they register and operate, as it lack the means to monitor them back
home. The development banks and commercial banks need to tighten their
environmental and social regulations when they provide financing to Chinese
overseas investors.
(4) Guide the enterprises in making preparations for “going global”. China
should organize training sessions for state-owned enterprises that “go global”, provide
information channels, enhance the leadership capacity of Chinese overseas enterprises,
and deepen their understanding of the local languages, legal systems, environmental
standards, cultures and customs, religions and taboos, as well as the social
responsibility of enterprises. It should provide an information platform for private
enterprises that “go global” and enhance the availability of various information. It
should encourage Chinese overseas enterprises to actively shoulder up their
environmental and social responsibilities and promote the local green transformation
and sustainable development. It should extend Chinese overseas investment to the
downstream of the industrial chain and to the grass roots of the host countries, so as to
improve the social image and credibility of the Chinese enterprises.
(5) Intensify the scientific research cooperation and exchanges in education and
training. China should strengthen research on the host countries in basic sciences and
social sciences, emphasize the research and advancing of applied sciences, especially
the adaptive technological researches in South-South cooperation, and strengthen the
exchanges and mutual learning between researchers and enterprises. It should focus
on the quality rather than the quantity of the foreign-aid education and training. To
enhance the standard of foreign-aid education, it needs to pay attention to the quality
and source of the overseas student candidates and strengthen the cultivation of the
ability of the local technological and engineering personnel.
(6) Emphasize communication and exchanges and establish a platform for
dialogue in order to take the initiative in publicity, enhance credibility and
clarify doubts. China should encourage overseas investment enterprises to work
closely with non-governmental organizations and business consulting agencies and
design their overseas investment behavior commercially. Meanwhile, it should
strengthen media publicity and spread the information of China to the host countries
via various channels. It should take the initiative to contact local media organizations,
make use of the Chinese media correspondents, and utilize various media platforms
comprehensively to communictaee Chinese culture and China’s green transformation
practices and produce a voice of its own in the international arena.
(7) Make full use of the latecomer advantage of Chinese investment and trade in
Africa, explore the African market for low-carbon adaptive technologies and
194
enhance South-South cooperation. Chinese low-carbon adaptive technologies have
a bright prospect and contribute greatly to the promotion of the green transformation
of China and the rest of the world. While the technologies of developed countries are
costly in implementation and low in adaptability, Chinese low-carbon technologies
are more suitable for the natural conditions and infrastructure standards of developing
countries with such advantages as inexpensiveness, simplicity in implementation,
convenience in maintenance, and low infrastructure requirements, etc. As members of
the South camp, China and the other developing countries, especially African
developing countries, share a lot of interests and are in similar stages of development,
which provide a foundation for South-South cooperation.
Fourthly, adjust the trade structure to make the foreign trade serve the green
transformation of China and the rest of the world.
China has remarkably increased its imports and exports and expanded its share in the
international market. As a result, there will be a broader market for foreign trade.
Meanwhile, there has been a change in the structure and trade mode of the imports
and exports, as processing trade is quickly expanding, overtaking the other trade
modes in growth. High-energy-consumption industries not only saw increase in
exports but also in their proportion in the total exports. As a result, a large amount of
energy has been implicitly exported while a lot of pollutants have been left back at
home, imposing pressure on the energy conservation and environmental protection in
China. The various forms of environmental regulation costs will change the costs of
domestic products. The implementation of the list of green products is an effective
method of environmental regulation. Natural resources and energy will flow in virtual
forms in the direction of the foreign trade. Policy makers shall take the factor of
embedded energy into full consideration and adjust the foreign trade policy
accordingly. Specifically, China should consider the following two policy suggestions:
(1) formulate a green trade list, reduce and abolish the system of export tax rebates,
and control the export of high-energy-consumption, high-pollution, and
resource-related products; (2) encourage the import of green technologies and
equipment and the introduction of green talents by providing policy support in
administrative procedures and appropriate subsidies.
Lastly, shift China’s role and actively participate in the formulation of
international rules to facilitate global green transformation.
To shift its role from the recipient to the formulator of the international rules does not
only lie in the protection of the development rights and interests of China and all the
other developing countries, but also in the commitment to global green transformation
and the promotion of the establishment of the international system in the process of
global sustainable development. China should participate in the formulation of
international rules more vigorously, so that the interests of developing countries are
embedded and protected in international negotiations.
195
(1) Actively participate in WTO talks and promote the formulation of standards
for environment-friendly products and technologies.
Considering the diversity and complexity of the economic development of China and
the urgency of its environmental requirements, it should make necessary adjustments
on the oversimplified dichotomy of developing vs. developed countries when it
approaches the international economic and trade relations in trade talks. For certain
WTO member states, especially the developing countries, it is advantageous for them
to list out the goods and services in affirmative statements; however, due to the
competitiveness of Chinese products, it is better for it to list out the goods and
services in negative statements. As the trade talks do not allow it to use such
statements, the more extensive the list of goods and related services is (with the
exception of local goods and services), the better it will be for its enterprises. Among
the three kinds of environmental goods and services, namely, global environmental
goods and services, local environmental goods and services and indoor environmental
goods and services, China is very competitive and will be more and more so in the
future in the provision of all but local environmental goods and services. As Chinese
environmental goods and services enjoy a similar advantage as that of Japanese and
Korean ones, China shall form an interested community with Japan and Korea in EGS
talks.
Currently the EGS talks in WTO’s Doha round have reached an impasse. China shall
proceed from the requirements of environmental protection and development and
formulate its own strategies in the current EGS talks of WTO-CTE on the basis of a
clear assessment of the comprehensive interests of China in economy, trade,
environmental protection, industrial development, and international diplomacy, etc.
Specifically, it shall divide the environmental products into indoor environmental
products, regional environmental products, and global environmental products, put
forward the development requirements of the developing countries, and formulate an
integrated strategy in the negotiations according to its own interests and the demand
of global environmental cooperation. The country shall not only stand side by side
with other developing countries to demand for special and differential treatment, but
also demand for new membership treatment, as China’s entry into WTO is fairly
recent.
(2) Actively participate in the negotiations on the International Investment
Agreement, and include appropriate provisions related to the environmental and
social impact on the basis of the practical conditions of China and other
developing countries.
First, China should intensify researches on the development trend of international
investment rules and pay special attention to the legal problems related to the host
196
countries when it signs bilateral or multilateral international contracts with developed
countries. Secondly, it should adhere to the principle of collective but differential
responsibility. It should adopt effective preventive measures to counteract those
provisions of the existing investment agreements that harm the interests of developing
countries, so as to protect its own interests and regulate the foreign enterprises that
pollute the environment. Thirdly, it should promote its dialogue with other countries
more vigorously, solve potential environmental problems through high-level
dialogues with major investment partners, and adapt itself to the changes by
establishing special channels of cooperation. Fourthly, it should improve the domestic
environmental legislation to be adapted to the changing international investment rules,
so as to avoid any violation of the investment agreement for failing to fulfil the
requirements of environmental protection.
(3) Actively participate in the negotiations on the provisions related to trade
and funding rules under UN Framework Convention on Climate Change.
China should fight for its interests and those of other developing countries in such
issues as public funding, private investment, trade of renewable resources and related
products and technologies, carbon tariff, etc. It should not only demand that
developed countries set up a good model, but also promote the green transformation
of developing countries and protect the development interests of developing countries.
Meanwhile, it should pay attention to the embodiment of the integration of the related
interests and rules, so that they can promote each other and serve China’s green
transformation.
(4) Explore the mode of multilateral cooperation of China, African countries and
European countries, so as to deal with climate change and facilitate the global
green transformation.
The green transformation of developing countries needs the technical and financial
support of EU countries, whereas developed countries also need space for carbon
emission. On the one hand, the cooperation can bring the cheap, highly adaptive
technologies from China to African countries and other developing countries; on the
other hand, developed countries can transform South-South projects into CDM
projects in the form of capacity building and acquire space for carbon emission
through the purchase of CER. Such a mode can produce a win-win result for the three
or more parties and is worth China’s thorough investigation and unremitting efforts.
China should promote this idea in various international negotiations and put forward a
scheme of its own.


![China-Ghana South-South Cooperation on …...[May , 2014] China-Ghana South-South Cooperation on Renewable Energy Technology Transfer Sector Renewable Energy, South -South Cooperation](https://img.pdfslide.us/doc/110x75/5e95f21ea5ae112499137a4e/china-ghana-south-south-cooperation-on-may-2014-china-ghana-south-south.jpg)