Embed Size (px)
Citation preview

Deutsche Bank Markets Research
Asia
China
Transportation
Infrastructure
Industry
China Infrastructure
Date
3 March 2017
Forecast Change
PPP story continues, upgrading 2017-2018 infra FAI; Buy CCC/CSCI
Reiterating positive view on constructors in 2017
________________________________________________________________________________________________________________
Deutsche Bank AG/Hong Kong
Deutsche Bank does and seeks to do business with companies covered in its research reports. Thus, investors should be aware that the firm may have a conflict of interest that could affect the objectivity of this report. Investors should consider this report as only a single factor in making their investment decision. DISCLOSURES AND ANALYST CERTIFICATIONS ARE LOCATED IN APPENDIX 1. MCI (P) 057/04/2016.
Phyllis Wang
Research Analyst
(-) - -
Key Changes
Company Target Price Rating
1800.HK 12.08 to 13.71(HKD)
-
3311.HK 14.97 to 16.06(HKD)
-
1186.HK 11.84 to 13.36(HKD)
-
0390.HK 6.93 to 7.92(HKD) -
Source: Deutsche Bank
Top picks
China Comms Construct (1800.HK),HKD10.78
Buy
CSCI (3311.HK),HKD13.40 Buy
Source: Deutsche Bank
Companies Featured
China Comms Construct (1800.HK),HKD10.78
Buy
2015A 2016E 2017E
P/E (x) 8.9 9.4 7.9
EV/EBITDA (x) 8.8 9.3 8.9
Price/book (x) 0.7 1.1 1.0
CSCI (3311.HK),HKD13.40 Buy
2015A 2016E 2017E
P/E(x) 11.8 13.6 10.2
EV/EBITDA(x) 11.5 11.0 8.4
Price/book(x) 2.6 2.0 1.8
China Rail Construction (1186.HK),HKD11.20
Buy
2015A 2016E 2017E
P/E (x) 9.4 9.4 8.1
EV/EBITDA (x) 5.0 4.9 4.4
Price/book (x) 0.9 1.1 1.0
China Railway Group (0390.HK),HKD7.16 Buy
2015A 2016E 2017E
P/E (x) 11.6 10.8 9.3
EV/EBITDA (x) 8.6 7.7 6.9
Price/book (x) 0.9 1.1 1.0
Source: Deutsche Bank
We reiterate our positive view on the construction sector for the rest of this year after our recent trip and analysis of PPP projects. Domestic orders for infrastructure projects are still healthy in Jan 2017. We believe healthy momentum in the coming months will continue, supported by the accelerating development of PPP projects (mainly highway and municipal projects). Management guidance on new orders in 2017 looks stronger than expectation. We raise our estimate on infrastructure spending in China by 2-4% in 2017-2018, on our base case analysis of PPP projects. We still like constructors on the back of healthy earnings and order outlook. CCC and CSCI are top picks.
Positive message from recent tour: healthy new orders growth to continue Our trip last week to Beijing, Shangdong, Jiangsu, Hubei and Hunan in relation to the infrastructure construction sector gave us the impression that sentiment in the infrastructure industry remains strong. Progress on the PPP model (especially from highway, subway and municipal projects) is ahead of our expectation, which should support infra spending in 2017-19. In addition, all the constructors expect positive new order growth this year after the strong growth in 2016. Accordingly, we raise our new orders estimates for the constructors by 8-23% in 2017.
Lifting infra FAI in China, due to accelerating development of PPP projects We lift China infra spending (including railway, road and municipal projects) forecasts by 2-4% for 2017-18 on a base-case scenario, mainly due to higher assumption on highway and subway investment. Thus, we now forecast infra FAI in China to grow 5% CAGR in 2016-2018 (vs. previous 3.5%), among which we expect investment via the PPP financial model to account for 20% of total in 2018 (vs. previous 15%). We estimate the market size for PPP projects (mainly including transportation and municipal projects) will be more than Rmb2trn in 2017-18 (vs. our previous estimate of Rmb1.65trn), representing a 35% CAGR over 2016-2018. Our blue sky scenario implies 2% and 9% potential upside from our current estimates for infra FAI and investment for PPP projects, respectively; we believe this would enhance constructors’ earnings by 5-10% on the back of higher construction volume and better margin expansion led by a rising portion from high-margin PPP projects.
Upgrade earnings/TP; consensus estimates conservative; top pick: CCC/CSCI We raise CRCC, CRG, CCC and CSCI’s 2016-2018 earnings by 4-7% on higher infra spending assumption. Our revised 2017-2018 earnings forecasts are 3-16% ahead of market consensus. CCC is our top pick as it is likely a medium-term beneficiary of the OBOR initiative and has more attractive valuations then peers. It has the highest exposure to PPP projects among the big three names and strong capability to control projects. Potential SOE reforms may benefit its B/S. CCC trades at 7.9x 2017E PE (3%/15% discount to CRCC/CRG’s). We also like CSCI for its potential to be the biggest beneficiary of the PPP model promotion given its high exposure to the domestic infra investment business.
Valuing Chinese railway companies on DCF; risks Our preferred valuation methodology for railway names is one-year forward FY17E DCF (WACC: 7.4% for CRG, 7.0% for CRCC, 8.0% for CCC, and 8.5% for CSCI). Risks: government spending and political risk for overseas projects. In this report we change estimates and TPs for companies under coverage. Please see Figure 18-19 on page 9 for details.
Distributed on: 02/03/2017 21:03:35 GMT

3 March 2017
Infrastructure
China Infrastructure
Page 2 Deutsche Bank AG/Hong Kong
PPP story continues
Positive message on constructors from our recent trip
We took a trip last week to gain further insight into the infrastructure sector.
We covered five regions in China (Beijing, Shangdong, Jiangsu, Hubei and
Hunan) and visited infrastructure constructors (MCC, CSCEC, Gezhouba, and
JSTI group), Jinan Development and Reform Commission and industry expert
from China Railway Construction (CRC).
The trip gave us the impression that sentiment in the infrastructure industry
remains strong. Progress on the Public-Private Partnership (PPP) model
(especially from highway, subway and municipal projects) is ahead of our
expectation, which should support infrastructure spending in 2017-19E. We
believe railway infrastructure spending (a key driver for infrastructure spending
growth in the past few years), will no longer be the catalyst in the next few
years, which is also in line with industry expert’s view (from CRC).
1) All the constructors we visited are positive on the outlook, given the
accelerating development of PPP models. As well, they cite the
continued healthy new orders growth from infrastructure projects in
January 2017 and expect this trend to remain for the rest of this year.
2) Jinan local government is aggressively pushing PPP project
developments. 32 projects are now in their project pool, among which
10 are in execution period. They have picked up 30 projects this year,
which will be put into the local governments’ PPP project pool.
3) The railway expert from CRC expects railway infrastructure to have no
growth in 2017. The development of PPP railway projects looks slow
due to low returns.
Good signals from PPP annual report
Expanding national PPP reserves, further accelerating implementation
The China Public Private Partnerships Center (CPPPC) recently released an
annual report on the MoF’s PPP project pool. The report notes improvement in
scale and quality of reserved PPP projects. At the end of 2016, total investment
from 11,260 reserved PPP projects amounted to RMB13.5tr, up 8.3% from
end-September 2016 and 66% from end-January 2016. Despite the expanding
scale, the contract signing rate in terms of project number and total
investment continued to rise; it jumped to 12.0% from 9.0% at end-September
and to 16.5% from 12.5% at end-September, respectively. By percentage
points, the 4Q16 contract signing rate enjoyed the fastest quarterly growth in
2016.

3 March 2017
Infrastructure
China Infrastructure
Deutsche Bank AG/Hong Kong Page 3
Figure 1: Contract signing rate for national PPP project
reserve by number of projects
Figure 2: Contract signing rate for national PPP project
reserve by investment
298 369
619
946
1,351
4.3% 4.8%6.7%
9.0%12.0%
0.0%
5.0%
10.0%
15.0%
20.0%
25.0%
30.0%
35.0%
40.0%
45.0%
50.0%
-
200
400
600
800
1,000
1,200
1,400
1,600
End-Jan 2016 End-Mar 2016 End-Jun 2016 End-Sep 2016 End-Dec 2016
Number of contracted projects Contract signing rate
# of projects
410 510
1,060
1,560
2,230
5.0% 5.8%
10.0%12.5%
16.5%
0.0%
5.0%
10.0%
15.0%
20.0%
25.0%
30.0%
35.0%
40.0%
45.0%
50.0%
-
500
1,000
1,500
2,000
2,500
End-Jan 2016 End-Mar 2016 End-Jun 2016 End-Sep 2016 End-Dec 2016
Contracted investment value Contract signing rate
Rmbbn
Source: CPPPC
Source: CPPPC
Regional and industrial distribution remains concentrated
Regional distribution of the PPP project pool is still concentrated. As of end-
2016, the top five provinces represented 48% of total number of projects and
42% of total project investments (with Guizhou and Shandong dominating both
rankings), reflecting the differentiated attitude of local governments towards
the PPP model. We note that active participants in PPP projects are mainly
from provinces that have a weaker fiscal situation to boost infrastructure
investment, as well as from provinces with larger population to underpin
projects’ operational profitability.
Figure 3: Regional distribution of national PPP project
reserve by number of projects at end-2016
Figure 4: Regional distribution of national PPP project
reserve by investment at end-2016
Guizhou, 16%
Shandong, 10%
Xinjiang, 8%
Sichuan, 8%
Inner Mongolia, 7%Henan, 7%Liaoning, 4%
Gansu, 4%
Hebei, 4%
Yunnan, 4%
Others, 29%
Guizhou, 12%
Shandong, 9%
Yunnan, 8%
Henan, 7%
Sichuan, 7%
Inner Mongolia, 5%Jiangsu, 5%Hebei, 5%
Gansu, 4%
Liaoning, 4%
Others, 34%
Source: CPPPC
Source: CPPPC
In terms of reserved project type, municipal (mainly subway), transportation
(mainly highway) and urban comprehensive development projects occupied
the top three of the reserved project number (jointly accounting for 54% of
total) and project investment (68% of total) at end-2016. Figure 5 and Figure 6
illustrate the overall rising trend of these three project types. Indeed, these are
the major businesses of the constructors under our coverage. Business
opportunities remain adequate, in our view, given the significant upside
potential in contract signing rate and the sizeable municipal, transportation and
urban development projects.

3 March 2017
Infrastructure
China Infrastructure
Page 4 Deutsche Bank AG/Hong Kong
Figure 5: Contribution from
transportation/municipal/urban development PPP
projects by number
Figure 6: Contribution from
transportation/municipal/urban development PPP
projects by investment
43.7%
52.7%53.1%
53.7%53.8%
30.0%
35.0%
40.0%
45.0%
50.0%
55.0%
60.0%
End-Jan 2016 End-Mar 2016 End-Jun 2016 End-Sep 2016 End-Dec 2016
63.9%
65.2%
67.2%
68.0% 67.7%
60.0%
62.0%
64.0%
66.0%
68.0%
70.0%
End-Jan 2016 End-Mar 2016 End-Jun 2016 End-Sep 2016 End-Dec 2016
Source: CPPPC
Source: CPPPC
Demonstration projects leading the way
Compared with the MoF’s entire PPP pool, the 743 demonstration PPP
projects, which have a total investment of RMB1.9tr, recorded a much higher
contract signing rate at end-2016 (i.e. 49%/50% in terms of number of
projects/total investment). We highlight that besides the high implementation
rate, there are much fewer projects in the initial recognition stage (4% of total)
compared with that in the MoF’ entire pool (62% of total). This will enable
smoother project negotiations and execution, in our view.
Figure 7: Contract signing rate by number of projects at
end-2016
Figure 8: Contract signing rate by investment at end-
2016
48.9%
12.0%
0.0%
10.0%
20.0%
30.0%
40.0%
50.0%
60.0%
Demonstration projects National PPP reserve
50.4%
16.5%
0.0%
10.0%
20.0%
30.0%
40.0%
50.0%
60.0%
Demonstration projects National PPP reserve
Source: CPPPC
Source: CPPPC
The first batch of demonstration projects, released in November 2014, is finally
100% contracted, in line with the MoF’s previous guidance. In the same
guidance, the MoF urged all the second and third batch of demonstration
projects to finish procurement (or to be contracted by definition) by end-March
2017 and end-September 2017. So far, the average execution period (time
between project release and being contracted) of the third batch of
demonstration projects (released in October 2016) has shortened by four
months to 11 months. If procurements could be achieved on time (which is
highly likely, in our view, given stronger administrative and financial support
and the need to better understand the PPP model from all related parties), the
implied average execution period could decline further, and could accelerate
the constructors’ revenue recognition from PPP projects in 2017.

3 March 2017
Infrastructure
China Infrastructure
Deutsche Bank AG/Hong Kong Page 5
Figure 9: Demonstration PPP projects released by the MoF
Announcement date # of projects Total investment (Rmbbn)
Deadline for finishing procurement
Implied period for full procurement
(month)
Contract signing rate by # of projects
First batch Nov-14 22 71 Dec-16 25.0 100%
Second batch Sep-15 205 627 Mar-17 18.0 62%
Third batch Oct-16 516 1,170 Sep-17 11.5 43%
Total 743 1,868 50% Source: MoF, CPPPC
Figure 10: Average execution period for demonstration projects at end-2016
15.015.6
11.0
5.0
7.0
9.0
11.0
13.0
15.0
17.0
First batch Second batch Third batch
Month
Source: CPPPC
Constructors’ new orders: raising our estimates; solid growth may continue in 2017-2018E
New contract growth strong in 4Q16, beating expectations
Despite having a high 4Q15 base, CRG and CRCC registered higher-than-
expected new orders growth of 25% and 38% in 4Q16, respectively. Expedited
rollout of PPP projects continued to drive solid growth in the urban transit and
municipal segments in 4Q16 and brought strong recovery in highway
construction orders too (+121% yoy for CRG and +110% for CRCC), which
helped offset a weaker railway bidding market during the same period (new
orders down 25%/26% for CRG/CRCC in 4Q16). In FY2016, CRG and CRCC’s
total new contract value rose 29% yoy to RMB1.24trn and 28% yoy to
RMB1.22trn, respectively (13% and 15% higher than our previous estimates for
CRG and CRCC). Newly-signed PPP contract value was RMB290bn and
RMB240bn for CRG and CRCC, respectively, of which RMB160bn/RMB200bn
was related to construction for CRG/CRCC, respectively.
CSCI’s 2016 new orders grew 19% yoy to HKD84bn, slightly above our
previous estimate of HKD82bn and its guidance of HKD83bn. Among CSCI’s
2016 new orders, HKD50bn+ would be related to PPP projects, based on our
estimate.

3 March 2017
Infrastructure
China Infrastructure
Page 6 Deutsche Bank AG/Hong Kong
CCC’s 2016 new orders grew 12% yoy to Rmb730bn, slightly above our
estimate. The solid growth was mainly driven by the investment (81% yoy) and
overseas segments (51% yoy). Total new contract value contributed by PPP
was around Rmb174bn, of which Rmb151bn was related to construction.
Management guidance on 2017 orders looks stronger than forecasts
All the constructors we visited witnessed continued healthy new orders growth
from infrastructure projects in January 2017. The constructors expect the trend
to continue for the rest of the year. During our Beijing conference in January
2017, CRCC guided for new orders to grow c. 10% yoy. CCC gave new orders
growth guidance on 28 February 2017, expecting new orders to rise more than
20% in 2017. The guidance provided by these companies is better than our
expectations.
Upgrading our new orders estimates for the constructors
Based on ytd performance and management guidance, we raise our new order
estimates by 18% on average for the constructors in 2017 and 23% in 2018.
Figure 11: CCC’s new orders growth Figure 12: CRCC’s new orders growth
608 650
731
900
994
12%
7%
12%
23%
10%
0%
5%
10%
15%
20%
25%
500
600
700
800
900
1,000
1,100
2014 2015 2016 2017E 2018E
Rmb bn
New contract value YoY chg
828 949
1,219
1,356
1,466
-3%
15%
28%
11%8%
-6%-3%0%3%6%9%12%15%18%21%24%27%30%
500
600
700
800
900
1,000
1,100
1,200
1,300
1,400
1,500
2014 2015 2016 2017E 2018E
Rmb bn
New contract value YoY chg
Source: Deutsche Bank, Company data
Source: Deutsche Bank, Company data
Figure 13: CRG’s new orders growth Figure 14: CSCI’s new orders growth
935 957
1,235 1,358
1,453
1% 2%
29%
10%7%
0%
5%
10%
15%
20%
25%
30%
35%
40%
600
700
800
900
1,000
1,100
1,200
1,300
1,400
1,500
2014 2015 2016 2017E 2018E
Rmb bn
New contract value YoY chg
60 70
84 94
101 32%
16%20%
13%
7%
0%
5%
10%
15%
20%
25%
30%
35%
-
20
40
60
80
100
120
2014 2015 2016 2017E 2018E
HK$ bn
New contract value YoY chg
Source: Deutsche Bank, Company data
Source: Deutsche Bank, Company data

3 March 2017
Infrastructure
China Infrastructure
Deutsche Bank AG/Hong Kong Page 7
Lifting infra FAI estimates, mainly driven by higher PPP investment (mainly highway and municipal projects)
We believe the promotion of PPP projects should support infrastructure
investment, in turn helping to support China’s economic growth. We note that
municipal and transportation projects (the target market of CCC, CRCC, CRG
and CSCI) account for a high proportion of total investment for the national
reserve for PPP projects. Hence, the accelerating development of PPP projects
should benefit all the constructors under our coverage.
We lift China infrastructure spending (including railway, road and municipal
projects) estimate by 2-4% in 2017-2018 based on a base-case scenario (our
assumption: all the projects in the national PPP project reserve could enter
implementation period in the next three years). Consequently, we now forecast
infra FAI in China to register a 5% CAGR over 2016-2018 (vs. our previous
estimates of 3.5%), among which we expect investment via the investment
financing model to account for 17% of total in 2018 (vs. our previous forecast
of 15%). We estimate the market size for PPP projects (mainly including
transportation and municipal projects) will be more than Rmb2trn in 2017-18
(vs. our previous estimates of Rmb1.65trn), representing a 35% CAGR over
2016-2018.
Our blue sky scenario (our assumption: PPP projects could enter
implementation period in the next 2.5 years) suggests 2% and 9% potential
upside from our current estimates for infra FAI and investment for PPP
projects, respectively, which should enhance the constructors’ earnings by
5-10%.
In addition, there is upside risk to our estimates on infra investment as we
assume current reserved PPP projects (amounting to Rmb13.5trn) in the MoF’s
pool would enter implementation period and no additional PPP projects from
the beginning of this year.
Figure 15: DB assumption on China infrastructure spending (base case)
Rmbm 2013 2014 2015 2016E 2017E 2018E 2019E
Railway 532,770 622,300 659,638 676,129 676,129 608,516 547,664
yoy change 17% 6% 3% 0% -10% -10%
Road 1,369,220 1,546,094 1,651,330 1,778,740 1,912,146 2,007,753 2,007,753
yoy change 13% 7% 8% 8% 5% 0%
Water and others 184,097 171,057 190,770 189,396 189,396 189,396 189,396
yoy change -7% 12% -1% 0% 0% 0%
Municipal (including Urban transit)
2,383,950 2,335,990 2,303,220 2,455,211 2,633,032 2,829,656 3,018,318
yoy change -2% -1% 7% 7% 7% 7%
Total 4,285,940 4,675,441 4,804,958 5,099,476 5,410,703 5,635,320 5,763,131
yoy change 9.1% 2.8% 6.1% 6.1% 4.2% 2.3%
Investment business 342,875 420,790 480,496 626,588 905,280 1,146,145 1,300,681
yoy change 23% 14% 30% 44% 27% 13%
% of total 8% 9% 10% 12% 17% 20% 23%
Cash construction 3,943,065 4,254,652 4,324,462 4,472,888 4,505,423 4,489,176 4,462,450
yoy change 8% 2% 3% 0.7% -0.4% -1%
% of total 92% 91% 90% 88% 83% 80% 77%
Our assumption: PPP projects could be entered into implementation period in the next 3 years Source: Deutsche Bank. CRC, MoT, MOHURD

3 March 2017
Infrastructure
China Infrastructure
Page 8 Deutsche Bank AG/Hong Kong
Figure 16: DB assumption on China infrastructure spending (worst case)
Rmbm 2013 2014 2015 2016E 2017E 2018E 2019E
Railway 532,770 622,300 659,638 676,129 675,890 606,232 541,361
yoy change 17% 6% 3% 0% -10% -11%
Road 1,369,220 1,546,094 1,651,330 1,778,740 1,902,432 1,963,555 1,924,193
yoy change 13% 7% 8% 7% 3% -2%
Water and others 184,097 171,057 190,770 189,396 189,396 189,396 189,396
yoy change -7% 12% -1% 0% 0% 0%
Municipal (including Urban transit)
2,383,950 2,335,990 2,303,220 2,455,211 2,625,489 2,791,656 2,940,371
yoy change -2% -1% 7% 7% 6% 5%
Total 4,470,037 4,675,441 4,804,958 5,099,476 5,393,207 5,550,838 5,595,321
yoy change 4.6% 2.8% 6.1% 5.8% 2.9% 0.8%
Investment business 357,603 420,790 480,496 626,588 886,207 1,057,030 1,127,243
yoy change 18% 14% 30% 41% 19% 7%
% of total 8% 9% 10% 12% 16% 19% 20%
Cash construction 4,112,434 4,254,651 4,324,462 4,472,888 4,507,000 4,493,808 4,468,078
yoy change 3% 2% 3% 1% 0% -1%
% of total 92% 91% 90% 88% 84% 81% 80% Our assumption: PPP projects could be entered into implementation period in the next 3.5 years Source: Deutsche Bank, CRC, MoT, MOHURD
Figure 17: DB assumption on China infrastructure spending (best case)
Rmbm 2013 2014 2015 2016E 2017E 2018E 2019E
Railway 532,770 622,300 659,638 676,129 676,368 610,872 550,020
yoy change 17% 6% 3% 0% -10% -10%
Road 1,369,220 1,546,094 1,651,330 1,778,740 1,944,182 2,101,104 2,101,300
yoy change 13% 7% 8% 9% 8% 0%
Water and others 184,097 171,057 190,770 189,396 189,396 189,396 189,396
yoy change -7% 12% -1% 0% 0% 0%
Municipal (including Urban transit)
2,383,950 2,335,990 2,303,220 2,455,211 2,640,575 2,869,919 3,061,525
yoy change -2% -1% 7% 8% 9% 7%
Total 4,470,037 4,675,441 4,804,958 5,099,476 5,450,521 5,771,291 5,902,241
yoy change 4.6% 2.8% 6.1% 6.9% 5.9% 2.3%
Investment business 357,603 420,790 480,496 626,588 948,646 1,289,570 1,447,625
yoy change 18% 14% 30% 51% 36% 12%
% of total 8% 9% 10% 12% 17% 22% 25%
Cash construction 4,112,434 4,254,651 4,324,462 4,472,888 4,501,875 4,481,721 4,454,615
yoy change 3% 2% 3% 1% 0% -1%
% of total 92% 91% 90% 88% 83% 78% 75%
Our assumption: PPP projects could be entered into implementation period in the next 2.5 years Source: Deutsche Bank, CRC, MoT, MOHURD

3 March 2017
Infrastructure
China Infrastructure
Deutsche Bank AG/Hong Kong Page 9
Valuations and ratings
Raising earnings/target price for all the constructors
Based on management guidance on new orders, our recent tour and analysis
on PPP projects, we upgrade our forecasts and target prices for all the
constructors, as follows.
Figure 18: Forecast revisions
Net profit (Rmbm) 2016F 2017F 2018F Comment vs. Bloomberg consensus
CRG
Old 13,333 14,675 15,462 Higher construction revenue and better margin expansion
Our 2016 forecast is in line with the market. Our 2017 and 2018 earnings forecast is 8% and 12%
above Bloomberg consensus
New 13,459 15,549 17,259
% change 1% 6% 12%
CRCC
Old 14,062 16,035 16,557 Higher construction revenue and better margin expansion
Our 2016 forecast is in line with the market. Our 2017 and 2018 earnings forecast is 4% and 12%
above Bloomberg consensus
New 14,273 16,620 18,659
% change 2% 4% 13%
CCC
Old 18,051 19,923 21,598 Higher construction revenue and better margin expansion
Our 2016, 2017 and 2018 earnings forecasts are
6%, 11% and 16% above Bloomberg consensus
New 18,201 21,311 24,345
% change 1% 7% 13%
CSCI (HK$m)
Old 5,132 5,514 6,611 Higher construction revenue and better margin expansion
Our 2016, 2017 and 2018 earnings forecasts are
11%, 3% and 5% above Bloomberg consensus
New 5,155 5,894 7,314
% change 0% 7% 11%
Source: Deutsche Bank, Bloomberg Finance LP
Figure 19: Target price changes
Target price CRG CRCC CCC CSCI
Old 6.93 11.84 12.08 14.97
New 7.92 13.36 13.71 16.06
Reason for TP change Earnings upgrade and target price roll-over (to 2017)
Earnings upgrade and target price roll-over (to 2017)
Earnings upgrade and target price roll-over (to 2017)
Earnings upgrade
Target 2017E (x) 10 10 10 12 Source: Deutsche Bank

3 March 2017
Infrastructure
China Infrastructure
Page 10 Deutsche Bank AG/Hong Kong
Figure 20: Valuation comparables
Stock name Stock code Rating TP (HK$)
Price (March 1)
Upside to TP
P/E (x) EPS growth
P/B (x) ROE (%)
Dividend yield (%)
new new old HK$ % FY16E FY17E FY16E FY17E FY16E FY17E FY16E FY17E FY17E
CCC 1800.HK Buy 13.71 12.08 10.80 27% 9.4 7.9 6% 19% 1.0 0.9 11.3% 12.8% 2.6%
CSCI 3311.HK Buy 16.06 14.97 13.20 22% 13.4 10.1 -4% 34% 2.0 1.8 20.3% 18.6% 3.0%
CRCC 1186.HK Buy 13.36 11.84 11.36 18% 9.6 8.2 7% 16% 1.1 1.0 12.1% 12.7% 1.9%
CRG 390.HK Buy 7.94 6.93 7.11 12% 10.7 9.3 11% 15% 1.1 1.0 11.0% 11.7% 1.8%
Source: Deutsche Bank, Bloomberg Finance LP, Company data
2016 earnings preview
All the construction companies under our coverage are scheduled to release
2016 results in mid- to end-March 2017. We forecast CRG, CCC, CRCC and
CSCI’s 2016 core earnings to increase 15%, 15%, 13% and 1% yoy,
respectively. Our earnings estimate for CCC and CSCI is 6% and 11% ahead of
market consensus. Our forecasts for the other two names are largely in line
with market expectations.
Figure 21: 2016 earnings calendar
Ticker 2016 result date
CRG 390.HK 30-Mar-2017
CRCC 1186.HK 30-Mar-2017
CCC 1800.HK 28-Mar-2017
CSCI 3311.HK 21-Mar-2017 Source: Company data
Our top picks – CCC and CSCI
CCC (1800.HK, Buy, target price HK$13.71)
Investment thesis
CCC is a leading state-owned company, engaged primarily in infrastructure
construction (mainly ports, roads, bridges, and railways), dredging, port
machinery, and road/bridge/port design. CCC is our top pick in the sector
mainly due to the following reasons.
1) In our opinion, CCC is the largest prospective beneficiary from the
OBOR plan in the medium term.
2) It has the highest exposure to investment business among big three
constructors. PPP projects account for 21% of CCC’s new orders in
2016, vs. 14-17% for CRG and CRCC.
3) It has strong capability to control overseas and investment-business
projects considering its good track record.
4) Potential SOE reforms may benefit its B/S. We believe it is possible for
CCC to introduce forecast strategic investors and optimize its business
this year.
5) CCC is trading at 8x 2017E PE, at a 4% and 15% discount to CRCC
and CRG’s, respectively.

3 March 2017
Infrastructure
China Infrastructure
Deutsche Bank AG/Hong Kong Page 11
Valuation
Our preferred valuation method for CCC is DCF (WACC of 8.0%, COE of 9.5%,
COD of 5%, and ND/E of 50%), with 2020 as the terminal year and a 0.5%
terminal growth rate (based on potentially lower railway infrastructure
spending in China). Our COE of 9.5% uses Deutsche Bank’s guided 3.9% risk-
free rate and 5.6% risk premium.
Risks
Key downside risks include worse-than-expected growth in the heavy
machinery business, lower margin expansion; lower government infrastructure
spending, interest rate hikes, weaker-than-expected overseas business, and
VAT reform.
Figure 22: CCC’s rolling forward PE band Figure 23: CCC’s PB vs. ROE
-5%
0%
5%
10%
15%
20%
25%
30%
0
2
4
6
8
10
12
14
16
18
20
22
24
26
Ja
n-1
2
Mar-
12
May-1
2
Ju
l-12
Se
p-1
2
No
v-1
2
Ja
n-1
3
Mar-
13
May-1
3
Ju
l-13
Se
p-1
3
No
v-1
3
Ja
n-1
4
Mar-
14
May-1
4
Ju
l-14
Se
p-1
4
No
v-1
4
Ja
n-1
5
Mar-
15
May-1
5
Ju
l-15
Se
p-1
5
No
v-1
5
Ja
n-1
6
Mar-
16
May-1
6
Jul-16
Se
p-1
6
Nov-1
6
Ja
n-1
7
EPS growth(%)HK$
16x
8x
12x
4x
0%
5%
10%
15%
20%
0.0
0.5
1.0
1.5
2.0
Jan
-12
Ap
r-1
2
Jul-
12
Oct
-12
Jan
-13
Ap
r-1
3
Jul-
13
Oct
-13
Jan
-14
Ap
r-1
4
Jul-
14
Oct
-14
Jan
-15
Ap
r-1
5
Jul-
15
Oct
-15
Jan
-16
Ap
r-1
6
Jul-
16
Oct
-16
Jan
-17
Average P/B
P/B (LHS) ROE (RHS)
Source: Deutsche Bank, Bloomberg Finance LP, Company data
Source: Deutsche Bank, Bloomberg Finance LP, Company data
CSCI (3311.HK, Buy, target price HK$16.06)
Investment thesis
We estimate the market size of infrastructure projects via the PPP financing
model (mainly including transportation and municipal projects) will be Rmb2trn
in 2017-18, representing a 35% CAGR over 2016-2018. We believe CSCI will be
the largest beneficiary of this acceleration among the constructors due to its
high exposure (+40% of total backlog) to the investment business for
infrastructure projects, which would be its major target market in mainland
China in the coming years. Armed with a distinct platform supported by parent
company CSCEC, coupled with a steadier financial position and good risk
management, we believe CSCI will be able to explore rising business
opportunities stemming from infrastructure PPP projects in mainland China.
We estimate CSCI will report a 32% core earnings CAGR in 2016-2018 on
healthy revenue growth and margin expansion. Our Buy rating reflects our
view on the company's healthy earnings outlook and solid financial position.
Valuation
We use DCF as our primary tool to value CSCI, with reference to a relative
valuation based on P/E multiples. Our target price is based on a WACC of 8.5%
and terminal growth rate of 0.5%. This implies a 2017 P/E of 12x, higher than
that of its Chinese peers at 10x. We believe this is justifiable, as CSCI offers
potential stronger earnings growth than peers.

3 March 2017
Infrastructure
China Infrastructure
Page 12 Deutsche Bank AG/Hong Kong
Risks
Key down risks include: 1) slower-than-expected promotion of PPP model; 2)
lower-government spending in public housing and infrastructure projects; 3) a
sharp increase in raw materials prices; and 4) worse-than-expected margin
performance.
Figure 24: CSCI’s rolling forward PE band Figure 25: CSCI’s PB vs. ROE
8x
4x
12x
16x
20x
-10%
0%
10%
20%
30%
40%
50%
0
5
10
15
20
25
30
35
Jan
-12
Ap
r-12
Jul-
12
Oct
-12
Jan
-13
Ap
r-13
Jul-
13
Oct
-13
Jan
-14
Ap
r-14
Jul-
14
Oct
-14
Jan
-15
Ap
r-15
Jul-
15
Oct
-15
Jan
-16
Ap
r-16
Jul-
16
Oct
-16
Jan
-17
EPS growth (%)HK$
Average P/B
0%
5%
10%
15%
20%
25%
0.0
1.0
2.0
3.0
4.0
5.0
6.0
Jan
-12
Ap
r-12
Jul-
12
Oct
-12
Jan
-13
Ap
r-13
Jul-
13
Oct
-13
Jan
-14
Ap
r-14
Jul-
14
Oct
-14
Jan
-15
Ap
r-15
Jul-
15
Oct
-15
Jan
-16
Ap
r-16
Jul-
16
Oct
-16
Jan
-17
P/B (LHS) ROE (RHS)
Source: Deutsche Bank, Bloomberg Finance LP, Company data
Source: Deutsche Bank, Bloomberg Finance LP, Company data
Other Names:
China Railway Group (0390.HK) Valuation:
Our preferred valuation method for CRG is DCF (WACC of 7.4%, COE of 9.3%, COD
of 5.0% and ND/E of 50%), with 2020 as the terminal year and 0.5% terminal
growth (average growth rate for the companies in the sector). Our COE of 9.3%
uses Deutsche Bank's guided 3.9% risk-free rate and 5.6% risk premium. Our target
price implies PEs of 10x for 2017E.
Risks:
Downside risks: rising raw material costs; slowdown in the property market;
political instability overseas; and lower margin performance.
China Rail Construction (1186.HK) Valuation
Our preferred valuation methodology for CRCC is a DCF valuation (WACC of 7.0%,
COE of 8.7%, COD of 5.0% and ND/E of 30%), with 2020 being the terminal year,
and terminal growth of 0.5% (average growth rate for the companies in the sector).
Our COE of 8.7% uses Deutsche Bank's guided 3.9% risk-free rate and 5.6% risk
premium. Our target price implies a PE of 10x for 2017E.
Risks
Downside risks: lower infrastructure capex; political instability overseas; rising raw
material costs; margin performance; weaker overseas demand; and VAT reform.

Ch
ina In
frastru
ctu
re
Infra
structu
re
3 M
arc
h 2
017
Deu
tsch
e B
an
k A
G/H
on
g K
on
g
Pag
e 1
3
Figure 26: Infrastructure construction – peer valuation
Company Name Bloomberg Curr DB rating
Price Market Cap
Avg trading
value
P/E (X) EPS Chg(%)
P/B (X) ROE (%)
March 1, 2017 Ticker (local) (US$ m) (US$ m) FY16E FY17E FY18E FY16E FY17E FY18E FY16E FY17E FY18E FY16E FY17E FY18E
Chinese construction competitors
China Railway Group * 390 HK HK$ Buy 7.11 28,450 19 10.7 9.2 8.3 12% 16% 11% 1.1 1.0 0.9 11.0 11.7 11.8
China Railway Construction * 1186 HK HK$ Buy 11.36 25,225 22 9.6 8.2 7.3 7% 16% 12% 1.1 1.0 0.9 12.1 12.7 12.8
China Communications Construction * 1800 HK HK$ Buy 10.80 36,996 36 9.4 7.9 6.8 6% 19% 16% 1.1 1.0 0.9 12.5 13.9 14.3
China State Construction Int'l * 3311 HK HK$ Buy 13.20 7,632 17 13.4 10.1 8.1 -4% 34% 24% 2.0 1.8 1.5 20.2 18.6 20.2
China Machinery Engineering 1829 HK HK$ n/a 5.62 2,987 5 10.7 9.9 9.4 -15% 7% 5% 1.3 1.2 1.1 13.1 13.1 12.9
China Oilfield Services Limited 601808.SH Rmb n/a 13.43 7,585 13 n/a n/a 57.6 n/a n/a 497% 1.8 1.8 1.7 (23.1) (0.0) 3.1
Offshore Oil Engineering 600583.SH Rmb n/a 8.02 5,202 34 21.4 20.4 16.2 -51% 5% 26% 1.5 1.4 1.3 6.0 6.3 8.0
China Gezhouba Group 600068.SH Rmb n/a 11.01 7,396 114 15.4 12.4 9.9 23% 24% 25% 2.3 2.0 1.7 15.2 16.6 17.3
Sinoma International Engineering 600970.SH Rmb n/a 7.89 2,031 25 16.6 13.7 11.8 -21% 21% 16% 1.5 1.4 1.3 11.8 13.1 13.8
Shanghai Construction 600170.SH Rmb n/a 5.04 5,546 49 17.1 15.3 14.0 -5% 12% 9% 1.5 1.4 1.3 9.4 9.7 10.0
Shanghai Tunnel Engineering 600820.SH Rmb n/a 11.70 5,361 72 21.7 18.6 15.9 15% 16% 17% 2.0 1.9 1.7 9.5 10.1 10.4
Shanghai Pudong Road & Bridge Construction
600284.SH Rmb n/a 12.89 1,300 24 35.8 36.8 n/a -34% -3% n/a 1.7 1.6 1.5 8.6 9.4 9.5
Simple average for Chinese peers 16.5 14.8 15.0 -6% 15% 60% 1.6 1.4 1.3 8.9 11.3 12.0
Simple average for Chinese peers (listed on HK market)
10.7 9.1 8.0 1% 18% 14% 1.3 1.2 1.1 13.8 14.0 14.4
Regional construction competitors
Shimizu Corporation * 1803 JP JPY Hold 1,045.00 7,315 25 13.1 10.7 12.4 78% 29% -14% 1.6 1.5 1.4 12.4 15.0 11.7
KAJIMA Corporation * 1812 JP JPY Hold 738.00 6,880 39 9.2 8.6 9.3 378% 23% -7% 1.6 1.4 1.2 16.0 17.5 14.2
Hyundai Engineering&Construction 000720 KS KRW n/a 47,800.00 4,743 18 11.9 9.5 9.1 22% 25% 5% 0.9 0.8 0.7 7.6 8.7 8.6
Daewoo Engineering & Construction 047040 KS KRW n/a 6,130.00 2,250 5 21.9 7.9 7.8 -20% 177% 1% 0.9 1.0 0.9 4.2 14.4 12.4
GS E&C 006360 KS KRW n/a 29,800.00 1,900 10 64.9 9.8 7.7 26% 562% 28% 0.6 0.6 0.5 1.3 6.5 7.7
Hyundai Dev. Co. 012630 KS KRW n/a 43,800.00 2,938 13 9.5 8.0 7.9 56% 20% 1% 1.2 1.1 1.0 13.9 14.8 13.4
Samsung Eng. 028050 KS KRW n/a 12,400.00 2,219 19 33.3 16.8 13.3 n/a 98% 26% 2.2 2.1 1.8 16.8 12.7 15.5
Daelim Industrial 000210 KS KRW n/a 83,600.00 2,605 11 8.9 7.6 7.4 76% 17% 3% 0.7 0.6 0.6 7.7 8.4 8.0
Sino-Thai Engineering STEC TB THB n/a 25.50 1,123 6 37.6 28.5 22.1 -32% 32% 29% 3.9 3.5 3.2 10.9 12.7 14.9
Larsen & Toubro Ltd * LT IN INR Hold 1,469.20 20,651 34 32.4 23.5 22.9 -9% 32% 10% 2.6 2.9 2.7 10.0 12.8 12.3
BHEL * BHEL IN INR Buy 162.45 5,881 21 n/a 49.7 27.0 n/a n/a 84% 0.8 1.2 1.1 (2.7) 2.4 4.3
Gamuda GAM MK MYR n/a 4.95 2,705 4 19.7 17.6 15.7 -13% 12% 12% 1.8 1.6 1.5 9.6 10.0 10.5
IJM Corp IJM MK MYR n/a 3.35 2,734 3 19.0 19.9 17.0 -46% -5% 17% 1.3 1.3 1.2 7.5 6.7 7.6
Simple average for regional peers 23.5 16.8 13.8 47% 85% 15% 1.6 1.5 1.4 8.9 11.0 10.9
Source: Deutsche Bank estimates for companies with”*”, Bloomberg Finance LP estimates for all others

Ch
ina In
frastru
ctu
re
Infra
structu
re
3 M
arc
h 2
017
Pag
e 1
4
Deu
tsch
e B
an
k A
G/H
on
g K
on
g
Figure 27: Infrastructure construction – peer valuation (continued)
Company Name Bloomberg Curr DB rating Price Market Cap
Ave trading value
P/E (x) (F)
EPS chg
(%) (F)
P/B (x) ROE (%)
March 1, 2017 Ticker (local) (US$ m) (US$ m) FY16E FY17E FY18E FY16E FY17E FY18E FY16E FY17E FY18E FY16E FY17E FY18E
Europe and US construction competitors
VINCI SA DG FP EUR n/a 68.01 43,390 99 16.5 14.8 13.7 12% 11% 8% 2.4 2.2 2.0 14.7 15.0 14.9
Bouygues SA EN FP EUR n/a 36.37 13,889 32 19.8 16.8 15.0 54% 18% 12% 1.6 1.6 1.6 5.8 9.3 10.7
EIFFAGE SA FGR FP EUR n/a 67.42 7,100 19 16.2 14.0 12.2 22% 15% 15% 1.8 1.7 1.5 11.7 12.1 12.7
ACCIONA S.A.* ANA SM EUR Buy 70.67 4,288 11 11.0 13.7 11.8 -35% 103% 16% 1.1 1.1 1.0 9.8 7.9 8.8
STRABAG SE * STR AV EUR Hold 35.10 4,222 0 16.0 15.4 15.1 29% 4% 2% 1.2 1.1 1.1 7.5 7.5 7.3
Skanska AB SKAB SS SEK n/a 215.20 10,151 27 14.5 15.9 16.9 27% -9% -6% 3.3 3.0 27.3 24.0 19.3 17.9
NCC AB NCCB SS SEK n/a 214.70 2,588 8 20.4 14.8 14.1 -46% 37% 5% 4.0 3.7 31.7 18.4 26.5 25.0
Fluor Corporation * FLR US USD Buy 55.39 7,892 81 25.3 18.5 16.5 -29% 50% 12% 2.3 2.3 2.1 9.2 12.9 13.2
Jacobs Engineering * JEC US USD Hold 56.41 6,966 54 26.1 21.1 16.2 -6% -2% 16% 1.5 1.5 1.4 4.9 7.4 9.0
Enka Insaat * ENKAI TI TRY Hold 5.64 6,633 5 12.5 12.0 11.6 1% 4% 4% 1.2 1.1 1.1 10.0 9.7 9.4
Simple average for international peers 17.8 15.7 14.3 3% 23% 8% 2.0 1.9 7.1 11.6 13.1 13.3
Overall average 19.4 15.8 14.4 15% 43% 28% 1.7 1.6 3.0 9.6 11.6 11.8
Source: Deutsche Bank estimates for companies with”*”, Bloomberg Finance LP estimates for all others

3 March 2017
Infrastructure
China Infrastructure
Deutsche Bank AG/Hong Kong Page 15
Model updated:02 March 2017
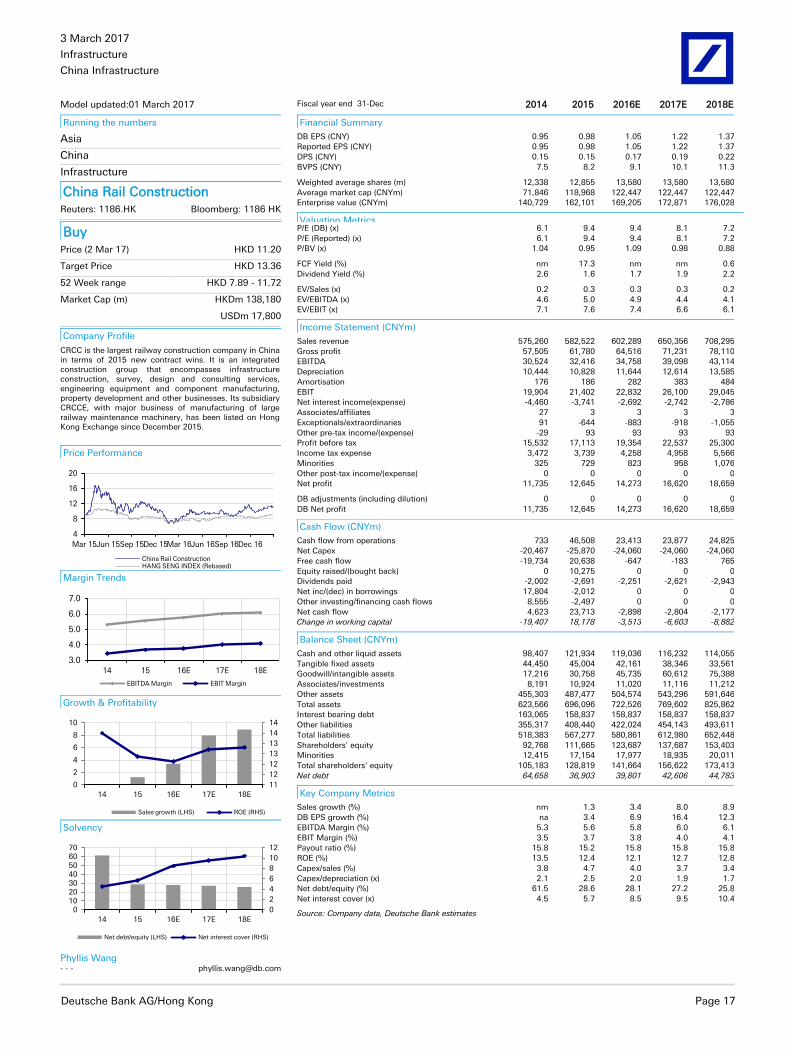
Running the numbers
Asia
China
Infrastructure
China Comms Construct Reuters: 1800.HK Bloomberg: 1800 HK
Buy Price (2 Mar 17) HKD 10.78
Target Price HKD 13.71
52 Week range HKD 7.55 - 10.80
Market Cap (m) HKDm 174,364
USDm 22,460
Company Profile
CCC is a leading state-owned company, engaged primarily in infrastructure construction (mainly ports/roads/bridges/railways), dredging, port machinery, and road/bridge/port design. CCC is the third-largest railway construction company in China and the the largest dredging company, with a 70-80% market share. It conducts a port machinery manufacturing business through SZHI, which is the largest container crane producer in the world.
Price Performance
4
8
12
16
20
Mar 15Jun 15Sep 15Dec 15Mar 16Jun 16Sep 16Dec 16
China Comms ConstructHANG SENG INDEX (Rebased)
Margin Trends
6.0
7.0
8.0
9.0
10.0
14 15 16E 17E 18E
EBITDA Margin EBIT Margin
Growth & Profitability
1011111212131314
02468
101214
14 15 16E 17E 18E
Sales growth (LHS) ROE (RHS)
Solvency
01234567
0
50
100
150
14 15 16E 17E 18E
Net debt/equity (LHS) Net interest cover (RHS)
Phyllis Wang
- - - [email protected]
Fiscal year end 31-Dec 2014 2015 2016E 2017E 2018E
Financial Summary
DB EPS (CNY) 0.86 0.96 1.02 1.21 1.40
Reported EPS (CNY) 0.86 0.96 1.02 1.21 1.40
DPS (CNY) 0.17 0.19 0.20 0.24 0.28
BVPS (CNY) 7.2 9.1 9.0 10.0 11.1
Weighted average shares (m) 16,175 16,175 16,175 16,175 16,175
Average market cap (CNYm) 76,212 138,594 154,510 154,510 154,510
Enterprise value (CNYm) 232,358 305,393 357,458 393,657 432,680
Valuation Metrics P/E (DB) (x) 5.4 8.9 9.4 7.9 6.8
P/E (Reported) (x) 5.4 8.9 9.4 7.9 6.8
P/BV (x) 1.03 0.71 1.06 0.96 0.86
FCF Yield (%) nm nm nm nm nm
Dividend Yield (%) 3.6 2.2 2.1 2.5 2.9
EV/Sales (x) 0.6 0.8 0.8 0.9 0.8
EV/EBITDA (x) 7.3 8.8 9.3 8.9 8.7
EV/EBIT (x) 9.8 11.8 12.5 11.8 11.4
Income Statement (CNYm)
Sales revenue 366,042 403,616 423,592 462,569 520,139
Gross profit 47,163 58,551 63,290 71,031 80,223
EBITDA 31,676 34,595 38,601 44,223 49,954
Depreciation 7,211 7,839 8,712 9,584 10,457
Amortisation 680 958 1,182 1,369 1,549
EBIT 23,785 25,798 28,707 33,270 37,948
Net interest income(expense) -6,520 -6,511 -4,895 -5,325 -5,968
Associates/affiliates 339 384 384 384 384
Exceptionals/extraordinaries 0 0 0 0 0
Other pre-tax income/(expense) 0 0 0 0 0
Profit before tax 17,604 19,671 24,196 28,329 32,364
Income tax expense 3,721 3,758 5,897 6,904 7,887
Minorities -102 85 98 114 131
Other post-tax income/(expense) 0 -300 -1,736 -1,736 -1,736
Net profit 13,985 15,528 16,465 19,575 22,609
DB adjustments (including dilution) 0 0 0 0 0
DB Net profit 13,985 15,528 16,465 19,575 22,609
Cash Flow (CNYm)
Cash flow from operations -6,256 18,465 3,120 4,360 2,153
Net Capex -42,255 -51,267 -34,555 -35,210 -35,210
Free cash flow -48,511 -32,802 -31,435 -30,850 -33,057
Equity raised/(bought back) 0 0 0 0 0
Dividends paid -3,116 -3,195 -3,265 -3,882 -4,483
Net inc/(dec) in borrowings 38,246 26,862 0 10,000 15,000
Other investing/financing cash flows 4,085 31,999 -1,736 -1,736 -1,736
Net cash flow -9,296 22,864 -36,436 -26,468 -24,276
Change in working capital -20,650 17,505 -24,688 -27,634 -33,945
Balance Sheet (CNYm)
Cash and other liquid assets 78,040 98,077 61,641 35,173 10,897
Tangible fixed assets 63,377 67,973 61,227 58,842 55,585
Goodwill/intangible assets 90,378 141,345 158,258 184,899 211,360
Associates/investments 9,730 12,589 12,973 13,357 13,741
Other assets 388,655 411,329 449,075 502,526 575,986
Total assets 630,180 731,313 743,173 794,798 867,570
Interest bearing debt 228,835 255,183 255,183 265,183 280,183
Other liabilities 269,733 307,124 320,181 345,998 385,514
Total liabilities 498,568 562,307 575,364 611,181 665,697
Shareholders' equity 116,531 146,724 145,429 161,122 179,248
Minorities 15,081 22,282 22,380 22,494 22,625
Total shareholders' equity 131,612 169,006 167,809 183,617 201,873
Net debt 150,795 157,106 193,542 230,010 269,286
Key Company Metrics
Sales growth (%) nm 10.3 4.9 9.2 12.4
DB EPS growth (%) na 11.0 6.0 18.9 15.5
EBITDA Margin (%) 8.7 8.6 9.1 9.6 9.6
EBIT Margin (%) 6.5 6.4 6.8 7.2 7.3
Payout ratio (%) 19.9 19.8 19.8 19.8 19.8
ROE (%) 13.2 11.8 11.3 12.8 13.3
Capex/sales (%) 11.7 12.9 8.8 7.6 6.8
Capex/depreciation (x) 5.4 5.9 3.8 3.2 2.9
Net debt/equity (%) 114.6 93.0 115.3 125.3 133.4
Net interest cover (x) 3.6 4.0 5.9 6.2 6.4
Source: Company data, Deutsche Bank estimates

3 March 2017
Infrastructure
China Infrastructure
Page 16 Deutsche Bank AG/Hong Kong
Model updated:02 March 2017
Running the numbers
Asia
China
Property
CSCI Reuters: 3311.HK Bloomberg: 3311 HK
Buy Price (2 Mar 17) HKD 13.40
Target Price HKD 16.06
52 Week range HKD 9.12 - 13.52
Market Cap (m) HKDm 60,141
USDm 7,747
Company Profile
China State Construction International Holdings Limited began operations in Hong Kong in 1979. It engages in housing/infrastructure construction and civil engineering operations as well as other peripheral operations such as foundation work, site investigation, mechanical and electrical engineering, highway and bridge construction, ready-mixed concrete, pre-cast production and infrastructure investment. China State Construction was listed on the Main Board of The Hong Kong Stock Exchange in July 2005.
Price Performance
8
9
11
12
14
15
17
Mar 15Jun 15Sep 15Dec 15Mar 16Jun 16Sep 16Dec 16
CSCI HANG SENG INDEX (Rebased)
Margin Trends
10.0
11.0
12.0
13.0
14.0
15.0
14 15 16E 17E 18E
EBITDA Margin EBIT Margin
Growth & Profitability
18
18
19
19
20
20
21
0
5
10
15
20
25
14 15 16E 17E 18E
Sales growth (LHS) ROE (RHS)
Solvency
0
5
10
15
20
0
10
20
30
40
50
14 15 16E 17E 18E
Net debt/equity (LHS) Net interest cover (RHS)
Phyllis Wang
- - - [email protected]
Fiscal year end 31-Dec 2014 2015 2016E 2017E 2018E
Financial Summary
DB EPS (HKD) 0.88 1.02 0.98 1.31 1.63
Reported EPS (HKD) 0.88 1.02 1.21 1.31 1.63
DPS (HKD) 0.26 0.33 0.36 0.39 0.49
BVPS (HKD) 4.9 5.2 6.6 7.5 8.6
Weighted average shares (m) 3,896 4,026 4,272 4,488 4,488
Average market cap (HKDm) 49,755 48,730 60,141 60,141 60,141
Enterprise value (HKDm) 51,282 50,976 57,749 59,232 60,802
Valuation Metrics P/E (DB) (x) 14.6 11.8 13.6 10.2 8.2
P/E (Reported) (x) 14.6 11.8 11.1 10.2 8.2
P/BV (x) 2.21 2.58 2.03 1.79 1.55
FCF Yield (%) nm nm 2.0 nm nm
Dividend Yield (%) 2.0 2.7 2.7 2.9 3.6
EV/Sales (x) 1.5 1.3 1.2 1.1 1.0
EV/EBITDA (x) 12.6 11.5 11.0 8.4 7.1
EV/EBIT (x) 13.7 12.4 11.8 8.9 7.4
Income Statement (HKDm)
Sales revenue 34,440 37,913 46,491 54,004 61,340
Gross profit 5,063 5,362 6,563 8,523 10,291
EBITDA 4,074 4,439 5,248 7,044 8,609
Depreciation 320 332 362 392 423
Amortisation 0 0 0 0 0
EBIT 3,754 4,107 4,886 6,652 8,186
Net interest income(expense) -301 -405 -426 -416 -467
Associates/affiliates 318 496 651 900 1,246
Exceptionals/extraordinaries 0 0 0 0 0
Other pre-tax income/(expense) 277 558 1,010 22 27
Profit before tax 4,048 4,756 6,121 7,158 8,992
Income tax expense 660 655 979 1,253 1,663
Minorities -70 -51 -13 12 15
Other post-tax income/(expense) 0 0 0 0 0
Net profit 3,457 4,153 5,155 5,894 7,314
DB adjustments (including dilution) 0 0 -953 0 0
DB Net profit 3,457 4,153 4,202 5,894 7,314
Cash Flow (HKDm)
Cash flow from operations -1,674 316 1,568 247 295
Net Capex -476 -393 -425 -425 -425
Free cash flow -2,150 -77 1,143 -178 -130
Equity raised/(bought back) 1 10 4,810 0 0
Dividends paid -901 -1,216 -1,547 -1,768 -2,194
Net inc/(dec) in borrowings 4,740 3,114 474 0 0
Other investing/financing cash flows -2,346 -1,320 -433 -425 -478
Net cash flow -656 510 4,447 -2,371 -2,802
Change in working capital -5,461 -3,958 -3,711 -5,567 -6,677
Balance Sheet (HKDm)
Cash and other liquid assets 7,452 8,015 12,462 10,092 7,290
Tangible fixed assets 2,827 2,772 2,835 2,867 2,870
Goodwill/intangible assets 0 0 0 0 0
Associates/investments 6,007 7,613 8,265 9,165 10,411
Other assets 50,292 51,664 61,534 71,997 83,554
Total assets 66,579 70,065 85,096 94,120 104,125
Interest bearing debt 14,820 17,774 18,248 18,248 18,248
Other liabilities 31,762 31,043 37,196 42,083 46,953
Total liabilities 46,581 48,818 55,444 60,331 65,201
Shareholders' equity 19,830 21,147 29,565 33,691 38,810
Minorities 168 100 87 99 114
Total shareholders' equity 19,998 21,247 29,652 33,790 38,924
Net debt 7,367 9,759 5,786 8,156 10,958
Key Company Metrics
Sales growth (%) nm 10.1 22.6 16.2 13.6
DB EPS growth (%) na 16.8 -3.8 33.5 24.1
EBITDA Margin (%) 11.8 11.7 11.3 13.0 14.0
EBIT Margin (%) 10.9 10.8 10.5 12.3 13.3
Payout ratio (%) 29.3 32.0 30.0 30.0 30.0
ROE (%) 19.2 20.3 20.3 18.6 20.2
Capex/sales (%) 1.5 1.1 0.9 0.8 0.7
Capex/depreciation (x) 1.6 1.3 1.2 1.1 1.0
Net debt/equity (%) 36.8 45.9 19.5 24.1 28.2
Net interest cover (x) 12.5 10.1 11.5 16.0 17.5
Source: Company data, Deutsche Bank estimates
3 March 2017
Infrastructure
China Infrastructure
Deutsche Bank AG/Hong Kong Page 17
Model updated:01 March 2017
Running the numbers
Asia
China
Infrastructure
China Rail Construction Reuters: 1186.HK Bloomberg: 1186 HK
Buy Price (2 Mar 17) HKD 11.20
Target Price HKD 13.36
52 Week range HKD 7.89 - 11.72
Market Cap (m) HKDm 138,180
USDm 17,800
Company Profile
CRCC is the largest railway construction company in China in terms of 2015 new contract wins. It is an integrated construction group that encompasses infrastructure construction, survey, design and consulting services, engineering equipment and component manufacturing, property development and other businesses. Its subsidiary CRCCE, with major business of manufacturing of large railway maintenance machinery, has been listed on Hong Kong Exchange since December 2015.
Price Performance
4
8
12
16
20
Mar 15Jun 15Sep 15Dec 15Mar 16Jun 16Sep 16Dec 16
China Rail ConstructionHANG SENG INDEX (Rebased)
Margin Trends
3.0
4.0
5.0
6.0
7.0
14 15 16E 17E 18E
EBITDA Margin EBIT Margin
Growth & Profitability
11
12
12
13
13
14
14
0
2
4
6
8
10
14 15 16E 17E 18E
Sales growth (LHS) ROE (RHS)
Solvency
0
2
4
6
8
10
12
010203040506070
14 15 16E 17E 18E
Net debt/equity (LHS) Net interest cover (RHS)
Phyllis Wang
- - - [email protected]
Fiscal year end 31-Dec 2014 2015 2016E 2017E 2018E
Financial Summary
DB EPS (CNY) 0.95 0.98 1.05 1.22 1.37
Reported EPS (CNY) 0.95 0.98 1.05 1.22 1.37
DPS (CNY) 0.15 0.15 0.17 0.19 0.22
BVPS (CNY) 7.5 8.2 9.1 10.1 11.3
Weighted average shares (m) 12,338 12,855 13,580 13,580 13,580
Average market cap (CNYm) 71,846 118,968 122,447 122,447 122,447
Enterprise value (CNYm) 140,729 162,101 169,205 172,871 176,028
Valuation Metrics P/E (DB) (x) 6.1 9.4 9.4 8.1 7.2
P/E (Reported) (x) 6.1 9.4 9.4 8.1 7.2
P/BV (x) 1.04 0.95 1.09 0.98 0.88
FCF Yield (%) nm 17.3 nm nm 0.6
Dividend Yield (%) 2.6 1.6 1.7 1.9 2.2
EV/Sales (x) 0.2 0.3 0.3 0.3 0.2
EV/EBITDA (x) 4.6 5.0 4.9 4.4 4.1
EV/EBIT (x) 7.1 7.6 7.4 6.6 6.1
Income Statement (CNYm)
Sales revenue 575,260 582,522 602,289 650,356 708,295
Gross profit 57,505 61,780 64,516 71,231 78,110
EBITDA 30,524 32,416 34,758 39,098 43,114
Depreciation 10,444 10,828 11,644 12,614 13,585
Amortisation 176 186 282 383 484
EBIT 19,904 21,402 22,832 26,100 29,045
Net interest income(expense) -4,460 -3,741 -2,692 -2,742 -2,786
Associates/affiliates 27 3 3 3 3
Exceptionals/extraordinaries 91 -644 -883 -918 -1,055
Other pre-tax income/(expense) -29 93 93 93 93
Profit before tax 15,532 17,113 19,354 22,537 25,300
Income tax expense 3,472 3,739 4,258 4,958 5,566
Minorities 325 729 823 958 1,076
Other post-tax income/(expense) 0 0 0 0 0
Net profit 11,735 12,645 14,273 16,620 18,659
DB adjustments (including dilution) 0 0 0 0 0
DB Net profit 11,735 12,645 14,273 16,620 18,659
Cash Flow (CNYm)
Cash flow from operations 733 46,508 23,413 23,877 24,825
Net Capex -20,467 -25,870 -24,060 -24,060 -24,060
Free cash flow -19,734 20,638 -647 -183 765
Equity raised/(bought back) 0 10,275 0 0 0
Dividends paid -2,002 -2,691 -2,251 -2,621 -2,943
Net inc/(dec) in borrowings 17,804 -2,012 0 0 0
Other investing/financing cash flows 8,555 -2,497 0 0 0
Net cash flow 4,623 23,713 -2,898 -2,804 -2,177
Change in working capital -19,407 18,178 -3,513 -6,603 -8,882
Balance Sheet (CNYm)
Cash and other liquid assets 98,407 121,934 119,036 116,232 114,055
Tangible fixed assets 44,450 45,004 42,161 38,346 33,561
Goodwill/intangible assets 17,216 30,758 45,735 60,612 75,388
Associates/investments 8,191 10,924 11,020 11,116 11,212
Other assets 455,303 487,477 504,574 543,296 591,646
Total assets 623,566 696,096 722,526 769,602 825,862
Interest bearing debt 163,065 158,837 158,837 158,837 158,837
Other liabilities 355,317 408,440 422,024 454,143 493,611
Total liabilities 518,383 567,277 580,861 612,980 652,448
Shareholders' equity 92,768 111,665 123,687 137,687 153,403
Minorities 12,415 17,154 17,977 18,935 20,011
Total shareholders' equity 105,183 128,819 141,664 156,622 173,413
Net debt 64,658 36,903 39,801 42,606 44,783
Key Company Metrics
Sales growth (%) nm 1.3 3.4 8.0 8.9
DB EPS growth (%) na 3.4 6.9 16.4 12.3
EBITDA Margin (%) 5.3 5.6 5.8 6.0 6.1
EBIT Margin (%) 3.5 3.7 3.8 4.0 4.1
Payout ratio (%) 15.8 15.2 15.8 15.8 15.8
ROE (%) 13.5 12.4 12.1 12.7 12.8
Capex/sales (%) 3.8 4.7 4.0 3.7 3.4
Capex/depreciation (x) 2.1 2.5 2.0 1.9 1.7
Net debt/equity (%) 61.5 28.6 28.1 27.2 25.8
Net interest cover (x) 4.5 5.7 8.5 9.5 10.4
Source: Company data, Deutsche Bank estimates

3 March 2017
Infrastructure
China Infrastructure
Page 18 Deutsche Bank AG/Hong Kong
Model updated:02 March 2017
Running the numbers
Asia
China
Infrastructure
China Railway Group Reuters: 0390.HK Bloomberg: 390 HK
Buy Price (2 Mar 17) HKD 7.16
Target Price HKD 7.92
52 Week range HKD 5.24 - 7.16
Market Cap (m) HKDm 152,507
USDm 19,645
Company Profile
CRG is the second largest railway construction company in China in terms of 2015 new contract value. CRG is an integrated construction group that encompasses infrastructure construction, survey, design and consulting services, engineering equipment and component manufacturing, property development and other businesses (such as mining and merchandise trading).
Price Performance
4
6
8
10
12
Mar 15Jun 15Sep 15Dec 15Mar 16Jun 16Sep 16Dec 16
China Railway GroupHANG SENG INDEX (Rebased)
Margin Trends
2.83.23.64.04.44.85.2
14 15 16E 17E 18E
EBITDA Margin EBIT Margin
Growth & Profitability
10
11
11
12
12
0
2
4
6
8
10
14 15 16E 17E 18E
Sales growth (LHS) ROE (RHS)
Solvency
0
5
10
15
20
0
20
40
60
80
100
120
14 15 16E 17E 18E
Net debt/equity (LHS) Net interest cover (RHS)
Phyllis Wang
- - - [email protected]
Fiscal year end 31-Dec 2014 2015 2016E 2017E 2018E
Financial Summary
DB EPS (CNY) 0.48 0.53 0.59 0.68 0.76
Reported EPS (CNY) 0.48 0.53 0.59 0.68 0.76
DPS (CNY) 0.08 0.09 0.10 0.11 0.12
BVPS (CNY) 4.5 5.4 5.5 6.1 6.7
Weighted average shares (m) 21,300 22,023 22,844 22,844 22,844
Average market cap (CNYm) 70,084 134,363 135,142 135,142 135,142
Enterprise value (CNYm) 173,891 218,765 222,292 226,077 228,803
Valuation Metrics P/E (DB) (x) 6.8 11.6 10.8 9.3 8.4
P/E (Reported) (x) 6.8 11.6 10.8 9.3 8.4
P/BV (x) 1.13 0.89 1.15 1.05 0.95
FCF Yield (%) 4.0 11.7 nm nm 0.3
Dividend Yield (%) 2.4 1.4 1.5 1.7 1.9
EV/Sales (x) 0.3 0.4 0.4 0.3 0.3
EV/EBITDA (x) 6.8 8.6 7.7 6.9 6.3
EV/EBIT (x) 9.3 12.1 10.7 9.4 8.6
Income Statement (CNYm)
Sales revenue 590,166 599,942 629,709 681,149 742,097
Gross profit 55,259 56,130 60,770 67,345 73,721
EBITDA 25,532 25,556 29,017 32,998 36,301
Depreciation 6,082 6,734 7,401 8,064 8,728
Amortisation 662 710 764 818 872
EBIT 18,788 18,112 20,851 24,116 26,701
Net interest income(expense) -4,275 -3,172 -1,615 -1,700 -1,792
Associates/affiliates 259 248 248 248 248
Exceptionals/extraordinaries 1,450 1,746 133 0 0
Other pre-tax income/(expense) 11 0 0 0 0
Profit before tax 16,233 15,188 19,484 22,663 25,156
Income tax expense 5,557 5,231 6,030 6,967 7,733
Minorities 414 111 128 148 164
Other post-tax income/(expense) 0 0 0 0 0
Net profit 10,262 11,592 13,459 15,549 17,259
DB adjustments (including dilution) 0 0 0 0 0
DB Net profit 10,262 11,592 13,459 15,549 17,259
Cash Flow (CNYm)
Cash flow from operations 9,600 27,385 10,494 9,835 11,204
Net Capex -6,774 -11,681 -10,802 -10,802 -10,802
Free cash flow 2,826 15,704 -308 -967 402
Equity raised/(bought back) 0 12,000 0 0 0
Dividends paid -1,406 -2,005 -2,311 -2,670 -2,964
Net inc/(dec) in borrowings -5,685 -2,492 0 -5,000 -5,000
Other investing/financing cash flows -2,714 1,418 0 0 0
Net cash flow -6,979 24,625 -2,620 -8,638 -7,562
Change in working capital -7,196 11,935 -11,011 -14,497 -15,571
Balance Sheet (CNYm)
Cash and other liquid assets 68,679 93,304 90,684 82,047 74,485
Tangible fixed assets 48,166 51,765 49,206 48,641 47,413
Goodwill/intangible assets 35,450 38,376 40,076 42,307 44,485
Associates/investments 23,852 23,654 23,654 23,654 23,654
Other assets 506,731 506,406 534,916 579,818 632,238
Total assets 682,878 713,505 738,535 776,468 822,275
Interest bearing debt 182,914 180,422 180,422 175,422 170,422
Other liabilities 391,070 393,845 410,972 441,173 477,806
Total liabilities 573,984 574,267 591,394 616,595 648,228
Shareholders' equity 95,470 118,300 126,076 138,659 152,669
Minorities 13,424 20,938 21,066 21,214 21,378
Total shareholders' equity 108,894 139,238 147,142 159,873 174,047
Net debt 114,235 87,118 89,738 93,375 95,937
Key Company Metrics
Sales growth (%) nm 1.7 5.0 8.2 8.9
DB EPS growth (%) na 9.2 11.9 15.5 11.0
EBITDA Margin (%) 4.3 4.3 4.6 4.8 4.9
EBIT Margin (%) 3.2 3.0 3.3 3.5 3.6
Payout ratio (%) 16.2 16.3 16.2 16.2 16.2
ROE (%) 11.3 10.8 11.0 11.7 11.8
Capex/sales (%) 1.3 1.9 1.7 1.6 1.5
Capex/depreciation (x) 1.1 1.6 1.3 1.2 1.1
Net debt/equity (%) 104.9 62.6 61.0 58.4 55.1
Net interest cover (x) 4.4 5.7 12.9 14.2 14.9
Source: Company data, Deutsche Bank estimates

3 March 2017
Infrastructure
China Infrastructure
Deutsche Bank AG/Hong Kong Page 19
Appendix 1
Important Disclosures
*Other information available upon request
Disclosure checklist
Company Ticker Recent price* Disclosure
China Comms Construct 1800.HK 10.78 (HKD) 2 Mar 17 6,9,13
CSCI 3311.HK 13.40 (HKD) 2 Mar 17 14,15
China Rail Construction 1186.HK 11.20 (HKD) 2 Mar 17 6,7,9,13,14,15
China Railway Group 0390.HK 7.16 (HKD) 2 Mar 17 13,14,15 Prices are current as of the end of the previous trading session unless otherwise indicated and are sourced from local exchanges via Reuters, Bloomberg and other vendors . Other information is sourced from Deutsche Bank, subject companies, and other sources. For disclosures pertaining to recommendations or estimates made on securities other than the primary subject of this research, please see the most recently published company report or visit our global disclosure look-up page on our website at http://gm.db.com/ger/disclosure/DisclosureDirectory.eqsr. Aside from within this report, important conflict disclosures can also be found at https://gm.db.com/equities under the "Disclosures Lookup" and "Legal" tabs. Investors are strongly encouraged to review this information before investing.
Important Disclosures Required by U.S. Regulators
Disclosures marked with an asterisk may also be required by at least one jurisdiction in addition to the United States. See Important Disclosures Required by Non-US Regulators and Explanatory Notes.
6. Deutsche Bank and/or its affiliate(s) owns one percent or more of a class of common equity securities of this company calculated under computational methods required by US law.
7. Deutsche Bank and/or its affiliate(s) has received compensation from this company for the provision of investment banking or financial advisory services within the past year.
14. Deutsche Bank and/or its affiliate(s) has received non-investment banking related compensation from this company within the past year.
15. This company has been a client of Deutsche Bank Securities Inc. within the past year, during which time it received non-investment banking securities-related services.
Important Disclosures Required by Non-U.S. Regulators
Please also refer to disclosures in the Important Disclosures Required by US Regulators and the Explanatory Notes.
6. Deutsche Bank and/or its affiliate(s) owns one percent or more of a class of common equity securities of this company calculated under computational methods required by US law.
7. Deutsche Bank and/or its affiliate(s) has received compensation from this company for the provision of investment banking or financial advisory services within the past year.
9. Deutsche Bank and/or its affiliate(s) owns one percent or more of any class of common equity securities of this company calculated under computational methods required by India law.
13. As of the end of the preceding week, Deutsche Bank and/or its affiliate(s) owns one percent or more of a class of common equity securities of this company.
For disclosures pertaining to recommendations or estimates made on securities other than the primary subject of this research, please see the most recently published company report or visit our global disclosure look-up page on our website at http://gm.db.com/ger/disclosure/DisclosureDirectory.eqsr

3 March 2017
Infrastructure
China Infrastructure
Page 20 Deutsche Bank AG/Hong Kong
Analyst Certification
The views expressed in this report accurately reflect the personal views of the undersigned lead analyst about the subject issuers and the securities of those issuers. In addition, the undersigned lead analyst has not and will not receive any compensation for providing a specific recommendation or view in this report. Phyllis Wang
Historical recommendations and target price: China Comms Construct (1800.HK) (as of 3/2/2017)
1
2
3
4
56
0.00
2.00
4.00
6.00
8.00
10.00
12.00
14.00
16.00
18.00
Mar 15 Jun 15 Sep 15 Dec 15 Mar 16 Jun 16 Sep 16 Dec 16
Secu
rity
Pri
ce
Date
Previous Recommendations
Strong Buy Buy Market Perform Underperform Not Rated Suspended Rating
Current Recommendations
Buy Hold Sell Not Rated Suspended Rating
*New Recommendation Structure as of September 9,2002
**Analyst is no longer at Deutsche Bank
1. 29/04/2015: Buy, Target Price Change HKD18.47 4. 04/03/2016: Buy, Target Price Change HKD10.95
2. 01/07/2015: Buy, Target Price Change HKD15.58 5. 28/04/2016: Buy, Target Price Change HKD11.97
3. 12/11/2015: Buy, Target Price Change HKD13.16 6. 14/07/2016: Buy, Target Price Change HKD12.08
Historical recommendations and target price: CSCI (3311.HK) (as of 3/2/2017)
1
2
34
5 6
0.00
2.00
4.00
6.00
8.00
10.00
12.00
14.00
16.00
18.00
Mar 15 Jun 15 Sep 15 Dec 15 Mar 16 Jun 16 Sep 16 Dec 16
Secu
rity
Pri
ce
Date
Previous Recommendations
Strong Buy Buy Market Perform Underperform Not Rated Suspended Rating
Current Recommendations
Buy Hold Sell Not Rated Suspended Rating
*New Recommendation Structure as of September 9,2002
**Analyst is no longer at Deutsche Bank
1. 20/03/2015: Buy, Target Price Change HKD14.74 Tony Tsang** 4. 18/11/2015: Buy, Target Price Change HKD15.47 Tony Tsang**
2. 26/04/2015: Buy, Target Price Change HKD16.80 Tony Tsang** 5. 22/03/2016: Buy, Target Price Change HKD15.09 Tony Tsang**
3. 13/08/2015: Buy, Target Price Change HKD15.30 Tony Tsang** 6. 01/11/2016: Buy, Target Price Change HKD14.97

3 March 2017
Infrastructure
China Infrastructure
Deutsche Bank AG/Hong Kong Page 21
Historical recommendations and target price: China Rail Construction (1186.HK) (as of 3/2/2017)
1
23
4
5 6
0.00
2.00
4.00
6.00
8.00
10.00
12.00
14.00
16.00
18.00
Mar 15 Jun 15 Sep 15 Dec 15 Mar 16 Jun 16 Sep 16 Dec 16
Secu
rity
Pri
ce
Date
Previous Recommendations
Strong Buy Buy Market Perform Underperform Not Rated Suspended Rating
Current Recommendations
Buy Hold Sell Not Rated Suspended Rating
*New Recommendation Structure as of September 9,2002
**Analyst is no longer at Deutsche Bank
1. 29/04/2015: Buy, Target Price Change HKD18.83 4. 04/03/2016: Upgrade to Buy, Target Price Change HKD10.14
2. 01/07/2015: Buy, Target Price Change HKD15.39 5. 28/04/2016: Buy, Target Price Change HKD11.15
3. 12/11/2015: Downgrade to Hold, Target Price Change HKD11.45 6. 14/07/2016: Buy, Target Price Change HKD11.84
Historical recommendations and target price: China Railway Group (0390.HK) (as of 3/2/2017)
1
2
3
4
56
0.00
2.00
4.00
6.00
8.00
10.00
12.00
14.00
Mar 15 Jun 15 Sep 15 Dec 15 Mar 16 Jun 16 Sep 16 Dec 16
Secu
rity
Pri
ce
Date
Previous Recommendations
Strong Buy Buy Market Perform Underperform Not Rated Suspended Rating
Current Recommendations
Buy Hold Sell Not Rated Suspended Rating
*New Recommendation Structure as of September 9,2002
**Analyst is no longer at Deutsche Bank
1. 29/04/2015: Hold, Target Price Change HKD10.49 4. 04/03/2016: Upgrade to Buy, Target Price Change HKD6.46
2. 01/07/2015: Hold, Target Price Change HKD8.77 5. 28/04/2016: Downgrade to Hold, Target Price Change HKD6.73
3. 12/11/2015: Hold, Target Price Change HKD6.80 6. 14/07/2016: Upgrade to Buy, Target Price Change HKD6.93

3 March 2017
Infrastructure
China Infrastructure
Page 22 Deutsche Bank AG/Hong Kong
Equity rating key Equity rating dispersion and banking relationships
Buy: Based on a current 12- month view of total share-holder return (TSR = percentage change in share price from current price to projected target price plus pro-jected dividend yield ) , we recommend that investors buy the stock.
Sell: Based on a current 12-month view of total share-holder return, we recommend that investors sell the stock
Hold: We take a neutral view on the stock 12-months out and, based on this time horizon, do not recommend either a Buy or Sell.
Newly issued research recommendations and target prices supersede previously published research.
54 %
36 %
10 %18 % 18 % 18 %
050
100150200250300350400450500
Buy Hold Sell
Asia-Pacific Universe
Companies Covered Cos. w/ Banking Relationship
3 March 2017
Infrastructure
China Infrastructure
Deutsche Bank AG/Hong Kong Page 23
Additional Information
The information and opinions in this report were prepared by Deutsche Bank AG or one of its affiliates (collectively
"Deutsche Bank"). Though the information herein is believed to be reliable and has been obtained from public sources
believed to be reliable, Deutsche Bank makes no representation as to its accuracy or completeness.
If you use the services of Deutsche Bank in connection with a purchase or sale of a security that is discussed in this
report, or is included or discussed in another communication (oral or written) from a Deutsche Bank analyst, Deutsche
Bank may act as principal for its own account or as agent for another person.
Deutsche Bank may consider this report in deciding to trade as principal. It may also engage in transactions, for its own
account or with customers, in a manner inconsistent with the views taken in this research report. Others within
Deutsche Bank, including strategists, sales staff and other analysts, may take views that are inconsistent with those
taken in this research report. Deutsche Bank issues a variety of research products, including fundamental analysis,
equity-linked analysis, quantitative analysis and trade ideas. Recommendations contained in one type of communication
may differ from recommendations contained in others, whether as a result of differing time horizons, methodologies or
otherwise. Deutsche Bank and/or its affiliates may also be holding debt or equity securities of the issuers it writes on.
Analysts are paid in part based on the profitability of Deutsche Bank AG and its affiliates, which includes investment
banking, trading and principal trading revenues.
Opinions, estimates and projections constitute the current judgment of the author as of the date of this report. They do
not necessarily reflect the opinions of Deutsche Bank and are subject to change without notice. Deutsche Bank provides
liquidity for buyers and sellers of securities issued by the companies it covers. Deutsche Bank research analysts
sometimes have shorter-term trade ideas that are consistent or inconsistent with Deutsche Bank's existing longer term
ratings. Trade ideas for equities can be found at the SOLAR link at http://gm.db.com. A SOLAR idea represents a high
conviction belief by an analyst that a stock will outperform or underperform the market and/or sector delineated over a
time frame of no less than two weeks. In addition to SOLAR ideas, the analysts named in this report may from time to
time discuss with our clients, Deutsche Bank salespersons and Deutsche Bank traders, trading strategies or ideas that
reference catalysts or events that may have a near-term or medium-term impact on the market price of the securities
discussed in this report, which impact may be directionally counter to the analysts' current 12-month view of total return
or investment return as described herein. Deutsche Bank has no obligation to update, modify or amend this report or to
otherwise notify a recipient thereof if any opinion, forecast or estimate contained herein changes or subsequently
becomes inaccurate. Coverage and the frequency of changes in market conditions and in both general and company
specific economic prospects make it difficult to update research at defined intervals. Updates are at the sole discretion
of the coverage analyst concerned or of the Research Department Management and as such the majority of reports are
published at irregular intervals. This report is provided for informational purposes only and does not take into account
the particular investment objectives, financial situations, or needs of individual clients. It is not an offer or a solicitation
of an offer to buy or sell any financial instruments or to participate in any particular trading strategy. Target prices are
inherently imprecise and a product of the analyst’s judgment. The financial instruments discussed in this report may not
be suitable for all investors and investors must make their own informed investment decisions. Prices and availability of
financial instruments are subject to change without notice and investment transactions can lead to losses as a result of
price fluctuations and other factors. If a financial instrument is denominated in a currency other than an investor's
currency, a change in exchange rates may adversely affect the investment. Past performance is not necessarily
indicative of future results. Unless otherwise indicated, prices are current as of the end of the previous trading session,
and are sourced from local exchanges via Reuters, Bloomberg and other vendors. Data is sourced from Deutsche Bank,
subject companies, and in some cases, other parties.
The Deutsche Bank Research Department is independent of other business areas divisions of the Bank. Details regarding
our organizational arrangements and information barriers we have to prevent and avoid conflicts of interest with respect
to our research is available on our website under Disclaimer found on the Legal tab.
Macroeconomic fluctuations often account for most of the risks associated with exposures to instruments that promise
to pay fixed or variable interest rates. For an investor who is long fixed rate instruments (thus receiving these cash
3 March 2017
Infrastructure
China Infrastructure
Page 24 Deutsche Bank AG/Hong Kong
flows), increases in interest rates naturally lift the discount factors applied to the expected cash flows and thus cause a
loss. The longer the maturity of a certain cash flow and the higher the move in the discount factor, the higher will be the
loss. Upside surprises in inflation, fiscal funding needs, and FX depreciation rates are among the most common adverse
macroeconomic shocks to receivers. But counterparty exposure, issuer creditworthiness, client segmentation, regulation
(including changes in assets holding limits for different types of investors), changes in tax policies, currency
convertibility (which may constrain currency conversion, repatriation of profits and/or the liquidation of positions), and
settlement issues related to local clearing houses are also important risk factors to be considered. The sensitivity of fixed
income instruments to macroeconomic shocks may be mitigated by indexing the contracted cash flows to inflation, to
FX depreciation, or to specified interest rates – these are common in emerging markets. It is important to note that the
index fixings may -- by construction -- lag or mis-measure the actual move in the underlying variables they are intended
to track. The choice of the proper fixing (or metric) is particularly important in swaps markets, where floating coupon
rates (i.e., coupons indexed to a typically short-dated interest rate reference index) are exchanged for fixed coupons. It is
also important to acknowledge that funding in a currency that differs from the currency in which coupons are
denominated carries FX risk. Naturally, options on swaps (swaptions) also bear the risks typical to options in addition to
the risks related to rates movements.
Derivative transactions involve numerous risks including, among others, market, counterparty default and illiquidity risk.
The appropriateness or otherwise of these products for use by investors is dependent on the investors' own
circumstances including their tax position, their regulatory environment and the nature of their other assets and
liabilities, and as such, investors should take expert legal and financial advice before entering into any transaction similar
to or inspired by the contents of this publication. The risk of loss in futures trading and options, foreign or domestic, can
be substantial. As a result of the high degree of leverage obtainable in futures and options trading, losses may be
incurred that are greater than the amount of funds initially deposited. Trading in options involves risk and is not suitable
for all investors. Prior to buying or selling an option investors must review the "Characteristics and Risks of Standardized
Options”, at http://www.optionsclearing.com/about/publications/character-risks.jsp. If you are unable to access the
website please contact your Deutsche Bank representative for a copy of this important document.
Participants in foreign exchange transactions may incur risks arising from several factors, including the following: ( i)
exchange rates can be volatile and are subject to large fluctuations; ( ii) the value of currencies may be affected by
numerous market factors, including world and national economic, political and regulatory events, events in equity and
debt markets and changes in interest rates; and (iii) currencies may be subject to devaluation or government imposed
exchange controls which could affect the value of the currency. Investors in securities such as ADRs, whose values are
affected by the currency of an underlying security, effectively assume currency risk.
Unless governing law provides otherwise, all transactions should be executed through the Deutsche Bank entity in the
investor's home jurisdiction. Aside from within this report, important conflict disclosures can also be found at
https://gm.db.com/equities under the "Disclosures Lookup" and "Legal" tabs. Investors are strongly encouraged to
review this information before investing.
United States: Approved and/or distributed by Deutsche Bank Securities Incorporated, a member of FINRA, NFA and
SIPC. Analysts located outside of the United States are employed by non-US affiliates that are not subject to FINRA
regulations.
Germany: Approved and/or distributed by Deutsche Bank AG, a joint stock corporation with limited liability incorporated
in the Federal Republic of Germany with its principal office in Frankfurt am Main. Deutsche Bank AG is authorized under
German Banking Law and is subject to supervision by the European Central Bank and by BaFin, Germany’s Federal
Financial Supervisory Authority.
United Kingdom: Approved and/or distributed by Deutsche Bank AG acting through its London Branch at Winchester
House, 1 Great Winchester Street, London EC2N 2DB. Deutsche Bank AG in the United Kingdom is authorised by the
Prudential Regulation Authority and is subject to limited regulation by the Prudential Regulation Authority and Financial
Conduct Authority. Details about the extent of our authorisation and regulation are available on request.
Hong Kong: Distributed by Deutsche Bank AG, Hong Kong Branch.

3 March 2017
Infrastructure
China Infrastructure
Deutsche Bank AG/Hong Kong Page 25
India: Prepared by Deutsche Equities India Pvt Ltd, which is registered by the Securities and Exchange Board of India
(SEBI) as a stock broker. Research Analyst SEBI Registration Number is INH000001741. DEIPL may have received
administrative warnings from the SEBI for breaches of Indian regulations.
Japan: Approved and/or distributed by Deutsche Securities Inc.(DSI). Registration number - Registered as a financial
instruments dealer by the Head of the Kanto Local Finance Bureau (Kinsho) No. 117. Member of associations: JSDA,
Type II Financial Instruments Firms Association and The Financial Futures Association of Japan. Commissions and risks
involved in stock transactions - for stock transactions, we charge stock commissions and consumption tax by
multiplying the transaction amount by the commission rate agreed with each customer. Stock transactions can lead to
losses as a result of share price fluctuations and other factors. Transactions in foreign stocks can lead to additional
losses stemming from foreign exchange fluctuations. We may also charge commissions and fees for certain categories
of investment advice, products and services. Recommended investment strategies, products and services carry the risk
of losses to principal and other losses as a result of changes in market and/or economic trends, and/or fluctuations in
market value. Before deciding on the purchase of financial products and/or services, customers should carefully read the
relevant disclosures, prospectuses and other documentation. "Moody's", "Standard & Poor's", and "Fitch" mentioned in
this report are not registered credit rating agencies in Japan unless Japan or "Nippon" is specifically designated in the
name of the entity. Reports on Japanese listed companies not written by analysts of DSI are written by Deutsche Bank
Group's analysts with the coverage companies specified by DSI. Some of the foreign securities stated on this report are
not disclosed according to the Financial Instruments and Exchange Law of Japan. Target prices set by Deutsche Bank's
equity analysts are based on a 12-month forecast period.
Korea: Distributed by Deutsche Securities Korea Co.
South Africa: Deutsche Bank AG Johannesburg is incorporated in the Federal Republic of Germany (Branch Register
Number in South Africa: 1998/003298/10).
Singapore: by Deutsche Bank AG, Singapore Branch or Deutsche Securities Asia Limited, Singapore Branch (One Raffles
Quay #18-00 South Tower Singapore 048583, +65 6423 8001), which may be contacted in respect of any matters
arising from, or in connection with, this report. Where this report is issued or promulgated in Singapore to a person who
is not an accredited investor, expert investor or institutional investor (as defined in the applicable Singapore laws and
regulations), they accept legal responsibility to such person for its contents.
Taiwan: Information on securities/investments that trade in Taiwan is for your reference only. Readers should
independently evaluate investment risks and are solely responsible for their investment decisions. Deutsche Bank
research may not be distributed to the Taiwan public media or quoted or used by the Taiwan public media without
written consent. Information on securities/instruments that do not trade in Taiwan is for informational purposes only and
is not to be construed as a recommendation to trade in such securities/instruments. Deutsche Securities Asia Limited,
Taipei Branch may not execute transactions for clients in these securities/instruments.
Qatar: Deutsche Bank AG in the Qatar Financial Centre (registered no. 00032) is regulated by the Qatar Financial Centre
Regulatory Authority. Deutsche Bank AG - QFC Branch may only undertake the financial services activities that fall
within the scope of its existing QFCRA license. Principal place of business in the QFC: Qatar Financial Centre, Tower,
West Bay, Level 5, PO Box 14928, Doha, Qatar. This information has been distributed by Deutsche Bank AG. Related
financial products or services are only available to Business Customers, as defined by the Qatar Financial Centre
Regulatory Authority.
Russia: This information, interpretation and opinions submitted herein are not in the context of, and do not constitute,
any appraisal or evaluation activity requiring a license in the Russian Federation.
Kingdom of Saudi Arabia: Deutsche Securities Saudi Arabia LLC Company, (registered no. 07073-37) is regulated by the
Capital Market Authority. Deutsche Securities Saudi Arabia may only undertake the financial services activities that fall
within the scope of its existing CMA license. Principal place of business in Saudi Arabia: King Fahad Road, Al Olaya
District, P.O. Box 301809, Faisaliah Tower - 17th Floor, 11372 Riyadh, Saudi Arabia.
United Arab Emirates: Deutsche Bank AG in the Dubai International Financial Centre (registered no. 00045) is regulated

3 March 2017
Infrastructure
China Infrastructure
Page 26 Deutsche Bank AG/Hong Kong
by the Dubai Financial Services Authority. Deutsche Bank AG - DIFC Branch may only undertake the financial services
activities that fall within the scope of its existing DFSA license. Principal place of business in the DIFC: Dubai
International Financial Centre, The Gate Village, Building 5, PO Box 504902, Dubai, U.A.E. This information has been
distributed by Deutsche Bank AG. Related financial products or services are only available to Professional Clients, as
defined by the Dubai Financial Services Authority.
Australia: Retail clients should obtain a copy of a Product Disclosure Statement (PDS) relating to any financial product
referred to in this report and consider the PDS before making any decision about whether to acquire the product. Please
refer to Australian specific research disclosures and related information at
https://australia.db.com/australia/content/research-information.html
Australia and New Zealand: This research is intended only for "wholesale clients" within the meaning of the Australian
Corporations Act and New Zealand Financial Advisors Act respectively.
Additional information relative to securities, other financial products or issuers discussed in this report is available upon
request. This report may not be reproduced, distributed or published without Deutsche Bank's prior written consent.
Copyright © 2017 Deutsche Bank AG

David Folkerts-Landau Group Chief Economist and Global Head of Research
Raj Hindocha Global Chief Operating Officer
Research
Michael Spencer Head of APAC Research
Global Head of Economics
Steve Pollard Head of Americas Research
Global Head of Equity Research
Anthony Klarman Global Head of Debt Research
Paul Reynolds Head of EMEA
Equity Research
Dave Clark Head of APAC
Equity Research
Pam Finelli Global Head of
Equity Derivatives Research
Andreas Neubauer Head of Research - Germany
Stuart Kirk Head of Thematic Research
International locations
Deutsche Bank AG
Deutsche Bank Place
Level 16
Corner of Hunter & Phillip Streets
Sydney, NSW 2000
Australia
Tel: (61) 2 8258 1234
Deutsche Bank AG
Große Gallusstraße 10-14
60272 Frankfurt am Main
Germany
Tel: (49) 69 910 00
Deutsche Bank AG
Filiale Hongkong
International Commerce Centre,
1 Austin Road West,Kowloon,
Hong Kong
Tel: (852) 2203 8888
Deutsche Securities Inc.
2-11-1 Nagatacho
Sanno Park Tower
Chiyoda-ku, Tokyo 100-6171
Japan
Tel: (81) 3 5156 6770
Deutsche Bank AG London
1 Great Winchester Street
London EC2N 2EQ
United Kingdom
Tel: (44) 20 7545 8000
Deutsche Bank Securities Inc.
60 Wall Street
New York, NY 10005
United States of America
Tel: (1) 212 250 2500