Embed Size (px)
Citation preview

Page | 1 | PHILLIP SECURITIES RESEARCH (SINGAPORE) MCI (P) 118/10/2015 Ref. No.: SG2016_0064
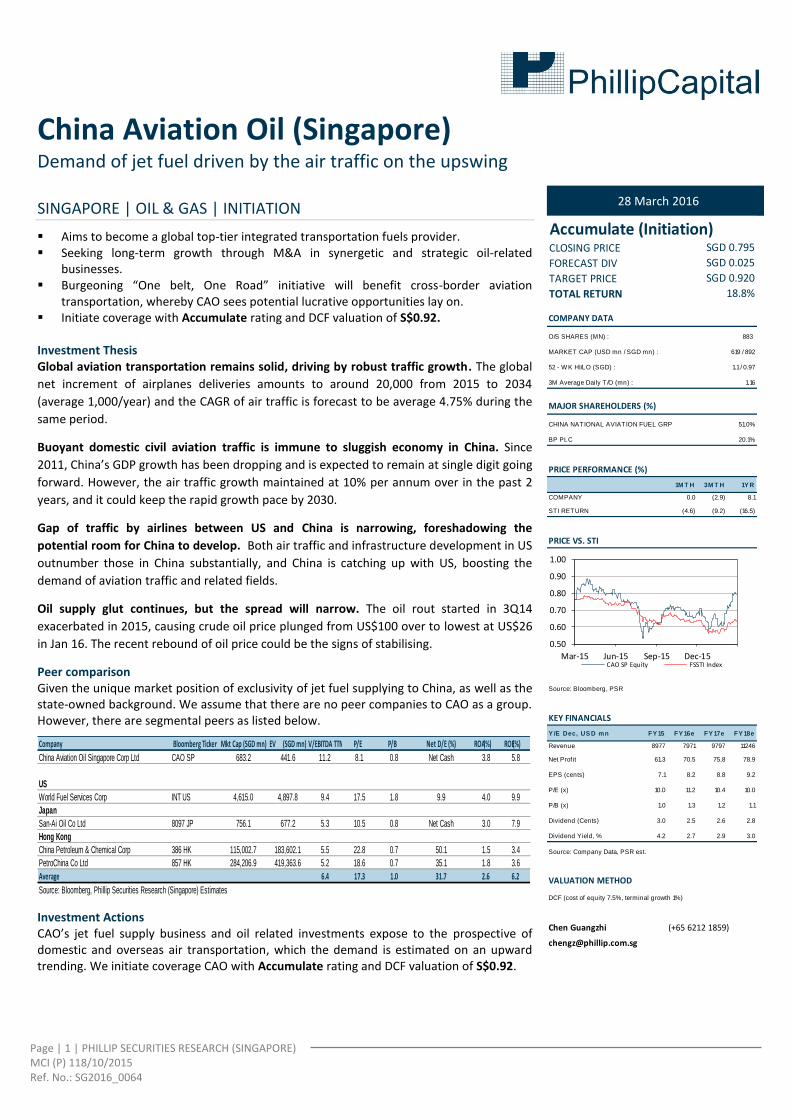
China Aviation Oil (Singapore) Demand of jet fuel driven by the air traffic on the upswing SINGAPORE | OIL & GAS | INITIATION
Aims to become a global top-tier integrated transportation fuels provider. Seeking long-term growth through M&A in synergetic and strategic oil-related
businesses. Burgeoning “One belt, One Road” initiative will benefit cross-border aviation
transportation, whereby CAO sees potential lucrative opportunities lay on. Initiate coverage with Accumulate rating and DCF valuation of S$0.92. Investment Thesis Global aviation transportation remains solid, driving by robust traffic growth. The global
net increment of airplanes deliveries amounts to around 20,000 from 2015 to 2034
(average 1,000/year) and the CAGR of air traffic is forecast to be average 4.75% during the
same period.
Buoyant domestic civil aviation traffic is immune to sluggish economy in China. Since
2011, China’s GDP growth has been dropping and is expected to remain at single digit going
forward. However, the air traffic growth maintained at 10% per annum over in the past 2
years, and it could keep the rapid growth pace by 2030.
Gap of traffic by airlines between US and China is narrowing, foreshadowing the
potential room for China to develop. Both air traffic and infrastructure development in US
outnumber those in China substantially, and China is catching up with US, boosting the
demand of aviation traffic and related fields.
Oil supply glut continues, but the spread will narrow. The oil rout started in 3Q14
exacerbated in 2015, causing crude oil price plunged from US$100 over to lowest at US$26
in Jan 16. The recent rebound of oil price could be the signs of stabilising.
Peer comparison Given the unique market position of exclusivity of jet fuel supplying to China, as well as the state-owned background. We assume that there are no peer companies to CAO as a group. However, there are segmental peers as listed below.
Company Bloomberg Ticker Mkt Cap (SGD mn) EV (SGD mn)EV/EBITDA TTM P/E P/B Net D/E (%) ROA (%) ROE (%)
China Aviation Oil Singapore Corp Ltd CAO SP 683.2 441.6 11.2 8.1 0.8 Net Cash 3.8 5.8
US
World Fuel Services Corp INT US 4,615.0 4,897.8 9.4 17.5 1.8 9.9 4.0 9.9
Japan
San-Ai Oil Co Ltd 8097 JP 756.1 677.2 5.3 10.5 0.8 Net Cash 3.0 7.9
Hong Kong
China Petroleum & Chemical Corp 386 HK 115,002.7 183,602.1 5.5 22.8 0.7 50.1 1.5 3.4
PetroChina Co Ltd 857 HK 284,206.9 419,363.6 5.2 18.6 0.7 35.1 1.8 3.6
Average 6.4 17.3 1.0 31.7 2.6 6.2
Source: Bloomberg, Phillip Securities Research (Singapore) Estimates
Investment Actions CAO’s jet fuel supply business and oil related investments expose to the prospective of domestic and overseas air transportation, which the demand is estimated on an upward trending. We initiate coverage CAO with Accumulate rating and DCF valuation of S$0.92.
28 March 2016
Accumulate (Initiation)CLOSING PRICE
FORECAST DIV
TARGET PRICE
TOTAL RETURN
COMPANY DATA
O/S SHARES (MN) : 883
MARKET CAP (USD mn / SGD mn) : 619 / 892
52 - W K HI/LO (SGD) : 1.1 / 0.97
3M Average Daily T /O (mn) : 1.16
MAJOR SHAREHOLDERS (%)
51.0%
BP PLC 20.1%
PRICE PERFORMANCE (%)
1M T H 3M T H 1Y R
COMPANY 0.0 (2.9) 8.1
STI RETURN (4.6) (9.2) (16.5)
PRICE VS. STI
Source: Bloomberg, PSR
KEY FINANCIALS
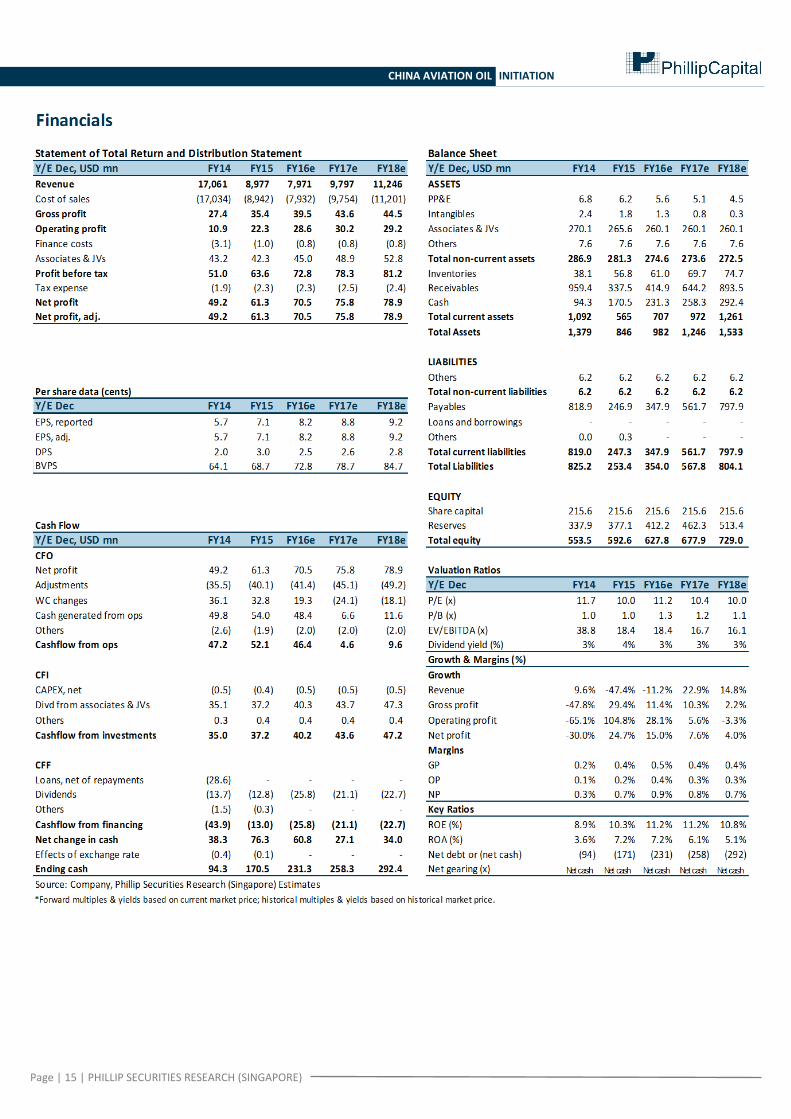
Y /E Dec, US D mn FY 15 FY 16e FY 17e FY 18e
Revenue 8977 7971 9797 11246
Net Profit 61.3 70.5 75.8 78.9
EPS (cents) 7.1 8.2 8.8 9.2
P/E (x) 10.0 11.2 10.4 10.0
P/B (x) 1.0 1.3 1.2 1.1
Dividend (Cents) 3.0 2.5 2.6 2.8
Dividend Yield, % 4.2 2.7 2.9 3.0
Source: Company Data, PSR est.
VALUATION METHOD
DCF (cost of equity 7.5%, terminal growth 1%)
Chen Guangzhi (+65 6212 1859)
SGD 0.920
18.8%
CHINA NATIONAL AVIATION FUEL GRP
SGD 0.795
SGD 0.025
0.50
0.60
0.70
0.80
0.90
1.00
Mar-15 Jun-15 Sep-15 Dec-15CAO SP Equity FSSTI Index
Page | 2 | PHILLIP SECURITIES RESEARCH (SINGAPORE)
CHINA AVIATION OIL INITIATION
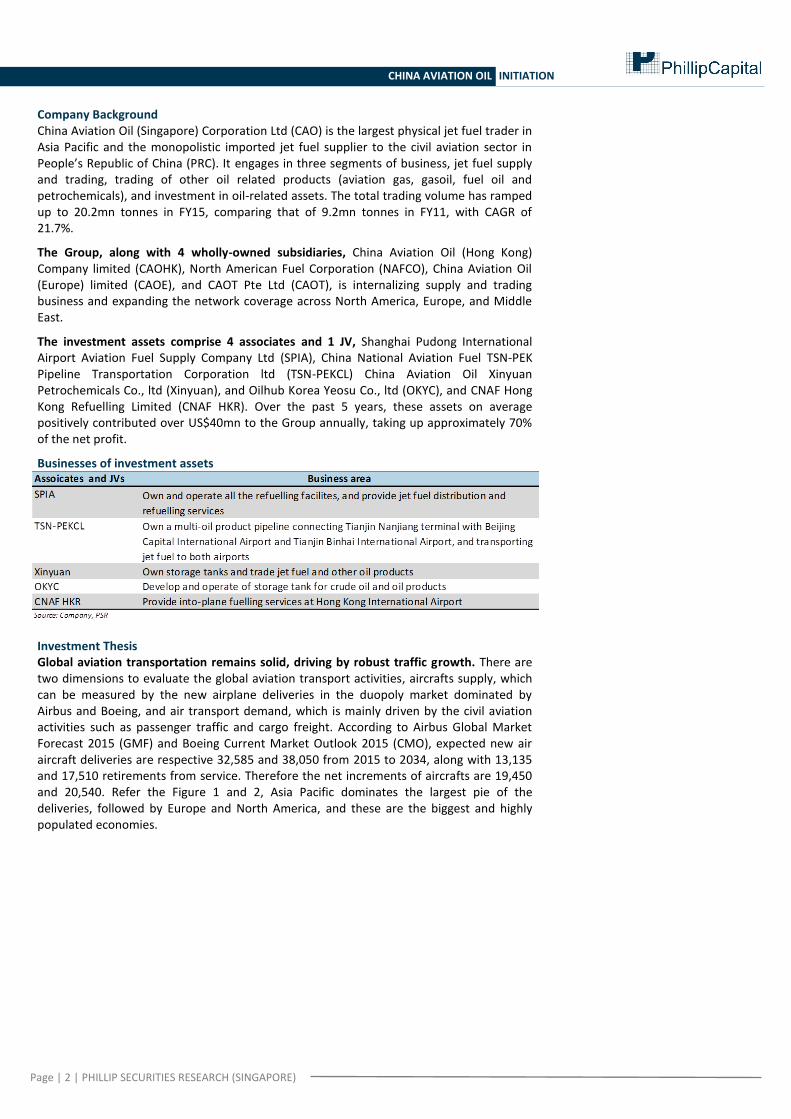
Company Background China Aviation Oil (Singapore) Corporation Ltd (CAO) is the largest physical jet fuel trader in Asia Pacific and the monopolistic imported jet fuel supplier to the civil aviation sector in People’s Republic of China (PRC). It engages in three segments of business, jet fuel supply and trading, trading of other oil related products (aviation gas, gasoil, fuel oil and petrochemicals), and investment in oil-related assets. The total trading volume has ramped up to 20.2mn tonnes in FY15, comparing that of 9.2mn tonnes in FY11, with CAGR of 21.7%.
The Group, along with 4 wholly-owned subsidiaries, China Aviation Oil (Hong Kong) Company limited (CAOHK), North American Fuel Corporation (NAFCO), China Aviation Oil (Europe) limited (CAOE), and CAOT Pte Ltd (CAOT), is internalizing supply and trading business and expanding the network coverage across North America, Europe, and Middle East.
The investment assets comprise 4 associates and 1 JV, Shanghai Pudong International Airport Aviation Fuel Supply Company Ltd (SPIA), China National Aviation Fuel TSN-PEK Pipeline Transportation Corporation ltd (TSN-PEKCL) China Aviation Oil Xinyuan Petrochemicals Co., ltd (Xinyuan), and Oilhub Korea Yeosu Co., ltd (OKYC), and CNAF Hong Kong Refuelling Limited (CNAF HKR). Over the past 5 years, these assets on average positively contributed over US$40mn to the Group annually, taking up approximately 70% of the net profit.
Businesses of investment assets
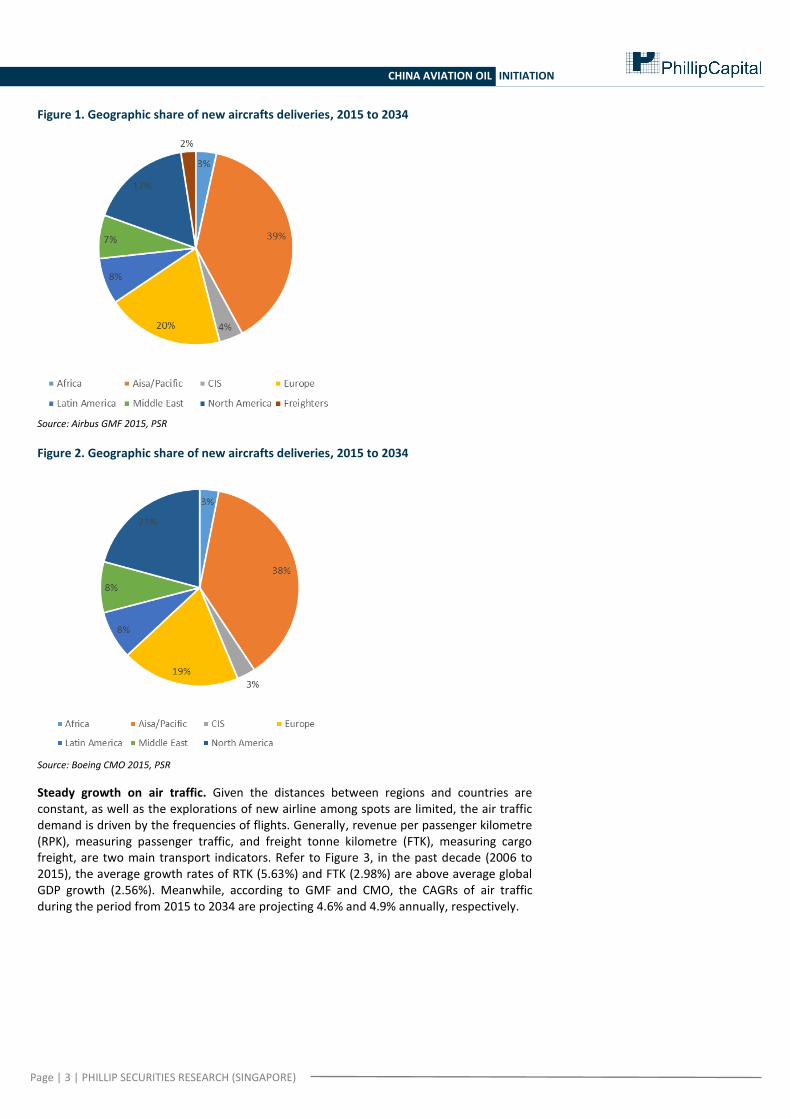
Investment Thesis Global aviation transportation remains solid, driving by robust traffic growth. There are two dimensions to evaluate the global aviation transport activities, aircrafts supply, which can be measured by the new airplane deliveries in the duopoly market dominated by Airbus and Boeing, and air transport demand, which is mainly driven by the civil aviation activities such as passenger traffic and cargo freight. According to Airbus Global Market Forecast 2015 (GMF) and Boeing Current Market Outlook 2015 (CMO), expected new air aircraft deliveries are respective 32,585 and 38,050 from 2015 to 2034, along with 13,135 and 17,510 retirements from service. Therefore the net increments of aircrafts are 19,450 and 20,540. Refer the Figure 1 and 2, Asia Pacific dominates the largest pie of the deliveries, followed by Europe and North America, and these are the biggest and highly populated economies.
Page | 3 | PHILLIP SECURITIES RESEARCH (SINGAPORE)
CHINA AVIATION OIL INITIATION
Figure 1. Geographic share of new aircrafts deliveries, 2015 to 2034
Source: Airbus GMF 2015, PSR
Figure 2. Geographic share of new aircrafts deliveries, 2015 to 2034
Source: Boeing CMO 2015, PSR
Steady growth on air traffic. Given the distances between regions and countries are constant, as well as the explorations of new airline among spots are limited, the air traffic demand is driven by the frequencies of flights. Generally, revenue per passenger kilometre (RPK), measuring passenger traffic, and freight tonne kilometre (FTK), measuring cargo freight, are two main transport indicators. Refer to Figure 3, in the past decade (2006 to 2015), the average growth rates of RTK (5.63%) and FTK (2.98%) are above average global GDP growth (2.56%). Meanwhile, according to GMF and CMO, the CAGRs of air traffic during the period from 2015 to 2034 are projecting 4.6% and 4.9% annually, respectively.

Page | 4 | PHILLIP SECURITIES RESEARCH (SINGAPORE)
CHINA AVIATION OIL INITIATION
Figure 3. Global RPK, FTK, and GDP growth
Source: ICAO, World Bank, PSR
Figure 4. World annual traffic
Source: Airbus GMF 2015, PSR
Figure 5. Traffic growth (%), 2015 to 2034
Source: Boeing CMO 2015, PSR Aviation transport market is far from saturation. Air traffic is seeing blooming perspective due to the fact that air travel is the most efficient way to complete journeys. Notwithstanding the expenditure per capita is still more costly than other transportation tools such as railways, vehicles, and vessels, the improving energy consumption efficiency, affordability to flight tickets, and convenience will lead to air travel more attractive.

Page | 5 | PHILLIP SECURITIES RESEARCH (SINGAPORE)
CHINA AVIATION OIL INITIATION
Sluggish economy in China. Since 2014, China has entered the era of moderate growth of GDP. The driving powers from export and domestic investment are weathering, resulting in economic restructuring and transformation initiated by the new governors. Moreover, the unfavourable external economic conditions such as low price level of commodities, currency devaluation in peripheral emerging countries, and low growth of world economy, challenge the business environment in China. Therefore, various sectors are undergoing tough period.
Civil aviation traffic is seemed immune. However, the civil aviation is one of the very few sectors stand out and enjoy substantial counter-cycle growth. Refer to Figure 6, in the past decade, RPK maintained at double digits annual growth, ranging from 11% to 20%, except the cliff jump to 3% during global financial crisis in 2008, whilst the FTK growth fluctuated significantly but stabilized at 10% in 2014 and 2015. Over the next two decades, China’s domestic market is assumed to be the largest domestic air travel market worldwide. The 20-year forecast annual growth rates of RPK and FTK are 6.6% and 7%, respectively in China.
Figure 6. China RPK, FTK, and GDP growth
Source: Civil Aviation Administration of China (CAAC), National Bureau of Statistics of China, PSR
Figure 7. World traffic varies by market
Source: Boeing CMO 2015, PSR
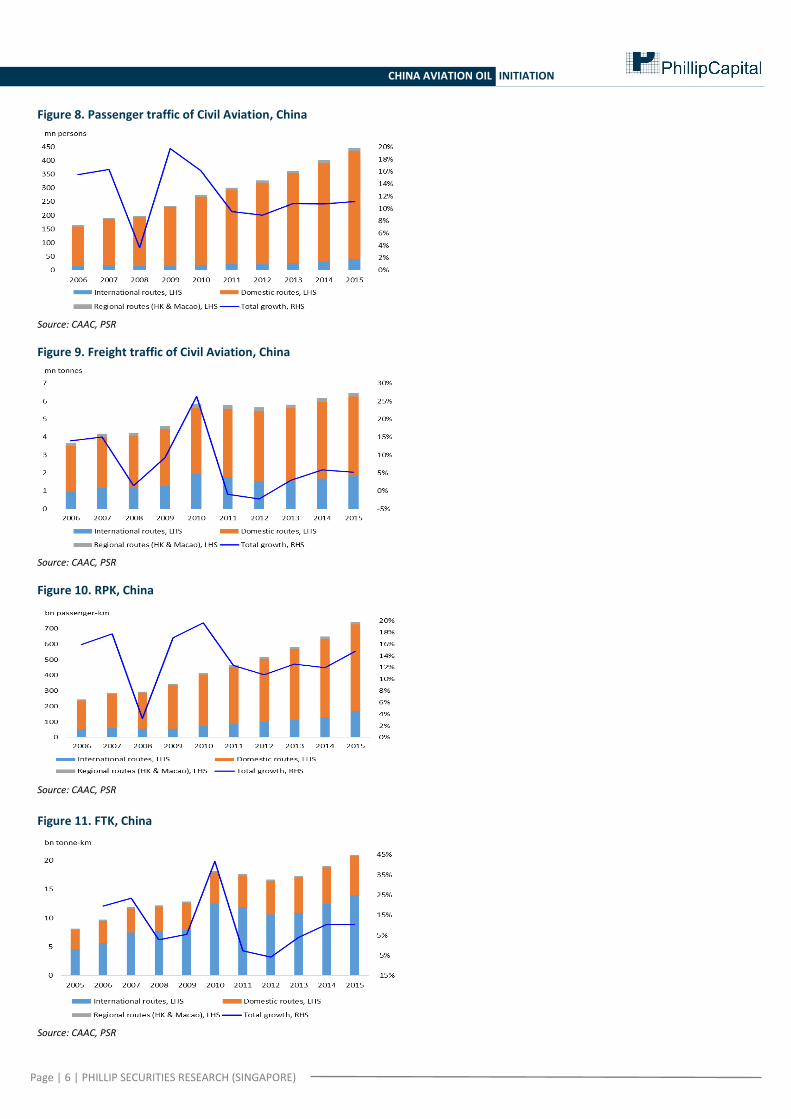
Refer to Figure 8 to 11, the further breakdown of RPK and FTK in China shows that RPK, whose main driver comes from domestic routes traffic, remains upward trend, whilst FTK, dominated by International routes traffic, was ascending since 2012 and peaked in 2015.
Page | 6 | PHILLIP SECURITIES RESEARCH (SINGAPORE)
CHINA AVIATION OIL INITIATION
Figure 8. Passenger traffic of Civil Aviation, China
Source: CAAC, PSR
Figure 9. Freight traffic of Civil Aviation, China
Source: CAAC, PSR
Figure 10. RPK, China
Source: CAAC, PSR
Figure 11. FTK, China
Source: CAAC, PSR

Page | 7 | PHILLIP SECURITIES RESEARCH (SINGAPORE)
CHINA AVIATION OIL INITIATION
Air traffic gap between US and China is narrowing, foreshadowing the potential room for China to develop. The management from CAO suggested that US aviation market is the benchmark of China aviation development going forward. Nowadays, US’s aviation industry is the biggest globally in terms of traffic flows, not only because US is the most open market worldwide, but also it has the most well-established infrastructure nationwide. According to Bureau of Transportation Statistics (BTS), as of 2014, total number of aircraft carrying passengers or cargo in US is approximately 7,000. By contrast, according to CAAC, the number is much less, recorded only 4,168 in China. Thus, there will be a long way for China to improve the facilities quantitatively. China, surpassing US in population and country area, has been increasingly opening the market towards the world, so it is reasonable to foresee the traffic gap between the two giants is narrowing down. Refer to Figure 12 to 13; there is more room for China to grow in both passenger and cargo freight amounts.
Figure 12. RPK, China & US
Source: CAAC, BTS, PSR
Figure 13. FTK, China & US
Source: CAAC, BTS, PSR
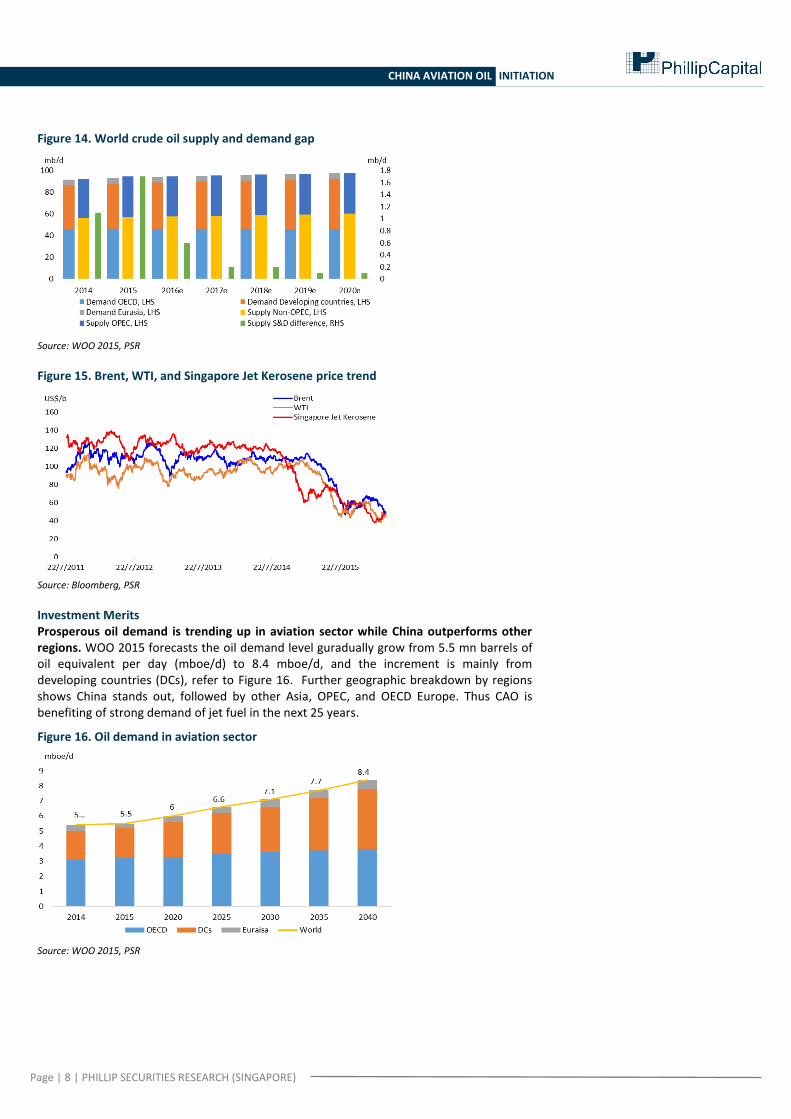
Oil supply glut continues, but the spread will narrow. According to OPEC World Oil Outlook 2015 (WOO), the trigger of the rout in oil market in the second half of 2014 till now was due to the excessive supply of crude oil. The mid-term forecast showed the supply glut peaked in 2015 and wiould gradually diminish afterwards, but still it wouldn’t be balanced by 2020. Therefore, the price of middle distillates and other oil products remains low accordingly. The EIA Short-term Energy Outlook (STEO) in March 2016 showed the Brent crude oil prices were forecast to be average US$34/bbl and US$40/bbl in 2016 and 2017, while the Forecast West Texas Intermediate (WTI) crude oil prices were expected to average the same as Brent in 2016 and 2017, amounted to US$35/bbl. Refer to Figure 15, both the Brent and WTI crude oil price slumped from US$100/bbl over in Sep 2014 to bottom at below US$30/bbl in Jan 2016, and recently the prices started to recover. Correspondingly, the Bloomberg Singapore Jet Kerosene Price rebounded from below US$40/bbl in in Jan 2016 to above US$48/bbl recently.
Page | 8 | PHILLIP SECURITIES RESEARCH (SINGAPORE)
CHINA AVIATION OIL INITIATION
Figure 14. World crude oil supply and demand gap
Source: WOO 2015, PSR
Figure 15. Brent, WTI, and Singapore Jet Kerosene price trend
Source: Bloomberg, PSR
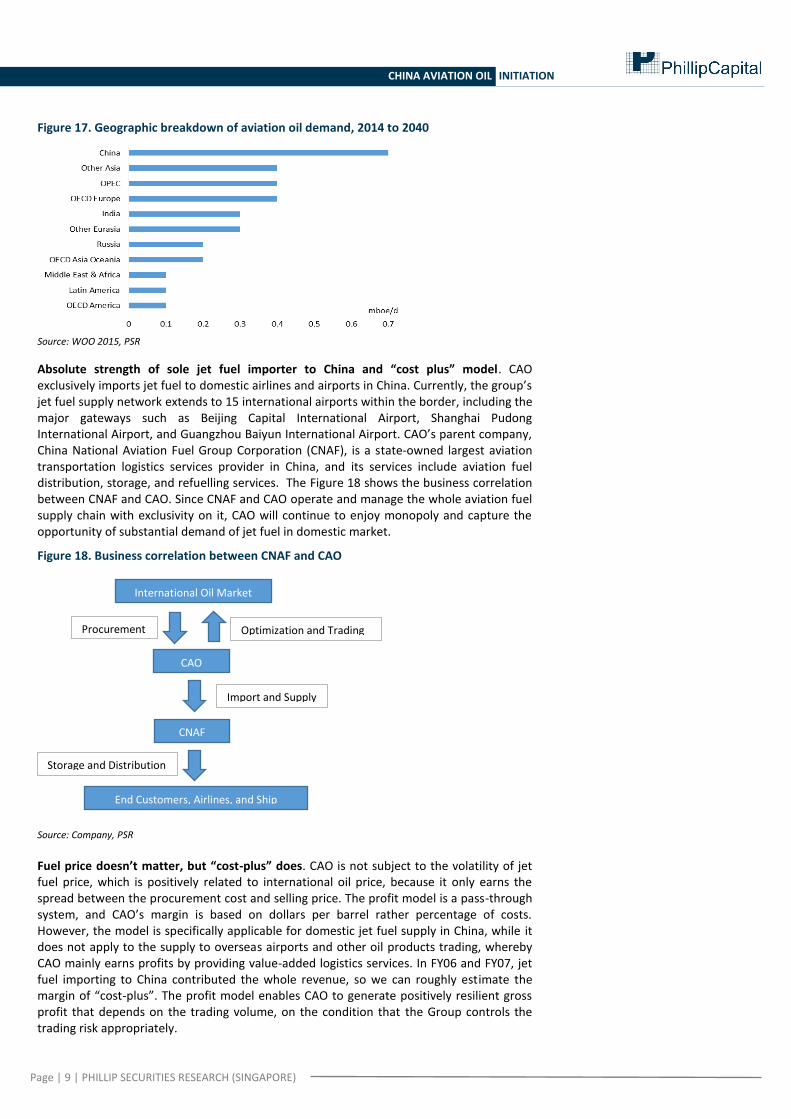
Investment Merits Prosperous oil demand is trending up in aviation sector while China outperforms other regions. WOO 2015 forecasts the oil demand level guradually grow from 5.5 mn barrels of oil equivalent per day (mboe/d) to 8.4 mboe/d, and the increment is mainly from developing countries (DCs), refer to Figure 16. Further geographic breakdown by regions shows China stands out, followed by other Asia, OPEC, and OECD Europe. Thus CAO is benefiting of strong demand of jet fuel in the next 25 years.
Figure 16. Oil demand in aviation sector
Source: WOO 2015, PSR
Page | 9 | PHILLIP SECURITIES RESEARCH (SINGAPORE)
CHINA AVIATION OIL INITIATION
Figure 17. Geographic breakdown of aviation oil demand, 2014 to 2040
Source: WOO 2015, PSR
Absolute strength of sole jet fuel importer to China and “cost plus” model. CAO exclusively imports jet fuel to domestic airlines and airports in China. Currently, the group’s jet fuel supply network extends to 15 international airports within the border, including the major gateways such as Beijing Capital International Airport, Shanghai Pudong International Airport, and Guangzhou Baiyun International Airport. CAO’s parent company, China National Aviation Fuel Group Corporation (CNAF), is a state-owned largest aviation transportation logistics services provider in China, and its services include aviation fuel distribution, storage, and refuelling services. The Figure 18 shows the business correlation between CNAF and CAO. Since CNAF and CAO operate and manage the whole aviation fuel supply chain with exclusivity on it, CAO will continue to enjoy monopoly and capture the opportunity of substantial demand of jet fuel in domestic market.
Figure 18. Business correlation between CNAF and CAO
Source: Company, PSR Fuel price doesn’t matter, but “cost-plus” does. CAO is not subject to the volatility of jet fuel price, which is positively related to international oil price, because it only earns the spread between the procurement cost and selling price. The profit model is a pass-through system, and CAO’s margin is based on dollars per barrel rather percentage of costs. However, the model is specifically applicable for domestic jet fuel supply in China, while it does not apply to the supply to overseas airports and other oil products trading, whereby CAO mainly earns profits by providing value-added logistics services. In FY06 and FY07, jet fuel importing to China contributed the whole revenue, so we can roughly estimate the margin of “cost-plus”. The profit model enables CAO to generate positively resilient gross profit that depends on the trading volume, on the condition that the Group controls the trading risk appropriately.
International Oil Market
CAO
Procurement Optimization and Trading
CNAF
Import and Supply
Storage and Distribution
End Customers, Airlines, and Ship
Owners

Page | 10 | PHILLIP SECURITIES RESEARCH (SINGAPORE)
CHINA AVIATION OIL INITIATION
Enhancement of diversification and internationalization. CAO’s strategic goal is to achieve the global top-tier transport fuels provider. Since 2008, CAO has been internationalizing the jet fuel supply coverage beyond China. In 2009 CAO diversified the oil product mix by continuously introducing other oil products trading. Refer to Figure 19, the geographic breakdowns of revenue from FY08 to FY15 show that CAO keeps optimizing the client base globally. Though China is still the biggest market, the percentage of its contributions is trending down to nearly 50%, and meanwhile overseas exposure is growing. There is no doubt that apparently CAO kept improving the capability on supply chain management and marketing. The increasing penetration into overseas market favours the brand and reputation establishment and reduces the risk from demand side effectively. Once CAO consolidates the global market position and maintains the supply channels on long-term basis, the reinforced bargaining power will come along accordingly.
Figure 19. Revenue breakdown, FY08 to FY15
Source: Company, PSR
CAO aims to achieve that the contribution from other oil product segment reaches one third of total revenue by 2020. Since FY11 the trading volume of other oil related products has been ramping up, and even though amid the plunge of oil price in FY15, the volume maintained as that of previous year. Going forward, CAO established gas oil trading book in FY12 and started to supply aviation gas in FY14. Nevertheless, CAO marked to market closely in order to reduce losses resulting from market turning around. In 3Q14, it suspended petrochemicals trading, due to weak market demand and backwardation, and was ready to restart to trade once market improved. With the stringent risk management, CAO is building up more mature trading model on these fragmented oil products.
Diversification of product mix benefits CAO in terms of inflating the turnover and the

Page | 11 | PHILLIP SECURITIES RESEARCH (SINGAPORE)
CHINA AVIATION OIL INITIATION
resistance upon market shortfall, as each distillate has its demand and driver, and outperformance of each single product can probably offset the underperformance of another and vice versa under the rise and fall of business cycle, but the portfolio as whole buffers the strike of oil price volatility and stabilizes the profitability.
Figure 20. Revenue and trading volume from product mix
Source: Company, PSR
Key propellants: investment of oil-related assets. CAO’s long-term strategy is the integration of transport fuel value chain, including procurement, delivery, storage, and fuelling. As of Dec 2015, the investments in oil-related fields are comprised of 4 associate companies and 1 joint venture, SPIA, TSN-PEKCL, Xinyuan, OKYC and CNAF HKR. CAO has been vertically integrating the downstream sectors such as transportation, storage, and even end customers. The complement of the downstream channels optimizes the synergies among the Group as a whole. The share profits from associates and JVs sustained at more than US$40mn over the past 5 years, which is a major driver of net profit.
Figure 21, Share profits from associates and JVs
Source: Company, PSR
SPIA is the primary profit generator among the asset portfolio, as it is the supply chain end point, which is the source of wealth. Moreover, Shanghai Pudong International Airport is the second largest airport in China in respective of total traffic volume, which is the key driver of the business. Refer to Figure 22, the passenger traffic reach the peak at over 60 mn in 2015, and the upswing is going on; so did the freight traffic that rebounded since 2013. The upcoming catalyst that will tremendously boost the passenger traffic is the opening of Shanghai Disney Park in mid-2016, as well as the businesses gearing up in Shanghai Free-trade Zone. At the end of 2015, the airport began to build up the world’s biggest satellite terminal, which is expected to commence operation in 2019, and by then the capability to handle traffic volume reaches more than 80mn per annum. Besides, the 5
th runway is scheduled in the city’s 13
th five-year plan. In a word, SPIA prepares for higher
traffic volume, which bodes a blossomy perspective.

Page | 12 | PHILLIP SECURITIES RESEARCH (SINGAPORE)
CHINA AVIATION OIL INITIATION
Figure 22, SPIA traffic volume
Source: Company, PSR
TSN-PEKCL, the transport volume is competing with supply from Sinopec Beijng Yanshan, but the profit contribution was stable.
Xinyuan, the challenges in the petrochemicals sector still remain. As China economy is undergoing the moderate growth period. Exploring new client base for new storage contacts is a relatively comprising way to struggle in a weak demand market.
OKYC, the tank storage leasing activities is positively correlated to abundance of oil supply. As the supply glut maintains, it will strengthen the profitability. However, the translated share profit is subject to FX volatility and correspondent hedges. According to the management from CAO, one of the synergies from OKYC is cost reduction. For example, when catering to urgent jet fuel calls from US, it is more cost-effective to deliver from South Korea rather from Singapore.
CANF HKR, it is enjoying 15% of market share regarding refuelling volume in Hong Kong currently. The management expects it will continue marginal loss making in 2016 and 2017 before it turns profitable in 2018.
How Do We View? Good opportunities for M&A. CAO reserved sufficient cash on hand in the past 10 years, refer to Figure 23. In FY14 and FY15, zero debts underpinned the war chest’s availability for potential merger and acquisition actions. The rout of oil market shuffled the whole industry, driving out participants failed to sustain the operation and leaving undervalued assets and facilities scattered globally. Therefore, it is both a challenge and an opportunity for CAO.
The milestone year is coming. Whether it can take a big leap from the current flattened organic growth depends on the success that the Group creates substantial positive inorganic growth through synergetic investment amid value chain integration. For FY16 outlook, the management guided the M&A move targets at aviation related assets such as air hub, international airport, airspace, pipeline network, and other infrastructures.
Benefiting from “One Belt, One Road”. Refer to Figure 24, CAO also highlighted the “One Belt, One Road” initiative is boon for seeking the potential right fits. Generally, it is difficult to breach into mature air hubs in developed cities, because the well-established supply system and the intact facilities are held by the major market players. However, the initiative spans across 3 continents in Eurasia, whereby most emerging economies are in demand for development of infrastructures such as roads, railways, ports, and airports. Accordingly, CAO sees the entry barrier of investment in oil related field or jet fuel supply business is lower, raising the probabilities of penetration.

Page | 13 | PHILLIP SECURITIES RESEARCH (SINGAPORE)
CHINA AVIATION OIL INITIATION
Figure 23. Cash and equivalent on hand
Source: Company, PSR
Figure 24. “One Belt One Road” map
Source: Company, PSR
Investment Risks Here we list some major risks that are keys to CAO’s ongoing running.
Risk factors Remarks Mitigation
Business risk 1. Unmatched supply
and demand dynamics
2. Competition
1. "Back-to-back" model, which is that CAO only conducts procurement after securing
the downstream supply contracts;
2. The exclusivity of jet fuel importing to China won't be impacted, since the
availability of supply facilities is the barrier which is very high. Besides, the sole import
license is granted by the government, keeping the private participants from entering
the market;
3. CAO is expanding the global deployment and maintaining quality of delivery
regarding oil grade and timing in order to build up good reputation and trust in the
market.
Market risk 1. Oil price volatility
2. Market turns around
1. 90% of the trading volumes are back by physical trading, and the rest 10% paper
trading is a yield enhancement which aligns with physical trading's ramp up;
2. VaR testing, use value at risk modeling to evaluate the probability of potential
losses;
3. Limit order, each trader's order book is locked in a limited amount;
4. Stop loss, once the losses hit the level set up by CAO, the account was halted to
trade;
5. When market turns around to backwardation, CAO suspends trading until contango
is back again.
Credit risk 1. Counterparty defaults 1. Scrutinize the credit rating and cancel the businesses with those credit ratings fail to
meet CAO's criteria.
Source: Company, PSR
Valuation Methodology: Discounted Cash Flow (DCF) Since CAO is forecast to generate positive operating cash flows and bears zero or minimal debt onwards, discounted cash flow model using free cash flow to equity (FCFE) is an appropriate method to value CAO.

Page | 14 | PHILLIP SECURITIES RESEARCH (SINGAPORE)
CHINA AVIATION OIL INITIATION
The major impact of FCFE is from working capital changes. Due to the back to back order for its trading business model, CAO holds low level of inventories, whilst the amounts of receivables and payables are substantial. Over the past 5 years, the days of sales outstanding (DSO) and days of payables outstanding (DPO) were trending downward to 13.7 and 10.1 in FY15 respectively. However, we think the days will rebound and fluctuate within 30 days, which are the maximum days of credit that CAO grants to customers. Therefore the FCFE is expected to back to average level in FY16 and drop in FY17 and FY18, and The terminal value is based on the cash flow level in FY16.
Discounted Cash Flow
(US$mn) FY16e FY17e FY18e
FCFE 45.921 4.075 9.114
PV of FCFE 42.700 3.523 7.328
Terminal value 708.933
PV of terminal value 569.992
Target price (S$) 0.92
Assumptions
Cost of equity 7.5%
Sustainable growth rate 1.0%
Source: PSR
Page | 15 | PHILLIP SECURITIES RESEARCH (SINGAPORE)
CHINA AVIATION OIL INITIATION
Page | 16 | PHILLIP SECURITIES RESEARCH (SINGAPORE)
CHINA AVIATION OIL INITIATION

22776846