Embed Size (px)
Citation preview
China and India Reshape Global Industrial Geography
27
CHAPTER 2
China and India ReshapeGlobal Industrial Geography
Shahid Yusuf, Kaoru Nabeshima, and Dwight Perkins*
China’s meteoric climb since the mid 1990s, as an exporter of manufactures, and India’s ability,over the past six years to claim a sizable fraction of the global market for tradable IT enabledservices1 have contributed to the changing pattern and the volume of global trade. Some of theimplications of these are modeled and described in chapter 3. In 2004, China’s share of theworld’s merchandise exports was close to 7 percent, that of India was a little less than 1 percent.The two countries’ shares of global imports were 6.1 percent and 1 percent respectively.
China’s manufacturing sector accounts for over 41 percent of GDP and manufactured goodsconstituted 93 percent of exports in 2005 or almost one quarter of the gross value of industrialoutput. Machinery and transport equipment accounted for 45.2 percent of total exports. Thesestatistics reflect the large gains in manufacturing capability facilitated by heavy investment inplant and equipment embodying the latest technologies and the codification of knowledge onproduction processes.
Relative to China, India’s formal manufacturing sector accounts for a far smaller share ofGDP—less than 16 percent. Investment in new industrial capacity and industrial growth since1990 has been slower and exports of manufactures are a fraction of China’s in absolute terms andalso a smaller fraction of total exports. Undoubtedly, India has achieved competitiveness in a fewmanufacturing subsectors and some of those are technologically quite advanced, as we willdiscuss below; however, on balance manufacturing capability has lagged. As described later,India’s breakthrough is in the exports of certain business process services and software thetradability of which has been greatly enhanced by advances in telecommunications and the adventof the Internet.2
These developments point to ongoing and impending shifts in worldwide industrialgeography. In this chapter we explore the likelihood of a continuing concentration of majorindustrial activities in China and India and the implications of such trends, were they tomaterialize, for other economies.
The balance of this chapter is divided as follows: Section II describes the size of thedomestic markets in China and India, especially for the relevant manufacturing products. SectionIII focuses on the overall strategy and patterns of development in the two countries. In section IV,we briefly examine the development of a few of the leading industrial and service sectors in both
* The authors are greatly indebted to Jimena Luna and Wei Ha for their assistance with the research and production, toRichard Cooper, Masahisa Fujita, Nobuaki Hamaguchi, Greg Noble, and T. N. Srinivasan for insightful backgroundpapers. We also thank Alan Winters, Tom Rawski, and T. N. Srinivasan for many valuable suggestions whichimproved contents and structure.1 These are principally business processing services and activities associated with the writing, testing and debugging ofsoftware.2 Exports of not just software and services but also of goods have benefited (Clarke and Wallsten 2006).
Dancing with Giants: China, India, and the Global Economy
28
countries. Finally, in the concluding section we report on longer term implications for China,India and their trading partners.
Large Domestic Market
The evolving international competitiveness of Chinese industry and eventually of Indian industry,will depend on a number of factors including the expansion of the domestic market,improvements in the infrastructure, strengthening of the innovation system and the dynamism ofmajor firms. Businesses and the press regularly talk about the enormous size of both the Chineseand Indian markets given their huge populations. Large markets create a competitive advantagefor any product where there are substantial economies of scale, as is the case for industries suchas white goods or automobile assembly. Scale economies can be achieved without a largedomestic market, of course, by relying from the start on exports, but access to the domesticmarket and lower entry barriers can be a significant advantage. But how big are the Chinese andIndian markets?
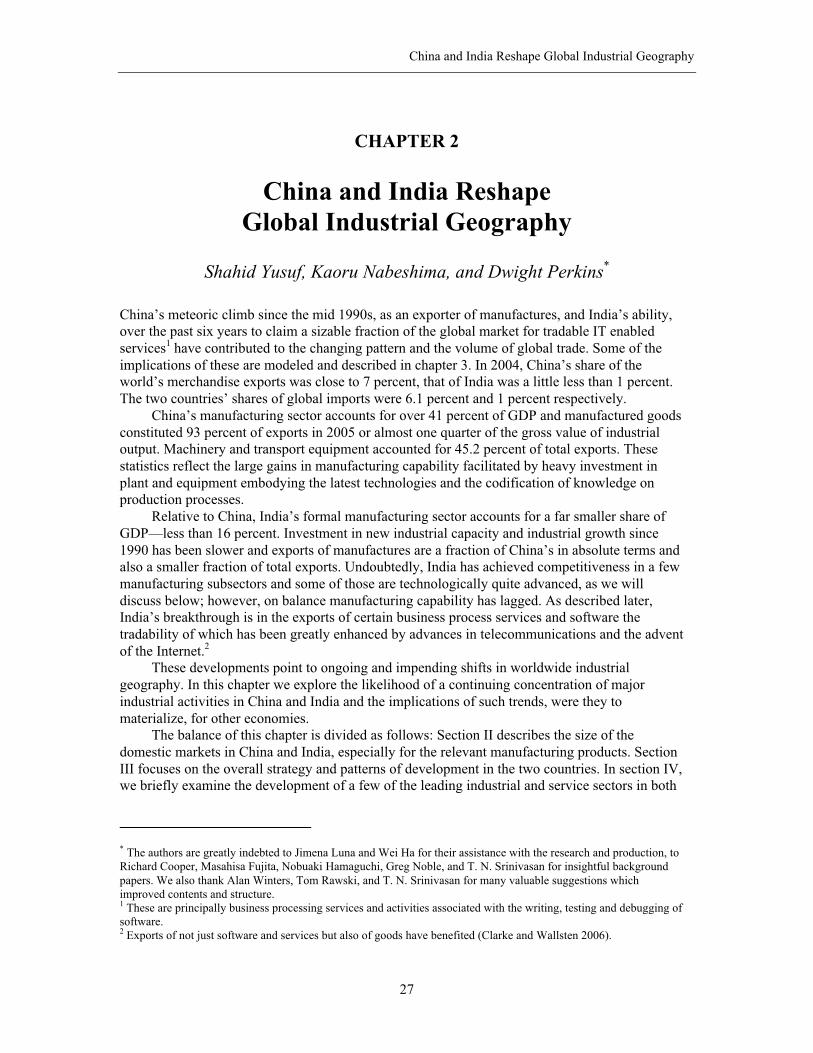
Table 2.1 Share of China and India in World Exports
1980 1990 2004World exports China India China India China India
I. Manufacturing 0.8 0.5 1.9 0.5 8.3 0.9 1. Iron and Steel 0.3 0.1 1.2 0.2 5.2 1.6 2. Chemicals 0.8 0.3 1.3 0.4 2.7 0.7 2.1 Pharmaceuticals 1.6 a 1.2 a+> 1.3 1.0 b
3 Office machines and telecom equip. 0.1 n.a. 1.0 0.8 15.2 0.6 4. Auto parts 0.0 0.0 0.1 0.1 0.7 0.1 5. Textiles 4.6 2.4 6.9 2.1 17.2 4.0 6. Clothing 4.0 1.7 8.9 2.3 24.0 2.9II. Commercial Services 2.9 1.9 1. Transports n.a. n.a. 2. Travel 4.1 n.a. 3. Other 2.4 3.1
Source: Srinivasan 2006.Note: n.a. = not available.a. Pertains to 2000.b. Pertains to 2003.
For many industrial producers the size of their market is much smaller than the total GDPhowever measured.3 Much of what purchasing power a family has is spent on food and not onindustrial products. Low income families both in the rural and urban areas do purchasemanufactured products such as garments and footwear, but they do not purchase automobiles andthe more expensive consumer durables. It is precisely in the area of white and brown goods whereeconomies of scale are important. Thus the market for these latter products is made up mainly ofpeople in the upper income groups with high income elasticities of demand for such products who
3 For an industrial firm selling its products in the market, the purchasing power parity measure of GDP is irrelevant. Aforeign firm in particular will want to know what its sales are worth in a convertible international currency such as U.S.dollars. If a domestic firm is engaged in international trade as either a seller or buyer, it will want to know pricesconverted into its domestic currency using the official exchange rate. Thus the relevant GDP concept in US dollars isthe one obtained by using the official exchange rate.
China and India Reshape Global Industrial Geography
29
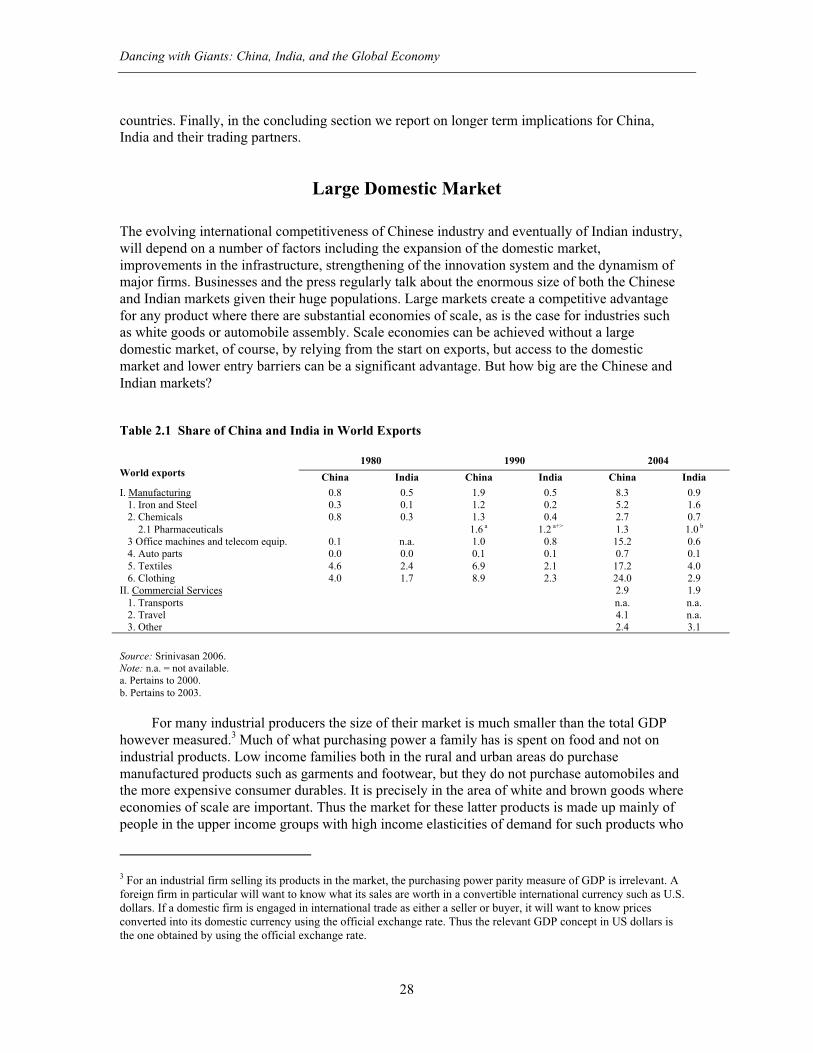
live in urban areas in China and India or abroad. Data on the ownership of consumer durables andautomobiles in China are presented in table 2.3 and for India in table 2.4.
Table 2.2 Share of China and India in World Imports
1980 1990 2004World exports China India China India China IndiaI. Manufacturing 1.1 0.5 1.7 0.5 6.3 0.8 1. Iron and Steel 2.7 1.0 2.5 1.0 8.2 1.0 2. Chemicals 2.0 n.a. 2.2 n.a. 6.5 n.a. 2.1 Pharmaceuticals 0.9a n.a. 0.8 a n.a. 3 Office machines and telecom equip. 0.6 0.2 1.3 0.3 11.2 0.5 4. Auto parts 0.6 0.0 0.6 0.1 1.7 0.3 5. Textiles 1.9 n.a. 4.9 0.2 7.4 0.6 b
6. Clothing 0.1 0.0 0.0 0.0 0.6 0.0II. Commercial Services 2.5a 2.1 a 3.4 2.0 1. Transports 4.2 2.2 2. Travel 3.3 2.4 3. Other 3.5 2.1
Source: Srinivasan 2006.Note: n.a. = not available.a. Pertains to 2000.b. Pertains to 2003.
Table 2.3 Ownership of High-Income Consumer Durables in China, 2004
Consumer durableUrban household
(per 100 households)Rural households
(per 100 households)
Washing machine 95.9 37.3
Refrigerator 90.2 17.8
Color TV 133.4 75.1
Camera 47.0 3.7
Mobile PHONE 111.4 34.7
Automobile 2.2 n.a.
Source: National Bureau of Statistics of China, China Statistical Yearbook 2005.
How big is the income of these higher income groups or the “middle class” in China andIndia? One way to approach this question is to measure the income of the highest income 20percent of the population and the share of that income spent on non-food products. Thatcalculation results in a market purchasing capacity of US$550 billion for China and less thanUS$150 billion for India. To this figure could be added the share of investment that goes topurchase machinery and equipment, and key inputs such as steel and cement. This would result ina market for industrial products of another US$ 400 billion for China and US$100–150 billion forIndia.
Thus, industrial producers in China face a potential market of nearly US$1 trillion. Indianindustrial producers face a potential market a quarter to a third of that size.
Dancing with Giants: China, India, and the Global Economy
30
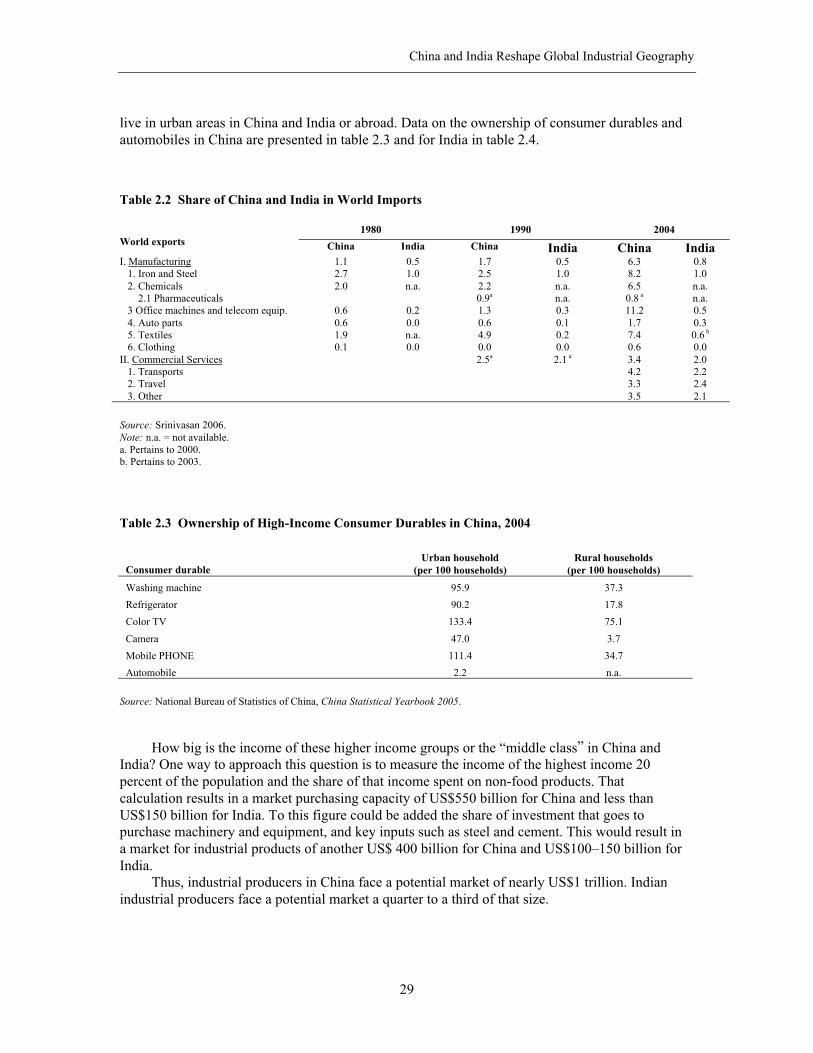
Table 2.4 Percentage of Households Owning the Specified Asset in India
Asset Total Rural Urban
ElectronicsRadio, transistor 35.1 31.5 44.5Television 31.6 18.9 64.3Telephone 9.1 3.8 23.0Transportation vehicles
Bicycle 43.7 42.8 46.0Scooter, motor cycle, moped 11.7 6.7 24.7Car, jeep, van 2.5 1.3 5.6None of the specified assets 34.5 40.5 19.0
Source: Office of the Registrar General, India 2003.
Two Industrial Giants?
What are the implications of recent trends for the future international competitiveness of Chineseand Indian industry and services and the likely resulting industrial geography?
China Ascending
To begin with, China will remain mainly an exporter of manufactures over the next 10–15 years.As regards imports, China is a major buyer of primary products, of sophisticated equipment andof components such as semiconductors, microprocessors and hard drives. This is already apparentwith petroleum, natural gas, iron ore and non-ferrous metals,4 but it will become steadily more soover the coming decade. In 2005 net imports of crude oil had risen to 127 million metric tons andthat upward trend is certain to continue.5 This rise in imports derives from the rapid growth ofChinese GDP, increasing demand from the transport sector and environmental problems, which isleading a major effort to switch to oil and natural gas (“Today India” 2005; Yusuf and Nabeshima2006b).6 A decade ahead in 2015, petroleum imports should be well above 5 million barrels a daydepending on the underlying assumptions about the pace and sectoral composition of economicgrowth.7
This demand has increased China’s imports from the least developed countries (LDCs). In2002, China absorbed $3.5 billion in exports from those countries and was their third rankedmarket (Yang 2006). The main question mark with respect to primary goods imports is the paceat which China will become a major importer of food and related agricultural products. China’sgrain output peaked in 1996 and 1998 and has fallen since in absolute terms and yet it was still anet exporter of 19.9 million tons of grain in 2003 and only a small net importer of 5 million tons
4 In 2004, China imported 208 million tons of iron ore, one third of world exports and one fourth of copper exports in2005.5 National Statistical Office, China Statistical Yearbook, 1999, p. 248 and China Statistical Yearbook, 2005, p.256.6 A move that is tempered by worries over increasing dependence on energy imports.7 Petroleum consumption in 2023 is projected to range from a low of 410 million tons (the slow growth scenario) to ahigh of 1246 million tons. The latter figure would imply imports of roughly 1000 million tons or 22 million barrels aday (Ho, Jorgenson, and Perkins 1998).
China and India Reshape Global Industrial Geography
31
in 2004. China has been a major importer of soybeans, importing more than 20 million tons inboth 2003 and 2004. Overall, however, China is still a net exporter of US$9.7 billion of food andlive animals as of 2004.
China imports machinery, plant equipment8 and components which have fuelled the massiveexpansion of industrial capacity and served as a conduit for technology transfer. The first two,that is, complex capital goods almost exclusively from the advanced countries, are likely tocontinue over the foreseeable future as China’s comparative advantage in these will materializeonly gradually given the importance of learning, tacit knowledge, and cumulative research. Withregard to electronic components, currently the principal export of several East and SoutheastAsian economies, the situation is less clear. They have risen steeply since 1995. China is one ofthe principal trading partners of the newly industrializing countries and China’s openness to tradeis contributing to the interdependence of the East Asian region (Branstetter and Lardy 2006; Petri2006; Yang 2006). More recently however, there is some evidence that elements of the supplychain are migrating to China as manufacturers of intermediates seek to move closer to marketsand final assemblers. This process, especially with regard to the auto industry, could fuel FDI inChina during the next decade.
On the export side, China is likely to remain competitive in labor intensive products in 2010or 2015 even as wages rise. In 2004, real wages were 2.11 times the level of 1989 and the rate ofwage increase has been accelerating in 2004–2005, especially in the coastal regions—althoughproductivity is rising as well.9 This trend is likely to be contained because China still has a largeoverhang of 350 million agricultural workers, many of whose incomes are a small fraction of thewages earned by urban workers.10 To take full advantage of these underutilized workers as wellas lower costs of land , however, China will have to move the labor intensive factories nearer tothe interior as is now being attempted in the southwestern provinces through investment in thetransport infrastructure (Chan and Qingyang 2006). Assuming it succeeds and the process couldtake time, China’s dominant world position in the export of textiles, garments, shoes, and toys isnot likely to change much in the coming years.
China is the second largest market for and the largest exporter of electronics/ICT products(Ma, Ngyuen, and Xu 2006a). The potential growth of these markets has attracted most of theleading Taiwanese, Korean and other MNCs in the electronics, auto and durables subsectors.China’s three largest exporters in 2003 were subsidiaries of Taiwanese electronics firms such asFoxconn (Hon Hai) and Quanta. Several auto assemblers and manufacturers of auto parts haveshifted their regional headquarters to China and are planning to move some of their research anddesign facilities as well.
A recent study by Roland-Holst and Weiss (2005) of China’s trade shows that it is outcompeting its ASEAN neighbors. The latter are losing shares in export markets although inabsolute terms their exports continue to grow. Rodrik (2006) similarly finds that the growingsophistication of China poses a considerable challenge for other Southeast Asian countries.
8 Imports of machinery and transport equipment by China in 2004 reached $253 billion as against just $22 billion byIndia (Panagariya 2006).9 These are the Chinese official wage indexes for enterprises in the urban areas see National Statistical Office, ChinaStatistical Yearbook 2005, p. 151. This is the change in the real average wage of all workers and staff so it includesboth wage increases within various job categories and changes in the share of particular job categories in the wage bill.10 The marginal return to labor in 2001 was 365 RMB in agriculture, while it was 11,884 RMB in urban industry, 4,672RMB in rural non-farm, and 2,009 RMB in urban services, pointing to large distortions in the labor market, especiallybetween agriculture and urban industry. This disparity has increased from the ratio of 11.4 in 1978 to 34 by 2001 (Tan2004).
Dancing with Giants: China, India, and the Global Economy
32
Table 2.5 Shanghai and Beijing Emerging as Asian Regional Headquarters
Corporation Presence in AsiaToyota Motor Corp. Plans to set up regional headquarters in Beijing to supervise and coordinate sales, distribution
and other operations.GM Will shift its Asia Pacific HQ from Singapore to Shanghai by January 2005.Visteon Has moved its Asian HQ from Tokyo to ShanghaiVolkswagen Has moved its Asia Pacific regional center to Beijing from its German HQ at Wolfsburg.
Source: Asia Pacific Foundation of Canada 2005.
With over five million graduates a year in senior secondary school, the Chinese labor forceis going to have a large number of people capable of taking on jobs well above the low skilledlabor intensive assembly operations associated with light manufactures.
China’s gross enrollment rate for higher education rose from 19 percent in 2004 to 21percent in 2005 (Min 2006).11 Currently China is graduating 600,000 people in science andengineering mainly at the undergraduate level. Over the next decade that number could reach atotal of more than 5 million (“Up to the Job?” 2006). The very top Chinese students in sciencesand engineering (like those from India) are competitive with the best in the world and arebeginning to make a mark through scientific publications and patenting (Chen and Kenney 2006).The increasing stock of engineers and scientists is now enabling China to enter a limited numberof higher technology areas (such as nanotechnology, see Zhou and Leydesdorff 2006) at anearlier stage of development than would be the case in a smaller country. Significant numbers ofgraduating students can staff world class research laboratories abroad and should enable China toenter other high technology fields provided that these experienced researchers come back toChina after years studying abroad. The lure is rising R&D, which reached 1.4 percent of GDP in2005 as against 1 percent in 2000 together with numerous incentives for returnee’s with S&Tskills (Yusuf and Nabeshima 2006a; Yusuf and Nabeshima 2006b; Yusuf, Wang, and Nabeshima2005).
11 Data from UNESCO Institute for Statistics, 2006.
China and India Reshape Global Industrial Geography
33
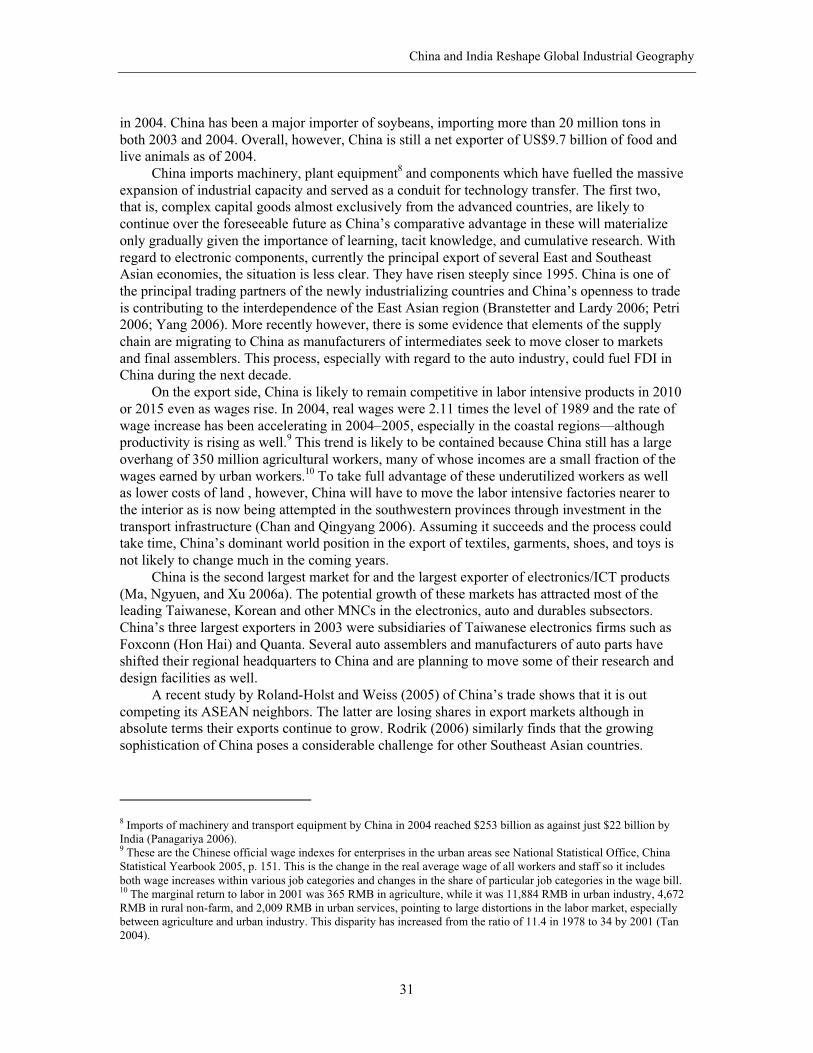
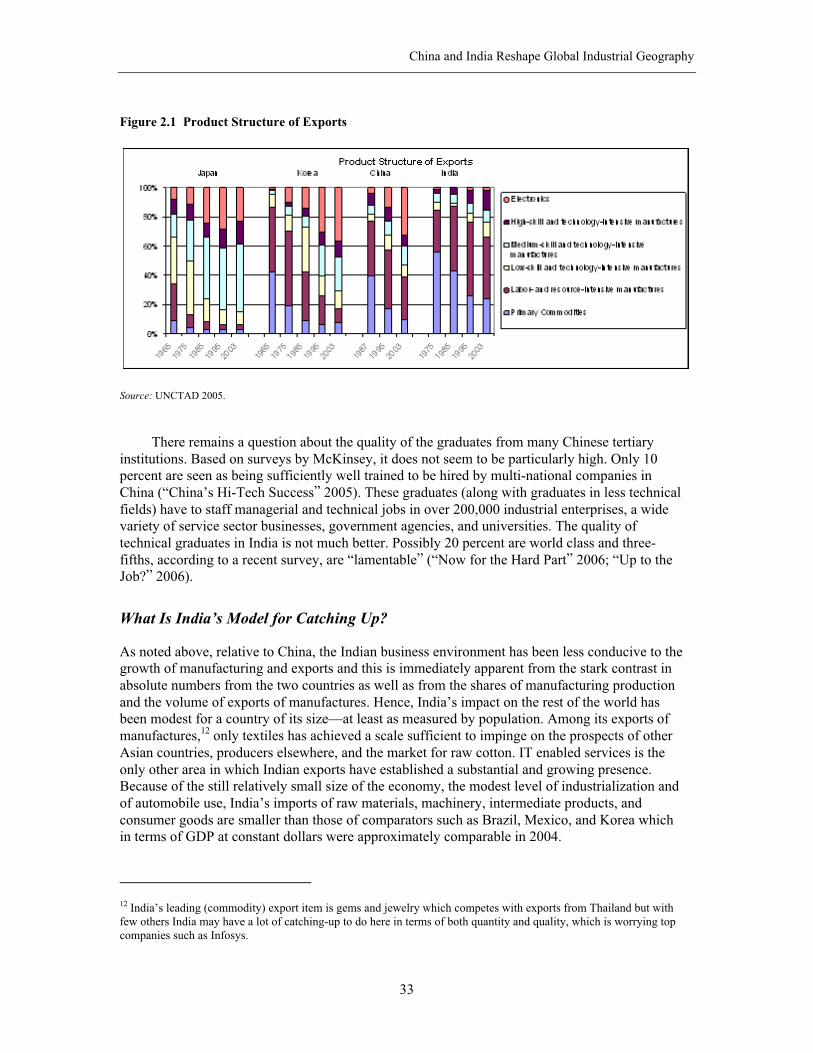
Figure 2.1 Product Structure of Exports
Source: UNCTAD 2005.
There remains a question about the quality of the graduates from many Chinese tertiaryinstitutions. Based on surveys by McKinsey, it does not seem to be particularly high. Only 10percent are seen as being sufficiently well trained to be hired by multi-national companies inChina (“China’s Hi-Tech Success” 2005). These graduates (along with graduates in less technicalfields) have to staff managerial and technical jobs in over 200,000 industrial enterprises, a widevariety of service sector businesses, government agencies, and universities. The quality oftechnical graduates in India is not much better. Possibly 20 percent are world class and three-fifths, according to a recent survey, are “lamentable” (“Now for the Hard Part” 2006; “Up to theJob?” 2006).
What Is India’s Model for Catching Up?
As noted above, relative to China, the Indian business environment has been less conducive to thegrowth of manufacturing and exports and this is immediately apparent from the stark contrast inabsolute numbers from the two countries as well as from the shares of manufacturing productionand the volume of exports of manufactures. Hence, India’s impact on the rest of the world hasbeen modest for a country of its size—at least as measured by population. Among its exports ofmanufactures,12 only textiles has achieved a scale sufficient to impinge on the prospects of otherAsian countries, producers elsewhere, and the market for raw cotton. IT enabled services is theonly other area in which Indian exports have established a substantial and growing presence.Because of the still relatively small size of the economy, the modest level of industrialization andof automobile use, India’s imports of raw materials, machinery, intermediate products, andconsumer goods are smaller than those of comparators such as Brazil, Mexico, and Korea whichin terms of GDP at constant dollars were approximately comparable in 2004.
12 India’s leading (commodity) export item is gems and jewelry which competes with exports from Thailand but withfew others India may have a lot of catching-up to do here in terms of both quantity and quality, which is worrying topcompanies such as Infosys.
Dancing with Giants: China, India, and the Global Economy
34
Undoubtedly, India’s global footprint has expanded since the beginning of the decade.Looking forward, India’s economy and trading relations will become more visible on the globalstage, but even a doubling of GDP in ten years will result in an economy that is less than two-thirds the size of the Chinese economy today, in nominal dollars. However, India’s future impacton the rest of the world needs to be taken seriously because it has the labor resources, a growingbase of human capital, the domestic market potential, and the nascent industrial strength tobecome an industrial powerhouse comparable to China today. Whether this actually materializesand India begins to significantly influence the fortunes of other countries as well as a naturalresource use and global externalities, will depend upon the competitiveness and dimensions of anumber of industrial subsectors. This appears unlikely.
Were India to proceed along the growth path chalked out by the dynamic and fast growingEast Asian economies, then manufacturing must lead the way. Given its factor supplies, Indiawould need to rapidly expand its labor intensive consumer industries while continuing to buildthe basic materials industries such as petrochemicals and metallurgical, as well as the downstreamengineering and transport industries. Moreover, while the domestic market is and would remain amajor outlet for all these industries, rapid growth is likely, as in the case of China, to rest uponFDI in manufacturing industries and success in export markets.13 If India is to conform to the EastAsian model, the share of manufacturing in GDP, currently less than 16 percent, would need todouble within possibly a decade and a half, calling for sector growth rates in the double digitrange, which also would help generate urgently needed jobs (“India: Risks Mount” 2006), and asignificant portion of the output produced would have to be exported.
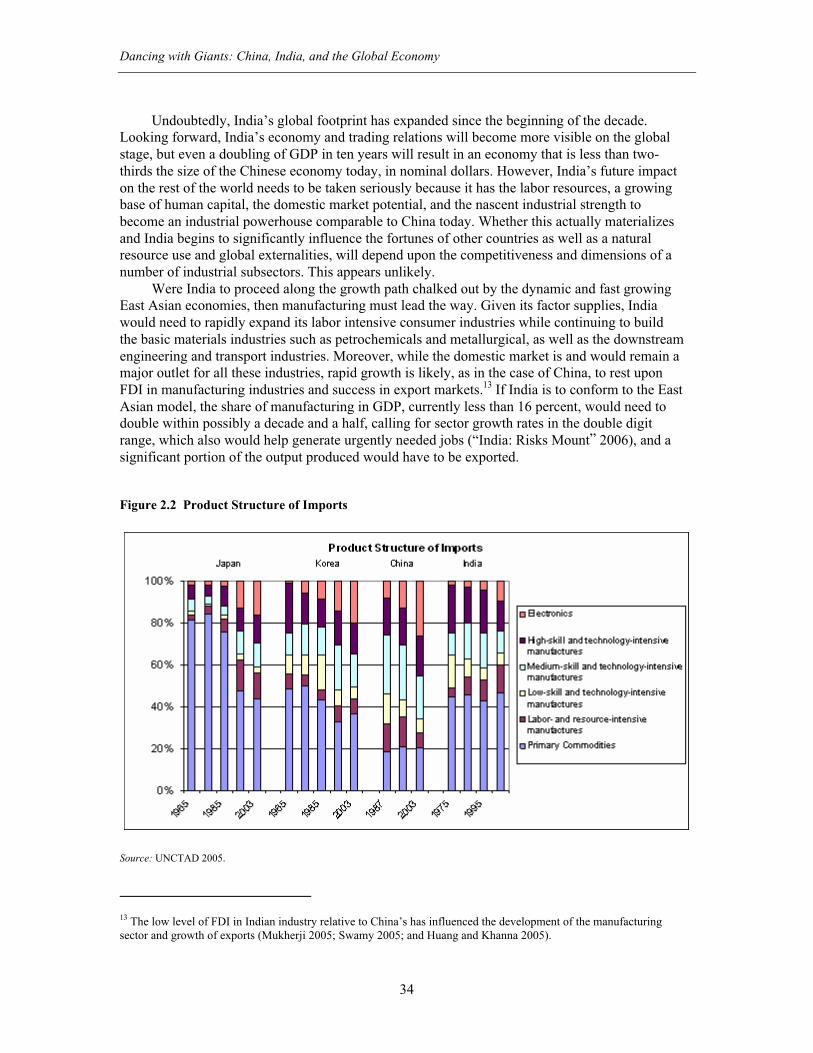
Figure 2.2 Product Structure of Imports
Source: UNCTAD 2005.
13 The low level of FDI in Indian industry relative to China’s has influenced the development of the manufacturingsector and growth of exports (Mukherji 2005; Swamy 2005; and Huang and Khanna 2005).
China and India Reshape Global Industrial Geography
35
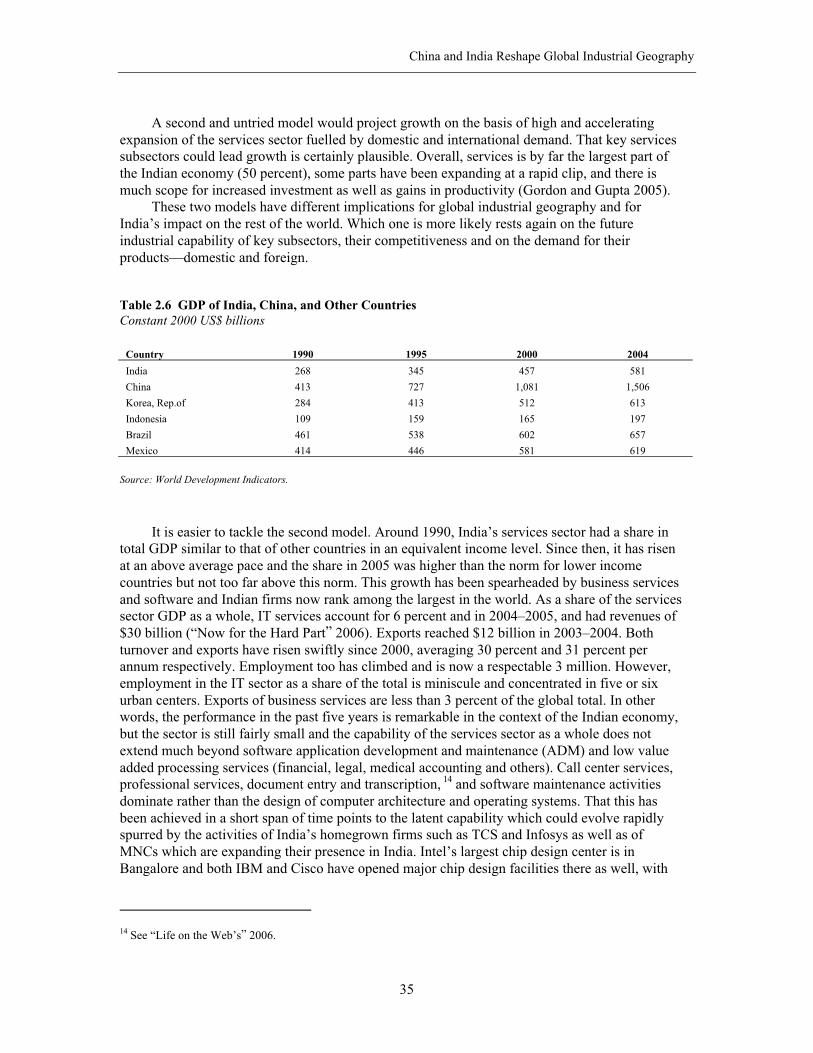
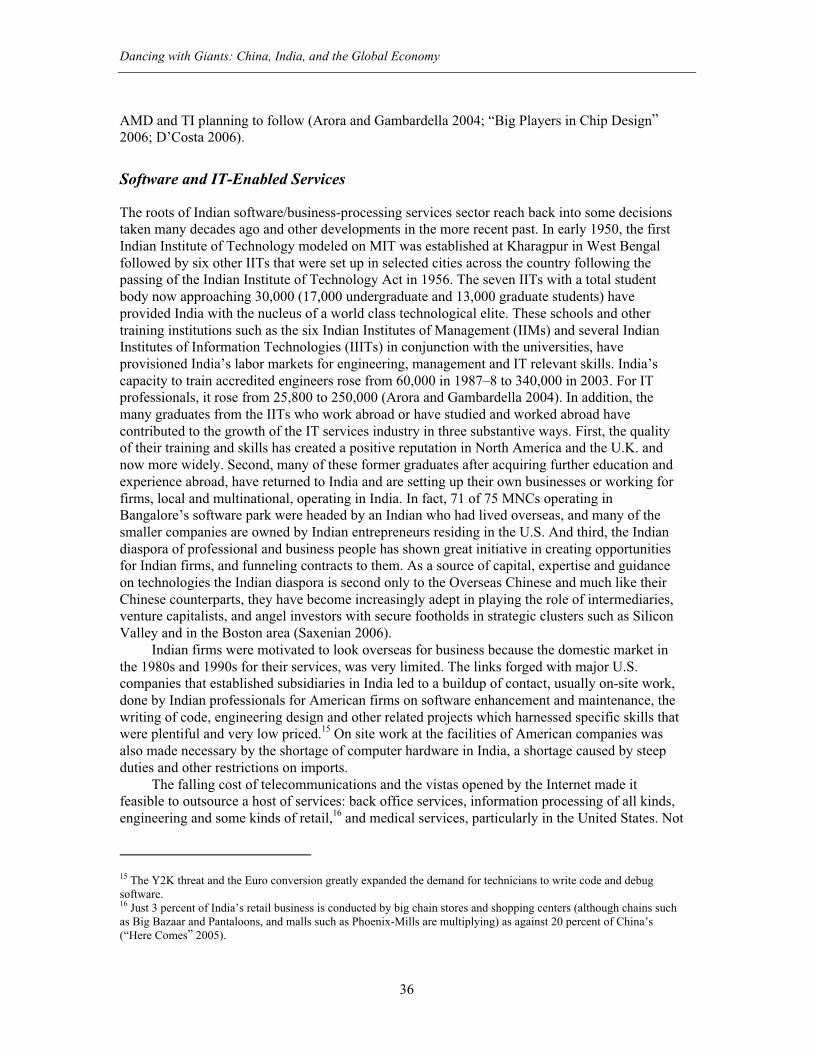
A second and untried model would project growth on the basis of high and acceleratingexpansion of the services sector fuelled by domestic and international demand. That key servicessubsectors could lead growth is certainly plausible. Overall, services is by far the largest part ofthe Indian economy (50 percent), some parts have been expanding at a rapid clip, and there ismuch scope for increased investment as well as gains in productivity (Gordon and Gupta 2005).
These two models have different implications for global industrial geography and forIndia’s impact on the rest of the world. Which one is more likely rests again on the futureindustrial capability of key subsectors, their competitiveness and on the demand for theirproducts—domestic and foreign.
Table 2.6 GDP of India, China, and Other CountriesConstant 2000 US$ billions
Country 1990 1995 2000 2004
India 268 345 457 581
China 413 727 1,081 1,506
Korea, Rep.of 284 413 512 613
Indonesia 109 159 165 197
Brazil 461 538 602 657
Mexico 414 446 581 619
Source: World Development Indicators.
It is easier to tackle the second model. Around 1990, India’s services sector had a share intotal GDP similar to that of other countries in an equivalent income level. Since then, it has risenat an above average pace and the share in 2005 was higher than the norm for lower incomecountries but not too far above this norm. This growth has been spearheaded by business servicesand software and Indian firms now rank among the largest in the world. As a share of the servicessector GDP as a whole, IT services account for 6 percent and in 2004–2005, and had revenues of$30 billion (“Now for the Hard Part” 2006). Exports reached $12 billion in 2003–2004. Bothturnover and exports have risen swiftly since 2000, averaging 30 percent and 31 percent perannum respectively. Employment too has climbed and is now a respectable 3 million. However,employment in the IT sector as a share of the total is miniscule and concentrated in five or sixurban centers. Exports of business services are less than 3 percent of the global total. In otherwords, the performance in the past five years is remarkable in the context of the Indian economy,but the sector is still fairly small and the capability of the services sector as a whole does notextend much beyond software application development and maintenance (ADM) and low valueadded processing services (financial, legal, medical accounting and others). Call center services,professional services, document entry and transcription, 14 and software maintenance activitiesdominate rather than the design of computer architecture and operating systems. That this hasbeen achieved in a short span of time points to the latent capability which could evolve rapidlyspurred by the activities of India’s homegrown firms such as TCS and Infosys as well as ofMNCs which are expanding their presence in India. Intel’s largest chip design center is inBangalore and both IBM and Cisco have opened major chip design facilities there as well, with
14 See “Life on the Web’s” 2006.
Dancing with Giants: China, India, and the Global Economy
36
AMD and TI planning to follow (Arora and Gambardella 2004; “Big Players in Chip Design”2006; D’Costa 2006).
Software and IT-Enabled Services
The roots of Indian software/business-processing services sector reach back into some decisionstaken many decades ago and other developments in the more recent past. In early 1950, the firstIndian Institute of Technology modeled on MIT was established at Kharagpur in West Bengalfollowed by six other IITs that were set up in selected cities across the country following thepassing of the Indian Institute of Technology Act in 1956. The seven IITs with a total studentbody now approaching 30,000 (17,000 undergraduate and 13,000 graduate students) haveprovided India with the nucleus of a world class technological elite. These schools and othertraining institutions such as the six Indian Institutes of Management (IIMs) and several IndianInstitutes of Information Technologies (IIITs) in conjunction with the universities, haveprovisioned India’s labor markets for engineering, management and IT relevant skills. India’scapacity to train accredited engineers rose from 60,000 in 1987–8 to 340,000 in 2003. For ITprofessionals, it rose from 25,800 to 250,000 (Arora and Gambardella 2004). In addition, themany graduates from the IITs who work abroad or have studied and worked abroad havecontributed to the growth of the IT services industry in three substantive ways. First, the qualityof their training and skills has created a positive reputation in North America and the U.K. andnow more widely. Second, many of these former graduates after acquiring further education andexperience abroad, have returned to India and are setting up their own businesses or working forfirms, local and multinational, operating in India. In fact, 71 of 75 MNCs operating inBangalore’s software park were headed by an Indian who had lived overseas, and many of thesmaller companies are owned by Indian entrepreneurs residing in the U.S. And third, the Indiandiaspora of professional and business people has shown great initiative in creating opportunitiesfor Indian firms, and funneling contracts to them. As a source of capital, expertise and guidanceon technologies the Indian diaspora is second only to the Overseas Chinese and much like theirChinese counterparts, they have become increasingly adept in playing the role of intermediaries,venture capitalists, and angel investors with secure footholds in strategic clusters such as SiliconValley and in the Boston area (Saxenian 2006).
Indian firms were motivated to look overseas for business because the domestic market inthe 1980s and 1990s for their services, was very limited. The links forged with major U.S.companies that established subsidiaries in India led to a buildup of contact, usually on-site work,done by Indian professionals for American firms on software enhancement and maintenance, thewriting of code, engineering design and other related projects which harnessed specific skills thatwere plentiful and very low priced.15 On site work at the facilities of American companies wasalso made necessary by the shortage of computer hardware in India, a shortage caused by steepduties and other restrictions on imports.
The falling cost of telecommunications and the vistas opened by the Internet made itfeasible to outsource a host of services: back office services, information processing of all kinds,engineering and some kinds of retail,16 and medical services, particularly in the United States. Not
15 The Y2K threat and the Euro conversion greatly expanded the demand for technicians to write code and debugsoftware.16 Just 3 percent of India’s retail business is conducted by big chain stores and shopping centers (although chains suchas Big Bazaar and Pantaloons, and malls such as Phoenix-Mills are multiplying) as against 20 percent of China’s(“Here Comes” 2005).
China and India Reshape Global Industrial Geography
37
many countries had the mix and volume of skills and English language capabilities which Indiadid. Moreover, Indian IT professionals and companies had the added advantage of long exposureand involvement with U.S. companies which took the lead in adopting IT, in reengineeringcorporate structures, and in outsourcing services.17 It was during this period that more and moreIndian firms began to enter the field and IT services clusters (for instance in the software parks)began to take shape in Bangalore and other cities with a concentration of engineering talent(Arora and Athreye 2001) However, the growth of the industry was spearheaded by a number ofmedium sized firms established much earlier: The first, Tata Consulting Services was created in1968, Wipro in 1980, Infosys in 1981, and Satyam in 1987. The leading firms now account forthe lion’s share of turnover and exports (Khanna and Palepu 2004). Only one-fourth of the toptwenty exporters are foreign multinationals. Thus the past association dating back to the 1980sand reinforced by the presence of thousands of Indian professionals in the U.S., gave Indian firmsa flying start in the global market place and accounts for the heavy dependence on exports and onthe U.S. market. The government assisted by containing the rates for telecommunication servicesand modifying India’s stringent labor laws so as to give IT firms greater flexibility in the hiringand laying off of workers.
As the IT sector has expanded one of the most serious constraints which has emerged is theshortage of needed technical and managerial skills which goes hand in hand with high anddisruptive labor turnover. Thus, India needs to invest heavily in skills and in technology and firmswill need to cultivate links with universities and research institutes if they are to sustain highgrowth rates.18 Other middle income countries are also looking to services to provide economicmomentum and jobs—the East European economies, Russia, Brazil, Mexico, not to mentionChina which is producing more engineers and IT technicians than India and is ambitiouslyexpanding the ITES and software sectors assisted by FDI by Indian IT firms (“Watch Out, India”2006). India can also expect to encounter strong competition from Israel, Ireland, severalEuropean countries and the U.S. as it pushes into the high value end of IT which it is nowattempting—for instance with digital signal processing software. Hence projecting the likelyfuture geographical distribution of business and IT services is no easy matter. However, it isbeginning to seem as though other South East and South Asian economies and those from EastEurope and Latin America will have to struggle to find lucrative niches in the IT services marketdominated by MNCs and Indian firms.
Other Services
India’s banking, finance, telecommunications, and hotel and restaurant services have also grownat double digit or near double digit rates (Gordon and Gupta 2005). There is plenty of scope forthe development of India’s finance, telecoms, commercial and retail, medical, moviemaking, andlogistics services on the strength of buoyant domestic demand as well as demand from overseas.Each of these also stands to benefit from advances in IT which will both raise productivity andgenerate demand for the firms supplying the services. It is an open question however, whetherIndia is likely to emerge within the next decade as a significant exporter of any of these services.India’s economy is only a sixth as monetized as China’s and India holds 1 percent of the globalfinancial assets but less than one-half are in the form of bank deposits (Farrell and Key 2005).
17 During 1999–2001, roughly half of the petitions for H1B visas (work authorization for skilled workers in the UnitedStates) were granted to Indians (Cooper 2006).18 Only a small fraction of those employed by the IT industry have more than five years experience (“Now for the HardPart” 2006; “Up to the Job?” 2006).
Dancing with Giants: China, India, and the Global Economy
38
India’s banking and finance sector while improving and apparently more dynamic than China’sremains inefficient by international standards and Indian institutions have not made any headwayoverseas.
Telecommunications also is a domestic industry even though India has created a productionbase for hardware technologically attuned to the needs of lower income countries. But unlikeChinese firms such as Huawei and ZTE, Indian companies have yet to venture abroad, offer thekind of full service (including financing) packages which Chinese firms now do and to investsignificant sums equal to 8–10 percent of sales in R&D to stay abreast with the frontrunners inthis rapidly advancing field (“Global Transformation” 2006).19
Moviemaking is a thriving national industry and India is the biggest producer of films in theworld. This industry also caters to the large overseas Indian diaspora and has acquired a nichemarket in some of the Middle Eastern countries as well. But it has yet to broaden its appeal toconsistently reach a global audience and compete with Hollywood or with producers in GreaterChina (China, Hong Kong and Taiwan, China) and Korea in spite of the international acclaimenjoyed by a few movies, most notably Bend It Like Beckham.
Very recently, Indian firms have begun supplying IT services for the international movieindustry and producers of video games (for example, for cell phones), a business that could growin line with the demand for special effects and video content. With the exception of the businessservices processing and software industries, it is far from obvious that India is positioned to makea mark in the global market with its services industry at least during the next ten years. Verylikely, India’s impact and China’s on the geography of the world’s tradable services industrycould be modest and not especially disruptive. The same cannot be said for manufacturing, ifIndia picks up speed. This brings us back to the conventional manufacturing sector led model ofdevelopment which underlies the development of China and other East Asian economies.
Prospects of Key Manufacturing Industry
Whether Indian manufacturing can become the principal leading sector and whether India canjoin China as a leading industrial economy will depend in both countries, largely on the mediumterm performance of a number of manufacturing subsectors and in India’s case in particular, theparallel development of infrastructure.20
19 The average investment in R&D as a percent of sales in 2000 by Indian software firms was 3.5 percent(Radhakrishnan 2006).20 Power shortages are a major concern for Indian firms. A survey of Indian manufacturing firms in 2003 reveals that61 percent of firms still rely on their own generators for electricity while in China, the share is 27 percent. The samesurvey also found that firms in India faced 17 significant power outages a month on average, far more frequent than inMalaysia (once a month) or China (less than five a month). The loss due from power outages in India was 9 percent oftotal output compared to 2 percent in China (World Bank 2004). Furthermore, electricity cost twice as much as inChina (“An Urgent Political and Moral Imperative” 2006). In addition, investment in infrastructure has lagged behindthe urban population growth of 31 percent between 1991 and 2001 (“India: Poor Infrastructure” 2006). Major cities areonly now embarking on various infrastructure projects (transport, roads, electricity, and water) to ameliorate the currentconditions. Deficiencies in infrastructure provisions are costing India 3–4 percentage points in lost growth (“An UrgentPolitical and Moral Imperative” 2006). China has invested more heavily in infrastructure and many regardinfrastructure provision as adequate and improving (Dollar and others 2003). Still China faces serious transportationconstraints. Rail bottlenecks remain severe and feeder roads require a further dose of investment (“China: RapidGrowth” 2005; “China: New Roads” 2006). Overall in 2003, India was investing 3.5 percent of GDP or $21 billion ininfrastructure, China 10.5 percent or $150 billion. This divergence is tellingly apparent in the current outcomes (“Nowfor the Hard Part” 2006).
China and India Reshape Global Industrial Geography
39
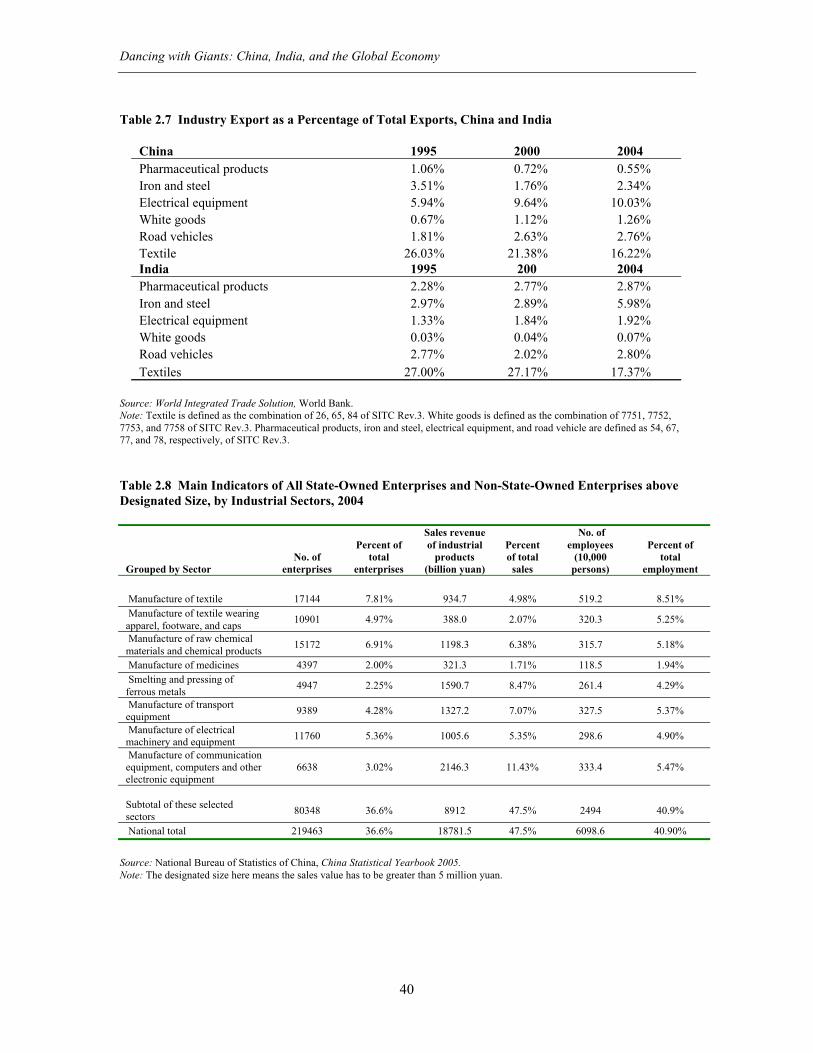
These subsectors are: textiles, white goods, pharmaceuticals, autos and auto parts, steel andelectronics. Together, these account for close to a third of the merchandise exports of both Indiaand China and for 48 percent of the sales of industrial products in China as well as 41 percent ofindustrial employment (see table 2.8).
Textiles
Textiles and clothing account for 7 percent of world exports. China is the leading producer,followed by India. China’s advantage derives from its integration with the global productionnetwork through foreign investment and direct contacts with the retailers in OECD countries.Wal-Mart for example, purchased $18 billion worth of goods from China in 2004. In contrast,India is not yet an integral part of global production networks and has little direct contact with theretailers (Whalley 2006).
Domestically, India’s textile and clothing sector is the second largest employer with 35million workers (10 percent of the workforce) (Ananthakrishnan and Jain-Chandra 2005). In1950, India was a leading exporter of cotton textiles, but thereafter it lost ground and theindustry’s fortunes only began once reforms were introduced in the early 1980s (Roy 2004).However, India’s textile industry still trails well behind that of China. In 2005, exports of textilesand garments amounted to $9.5 billion and $7.5 billion respectively versus $77 billion and $40billion for China. The average firm in the formal sector has often been constrained from fullyexploiting scale economies and new technologies; little foreign capital has flowed into the sector;Indian firms are less well integrated into global production networks than Chinese firms and forthat reason, have benefited less from technology transfer. Hence, the productivity level of Indiantextile and clothing sector is only 35 percent of that of the United States while China’s is 55percent (Ananthakrishnan and Jain-Chandra 2005). The overall productivity of India’s apparelindustry is 16 percent of that of producers in the U.S. (Padhi, Pauwels, and Taylor 2004).
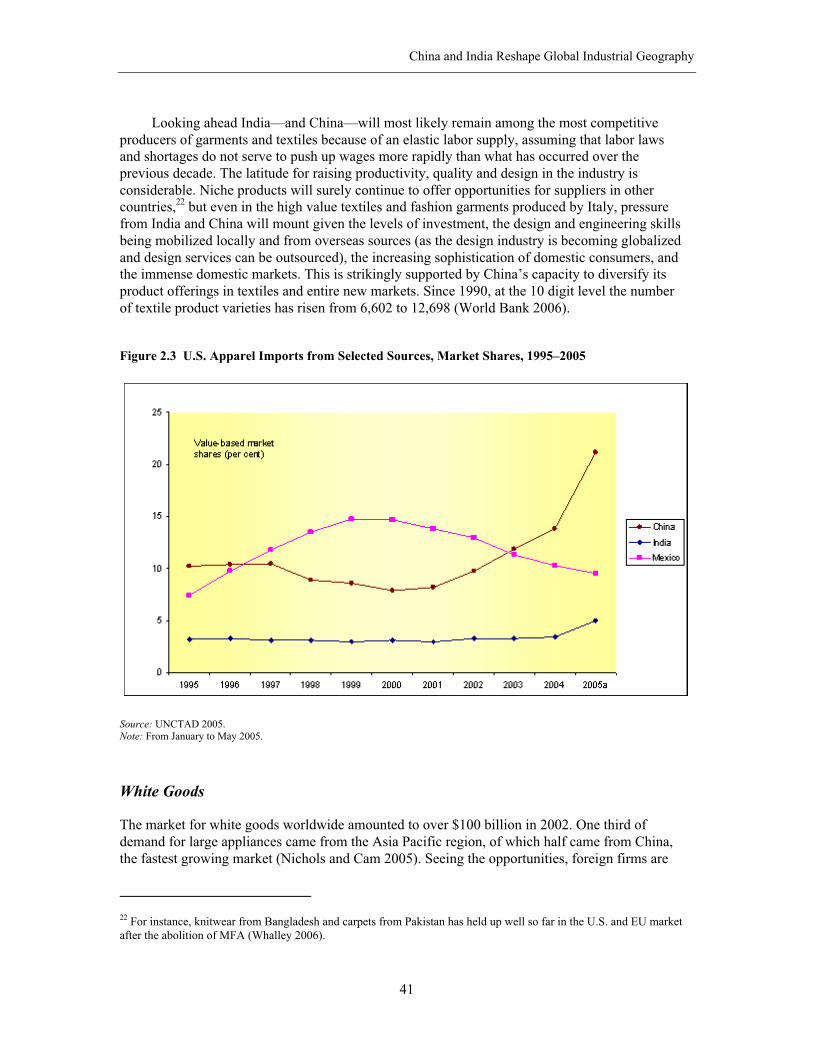
As with several other Indian industries, the partial dismantling of domestic regulations andof the MFA, have created openings which firms are rushing to exploit. Indian exports some ofwhich compete against exports from China are rising and the two countries are moving todominate the world market to an even greater extent than in the past. Both increased their marketshares in Japan, the EU, and the United States in 2005, however, China’s gains were largerbecause Chinese producers had invested in anticipation of the lifting of quotas, were betterprepared and more competitive (“Air-conditioners Wilt” 2005; “India: China Eats” 2005; Yang2006). As the backloaded MFA phase out started in 1995, China, even though it was not yet amember of the WTO, was able to take advantage of the phased removal of quotas on variousapparel categories. India did not (Srinivasan 2003; Srinivasan 2006).Even if there is a full liberalization, India may not soon be able to take advantage of theopportunities made available because Indian firms are still hampered by suboptimal scales ofproduction, labor market rigidities and other impediments to trade, particularly with respect tologistics (Schiff and others 2006).21 The minimum delivery time from India to the United States is24 days, compared to 18 days from Thailand, 15 days from China, 12 days from Hong Kong(China), and 3 days from Mexico. In addition, custom delays on imports eat up 10 days in Indiaas opposed to 7 days in Korea and Thailand (Ananthakrishnan and Jain-Chandra 2005).
21 Even large firms such as Gokaldas is unwilling to expand employment because it is difficult to lay-off workers(“Now for the Hard Part” 2006).
Dancing with Giants: China, India, and the Global Economy
40
Table 2.7 Industry Export as a Percentage of Total Exports, China and India
China 1995 2000 2004Pharmaceutical products 1.06% 0.72% 0.55%Iron and steel 3.51% 1.76% 2.34%Electrical equipment 5.94% 9.64% 10.03%White goods 0.67% 1.12% 1.26%Road vehicles 1.81% 2.63% 2.76%Textile 26.03% 21.38% 16.22%India 1995 200 2004Pharmaceutical products 2.28% 2.77% 2.87%Iron and steel 2.97% 2.89% 5.98%Electrical equipment 1.33% 1.84% 1.92%White goods 0.03% 0.04% 0.07%Road vehicles 2.77% 2.02% 2.80%Textiles 27.00% 27.17% 17.37%
Source: World Integrated Trade Solution, World Bank.Note: Textile is defined as the combination of 26, 65, 84 of SITC Rev.3. White goods is defined as the combination of 7751, 7752,7753, and 7758 of SITC Rev.3. Pharmaceutical products, iron and steel, electrical equipment, and road vehicle are defined as 54, 67,77, and 78, respectively, of SITC Rev.3.
Table 2.8 Main Indicators of All State-Owned Enterprises and Non-State-Owned Enterprises aboveDesignated Size, by Industrial Sectors, 2004
Grouped by SectorNo. of
enterprises
Percent oftotal
enterprises
Sales revenueof industrial
products(billion yuan)
Percentof total
sales
No. ofemployees
(10,000persons)
Percent oftotal
employment
Manufacture of textile 17144 7.81% 934.7 4.98% 519.2 8.51% Manufacture of textile wearingapparel, footware, and caps
10901 4.97% 388.0 2.07% 320.3 5.25%
Manufacture of raw chemicalmaterials and chemical products
15172 6.91% 1198.3 6.38% 315.7 5.18%
Manufacture of medicines 4397 2.00% 321.3 1.71% 118.5 1.94% Smelting and pressing offerrous metals
4947 2.25% 1590.7 8.47% 261.4 4.29%
Manufacture of transportequipment
9389 4.28% 1327.2 7.07% 327.5 5.37%
Manufacture of electricalmachinery and equipment
11760 5.36% 1005.6 5.35% 298.6 4.90%
Manufacture of communicationequipment, computers and otherelectronic equipment
6638 3.02% 2146.3 11.43% 333.4 5.47%
Subtotal of these selectedsectors
80348 36.6% 8912 47.5% 2494 40.9%
National total 219463 36.6% 18781.5 47.5% 6098.6 40.90%
Source: National Bureau of Statistics of China, China Statistical Yearbook 2005.Note: The designated size here means the sales value has to be greater than 5 million yuan.
China and India Reshape Global Industrial Geography
41
Looking ahead India—and China—will most likely remain among the most competitiveproducers of garments and textiles because of an elastic labor supply, assuming that labor lawsand shortages do not serve to push up wages more rapidly than what has occurred over theprevious decade. The latitude for raising productivity, quality and design in the industry isconsiderable. Niche products will surely continue to offer opportunities for suppliers in othercountries,22 but even in the high value textiles and fashion garments produced by Italy, pressurefrom India and China will mount given the levels of investment, the design and engineering skillsbeing mobilized locally and from overseas sources (as the design industry is becoming globalizedand design services can be outsourced), the increasing sophistication of domestic consumers, andthe immense domestic markets. This is strikingly supported by China’s capacity to diversify itsproduct offerings in textiles and entire new markets. Since 1990, at the 10 digit level the numberof textile product varieties has risen from 6,602 to 12,698 (World Bank 2006).
Figure 2.3 U.S. Apparel Imports from Selected Sources, Market Shares, 1995–2005
Source: UNCTAD 2005.Note: From January to May 2005.
White Goods
The market for white goods worldwide amounted to over $100 billion in 2002. One third ofdemand for large appliances came from the Asia Pacific region, of which half came from China,the fastest growing market (Nichols and Cam 2005). Seeing the opportunities, foreign firms are
22 For instance, knitwear from Bangladesh and carpets from Pakistan has held up well so far in the U.S. and EU marketafter the abolition of MFA (Whalley 2006).
Dancing with Giants: China, India, and the Global Economy
42
entering the Chinese market, and in durables such as washing machines their market share hasincreased from 15 percent in 2000 to 25 percent in 2003 (Nichols and Cam 2005). Firms such asGE are planning to shift a third of their production capacity to Asia, China being the primarydestination.
Similarly, the Indian market is expanding and domestic producers such as Godrej andVideocom and MNCs have created two large clusters to produce white goods in Noida (nearDelhi) and Pune (near Mumbai) assisted by government provided incentives. The householdownership rate for refrigerators in India was just 15 percent in 2004 and it was also low for otherdurables (“Japanese White Goods” 2006). Haier is attempting to enter the Indian market whereKorean producers (such as LG the market leader and Samsung) currently have a strong presence.In 2004, LG announced plans to make India its second largest global production base after China(Nichols and Cam 2005). It already accounts for more than a quarter of the market for air-conditioners and color TVs, and more than a third of the market for washing machines,refrigerators, and microwaves (“Now for the Hard Part” 2006). Sanyo will start marketing whitegoods in India, utilizing existing partnership with local distributors for their TVs (“Sanyo SeeksIndia Boost” 2006). So also are Sharp and Toshiba (“Sharp India Chalking Out” 2006; “ToshibaForays” 2006).
In the past, local production was the rule worldwide because of freight costs. As freightcharges are typically quoted with reference to cubic capacity, it is relatively expensive to shipfinished white goods over a long distance, especially the larger ones (Nichols and Cam 2005).Because of this, the development of the white goods industry was determined by the size and thegrowth opportunities of the domestic market. However, the combination of low wages andproduction costs coupled with adoption of modern technology, has enabled China to exportrefrigerators and wine coolers to the US (Nichols and Cam 2005). Parallel to the increase in tradeof finished goods, intra-industry trade has increased, reflecting the development of globalproduction networks for white goods.23
Although demand is strong, especially from China and India, the unit price of white goodshas been in decline and firms are adopting a number of strategies to cut labor costs, to outsource,to strip production down to an assembly operation, and bring in modern management techniques,especially total quality management to reduce the number of defects (Nichols and Cam 2005).Others are trying to move up the technology ladder by offering more functions in each unit, betterdesigns, integration with the whole kitchen as a system, and even internet-enabled refrigerators(Nichols and Cam 2005).
China
In 1981, the urban penetration rate in China of refrigerators and washing machines per 100families respectively was only 0.2 and 6. The “big three” home appliances at that time were thebicycle, the watch, and the sewing machine (Zhao, Nichols, and Cam 2005). In 20 years, thepenetration rate of white goods in China increased dramatically to reach 87 refrigerators and 92washing machines per 100 urban families in 2002. In some cities such as Beijing, the penetrationrate was 107.4 refrigerators and 102.8 washing machines per 100 families (Zhao, Nichols, andCam 2005). Although the urban market is fast becoming saturated, the ownership of white goodsby rural households is still low with 13.6 refrigerators and 29.9 washing machines per 100 ruralfamilies (Zhao, Nichols, and Cam 2005).
23 For instance, Maytag’s dishwashers that are assembled in the U.S. use motors made in China (by GE), and wireharnesses from Mexico (Nichols and Cam 2005).
China and India Reshape Global Industrial Geography
43
At the beginning, most firms were small-scale state-owned or collectively-ownedenterprises. To meet the rising demand, these firms imported factories from Italy and Germany.By the mid-1990s, more than 100 lines were imported. During the 1990s, more successfulenterprises, with government encouragement started to acquire other companies, forming severallarge well-known firms such as Haier, Kelon, Meiling and Little Swan, reflecting the worldwidetrend in consolidation (Zhao, Nichols, and Cam 2005). By 2002, the market share of the top fivefirms had risen to 60 percent in refrigerators and 68 percent in washing machines. The market forair conditioners is also becoming less crowded. Twenty-seven brands were withdrawn in 2001leaving 69 in 2005. By the end of 2006 only 20 might be left (“Air-conditioners Wilt” 2005).These successful firms are also relying heavily on exports. For example, Galanz exports 65percent of its production of microwave ovens and is becoming a major producer of airconditioning units (“An Alpha Delta” 2006; Sull and Wang 2005). Changhong Electric is alsoexpanding its production of air conditioners (“Telecoms and Technology” 2006). But many of theChinese producers depend upon foreign firms for key items such as compressors.
Haier, now the fourth largest white goods manufacturer in the world, was the first Chinesemanufacturing firm to invest abroad in 1999 (“Haier to Create” 2006).24 It is also the first Chinesefirm to hire an international advertisement agency to establish its brand (“Chinese FridgeMagnate” 2005), and now has dozens of factories scattered overseas.
India
India’s white goods industry is at an earlier stage of development relative to China’s. Exports areinsignificant and there is no Indian equivalent to China’s Haier prowling international markets.Protectionism, slow growing demand from the middle class, little FDI until recently, sub-scaleproduction and inadequate supplies of electricity all have combined to keep India out of therunning. Now, demand from the middle class is picking up and the white goods industry has seendouble-digit growth in recent years. The market size of white goods is about Rs. 80 billion(US$1.76 billion).
MNCs are expanding their manufacturing capacity in India. However, while India isattracting assembly operations, its slow start means that producers based in India are unlikely tobe exporting substantial quantities of finished products for some time. The exports of componentsis a different matter and feasible. China has established a lead in white and brown goods and itcould be a lengthening lead as MNCs transfer more and more technology and expand capacitythrough FDI in China.
Pharmaceuticals
Pharmaceuticals is one of India’s brightest prospects and is underpinned by strongentrepreneurship in the private sector and the abundance of skills in chemistry, biology, andchemical engineering and also the long term mastering of complex process technologies madepossible by the absence of IP protection until recently under Indian laws for foreignpharmaceutical products (Chaudhuri 2004). Here again, China is a close match although itscorporate capability is weaker than India’s. India is the fourth largest producer of pharmaceuticals
24 This investment was in a factory in South Carolina, United States. Haier plans to expand the existing factory withadditional investment amounting to $150 million. Furthermore, it plans to invest in an R&D facility in the United States(“Haier to Create” 2006).
Dancing with Giants: China, India, and the Global Economy
44
by volume—the 13th in terms of value—and for several compelling reasons it is likely not only toretain this ranking over the next decade but also to expand its global market share (Grace 2005).China is the second largest producer of pharmaceutical ingredients and generic drugs in terms ofvalue after the U.S. (with 5 percent of world output in 2004 valued at $54.4 billion (“ChinaPharmaceuticals Sector” 2005) but Chinese firms have, remarkably, shown less initiative in thisfield than in others, although they exported $4 billion worth of products (including traditionalmedicines) in 2004 and are now beginning to move into the neighboring fields of biotech andstem-cell research (Fernandez and Underwood 2006).
In addition to graduating 15,000 chemists each year, India has the corporate muscle toinvest in R&D, to test, and to market drugs. Firms such as Ranbaxy, Cipla, Dr. Reddy,Wockhardt, and Nicholas Piramal have the size and the experience to embark on substantialresearch activities involving drug discovery, a significant departure from their past practice ofimitating drugs produced abroad and selling mainly in the market for generics.25 Indiancompanies currently account for $8 billion of the $48 billion global market for generic drugs(“Selling Generics” 2006). The presence of these homegrown firms plus many MNCs such asNovartis and GlaxoSmithKline which are beginning to locate some of their research in India iscreating a dynamic environment. India’s huge size, numerous hospital facilities and the capacityto conduct drug trials involving a large and heterogeneous population is another advantage oversmaller countries such as Singapore and Korea which are also engaged in the development of newdrugs and procedures. Developing a drug in India can cost as little as $100 million vs. $1 billionor more in the U.S. China shares these advantages and is beginning to exploit them (see Yusufand Nabeshima 2006a).
India now has the largest number of FDA approved manufacturing plants outside of the U.S.and these factors plus the newly strengthened IP regime are a firm basis for future growth.26
Again, the competition is likely to be among the advanced countries, China and India possiblyalso Brazil, with other countries certain to be squeezed by the presence of the big players in anindustry, where size matters a great deal at several levels.
Autos and Parts
Traditionally, automobile firms have tended to prefer local assembly to exporting because of thebulkiness of the finished cars and the need to comply with local regulations that often differsubstantially among countries. This is not to say that the trade in the automobile sector isinsignificant. On the contrary, it is growing at double digit rates, especially that of moresophisticated and expensive parts.
In 2004, the Chinese share of automotive products exports was a mere 0.7 percent while thatof India was 0.2 percent (Noble 2006). However, the Indian production of automobiles couldclimb to about $40 billion in 2015 (today it is about $9 billion), of which $20–25 billion would beexported. By 2015, China’s export of automobiles could be as much as $120 billion (Noble2006). India seems to have a comparative advantage in exporting small cars27 although the recententry of Chinese producers such as Chery and Geely could change the picture as could thestrategies of MNCs to use China as a base for producing and exporting small cars, including
25 Until the revision of IPR in 2005, Indian firms were able to manufacture generic versions of medicines developed inother countries, without the need for the expiration of patents for these drugs.26 Surprisingly though, a survey by Bain and Company in 2006 found that pharmaceutical executives felt China was themore attractive site for low cost manufacturing of drugs (“China Looms Large” 2006).27 Just seven years after it commenced production, Tata Motors was making net pre-tax profits of 10 percent and wasthe largest group in the Tata business empire (“Today India” 2005).
China and India Reshape Global Industrial Geography
45
hybrids (Ma, Ngyuen, and Xu 2006b).28 China and India are both modernizing their autoindustries through joint ventures with foreign firms. Virtually all the major international automanufacturers have set up facilities in China and some such as Honda, Hyundai, Toyota andothers are entering India (“Honda to Invest” 2006). For example, the Indian governmentpartnered with Suzuki in the early 1980s to form a joint venture, Maruti Udyog, and begandelicensing the auto components industry (Gokarn and Vaidya 2004).29 In 1993, India endedlicensing of foreign automobile ventures and in 2001 it lifted almost all the restrictions on FDI inthe automobile industry. However, tariffs have remained high at 100 percent on vehicles and 35percent on parts. In contrast, tariffs in China declined to 25 percent on vehicles and 10 percent onparts after the accession to the WTO (Noble 2006).
FDI from MNCs is spurring the emergence of parts manufacturers in China (some of themforeign affiliates) (Noble 2006; Rawski 2006). China is acquiring an edge in the internationalmarket for auto parts with exports of $0.3 billion in engines, $3.25 billion in auto parts andbodies, and $1.35 billion in tires as opposed to $800 million for India for these products(Balakrishnan and others 2006). The assemblers and first tier suppliers (Sutton 2004) in bothcountries are able to manufacture products of sufficient quality no matter where they areproduced and are able to export their products.30 The distribution of defects observed confirms theview that first-tier suppliers to newly arrived carmakers in India and China are already operatingclose to world-class standards (Balakrishnan and others 2006). However, India’s auto industry ishandicapped by a significant cost disadvantage relative to China: costs are close to 20 percenthigher in almost all the parts and component production.
In both China and India, auto assemblers are facing difficult times in procuring parts ofsufficient quality from the lower-tier suppliers (Noble 2006). Recently, the Indian automobileparts industry has redoubled its efforts (the pressure mainly coming from MNCs) to improvequality, to streamline the delivery system (just-in time), and to improve the efficiency of theirfactory operations (Balakrishnan and others 2006).
In the push to raise the level of technology, China is ahead of India. The automobileindustry is one of the most R&D intensive.31 The list of top R&D spenders includes many of thewell-known automakers some of which have transferred a portion of their R&D activities toChina. Chinese automakers are also slowly increasing their R&D spending (for instance, Geelyclaims to invest more than 10 percent of revenues on R&D) (Noble 2006). By comparison, TataAuto spends about 2 percent of revenues on R&D and Maruti Udyog spends only 0.48 percent onR&D.32 This may change as Indian engineering and metal working firms such as Bharat Forge aregearing up to provide high value products and services in conjunction with software houses inparticular, products with embedded software. In this regard, India may be several steps ahead ofChina.
28 In 2004, 15 percent of the production was exported (Balakrishnan and others 2006). China was a net exporter ofvehicles in 2005 to the tune of about 10,000 (“Figures Show China” 2006). Most of the exports comprised of minivansmainly to the Middle East but this is likely to change with increasing exports of sedans.29 The earliest entry was by GM, assembling Chevrolets in India in 1928 (KPMG International 2006).30 Most of the Indian automotive exports are done by the international first tier suppliers (Balakrishnan and others2006).31 Among the top 10 firms in terms of R&D spending, five are automotive firms, led by DaimlerChrysler (Departmentof Trade and Industry 2005).32 The market share of Maruti Udyog is 54.5 percent in passenger cars with the capacity to produce 500,000 unitsannually (“Smooth Drive” 2006).
Dancing with Giants: China, India, and the Global Economy
46
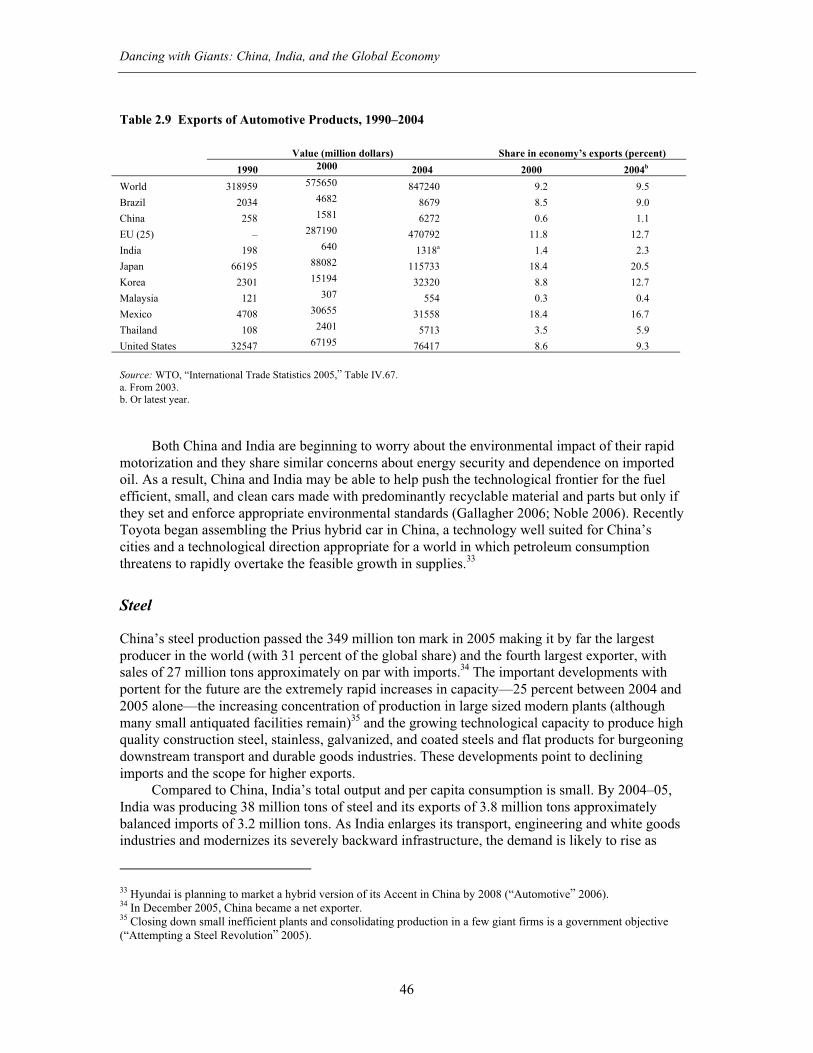
Table 2.9 Exports of Automotive Products, 1990–2004
Value (million dollars) Share in economy’s exports (percent)
1990 2000 2004 2000 2004b
World 318959 575650 847240 9.2 9.5
Brazil 2034 4682 8679 8.5 9.0
China 258 1581 6272 0.6 1.1
EU (25) – 287190 470792 11.8 12.7
India 198 640 1318a 1.4 2.3
Japan 66195 88082 115733 18.4 20.5
Korea 2301 15194 32320 8.8 12.7
Malaysia 121 307 554 0.3 0.4
Mexico 4708 30655 31558 18.4 16.7
Thailand 108 2401 5713 3.5 5.9
United States 32547 67195 76417 8.6 9.3
Source: WTO, “International Trade Statistics 2005,” Table IV.67.a. From 2003.b. Or latest year.
Both China and India are beginning to worry about the environmental impact of their rapidmotorization and they share similar concerns about energy security and dependence on importedoil. As a result, China and India may be able to help push the technological frontier for the fuelefficient, small, and clean cars made with predominantly recyclable material and parts but only ifthey set and enforce appropriate environmental standards (Gallagher 2006; Noble 2006). RecentlyToyota began assembling the Prius hybrid car in China, a technology well suited for China’scities and a technological direction appropriate for a world in which petroleum consumptionthreatens to rapidly overtake the feasible growth in supplies.33
Steel
China’s steel production passed the 349 million ton mark in 2005 making it by far the largestproducer in the world (with 31 percent of the global share) and the fourth largest exporter, withsales of 27 million tons approximately on par with imports.34 The important developments withportent for the future are the extremely rapid increases in capacity—25 percent between 2004 and2005 alone—the increasing concentration of production in large sized modern plants (althoughmany small antiquated facilities remain)35 and the growing technological capacity to produce highquality construction steel, stainless, galvanized, and coated steels and flat products for burgeoningdownstream transport and durable goods industries. These developments point to decliningimports and the scope for higher exports.
Compared to China, India’s total output and per capita consumption is small. By 2004–05,India was producing 38 million tons of steel and its exports of 3.8 million tons approximatelybalanced imports of 3.2 million tons. As India enlarges its transport, engineering and white goodsindustries and modernizes its severely backward infrastructure, the demand is likely to rise as
33 Hyundai is planning to market a hybrid version of its Accent in China by 2008 (“Automotive” 2006).34 In December 2005, China became a net exporter.35 Closing down small inefficient plants and consolidating production in a few giant firms is a government objective(“Attempting a Steel Revolution” 2005).
China and India Reshape Global Industrial Geography
47
sharply as it has done in China. Thus, it is realistic to expect India to produce 55–60 million tonsof steel by 2010 and as much as 120–130 million tons by 2015.
The production trends in China and India will have consequences for the rest of the world.One is that the capacity expansion in China and India will enormously add to the demand for ironore and coking coal (unless production of steel plummets elsewhere) and to the extent that thiscannot be met through the development of local mines and associated transport facilities, it willspillover into imports. Two, Indian production is still largely of mild steels. To a lesser extent sois China’s. Only Tata’s most modern plant is beginning to meet the needs of the auto industry forhot rolled steel.36 A considerable amount of investment, learning and gains in processtechnologies might be needed before even China and certainly India can meet the requirements ofits own advancing transport and engineering industries. For the above reasons, India is not likelyto emerge as a significant exporter of steel, and especially of high tech and specialty steels, duringthe next decade. More probably if infrastructure, housing, and industrial development take-off,India would for a time be an importer of certain types of specialized steels as very likely, wouldChina. However, China is sure to ascend the ranks of steel exporters, edging out the EU25 andpossibly Russia within 5 years.
Electronics
Competition, globalization, indigenization, and powerful policy factors have been the forcesdriving the electronics industries in China and India. Further impetus at least for China has comefrom the outsourcing of manufacturing from Taiwan (China), the U.S., Japan, and Europe in the1990s. However, the development of each country’s electronics industry has been shaped bydifferent industrial policies.
India’s policy framework has focused on technological self-reliance and assigned a limitedrole to foreign investment and to the development of electronic components manufacturing,which has contributed to the success of the industry in Taiwan (China) (Joseph 2004). TheElectronics Commission established in 1971 promoted protectionist policy measures to controlproduction capacity, investment, and imports. The strategy channeled the development of theelectronics industry to the public and small-scale sectors, in addition to regulating the entry andoperation of foreign capital and technology. Discontent with the policies emphasizing self-reliance and with restrictive industrial policies in general, has led to a gradual liberalization of theelectronics industry (Gokarn, Sen, and Vaidya 2004).
By 2004–2005, the production of electronics hardware in India amounted to $11.1 billion ofwhich one-third was from consumer electronics. Leading the increase in consumer electronicsproduction is the production of color TVs, which was over 10 million units in 2004–2005.Gradually the production of color TVs is shifting towards flat screen TV (based on tubes), andmore advanced flat panels such as LCD and Plasma TVs (as it also is in China, althoughmastering the latest generation of this technology is proving difficult for domestic producers).Backward linkages have encouraged investment in some types of component manufacturing, forexample, India is the world’s third largest manufacturer of optical storage media with 18.5percent of the global market. Around 80 percent of the production is exported to 82 differentcountries.
The shipment of PCs in India reached 2.34 million units in the first half of 2005–06, a 36percent increase compared to the same period in 2004–5. The growth of computer production is
36 Tata’s earnings before interest, tax, depreciation and amortization were $293 per ton in 2005, three times the averageof the industry. (“Tata Steel Girds” 2006).
Dancing with Giants: China, India, and the Global Economy
48
driven by the wider adoption of PCs by businesses, various government agencies, and affordablebroadband connections. Currently there are 800,000 broadband subscribers but this is expected toincrease to 10 million by the end of 2007, further fueling the demand for PCs.
China’s path towards achieving a flourishing electronics sector approximates thedevelopment in other NIEs. China has attached strategic importance to the electronics sector fordecades and developed electronics capability over the course of a succession of “Five Year Plans”(FYP), initially to meet defense needs, those of the industrial sector and to a lesser degree, thoseof households for electronic appliances, mainly radios. With increasing consistency it hascompelled foreign investors to transfer technology to local producers and gradually this strategyis yielding results (Rodrik 2006). The seventh (1986–90), eighth (1991–95), and ninth FYP’s(1996–2000) witnessed a dramatic surge in the production of consumer electronic products withan average annual growth rate of around 66 percent. By the ninth FYP (1996–2000), the output ofthe electronics sector amounted to $72 billion, and exports had climbed to around $35 billion.Alongside manufacturing capability, China also strengthened its technological capacity throughinvestment in R&D and was able to develop a number of products such as VLSI devices, thePanda ICCAD system, and rewritable CDs. This period also witnessed the emergence of newcompanies such as Changhong Electric, Tsinghua Tongfang, Caihong Electronics, Panda, andLianxiang, and numerous Taiwanese transplants all of which have since enabled China to becomethe leading manufacturer of color TVs, LCDs, laptops, PCs, color tubes, program controlledswitchboards, cell phones, display devices and monitors (Pecht and Chan 2004).37
By leveraging its low cost labor supplies and the impetus gained from WTO accession,China has doubled the scale of the electronics industry and it accounts for more than 8 percent ofindustrial output—while in India by comparison electronics sub-sector accounts for less than 3percent of a much smaller industrial sector.
In a little more than a decade, China has made the transition from the limited production oflow quality electronic products to partaking in the global production chain for a wide spectrum offinished products and components (Fernandez and Underwood 2006). Today, there are over10,000 foreign-invested firms in China and it is likely that many more foreign componentproducers will relocate because of lower labor costs, tax incentives,38 a large domestic market,and adequate infrastructure. Companies such as Intel and Motorola have taken the lead inpromoting electronics R&D in China—Intel has opened a test and assembly plant in Chengdu andMotorola is investing over half-a-billion dollars in a R&D facility in Beijing. Leading Taiwanesefirms such as Hon Hai Precision and Quanta are doing the same. In addition, Chinese universitieshave created linkages with institutes/universities abroad, and are attempting to gain access toadvanced technologies. The future of China’s electronics industry lies in its ability to transitionfrom a still relatively low skilled, labor-intensive sector towards an IT-enhanced electronicsmanufacturing sector (Sigurdson 2005).
On the other hand, India’s shortcomings in both the private and public sectors have beenmarked by a strong reliance on imported technology and inadequate R&D—a shift from import-induced to R&D-induced technology would be beneficial for the electronics industry. Belatedly,
37 While Chinese companies are catching up, the principal exporters of the high end electronics products such aslaptops and DVDs are Taiwanese companies such as FoxConn, Techfront and Magnificent Brightness (Branstetter andLardy 2006).38 See Yang (2006) who foresees a further expansion of China’s processing trade assisted by the InternationalTechnology Agreement, a part of the WTO accession but does not anticipate a shift of high value components to Chinafor some time. Foreign firms in China receive a tax exemption during the first two years and a 50 percent reduction ofthe full rate for three years due after the first profitable year—this is in contrast to the U.S. and Japan were corporatetax rates are respectively 35 (Federal rate) percent and 42 percent (Pecht and Chan 2004).
China and India Reshape Global Industrial Geography
49
India is now attempting to overcome these by making significant concessions to export-orientedfirms, and as a result India has experienced an increase in exports. But, liberalization is alsoleading to competition from imports and a decline in profits across industry branches. The Indianelectronics industry must now compete with China to gain a share of the gap left by the newlyindustrialized countries (NICs), all the while maintaining its lead in the export of electronicssoftware.39
Concluding Observations
This bird’s eye view of industrial capabilities in China and India leads us to the followingobservations on the evolution of global industrial geography. First that the rapid buildup ofindustrial capability in China across a wide range of subsectors is quite remarkable and showshow the codification of technology, its diffusion through FDI and trade, its harnessing byinvestment in human capital, in plant and equipment in infrastructure and organizational skills,have changed the rules of the game. Catching up and leapfrogging has become easier if countrieshave the policy determination, the ability to mobilize capital and build the infrastructure togenerate skills. Second, larger countries do enjoy scale economies and are better placed to attractFDI and induce MNCs to transfer technology. China has achieved a commanding lead in majorlow, medium, and high tech industries which it may be in a position to consolidate and enlargeover the next decade and a half (Devlin, Estevadeordal, and Rodriguez-Clare 2006; Lall andAlbaladejo 2004; Roland-Holst and Weiss 2005). While many complex capital goods,components and design and research intensive products are likely to remain the preserve of theadvanced countries, China’s industrial strength could put pressure on manufacturing industries inmiddle and low income countries and force them to rethink, narrow and focus their industrialambitions. Survival will depend on achieving industrial and innovation capability that equals orexceeds China’s. Innovation may drive competitiveness and other countries must match or exceedChina’s own investment in its innovation system.
India is likely to be a major force in the software, business processes and consultingindustries including design and engineering services competing not so much with the leaders suchas the U.S., Germany, and Japan but with the mid-range and lower-end players, including Chinawhich might soon enjoy an edge in terms of the volume of technical skills. India is certain tobuild manufacturing capability but at least during the coming decade, there is only a slim prospectof it emerging as an exporter on the scale of China in mass produced consumer products in keyindustries such as electronics, autos and auto parts. More likely it could emerge as a force incertain kinds of engineering products and services that leverage its skill base including softwareskills. India’s many institutional bottlenecks, gaps in the infrastructure and emerging shortages ofskills will remain a drag on industrial advance.
There is no doubt that China will be a formidable competitor for labor intensivemanufactures that depend on semi-skilled, disciplined, and low wage work force for at leastanother decade, and India, if the domestic and international regulatory environment allows it, canbecome a major competitor in this area as well.40
39 Signs that India is attracting the MNCs are supported by IBM’s announced intention of investing $6 billion in Indiaand the investment of $3.9 billion by Microsoft, Intel and Cisco (“IBM to Build” 2006).40 Recent trends also suggest that the two countries could develop significant bilateral trade links as well (Wu and Zhou2006).
Dancing with Giants: China, India, and the Global Economy
50
The world, however, is not going to be divided into China and India as the main suppliers tothe world market of manufactures and business services while the rest of the world specializes innatural resource and arable land based products. The world has not repealed the theory ofcomparative advantage. China’s very success in so many areas of manufacturing points to theforces that are going to gradually change China’s competitive position. Wages in the coastal areasof China are already rising to a level sufficient to reduce the country’s competitiveness at thelabor intensive end. Movement of these plants to areas where wages are still low will postponethe day when China will have to abandon many of these sectors, but the rapid movement ofworkers to China’s cities will raise incomes in the countryside and will thereby force up wages inthe nation’s interior as well. Indian low wage manufacturers (along with those in other low wagecountries), with the right policies, may be major beneficiaries of China’s rising wages just asChina benefited from the rapid increase in wages in Korea, Taiwan (China) and Hong Kong(China) over the past two plus decades.
India, in these respects, is in a very different position than China. With the right mix ofpolicies, India’s labor intensive manufactures can benefit significantly from China’s rising wagesand revaluing currency. India could become a major world exporter on the scale of China and willover time experience rapidly rising wages, but that is not a realistic prospect over the comingdecade.
Finally, one must be careful not to assume that because China and India can producehundreds of thousands of scientists and engineers each year, that they will soon dominate the highend of all manufactures and services world wide. Because China and India are very largecountries with rapidly expanding modern industrial and service sectors, they require a largenumber of engineers and scientists to staff a wide range of activities in their own countries. Chinaand India will be able to create and in some cases already have created world class research in themore advanced technologies, but they do have the qualified personnel to do this in only limitedareas.
References
“Air-conditioners Wilt under Cold Blast of Competition in China” 2005. Financial Times,September 24.
“An Alpha Delta.” 2006. Financial Times, May 8.
“An Urgent Political and Moral Imperative.” 2006. Financial Times, April 24.
Ananthakrishnan, Prasad, and Sonali Jain-Chandra. 2005. “The Impact on India of TradeLiberalization in the Textiles and Clothing Sector.” IMF Working Paper WP/05/214.Washington, DC: International Monetary Fund.
Arora, Ashish and Suma Athreye. 2001. “The Software Industry and India’s EconomicDevelopment.” WIDER Discussion Paper 2001/20. Helsinki: UNU/WIDER.
Arora, Ashish and Alfonso Gambardella. 2004. “The Globalization of the Software Industry:Perspectives and Opportunities for Developed and Developing Countries.” NBER WorkingPaper 10538. Cambridge, MA: National Bureau of Economic Research.
“Attempting a Steel Revolution.” 2005. Business China, May 23.
“Automotive.” 2006. Business China.
China and India Reshape Global Industrial Geography
51
Balakrishnan, Karthik, Ananth Iyer, Sridhar Seshadri, and Anshul Sehopuri. 2006. “Indian AutoSupply Chain at the Cross-Roads.” Processed. West Lafayette, IN: Purdue University.
“Big Players in Chip Design Buy Into India.” 2006. IEEE Spectrum, March.
Branstetter, Lee and Nicholas Lardy. 2006. “China’s Embrace of Globalization.” NBER WorkingPaper 12373. Cambridge, MA: National Bureau of Economic Research.
Chan, Sarah, and Gu Qingyang. 2006. “Investment in China Migrates Inland.” Far EasternEconomic Review (May).
Chaudhuri, Sudip. 2004. “The Pharmaceutical Industry,” in The Structure of Indian Industry, ed.Subir Gokarn, Anindya Sen, and Rajendra R. Vaidya. New York: Oxford University Press.
Chen, Kun and Martin Kenney. 2006. “Universities/Research Institutes and Regional InnovationSystems: The Cases of Beijing and Shenzhen.” World Development.
“China Looms Large.” 2006. “China Looms Large on India’s Pharma Frontier.” Bain &Company,http://www.bain.com/bainweb/publications/in_the_news_detail.asp?id=24912&menu_url=for_the_media.asp.
“China: Pharmaceuticals Sector has Unrealized Potential.” 2005. Oxford Analytica, September 8.
“China’s Hi-Tech Success Is Not Patently Obvious.” 2005. Financial Times, October 25.
“China: New Roads Will End Isolation, Improve Lives.” 2006. Oxford Analytica, February 8.
“China: Rapid Growth Puts Road Network under Strain.” 2005. Oxford Analytica, May 26.
“Chinese Fridge Magnate Becomes Hot Property.” 2005. Financial Times, November 18.
Clarke, George R., and Scott J. Wallsten. July 2006. “Has the Internet Increased Trade?Developed and Developing Country Evidence.” Economic Inquiry 44(3): 465–484.
Cooper, Richard N. 2006. “How Integrated Are Chinese and Indian Labor into the WorldEconomy?” Processed. Washington, DC: World Bank.
D’Costa, Anthony. 2006. “Exports, University-Industry Linkages, and Innovation Challenges inBangalore, India.” World Bank Policy Research Working Paper 3887. Washington, DC:World Bank.
Department of Trade and Industry, UK 2005. The 2005 R&D Scoreboard. London, UK:Department of Trade and Industry, UK.
Devlin, Robert, Antoni Estevadeordal, and Andres Rodriguez-Clare 2006. The Emergence ofChina: Opportunities and Challenges for Latin America and the Caribbean. Washington,D.C.: Inter-American Development Bank.
Dollar, David, Shi, Anqing, Wang, Shuilin, Xu, Lixin Colin. 2003. Improving CityCompetitiveness Through the Investment Climate: Ranking 23 Chinese Cities. Washington,DC: World Bank.
Farrell, Diana and Aneta Marcheva Key. 2005. “India’s Lagging Financial System.” TheMcKinsey Quarterly 2.
Fernandez, Juan Antonio and Laurie Underwood 2006. China CEO. Singapore: John Wiley andSons.
Dancing with Giants: China, India, and the Global Economy
52
“Figures Show China as Net Vehicle Exporter.” 2006. Financial Times, February 11.
Gallagher, Sims Kelly. 2006. “Limits to Leapfrogging in Energy Technologies? Evidence Fromthe Chinese Automobile Industry.” Energy Policy 34(4): 383–394.
“Global Transformation” 2006. Business China, June 19.
Gokarn, Subir, Anindya Sen, and Rajendra R. Vaidya (eds.) 2004. The Structure of IndianIndustry. New York: Oxford University Press.
Gokarn, Subir, and Rajendra R. Vaidya. 2004. “The Automobile Components Industry,” in TheStructure of Indian Industry, ed. Subir Gokarn, Anindya Sen, and Rajendra R. Vaidya. NewYork: Oxford University Press.
Gordon, James and Poonam Gupta. 2005. “Understanding India’s Services Revolution,” in Tseng,Wanda and David Cowen (eds.), India’s and China’s Recent Experience With Reform andGrowth. New York: Palgrave Macmillan.
Grace, Cheri. 2005. “A Briefing Paper for DFID: Update on China and India and Access toMedicines.” DFID. London: DFID.
“Haier to Create 1,000 Jobs in Kershaw County.” 2006. The State, April 11.
“Here Comes the Wal-Mart Wannabes.” 2005. BusinessWeek, April 4.
Ho, Mun S., Dale. W. Jorgenson, and Dwight H. Perkins. 1998. “China’s Economic Growth andCarbon Emissions,” in McElroy, Michael, Chris Nielsen, and Peter Lydon (eds.), EnergizingChina: Reconciling Environmental Protection and Economic Growth. Harvard UniversityPress.
“Honda to Invest $652m in Drive on Indian Market.” 2006. Financial Times, July 5.
Huang, Yasheng, and Tarun Khanna. 2005. “Indigenous Versus Foreign Business Models,” inAsia’s Giants: Comparing China and India, ed. Edward Friedman and Bruce Gilley. NewYork: Palgrave MacMillan.
“IBM to Build its Presence in India with $6bn Investment.” 2006. Financial Times, June 7.
“India: China Eats into Textile Exports.” 2005. Oxford Analytica, May 20.
“India: Poor Infrastructure Hampers Urban Growth.” 2006. Oxford Analytica, July 11.
“India: Risks Mount Alongside Growth.” 2006. Oxford Analytica.
“Japanese White Goods Get High Recognition in India” 2006. Jiji Press, April 17.
Joseph, K. J. 2004. “The Electronics Industry,” in The Structure of Indian Industry, ed. SubirGokarn, Anindya Sen, and Rajendra R. Vaidya. New York: Oxford University Press.
Khanna, Tarun and Krishna Palepu. 2004. “The Evolution of Concentrated Ownership in IndiaBroad Patterns and a History of the Indian Software Industry.” NBER Working Paper10613. Cambridge, MA: National Bureau of Economic Research.
KPMG International. 2006. Manufacturing in India: Opportunities, Challenges, and Myths.Report No. 211–786.
Lall, Sanjaya and Manuel Albaladejo. 2004. “China’s Competitive Performance: A Threat to EastAsian Manufactured Exports?” World Development 32(9): 1441–1466.
“Life on the Web’s Factory Floor.” 2006. BusinessWeek, May 22.
China and India Reshape Global Industrial Geography
53
Ma, Jun, Nam Ngyuen, and Jin Xu. 2006a. China’s Innovation Drive. Hong Kong: DeutscheBank.
————. 2006b. China’s Innovation Drive. Hong Kong: Deutsche Bank.
Min, Weifang. Recent Trends of Higher Education Development in China. 5-8-2006.
Mukherji, Joydeep. 2005. “The Causes of Differential Development: Beyond RegimeDichotomies,” in Asia’s Giants: Comparing China and India, ed. Edward Friedman andBruce Gilley. New York: Palgrave MacMillan.
Nichols, Theo and Surhan Cam. 2005. “The World of White Goods: Markets, Industry Structureand Dynamics,” in Nichols, Theo and Surhan Cam (eds.), Labour in a Global World: CaseStudies From the White Goods Industry in Africa, South America, East Asia and Europe.New York: Palgrave McMillan, 1–22.
Noble, Gregory W. 2006. “The Emergence of the Chinese and Indian Automobile Industries andImplications for Other Developing Countries.” Processed. Washington, DC: World Bank.
“Now for the Hard Part.” 2006. The Economist, June 3.
Padhi, Asutosh, Geert Pauwels, and Charlie Taylor. October 2004. “Freeing India’s TextileIndustry.” McKinsey Quarterly.
Panagariya, Arvind. 2006. “India and China: Trade and Foreign Investment.” Processed. NewYork: Columbia University.
Pecht, Michael and Y. C. Chan 2004. China’s Electronics Industry. College Park, Maryland:CALCE EPSC Press.
Petri, Peter A. April 2006. “Is East Asia Becoming More Interdependent?” Journal of AsianEconomics 17(3): 381–394.
Radhakrishnan, K. G. 2006. “India’s Adolescent Software Industry.” Far Eastern EconomicReview.
Rawski, Thomas. 2006. “International Dimensions of China’s Long Boom: Trend’s Prospects,and Implications.” Presented at Yale East Asia Forum on Political Economy, New Haven,CT, May 31.
Rodrik, Dani. 2006. “What’s So Special About China’s Exports?” Processed. Cambridge, MA:Harvard.
Roland-Holst, David and John Weiss. 2005. “People’s Republic of China and Its Neighbors:Evidence on Regional Trade and Investment Effects.” Asia-Pacific Economic Literature19(2): 18–35.
Roy, Tirthankar. 2004. “The Textile Industry,” in The Structure of Indian Industry, ed. SubirGokarn, Anindya Sen, and Rajendra R. Vaidya. New York: Oxford University Press.
“Sanyo Seeks India Boost.” 2006. Nihon Keizai Shimbun, April 3.
Saxenian, AnnaLee 2006. The New Argonauts. Cambridge, MA: Harvard University Press.
Schiff, Jerald, Fernandez, Enric, Kohli, Renu, Mohapata, Sudip, Purfield, Catriona, Flanagan,Mark, Rozhkov, Dimitri. 2006. “India: Selected Issues.” Report No. IMF Country ReportNo. 06/56.
“Selling Generics Used To Be So Easy.” 2006. BusinessWeek, February 27.
Dancing with Giants: China, India, and the Global Economy
54
“Sharp India Chalking Out Come Back Plan.” 2006. Economic Times, April 25.
Sigurdson, Jon 2005. Technological Superpower China. Northampton, MA: Edward ElgarPublishing.
“Smooth Drive.” 2006. Economic and Political Weekly, February 25.
Srinivasan, T. N. 2003. “China and India: Economic Performance, Competition, and Cooperation,An Update.” Stanford Center for International Development Working Paper 199. Palo Alto,CA: Stanford University.
————. 2006. “China, India, and the World Economy.” Processed. Washington, DC: WorldBank.
Sull, Donald N. and Yong Wang 2005. Made in China: What Western Managers Can LearnFrom Trailblazing Chinese Entrepreneurs. Boston, MA: Harvard Business School Press.
Sutton, John. 2004. “The Auto-Component Supply Chain in China and India: A BenchmarkingStudy.” Processed. London: STICERD, London School of Economics.
Swamy, Subramanian. 2005. “Chasing China: Can India Bridge the Gap?” in Asia’s Giants:Comparing China and India, ed. Edward Friedman and Bruce Gilley. New York: PalgraveMacMillan.
Tan, Kong-Yam. 2004. “Market Fragmentation and Impact on Economics Growth.” Prepared forthe 11th Five Year Plan of China. Washington, DC: World Bank.
“Tata Steel Girds Itself to Meet Indian Demand with Good Technology and Access to CheapOre.” 2006. Financial Times, March 24.
“Telecoms and Technology.” 2006. Business China, June 5.
“Today India, Tomorrow the World.” 2005. The Economist, April 2.
“Toshiba Forays into Indian Home Appliances Market.” 2006. Business Line, May 5.
“Up to the Job? How India and China Risk Being Stifled by a Skills Squeeze.” 2006. FinancialTimes, July 20.
“Watch Out, India.” 2006. The Economist, May 6.
Whalley, John. 2006. “The Post MFA Performance of Developing Asia.” NBER Working Paper12178. Cambridge, MA: National Bureau of Economic Research.
World Bank 2004. India Investment Climate Assessment 2004: Improving ManufacturingCompetitiveness. Washington, DC: World Bank.
————. 2006. “World Bank Office, Beijing: Quarterly Update.” Beijing: World Bank.
Wu, Yanrui and Zhangyue Zhou. April 2006. “Changing Bilateral Trade Between China andIndia.” Journal of Asian Economics 17(3): 509–518.
Yang, Yongzheng. 2006. “China’s Integration into the World Economy: Implications forDeveloping Countries.” Asia-Pacific Economic Literature 20(1): 40–56.
Yusuf, Shahid and Kaoru Nabeshima 2006a. Post Industrial East Asian Cities. Stanford, CA:Stanford University Press.
————. 2006b. China’s Development Priorities. Washington, DC: World Bank.
China and India Reshape Global Industrial Geography
55
Yusuf, Shahid, Shuilin Wang, and Kaoru Nabeshima. 2005. “Fiscal Policies for Innovation.”Processed. Washington, DC: World Bank.
Zhao, Wei, Theo Nichols, and Surhan Cam. 2005. “China: White Goods and the CapitalistTransformation,” in Nichols, Theo and Surhan Cam (eds.), Labour in a Global World: CaseStudies From the White Goods Industry in Africa, South America, East Asia and Europe.New York: Palgrave McMillan, 92–119.
Zhou, Ping and Loet Leydesdorff. 2006. “The Emergence of China As a Leading Nation inScience.” Research Policy 35(1): 83–104.