Embed Size (px)
Citation preview

Munich Personal RePEc Archive
The impact of tariff rates on the
probability of trade relationships
survival: evidence from ASEAN+6
manufactured goods
Lin, Chin-Ho
19 December 2015
Online at https://mpra.ub.uni-muenchen.de/71260/
MPRA Paper No. 71260, posted 14 May 2016 09:49 UTC

The impact of tariff rates on the probability of trade
relationships survival: evidence from ASEAN+6
manufactured goods
Chin-Ho Lin
Graduate School of Economics, Keio University, 2-15-45 Mita, Minato-ku, Tokyo,
108-8345, Japan
E-mail: [email protected]
This article explores the links between imported trade relationships, duration, and tariff rates. We
investigate how the probability of survival of trade relationships affected due to the difference in the
tariff rates based on survival analysis. Using ASEAN+6 as the reporter with 89 trading partners on
manufactured goods from 1996 to 2011. A series of findings are as follows. First, low-tariff trade
survives longer than high-tariff trade on manufactured goods. Second, a significantly negative
correlation between tariff rates and duration is evidenced, which increases around 4% hazard ratios.
Also, the reduction of tariff rates in intra-regional trade is helpful to prolong the length of trade
relationships. Third, low tariff rates have 9.1% lower hazard ratios. We also obtain robust results in
production networks and Rauch product’s classification. Finally, we consider these findings could
be the references for other economic organizations, which is aimed at the diminution of tariff rates.

I. Introduction
When survival analysis was first applied in international trade (Besedeš and
Prusa, 2006a, 2006b), many studies started to concentrate on the issue of trade
relationships, examining the probability of survival in the duration of relationships
with trading partners. The survival and death of trade relationships depend on whether
positive trade values exist in country-product pairs without question. Besedeš (2008)
indicates that higher initial export value is associated with the positive duration of
trade relationships. Besides, intensive margin has a significant effect on export growth
and further spreads the duration of trade relationships (Besedeš and Prusa, 2007;
Helpman, Melitz, and Rubinstein 2008; Felbermayr and Kohler, 2006).
Other essential factors may affect the volume of trade values, directly
impacting things like costs. For example, sunk costs significantly affect firm
performance on the probability of exports as well as entry costs (Roberts and Tybout,
1997; Bernard and Jensen, 1999, 2004; Impullittia, Irarrazabal, and Opromolla 2013);
trade costs have fallen given the trade value increase (Bridgman, 2013; Novy, 2013).
As previously mentioned, those studies do not directly explore the impact of costs on
the probability of trade relationships survival, particularly as this impact is defined in
survival analysis.
Fugazza and Molina (2011) use the time required to export as a proxy for export
costs and import as a proxy for import costs, investigating the impact of per-period
fixed costs to the duration of trade relationships by employing survival analysis. He
also mentioned that higher tariff rates accompany lower hazards for the duration of
trade relationships because of less competition for incumbent firms; this result is also
in line with Besedeš and Prusa (2006b). In other words, they evidence the significant
positive relationship between tariff rates and durations of trade relationships.
Tariff rates could be seen as transaction cost, which is an effective tool of
protection for domestic and foreign firms. However, we infer if firms face tariff
rates too high to afford, possibly leading to the exit of trade due to high export/import
costs. It is intuitive that high tariff causes the reduction of trade value1 which means
negative correlations with trade values. Based on this concept, presumably, tariff rates
cause a negative effect on the duration of trade relationships, instead of positive
correlations that evidenced by previous studies. In short, we set the hypothesis that
1 This intuition is evidenced by Hayakawa (2013), which investigates the impact of omitting bilateral
tariff rates employed in the gravity model. Also, Florensa et al. (2015) indicate that high tariffs cause a
negative effect for intermediate goods in the exports of Latin America.

low tariff rates of trade relationships are more likely to survive. Moreover, we
consider the fact that once the trade relationships are formed or when products are
traded, each country's each product corresponds varied tariff rates and changes over
time. In other words, tariff rates are distinct according to the type of products as well
as the trading partners. For example, a variety of tariff rates are possible in parts and
components as well as in differentiated products, reference prices, or homogeneous
goods. Similarly, international trade agreements and regional integration also lead the
difference of the tariff rates.
With the development of multilateral trade negotiation, increased importance has
been attached to regional economic integration. The evolution of ASEAN members
increased from its initial ten member nations to ASEAN+3 and further expanded to
ASEAN+6. At this moment, ASEAN+6 has become one of the largest economies,
particularly with her extensive scale, influential economic strength, and abundant
population. The basic aim of regional trade agreements (RTAs) is to promote trade
liberalization in intraregional trade through tariff diminution. The difference of tariff
rates is likely to shock the stability of trade relationships with upstream and
downstream trading partners caused a collapse in international production networks.
In particular, international production networks in East Asia have been played a
significant role in transactions in intra-regional trade (Athukorala, 2010). In other
words, the correlation between regional trade and tariff rates is pertinently considered.
We set ASEAN+6 as the reporter and 89 countries2 as the trading partners,
including intraregional and interregional trade from 1996 to 2011 to be our samples
and follow two steps. First, tariff rates are included to investigate the impact of tariffs
on the probability of the survival of trade relationships in imports and further
expand its application to the type of products that previous studies ignore (i.e.
production networks and Rauch product’s classification)3, based on Kaplan–Meier
estimation. To do this, we deal with the data management of tariff rates according to
the strategy of Hayakawa (2013) and then further expand on the decomposition of the
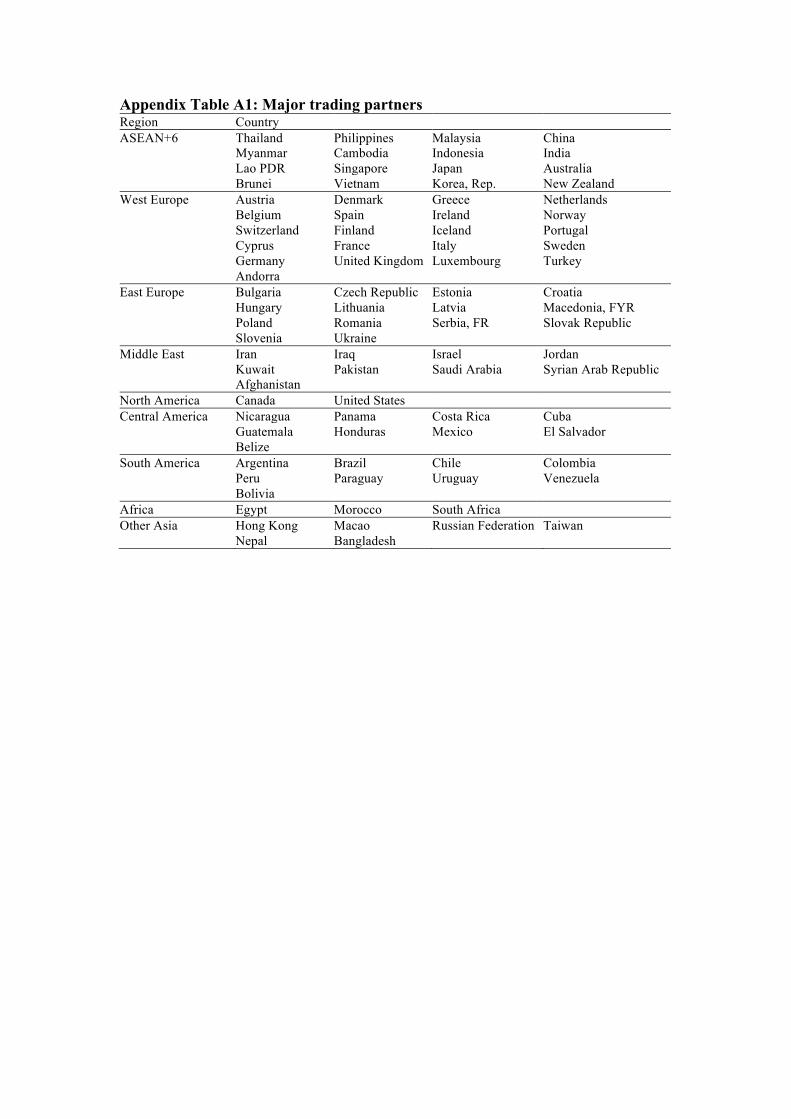
2 The trading partners are divided into nine regions, such as ASEAN+6, East Europe, West Europe,
Middle East, North America, Central America, South America, Africa and other Asian countries. See
more detail in Appendix Table A1. 3 Besedeš and Prusa (2006b), and Fugazza and Molina (2011) only present a positive correlation
between tariff rates and the duration of trade relationships but do not discuss the impact of tariff by the
type of product, as well as the mention in production networks. In addition, we expect that tariff rates
and the duration of trade relationships have a negative correlation, unlike their results. Obashi (2010,
2011), Ando and Kimura (2012), and Okubo, Kimura, and Teshima (2014) only indicate parts and
components are longer-lived than final products. Nevertheless, they do not explore the impact of the
tariff rates on the survival rates, and the relationships between tariff rates and duration of trade
relationships in production networks.

tariff as high and low tariff rates. Second, we exploit the Cox proportional hazards
model to re-investigate the correlation between tariff rates and the duration of trade
relationships. Otherwise, we also verify whether low tariff rates exist lower hazard
ratio compared to high tariff rates.
This article is organized as follows. Section II explains the management of tariff
rates. Section III presents the empirical strategy. Section IV provides the empirical
results in the Kaplan-Meier estimation and the Cox proportional hazard model.
Section V discusses the influence for upcoming integrated economic organizations.
Section VI concludes.
II. The Management of Database
In this section, we explain how we construct the database of the tariff rates. We
manage the tariff data by following the strategy of Hayakawa (2013). First, the
database is obtained from World Integrated Trade Solution (WITS) based on the
TRAINS database, which only consisted of ad valorem rather than non-ad valorem
tariff rates in order to avoid the tariff schemes becoming complicated. Second, the
lowest tariff is selected depending on importers, exporters, products, and years even
though multiple tariff schemes are available. For example, if exporter face MFN
applied rates and preferential tariffs for the specific products in particular years, the
lower tariff duty type will be chosen4. Third, missing data of the tariff rates is possible.
Some cases may report the import value but not report tariff rates. To solve this
problem, we replace the missing year by employing the nearest previous year that
tariff schemes are available5. Fourth, four types of HS classification have been
observed in our samples, i.e. HS1992, HS1996, HS2002, and HS2007. We convert all
varied version of HS classification to HS1992, by employing a conversion table6.
Consequently, we obtain the tariff data at the six-digit product level of the HS1992
classification.
Survival analysis employed in international trade studies refers to trade in a
single period of consecutive years until exit (Nitsch, V., 2009; Besedeš and Blyde,
4 Hayakawa (2013) assumes that all firms always chose the lowest rates, but some firms may use
higher tariff rates due to higher fixed costs for preferential tariff rates (Demidova and Krishna, 2008). 5 Only Cambodia as the reporter uses the nearest later year of tariff rates between 1996 and 2000 due
to the data availability from WITS. 6 Our analysis period is from 1996 to 2011 due to the availability of the conversion table. HS
classification is transformed again to HS2012 after 2012; however, related conversion table to HS1992
in official version is not confirmed.
2010). To insert tariff rates into the survival analysis, tariff data is matched with trade
data, which is obtained from United Nations Commodity Trade Statistics Database
(UN Comtrade) at the six-digit product level. In other words, each traded product
corresponds its specific tariff rate in each destination as well as in particular year.
Then, we take a simple average over the life period of a trade relationship. For
example, suppose that imports are active in three consecutive years, corresponded
with 3%, 2%, and 1% tariff rates for each year, then the average tariff rate is 2% for
this life period of the imported trade relationship. After taking the average tariff rate
for each country-product pair, we decompose tariff rates into high and low tariff rates
by using the median of average tariff rates. If the average tariff rates of products are
higher than those of median tariff rates, those products are defined as high tariff
products; on the contrary, another group belongs to low tariff products. In sum, the
tariff rates employed survival analysis is completed, through a series of data
management.
The basic concept of the survival analysis is to measure the length of the trade
relationships with trading partners. This duration of the trade relationship is defined as
a “spell” in the literature on the survival analysis employed in trade. For instance, if
Japan imports a particular good from a given country in six consecutive years, this is
defined as one spell with a length of six years. However, trade may restart in the
importing market, meaning the trade relationships have ever been disrupted. An
example is if a particular product is imported from 1996 to 2000 and then
discontinued until imported again from 2008 to 2011. One spell has a length of four
consecutive years, and another one is a spell with three consecutive years7. In our
samples, the total independent spells are 2 755 420 for manufactured goods8. Sources
of Distance, Common language, and Colony are obtained from CEPII database. As
for sources for Gross Domestic Product per Capita, GDP per capita of exporter are
obtained from the World Bank.
III. Theoretical Model
Regarding the statistical techniques of the survival analysis, the traditional
Kaplan–Meier estimation and the Cox proportional hazards model are commonly
7 The multiple spells are viewed as two independent spells (Besedeš and Prusa, 2006a, 2006b).
8 Initial samples include 472 875 country-product pairs for non-manufactured goods. We also test the
comparison between manufactured and non-manufactured goods by using the effect of the tariff cut,
inspecting that manufactured goods with low tariff rates survive longer relative to other specifications,
but not reported.

employed in trade. The objective of the former is to calculate the survival rate based
on the duration of trade relationships. The latter is mainly to investigate which
determinants can significantly affect the duration.
Assume T be a random variable referring time to the failure event9, and t
expresses that it has already survived the consecutive years. The survival function of
T, S(t), is given as
S t = 𝑝 𝑇 ≥ 𝑡 1
The non-parametric estimate of survival function is driven by Kaplan-Meier
estimation:
𝑆 𝑡 =!!!!!
!!!!!!
(2)
where 𝑛! means that the number of country-product pairs is at risk at time 𝑡!, and 𝑑!
indicates the number of country-product pairs that trade relationships have broken off.
Besides, the hazard function is considered as the alternative way to express the hazard
rate at which trade relationships end.
h 𝑡! = 𝑝 𝑇 = 𝑡! 𝑇 ≥ 𝑡! 3
The non-parametric estimator of the hazard function is given as
h 𝑡! =𝑑!
𝑛!
4
Then, the survival and hazard functions have specific relationships while the
hazard rate is too high (low) to survive (die in) trade relationships.
S t! = 1− h(t!)!!!!
(5)
Besedeš and Prusa (2006b) wrote the first article exploring the determinants that
affect the duration by employing the Cox proportional hazards model10
, which was
proposed by Cox (1972).
h t x! = h! t ℯ!!! (6)
where x means country-product specific covariates and the coefficient β are estimated
from the database in the regression. The baseline hazard rate function, h! t , is
9 Our data consists of complete and censored data. The former indicates that a failure event is observed
during the analysis period, but not to be observed for the latter data. Two types of censored data are left
and right censoring, respectively. For simplicity, we set the dummy of failure event equal to zero while
no failure event appeared in the right censoring data. 10
Cox proportional hazards model is the popular technique employed in survival analysis. Given that
the distribution of hazard is uncertain, the advantage of the Cox model is that there are no necessary
assumptions for hazard functions.

non-parametric and left unestimated. If all covariates are zero, the baseline hazard is
presented. The hazard ratio is smaller (higher) than one, which is likely to cause the
negative (positive) relationship with the hazard rate. In other words, a positive
(negative) effect on the duration is caused while a lower (higher) hazard rate is
presented. A ratio equals to one, meaning a specific covariate has no impact on trade
relationships. Tariffs, the dummy variables for the type of the products, regional
effect11
and other explanatory variables based on gravity literature are included. The
variables used are logarithmic12
.
IV. Estimation Results
The first step of this section investigates the survival rate of imported trade
relationships in ASEAN+6 with trading partners, highlighting the impact of tariff
rates in intraregional and interregional trade, by employing the Kaplan–Meier
estimation. The second step of this section applies survival analyses to examine
whether the covariates of product-specific and country-specific characteristics cause
the difference in the duration of trade by the Cox proportional hazard model.
Kaplan–Meier estimates
Inclusion of tariff rates on the manufactured goods. Table 1 reports the probability
of the survival of trade relationships on intraregional and interregional manufactured
goods without considering the effect of the tariff rates. The result evidences that the
imported trade relationships of ASEAN+6 on manufactured goods survive longer in
intraregional trade compared to those in other regions except North America. Other
regions such as West Europe and other Asian countries are also significant trading
partners/regions in imports. There is no doubt that these four regions are major
exported sources of manufactured goods and effectively support the stability of trade
relationships.
<Insert Table 1>
In the view that the tariff rates may potentially affect the duration of trade
relationships, the inclusion of the tariff effect is presented in Table 2. Overall, we find
that the country-product pairs with high-tariffs are greater than those with low-tariff
11 Note that our tariff data is shown under product line at the six-digit level between reporters and
trading partners, which includes the characteristic of products, as well as the effect of
importer-exporter. 12
The log of the tariff is presented as ln (1+Tariff). See Hayakawa (2013) and Florensa et al. (2015).
products. Obviously, we evidence the difference in duration13
after including the
tariff effect. The trade relationships with low tariffs are longer-lived, relative to those
with high tariffs. In other words, the country-product pairs with high tariff accompany
with large possibility breaking the trade relationships off. In the case of ASEAN+6 in
intra-regional trade, the probability of survival is approximately 58.22% in the first
year and only 19.22% in the fifteenth year, without considering the tariff effect.
However, after dividing country-product pairs into high and low tariffs, low-tariff
trade relationships rise up to 60.04% probability of survival in the first year and
24.24% probability of survival in the fifteenth year, relative to trade relationships with
high tariffs, which exhibit 56.62% survival in the first year and only 15.12% in the
fifteenth year. Through the tariff's effect on the duration of trade relationships, we
obtain inspiring evidence that low tariffs are likely to improve the connection of trade
relationships significantly.
< Insert Table 2>
International production networks. As previously mentioned, survival analysis
applied to the international production networks has verified that parts and
components14
are longer-lived than final products in duration of the trade
relationships (Obashi, 2010, 2011; Ando and Kimura, 2012; Okubo, Kimura, and
Teshima 2014). However, we mention that even parts and components include high-
and low-tariff products as well as final products. Therefore, it is reasonable to
distinguish the impact of the tariff on the probability of survival in international
production networks, which is presented in Table 3. We find that parts and
components still display a higher survival rate than final products do based on the
same tariff levels. As for the impact of inclusion, parts and components with low
tariffs survive longer than those with the high tariff, and similar results for final
products with low tariffs compared to those with high tariffs. In particular, final
products with low tariffs show a higher survival rate in the fifteen years, relative to
parts and components with high tariffs. Those results are in evidence of a noticeable
difference in survival rate even among products with distinct and similar attributes
over time. The aim of regional integration in ASEAN+6 is to eliminate the tariff
barrier in order to enhance trade flow more freely. Table 4 further explains the
difference in survival probability for inter-regional and intra-regional trade
13 To compare the differences in survival rates for distinct types of products, we use the log-rank test
to verify whether significant differences exist, and our tests are statistically significant and robust. 14
The machinery products of parts and components, as well as final products, are defined according to
Ando and Kimura (2005).

relationships in ASEAN+6 production networks. Overall, intra-regional trade
relationships show a higher survival rate in terms of parts, components, and final
products compared to corresponding specifications in inter-regional trade. Besides,
parts and components with low tariffs in regional trade exhibit the highest survival
rate, 34.7% in the fifteenth year.
< Insert Table 3>
< Insert Table 4>
Rauch product’s classification. This section complements the influence that tariff
rates attack the probability of survival applied in Rauch product’s
classification15
, which Besedeš and Prusa (2006b) as well as Fugazza and Molina
(2011) ignore. The overall results are consistent with their findings that differentiated
goods survive longer than reference-priced and homogeneous goods. However,
further evidence has confirmed again that low tariff rates are likely to continue trade
relationships for all products. In particular, reference-priced goods with low tariffs
present a higher survival rate compared to differentiated goods with high tariffs,
verifying a significant impact due to the difference in tariff rates. Nevertheless,
differentiated goods with low tariffs express a higher probability of survival at any
point in time.
< Insert Table 5>
Fig. 1 graphs survival functions for manufactured goods as well as production
networks and Rauch’s product classification, based on the difference of tariffs and
regional trade. Overall, the survival curve is displayed as a decreasing zigzag
pattern with negative slopes. Survival rates decrease as time increases. All
specifications show that low-tariff trade has a higher survival rate compared to
high-tariff trade. With respect to manufactured goods, the gap in survival rates
between low and high tariffs displays its largest difference around the eighth
year and does not spread afterwards. As for the regional trade for manufactured goods,
ASEAN+6 shows a relatively higher survival rate than other regions, except for North
America, which possesses close economic trade relationships with East Asia.
Nevertheless, the gap in survival rate between ASEAN+6 and North America
decreases over time. Moving attention to production networks in intra- and
inter-ASEAN+6, low-tariff trade of parts and components in intra-regional trade
15 Homogeneous, reference priced goods and differentiated products are defined by Rauch product’s
classification on manufactured goods.

exhibits higher survival rates than others, particularly as the gap in survival rate gets
larger and larger over time. Since previous studies have evidenced that parts and
components have a higher survival probability than final products, we further indicate
that tariff cuts have a leading effect on the difference in survival rate, even in parts
and components trade with high tariffs. The last survival function graphed is based on
Rauch's product classification; again, the effect of a tariff cut is clearly identified; for
example, the low-tariff trade of reference-priced goods survives longer than
the high-tariff trade of differentiated goods, but the low-tariff trade of differentiated
goods achieves the highest survival rate.
<Fig. 1>
Cox proportional hazard model
Table 6 explains how the duration of trade relationships essentially influenced
through related covariates by employing Cox proportional hazard model. Columns (1)
reports the results based on gravity covariates. Columns (2) holds crucial explanatory
variable, tariff rates, investigating the influence of the duration. Intraregional effect is
presented in Columns (3). As for Columns (4) considers regional dummies to examine
the difference in trade relationships. All estimated coefficients are expressed as
hazard ratios, and standard errors show in parentheses.
< Insert Table 6>
All gravity covariates estimated in Columns (1) are according with the expected
signs and are statistically significant. That means common language, colonial
background, and exporters’ GDP per capita are the negative correlation with hazards,
indicating the positive effect of the duration of trade relationships. In addition,
distance shows the negative impact significantly for the duration of trade relationships.
In other words, the closer distance between exporter and importer is likely to maintain
the duration of trade relationships; conversely, far distance is likely to disrupt the
trade relationships. Columns (2) introduces the tariff rates and support our previous
hypothesis that tariff rates are induced to the negative impact with the duration of
trade relationships16
. This finding is not consistent with the result of previous studies.
However, we consider trade relationships may be discontinued due to too high tariff
16 This result is robust while we did the robustness check for the single spell, first spell, and one-year
gap adjustment for manufactured goods as well as similar specifications for production networks and
for Rauch product’s classification.

rates that firms are not able to afford. Consequently, reduction of tariff rates is
conductive to enhance the duration of trade relationships.
We find the effect of intra-regional trade contributes to expanding the length of
trade relationships, which is reported in Columns (3). In other words, intra-regional
trade shows a 19.4 lower hazard ratio, compared to inter-regional trade. As for
regional dummies are included in Columns (4). We find ASEAN+6, West Europe,
and North America have lower hazard ratios, relative to other regions such as East
Europe, Central America, South America, Middle East, and Africa. This evidence is
completely reflected from the results of Kaplan–Meier estimates.
Through the finding of estimated results on the manufactured goods based on the
effect of related covariates, we wonder whether this experience can be duplicated
consist results in international production networks, as well as the type of product in
Rauch product’s classification. In addition, the interaction term of ASEAN+6 and
tariff rates is also included, which is defined as the intra-regional tariff, is reported in
Table 7.
<Insert Table 7>
Most gravity variables are significantly estimated with their expected signs,
except for the covariate of the common language and intra-regional tariff in
homogeneous goods. As for tariff rates, are again significantly evidenced to be raise
(low) the duration of trade relationships once hazard ratios decrease (increase). As for
interaction term of ASEAN+6 and tariff rates, the esticmated results are statistically
significant, except for the homogenous goods, which is not significant but with
expected sign. The result of interaction term indicates that the tariff rates of
ASEAN+6 (intra-regional trade) reduce will lead the extension to the duration of
trade relationships, particularly in terms of parts and components in production
networks and differentiated products in Rauch product’s classification, which are
more sensitive to the effect. This inspiring evidence explains the features of regional
trade and tariff diminution, as well as the formation of regional economic integration
organization.
We have already verified a robust negative relationship between duration and
tariff rates through a series of evidence acquired from previous estimations. However,
we decompose tariff rates into high and low tariff by adopting the median of tariff
rates previously. Therefore, this section explains whether a significant difference
between high and low tariff, describing the effect of tariff cut and regional trade, the
magnitude of influences is presented in Table 8, according to the type of industry and

product. To shed light the effect of low tariff rates, we control for low tariff rates by
adding a dummy that is 1, and also introduce the interaction term of the type of
product and low tariff, the interaction term of ASEAN+6 and low tariff, as well as the
interaction term of the type of product, ASEAN+6, and low tariff. Regional dummies
and gravity variables are also controlled but not report.
First of all, low tariff rates show positive relationships with the duration of trade
relationships, implying 8.1% lower hazard ratio for the manufactured goods, as well
as 8.4% lower hazard ratio for the interaction term of low tariff in intra-regional trade.
This result is reasonable; firm would like to export or export because of more free
mobility and lower transaction costs and through regional integration and tariff cut.
Next, we find parts and components with low tariff show 20.2% in Columns (2) and
18.4% in Columns (3) lower hazard ratios in international production networks. In
particular, parts and components of ASEAN+6 with low tariff show 16.8% lower
hazard ratios. Similar applied in Rauch product’s classification, it is noticeable that
differentiated products with low tariff exhibit 11% lower hazard ratios in Columns (4).
Besides, differentiated products of ASEAN+6 with low tariff show 7.7% lower
hazard ratios. The results of homogenous goods are in line with Besedeš and Prusa
(2006b), even though we consider the effect of tariff cut. However the results are
inverse with inclusion of intra-regional effect, indicating the importance of regional
trade. Our findings provide the presence of lower hazard ratios due to effect of
regional trade and tariff cut regarding production networks and Rauch product’s
classification that previous studies ignore.
<Insert Table 8>
V. Discussion
In this section, we explain the influence of inactive and potential trading partners
and the implication for upcoming integrated economic organizations based on our
findings. Appendix Fig. A1 shows the survival rate of low and high tariff, by country
dimension in the initial and the last year. The member nations of ASEAN+6, such as
Cambodia, Lao PDR, Myanmar and Brunei, show relative low survival rates17
in
17 The probabilities of survival of Cambodia, Lao PDR, Myanmar and Brunei are 0.3952, 0.3569,
0.3669, and 0.3185 in the first year, and 0.0796, 0.0590, 0.0371, 0.0110 in the fifteenth year under a
low-tariff level. Under high-tariff trade, the probabilities are 0.3359, 0.3352, 0.3248, and 0.2177 in the
first year, and 0.0000, 0.0106, 0.0255, 0.0000 in the fifteenth year.

intra-regional trade. Their trade relationships are not active compared to other
member nations of ASEAN+6, even though the probability of survival advances
slightly due to low-tariff trade. On the contrary, some Asian countries that are not
member nations of ASEAN+6 exhibit high survival rates of trade that are above
average of ASEAN+6, such as Hong Kong and Taiwan. If they participate in the
regional trade agreement and face lower tariffs afterwards, the overall survival rate of
trade relationships is likely to integrate closely. Besides, the United States shows a
quite high survival rate in trade relationships with ASEAN+6, as always; this could be
seen as an integrated global production network (Wang, Powers, and Wei 2009; Ando
and Kimura, 2013). In particular, low-tariff induced-trade relationships are more
likely to survive. This finding can be applied to the integrated trade relationships
between the United States and Asian countries for upcoming trade treatment, such as
The Trans-Pacific Partnership (TPP), which is aimed at the diminution of tariff rates
completely.
VI. Conclusion
In this article, we employ ASEAN+6 as the reporter, investigating the
probability of survival of imported trade relationships in intraregional and
interregional trade, by introducing the impact of tariff rates that previous studies
ignore. Through Kaplan-Meier estimator and the application of Cox proportional
hazard model, we obtain a series of significant evidence. First, we find low-tariff
trade are likely longer-lived than high-tariff trade on manufactured goods and can be
applied in production networks and Rauch product’s classification. Second, we find a
significantly negative correlation between duration of trade relationships and tariff
rates. That means the reduction on tariff rates contributes to prolonging the length of
trade relationships, particularly in intraregional trade. This evidence provides the
aspect for regional economic integration. Third, we also provide the influence of low
tariff not only in intraregional trade but also on the type of product, indicating a
substantial reduction in hazard ratios. We consider these findings could be the
references for other economic organizations, TPP, which is aimed at the diminution of
tariff rates. However, the magnitude of reduction is worth to investigate for future
research.

Reference
Ando, M. and Kimura, F. (2005) The formation of international production and
distribution networks in East Asia, NBER Chapters, in: International trade in
East Asia, NBER-East Asia seminar on economics, 14, 177-216. National
Bureau of Economic Research, Inc. Available at
http://www.nber.org/chapters/c0194
Ando, M. and Kimura, F. (2012) How did the Japanese exports respond to two crises
in the international production networks? The Global Financial Crisis and the
East Japan earthquake, Asian Economic Journal, 26, 261–287.
doi:10.1111/j.1467-8381.2012.02085.x
Ando, M. and Kimura, F. (2013) Evolution of Machinery Production Networks:
Linkage of North America with East Asia, Working Papers DP-2013-32,
Economic Research Institute for ASEAN and East Asia (ERIA). Available at
http://www.eria.org/ERIA-DP-2013-32.pdf
Athukorala, P. (2010) Production Networks and Trade Patterns in East Asia:
Regionalization or Globalization? Asian Economic Papers, 10, 65-95.
doi:10.1162/ASEP_a_00045
Bernard, A. B. and Jensen, J. B. (1999) Exceptional exporter performance: cause,
effect, or both? Journal of International Economics, 47, 1–25.
doi:10.1016/S0022-1996(98)00027-0
Besedes, T. (2008) Search Cost Perspective on Formation and Duration of Trade,
Review of International Economics, 16, 835–849.
doi:10.1111/j.1467-9396.2008.00752.x
Besedeš, T. and Blyde, J. (2010) What Drives Export Survival? An Analysis of
Export Duration in Latin America, mimeo, Inter-American Development Bank.
Available at
http://siteresources.worldbank.org/INTRANETTRADE/Resources/Internal-Train
ing/287823-1256848879189/Besedes_Mar16_2010.pdf
Besedes, T. and Prusa, T. J. (2006a) Ins, Outs, and the Duration of Trade, Canadian
Journal of Economics, 39, 266-295. doi:10.1111/j.0008-4085.2006.00347.x
Besedes, T. and Prusa, T. J. (2006b) Product Differentiation and Duration of U.S.
Import Trade? Journal of International Economics, 70, 339–358.
doi:10.1016/j.jinteco.2005.12.005

Besedes, T. and Prusa, T. J. (2011) The Role of Extensive and Intensive Margins and
Export Growth, Journal of Development Economics, 96, 371-379.
doi:10.1016/j.jdeveco.2010.08.013
Bridgman, B. (2013) Market Entry and Trade Weighted Import Costs, Canadian
Journal of Economics, 46, 982-1013. doi:10.1111/caje.12044
Cox, D. R. (1972). Regression models and life-tables (with discussion), Journal of the
Royal Statistical Society, Series B (Methodological), 34, 187-202.
Demidova, S. and Krishna, K. (2008) Firm heterogeneity and firm behavior with
conditional policies, Economics Letters. 98, 122–128.
doi:10.1016/j.econlet.2007.04.020
Felbermayr, G. J. and Kohler, W. (2006) Exploring the Intensive and Extensive
Margins of World Trade, Review of World Economics, 142, 642-674.
doi:10.1007/s10290-006-0087-3
Florensa, L.M., Márquez-Ramos, L., Martínez-Zarzoso, I. and Recalde M. L. (2015)
Regional versus global production networks: where does Latin America stand?
Applied Economics, 47, 3938-3956. doi:10.1080/00036846.2015.1023938
Fugazza, M. and Molina, A. C. (2011) On the Determinants of Exports Survival,
Policy Issues in International Trade and Commodities Study Series No. 46
UNCTAD, New York and Geneva. Available at
unctad.org/en/Docs/itcdtab47_en.pdf
Hayakawa K. (2013) How serious is the omission of bilateral tariff rates in gravity?
Journal of The Japanese and International Economies, 27, 81-94.
doi:10.1016/j.jjie.2013.01.002
Helpman, E., Melitz M. J. and Rubinstein, Y. (2008) Estimating Trade Flows:
Trading Partners and Trading Volumes, The Quarterly Journal of Economics,
123, 441-487. doi:10.1162/qjec.2008.123.2.441
Impullitti, G., Irarrazabal, A. A. and Opromolla, L. D. (2013) A theory of entry into
and exit from export markets, Journal of International Economics, 90, 75-90.
doi:10.1016/j.jinteco.2012.11.005
Nitsch, Volker. (2009) Die Another Day: Duration in German Import Trade”, Review
of World Economics, 145, 133-154. doi:10.1007/s10290-009-0008-3
Novy, D. (2013) Gravity Redux: Measuring International Trade Costs with Panel
Data, Ecconomic Inquiry, 51, 101-121. doi:10.1111/j.1465-7295.2011.00439.x
Obashi, A. (2010) Stability of production networks in East Asia: Duration and
survival of trade. Japan and the World Economy, 22, 21–30.

doi:10.1016/j.japwor.2009.06.002
Obashi, A. (2011) Resiliency of production networks in Asia: Evidence from the
Asian crisis, Studies in Trade and Investment, in: Trade-led growth: A sound
strategy for Asia. United Nations Economic and Social Commission for Asia and
the Pacific (ESCAP). Available at http://www.eria.org/ERIA-DP-2009-21.pdf
Okubo, T., Kimura, F. and Teshima, N. (2014) Asian fragmentation in the Global
Financial Crisis, International Review of Economics and Finance, 31, 114–127.
doi:10.1016/j.iref.2014.01.001
Roberts, M. J. and Tybout, J. R. (1997) The Decision to Export in Colombia: An
Empirical Model of Entry with Sunk Costs, American Economic Review, 87,
545–564.
Wang, Z., Powers, W. and Wei, S. J. (2009) Value Chains in East Asian Production
Networks: An International Input-Output Model Based Analysis, Office of
Economics Working Paper, No 2009-10-C (Washington, D.C.: US International
Trade Commission, 2009). Available at
http://ecomod.net/sites/default/files/document-conference/ecomod2009/903.pdf

Table 2. Estimated survival rates on manufactured goods: inclusion of tariffs
K-M survival rate
N 1st year 4
th year 8
th year 11
th year 15
th year
High Tariffs
ASEAN+6
East Europe
West Europe
North America
Central America
South America
Middle East
Africa
Other Asia
467 101
109 757
583 603
87 324
31 889
49 199
58 274
34 853
147 999
0.5662
0.4153
0.5429
0.6274
0.3947
0.3706
0.3549
0.4011
0.5787
0.2981
0.1681
0.2747
0.3636
0.1573
0.1238
0.1185
0.1433
0.2657
0.1955
0.1067
0.1768
0.2419
0.1018
0.0670
0.0639
0.0826
0.1650
0.1748
0.0885
0.1555
0.2172
0.0839
0.0523
0.0521
0.0653
0.1337
0.1512
0.0677
0.1272
0.1783
0.0705
0.0368
0.0387
0.0494
0.1154
Total 1 569 999 0.5313 0.2637 0.1697 0.1486 0.1243
Low Tariffs
ASEAN+6
East Europe
West Europe
North America
Central America
418 611
70 931
403 350
68 621
24 128
0.6004
0.4333
0.5533
0.6513
0.4507
0.3524
0.1891
0.2994
0.4275
0.2068
0.2852
0.1289
0.2183
0.3462
0.1493
0.2600
0.1120
0.1928
0.3172
0.1320
0.2424
0.0973
0.1727
0.2928
0.1183
South America
Middle East
Africa
Other Asia
37 880
38 313
24 801
98 786
0.4222
0.3868
0.4288
0.5776
0.1612
0.1495
0.1588
0.3095
0.1012
0.0981
0.0985
0.2224
0.0831
0.0823
0.0786
0.1805
0.0688
0.0713
0.0645
0.1634
Total 1 185 421 0.5571 0.3073 0.2345 0.2088 0.1907 Notes: Manufactured goods refer to imported products of HS28 to HS 92 at the six-digit level. See
Appendix Table A1 for regional classification. High and low tariffs are determined by using the
median of average tariff rates based on World Integrated Trade System data.
Source: Author’s calculation.

Table 3. Estimated survival rates in machinery: inclusion of tariffs
K-M survival rate
N 1st year 4
th year 8
th year 11
th year 15
th year
All High 441 835 0.5400 0.2799 0.1918 0.1690 0.1315
Low 469 380 0.5610 0.3236 0.2554 0.2305 0.2136
P&C High 194 916 0.5769 0.3292 0.2330 0.2107 0.1681
Low 206 107 0.5919 0.3678 0.3009 0.2789 0.2615
FP High
Low
246 919
263 273
0.5108
0.5368
0.2407
0.2888
0.1590
0.2196
0.1356
0.1922
0.1023
0.1757 Notes: All refers to imported products of HS84 to HS92 at the six-digit level in machinery. P&C and FP refer
to parts and component products and final products, respectively, at the six-digit level in machinery. High
and low tariffs are determined by using the median of average tariff rates based on World Integrated Trade
System data.
Source: Author’s calculation.
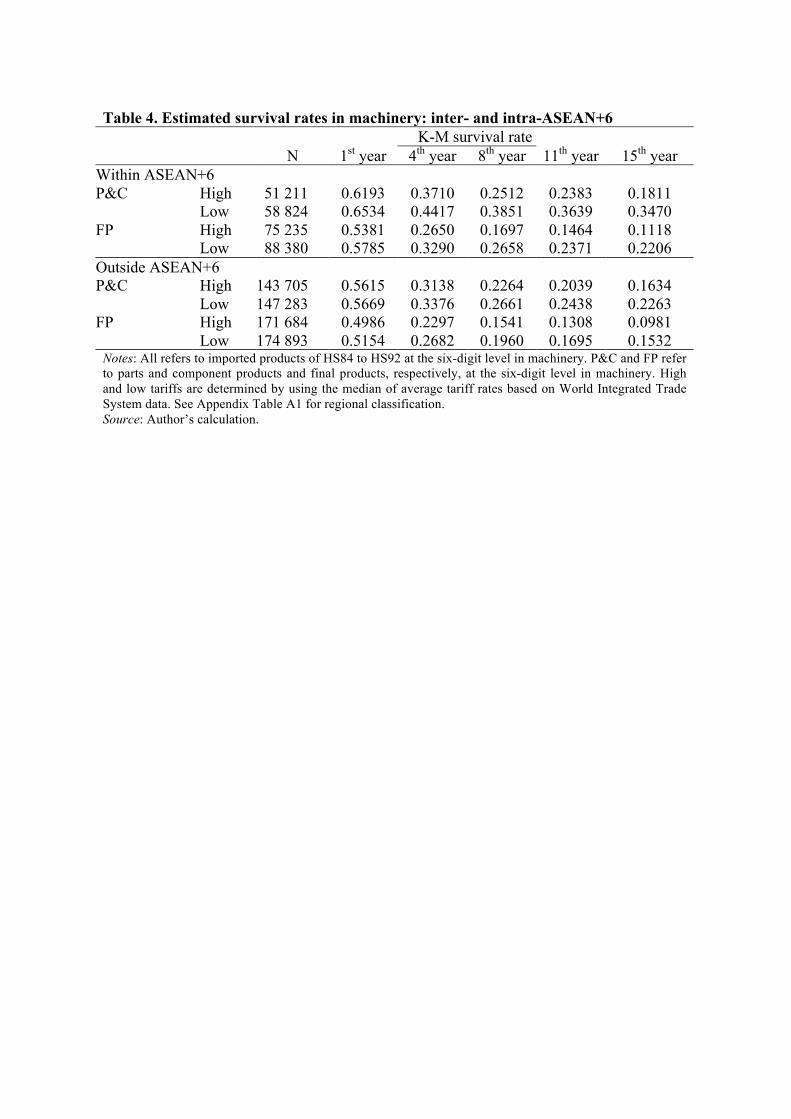
Table 4. Estimated survival rates in machinery: inter- and intra-ASEAN+6
K-M survival rate
N 1st year 4
th year 8
th year 11
th year 15
th year
Within ASEAN+6
P&C High 51 211 0.6193 0.3710 0.2512 0.2383 0.1811
Low 58 824 0.6534 0.4417 0.3851 0.3639 0.3470
FP High
Low
75 235
88 380
0.5381
0.5785
0.2650
0.3290
0.1697
0.2658
0.1464
0.2371
0.1118
0.2206
Outside ASEAN+6
P&C High
Low
143 705
147 283
0.5615
0.5669
0.3138
0.3376
0.2264
0.2661
0.2039
0.2438
0.1634
0.2263
FP High
Low
171 684
174 893
0.4986
0.5154
0.2297
0.2682
0.1541
0.1960
0.1308
0.1695
0.0981
0.1532 Notes: All refers to imported products of HS84 to HS92 at the six-digit level in machinery. P&C and FP refer
to parts and component products and final products, respectively, at the six-digit level in machinery. High
and low tariffs are determined by using the median of average tariff rates based on World Integrated Trade
System data. See Appendix Table A1 for regional classification.
Source: Author’s calculation.

Table 5. Estimated survival rates for Rauch product’s classification by tariffs
K-M survival rate
N 1st year 4
th year 8
th year 11
th year 15
th year
Homogeneous goods High
Low
26 084
33 578
0.4702
0.5093
0.1928
0.2479
0.1025
0.1686
0.0809
0.1417
0.0519
0.1222
Reference priced goods High 302 787 0.5301 0.2485 0.1424 0.1193 0.0959
Low 285 330 0.5486 0.2889 0.2060 0.1769 0.1546
Differentiated products High
Low
1 162 481
788 219
0.5328
0.5623
0.2690
0.3155
0.1782
0.2459
0.1578
0.2207
0.1339
0.2038 Notes: Homogeneous goods, referenced priced goods, and differentiated products are defined by
Rauch product’s classification. High and low tariffs are determined by using the median of average
tariff rates based on World Integrated Trade System data.
Source: Author’s calculation.

Table 6. Cox proportional hazard estimates: manufactured goods (1) (2) (3) (4)
Tariffs 1.046*** 1.041*** 1.041***
(0.001) (0.001) (0.001)
Distance 1.100*** 1.105*** 1.036*** 1.035***
(0.001) (0.001) (0.001) (0.001)
Common language 0.919*** 0.933*** 0.942*** 0.955***
(0.002) (0.002) (0.002) (0.002)
Colony dummy 0.877*** 0.883*** 0.864*** 0.882***
(0.004) (0.004) (0.004) (0.004)
GDP per capita of exporter 0.947*** 0.944*** 0.926*** 0.960***
(0.001) (0.001) (0.001) (0.001)
ASEAN+6 0.806*** 0.858***
(0.002) (0.002)
East Europe 1.159***
(0.005)
West Europe 0.981***
(0.003)
North America 0.794***
(0.003)
Central America 1.131***
(0.007)
South America 1.230***
(0.006)
Middle East 1.308***
(0.006)
Africa 1.213***
(0.007)
Number of observations 2 615 276 2 615 276 2 615 276 2 615 276
Number of failures 2 058 629 2 058 629 2 058 629 2 058 629
Time at risk 9 370 229 9 370 229 9 370 229 9 370 229
Log likelihood -29 441 859 -29 438 949 -29 432 993 -29 425 481
Notes: ***indicates that the results are statistically significant at the 1 percent level, ** at the 5 percent level,
and * at the 10 percent, respectively. The dependent variable is the hazard of a trade relationship. All
explanatory variables are in natural logs, except for dummy variables. Tariffs= ln (1+Tariff). Standard errors are
in parentheses.

Table 7. Cox proportional hazard estimates: production networks/Rauch classification
P&C Final Homogeneous Reference priced Differentiated
Tariffs 1.027*** 1.037*** 1.042*** 1.033*** 1.042***
(0.002) (0.002) (0.005) (0.002) (0.001)
Distance 1.041*** 1.052*** 1.088*** 1.065*** 1.027***
(0.004) (0.004) (0.010) (0.003) (0.002)
Common language 0.920*** 0.942*** 1.009 1.015*** 0.937***
(0.006) (0.005) (0.013) (0.004) (0.002)
Colony dummy 0.815*** 0.905*** 0.938*** 0.887*** 0.870***
(0.012) (0.009) (0.024) (0.008) (0.005)
GDP per capita of exporter 0.906*** 0.923*** 0.983*** 0.960*** 0.959***
(0.002) (0.002) (0.004) (0.001) (0.001)
Intra-regional tariffs 1.074*** 1.026*** 1.008 1.007** 1.020**
(0.004) (0.003) (0.009) (0.003) (0.002)
Regional dummies Yes Yes Yes Yes Yes
Number of observations 380 959 484 234 56 609 561 932 1 848 484
Number of failures 276 483 387 390 48 144 457 824 1 438 433
Time at risk 1 629 499 1 677 003 170 333 1 924 505 6 723 276
Log likelihood -3 427 882 -4 881 872 -501 724 -5 822 666 -20 075 290
Notes: ***indicates that the results are statistically significant at the 1 percent level, ** at the 5 percent level, and
* at the 10 percent, respectively. The dependent variable is the hazard of a trade relationship. All explanatory
variables are in natural logs, except for dummy variables. Tariffs= ln (1+Tariff). Standard errors are in
parentheses.

Table 8. Cox proportional hazard estimates: the effects of tariff cuts and regional trade
Manufactured
goods
Machinery
industry
Machinery
industry
Rauch
classification
Rauch
classification
(1) (2) (3) (4) (5)
Low tariffs 0.919***
(0.002)
P&C*Low tariff 0.798*** 0.816***
(0.003) (0.003)
ASEAN+6*Low tariff 0.916*** 0.868*** 0.911***
(0.003) (0.004) (0.003)
ASEAN+6 P&C
*Low tariff
0.842***
(0.006)
Homogeneous goods
*Low tariff
1.087***
(0.007)
1.087***
(0.009)
Differentiated products
*Low tariff
0.890***
(0.002)
0.892***
(0.012)
ASEAN+6 Homogeneous
goods*Low tariff
0.927***
(0.012)
ASEAN+6 Differentiated
products*Low tariff
0.923***
(0.003)
Gravity covariates
Regional dummies
Yes
Yes
Yes
Yes
Yes
Yes
Yes
Yes
Yes
Yes
Number of observations 2 615 276 865 193 865 193 2 467 025 2 467 025
Number of failures 2 058 629 663 873 663 873 1 944 401 1 944 401
Time at risk 9 370 229 3 306 502 3 306 502 8 818 114 8 818 114
Log likelihood -29 424 435 -8 762 094 -8 762 226 -27 674 824 -27 675 062
Notes: ***indicates that the results are statistically significant at the 1 percent level, ** at the 5 percent level,
and * at the 10 percent, respectively. The dependent variable is the hazard of a trade relationship. All
explanatory variables are in natural logs, except for dummy variables. Tariffs= ln (1+Tariff). Standard errors are
in parentheses.

Fig. 1. Survival functions for the type of the products
Source: Author’s calculation.
0.0
00
.25
0.5
00
.75
1.0
0
0 5 10 15analysis time
high low
High and Low Tariff for Manufactured Goods
0.0
00
.25
0.5
00
.75
1.0
0
0 5 10 15analysis time
ASEAN Africa
Central_America East_Europe
Middle_East North_America
Other_Asia South_America
West_Europe
Regional Trade for Manufactured Goods
0.0
00
.25
0.5
00
.75
1.0
0
0 5 10 15analysis time
high/final/ASEAN = 0 high/final/ASEAN = 1
high/pc/ASEAN = 0 high/pc/ASEAN = 1
low/final/ASEAN = 0 low/final/ASEAN = 1
low/pc/ASEAN = 0 low/pc/ASEAN = 1
Production Networks
0.0
00
.25
0.5
00
.75
1.0
0
0 5 10 15analysis time
differentiated/high differentiated/low
homogeneous/high homogeneous/low
reference priced/high reference priced/low
Rauch Product's Classification
Appendix Table A1: Major trading partners
Region Country
ASEAN+6 Thailand Philippines Malaysia China
Myanmar Cambodia Indonesia India
Lao PDR Singapore Japan Australia
Brunei Vietnam Korea, Rep. New Zealand
West Europe Austria Denmark Greece Netherlands
Belgium Spain Ireland Norway
Switzerland Finland Iceland Portugal
Cyprus France Italy Sweden
Germany United Kingdom Luxembourg Turkey
Andorra
East Europe Bulgaria Czech Republic Estonia Croatia
Hungary Lithuania Latvia Macedonia, FYR
Poland Romania Serbia, FR Slovak Republic
Slovenia Ukraine
Middle East Iran Iraq Israel Jordan
Kuwait Pakistan Saudi Arabia Syrian Arab Republic
Afghanistan
North America Canada United States
Central America Nicaragua Panama Costa Rica Cuba
Guatemala Honduras Mexico El Salvador
Belize
South America Argentina Brazil Chile Colombia
Peru Paraguay Uruguay Venezuela
Bolivia
Africa Egypt Morocco South Africa
Other Asia Hong Kong Macao Russian Federation Taiwan
Nepal Bangladesh

Appendix Fig. A1: Estimated survival rates for low and high tariff in the first
and fifteenth year by country dimension
AFG
AND
ARG
AUS
AUTBEL
BGD
BGR
BLZ
BOL
BRA
BRN
CANCHE
CHL
CHN
COL
CRI
CUB
CYP
CZE
DEU
DNK
EGY
ESP
EST
FIN
FRA
GBR
GRCGTM
HKG
HND
HRV
HUN
IDNIND
IRL
IRN
IRQ
ISL
ISR
ITA
JOR
JPN
KHM
KOR
KWT
LAOLTU
LUXLVA
MAC
MAR
MEX
MKD
MMR
MYS
NIC
NLD
NORNPL
NZL
PAK
PAN
PER
PHL
POLPRT
PRY
ROM
RUS
SAU
SGP
SLV
SVKSVN
SWE
SYR
THA
TUR
TWN
UKR
URY
USA
VEN
VNM
YUG
ZAF
.2.4
.6.8
1st ye
ar
0 .1 .2 .3 .4 .515th year
Low Tariff
AFG
AND
ARG
AUS
AUT
BEL
BGDBGR
BLZ
BOL
BRA
BRN
CAN
CHE
CHL
CHN
COLCRI
CUB
CYP
CZE
DEU
DNK
EGY
ESP
EST
FIN
FRA
GBR
GRC
GTM
HKG
HNDHRV
HUN
IDN IND
IRL
IRN
IRQ
ISL
ISR
ITA
JOR
JPN
KHM
KOR
KWT
LAOLTU
LUX LVAMAC MAR
MEX
MKD
MMR
MYS
NIC
NLD
NOR
NPL
NZLPAK
PAN
PER
PHL POLPRT
PRY
ROM
RUS
SAU
SGP
SLV
SVKSVN
SWE
SYR
THA
TUR
TWN
UKR
URY
USA
VEN
VNM
YUG
ZAF
0.2
.4.6
.81
st ye
ar
0 .1 .2 .315th year
High Tariff