Embed Size (px)
Citation preview
Children and Families in Diverse Settings
Margaret Burchinal
University of California-Irvine
(UNC)
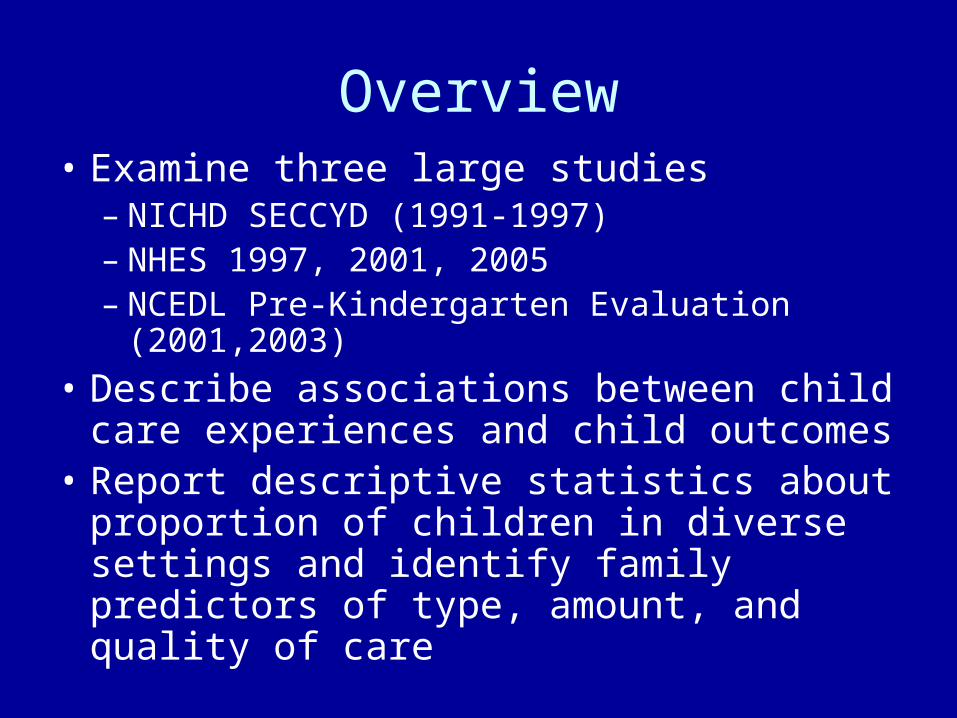
Overview• Examine three large studies
– NICHD SECCYD (1991-1997)– NHES 1997, 2001, 2005– NCEDL Pre-Kindergarten Evaluation
(2001,2003)
• Describe associations between child care experiences and child outcomes
• Report descriptive statistics about proportion of children in diverse settings and identify family predictors of type, amount, and quality of care
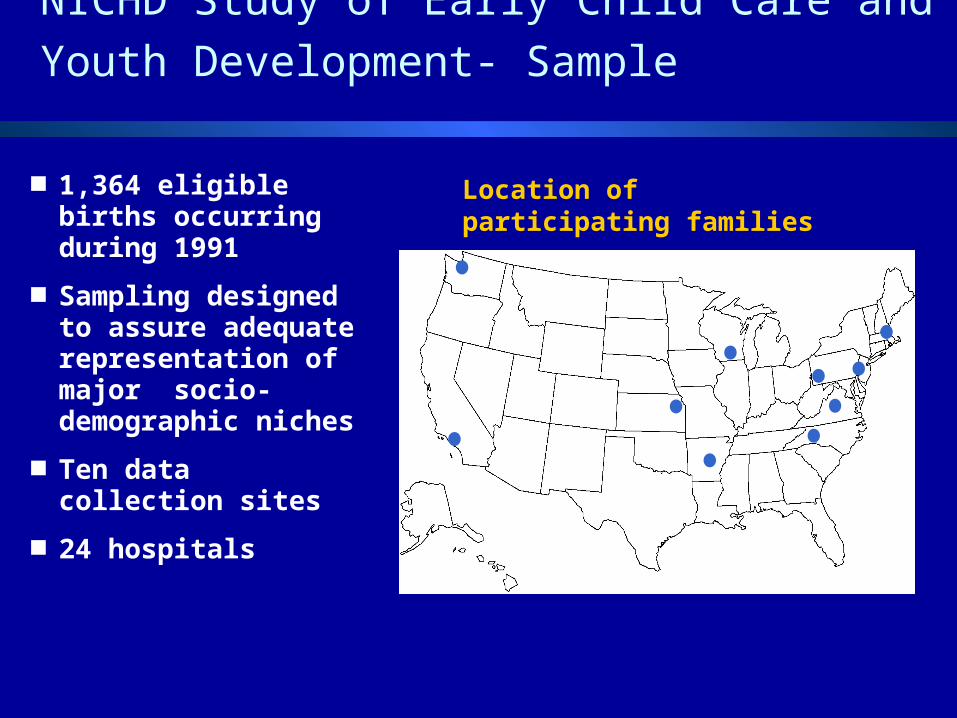
NICHD Study of Early Child Care and Youth
Development- Sample 1,364 eligible
births occurring during 1991
Sampling designed to assure adequate representation of major socio-demographic niches
Ten data collection sites
24 hospitals
Location of participating families
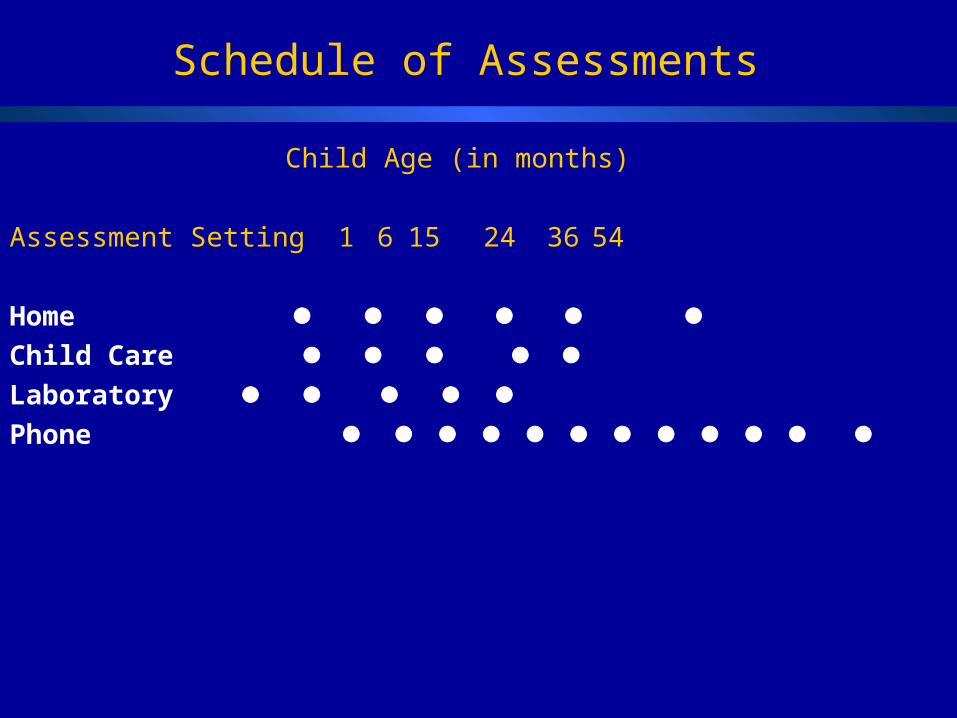
Child Age (in months)
Assessment Setting 1 6 15 24 36 54
Home
Child Care
Laboratory Phone
Schedule of Assessments
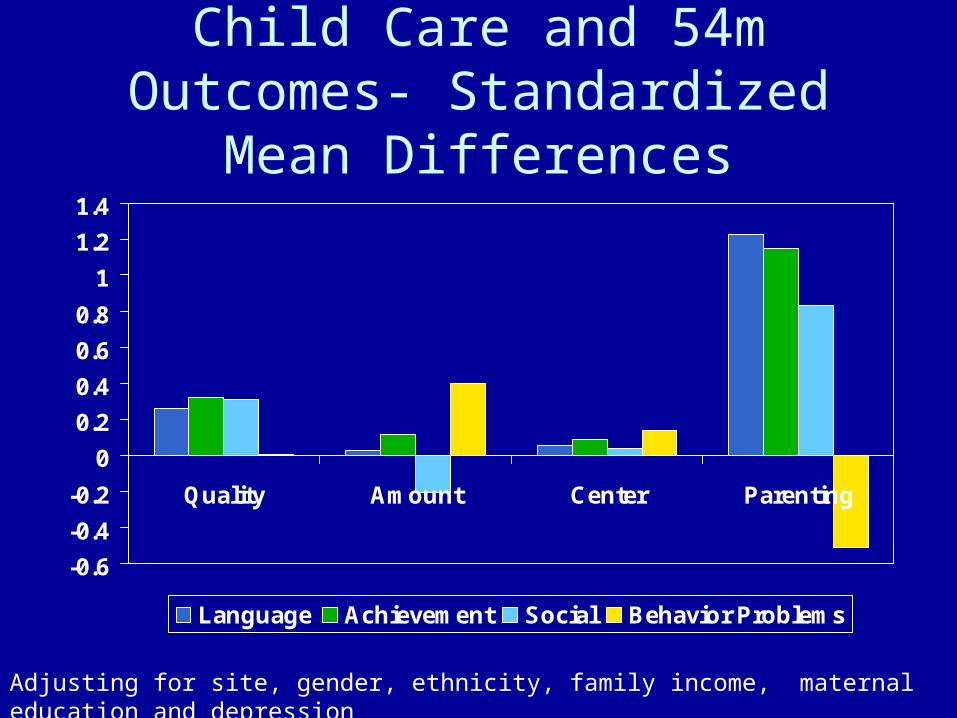
Child Care and 54m Outcomes- Standardized Mean Differences
-0.6
-0.4
-0.2
0
0.2
0.4
0.6
0.8
1
1.2
1.4
Quality Amount Center Parenting
Language Achievement Social Behavior Problems
Adjusting for site, gender, ethnicity, family income, maternal education and depression
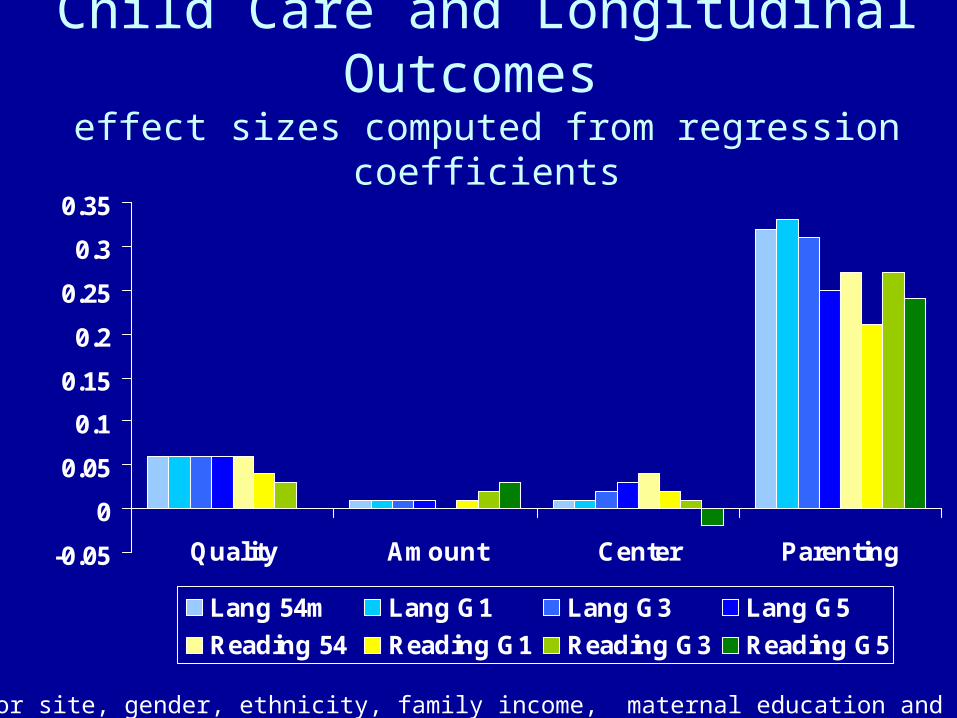
Child Care and Longitudinal Outcomes
effect sizes computed from regression coefficients
-0.05
0
0.05
0.1
0.15
0.2
0.25
0.3
0.35
Quality Amount Center Parenting
Lang 54m Lang G1 Lang G3 Lang G5
Reading 54 Reading G1 Reading G3 Reading G5
Adjusting for site, gender, ethnicity, family income, maternal education and depression
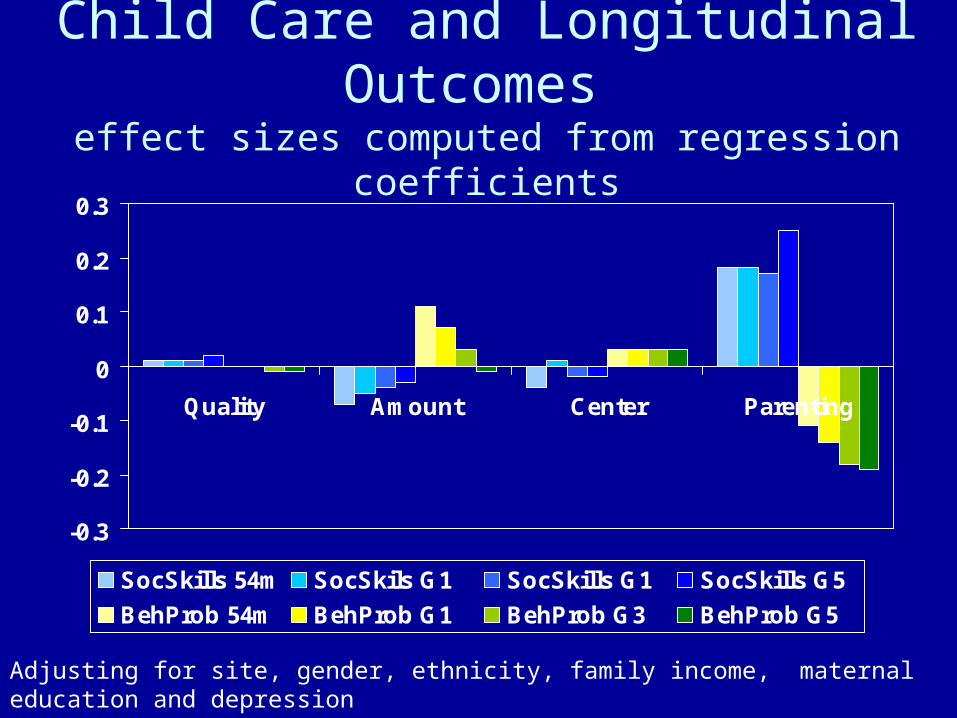
Child Care and Longitudinal Outcomes
effect sizes computed from regression coefficients
-0.3
-0.2
-0.1
0
0.1
0.2
0.3
Quality Amount Center Parenting
SocSkills 54m SocSkils G1 SocSkills G1 SocSkills G5
BehProb 54m BehProb G1 BehProb G3 BehProb G5
Adjusting for site, gender, ethnicity, family income, maternal education and depression
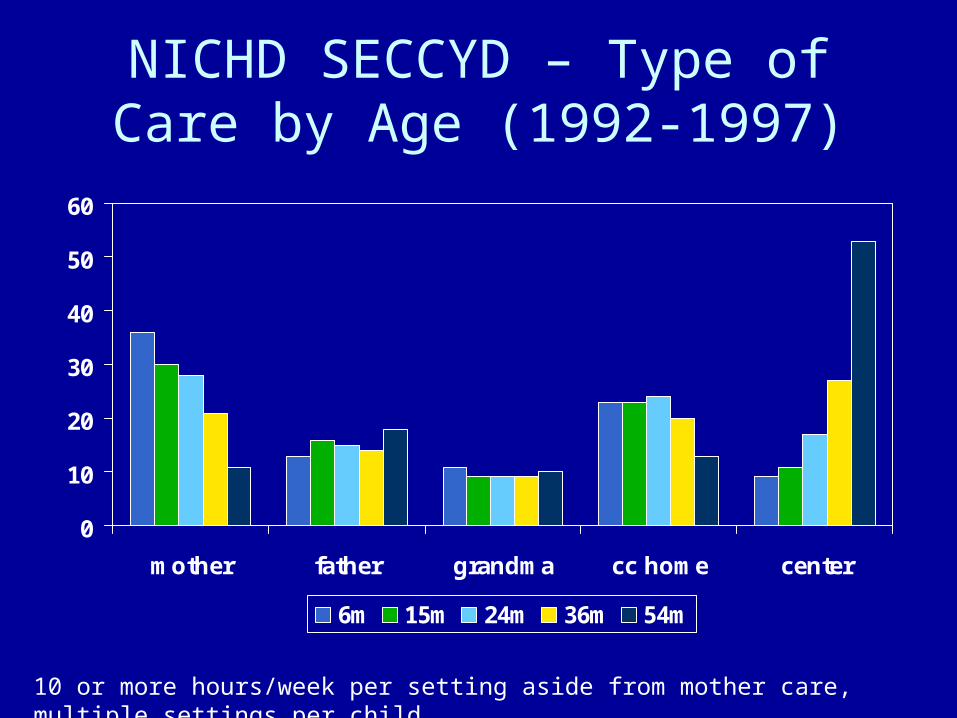
NICHD SECCYD – Type of Care by Age (1992-1997)
0
10
20
30
40
50
60
mother father grandma cc home center
6m 15m 24m 36m 54m
10 or more hours/week per setting aside from mother care, multiple settings per child
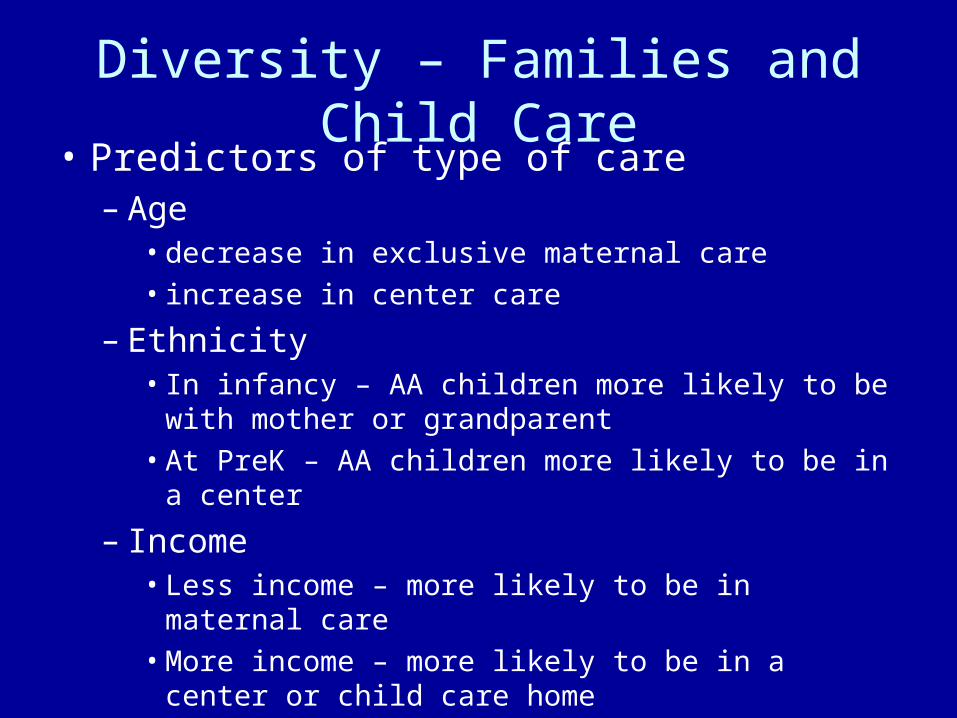
Diversity – Families and Child Care• Predictors of type of care
– Age • decrease in exclusive maternal care• increase in center care
– Ethnicity • In infancy – AA children more likely to be with
mother or grandparent• At PreK – AA children more likely to be in a center
– Income• Less income – more likely to be in maternal care• More income – more likely to be in a center or child
care home
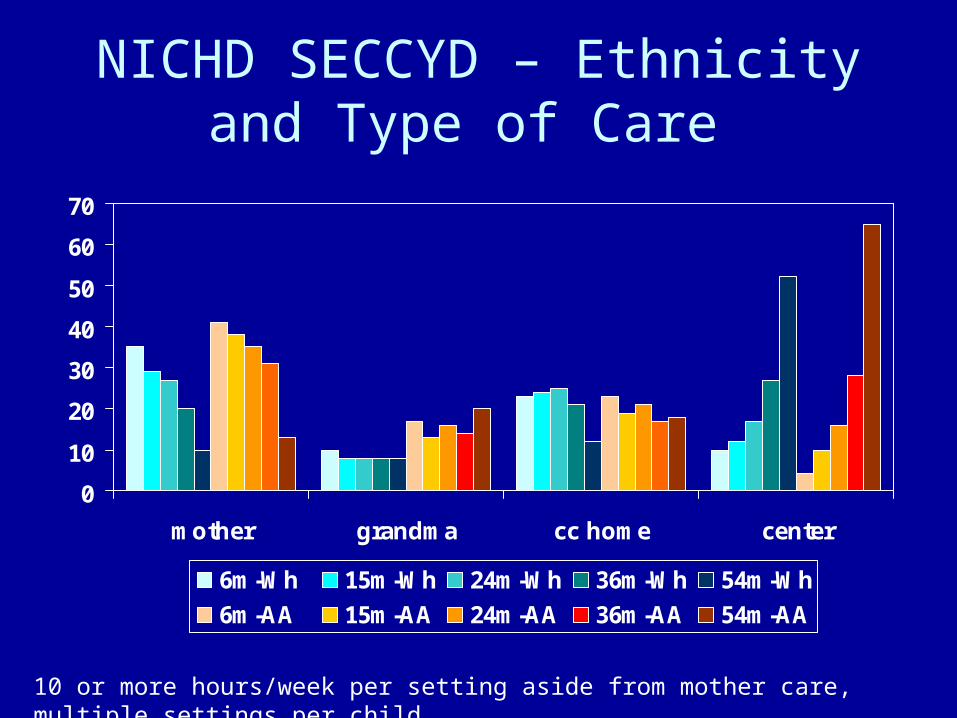
NICHD SECCYD – Ethnicity and Type of Care
0
10
20
30
40
50
60
70
mother grandma cc home center
6m-Wh 15m-Wh 24m-Wh 36m-Wh 54m-Wh
6m-AA 15m-AA 24m-AA 36m-AA 54m-AA
10 or more hours/week per setting aside from mother care, multiple settings per child
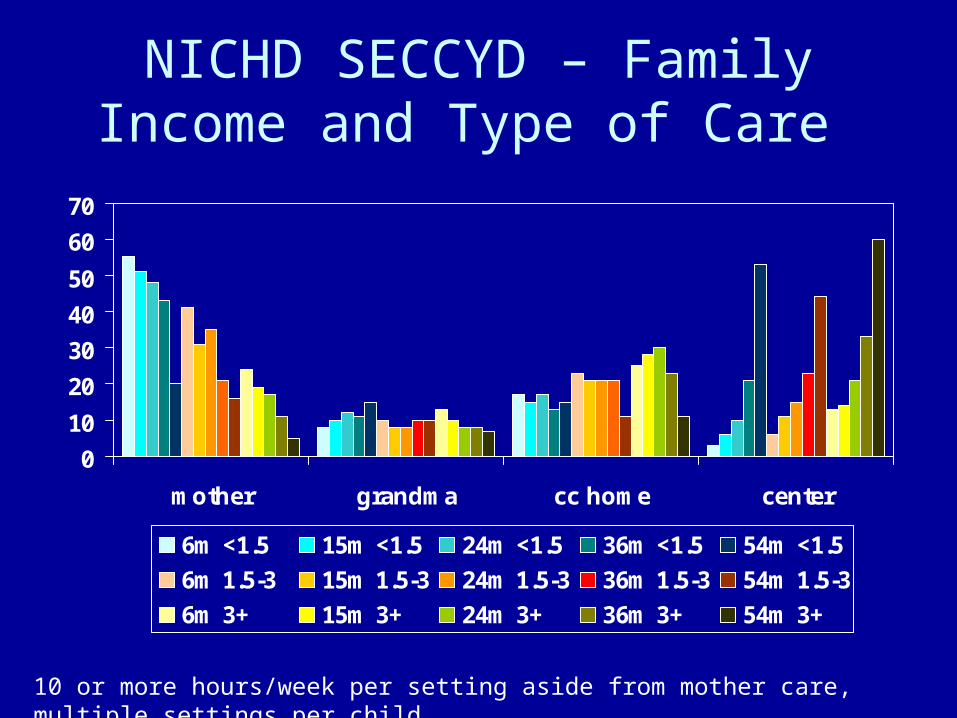
NICHD SECCYD – Family Income and Type of Care
0
10
20
30
40
50
60
70
mother grandma cc home center
6m <1.5 15m <1.5 24m <1.5 36m <1.5 54m <1.5
6m 1.5-3 15m 1.5-3 24m 1.5-3 36m 1.5-3 54m 1.5-3
6m 3+ 15m 3+ 24m 3+ 36m 3+ 54m 3+
10 or more hours/week per setting aside from mother care, multiple settings per child
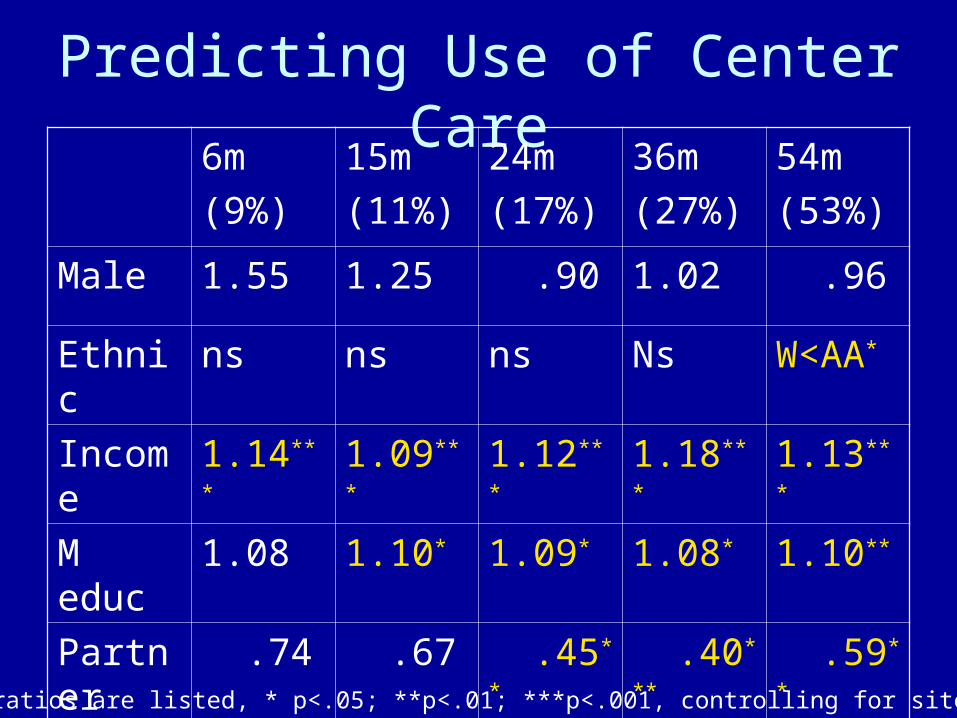
Predicting Use of Center Care6m
(9%)
15m
(11%)
24m
(17%)
36m
(27%)
54m
(53%)
Male 1.55 1.25 .90 1.02 .96
Ethnic ns ns ns Ns W<AA*
Income 1.14*** 1.09*** 1.12*** 1.18*** 1.13***
M educ 1.08 1.10* 1.09* 1.08* 1.10**
Partner .74 .67 .45** .40*** .59**
Odds ratios are listed, * p<.05; **p<.01; ***p<.001, controlling for site
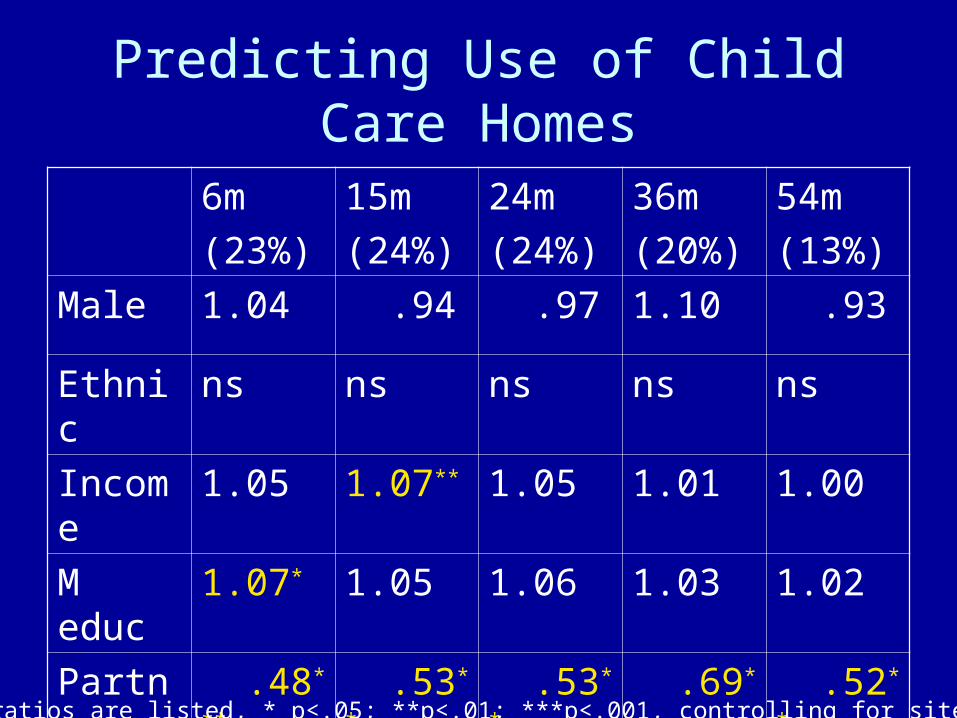
Predicting Use of Child Care Homes
6m
(23%)
15m
(24%)
24m
(24%)
36m
(20%)
54m
(13%)
Male 1.04 .94 .97 1.10 .93
Ethnic ns ns ns ns ns
Income 1.05 1.07** 1.05 1.01 1.00
M educ 1.07* 1.05 1.06 1.03 1.02
Partner .48*** .53** .53** .69* .52**
Odds ratios are listed, * p<.05; **p<.01; ***p<.001, controlling for site
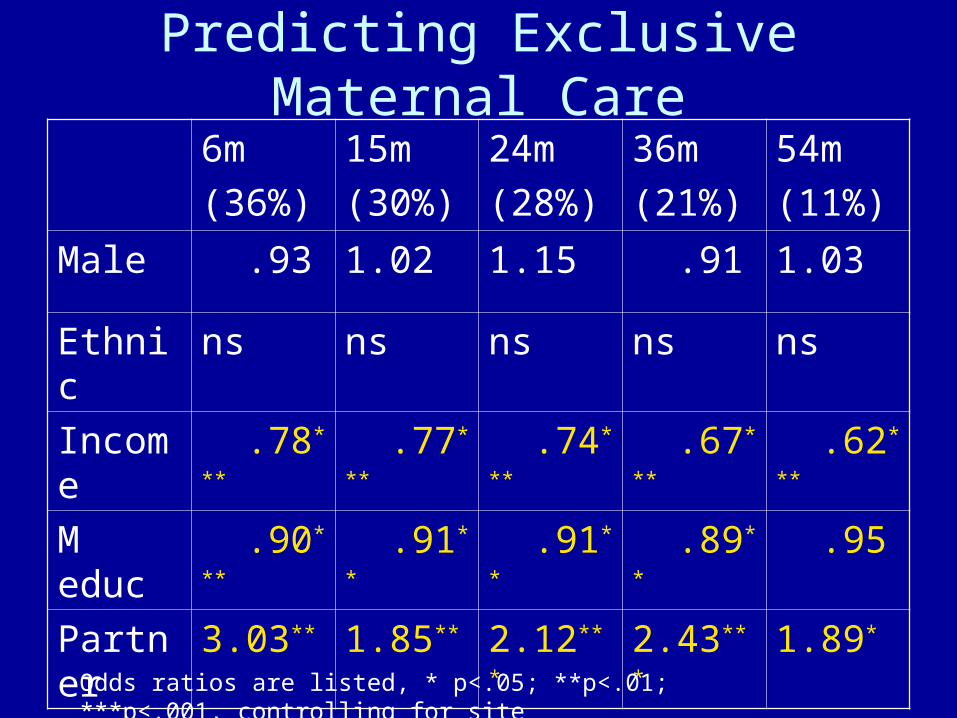
Predicting Exclusive Maternal Care
6m
(36%)
15m
(30%)
24m
(28%)
36m
(21%)
54m
(11%)
Male .93 1.02 1.15 .91 1.03
Ethnic ns ns ns ns ns
Income .78*** .77*** .74*** .67*** .62***
M educ .90*** .91** .91** .89** .95
Partner 3.03** 1.85** 2.12*** 2.43*** 1.89*
Odds ratios are listed, * p<.05; **p<.01; ***p<.001, controlling for site
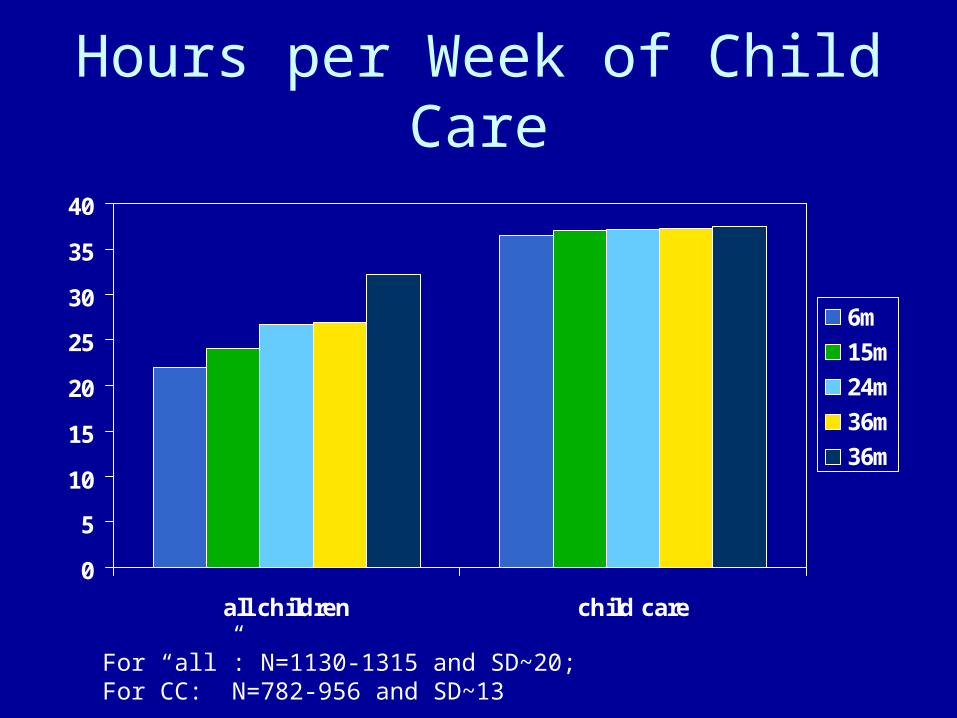
Hours per Week of Child Care
0
5
10
15
20
25
30
35
40
all children child care
6m
15m
24m
36m
36m
For “all”: N=1130-1315 and SD~20; For CC: N=782-956 and SD~13
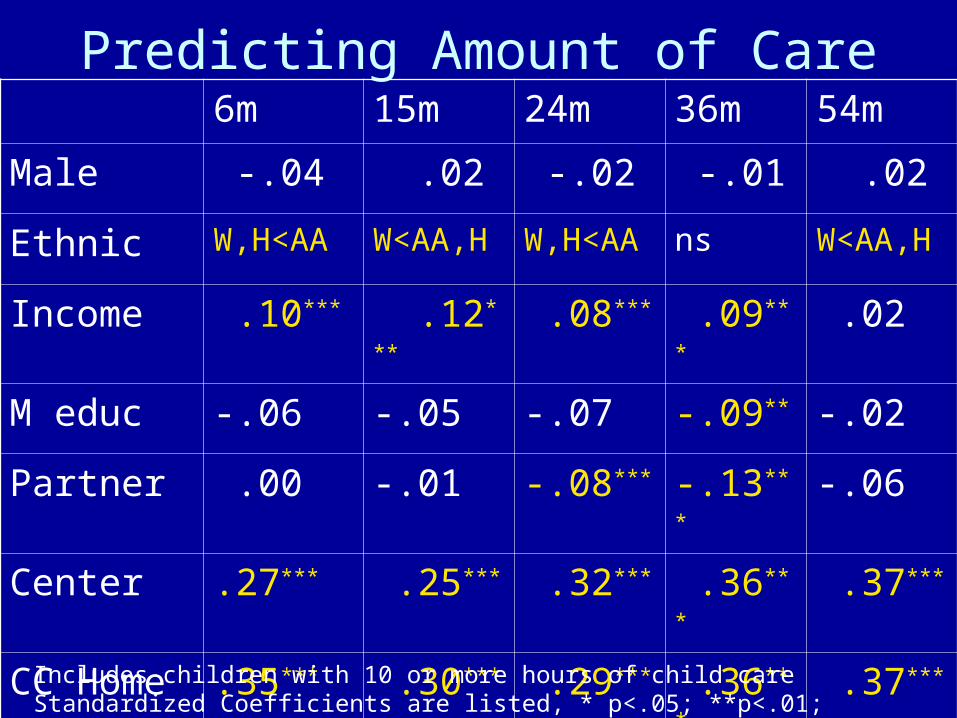
Predicting Amount of Care6m 15m 24m 36m 54m
Male -.04 .02 -.02 -.01 .02
Ethnic W,H<AA W<AA,H W,H<AA ns W<AA,H
Income .10*** .12*** .08*** .09*** .02
M educ -.06 -.05 -.07 -.09** -.02
Partner .00 -.01 -.08*** -.13*** -.06
Center .27*** .25*** .32*** .36*** .37***
CC Home .35*** .30*** .29*** .36*** .37***
Includes children with 10 or more hours of child careStandardized Coefficients are listed, * p<.05; **p<.01; ***p<.001, controlling for site
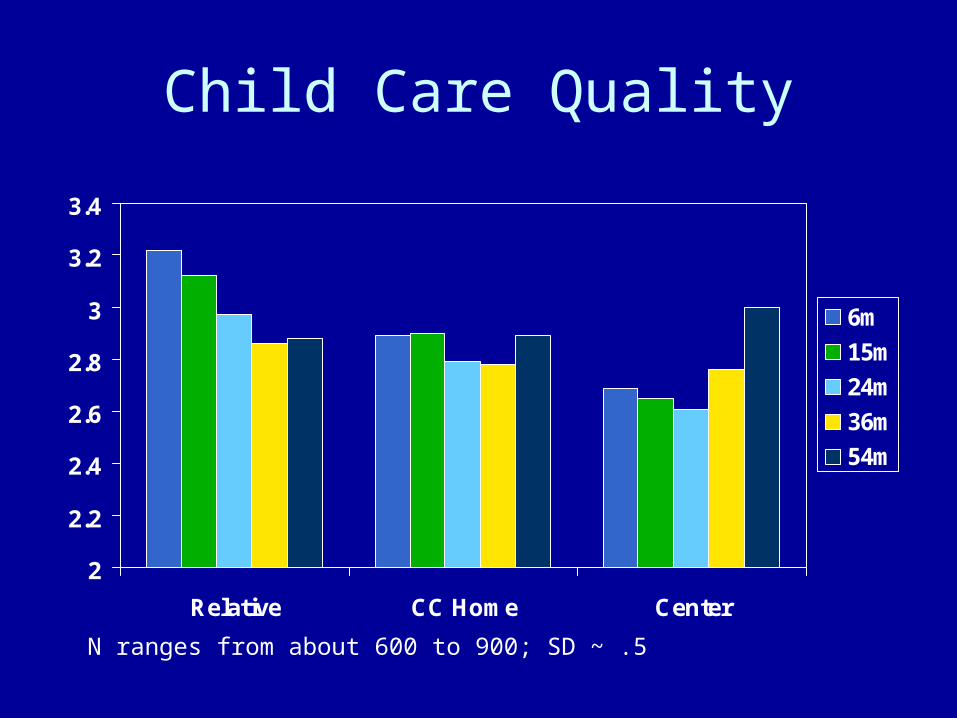
Child Care Quality
2
2.2
2.4
2.6
2.8
3
3.2
3.4
Relative CC Home Center
6m
15m
24m
36m
54m
N ranges from about 600 to 900; SD ~ .5
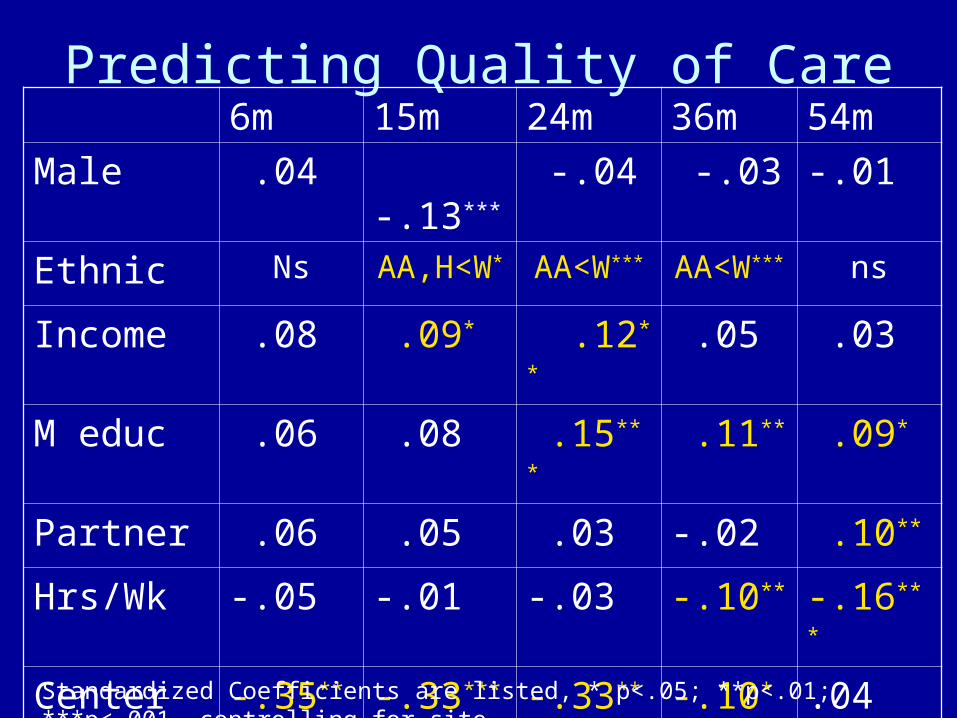
Predicting Quality of Care6m 15m 24m 36m 54m
Male .04 -.13*** -.04 -.03 -.01
Ethnic Ns AA,H<W* AA<W*** AA<W*** ns
Income .08 .09* .12** .05 .03
M educ .06 .08 .15*** .11** .09*
Partner .06 .05 .03 -.02 .10**
Hrs/Wk -.05 -.01 -.03 -.10** -.16***
Center -.35*** -.33*** -.33*** -.10* .04
CC Home -.22*** -.15*** -.15*** -.07 .02
Standardized Coefficients are listed, * p<.05; **p<.01; ***p<.001, controlling for site
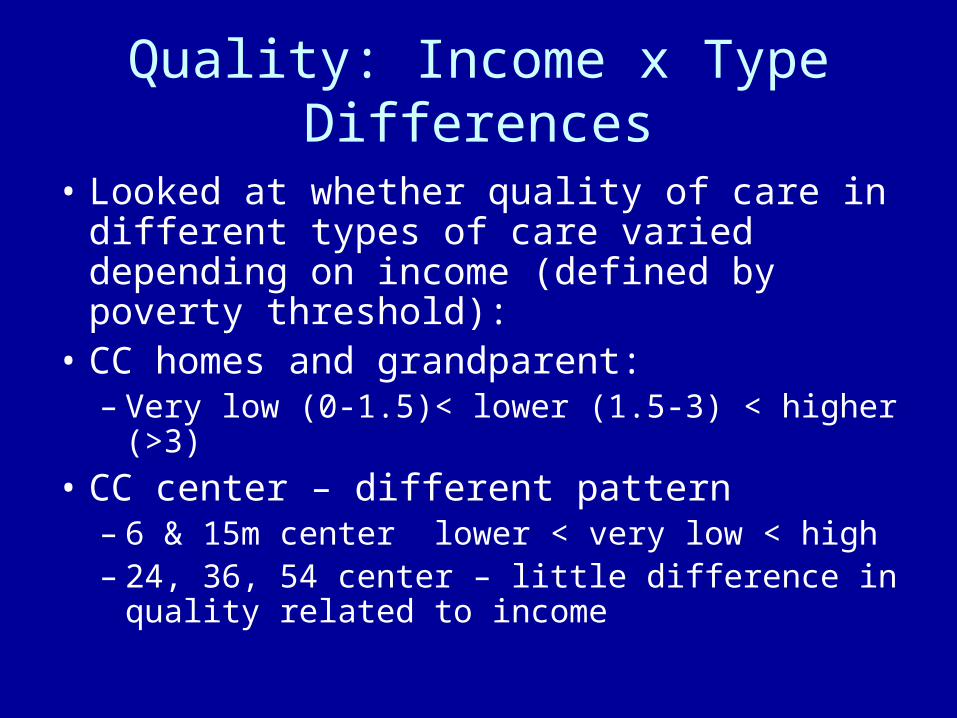
Quality: Income x Type Differences
• Looked at whether quality of care in different types of care varied depending on income (defined by poverty threshold):
• CC homes and grandparent: – Very low (0-1.5)< lower (1.5-3) < higher (>3)
• CC center – different pattern– 6 & 15m center lower < very low < high– 24, 36, 54 center – little difference in quality
related to income
National Household Educational Survey
• Cross-sectional nationally representative sample
• Asked about child care in 1996, 2000, 2004
• We divided children based on age (0-1, 1-2, 2-3, 3-4, 4-6 years-of-age) and looked at type of care (present for at least 5 hours) and hours of child care per week
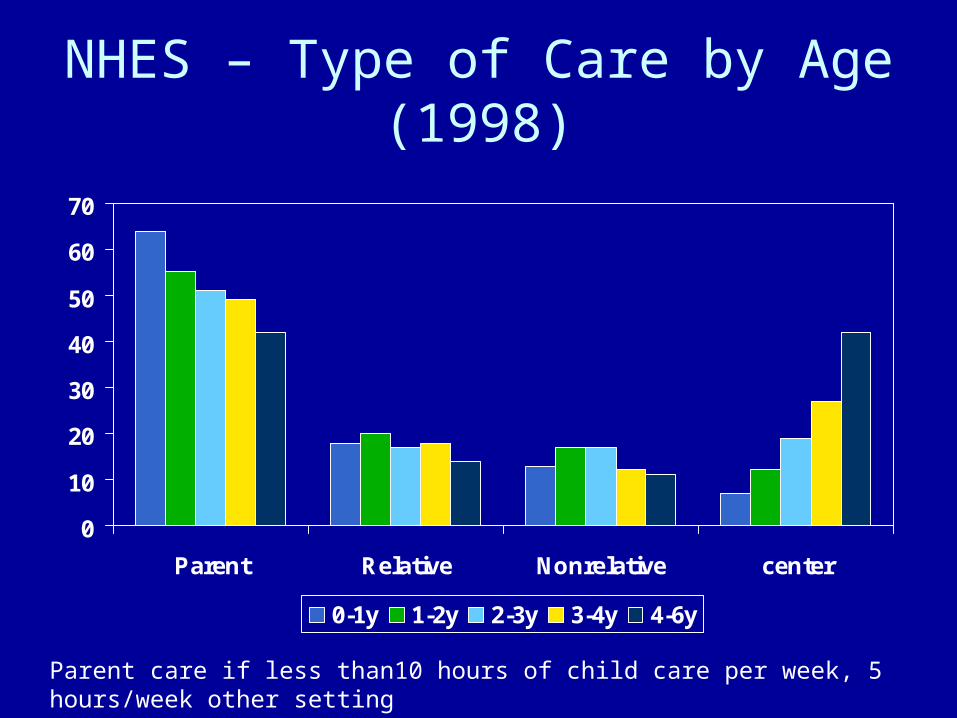
NHES – Type of Care by Age (1998)
0
10
20
30
40
50
60
70
Parent Relative Nonrelative center
0-1y 1-2y 2-3y 3-4y 4-6y
Parent care if less than10 hours of child care per week, 5 hours/week other setting
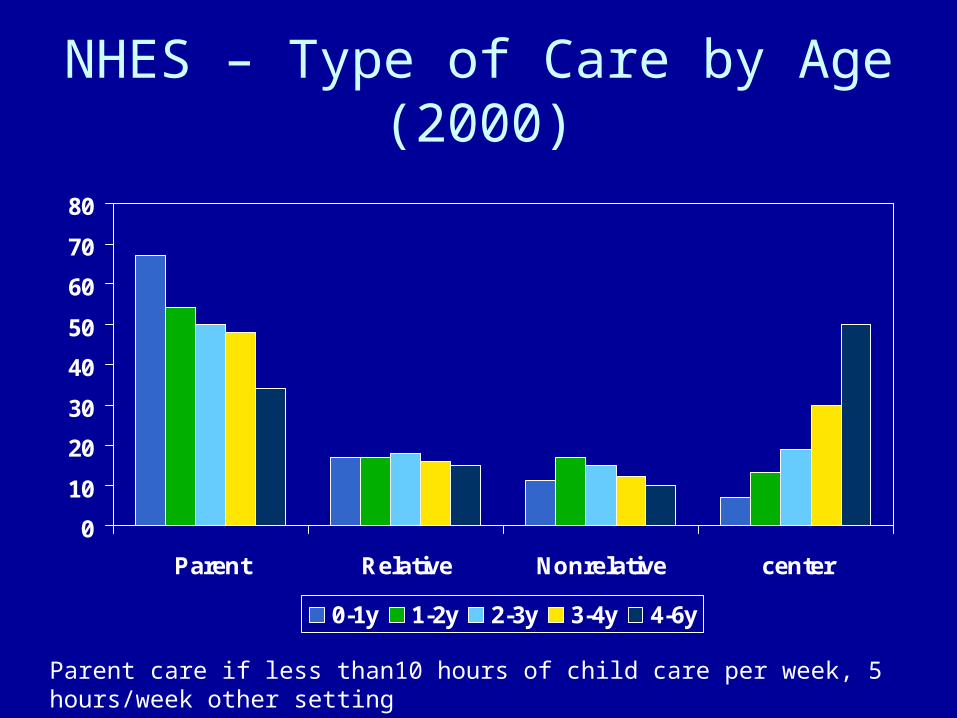
NHES – Type of Care by Age (2000)
0
10
20
30
40
50
60
70
80
Parent Relative Nonrelative center
0-1y 1-2y 2-3y 3-4y 4-6y
Parent care if less than10 hours of child care per week, 5 hours/week other setting
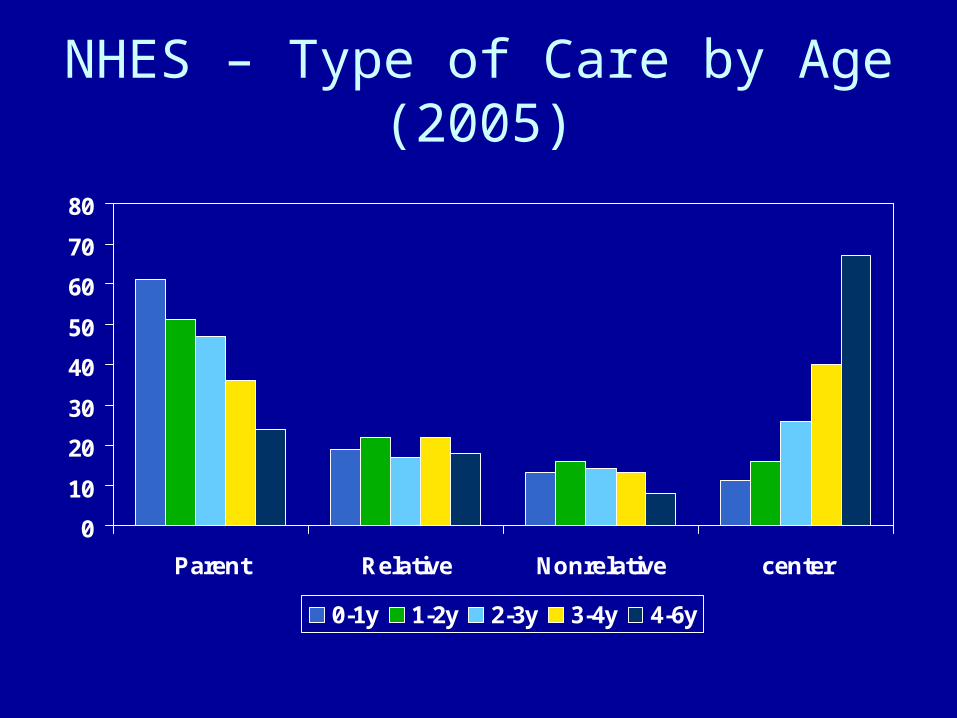
NHES – Type of Care by Age (2005)
0
10
20
30
40
50
60
70
80
Parent Relative Nonrelative center
0-1y 1-2y 2-3y 3-4y 4-6y
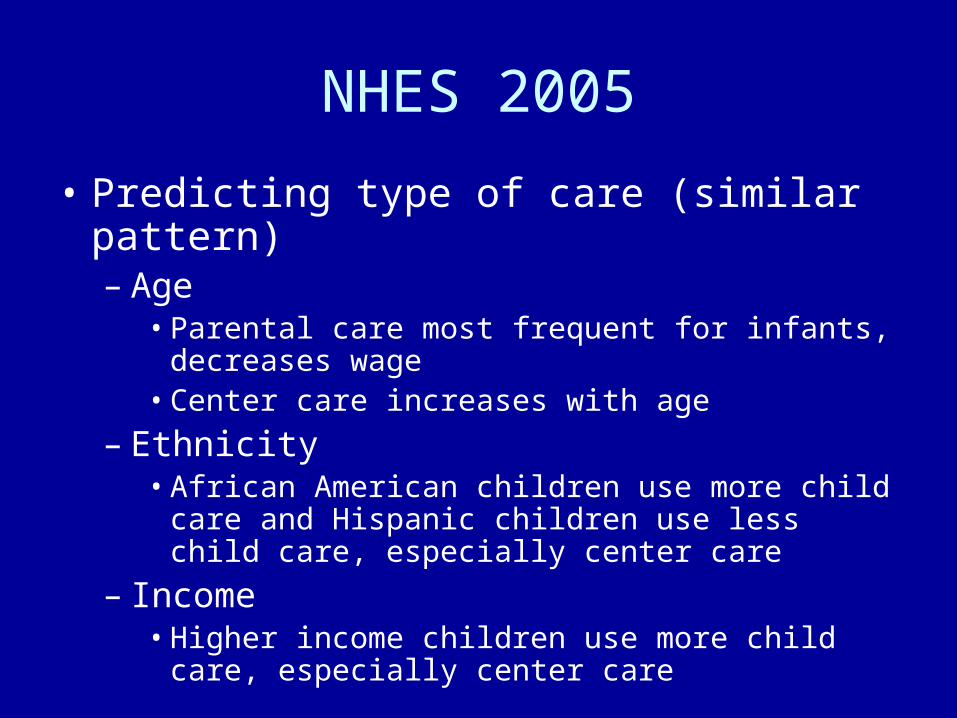
NHES 2005
• Predicting type of care (similar pattern) – Age
• Parental care most frequent for infants, decreases wage
• Center care increases with age
– Ethnicity• African American children use more child care and
Hispanic children use less child care, especially center care
– Income • Higher income children use more child care,
especially center care
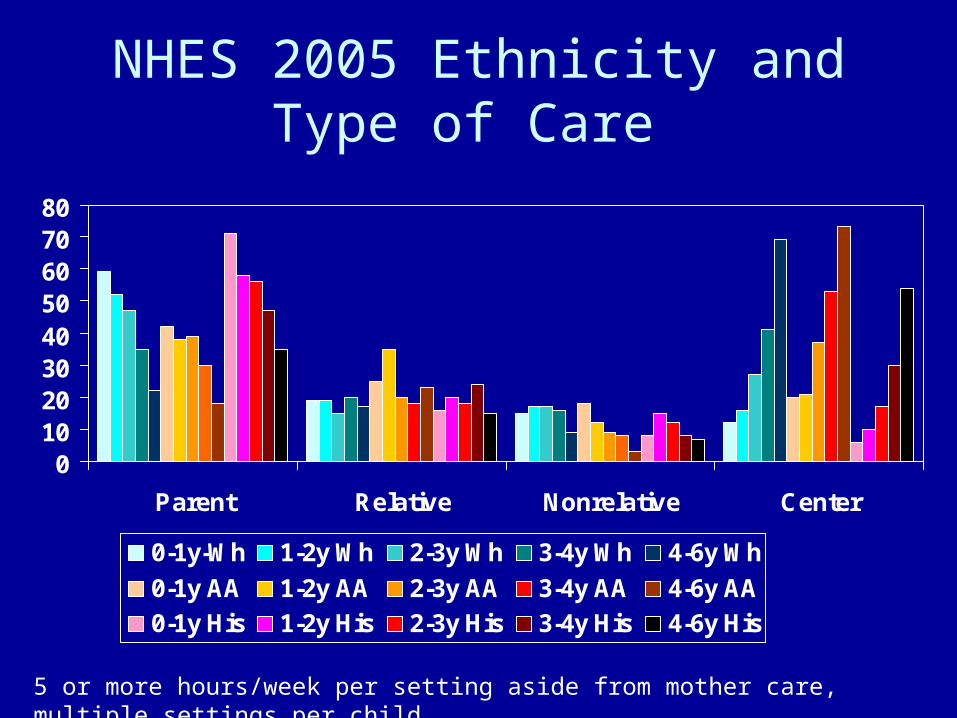
NHES 2005 Ethnicity and Type of Care
01020304050607080
Parent Relative Nonrelative Center
0-1y-Wh 1-2y Wh 2-3y Wh 3-4y Wh 4-6y Wh
0-1y AA 1-2y AA 2-3y AA 3-4y AA 4-6y AA
0-1y His 1-2y His 2-3y His 3-4y His 4-6y His
5 or more hours/week per setting aside from mother care, multiple settings per child
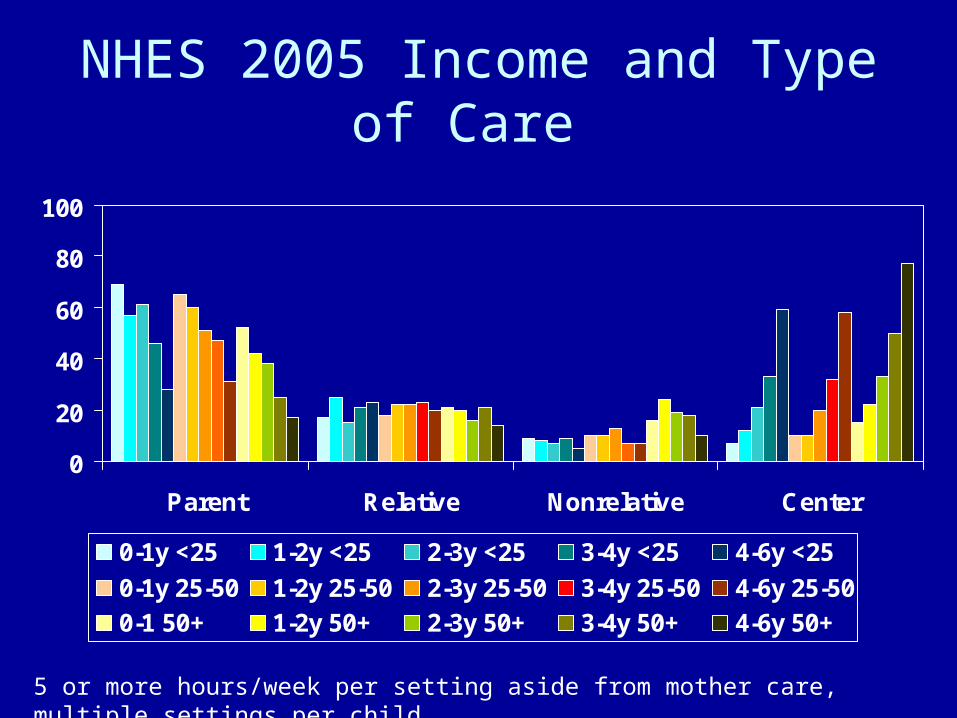
NHES 2005 Income and Type of Care
0
20
40
60
80
100
Parent Relative Nonrelative Center
0-1y <25 1-2y <25 2-3y <25 3-4y <25 4-6y <25
0-1y 25-50 1-2y 25-50 2-3y 25-50 3-4y 25-50 4-6y 25-50
0-1 50+ 1-2y 50+ 2-3y 50+ 3-4y 50+ 4-6y 50+
5 or more hours/week per setting aside from mother care, multiple settings per child
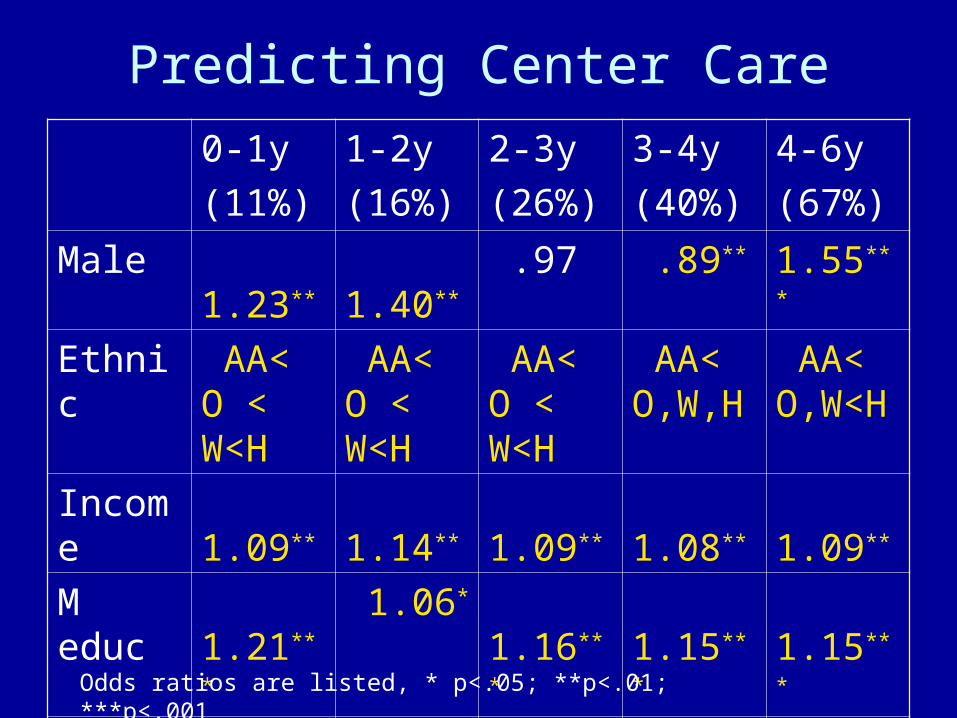
Predicting Center Care
0-1y
(11%)
1-2y
(16%)
2-3y
(26%)
3-4y
(40%)
4-6y
(67%)
Male 1.23** 1.40** .97 .89** 1.55***
Ethnic AA< O < W<H
AA< O < W<H
AA< O < W<H
AA< O,W,H
AA< O,W<H
Income 1.09** 1.14** 1.09** 1.08** 1.09**
M educ 1.21*** 1.06* 1.16*** 1.15*** 1.15***
Partner .45*** .38*** .37*** .68*** .63***
Odds ratios are listed, * p<.05; **p<.01; ***p<.001
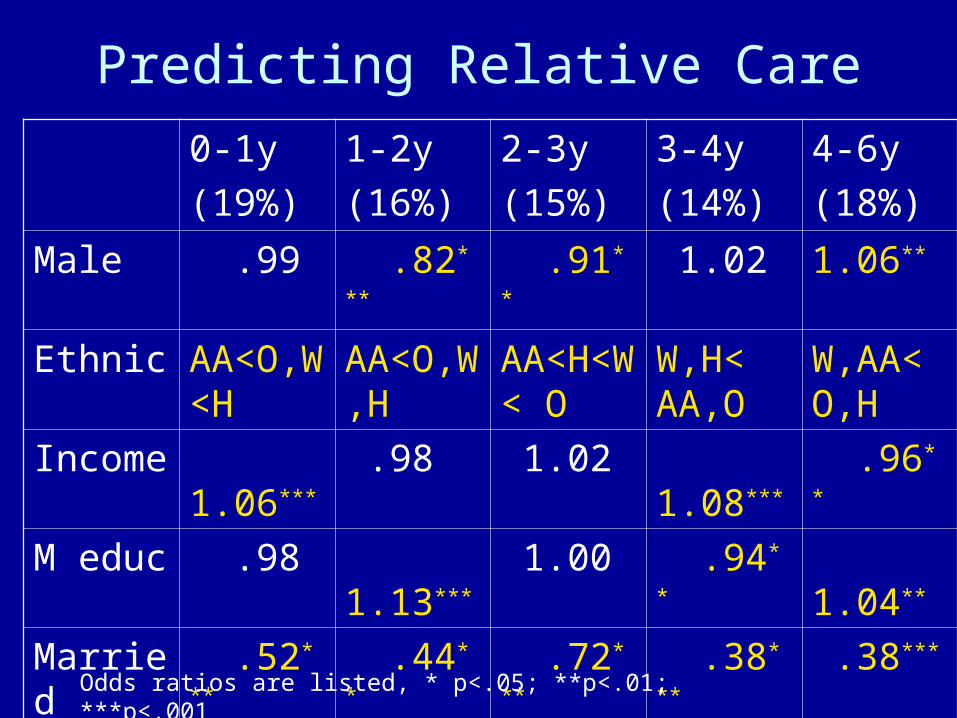
Predicting Relative Care
0-1y
(19%)
1-2y
(16%)
2-3y
(15%)
3-4y
(14%)
4-6y
(18%)
Male .99 .82*** .91** 1.02 1.06**
Ethnic AA<O,W<H
AA<O,W,H
AA<H<W < O
W,H< AA,O
W,AA< O,H
Income 1.06*** .98 1.02 1.08*** .96**
M educ .98 1.13*** 1.00 .94** 1.04**
Married .52*** .44** .72*** .38*** .38***
Odds ratios are listed, * p<.05; **p<.01; ***p<.001
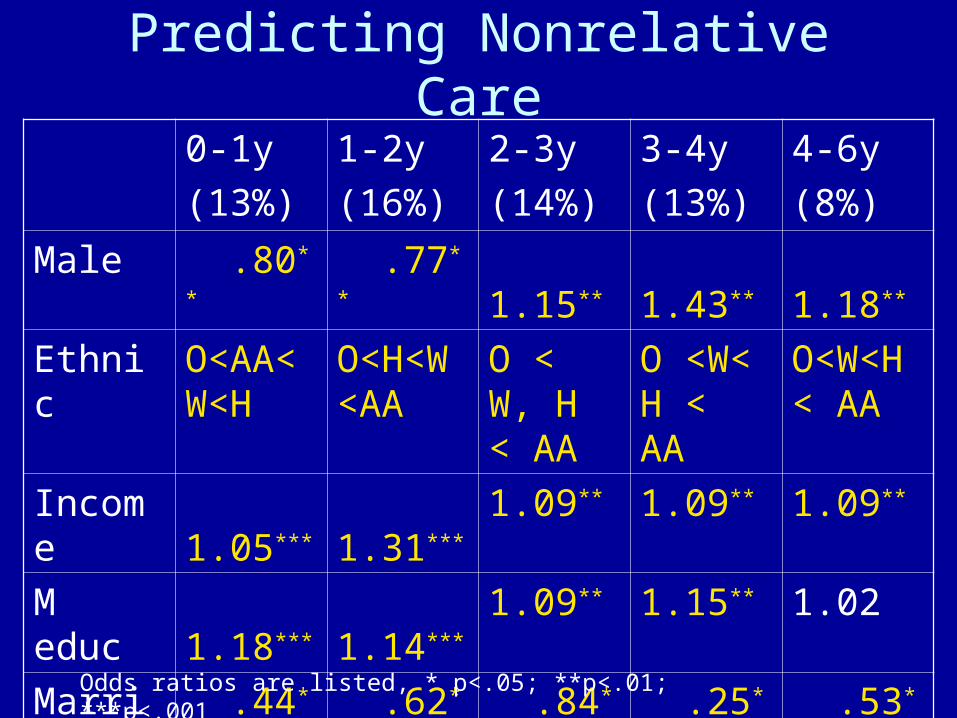
Predicting Nonrelative Care
0-1y
(13%)
1-2y
(16%)
2-3y
(14%)
3-4y
(13%)
4-6y
(8%)
Male .80** .77** 1.15** 1.43** 1.18**
Ethnic O<AA<W<H
O<H<W<AA
O < W, H < AA
O <W< H < AA
O<W<H < AA
Income 1.05*** 1.31*** 1.09** 1.09** 1.09**
M educ 1.18*** 1.14*** 1.09** 1.15** 1.02
Married .44*** .62*** .84*** .25*** .53***
Odds ratios are listed, * p<.05; **p<.01; ***p<.001
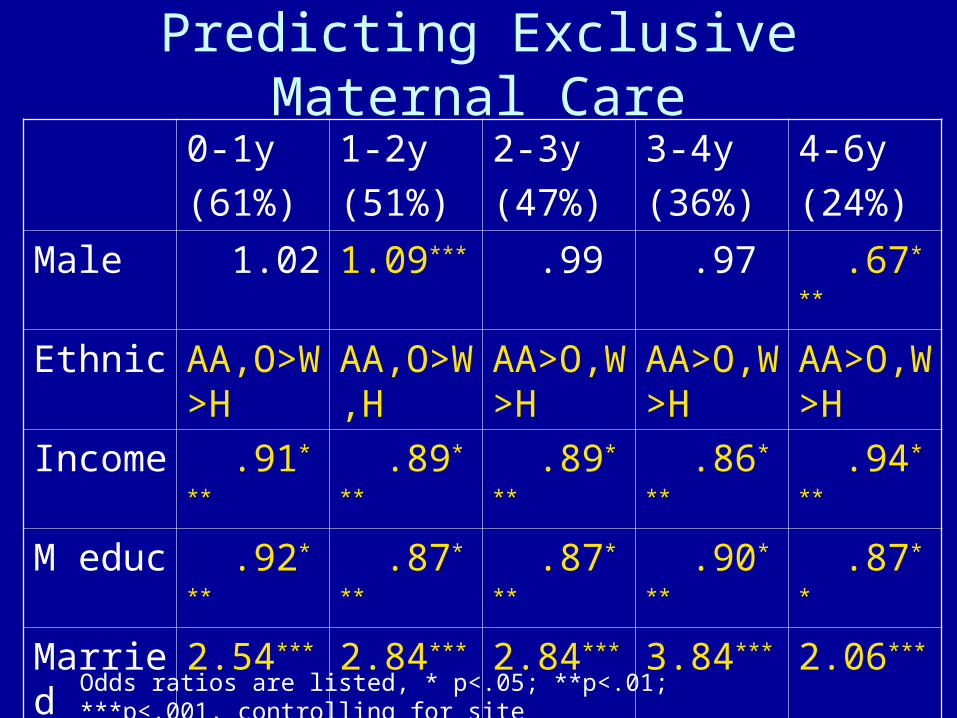
Predicting Exclusive Maternal Care
0-1y
(61%)
1-2y
(51%)
2-3y
(47%)
3-4y
(36%)
4-6y
(24%)
Male 1.02 1.09*** .99 .97 .67***
Ethnic AA,O>W>H
AA,O>W,H
AA>O,W>H
AA>O,W>H
AA>O,W>H
Income .91*** .89*** .89*** .86*** .94***
M educ .92*** .87*** .87*** .90*** .87**
Married 2.54*** 2.84*** 2.84*** 3.84*** 2.06***
Odds ratios are listed, * p<.05; **p<.01; ***p<.001, controlling for site
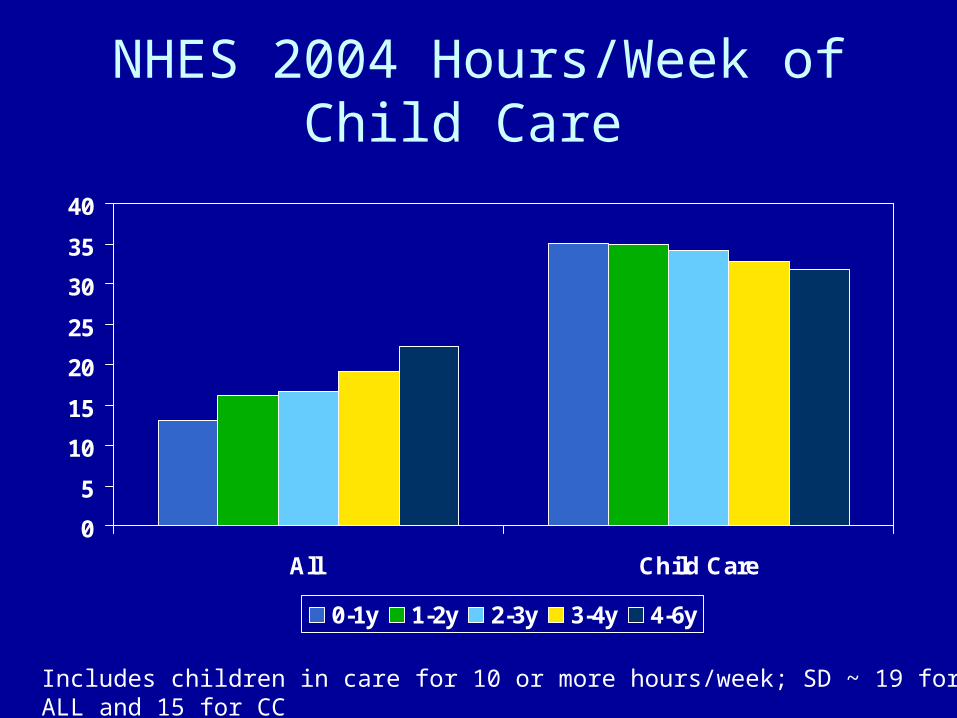
NHES 2004 Hours/Week of Child Care
0
5
10
15
20
25
30
35
40
All Child Care
0-1y 1-2y 2-3y 3-4y 4-6y
Includes children in care for 10 or more hours/week; SD ~ 19 for ALL and 15 for CC
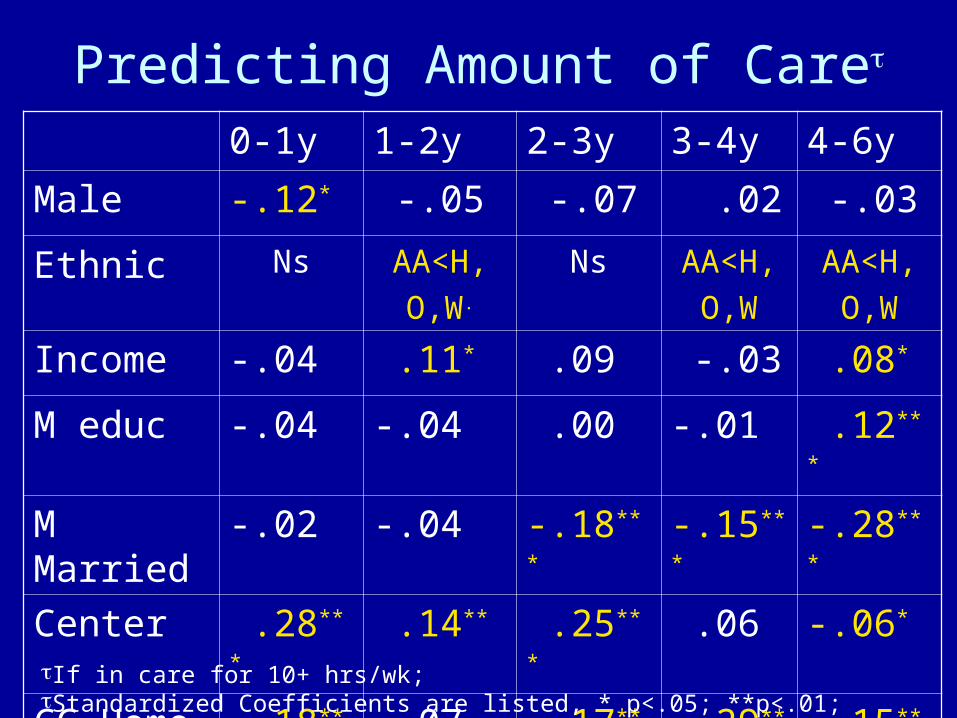
Predicting Amount of Care
0-1y 1-2y 2-3y 3-4y 4-6y
Male -.12* -.05 -.07 .02 -.03
Ethnic Ns AA<H,
O,W.
Ns AA<H,
O,W
AA<H,
O,W
Income -.04 .11* .09 -.03 .08*
M educ -.04 -.04 .00 -.01 .12***
M Married -.02 -.04 -.18*** -.15*** -.28***
Center .28*** .14** .25*** .06 -.06*
CC Home .18*** .07 .17*** .29*** .15***
If in care for 10+ hrs/wk; Standardized Coefficients are listed, * p<.05; **p<.01; ***p<.001
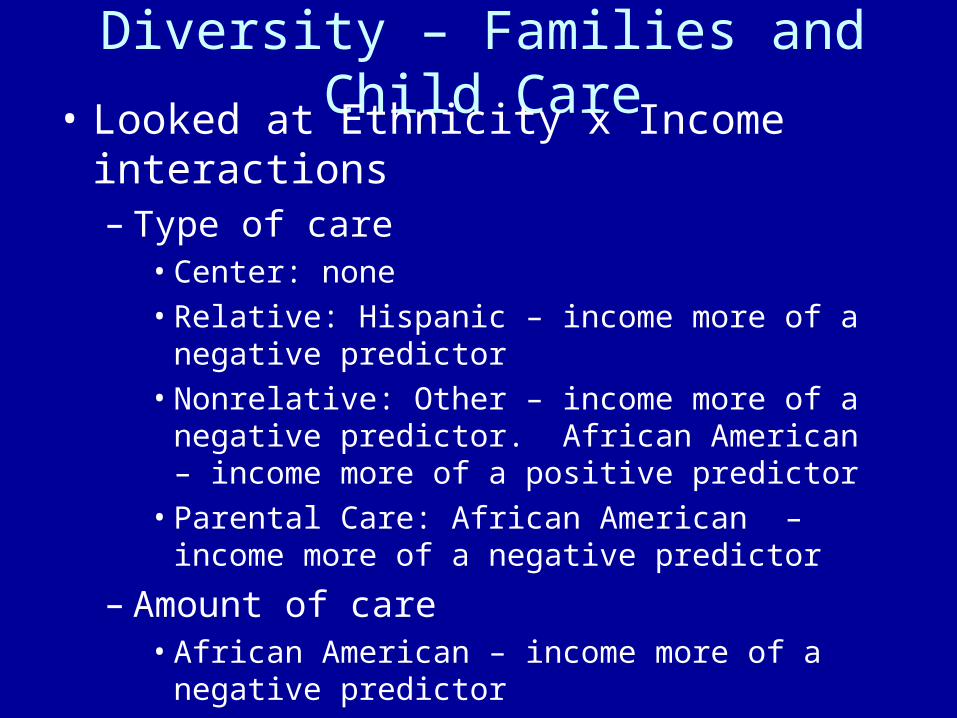
Diversity – Families and Child Care• Looked at Ethnicity x Income interactions
– Type of care • Center: none• Relative: Hispanic – income more of a negative
predictor• Nonrelative: Other – income more of a negative
predictor. African American – income more of a positive predictor
• Parental Care: African American – income more of a negative predictor
– Amount of care• African American – income more of a negative
predictor

Multi-State Study of Pre-Kindergarten &
Study of State-Wide Early Education Programs
(SWEEP)
Funded by the: U.S. Department of Education,National Institute for Early Education Research (NIEER) & The Foundation for Child Development
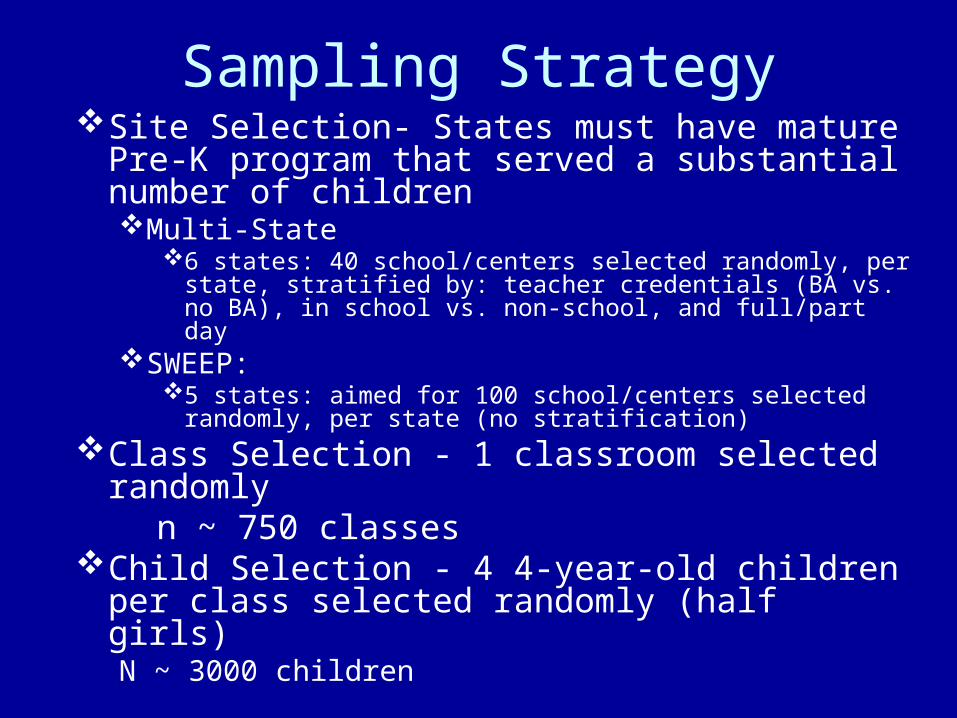
Sampling StrategySite Selection- States must have mature Pre-K
program that served a substantial number of childrenMulti-State
6 states: 40 school/centers selected randomly, per state, stratified by: teacher credentials (BA vs. no BA), in school vs. non-school, and full/part day
SWEEP: 5 states: aimed for 100 school/centers selected randomly,
per state (no stratification)Class Selection - 1 classroom selected randomly n ~ 750 classesChild Selection - 4 4-year-old children per class
selected randomly (half girls) N ~ 3000 children
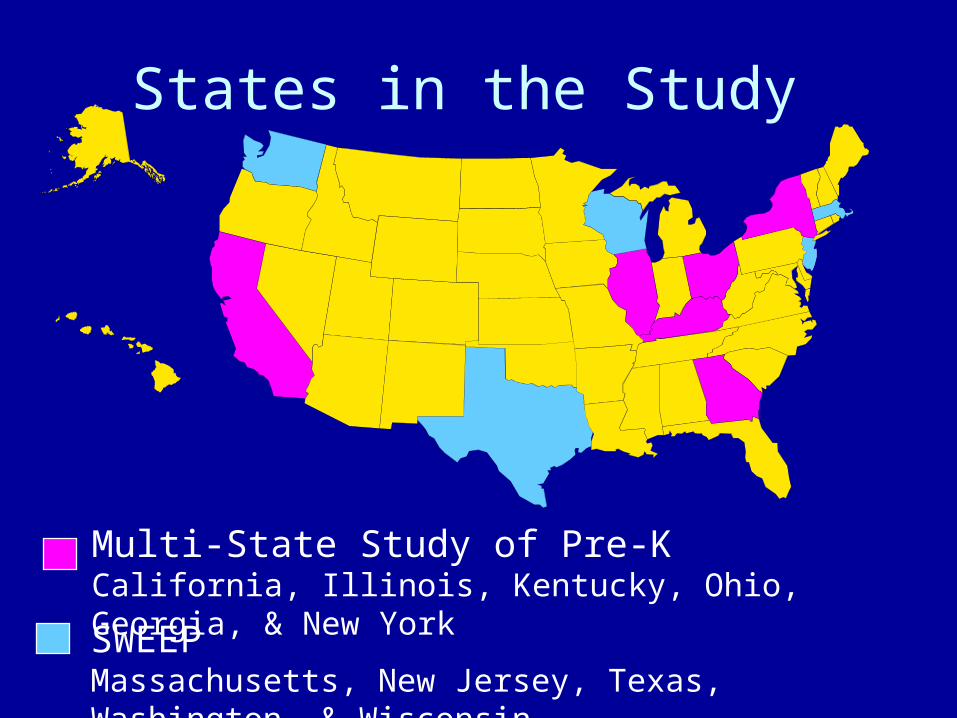
Multi-State Study of Pre-K California, Illinois, Kentucky, Ohio, Georgia, & New York
States in the Study
SWEEPMassachusetts, New Jersey, Texas, Washington, & Wisconsin

Pre-Kindergarten Classrooms
Teacher educationMA or higher 22%BA 58%AA 15%CDA only 14%HS <1%
State Teaching Certification 57%
Location - Public School 53%
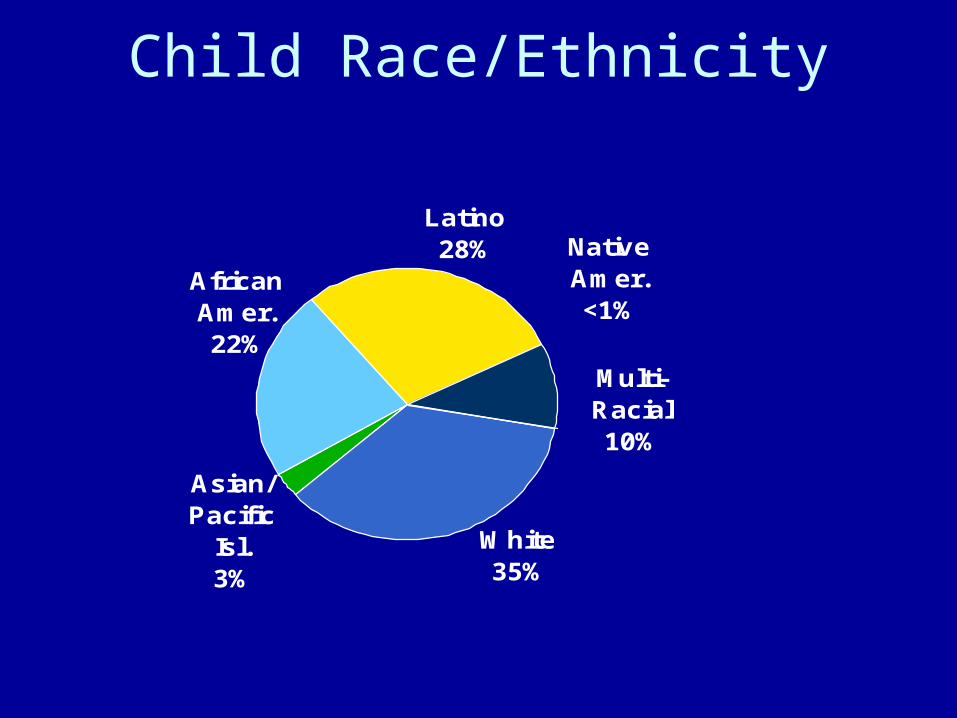
Child Race/Ethnicity
White35%
Asian/ Pacific
Isl.3%
Native Amer.<1%
African Amer.22%
Multi-Racial10%
Latino28%
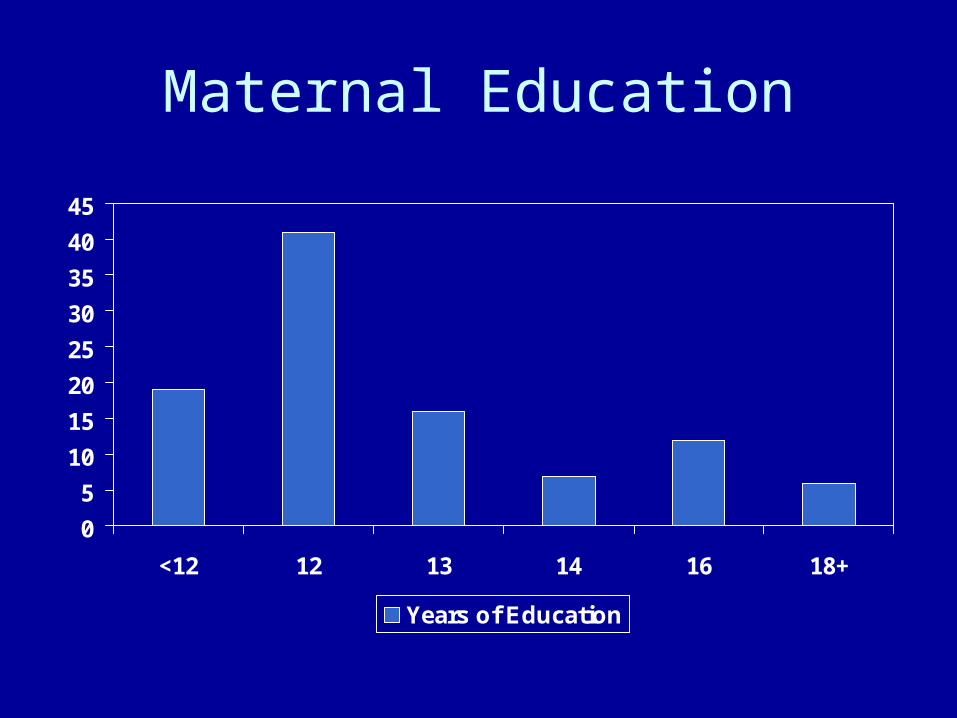
Maternal Education
0
5
10
15
20
25
30
35
40
45
<12 12 13 14 16 18+
Years of Education
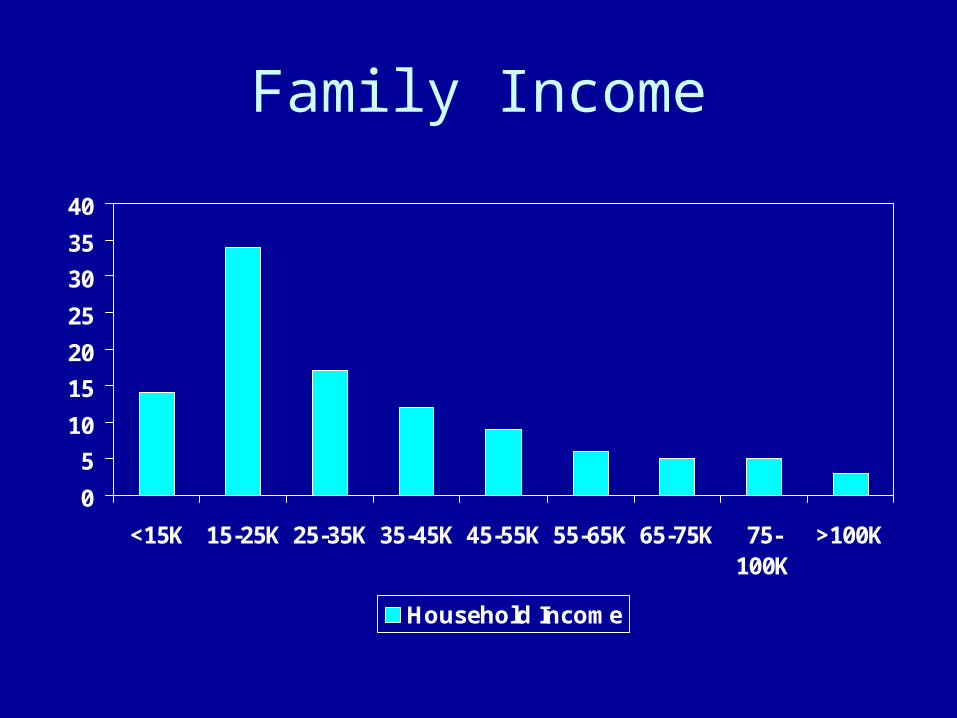
Family Income
0
5
10
15
20
25
30
35
40
<15K 15-25K 25-35K 35-45K 45-55K 55-65K 65-75K 75-100K
>100K
Household Income
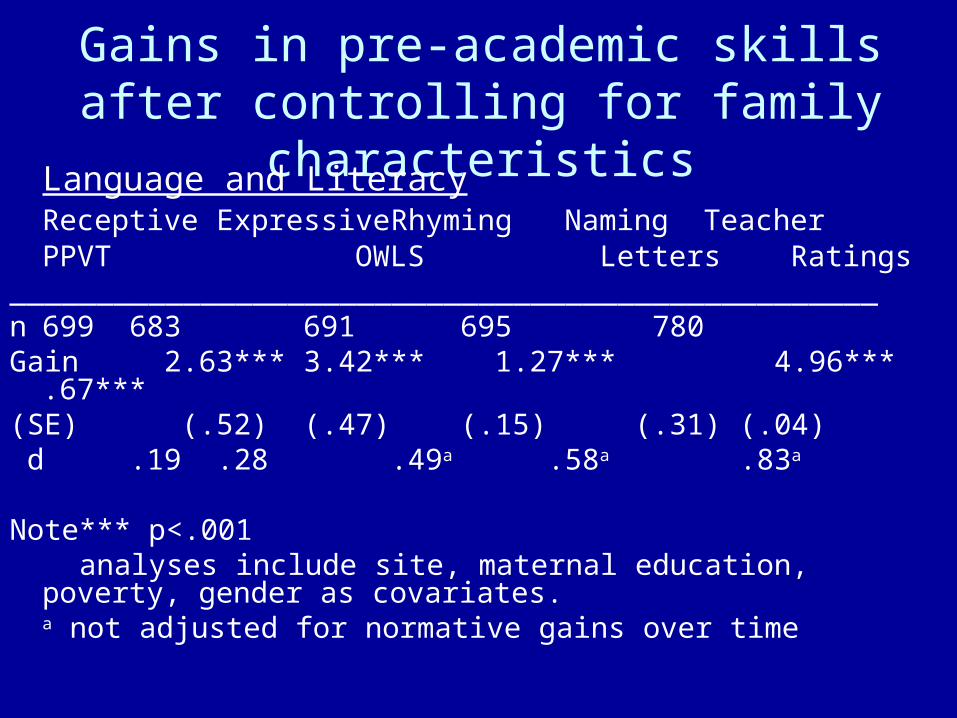
Gains in pre-academic skills after controlling for family characteristics
Language and LiteracyReceptive Expressive Rhyming Naming TeacherPPVT OWLS Letters Ratings
__________________________________________________n 699 683 691 695 780Gain 2.63*** 3.42*** 1.27*** 4.96*** .67***(SE) (.52) (.47) (.15) (.31) (.04) d .19 .28 .49a .58a .83a
Note*** p<.001 analyses include site, maternal education, poverty, gender as
covariates.a not adjusted for normative gains over time
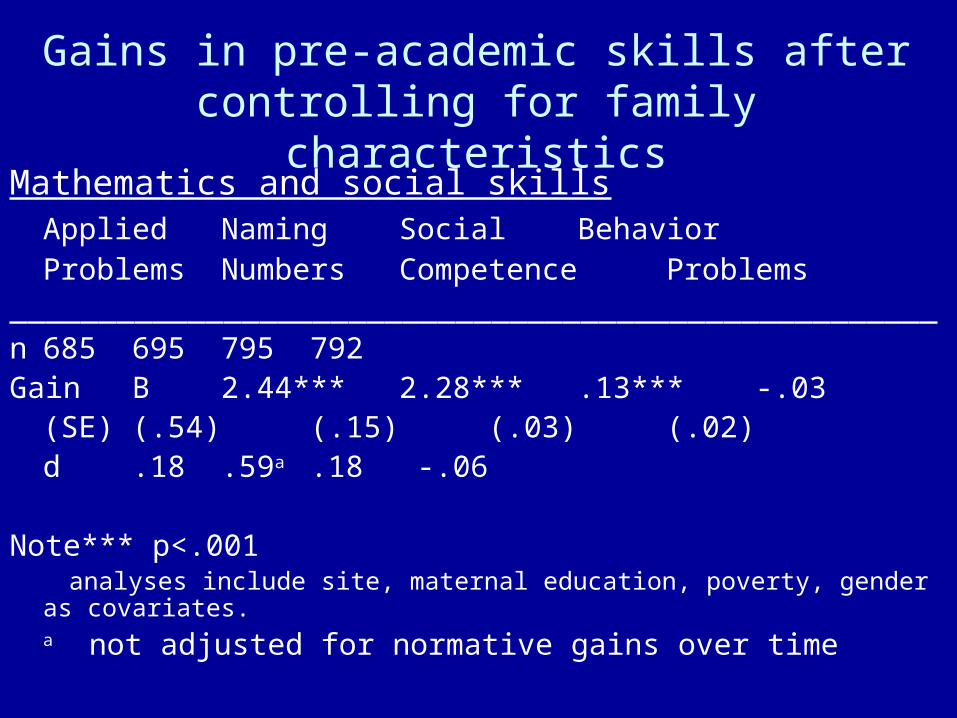
Gains in pre-academic skills after controlling for family characteristics
Mathematics and social skillsApplied Naming Social BehaviorProblems Numbers Competence Problems
____________________________________________________n 685 695 795 792Gain B 2.44*** 2.28*** .13*** -.03
(SE) (.54) (.15) (.03) (.02) d .18 .59a .18 -.06
Note*** p<.001 analyses include site, maternal education, poverty, gender as covariates.
a not adjusted for normative gains over time
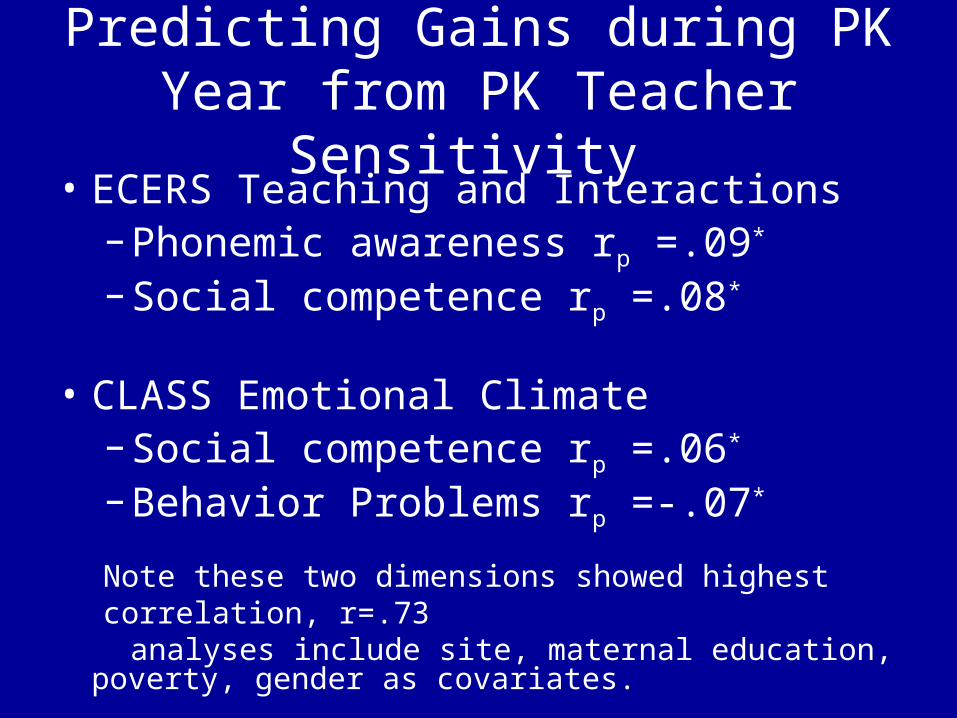
Predicting Gains during PK Year from PK Teacher Sensitivity
• ECERS Teaching and Interactions– Phonemic awareness rp =.09*
– Social competence rp =.08*
• CLASS Emotional Climate– Social competence rp =.06*
– Behavior Problems rp =-.07*
Note these two dimensions showed highest correlation, r=.73
analyses include site, maternal education, poverty, gender as covariates.
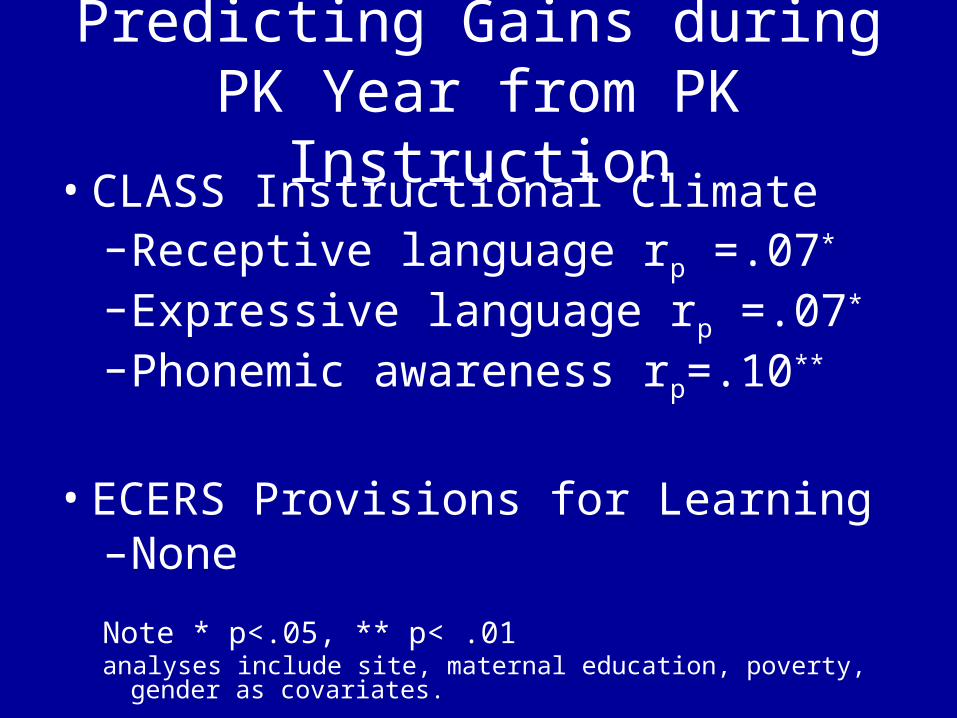
Predicting Gains during PK Year from PK Instruction
• CLASS Instructional Climate–Receptive language rp =.07*
–Expressive language rp =.07*
–Phonemic awareness rp=.10**
• ECERS Provisions for Learning–None
Note * p<.05, ** p< .01 analyses include site, maternal education, poverty, gender as
covariates.
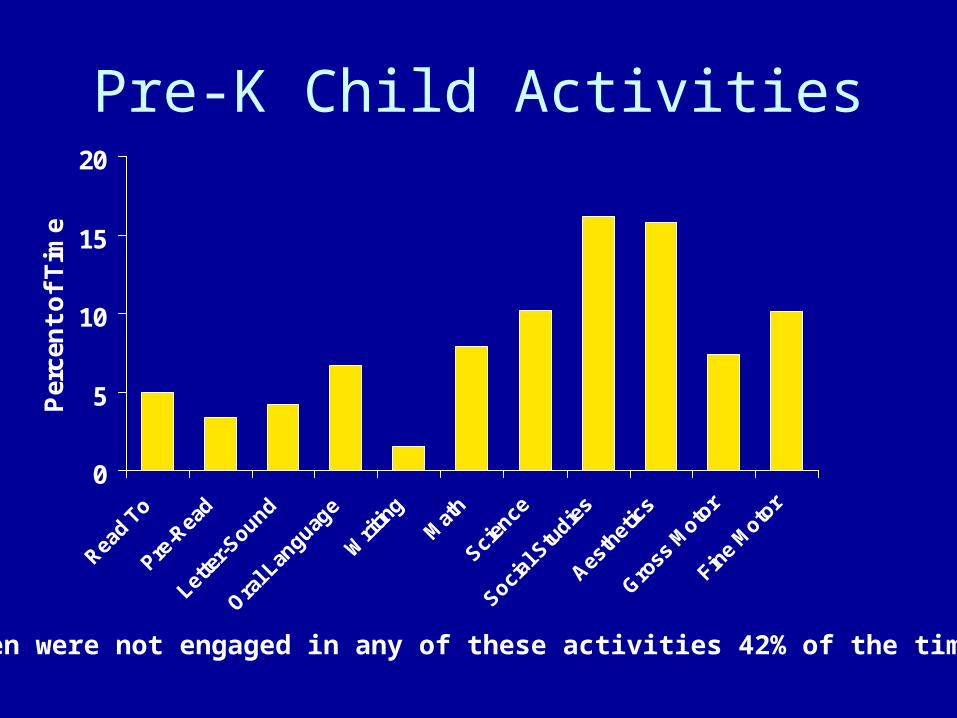
Pre-K Child Activities
0
5
10
15
20
Per
cen
t o
f T
ime
Children were not engaged in any of these activities 42% of the time.
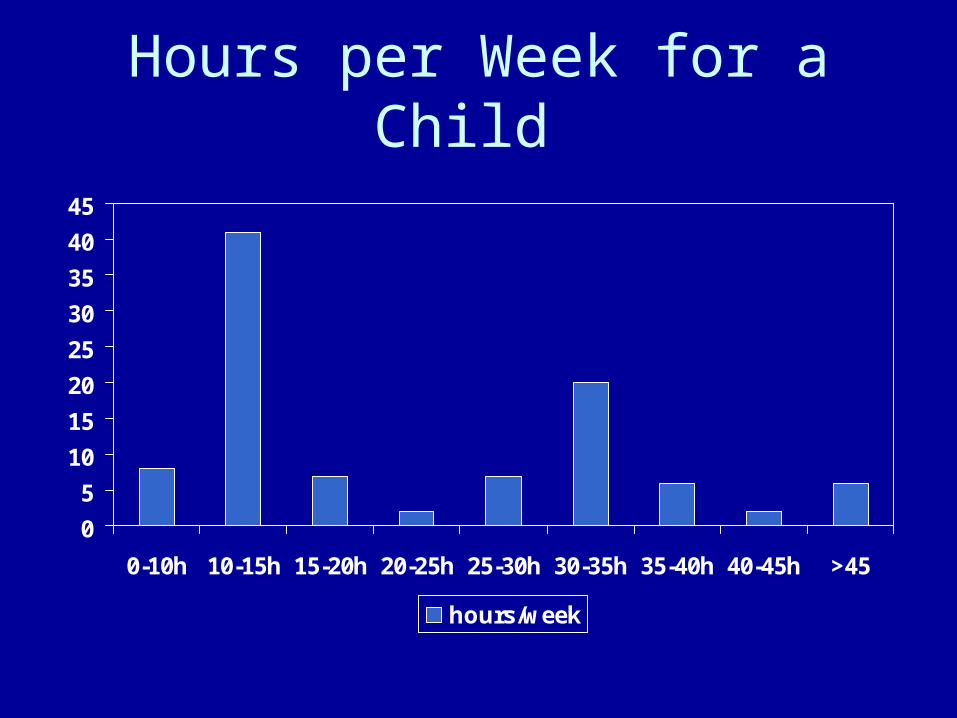
Hours per Week for a Child
0
5
10
15
20
25
30
35
40
45
0-10h 10-15h 15-20h 20-25h 25-30h 30-35h 35-40h 40-45h >45
hours/week
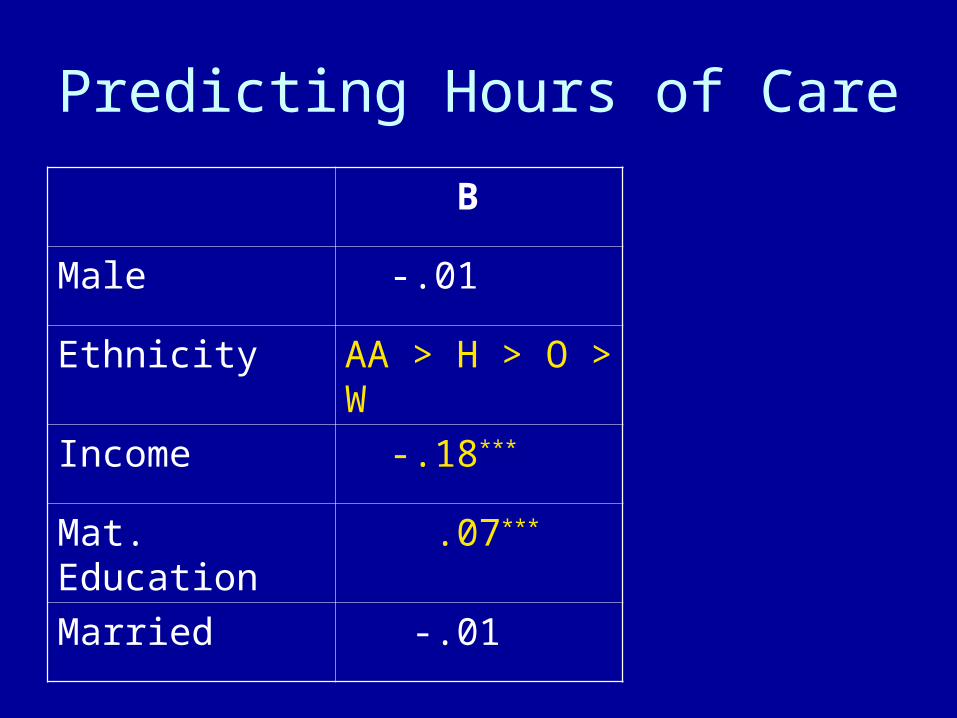
Predicting Hours of Care
B
Male -.01
Ethnicity AA > H > O > W
Income -.18***
Mat. Education .07***
Married -.01
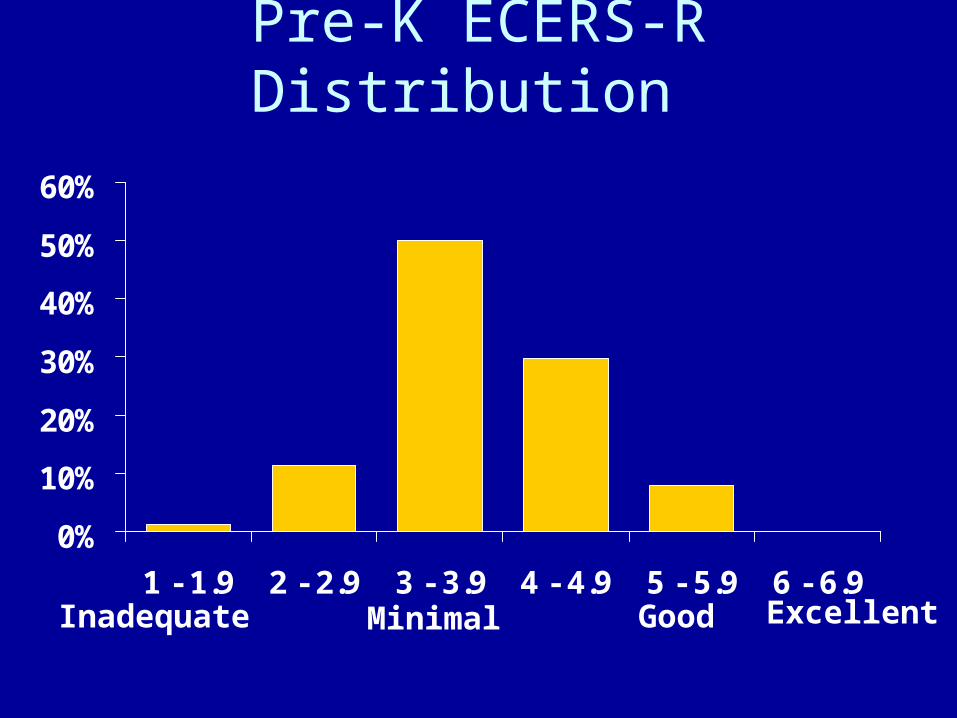
Pre-K ECERS-R Distribution
0%
10%
20%
30%
40%
50%
60%
1 - 1.9 2 - 2.9 3 - 3.9 4 - 4.9 5 - 5.9 6 - 6.9MinimalInadequate Good Excellent
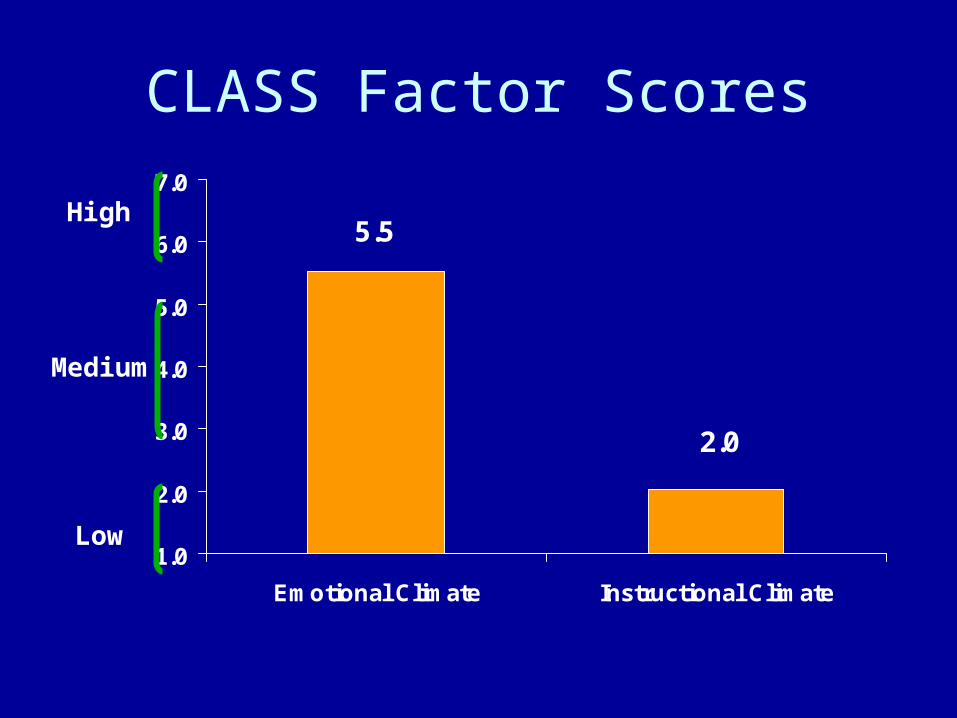
CLASS Factor Scores
5.5
2.0
1.0
2.0
3.0
4.0
5.0
6.0
7.0
Emotional Climate Instructional Climate
Medium
Low
High
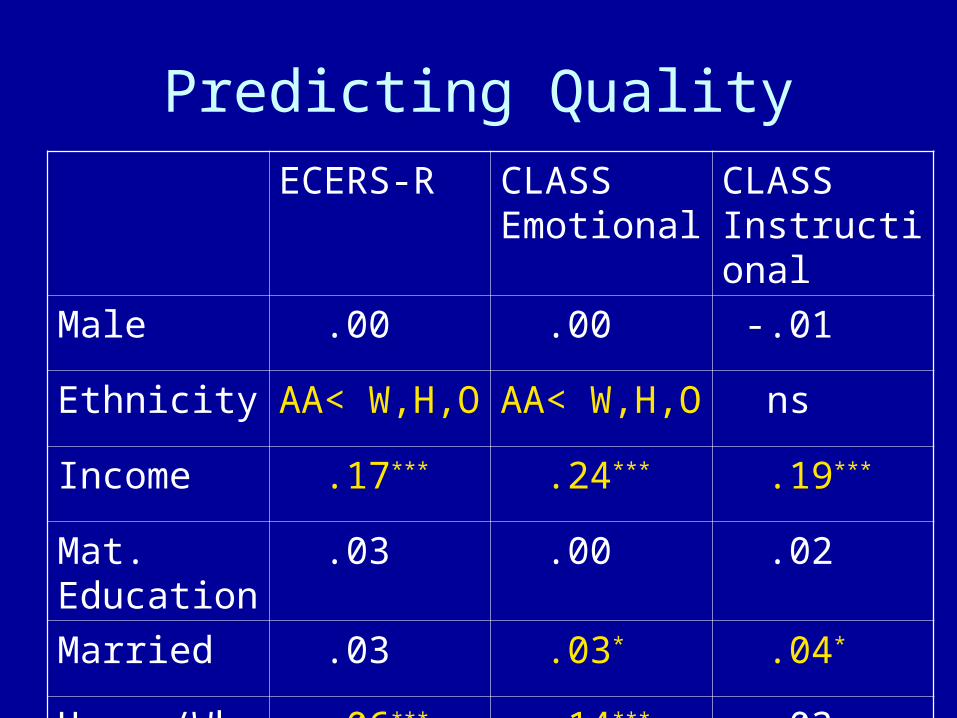
Predicting Quality
ECERS-R CLASS Emotional
CLASS Instructional
Male .00 .00 -.01
Ethnicity AA< W,H,O AA< W,H,O ns
Income .17*** .24*** .19***
Mat. Education
.03 .00 .02
Married .03 .03* .04*
Hours/Wk .06*** -.14*** .03
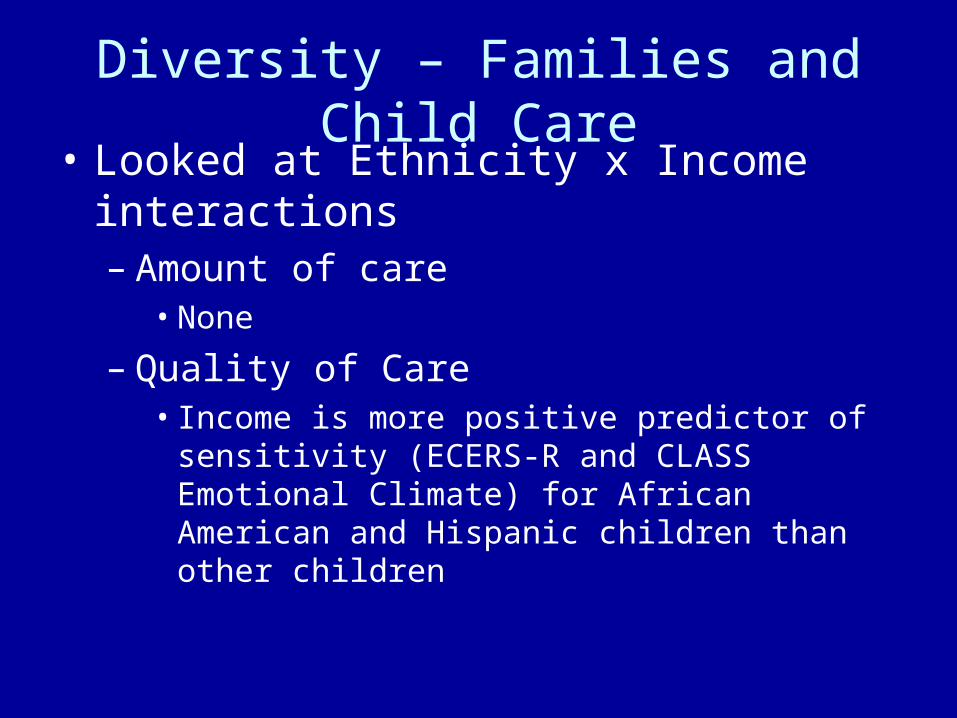
Diversity – Families and Child Care• Looked at Ethnicity x Income interactions
– Amount of care• None
– Quality of Care• Income is more positive predictor of sensitivity
(ECERS-R and CLASS Emotional Climate) for African American and Hispanic children than other children
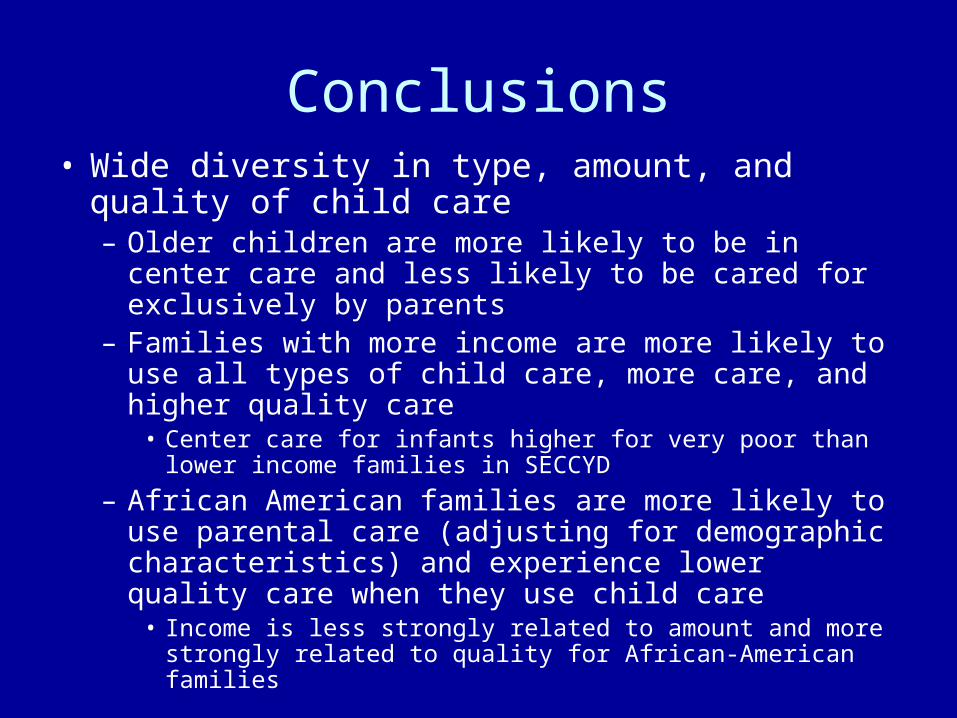
Conclusions• Wide diversity in type, amount, and quality of
child care– Older children are more likely to be in center care and
less likely to be cared for exclusively by parents– Families with more income are more likely to use all
types of child care, more care, and higher quality care• Center care for infants higher for very poor than lower
income families in SECCYD
– African American families are more likely to use parental care (adjusting for demographic characteristics) and experience lower quality care when they use child care
• Income is less strongly related to amount and more strongly related to quality for African-American families
Conclusions
• Child care quality, quantity, and type are modestly related to some outcomes– Limited evidence that associations stronger
for at risk children