Embed Size (px)
Citation preview
Childhood Obesity � Food Advertising in Context
Children�s food choices, parents� understanding and influence, and the role of food promotion
Issued: 22 July 2004
1
ContentsContents.................................................................................................................. 1Glossary.................................................................................................................. 3Introduction ............................................................................................................ 41 Executive Summary & Conclusions ......................................................... 71.1 Lifestyle trends influencing British �food culture�........................................... 8 1.2 What are children eating? ............................................................................ 9 1.2.1 Demographic differences................................................................... 10 1.3 What factors influence children�s food choice? .......................................... 10 1.3.1 The role of parents ............................................................................ 11 1.3.2 The role of schools ............................................................................ 12 1.4 The role of television advertising................................................................ 13 1.4.1 Television advertising: direct effects.................................................. 13 1.4.2 Television advertising: indirect effects............................................... 14 1.5 Viewing patterns and advertising spend..................................................... 14 1.5.1 Children�s viewing patterns................................................................ 14 1.5.2 Advertising spend .............................................................................. 15 1.5.3 Advertising seen ................................................................................ 16 1.6 How advertising works ............................................................................... 16 1.6.1 Differences in reactions to advertising............................................... 16 1.6.2 Creative executions used to target children ...................................... 17 1.7 What parents and children say about television advertising ...................... 17 1.7.1 Parents� and children�s reactions to advertising ................................ 17 1.7.2 Influence of branding ......................................................................... 18 1.7.3 Parents� views on regulation.............................................................. 19 1.8 Differences between obese and normal weight children............................ 20 1.8.1 Diet .................................................................................................... 20 1.8.2 Attitudes, beliefs and behaviour ........................................................ 21 1.9 Conclusions................................................................................................ 23
2 Background .............................................................................................. 262.1 Obesity and the health of the nation�s children .......................................... 26 2.1.1 International trends in obesity............................................................ 26 2.1.2 European trends in obesity................................................................ 27 2.1.3 Social inequalities.............................................................................. 28 2.1.4 Obesity amongst children .................................................................. 29 2.1.5 Health risks........................................................................................ 31 2.1.6 Economic costs ................................................................................. 32 2.2 Causes of obesity....................................................................................... 33 2.2.1 Concerns about national levels of physical activity ........................... 33 2.2.2 Research on links between obesity and lack of physical exercise .... 34 2.2.3 Concerns about national diet............................................................. 36 2.2.4 Research on links between obesity and consumption of foods high in
fats, salt and sugar (HFSS foods) ..................................................... 37 2.3 Calls for action............................................................................................ 40 2.3.1 W.H.O. recommendations ................................................................. 40 2.3.2 The British response so far................................................................ 40
2
3 Research Findings ................................................................................... 443.1 Lifestyle changes and their impact on contemporary food culture in the UK 47 3.1.1 More pre-prepared/ convenience foods............................................. 47 3.1.2 More eating outside the home ........................................................... 50 3.1.3 A snacking/grazing culture ................................................................ 52 3.1.4 More �child(ren)-only� meals .............................................................. 54 3.1.5 Increasing influence of child over food choice................................... 57 3.2 What children eat ....................................................................................... 62 3.2.1 High consumption of HFSS foods ..................................................... 62 3.2.2 Low consumption of fruit and vegetables .......................................... 63 3.2.3 Eating patterns across the day .......................................................... 67 3.2.4 HFSS consumption: correlational analysis of the NOP survey data.. 79 3.3 Factors influencing children�s food choice.................................................. 81 3.3.1 The role of parents ............................................................................ 83 3.3.2 The role of the school ........................................................................ 94 3.4 The role of television advertising................................................................ 99 3.4.1 The effects of television advertising .................................................. 99 3.4.2 The relative importance of TV advertising: what parents and children
say ................................................................................................... 101 3.4.3 Indirect effects: �the web of causality� .............................................. 110 3.5 Children�s viewing patterns and advertising size, spend and impact ............ ................................................................................................................. 115 3.5.1 The window of opportunity for advertisers: how much time do children
spend watching commercial television? .......................................... 116 3.5.2 Size and spend of the food advertising market: How much do
advertisers invest in TV advertising?............................................... 122 3.6 Processes of persuasion � how advertising works................................... 131 3.6.1 Age-related differences in media/advertising literacy ...................... 131 3.6.2 Advertising literacy: how does it relate to advertising effects? ....... 131 3.6.3 Towards a model of persuasion ...................................................... 132 3.6.4 Types of creative execution............................................................. 133 3.7 What do parents and children say about television advertising? ............. 140 3.7.1 Children�s reactions ......................................................................... 140 3.7.2 Parents� reactions............................................................................ 141 3.7.3 Parents� views on regulation............................................................ 146 3.7.4 Regulation of advertising to children in other countries................... 150 3.8 Differences between obese and normal weight children.......................... 155 3.8.1 Diet .................................................................................................. 155 3.8.2 Profiles............................................................................................. 161
4 Conclusions............................................................................................ 176
3
Glossary
¶ Big 5 = confectionery, soft drinks, crisps/savoury snacks, fast food, pre- sugared breakfast cereals
¶ Big 6 = as Big 5 plus pre-prepared convenience foods
¶ Core Categories = (all) food, soft drinks, fast food chains
¶ HFSS = high in fat, salt and sugar
¶ FSS = fat, salt and sugar
¶ BARB and Nielsen definition of children = aged 4-15 years
Introduction
4
IntroductionOfcom (the Office of Communications) is the new regulator for the UK communications industries, with responsibilities across television, radio, telecommunications and wireless communications services. It was established on 29th December 2003, and replaces the Independent Television Commission, the Radio Authority, the Broadcasting Standards Commission, Oftel and the Radio Communications Agency.
In view of increasing concerns about levels of obesity amongst British children and suggestions that changes in diet are likely be a contributory cause, the Secretary for Culture, Media and Sport, Tessa Jowell, asked Ofcom at the end of 2003 to consider �targeted and proportionate� proposals for strengthening the existing code on TV advertising in respect of food and drink to children.
In response to this request, Ofcom conducted a wide-ranging research project during the first half of 2004. This multi-faceted project provides a robust evidence base that helps in understanding the role that TV advertising plays in influencing children�s food and drink consumption in the context of the whole spectrum of influences. It draws together information from previous academic research, national food surveys and lifestyle research, re-analysis of information already available in food industry and broadcasting databases, as well as new, bespoke qualitative and quantitative projects.
The findings from this research, summarised in this report, are intended to provide an important input to Ofcom�s response to the Secretary of State and the review of the provisions of the Advertising Standards Code relating to the promotion of food and drink to children.
Involvement in the area of food promotion to children raises questions about the scope of Ofcom�s role:
¶ On the one hand, Ofcom has under the Communications Act 2003 a duty of protection to citizens in general and to children in particular.1 The protection of children is an explicit duty in respect of Ofcom�s broadcasting standards objectives, and Parliament requires Ofcom to ensure that broadcast advertising does not offend, harm or mislead viewers and listeners as a whole.
¶ On the other hand, any consideration of restrictive rules aimed at protecting viewers must be balanced against the need to act proportionately and if necessary intervene effectively, and to ensure a healthy broadcasting ecology. This does not mean that regulation cannot have a cost to broadcasters or advertisers, but that cost must be set against the benefits to citizens. Regulation which has a severe negative economic impact on broadcasters, or on a particular group of stakeholders, is unlikely to be acceptable unless it has a correspondingly clear and significant social benefit. Looking ahead, therefore, another important input to the Code review will be a full regulatory impact assessment (RIA) of any policy options that Ofcom might put forward in the light of the research evidence.
1 The protection of children is also enshrined in European Broadcasting law.
Introduction
5
In this report the following key questions are addressed:
¶ What are the key lifestyle trends in the UK today that influence contemporary food culture? (Section 3.2)
¶ What are children in the UK eating? (Section 3.3)
¶ What is the range of factors influencing children�s food choice? (Section 3.4)
¶ How different are the diet, behaviour and attitudes of the obese child? (Section 3.5)
¶ How much time do children spend watching, and how much do advertisers invest, in television advertising? (Section3.6)
¶ How does advertising work? (Section 3.7)
¶ What do parents and children say about advertising? (section 3. 8)
The present Ofcom report focuses on the effects of the advertising on television of products high in fats, salt and sugar (HFSS) to children and the link with obesity. It is concerned only tangentially with the influence of physical activity on children�s health and obesity levels.
Throughout our research we have remained fully aware that fat, salt and sugar are important and necessary parts of any diet. HFSS products are not �unhealthy� per se but can be if they form a disproportionate part of a diet.
We recognised that there was an urgent need for evidence-based assessment of the full spectrum of influences on children�s food choice and their relative importance, if any future interventions in the field of broadcasting regulations are to be properly targeted as well as successful. As a result our enquiry has focused on, but not been limited to, the exploration of the influence of television advertising. Instead we have tried wherever possible to assess its role within the context of other influences affecting children�s food choice including promotion in media other than television. It is our hope, therefore, that the information summarised in this report will make a contribution to the wider national debate about the full range of influences which can lead to obesity both in terms of �calories in� and �calories out�.
Introduction
6
Ofcom�s Current Rules
Ofcom is required by the Communications Act 20032 to ensure that broadcasters meet a range of standards objectives for programmes and advertisements and to draw up codes of practice to assist broadcasters in meeting these standards. Compliance with the codes is mandatory, and is a condition of being a broadcast licence holder. Ofcom�s Codes contain a number of rules relating to children and to food. Amongst these are:
¶ Advertisements in which personalities or other characters (including puppets etc.) who appear regularly in any children�s television programme � present or positively endorse products or services of special interest to children, may not be advertised before 9pm.3
¶ Advertisements must not directly advise or ask children to buy or to ask their parents or others to make enquiries or purchases.4
¶ Nutrition claims (e.g. �full of the goodness of vitamin C�) or health claims (e.g. �aids a healthy digestion�) must be supported by sound scientific evidence. Advertising must not give a misleading impression of the nutritional or health benefits of the product as a whole.5
¶ Advertisements must not encourage or condone excessive consumption of any food (Note: Interpretation of this rule should be by reference to current generally accepted nutritional advice�).6
¶ Advertisements must not disparage good dietary practice. Comparisons between products must not discourage the selection of options such as fresh fruit and vegetables which accepted dietary opinion recommends should form a greater part of the average diet.7
2 See The Communications Act 2003, Sections 319, 321 and 325 3 Rules on the Amount and Scheduling of Advertising (RASA) 4.3.4 (a). 4 Advertising Standards Code 7.2.1 Direct Exhortation 5 Advertising Standards Code 8.3.1 Accuracy in food advertising 6 Advertising Standards Code 8.3.2 Excessive consumption 7 Advertising Standards Code 8.3.3 Comparisons and good dietary practice.
Executive Summary & Conclusions
7
1 Executive Summary & Conclusions This summary and the report that follows draw upon the results of:
¶ two reviews of academic literature8
¶ background data on national lifestyle changes9
¶ re-analysis of market data on family food purchase and consumption10
¶ analysis of BARB audience data11
¶ analysis of data from Nielsen Media Research on the advertising market12
¶ content analysis of food advertising on ITV113
¶ bespoke qualitative14 and quantitative15 research commissioned by Ofcom to identify influences on children�s food preferences, purchase behaviour and consumption and the role of TV advertising in this context.
These two studies were designed to explore the role of food promotion in general, and TV advertising in particular, on children�s food preference, purchase behaviour and consumption, in order to provide input to the review of the provisions of the Advertising Standards Code. More specifically, these two newly commissioned qualitative and quantitative studies examine the impact of TV advertising, relative to other influences and other forms of promotion, on the consumption of HFSS (high in fat, salt and sugar) foods.
8 Sonia Livingstone (2004) A commentary on the research evidence regarding the effects of food promotion on children; Sonia Livingstone and Ellen Helsper (2004) Advertising HFSS Foods to Children: Understanding Promotion In The Context Of Children�s Daily Lives. See appendix 1 and 2.
9 Report prepared by the Henley Centre for Ofcom.
10 From Taylor Nelson Sofres (TNS) Food Panels. The TNS Family Food Panel includes 11,000 individuals within 4,200 households who record their food and drink consumption in diaries. It is the UK�s largest database tracking food and drink consumption. The TNS Superpanel consists of 15,000 GB households demographically and regionally representative of the total household population. Food purchasing is recorded using palm pilot technology (bar code detail) and the information is collected through telephone line.
11 BARB TV viewing data - See Appendix 3.
12 Nielsen Media Research spend data - See Appendix 4.
13 David Graham and Associates were commissioned by Ofcom to conduct content analysis to help understand the types of creative executions used by advertisers to target children. The analysis involved the recording of advertisements shown on ITV1 in the HTV West region across 7 days between September-November 2003. Over 900 commercial spots were analyzed across the entire period, including 156 food, soft drink and fast food commercials � see Appendix 5.
14Ruth Foulds (2004) Food Promotion and Children. Fuller details of the qualitative methodology are found in section 3.
15 Survey conducted for Ofcom by NOP. Fuller details of the quantitative methodology are found in section 3.
Lifestyle Trends
8
1.1 Lifestyle trends influencing British �food culture�16
¶ Lifestyle trends in the UK (rising incomes, longer working hours, more working mothers, time-poor/cash-rich parents) tend to support a �convenience food culture� and the increased consumption of HFSS foods.17
¶ The demand for ready-meals in Britain grew by 44% between 1990 and 2002, while growth across Europe as a whole was 29%.18 Britain is now consuming double the amount of ready-meals consumed in France and six times the number in Spain. 80% of households in the UK have a microwave, compared with 27% in Italy.
¶ In Ofcom�s qualitative research many mothers19 talked of having no time to do �proper cooking� and there was a feeling that real cooking is hard work. An abundance of processed products which don�t need forward planning and require little if any preparation time, make it easy to produce food for children quickly and conveniently. The lack of preparation is also important to older children who are likely to be preparing their own snacks.
¶ Breakfast and packed lunches for school are prepared in the morning rush, when mothers are particularly busy. The food industry has developed products (many of which are HFSS) targeting these eating occasions and markets them heavily to mothers and children.
¶ Although the data is somewhat contradictory, there is some evidence that demand for take-away meals and affordable eating options outside the home has increased.20 The food industry has met such needs by the expansion of fast food outlets, many of which sell HFSS products.
¶ Pre-prepared, convenience foods, take-aways and eating out, reduce parents� control over what goes into food, making it more difficult to monitor HFSS content.
¶ �Convenient�/pre-prepared meals are less likely to be eaten with fresh fruit and vegetables � a �knock on effect�.21
¶ There is a growing grazing/snacking culture amongst children, which favours the consumption of HFSS foods.
16 Detailed information and sources are to be found in Section 3.1 of this report.
17 Henley Centre report prepared for Ofcom.
18 Mintel report summarised on http://news.bbc.co.uk/1/hi/uk/2787329.stm.
19 Throughout the report we talk predominantly but not exclusively about mothers, as opposed to fathers, or parents in general. This is simply because we found mothers to be almost always in charge of family food shopping. Consequently their attitudes to food and approach to their children�s diet is crucial. It is in no way meant to underplay the role of fathers, some of whom now fill this role in their families.
20 See Chief Medical Officer�s Annual Report 2000. Cited in the Food Standard Agency�s website. http://www.foodstandards.gov.uk/healthierearting/promotion/promofacts/.
21 TNS Family Food Panel data. See Section 3.2.2.
What Are Children Eating?
9
¶ Overall, there is a decline on the number of occasions that a family eats together.22
¶ The food and grocery market has developed a range of chilled, frozen and ambient pre-prepared meals specifically for children who eat without adults, which can be prepared without affecting the meal patterns of the rest of the household.
¶ Less authoritarian parent/child relationships and children�s own growing spending power23 contribute to the finding that children increasingly control their own eating patterns.24 And children like the taste of HFSS foods.25
1.2 What are children eating?26
¶ Foods high in fats, sugars and salt such as confectionery, soft drinks, crisps and savoury snacks, fast food and pre-sugared breakfast cereals (the �Big Five�) figure prominently in foods promoted to children in the UK and in their daily diets.27
¶ Families are also eating more pre-prepared/ convenience foods, which are high in fats, salt and sugar (HFSS), making a �Big 6�28 of foods causing concern to dieticians and health professionals.29
¶ Children eat well below the recommended amount of fresh fruit and vegetables. W.H.O. recommends at least 5 portions of fruit and vegetables a day.30 In England the average fruit and vegetable intake for girls aged 5-15 is 2.6 portions and for boys 2.5 portions. 31
22 Mintel (2001) Regional Eating and Drinking Habits: FSA (2001) Promoting Food to Children: Taylor Nelson Sofres, Family Food Panel.
23 Sodhexho School Meals and Lifestyle Survey 2002, p.9. See htpp://www.sodexho.co.uk/segments/smsurvey2002/pdf
24 Taylor Nelson Sofres (TNS) Family Food Panel data shows that parents increasingly buy what children want.
25 See present report Section 3.1. �Favourite food� Chart 15 and �Main meal most enjoyed�, Chart 16.
26 Detailed information and sources are to be found in Section 3.2 of this report.
27 The National Diet and Nutrition Survey of Young People aged 4 to 18 years (June 2000). HMSO, London.
28 In this report, therefore, the �Big 6� = confectionery, pre-sugared breakfast cereals, soft drinks, crisps and savoury snacks, fast food AND pre-prepared convenience foods.
29 Taylor Nelson Sofres (TNS), Family Food Panel report conducted for Ofcom.
30 W.H.O. (2004) Young people�s health in context. Health Behaviour in School-aged Children (HBSC) study: international report from the 2001/2002 survey, Eating habits pp110-119 ISBN 92 890 1372 9. http://www.euro.who.int/Document/e82923.pdf.
31 C. Deveril (2002). Fruit and vegetable consumption. In Health Survey for England 2002 report, The Health of Children and Young People. Chapter 3.
What Are Children Eating?
10
¶ Although the consumption of fresh fruit in the home has risen for much of the last twenty five years, the consumption of fresh green vegetables was 27% lower in 2000 than in 1975.32
¶ Most children do know that fruit and vegetables are good for them and that they should avoid eating too many HFSS foods. However, children like the taste of HFSS food and are oblivious to concerns about health. If they do not want to get fat, it is because they perceive it to be unattractive.
1.2.1 Demographic differences
¶ The diet of children living in areas of multiple deprivation, or in families of lower socio-economic status, is especially poor.33
¶ The diet of obese children is characterised by particularly high consumption of convenience foods, carbonated drinks, dairy products and low intake of homemade foods, fresh fruit and vegetables.34
1.3 What factors influence children�s food choice?35
¶ There is general consensus of opinion that food preference, consumption and behaviour are multi-determined. Amongst factors shown to be involved where children are concerned are:
- psychosocial factors (e.g. food preferences, meanings of food, and food knowledge)
- biological factors (e.g. heredity, hunger and gender) - behavioural factors (e.g. time and convenience, meal
patterns, dieting) - family (e.g. income, working status of mother, family eating
patterns, parental weight, diet and knowledge) - friends (e.g. conformity, norms and peer networks) - schools (school meals, sponsorship, vending machines) - commercial sites (fast food restaurants, stores) - consumerism (youth market and pester power) - media (food promotion, including television advertising)36
32 Data from National Food Survey (NFS) annual surveys. Cited in the Government�s Food and Health Action Plan: Food and Health Problem Analysis for Comment. 31st July 2003.
33 See Department of Health (2003) Food and Health Action Plan: Food and Health Problem Analysis for comment. Chapter 3 55. www.dh.gov.uk/assetRoot/04/06/58/34/04065834.pdf . Also National Diet and Nutrition Survey of Young People aged 4 to 18 years (June 2000). HMSO, London passim.
34 Taylor Nelson Sofres (TNS) Family Food Panel.
35 Detailed information and sources are to be found in Section 3.3 of this report.
36 Story, M., Neumark-Sztainer, D., and French, S. (2002). Individual and environmental influences on adolescent eating behaviors. Journal of the American Dietetic Association, 102(3), S40-S51.
Factors Influencing Children�s Food Choice
11
1.3.1 The role of parents
¶ The overwhelming majority (79%) of parents in the NOP survey say parents themselves have �a great deal� of responsibility for the situation outlined in the recent publicity about children�s diets.
¶ However other groups are seen as having an important part to play, in particular schools (52%) and food manufacturers (43%). Just one third see the Government (33%) and the media (32%) as �having a great deal of responsibility�, and even fewer the supermarkets (28%) and broadcasters (23%).
¶ Asked which one of the same groups could do most to ensure that children eat healthily, �parents/family� are again named by just over half (55%). Only a small minority name food manufacturers (16%) and schools (14%). Very few name the media (5%), government (4%), supermarkets (3%) and broadcasters (1%).
¶ Ofcom�s qualitative research suggests that:
o the majority of parents will often defer to their children�s food preferences, and serve HFSS foods. Such parents were more often to be found in the lower socio-economic groups in which money is tighter and food choice in the area more restricted.
o only a minority of parents in our research seemed to exercise effective control over their children�s food choices. Such parents were usually better off and more often found in the higher socio-economic groups.
Knowledge about, and reactions to, health issues
¶ The qualitative research suggests that while many mothers think they know what a healthy diet is, they are at a loss as to how to make this attractive to their children. They feel they would have to reject whole categories of foods e.g. dairy products, sugar and carbohydrates. Their notion of a healthy diet is austere and is consequently perceived as unattainable.
o Such mothers think in terms of the outcomes of healthy eating outlined in the media � lessening the risk of obesity and better dental health. Their approach is essentially reactive � if their child is of normal weight and has no specific health problem then they make only token gestures towards establishing healthier eating patterns.
o A minority of more confident, better-informed and largely middle-class, mothers were more proactive. Such mothers are aware of the long-term risks associated with obesity, such as heart disease, diabetes and cancer and have a more inclusive, and consequently more attainable, idea of what constitutes a healthy diet. They do not exclude whole categories of food, but are more likely to limit HFSS foods and exclude those with artificial additives. If they buy convenience foods they favour options such as pre-packaged salads and chilled foods.
Factors Influencing Children�s Food Choice
12
1.3.2 The role of schools
¶ Ofcom�s qualitative research in schools found that:
o There is formal coverage of diet and nutrition in classrooms, where teachers educate pupils about healthy food choices.
o There is evidence that some schools are making successful attempts to provide healthy food choices and actively influence their pupils� diets.
o There was little active supervision of what children actually choose to eat at lunchtimes in the schools included in the survey. The school�s role, as regards teaching by example, seemed to be largely unacknowledged.
o Most school provision appeared to be driven by what children wanted and could be seen as giving a seal of approval to eating HFSS products. High fat and high sugar foods (e.g. chips, burgers, hot dogs, sausages, pizza, cake and jelly) were popular in both primary and secondary schools. Secondary schools had vending machines with crisps, confectionery and soft drinks for sale.
o Schools had few, if any, rules regarding the food pupils bring in to eat during the school day. The NOP survey and the TNS Family Food Panel report that packed lunches and snacks brought in for breaks at school often contain highly branded, processed, HFSS products.
¶ Most parents consider the lunch choices provided by schools to be very (12%) or fairly (36%) healthy. Less than one in five (14%) considered them not to be healthy.
Barriers to healthier provision in schools
¶ In the qualitative research, teachers reported that finance is a key barrier to healthier provision in schools. In order to make food provision cost-effective, schools sell HFSS foods, as these are what children like, want and will buy. Vending machines bring in much needed income.
¶ Schools may also lack control over food provision if contracted catering companies hold the reins in terms of what food is provided. These companies can be very resistant to moves towards healthier provision that may be less popular with pupils and affect the profits or financial viability of their operation.
The Role of Television Advertising
13
1.4 The role of television advertising37
¶ Academic research confirms38 that hours spent in television viewing correlate with measures of poor diet, poor health and obesity among both children and adults. Three explanations for this have been offered:
- television viewing is a sedentary activity that reduces metabolic rates and displaces physical exercise;
- television viewing is associated with frequent snacking, pre-prepared meals and/or fast food consumption;
- television viewing includes exposure to advertisements for HFSS food products.
There is support for each of these explanations, although little empirical research attempts to disentangle them. 39
1.4.1 Television advertising: direct effects
¶ Academic research shows �modest direct effects� of television advertising on food preference, consumption and behaviour. There is insufficient evidence to determine the relative size of the effect of TV advertising on children�s food choice by comparison with other relevant factors. Nor does a clear consensus exist yet regarding the nature of these other factors.
¶ In the context of the multiplicity of influences mentioned above (section 1.3), it is not surprising that the direct contribution of TV advertising has been found to be modest.
¶ In the NOP survey, when television advertising is put in the context of other influences, we see that it does have an impact on food choice among both parents and children, but it is small compared to other influences. For example:
o To parent and child alike, the child�s own taste preferences are paramount and price and familiarity are also important. Peer pressure (�My friends like it�) is also a notable influence on food choice for children. Parents are influenced by the healthiness of the products, although when actually serving food or drink, convenience (�Quick and easy to prepare�) is a more powerful motivator.
37 Detailed information and sources can be found in Section 3.4 of this report.
38 Sonia Livingstone (2004) A commentary on the research evidence regarding the effects of food promotion on children. See Appendix 1.
39 Robinson (2001); Proctor, Moore, Gao, Cupples, Bradlee, Hood and Ellison (2003); Dietz and Gortmaker (1985); Kleges, Shelton and Kleges (1993). Cited in Sonia Livingstone (2004) A commentary on the research evidence regarding the effects of food promotion on children � Appendix 1.
The Role of Television Advertising
14
¶ That said, promotions (e.g. special offer/in-store promotion, caught eye in shop, saw TV ad) appear to play a relatively greater role in the choice of HFSS products compared with non-HFSS products.
1.4.2 Television advertising: indirect effects
¶ There is insufficient evidence to show that TV advertising has a larger, indirect effect on children�s food choices, however it is widely argued in the fields of social and developmental psychology and in consumer and marketing research that substantial indirect effects occur40
o Example of indirect effects: television advertising affects the views of the child�s parents and peers about diet (parents� and peers� attitudes and behaviour subsequently have an impact on the child); it may normalize the image of a particular diet; it may prime the target audience to notice other forms of promotion.
¶ In many such indirect ways television advertising can have a powerful, if largely un-researched and possibly un-researchable, influence on young people�s food preferences, consumption and behaviour.
¶ For a range of methodological reasons it is unlikely that research will ever produce the ideal, uncontroversial demonstration of a causal effect of food promotion on children�s food choices, or the factors that in combination, influence children�s food choices.
1.5 Viewing patterns and advertising spend41
1.5.1 Children�s viewing patterns
¶ Children�s total viewing has remained fairly stable over the past three years. The average child watches around 17 hours of television each week.
¶ There has been an increase in viewing during children�s airtime42, driven by the popularity of the dedicated BBC channels, which account for a growing proportion of viewing during children�s airtime and an even greater proportion of viewing in Freeview homes.
¶ Children spend 71% of their viewing time (12 hours per week) outside of children�s airtime.
40 Sonia Livingstone (2004) A commentary on the research evidence regarding the effects of food promotion on children: See Appendix 1.
41 Detailed information and sources in Section 3.5 of this report.
42 Children�s airtime= terrestrial children�s slots plus children�s channels.
Viewing Patterns & Advertising Spend
15
¶ Of the 5 hours spent in children�s airtime, 2.6 hours (15% of total viewing time) is spent in commercial children�s airtime (excluding Disney).43
o This means that children spend the equivalent of 22 minutes each day in commercial children�s airtime.
o Children aged 4-9 spend 20% (3.4 hours per week) of their viewing in dedicated commercial children�s airtime, while children aged 10-15 spend around 11% (1.9 hours per week).
¶ More children and young people watch television at peak times (between 6pm and 9pm) than any other day part.
¶ Around four in ten children who view during children�s airtime do so in the company of an adult, compared to seven in ten during the evening slot.
1.5.2 Advertising spend
¶ The total advertising spend on all types of Food, Soft Drinks and Chain Restaurants (from here on known as �Core Category products�) has decreased by 15% since 1999 (£856m in 1999 to £727m in 2003). The proportion of that spend invested in television advertising has decreased even more dramatically (by 22% from £669m in 1999 to £522m in 2003).
¶ In 2003 advertisers for food, soft drinks and Chain Restaurants (�Core Category�44 foods) spent £522m promoting their products on television. This represents 72% of their budget, making television a key medium for food advertisers.
¶ The largest sub-sectors in terms of advertising spend on television are Prepared & Convenience Foods, Confectionery and Dairy Products, mirroring the categories found to be most prominent in the diets of obese children.
¶ �Big Five� products represent 77% of all food, soft drink and fast food advertising spend within children�s airtime.45
43 Disney channels have been excluded as they do not show advertising.
44 When analysing the size and spend of the food market, we have used the following categories as defined by Nielsen Media: 1) Food 2) Soft Drinks 3) Chain Restaurants. These have been grouped together to create what is referred to throughout the analysis of the advertising market as �Core Category� foods. This definition is broader than that used by the FSA and includes the �Big 6th� product category which our research has identified as important - Prepared & Convenience Foods.
45 The other categories include dairy products, meat, fish and poultry, convenience foods, other than snacks and mineral water.
Viewing Patterns & Advertising Spend
16
1.5.3 Advertising seen
¶ �Advertising seen� is measured by looking at �impacts�. Impacts provide a measure of advertising exposure. One impact is equivalent to one member of the target audience viewing one commercial spot.
¶ Overall, most of the television advertising seen by children is outside of children�s airtime (71%).
¶ Around one in five of all of the TV ads seen by children is for a Core Category product (19%).
¶ Television advertising for Core Category products in children�s airtime represents 8% of all television advertising seen by children.
¶ Younger children see more advertising for Core Category products in children�s airtime than older children, because they spend more time watching television in children�s airtime.
o Children aged 4 � 9 see just over half of the Core Category advertisements that they are exposed to in children�s airtime
o Children aged 10 � 15 see around one third in children�s airtime.
¶ 29% of all of the advertising seen during children�s airtime is for a Core Category product.
1.6 How advertising works46
1.6.1 Differences in reactions to advertising
¶ Before four or five years old, children regard advertising as simply entertainment, while between four and seven, they begin to be able to distinguish advertising from programmes. The majority have generally grasped the intention to persuade by the age of eight, while after eleven or twelve they can articulate a critical understanding of advertising.47
¶ Younger children remain relatively unengaged by the message content but may still be persuaded by the status of its celebrity source or the intensity of the message (colour, sound). Consequently advertisers may appeal to younger children through the use of bright colours, lively music and the involvement of cartoon characters or celebrities.
46 Detailed information and sources in Section 3.6 of this report.
47 See Bandyopadhyay, Kindra and Sharp (2001); Hastings et al (2003); Valkenburg and Cantor (2001); van Evra (1998), Young et al (1996), Young (2003). Cited in Sonia Livingstone (2004) A commentary on the research evidence regarding the effects of food promotion on children � appendix 1.
How Advertising Works
17
¶ Teenagers are more likely to pay attention to the content of the message, and be persuaded because they attend to, and engage with, the arguments put forward for a proposition or product. Hence advertisements for teenagers are more likely appeal through witty or stylish imagery and subtle messages. Celebrities as role models are likely to continue to have an influence.
¶ Television advertising may have a more powerful influence on obese children, engaging them in a more emotional/physical way than it does children of normal weight.48
1.6.2 Creative executions used to target children49
¶ Advertising for Core Category foods in children�s airtime makes more use of animation and product tie-ins:
o In children�s airtime, 42% of Core Category commercials featured animation, compared with 16% in the early evening.
o 28% of Core Category commercials in children�s airtime featured a product tie-in, compared with 11% in other types of commercials in children�s airtime.
¶ The analysis showed little use of celebrities (1% of all adverts in children�s airtime compared with 8% in the early evening slot).
1.7 What parents and children say about television advertising50
1.7.1 Parents� and children�s reactions to advertising
¶ The qualitative research found:
o children actively enjoy television advertising. It entertains them and is part of the pleasure they derive from watching television. It is also part of a shared culture with family and friends.
o most parents are also non-judgemental. Like their children, they too watch advertising with evident enjoyment. When discussing commercials seen and advertising generally, they do not differentiate between advertising aimed at children and at adults.
48 Halford, C.J., Gillespie, J., Brown, V., Pontin, E.E., Dovey, T.M. (2003) Effects of television advertisements for foods on food consumption in children. Appetite, 42 (2), pp221-225.
49 David Graham and Associates was commissioned by Ofcom to conduct content analysis to help understand the types of creative executions used by advertisers to target children. The analysis involved the recording of advertisements shown on ITV1 in the HTV West region across 7 days between September-November 2003. Over 900 commercial spots were analysed across the entire period, including 156 food, soft drink and fast food commercials.
50 Detailed information and sources in Section 3.7 of this report.
What Parents & Children Say About TV Advertising
18
¶ The NOP quantitative survey shows that:
o few parents make any attempt to mediate the impact of television advertising on their children. Just under half of parents (44%) say they �never� talk about adverts to their children and a further 15% say they do so �hardly ever�. Those who do talk about them are most likely to do so only �occasionally� and very few say they ever discuss the credibility of the advert or its commercial motivation.
o asked which kinds of adverts appeal to them most, children most often mention funny adverts (28%), and those with good music (25%). The next largest proportion talks about adverts with celebrities (15%).
o however, as previously mentioned (section 1.4.1), when television advertising is put in the context of other influences, we see that its impact on food choice among both parents and children is relatively small. More important is, for example, the child�s own taste, peer pressure etc.
1.7.2 Influence of branding
¶ Branding and brands were discussed in the qualitative research:
o It was found that both mothers and children engage with and enjoy food brands. Children generally associate heavily advertised, branded foods with �fun�, based on their colourful packaging and widespread use of pictures, cartoons and characters.
o Effectively marketed, brands generate recognition, familiarity and even affection amongst children. Well-known brands can impart status/�cool� to the user.
o Brand presence is created and sustained by all forms of marketing activity � but especially by television advertising. Television advertising imagery frames how children talk about products. This imagery is invariably positive.
o Mothers often collude with their children�s enjoyment of brands and use them to encourage their children to eat.
o Food advertising on television can produce confusion amongst many mothers about healthy options. Brands are seen as indicators of quality, intrinsically better than unbranded goods � yet they are differentially skewed towards the promotion of HFSS foods. They sometimes assert health claims (e.g. high in calcium) for foods that have other �unhealthy� aspects (e.g. high in salt).
¶ Asked why they switch brands in the NOP survey, the largest single proportion of mothers name price cuts (42%). Next most influential are recommendations from family or friends (24%). Television advertising is only mentioned by around one in every ten respondents.
What Parents & Children Say About TV Advertising
19
1.7.3 Parents� views on regulation
¶ In the qualitative research parents showed limited awareness of current regulation of food/drink advertising to children, apart from the belief that advertising (in general) is not allowed to say anything that is untrue. There were no unprompted calls for more regulation.
¶ In the NOP quantitative survey, asked whether they felt there needed to be any change to the rules governing the advertising of HFSS products, the majority of parents (56%) say they want some change. However 29% believe the rules should stay the way they are.
¶ When parents were asked how much they agreed with eight possible rule changes (see Chart 84, section 3.7.3):
o There was least support for a total ban on advertising of HFSS products. 46% disagreed with a total ban, almost twice the number who agreed with it (24%).
o In contrast, parents showed most support for changes that would provide more information.
- A clear consensus emerges in favour of a rule that would ensure that advertisements for HFSS products contain �a nutritional messageabout the product�. 81% agree with this type of rule change. This rule is also the one most commonly identified when parents are asked to choose the one change they think most important to make.
(Mothers in the qualitative research point out that health information will need to be available on all forms of promotion, including packaging, not just television advertising. They also anticipated difficulties in defining �unhealthy� foods and pointed out that health information is unlikely to be understood by younger children.)
- Two thirds (65%) agree that advertisers should not be allowed to make health claims for a product if something else about it is �unhealthy� (e.g. high in salt, fat or sugar).
o The same proportion (65%) wants to see advertisements for HFSS foods made �less appealing to children�, although in this case fewer (27%) feel very strongly about it.
o Around half want to see cartoon characters (49%) and celebrities(48%) banned from advertising HFSS products to children.
(In the qualitative research mothers were likely to take issue with the use of sports personalities to promote foods which they regarded as very �unhealthy�.)
What Parents & Children Say About TV Advertising
20
o Just over half (57%) favoured a ban on advertising HFSS products during children�s programmes.
(However, set against that, in the qualitative research, even those mothers who supported a ban in children�s airtime recognized that children watch TV in adult airtime, where they can still see HFSS product advertising.)
o Just under half (48%) wish to see a ban on advertising HFSS products before 9pm.
(However, in the qualitative research, a ban on advertising before 9 o�clock was felt by mothers to compromise adult freedom to enjoy advertising and was considered �unfair� to advertisers. Some however did suggest that banning ads for HFSS foods before 9pm is likely to result in food manufacturers reformulating products, so that they are no longer deemed �unhealthy� � and therefore can still be advertised.)
Research on the effectiveness of bans
¶ Surprisingly little research has sought to evaluate the effectiveness of television advertising regulation and there is even less on the banning of food advertising on TV.
¶ However, where there has been research on the effectiveness of TV advertising bans on food advertising in relation to obesity in other countries, the conclusions are at best both unclear and contested.
1.8 Differences between obese and normal weight children51
1.8.1 Diet
¶ Compared with children of normal weight, obese children consume less home-made food, fewer vegetables and less fruit. They consume more frozen food, microwaved food and more carbonated drinks.
¶ In the NOP survey, obese children themselves tend to report snacking more often than children of normal weight. Parents of obese children, however, do not report their child as snacking more often compared with parents of normal weight children. This is confirmed in both the NOP survey and the TNS Family Food Panel
¶ The TNS Family Food Panel data suggests that when obese children do snack, they are more likely than children of normal weight to consume crisps and nuts inside the home and carbonated drinks outside it.
51 Further details and sources to be found in Section 3.8 of this report.
Differences between obese and normal weight children
21
1.8.2 Attitudes, beliefs and behaviour52
¶ Most obese children and their parents are unaware of, or choose to ignore, the reality of the child�s situation. Obese children are considered healthy, and of �average weight� by the majority of their parents. Most of the children themselves claim they are happy with their current weight and about the way they look.
¶ Compared with children and parents in families where the child is of normal weight, both obese children and their parents are less knowledgeable about healthy eating and less likely to appreciate the importance of eating fresh fruit and vegetables.
¶ Parents of obese children compared with parents of normal weight children are less motivated by health and more motivated by convenience and price when choosing food.
¶ When shopping, obese adults are more likely to be attracted to offers which can be seen as encouraging extra consumption � multi-buys and extra free content.
¶ Food promotion generally, and television advertising in particular they tell us, play a very small part in their decisions, although they are more likely than parents of normal weight children to cite these as reasons for their food choice. Television advertising for food and drink may engage obese children in a more emotional/physical way than it does children of normal weight.53
¶ Parents of obese children tend to have a more laissez faire attitude to mealtimes and are less likely to have rules about good table manners. They seem generally less confident than parents of normal weight children about their own ability to have an influence.
¶ Parents of obese children tend to show polarised opinions when considering what can be done to ensure a healthier diet for children. Minorities support either �no change� to rules governing the advertising of food and drink to children, or the most radical and uncompromising alternative � a complete ban on advertising HFSS foods and drinks. (Similarly, asked to imagine an �ideal diet� for children, mothers who were more likely to provide a poor diet for their children tended to think in terms of an unrealistic avoidance of whole categories of food.)
¶ Parents of an obese child are less likely to think that parents are the ones who can �do most to help children eat more healthily�. Conversely, they are more likely to think schools can do most to help and they consider lunchtime meals to be more important than do parents of normal weight children.
52 In this section data is sourced from the NOP survey and the TNS Family Food Panel.
53 Halford, C.J., Gillespie, J., Brown, V., Pontin, E.E., Dovey, T.M. (2003) Effects of television advertisements for foods on food consumption in children. Appetite, 42 (2), pp221-225.
Differences between obese and normal weight children
22
¶ Parents of obese children are also less likely to read labels about ingredients, or to support changes to the rules about how HFSS products are advertised to children that would provide them with more information.
Conclusions
23
1.9 Conclusions
Context
¶ Children�s food preference, consumption and behaviour are multi-determined.
¶ The rise in obesity levels amongst children is similarly multi-determined, against a backdrop of key lifestyle changes over the past few decades.
¶ People see parents as primarily responsible for improving children�s diets. Schools and food manufacturers are also seen to play an important role. The role of government, the media, supermarkets and broadcasters is not perceived to be as important as these three.
¶ There is a trend for children to increasingly influence their own diet with the acquiescence of their parents.
¶ TV advertising forms a smaller part of a larger social issue.
¶ Solutions to the problem of obesity need to be multi-faceted.
The role of television advertising
There is sufficient empirical evidence to conclude that:
¶ TV advertising has a modest, direct effect on children�s food choices.
¶ While indirect effects are likely to be larger, there is insufficient evidence to determine the relative size of the effect of TV advertising on children�s food choice, by comparison with other relevant factors.
o This does not however mean that the indirect effects of television advertising are negligible. It is widely argued in the fields of social and developmental psychology and in consumer marketing research that substantial indirect effects occur.
¶ In the context of the multiplicity of influences of children�s food choice, it is perhaps not surprising that the direct effect of TV advertising has been found to be �modest�. While from our qualitative research we found that TV plays an important role, in our quantitative research we saw that more important are, for example, the child�s own taste preference, price, familiarity, peer pressure, healthiness and convenience.
Children�s television viewing
Analysis of children�s viewing behaviour reveals:
¶ On average children aged 4-15 watch far more television in adult airtime than they do in children�s airtime (12 hours vs 5 hours/week)
Conclusions
24
¶ Most of their viewing in commercial children�s airtime (2.6 hours/week) is with non-terrestrial channels (1.9 hours/week)
¶ Children watch an average of 22 minutes a day of commercial children�s TV.
¶ Overall, around one in five ads seen by children is for a Core Category product.
¶ On average, over half of these Core Category TV ads are seen by children outside of children�s airtime. However:
o children aged 4 � 9 see just over half of the Core Category advertisements that they are exposed to in children�s airtime
o children aged 10 � 15 see around one third in children�s airtime.
¶ 29% of the advertising impacts in children�s airtime are for Core Category products.
¶ Most of the TV advertising Core Category products that children see is for confectionery, savoury snacks, soft drinks, fast food and pre-sugared breakfast cereals (the �Big Five�).
Parents� views on regulation
¶ Most parents believe that the rules about how the �Big Five� are advertised on television need to be changed.
o Least support was registered for an outright ban on the advertising of HFSS products on TV
o Most support emerged for ensuring that there is accurate information in advertising (i.e. the provision of nutritional information; banning health claims if something else about the product is �unhealthy�)
o There is also support for
¶ targeting the attractiveness of advertising to children (in general, not using celebrities or cartoon characters)
¶ targeted scheduling restrictions (a ban during children�s airtime or before 9 o�clock in the evening � even though in our qualitative research mothers acknowledged that regarding the former, children watch TV in adult airtime where they can still see HFSS advertising, and that, regarding the latter, such a ban was felt to compromise adult freedom to enjoy advertising.)
Conclusions
25
Experience in other countries
Little research has been done to evaluate the effectiveness of banning food advertising on TV and where there has been research in other countries on the effectiveness of bans on food advertising in relation to obesity, the conclusions are at best both unclear and contested.
Implications for regulatory change
Solutions to the problems of obesity/children�s health need to be multi-faceted. While the research suggests that regulation of TV advertising has a role to play, changing the rules around the advertising of HFSS products alone as a single approach to combat obesity seems highly unlikely to succeed.
Addressing how HFSS products are advertised on television will need to be accompanied by comparable action in a number of other areas, for example:
- Improved access to healthy foods in areas of multiple deprivation54
- improved food provision in schools - promotion of physical exercise - educational programmes to promote healthy eating - promotion of media and advertising literacy - food pricing - labelling of foods - regulation of other forms of promotion.
Furthermore, a necessary prerequisite for any proportionate and targeted intervention would be a practical, actionable definition of what defines a HFSS/�unhealthy� product, and conversely, what constitutes a healthy food.
54 The Index of Multiple Deprivation (IMD) ranks areas from among the most deprived to the least deprived. The classification is based upon area characteristics in six domains: income, employment, health and disability, education, housing and access to services. Obesity is consistently linked to IMD. Access to fast food on high streets is lower income areas is often easier than to fruit and vegetables (Inconvenience Food, Demos 1999). Cited in Henley Centre report prepared for Ofcom.
Obesity & Children�s Health
26
2 Background 2.1 Obesity and the health of the nation�s children55
This section outlines the background to current concerns about obesity levels in England56 generally and amongst children in particular. National trends in obesity, health-related consequences and economic costs are summarised. The links between obesity and changing patterns of physical exercise and diet are considered. Finally, the role of food promotion is placed in the context of a range of other factors influencing children�s food choice.
2.1.1 International trends in obesity
The World Health Organisation (W.H.O.), which has until recently focussed on malnutrition, has now begun to recognise the problems of over-nutrition. In 1998 the W.H.O. stated that �the epidemic projections are so serious that public health action is urgently required�, 57 while in 2000 �urgent action� was again called for �to combat the growing epidemic of obesity which affects developing and industrialised countries alike�.58 By 2002 the language was even stronger with a W.H.O. report claiming �the epidemic projections for obesity mean that it has probably become the major public health problem of our time � likely to outstrip smoking as a hazard to health�.59
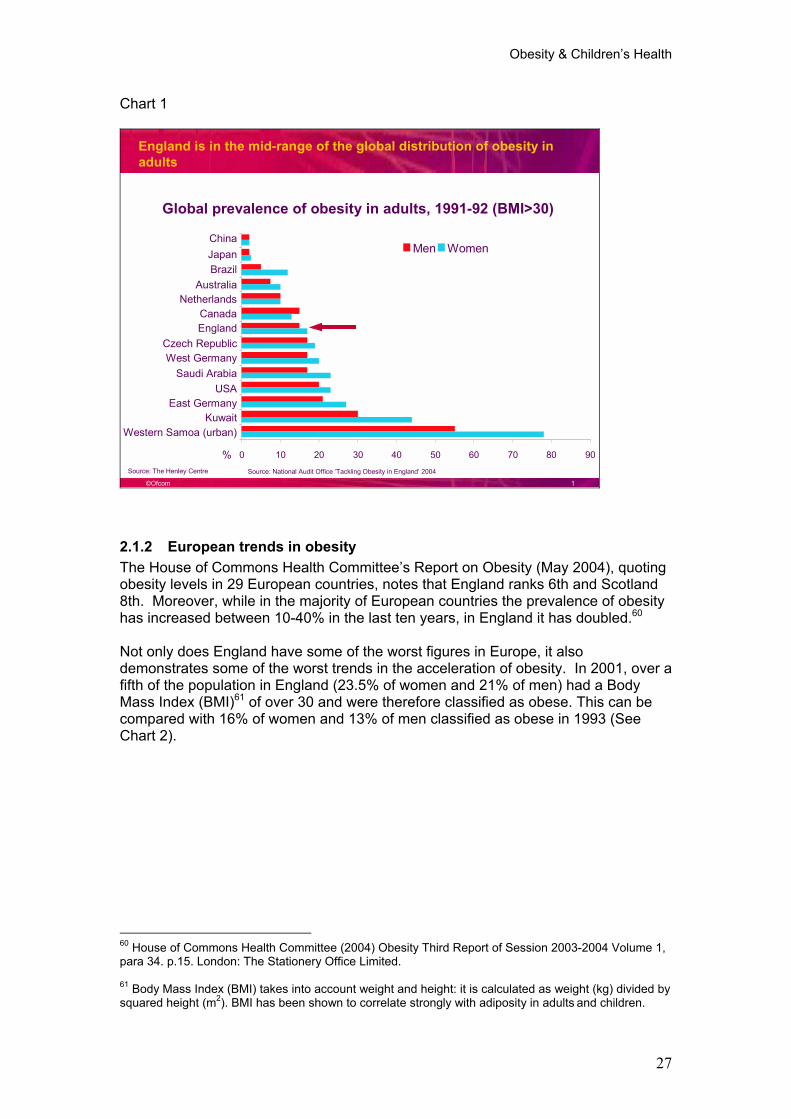
England is in the middle range of the global distribution of obesity in adults, considerably behind the USA (see Chart 1).
55 Overweight and obesity are terms that refer to an excess of body fat (adiposity) and they usually relate to an increased weight-for-height. The two terms, however, denote different degrees of excess adiposity, and overweight can be thought of as a stage where an individual is at risk of developing obesity.
56 Much of the information about obesity levels is based on figures for England. We have not always included data for Scotland Wales and Northern Ireland due the difficulty of accessing comparable data. Obesity levels are causing comparable concern all over the UK, although the national debate has usually focussed on the figures for England.
57 World Health Organisation (1998) Prevention and Management of the Global Epidemic of Obesity. Geneva, W.H.O.
58 World Health Organisation (2000) Preventing and Managing the Global Epidemic. W.H.O. Technical Report Series 894. Geneva, W.H.O.
59 World Health Report. W.H.O. Geneva 2002.
Obesity & Children�s Health
27
Chart 1
©Ofcom 1
England is in the mid-range of the global distribution of obesity in adults
Source: National Audit Office �Tackling Obesity in England� 2004
Global prevalence of obesity in adults, 1991-92 (BMI>30)
0 10 20 30 40 50 60 70 80 90
ChinaJapanBrazil
AustraliaNetherlands
CanadaEngland
Czech RepublicWest Germany
Saudi ArabiaUSA
East GermanyKuwait
Western Samoa (urban)
Men Women
Source: The Henley Centre
%
2.1.2 European trends in obesity The House of Commons Health Committee�s Report on Obesity (May 2004), quoting obesity levels in 29 European countries, notes that England ranks 6th and Scotland 8th. Moreover, while in the majority of European countries the prevalence of obesity has increased between 10-40% in the last ten years, in England it has doubled.60
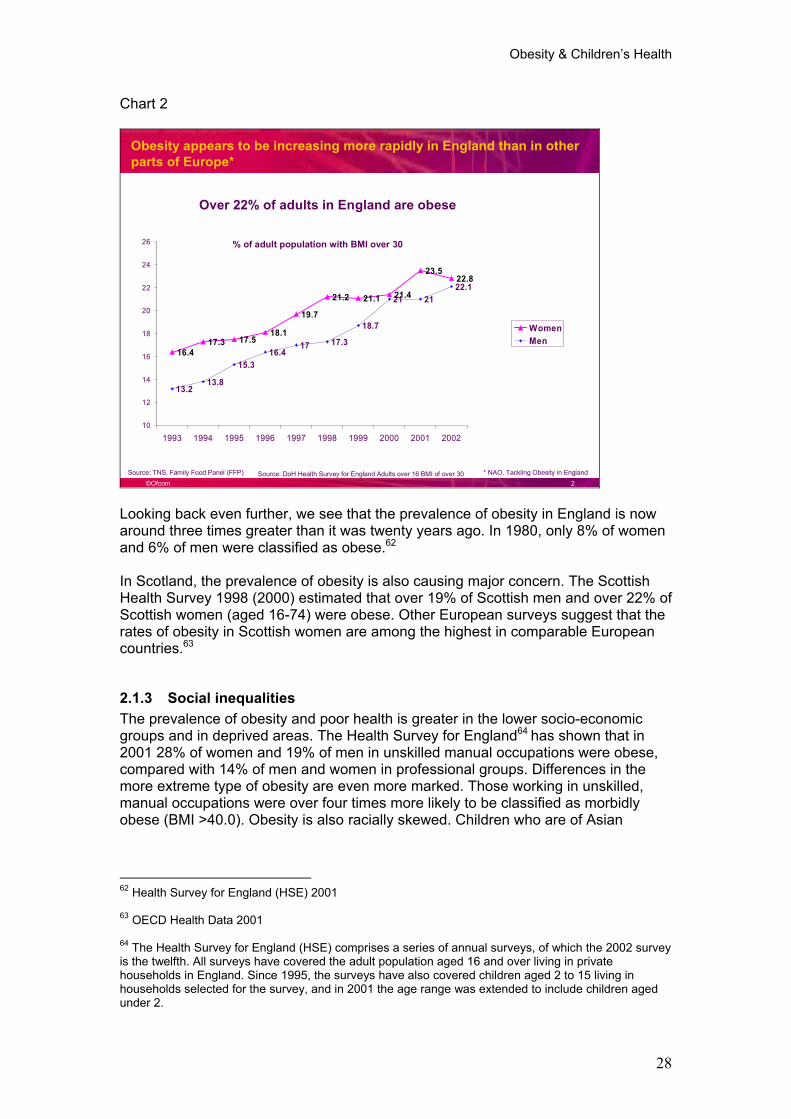
Not only does England have some of the worst figures in Europe, it also demonstrates some of the worst trends in the acceleration of obesity. In 2001, over a fifth of the population in England (23.5% of women and 21% of men) had a Body Mass Index (BMI)61 of over 30 and were therefore classified as obese. This can be compared with 16% of women and 13% of men classified as obese in 1993 (See Chart 2).
60 House of Commons Health Committee (2004) Obesity Third Report of Session 2003-2004 Volume 1, para 34. p.15. London: The Stationery Office Limited.
61 Body Mass Index (BMI) takes into account weight and height: it is calculated as weight (kg) divided by squared height (m2). BMI has been shown to correlate strongly with adiposity in adults and children.
Obesity & Children�s Health
28
Chart 2
©Ofcom 2
16.417.3 17.5
18.1
19.7
21.2 21.1 21.4
23.522.8
13.213.8
15.316.4
17 17.3
18.7
21 2122.1
10
12
14
16
18
20
22
24
26
1993 1994 1995 1996 1997 1998 1999 2000 2001 2002
WomenMen
Obesity appears to be increasing more rapidly in England than in other parts of Europe*
% of adult population with BMI over 30
Source: DoH Health Survey for England Adults over 16 BMI of over 30Source: TNS, Family Food Panel (FFP)
Over 22% of adults in England are obese
* NAO, Tackling Obesity in England
Looking back even further, we see that the prevalence of obesity in England is now around three times greater than it was twenty years ago. In 1980, only 8% of women and 6% of men were classified as obese.62
In Scotland, the prevalence of obesity is also causing major concern. The Scottish Health Survey 1998 (2000) estimated that over 19% of Scottish men and over 22% of Scottish women (aged 16-74) were obese. Other European surveys suggest that the rates of obesity in Scottish women are among the highest in comparable European countries.63
2.1.3 Social inequalities The prevalence of obesity and poor health is greater in the lower socio-economic groups and in deprived areas. The Health Survey for England64 has shown that in 2001 28% of women and 19% of men in unskilled manual occupations were obese, compared with 14% of men and women in professional groups. Differences in the more extreme type of obesity are even more marked. Those working in unskilled, manual occupations were over four times more likely to be classified as morbidly obese (BMI >40.0). Obesity is also racially skewed. Children who are of Asian
62 Health Survey for England (HSE) 2001
63 OECD Health Data 2001
64 The Health Survey for England (HSE) comprises a series of annual surveys, of which the 2002 survey is the twelfth. All surveys have covered the adult population aged 16 and over living in private households in England. Since 1995, the surveys have also covered children aged 2 to 15 living in households selected for the survey, and in 2001 the age range was extended to include children aged under 2.
Obesity & Children�s Health
29
descent are four times more likely to be obese than those who are white. Women of Black Caribbean and Pakistani descent are at particularly high risk.65
2.1.4 Obesity amongst children
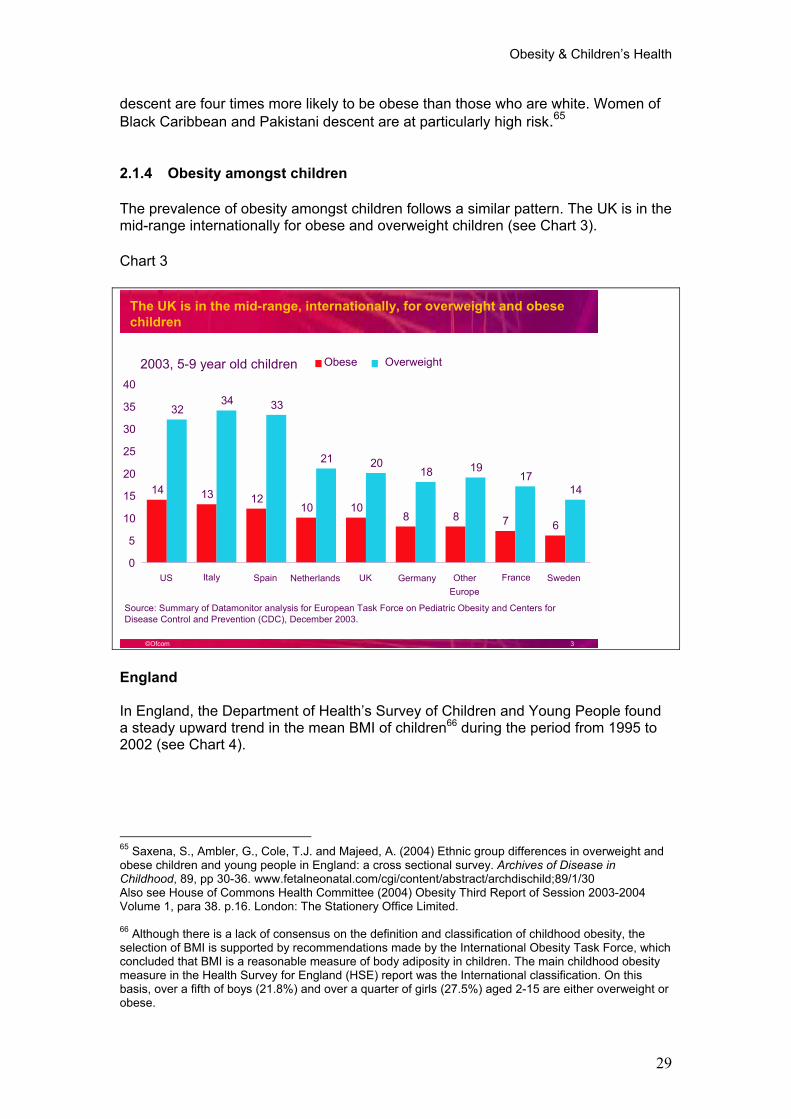
The prevalence of obesity amongst children follows a similar pattern. The UK is in the mid-range internationally for obese and overweight children (see Chart 3).
Chart 3
©Ofcom 3
The UK is in the mid-range, internationally, for overweight and obese children
Source: Summary of Datamonitor analysis for European Task Force on Pediatric Obesity and Centers for Disease Control and Prevention (CDC), December 2003.
2003, 5-9 year old children
14 13 1210 10
8 8 7 6
3234 33
21 2018 19
1714
0
5
10
15
20
25
30
35
40
US Spain UK OtherEurope
Sweden
Obese Overweight
Italy Netherlands Germany France
England
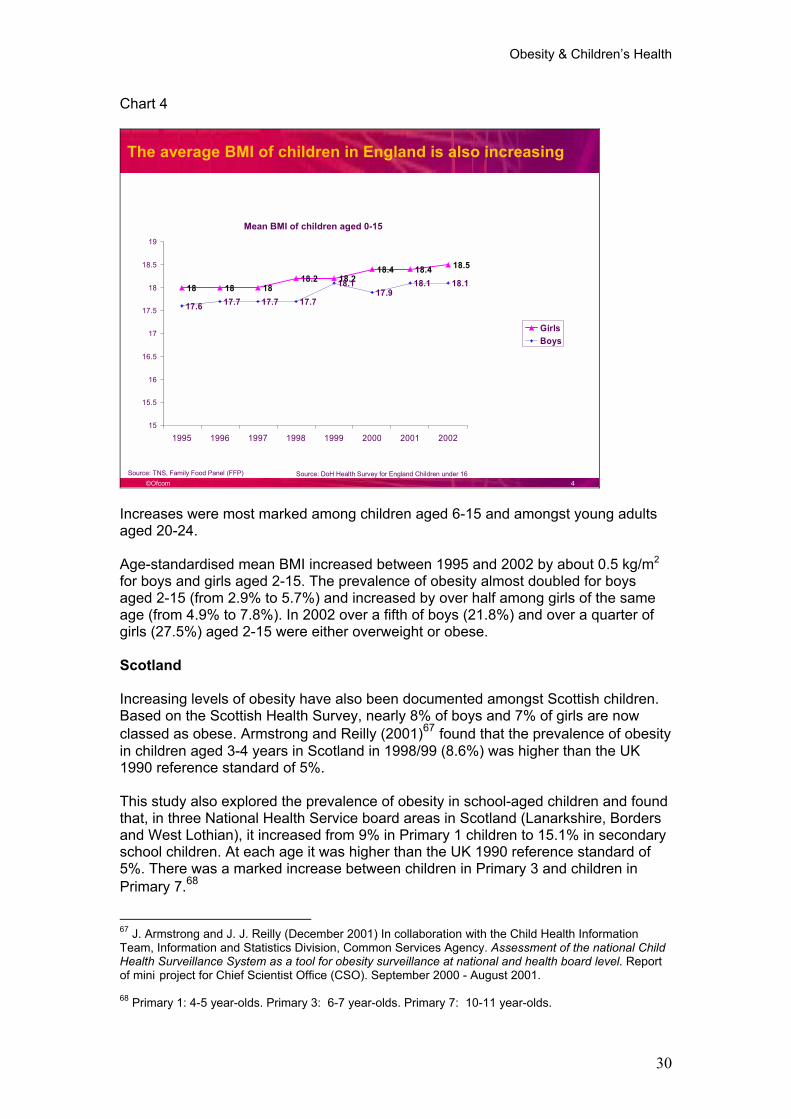
In England, the Department of Health�s Survey of Children and Young People found a steady upward trend in the mean BMI of children66 during the period from 1995 to 2002 (see Chart 4).
65 Saxena, S., Ambler, G., Cole, T.J. and Majeed, A. (2004) Ethnic group differences in overweight and obese children and young people in England: a cross sectional survey. Archives of Disease in Childhood, 89, pp 30-36. www.fetalneonatal.com/cgi/content/abstract/archdischild;89/1/30 Also see House of Commons Health Committee (2004) Obesity Third Report of Session 2003-2004 Volume 1, para 38. p.16. London: The Stationery Office Limited.
66 Although there is a lack of consensus on the definition and classification of childhood obesity, the selection of BMI is supported by recommendations made by the International Obesity Task Force, which concluded that BMI is a reasonable measure of body adiposity in children. The main childhood obesity measure in the Health Survey for England (HSE) report was the International classification. On this basis, over a fifth of boys (21.8%) and over a quarter of girls (27.5%) aged 2-15 are either overweight or obese.
Obesity & Children�s Health
30
Chart 4
©Ofcom 4
18 18 1818.2 18.2
18.4 18.4 18.5
17.6 17.7 17.7 17.7
18.117.9
18.1 18.1
15
15.5
16
16.5
17
17.5
18
18.5
19
1995 1996 1997 1998 1999 2000 2001 2002
GirlsBoys
The average BMI of children in England is also increasing
Mean BMI of children aged 0-15
Source: DoH Health Survey for England Children under 16Source: TNS, Family Food Panel (FFP)
Increases were most marked among children aged 6-15 and amongst young adults aged 20-24.
Age-standardised mean BMI increased between 1995 and 2002 by about 0.5 kg/m2
for boys and girls aged 2-15. The prevalence of obesity almost doubled for boys aged 2-15 (from 2.9% to 5.7%) and increased by over half among girls of the same age (from 4.9% to 7.8%). In 2002 over a fifth of boys (21.8%) and over a quarter of girls (27.5%) aged 2-15 were either overweight or obese.
Scotland
Increasing levels of obesity have also been documented amongst Scottish children. Based on the Scottish Health Survey, nearly 8% of boys and 7% of girls are now classed as obese. Armstrong and Reilly (2001)67 found that the prevalence of obesity in children aged 3-4 years in Scotland in 1998/99 (8.6%) was higher than the UK 1990 reference standard of 5%.
This study also explored the prevalence of obesity in school-aged children and found that, in three National Health Service board areas in Scotland (Lanarkshire, Borders and West Lothian), it increased from 9% in Primary 1 children to 15.1% in secondary school children. At each age it was higher than the UK 1990 reference standard of 5%. There was a marked increase between children in Primary 3 and children in Primary 7.68
67 J. Armstrong and J. J. Reilly (December 2001) In collaboration with the Child Health Information Team, Information and Statistics Division, Common Services Agency. Assessment of the national Child Health Surveillance System as a tool for obesity surveillance at national and health board level. Report of mini project for Chief Scientist Office (CSO). September 2000 - August 2001.
68 Primary 1: 4-5 year-olds. Primary 3: 6-7 year-olds. Primary 7: 10-11 year-olds.
Obesity & Children�s Health
31
2.1.5 Health risks Obesity, as well as being a debilitating condition in itself, has been linked by health professionals with an increasing incidence of Type 2 diabetes69, heart disease, high blood pressure70 and some types of cancer (especially cancers of the breast and colon)71. Because of the additional strain on joints, obesity increases the risk of osteo-arthritis. It can also have a profound effect on the mental health of those affected.
From the recent National Audit Office figures, the British Medical Association (BMA) estimates that if there were one million fewer obese people in England, this could lead to:
¶ 15,000 fewer people with coronary heart disease ¶ 34,000 fewer people with type 2 diabetes ¶ 99,000 fewer people with high blood pressure.72
In the House of Commons� Obesity report (2004) it is noted that for diabetes and many of the other conditions listed, it is not necessary to be actually obese to increase the risk of morbidity. Risks rapidly accelerate as people become overweight.73
Diet- and obesity-related ill-health is much more prevalent in the lower socio-economic groups and in particular ethnic groups74. The death rate, for example, for coronary heart disease is now three times higher for unskilled men of working age, compared with professional men in the same age bracket. Moreover this gap has widened sharply over the most recent 20 years for which figures are available75.
The importance of combating early obesity and overweight is underlined by the increasing number of studies linking childhood and adolescent obesity with middle-aged mortality and morbidity. Overweight adolescents have a 70% chance of becoming overweight or obese adults, and obese 18 year olds are twice as likely to be dead at 50.76 Severely obese children and adolescents have, on quality of life measures, been reported to score lower than cancer patients of a similar age. 77
69 Tuomilehto, J. et al (2001) New England Medical Journal 344: 1343-1350.
70 British Heart Foundation. (1998) Coronary heart disease statistics: economic supplement www.heartststs.org.
71 Diet is thought to play a role on a quarter of premature deaths from cancer, and could help to prevent up to a third of all cancers occurring in the first place (see Department of Health (2003) Food and Health: Food and Health Problem Analysis for comment. Chapter 2 32. www.dh.gov.uk/assetRoot/04/06/58/34/04065834.pdf.)
72 BMA News, January 24 2004.
73 House of Commons Health Committee (2004) Obesity Third Report of Session 2003-2004 Volume 1, para 51. p.19. London: The Stationery Office Limited.
74 Saxena,S. Ambler,G. Cole, T.J. and Majeed, A. (2004) Archives of Disease in Childhood 89 (1), 30-36.
75 See Department of Health (2003) Food and Health Action Plan: Food and Health Problem Analysis for comment. Chapter 3 55. www.dh.gov.uk/assetRoot/04/06/58/34/04065834.pdf .
76 Parliamentary Office of Science and technology Postnote 2003, No 205, Childhood Obesity.
77 E. Stamatakis (2002). Anthropometric measurements, overweight and obesity. In The Health of Children and Young People 2002 Chapter 9.
Obesity & Children�s Health
32
There are also associations between childhood obesity and the increased prevalence of Type 2 diabetes amongst children. Type 2 diabetes used to be called �late onset diabetes�, as it was normally associated with diabetes developing in adults over the age of 35. It is now being increasingly diagnosed in children.78 Type 2 diabetes is much more difficult to control than Type 1. A long-term study of 51 Canadian patients aged 18-33 years who had developed Type 2 diabetes before the age of 17 found that:
�Seven had died; three others were on dialysis; one became blind at the age of 26; and one had a toe amputation. Of the 56 pregnancies in this cohort, only 35 had resulted in live births (62.5%).�79
Recent research has however produced one important finding: the obese do not have to achieve an ideal weight to make significant improvements to their risk profile. Individuals can benefit from a 5-10% weight loss.80
2.1.6 Economic costs
The National Audit Office (NAO) has estimated that the direct cost of treating obesity and its consequences in 1998 was £480 million (1.5% of NHS expenditure) and that indirect costs (loss of earnings due to sickness and premature mortality) amounted to £2.1 billion, making an overall cost of £2.58 billion. Moreover the authorsacknowledge throughout that their estimates are conservative.81
The House of Commons Health Committee asked the House of Commons Clerk�s Department Scrutiny Unit to revisit the NAO�s calculations and produce a more up-to-date and comprehensive analysis of the costs of obesity. In summary, they have estimated that in England in 2002 the total estimated cost of obesity is £3.3-3.7 billion. These figures, they suggest, should still be regarded as an underestimate, as they are for obesity only. Supposing that the costs due to being overweight are on average half that of being obese, then (since there are more than twice as many overweight as obese men and women) these costs would more than double. This would suggest, according to the Committee�s report, an overall cost estimate for overweight and obesity of £6.6-7.4 billion per year.
78 One estimate suggests up to 45% of diabetes diagnosed in American children is now Type 2. See A Pagota Campagna, �Emergence of type 2 diabetes mellitus in children: epidemiological evidence�, Journal of Paediatric Endocrinology and Metabolism 13 (200) supplement 6, pp 1395-1402.
79 Dean, H. Flett, B. �Natural history of type 2 diabetes diagnosed in childhood: long term follow-up in young adult years�, Diabetes 2002:51 (suppl 2) A24-25, cited in RCP, Storing up problems: the medical case for a slimmer nation, 2004, p.8 : Q195 (Dr Barrett)
80 James, W.P.T. (1996) The I.O.T.F., Obesity at the World Health Organisation. Journal of Nutrition, Metabolism and Cardiovascular Disease Supplement 6, 12-13.
81 Tackling obesity in England, para 2.27. Cited in House of Commons Health Committee (2004) Obesity Third Report of Session 2003-2004 Volume 1, para 63. p.21. London: The Stationery Office Limited.
Causes of Obesity
33
2.2 Causes of obesity
Although it is widely acknowledged that a range of environmental and cultural factors are implicated in the trend towards obesity, public debate has usually focussed on the relative importance of diet and exercise.
�Faced by a life circumstance that discourages routine physical effort and activity and that offers a surfeit of palatable, high energy and high fat foods in bewildering variety, weight gain is an understandable consequence.�82
�A few largely preventable risk factors account for most of the world's disease burden. This reflects a significant change in diet habits and physical activity levels worldwide as a result of industrialization, urbanization, economic development and increasing food market globalization.�83
2.2.1 Concerns about national levels of physical activity
�Physical activity has a significant effect on health, and a low level of physical activity has a close relationship with diet-related illness�.84
The House of Commons Health Committee comments that there is little doubt that the nation as a whole is not as active as it should be.
�Levels of activity in the UK are below the European average ... The increasing use of cars has led to a vicious circle of car dependency, as town planning has increasingly prioritised the needs of motorists above those of pedestrians and cyclists, meaning that in many places walking and cycling are at best unpleasant and at worst dangerous �.. Less tangible, but probably at least as pertinent, has been the reduction in physical activity in everyday life arising from mechanised tools, warmer dwellings, labour-saving devices, lifts and escalators, more sedentary jobs, and the pursuit of more sedentary leisure activities.�85
The report on recent lifestyle changes in the UK prepared for Ofcom by the Henley Centre to provide background information for the present research, reports that less than half (47%) of adults participate in sport more than 12 times a year and only 32% take the recommended 30 minutes of moderate exercise (e.g. brisk walking) 5 times a week. These figures have been stable for the last decade.
In the UK amongst children in particular, sedentary activities such as computer use and TV viewing have all risen dramatically. In the 1970s, 90% of primary school children in the UK walked to school, compared with 10% today.86 In schools the
82 Hill, A.J., Rogers, P.G. (1998) Food Intake and eating behaviour. In Kopelman, P.G., Stock, M.J. (Eds.) Clinical obesity pp86-111. Blackwell Science. Oxford.
83 http://www.W.H.O.int/dietphysicalactivity/en/
84 Department of Health (2003) Food and Health: Food and Health Problem Analysis for comment. Chapter 1 18. www.dh.gov.uk/assetRoot/04/06/58/34/04065834.pdf .
85 House of Commons Health Committee (2004) Obesity Third Report of Session 2003-2004 Volume 1, p.41-43 para 133, 137, 144. London: The Stationery Office Limited
86 DEFRA 2001. Cited in Henley Centre report prepared for Ofcom.
Causes of Obesity
34
introduction of core curriculum Literacy and Numeracy hours has reduced time spent on sport. Very few primary school teachers are trained in PE. Facilities are ageing - a high proportion were built in the 1970s. The selling of schools� playing fields has had serious repercussions.
In many European countries such as Austria, Norway, Portugal, Spain and Switzerland, 3.5 hours per week is spent on school sport.87 In 2002 less than half of English children received the Government�s target of 2 hours per week of PE in school.88 These trends are particularly important since academic studies have highlighted the fact that the critical lifelong motivation to take part in recreational sport is learnt primarily between the ages of 7 and 10.
It has been estimated that the cost of physical inactivity in England is around £2 billion per year and each 10% increase in activity across the population has a potential gain of £500 million.89
2.2.2 Research on links between obesity and lack of physical exercise
Research addressing the potential link between low levels of physical activity and obesity has produced some conflicting results. A number of studies have detected significant relationships between physical activity levels and percentage of body fat or overweight/obesity amongst children.90 However, a number of other studies have not found any significant association.91
Moreover links between sedentary activities such as television viewing and physical inactivity are contested. Roberts et al (2004), comparing data across 34 European countries and the USA in a recent W.H.O. report, comment:
87 House of Commons Health Committee, Second Report of Session 2000-2001, Public Health, HC30, para 191.
88 House of Commons Health Committee (2004) Obesity Third Report of Session 2003-2004 Volume 1, p.44 para 148. London: The Stationery Office Limited.
89 Game Plan (December 2002). A Strategy for Delivering Government�s sport and physical activity objectives, p 47.
90 LeMura, L.M., Andreacci, J., Carlona, R., Klebez, J.M., Chelland, S. Evaluation of physical activity measured via accelerometry in rural fourth-grade children. Percept Motor Skill, 2000; 90: 329-337: Almeida, M., Fox, K. Preliminary evidence for an activity-fatness relationship in Portuguese adolescents. J. Sport Sci, 1998; 16: 31-32. Rowlands, A.V., Eston, R.G., Ingledew, D.K. Relationship between activity levels, aerobic fitness, and body fat in 8- to 10-yr-old children. J. Appl Physiology, 1999; 86: 1428-1435: Sallis, J.F., Taylor, W.C., Dowda, M., Freedson, P.S., Pate, R.R. Correlates of vigorous physical activity for children in grades 1 through 12: Comparing parent-reported and objectively measured physical activity. Pediatr Exerc Sci, 2002; 14: 30-44: Berkowitz, R.I., Agras, W.S., Korner, A.F., Kraemer, H.C., Zeanah, C.H. Physical-activity and adiposity - a longitudinal-study from birth to childhood. J. Pediatrics,1985; 106:734-738. Janz, K.F., Golden, J.C., Hansen, J.R. Heart-rate monitoring of physical-activity in children and adolescents - the Muscatine Study. Pediatrics, 1992; 89: 256-261.
91 Maffeis, C., Talamini, G., Tato, L. (1994) Influence of diet, physical activity and parents' obesity on children's adiposity: a four-year longitudinal study. Int J. Obesity, 1998; 22: 758-764. Moussa, M.A.A., Skaik, M.B., Selwanes, S.B., Yaghy, O.Y., Binothman, S.A. Factors associated with obesity in school-children. Int J Obesity, 1994; 18: 513-515.
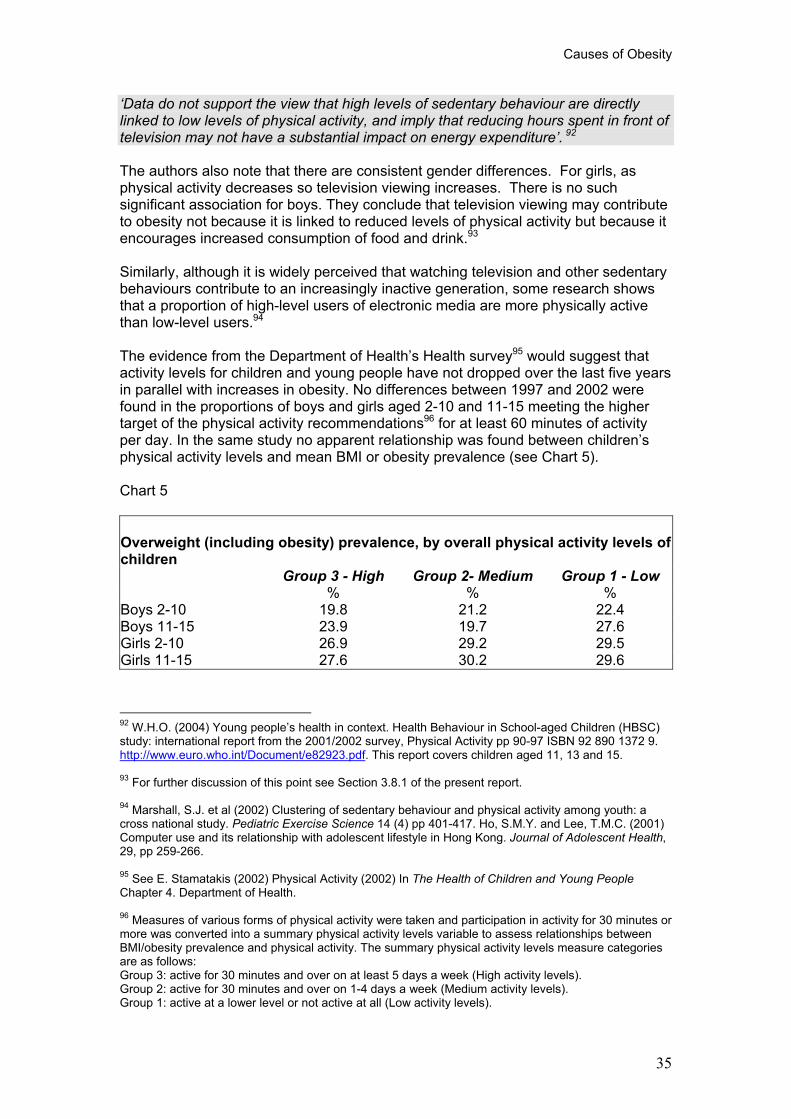
Causes of Obesity
35
�Data do not support the view that high levels of sedentary behaviour are directly linked to low levels of physical activity, and imply that reducing hours spent in front of television may not have a substantial impact on energy expenditure�. 92
The authors also note that there are consistent gender differences. For girls, as physical activity decreases so television viewing increases. There is no such significant association for boys. They conclude that television viewing may contribute to obesity not because it is linked to reduced levels of physical activity but because it encourages increased consumption of food and drink.93
Similarly, although it is widely perceived that watching television and other sedentary behaviours contribute to an increasingly inactive generation, some research shows that a proportion of high-level users of electronic media are more physically active than low-level users.94
The evidence from the Department of Health�s Health survey95 would suggest that activity levels for children and young people have not dropped over the last five years in parallel with increases in obesity. No differences between 1997 and 2002 were found in the proportions of boys and girls aged 2-10 and 11-15 meeting the higher target of the physical activity recommendations96 for at least 60 minutes of activity per day. In the same study no apparent relationship was found between children�s physical activity levels and mean BMI or obesity prevalence (see Chart 5).
Chart 5
Overweight (including obesity) prevalence, by overall physical activity levels of children
Group 3 - High Group 2- Medium Group 1 - Low % % % Boys 2-10 19.8 21.2 22.4 Boys 11-15 23.9 19.7 27.6 Girls 2-10 26.9 29.2 29.5 Girls 11-15 27.6 30.2 29.6
92 W.H.O. (2004) Young people�s health in context. Health Behaviour in School-aged Children (HBSC) study: international report from the 2001/2002 survey, Physical Activity pp 90-97 ISBN 92 890 1372 9. http://www.euro.who.int/Document/e82923.pdf. This report covers children aged 11, 13 and 15.
93 For further discussion of this point see Section 3.8.1 of the present report.
94 Marshall, S.J. et al (2002) Clustering of sedentary behaviour and physical activity among youth: a cross national study. Pediatric Exercise Science 14 (4) pp 401-417. Ho, S.M.Y. and Lee, T.M.C. (2001) Computer use and its relationship with adolescent lifestyle in Hong Kong. Journal of Adolescent Health,29, pp 259-266.
95 See E. Stamatakis (2002) Physical Activity (2002) In The Health of Children and Young PeopleChapter 4. Department of Health.
96 Measures of various forms of physical activity were taken and participation in activity for 30 minutes or more was converted into a summary physical activity levels variable to assess relationships between BMI/obesity prevalence and physical activity. The summary physical activity levels measure categories are as follows: Group 3: active for 30 minutes and over on at least 5 days a week (High activity levels). Group 2: active for 30 minutes and over on 1-4 days a week (Medium activity levels). Group 1: active at a lower level or not active at all (Low activity levels).
Causes of Obesity
36
When the relationship of overweight (including those who were obese) to overall activity levels was examined, weak inverse relationships were found for boys (r=-0.23, not significant) and for girls (r=-0.20, not significant).
Meta-analysis97 of some fifty studies covering the whole range of the existing activity measurements (questionnaires, motion sensors, direct observation, heart rate monitors) was carried out and offers some explanation for the diverse results found in this research area. One of the main findings is that questionnaire studies indicate less of an effect than studies that use objective measures. The authors� conclusion was that non-objective evidence on the relationships between children's activity and body weight status should be interpreted with caution.
2.2.3 Concerns about national diet
Early reporting by the Government�s Food and Health Action Plan98 notes that the majority of people in the UK consume more than the recommended amounts of fat, saturated fat, added salt and sugar. The authors stress the implications for public health:
��a small reduction in salt intakes across the population could lead to significant improvements in health. A two point reduction in average blood pressure readings across the population could be expected to reduce the rates of stroke by 16% and coronary heart disease by 6% (Greenland Editorial, New England Medical Journal, 2001) 75% of the salt we consume comes from processed foods��
Dr Colin Waine of the National Obesity Forum offers a Darwinian explanation for the hypothesised link between high fat consumption and obesity. He suggests that people are pre-programmed to like energy-rich foods, which in the past conferred an evolutionary advantage. In the �modern world� this preference can lead to obesity.
�� in many ways the present obesity epidemic can be thought of as an inevitable, biological response to an abnormal environment. For millions of years the ability of humans to store energy as fat was an evolutionary advantage, guaranteeing survival through famine. In the modern world of plentiful energy rich foods it has overnight (in evolutionary terms), become a hazard to health and well-being.�
The low consumption of fruit and vegetables in the UK also raises concerns. It is widely accepted that fruit and vegetable consumption can protect against cancer and coronary heart disease.
�After reducing smoking, increased consumption of fruit and vegetables may be the most effective cancer prevention strategy.�99
97 Rowlands, A.V., Ingledew, D.K., Eston, R.G. (2000) The effect of type of physical activity measure on the relationship between body fatness and habitual physical activity in children: a meta-analysis. Ann of Hum Biol, 2000; 27: 479-497.
98 Department of Health (2003) Food and Health Action Plan: Food and Health Problem Analysis for comment. Chapter 2 31. www.dh.gov.uk/assetRoot/04/06/58/34/04065834.pdf .
99 Day, (2000). Report to Department of Health.
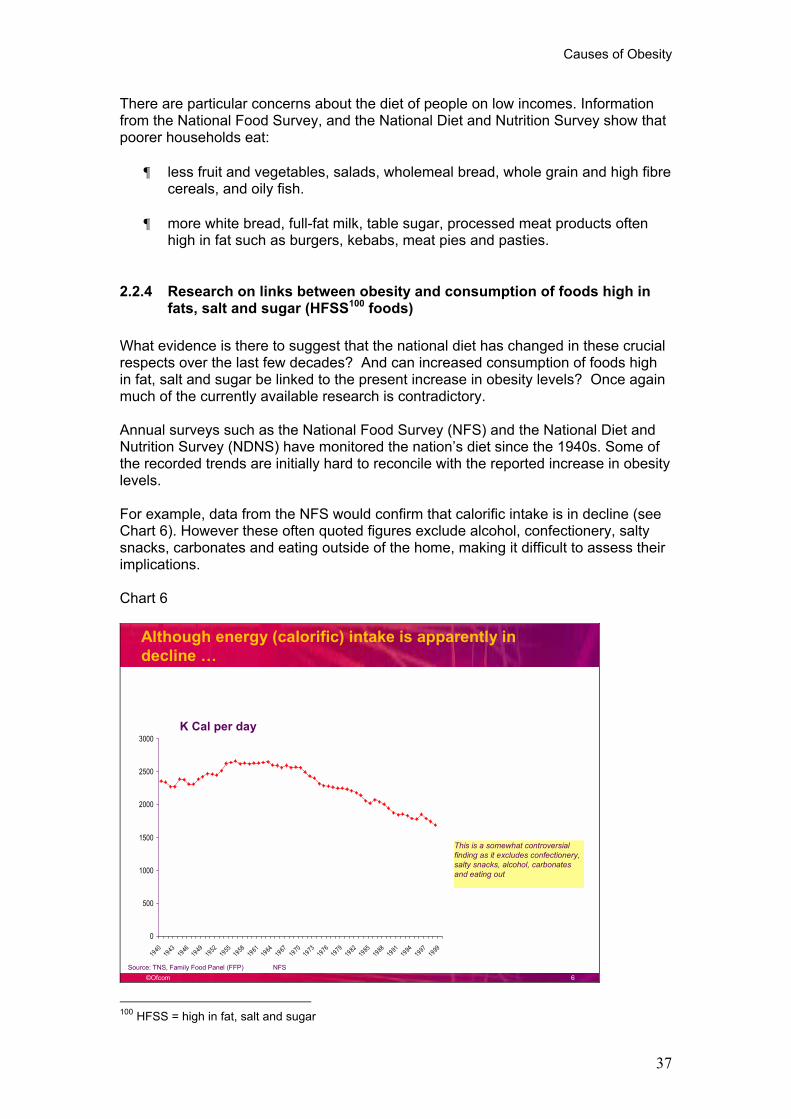
Causes of Obesity
37
There are particular concerns about the diet of people on low incomes. Information from the National Food Survey, and the National Diet and Nutrition Survey show that poorer households eat:
¶ less fruit and vegetables, salads, wholemeal bread, whole grain and high fibre cereals, and oily fish.
¶ more white bread, full-fat milk, table sugar, processed meat products often high in fat such as burgers, kebabs, meat pies and pasties.
2.2.4 Research on links between obesity and consumption of foods high in fats, salt and sugar (HFSS100 foods)
What evidence is there to suggest that the national diet has changed in these crucial respects over the last few decades? And can increased consumption of foods high in fat, salt and sugar be linked to the present increase in obesity levels? Once again much of the currently available research is contradictory.
Annual surveys such as the National Food Survey (NFS) and the National Diet and Nutrition Survey (NDNS) have monitored the nation�s diet since the 1940s. Some of the recorded trends are initially hard to reconcile with the reported increase in obesity levels.
For example, data from the NFS would confirm that calorific intake is in decline (see Chart 6). However these often quoted figures exclude alcohol, confectionery, salty snacks, carbonates and eating outside of the home, making it difficult to assess their implications.
Chart 6
©Ofcom 6
0
500
1000
1500
2000
2500
3000
1940
1943
19461949
19521955
195819
6119
6419
671970
19731976
197919
8219
8519
881991
19941997
1999
Although energy (calorific) intake is apparently in decline �
K Cal per day
Source: TNS, Family Food Panel (FFP) NFS
This is a somewhat controversial finding as it excludes confectionery, salty snacks, alcohol, carbonates and eating out
100 HFSS = high in fat, salt and sugar
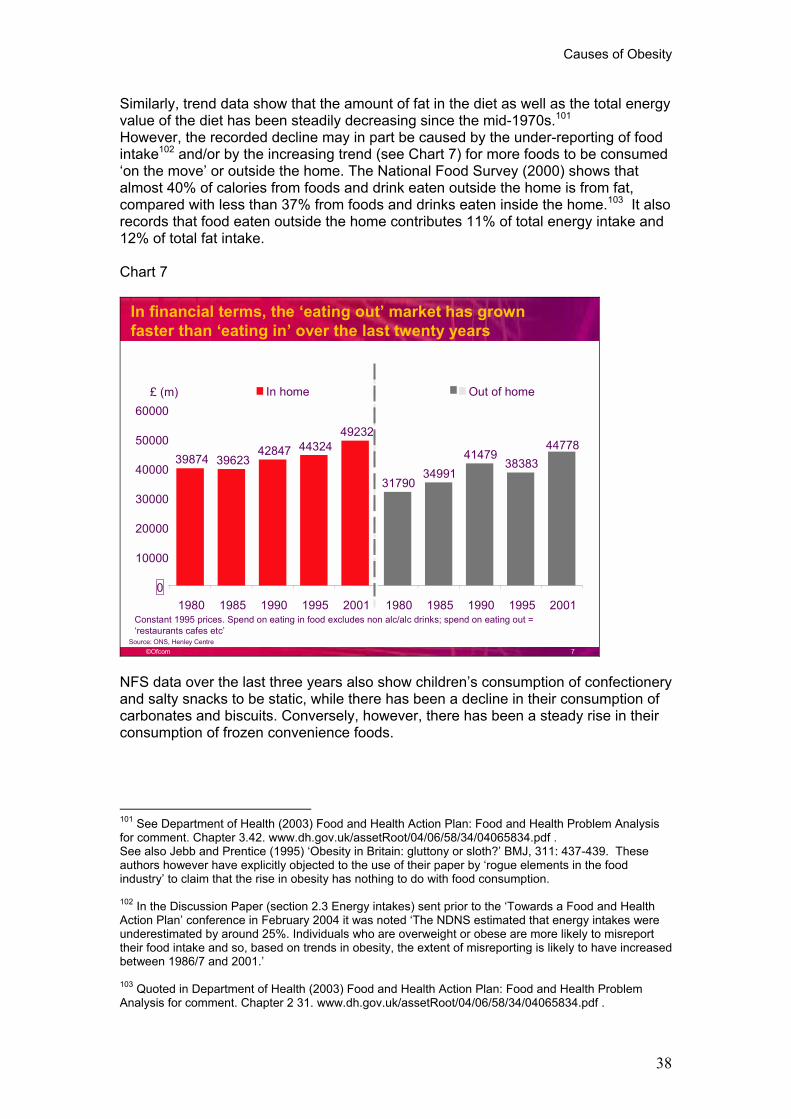
Causes of Obesity
38
Similarly, trend data show that the amount of fat in the diet as well as the total energy value of the diet has been steadily decreasing since the mid-1970s.101
However, the recorded decline may in part be caused by the under-reporting of food intake102 and/or by the increasing trend (see Chart 7) for more foods to be consumed �on the move� or outside the home. The National Food Survey (2000) shows that almost 40% of calories from foods and drink eaten outside the home is from fat, compared with less than 37% from foods and drinks eaten inside the home.103 It also records that food eaten outside the home contributes 11% of total energy intake and 12% of total fat intake.
Chart 7
©Ofcom 7
In financial terms, the �eating out� market has grown faster than �eating in� over the last twenty years
Source: ONS, Henley Centre
39874 3962342847 44324
49232
0
10000
20000
30000
40000
50000
60000
1980 1985 1990 1995 2001
In home
3179034991
4147938383
44778
1980 1985 1990 1995 2001
Out of home£ (m)
Constant 1995 prices. Spend on eating in food excludes non alc/alc drinks; spend on eating out = �restaurants cafes etc�
NFS data over the last three years also show children�s consumption of confectionery and salty snacks to be static, while there has been a decline in their consumption of carbonates and biscuits. Conversely, however, there has been a steady rise in their consumption of frozen convenience foods.
101 See Department of Health (2003) Food and Health Action Plan: Food and Health Problem Analysis for comment. Chapter 3.42. www.dh.gov.uk/assetRoot/04/06/58/34/04065834.pdf . See also Jebb and Prentice (1995) �Obesity in Britain: gluttony or sloth?� BMJ, 311: 437-439. These authors however have explicitly objected to the use of their paper by �rogue elements in the food industry� to claim that the rise in obesity has nothing to do with food consumption.
102 In the Discussion Paper (section 2.3 Energy intakes) sent prior to the �Towards a Food and Health Action Plan� conference in February 2004 it was noted �The NDNS estimated that energy intakes were underestimated by around 25%. Individuals who are overweight or obese are more likely to misreport their food intake and so, based on trends in obesity, the extent of misreporting is likely to have increased between 1986/7 and 2001.�
103 Quoted in Department of Health (2003) Food and Health Action Plan: Food and Health Problem Analysis for comment. Chapter 2 31. www.dh.gov.uk/assetRoot/04/06/58/34/04065834.pdf .
Causes of Obesity
39
On the basis of this sometimes contradictory evidence, it had been suggested that reductions in activity levels, rather than changes in the diet of British people, are the primary cause of increased obesity levels. It has also been pointed out that fat, salt and sugar are all necessary parts of a healthy diet: they are only unhealthy if consumed in excess. This is sometimes summarised in the statement that �there is no such thing as an unhealthy food � only an unhealthy diet�.104
However, it is generally accepted that both activity levels and food consumption are implicated. Rising levels of obesity reflect changes in the nation�s energy balance: people are consuming more calories through food than they are expending through physical activity. We need to understand more about both sides of the equation and how they interact. In particular, the House of Commons Health Committee highlights the need for more accurate information on the population�s calorie consumption:
�Given the profound significance of overweight and obesity to the population we believe it is essential that the Government has access to accurate data on the actual calories the population is consuming, including figures for confectionery, soft drinks, alcohol and meals taken outside of the home. Although we acknowledge the difficulties of obtaining accurate data, given the limitations of any self-reported survey, the current information is very weak and clearly underestimates actual calorie consumption. We recommend that work is urgently commissioned to establish a Food Survey that accurately reflects the total calorie intake of the population to supersede the flawed and partial analysis currently available.�105
104 Some food manufacturers claim there is a clear distinction, for example, between food and alcohol or tobacco. They argue that, while there is no such thing as a safe cigarette, there is no food which is dangerous per se.
105 House of Commons Health Committee (2004) Obesity Third Report of Session 2003-2004 Volume 1, p.25 para 72. London: The Stationery Office Limited.
Calls for Action
40
2.3 Calls for action
2.3.1 W.H.O. recommendations On 23rd May 2004, The World Health Organization�s Global Strategy on Diet, Physical Activity and Health was endorsed by member states at their annual Health Assembly in Geneva. The Global Strategy pinpoints diet and physical activity as the key areas in which effective and integrated national strategies need to be developed to reduce the human and socioeconomic costs of non-communicable diseases (such as cardiovascular disease, type 2 diabetes, cancers and obesity-related conditions). It emphasizes the need to limit the consumption of saturated fats and trans-fatty acids, salt and sugars, and to increase consumption of fruit and vegetables and levels of physical activity. It also addresses the role of prevention in health services; food and agriculture policies; fiscal policies; surveillance systems; regulatory policies; consumer education and communication including marketing, health claims and nutrition labelling; and school policies as they affect food and physical activity choices.
Recommended areas for action include education/public awareness activities, labelling and health claims as well as the provision of accurate and balanced information on diet and physical activity. Regarding the latter it states that areas for action on this could include:
�Marketing, advertising, sponsorship and promotion: Food advertising affects food choices and influences dietary habits. Food and beverage advertisements should not exploit children�s inexperience or credulity. Messages that encourage unhealthy dietary practices or physical inactivity should be discouraged, and positive, healthy messages encouraged. Governments should work with consumer groups and with the industry (including the advertising sector) to develop appropriate approaches to deal with the marketing of food to children.�106
Both the World Health Organisation (W.H.O.) and The International Obesity Task Force (IOTF)107 recommend tighter regulation of food promotion and tougher enforcement. The IOTF supports the �precautionary principle�108 which asserts that children, especially youngsters, should be protected from �excessive marketing�.
2.3.2 The British response so far In response to this upsurge of concern, the Cabinet Office and The Department of Health, as well as professional bodies such as the British Medical Association (BMA),
106 WHO (December 2004) Global Strategy on Diet, Physical Activity and Health. Draft version.
107 The International Obesity TaskForce (IOTF) is part of the International Association for the Study of Obesity (IIASO). The TaskForce collaborates with the World Health Organization and has working groups examining a range of issues.
108 The Food Standard Agency (FSA) report (Gerard Hastings, Martine Stead, Laura McDermot, Alasdair Forsyth, Anne Marie MacIntosh, Mike Rayner, Christine Godfrey, Martin Caraher and Kathryn Angus (2003) Review of Research on the Effects of Food Promotion to Children. CSM. Glasgow (p.23)) notes the Chief Medical Officer�s advocacy of the �precautionary principle� � that regulation should rest on a judgement of probable influence rather than on any absolute demonstration of the harmful effects of food promotion.
Calls for Action
41
and groups such as the National Obesity Forum (NOF)109 have identified obesity as a major public health issue and called for action on a number of fronts.
As early as 1997 the Health Education Authority initiated a process of expert consultation and review of the evidence surrounding the promotion of health-enhancing physical activity among young people, with the aim of producing a policy framework and recommendations. Review papers on key aspects of physical activity amongst young people were also produced.110 The outcome of the review process was a set of recommendations on physical activity levels for young people aged 5-18.
The primary recommendations are:
¶ All young people should participate in physical activity of at least moderate intensity for one hour per day.
¶ Young people who currently do little activity should participate in physical activity of at least moderate intensity for at least half an hour per day.
In recognition of the importance of encouraging physical activity, the Government�s Game Plan 2002 initiative aims to increase participation in sport from the current level of 30% to 70% by 2020, throughout the population. Pilot initiatives on reinstating park wardens and peripatetic sports coaches visiting schools already show signs of having positive effects.
The Department of Health has taken a lead role in the development of a Food and Health Action Plan, working across Government with the food industry and other stakeholders to �establish a coherent and effective programme of activities on nutrition in order to achieve a healthier diet for people in England�.111 In 2003 the Department of Health stated:
�The food we eat, and the way it is produced and manufactured, has a significant impact on health. Cancer and cardiovascular diseases, including heart disease and stroke are the major causes of death in England, accounting for almost 60% of all premature deaths between them. The types of diet people eat and, therefore, the food they buy and the way it is processed and prepared, can influence the risk of developing these diseases. In total it is thought that treating ill-health caused by poor diet costs the NHS at least £2bn each year.� 112
Government action to improve diet and nutrition is to be guided by a comprehensive set of policy objectives designed to improve the death rate for cancer and coronary heart disease and to narrow the health gap between socio-economic groups.
109 The NOF was established by medical practitioners in the United Kingdom in 2000 to raise awareness of the growing impact of obesity and overweight on our patients and our national health service. Membership is open to all health professionals and currently numbers more than 1,500.
110 Biddle S, Sallis J and Cavill N (eds). Young and Active? Young people and health-enhancing physical activity - evidence and implications, Health Education Authority, London, 1998.
111 Department of Health (2003) Food and Health Action Plan: Food and Health Problem Analysis for comment. www.dh.gov.uk/assetRoot/04/06/58/34/04065834.pdf .
112 Department of Health (2003) Food and Health Action Plan: Food and Health Problem Analysis for comment. Chapter 2 29. www.dh.gov.uk/assetRoot/04/06/58/34/04065834.pdf .
Calls for Action
42
In Scotland the problem is being tackled through the Scottish Executive primary health care and exercise initiatives. The Physical Activity Task Force targets schools, and the Scottish Diet Action Plan Eating for Health aims to double the consumption of fruit, vegetables and oily fish and reduce the consumption of total and saturated fat by over 5% by 2005.113 In Wales a BBC Wales social action campaign (the �Big Fat Problem�) has been developed in partnership with the Welsh Assembly Government. It aims to raise awareness of the health benefits of eating a healthy diet and undertaking regular physical activity.
Initiatives such as Media Smart, which is supported by the government and the National Confederation of Parent Teacher Associations, as well as major advertisers, aim to educate children about advertising, while the study of advertising and the development of �media literacy� is an increasing part of Personal Health and Social Education within schools.
There have also been some initiatives from the food industry. For example several supermarkets have banned the placement of confectionery at checkouts, fast food outlets have begun to offer fruit and salad options and Kraft and McDonald�s have begun to limit the availability of super-sized portions. The fast food chain McDonald�s has announced a campaign designed to promote a �healthy lifestyle�. It is investing £1 million on a series of two-minute adverts during children�s television, encouraging children to eat fruit and vegetables and keep active. Andrew Taylor, CEO and Chairman of McDonald�s announced at a Childhood Obesity conference in Scotland in June 2004:
�We recognise that getting children to eat a balanced diet can sometimes be a challenge for parents and we have therefore taken the decision, as part of our commitment to responsible communication, to work on a programme to help parents.�
The Food Standards Agency (FSA) is currently involved in a project to identify a range of options for nutrient profiles that could be used to define 'healthier food choices' and 'foods high in fat, sat or sugar' in relation to specific aspects of the promotion of food to children. The nutrient profiles would be used as the basis for Agency advice, for example on the use of children's characters on foods or healthier vending approaches in schools, or food labelling schemes. It is expected that the FSA will report on the project in the autumn of 2004.
Not withstanding these initiatives, the conclusion of the House of Commons Health Committee, reporting in May 2004, is that current Government interventions are an insufficient response to the magnitude of the �obesity crisis�. It pinpoints the low profile of obesity for the NHS and the inadequacy of the treatment currently available for obese children, the lack of Government-funded health education campaigns and the failure of the DTI to produce a National Walking Strategy.
Concerning the role of food advertising and promotion, the Committee notes that:
�..for every pound the Health Education Authority used to spend on promoting healthy diets there is about £800 being spent by the food industry encouraging us to eat their products. Of those products, about 95% are ones that would have encouraged weight gain rather than a healthy diet.�114
113 Health in Scotland 2001, Scottish Executive
114 House of Commons Health Committee (2004) Obesity Third Report of Session 2003-2004 Volume 1, p.54-55 para 182. London: The Stationery Office Limited.
Calls for Action
43
Although calling for the support of the food industry, the Committee does not feel that it is realistic to rely on them to achieve equality in the promotion of healthy and unhealthy foods. However, it applauds the food industry�s desire to be part of the solution as well as part of the problem. The committee�s concluding thought is that:
� the Government must be prepared to act and intervene more forcefully and more directly if voluntary agreements fail. We recommend that the Government should allow three years to establish those areas where voluntary regulation and cooperation between the food industry and Government have worked and those where they have failed. It should then either extend the voluntary controls or introduce direct regulation�.115
115 House of Commons Health Committee (2004) Obesity Third Report of Session 2003-2004 Volume 1, p.107 para 411. London: The Stationery Office Limited.
Research Findings
44
3 Research Findings In the following section we summarise the findings of an extensive, multi-faceted programme of research undertaken by Ofcom to inform decisions concerning regulatory options.
Two reviews of academic research were commissioned. This work was led by Professor Sonia Livingstone, Dept. of Media and Communications, London School of Economics.
Existing market data pertinent to this area was also extensively analysed:
¶ Lifestyle trends and analysis: Comprehensive, longitudinal data bases, studies and panels sourced from both the Henley Centre and Taylor Nelson Sofres (TNS)116 are used to help us to understand better lifestyle and societal changes which have had significant impact upon food purchasing, preparation and consumption in and outside the home, and upon levels of physical activity as well as overall trends in food consumption amongst children.
¶ Viewing analysis: Using BARB audience measurement data, we look at trends over three years in viewing in and out of dedicated children�s airtime on terrestrial television and dedicated children�s channels, plus trends in viewing in commercial and non-commercial airtime. Differences due to demographics and viewing platform (multi-channel, digital and terrestrial-only homes) are examined. The aim is to understand what and when children are viewing.
¶ Analysis of advertising spend and exposure: Using data sourced from Nielsen Media Research, we examine trends over the past 5 years in above-the-line marketing spend for the following Core Categories: all food, soft drink and fast food chains.117 We also examine spend and exposure in and out of children�s airtime, as well as seasonal differences. The aim here is to understand the role of television in the overall above-the-line promotional mix for these Core Food Categories, how much and what type of television Core Food Category advertising children are exposed to.
¶ Content analysis: David Graham and Associates was commissioned to analyse television advertisements during children�s commercial airtime on
116 The TNS Family Food Panel includes 11,000 individuals within 4,200 households who record their food and drink consumption in diaries. It is the UK�s largest database tracking food and drink consumption. The TNS Superpanel consists of 15,000 GB households demographically and regionally representative of the total household population. Food purchasing is recorded using palm pilot technology (bar code detail) and the information is collected through telephone line.
117 For further details on food categorisation see Appendix 6. When analysing the above-the line size and spend of the food market, we have used the following categories as defined by Nielsen Media: 1) Food 2) Soft Drinks 3) Chain Restaurants. These have been grouped together to create what is referred to throughout the analysis of the advertising market as �Core Category� foods. This definition is broader than that used by the FSA and includes the �Big 6th� product category of Prepared & Convenience Foods. One of the principal reasons for looking at all food, soft drinks and fast food restaurants is that given the data available, and the amount of subjectivity involved, it is difficult to determine what a definition of �unhealthy� foods/HFSS foods should contain. For example, it is generally accepted that vegetables are a healthy food; however, chips are included in the vegetable category and these are generally regarded as an unhealthy food.
Research Findings
45
ITV1, in order to inform our understanding of creative executions in children�s airtime and in the early evening118.
Ofcom also commissioned two UK-wide market research studies:
¶ A wide-ranging qualitative research project (conducted by Ruth Foulds) in which we probe the role of TV advertising on food choices, consumption and attitudes which operate in homes and at school. This includes ethnographic-style family encounters, observational studies in schools at lunchtime, interviews with teachers, focus groups with mothers and with children, and in-depth telephone interviews with teachers and nutritionists.119
¶ A quantitative survey of over 1,000 interviews each with parents and their children, conducted by NOP. This survey examines children�s consumption of food in general, and of HFSS foods in particular, as well as the factors which influence food choice, thereby addressing issues generally examined separately in previous academic studies. This enables us to interpret the role played by TV advertising in the consumption of particular foods of special interest in the context of other potential influences. These involve both other promotional activities and individual, social, and environmental factors identified in our literature reviews and widely acknowledged to have a major influence on diet and health. The aim is to provide contemporary, UK-based information120 which can inform a proportionate and targeted response to suggestions that modifications may be needed to the regulations governing food advertising on TV to children.
o Further multivariate analysis was carried out (by Dr Peter Lunt of University College London and Ellen Helsper of the London School of Economics and Political Science) in order to mine more fully the findings from the quantitative research.
118 The analysis involved the recording of advertisements shown on ITV1 in the HTV west region across 7 days between Sept � Nov 2003. Details of commercial spots aired during ITV�s dedicated children�s slots and the early evening slot were recorded with the latter providing a comparison against which the activity during children�s airtime has been assessed.
119 The qualitative research comprised of the following: ¶ 8 family encounters conducted with mothers (+ one father) and children aged 4-14 years ¶ 6 school sessions: three primary schools, three secondary schools ¶ 8 group discussions with mothers of children aged 5-15 years ¶ 10 group discussions with children aged 5-15 years ¶ 2 depth interviews with mothers of overweight 5 year olds ¶ 8 paired depth interviews with mothers and overweight children aged 7-15 years ¶ 10 telephone depth interviews: 5 primary school teachers, 5 secondary school teachers ¶ 10 telephone depth interviews with nutritionists
120 The FSA�s Hastings Report and the FAU�s critique both noted the need for recent UK based research.
Research Findings
46
Much has also been learned from studies of the diet of British children in major national surveys121 and from previous research on the market forces in the food industry122 as well as from academic studies on the influence of food promotion, well documented in the review commissioned by the Food Standards Agency (FSA)123
and critiqued by the Food Advertising Unit (FAU)124.
We at Ofcom would like to acknowledge our debt to the reports the FSA and FAU have produced and their continuing support throughout our own examination of the complex issues involved.125
121 See the National Diet and Nutrition Survey (NDNS) of young people aged 4 to 18 years and the National Food Survey (NFS)
122 See Angela Groves (2002) Children�s Food: Market Forces and Industry Responses. IGD Business publication. ISBN 1-904231-00-4
123 See Hastings Report.
124 See Paliwoda, S. and Crawford, I. (2003). An analysis of the Hastings Review. London: Food Advertising Unit. Young, B. (2003) Does food advertising influence children�s food choices? A critical review of some of the recent literature. International Journal of Advertising, 22, pp441-459.
125 More detailed examination of these reviews can be found in Sonia Livingstone (2004) A commentary on the research evidence regarding the effects of food promotion on children. See Appendix 1
Lifestyle Changes & Their Impact on Food Culture
47
3.1 Lifestyle changes and their impact on contemporary food culture in the UK
Over the past decades there have been substantial lifestyle changes in the UK that have had a major impact on what we may term the �food culture� of families.126
Amongst these changes are:
1. a steady rise in incomes 2. longer working hours 3. increase in the numbers of working mothers 4. increase in the numbers of time-poor/cash-rich parents
Ć5. increase in consumption of pre-prepared, convenience foods 6. increase in out-of-home eating 7. trend towards a �snacking/grazing culture� amongst children 8. increase in �children-only� meals 9. increasing influence of child over their food choice
Other trends have had a comparable impact on children�s activity levels:
1. increase in media ownership in the home and in children�s rooms 2. increase in parents� fears for the safety of children outdoors
Ć3. increase in sedentary indoor pastimes (watching TV, playing computer
games)4. decrease in physical activity amongst children.
These trends have, in general, had a negative impact on the diets and health of British children. In this section we will concentrate on those factors (italicised above) that have impacted upon our main focus of interest - children�s eating habits.
3.1.1 More pre-prepared/ convenience foods127
There is increasing consumer demand in Britain for convenience food. In its White paper: Convenience Matters (September, 2003), Information Resources Inc (IRI) 128 note:
�Town centre convenience stores are more prevalent than ever now that the leading supermarkets are involved in making the most of local trade. As well as having less time to buy food, consumers now have less time to prepare it. As a result, manufacturers are constantly revamping their offerings to suit people who want to eat on the go or want a meal ready as quickly as possible ... Convenience has arguably
126 Henley Centre report prepared for Ofcom.
127 The �prepared and convenience food� category as defined by TNS includes for example: Baked beans, canned pasta, pot noodles, frozen fish products, canned meats, pizza, frozen potatoes, hot dogs, burgers, red meat grills, ready meals, manufactured hot meat pies. As we have seen in Section 2.2.4 of this report, 75% of salt intake is accounted for by pre-prepared foods.
128 Information Resources Inc (IRI) works to provide leading global FMCG manufacturers and retailers with data on electronic point-of-sale purchases and consumer behaviour tracking through an alliance with Europanel, the leading European panel operator. This information is structured to inform their customers� sales, marketing and supply initiatives.
Lifestyle Changes & Their Impact on Food Culture
48
become the dominant concept in modern consuming and consequently in manufacturing and retailing as well.�129
According to market analysts Mintel, demand for ready meals in Britain grew by 44% between 1990 and 2002, while growth across Europe as a whole was 29%. They note that figures suggest that Britain is now consuming double the amount of ready meals consumed in France and six times the number in Spain. A �convenience food culture� is further indicated by figures showing that 80% of households in the UK have a microwave, compared with 27% in Italy.130
The House of Commons Health Committee point out that pre-prepared convenience foods limit the consumer�s choice and control over what they eat:
�When preparing a meal from scratch, a consumer will have full control over how much fat, sugar and other ingredients are put into the dish, control over the quantity to make and over the portion size that is served. Buying a snack such as a bag of crisps, or a ready-prepared meal to heat up, effectively removes those choices.�131
The trend towards convenience foods has a considerable impact on children�s diets. In our qualitative research Foulds (2004) identified the �convenience food culture�, or the demand for foods which are easy and quick to prepare, as a powerful barrier to healthier eating. With an abundance of processed products that don�t need forward planning and that require little, if any, preparation time it is easy to produce food for children very quickly and conveniently. Mothers often talked about having no time to do �proper cooking� and there was sometimes a reluctance to make the necessary effort and a feeling that real cooking is hard work.132
�Sometimes my mum�s tired when she comes home from work, so she just takes us to MacDonald�s or just puts something in the microwave for us.� (Girl/DE/11-13/Scotland)
�I think my children would eat healthier if I didn�t work but there�s nothing I can do about it.� (Mother of overweight 11 year-old boy/AB/Scotland)
�The oven chips, you just put them in the top of the oven and then put fish fingers or chicken nuggets or something underneath, it all takes the same time.� (Mother of 5-7 year-old/C1C2/N. Ireland)
The lack of preparation required in convenience foods is also important to older children who are likely to be preparing their own snacks.
129 http://www.infores.com/public/uk/newsEvents/thoughtleadership/uk_new_091903a.htm
130 http://news.bbc.co.uk/1/hi/uk/2787329.stm. Cited in House of Commons Health Committee (2004) Obesity Third Report of Session 2003-2004 Volume 1, para 83. p.27. London: The Stationery Office Limited.
131 House of Commons Health Committee (2004) Obesity Third Report of Session 2003-2004 Volume 1, para 84. p.27-28. London: The Stationery Office Limited.
132 In the qualitative and quantitative research we talk almost exclusively about mothers, as opposed to parents or fathers. This is simply because we found mothers to be almost always in charge of family food shopping. Consequently their attitudes to food and approach to their children�s diet is crucial. It is in no way meant to underplay the role of fathers, some of whom now fill this role in their families.
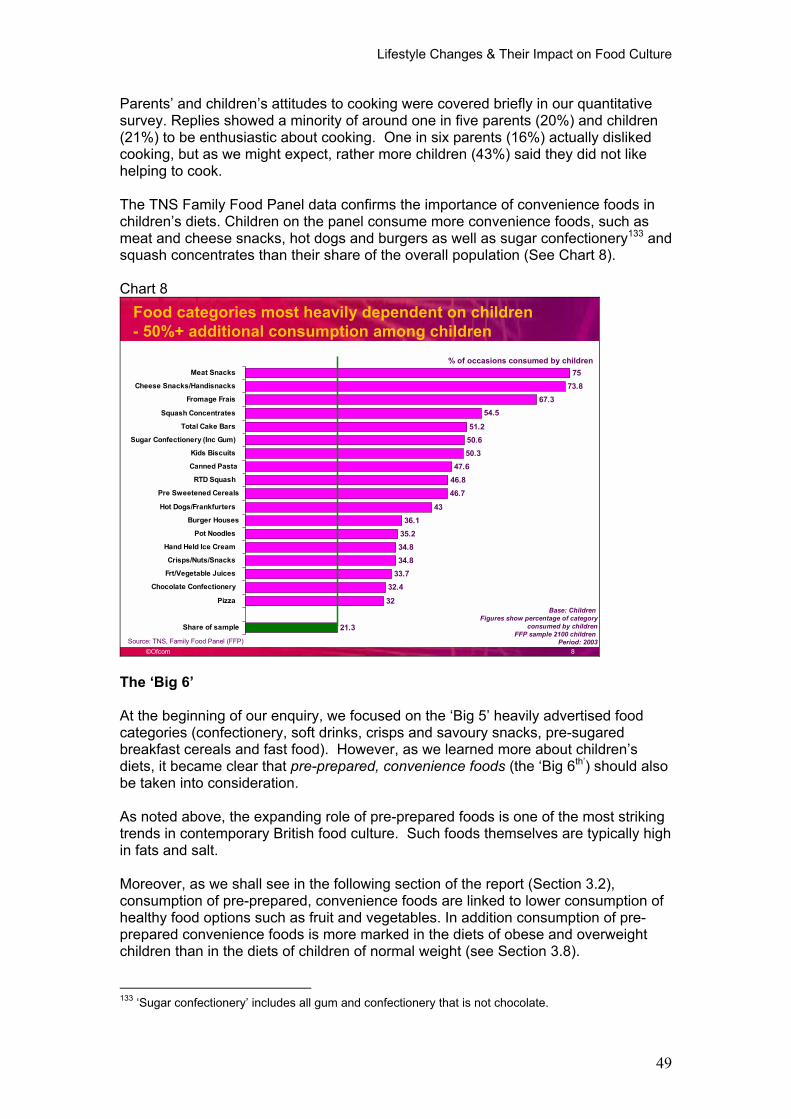
Lifestyle Changes & Their Impact on Food Culture
49
Parents� and children�s attitudes to cooking were covered briefly in our quantitative survey. Replies showed a minority of around one in five parents (20%) and children (21%) to be enthusiastic about cooking. One in six parents (16%) actually disliked cooking, but as we might expect, rather more children (43%) said they did not like helping to cook.
The TNS Family Food Panel data confirms the importance of convenience foods in children�s diets. Children on the panel consume more convenience foods, such as meat and cheese snacks, hot dogs and burgers as well as sugar confectionery133 and squash concentrates than their share of the overall population (See Chart 8).
Chart 8
©Ofcom 8
Food categories most heavily dependent on children - 50%+ additional consumption among children
7573.8
67.354.5
51.250.650.3
47.646.846.7
4336.1
35.234.834.8
33.732.4
32
21.3
Meat Snacks
Cheese Snacks/Handisnacks
Fromage Frais
Squash Concentrates
Total Cake Bars
Sugar Confectionery (Inc Gum)
Kids Biscuits
Canned Pasta
RTD Squash
Pre Sweetened Cereals
Hot Dogs/Frankfurters
Burger Houses
Pot Noodles
Hand Held Ice Cream
Crisps/Nuts/Snacks
Frt/Vegetable Juices
Chocolate Confectionery
Pizza
Share of sample
Base: Children Figures show percentage of category
consumed by childrenFFP sample 2100 children
Period: 2003
% of occasions consumed by children
Source: TNS, Family Food Panel (FFP)
The �Big 6�
At the beginning of our enquiry, we focused on the �Big 5� heavily advertised food categories (confectionery, soft drinks, crisps and savoury snacks, pre-sugared breakfast cereals and fast food). However, as we learned more about children�s diets, it became clear that pre-prepared, convenience foods (the �Big 6th�) should also be taken into consideration.
As noted above, the expanding role of pre-prepared foods is one of the most striking trends in contemporary British food culture. Such foods themselves are typically high in fats and salt.
Moreover, as we shall see in the following section of the report (Section 3.2), consumption of pre-prepared, convenience foods are linked to lower consumption of healthy food options such as fruit and vegetables. In addition consumption of pre-prepared convenience foods is more marked in the diets of obese and overweight children than in the diets of children of normal weight (see Section 3.8).
133 �Sugar confectionery� includes all gum and confectionery that is not chocolate.
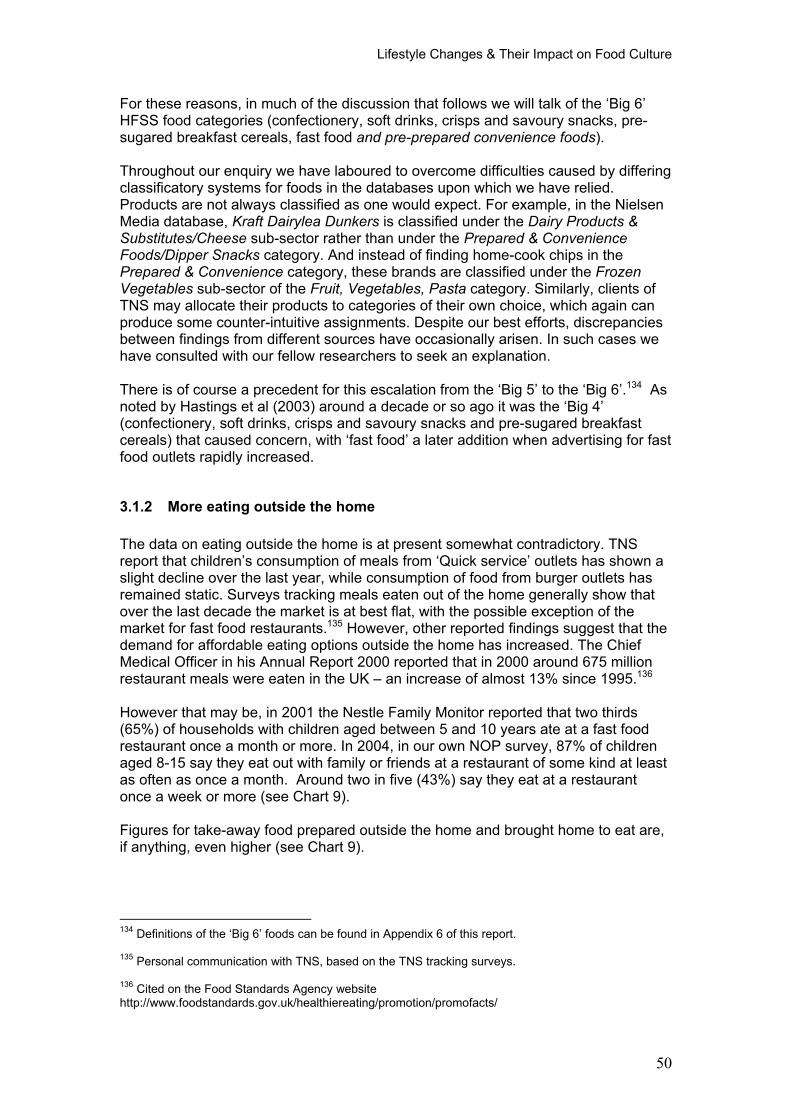
Lifestyle Changes & Their Impact on Food Culture
50
For these reasons, in much of the discussion that follows we will talk of the �Big 6� HFSS food categories (confectionery, soft drinks, crisps and savoury snacks, pre-sugared breakfast cereals, fast food and pre-prepared convenience foods).
Throughout our enquiry we have laboured to overcome difficulties caused by differing classificatory systems for foods in the databases upon which we have relied. Products are not always classified as one would expect. For example, in the Nielsen Media database, Kraft Dairylea Dunkers is classified under the Dairy Products & Substitutes/Cheese sub-sector rather than under the Prepared & Convenience Foods/Dipper Snacks category. And instead of finding home-cook chips in the Prepared & Convenience category, these brands are classified under the FrozenVegetables sub-sector of the Fruit, Vegetables, Pasta category. Similarly, clients of TNS may allocate their products to categories of their own choice, which again can produce some counter-intuitive assignments. Despite our best efforts, discrepancies between findings from different sources have occasionally arisen. In such cases we have consulted with our fellow researchers to seek an explanation.
There is of course a precedent for this escalation from the �Big 5� to the �Big 6�.134 As noted by Hastings et al (2003) around a decade or so ago it was the �Big 4� (confectionery, soft drinks, crisps and savoury snacks and pre-sugared breakfast cereals) that caused concern, with �fast food� a later addition when advertising for fast food outlets rapidly increased.
3.1.2 More eating outside the home
The data on eating outside the home is at present somewhat contradictory. TNS report that children�s consumption of meals from �Quick service� outlets has shown a slight decline over the last year, while consumption of food from burger outlets has remained static. Surveys tracking meals eaten out of the home generally show that over the last decade the market is at best flat, with the possible exception of the market for fast food restaurants.135 However, other reported findings suggest that the demand for affordable eating options outside the home has increased. The Chief Medical Officer in his Annual Report 2000 reported that in 2000 around 675 million restaurant meals were eaten in the UK � an increase of almost 13% since 1995.136
However that may be, in 2001 the Nestle Family Monitor reported that two thirds (65%) of households with children aged between 5 and 10 years ate at a fast food restaurant once a month or more. In 2004, in our own NOP survey, 87% of children aged 8-15 say they eat out with family or friends at a restaurant of some kind at least as often as once a month. Around two in five (43%) say they eat at a restaurant once a week or more (see Chart 9).
Figures for take-away food prepared outside the home and brought home to eat are, if anything, even higher (see Chart 9).
134 Definitions of the �Big 6� foods can be found in Appendix 6 of this report.
135 Personal communication with TNS, based on the TNS tracking surveys.
136 Cited on the Food Standards Agency website http://www.foodstandards.gov.uk/healthiereating/promotion/promofacts/
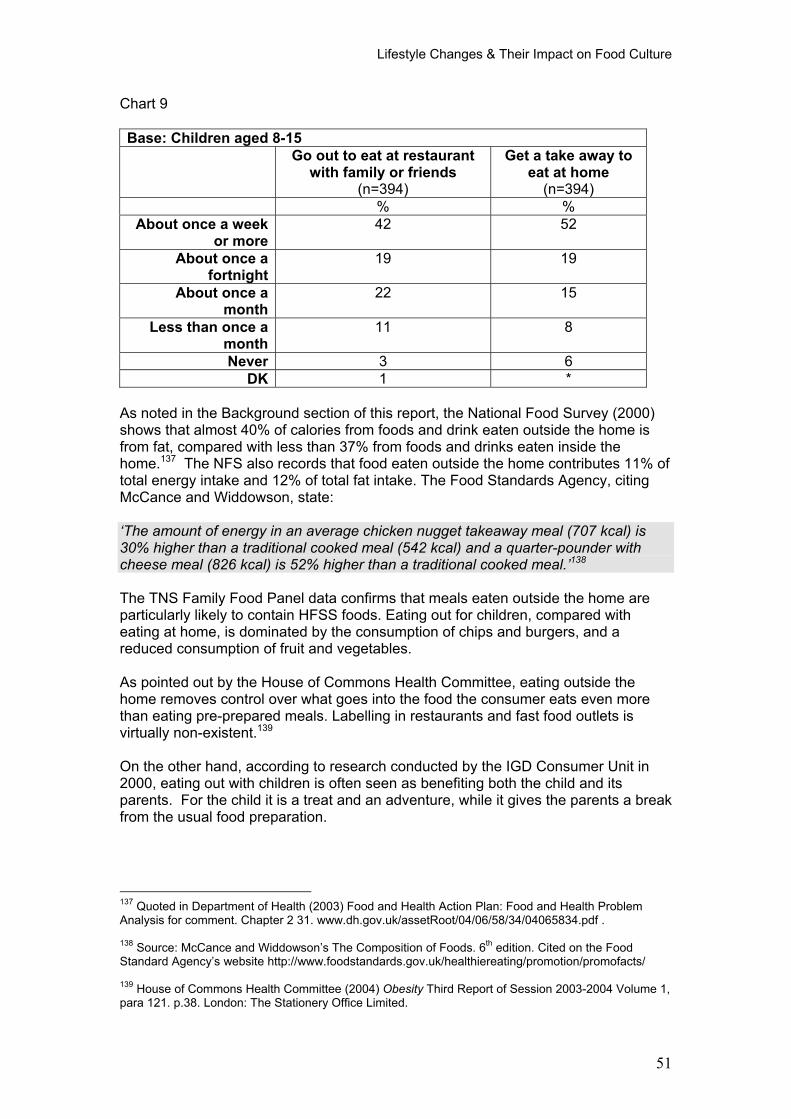
Lifestyle Changes & Their Impact on Food Culture
51
Chart 9
Base: Children aged 8-15 Go out to eat at restaurant
with family or friends (n=394)
Get a take away to eat at home
(n=394) % %
About once a week or more
42 52
About once a fortnight
19 19
About once a month
22 15
Less than once a month
11 8
Never 3 6 DK 1 *
As noted in the Background section of this report, the National Food Survey (2000) shows that almost 40% of calories from foods and drink eaten outside the home is from fat, compared with less than 37% from foods and drinks eaten inside the home.137 The NFS also records that food eaten outside the home contributes 11% of total energy intake and 12% of total fat intake. The Food Standards Agency, citing McCance and Widdowson, state:
�The amount of energy in an average chicken nugget takeaway meal (707 kcal) is 30% higher than a traditional cooked meal (542 kcal) and a quarter-pounder with cheese meal (826 kcal) is 52% higher than a traditional cooked meal.�138
The TNS Family Food Panel data confirms that meals eaten outside the home are particularly likely to contain HFSS foods. Eating out for children, compared with eating at home, is dominated by the consumption of chips and burgers, and a reduced consumption of fruit and vegetables.
As pointed out by the House of Commons Health Committee, eating outside the home removes control over what goes into the food the consumer eats even more than eating pre-prepared meals. Labelling in restaurants and fast food outlets is virtually non-existent.139
On the other hand, according to research conducted by the IGD Consumer Unit in 2000, eating out with children is often seen as benefiting both the child and its parents. For the child it is a treat and an adventure, while it gives the parents a break from the usual food preparation.
137 Quoted in Department of Health (2003) Food and Health Action Plan: Food and Health Problem Analysis for comment. Chapter 2 31. www.dh.gov.uk/assetRoot/04/06/58/34/04065834.pdf .
138 Source: McCance and Widdowson�s The Composition of Foods. 6th edition. Cited on the Food Standard Agency�s website http://www.foodstandards.gov.uk/healthiereating/promotion/promofacts/
139 House of Commons Health Committee (2004) Obesity Third Report of Session 2003-2004 Volume 1, para 121. p.38. London: The Stationery Office Limited.
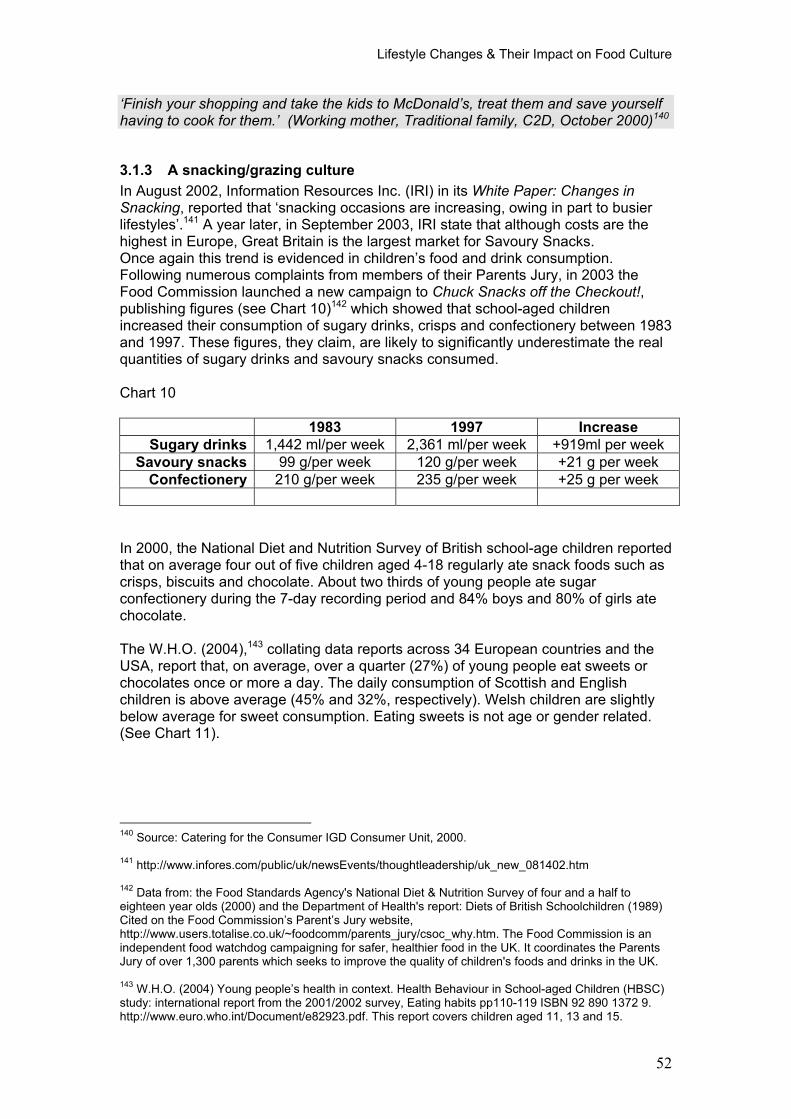
Lifestyle Changes & Their Impact on Food Culture
52
�Finish your shopping and take the kids to McDonald�s, treat them and save yourself having to cook for them.� (Working mother, Traditional family, C2D, October 2000)140
3.1.3 A snacking/grazing culture In August 2002, Information Resources Inc. (IRI) in its White Paper: Changes in Snacking, reported that �snacking occasions are increasing, owing in part to busier lifestyles�.141 A year later, in September 2003, IRI state that although costs are the highest in Europe, Great Britain is the largest market for Savoury Snacks. Once again this trend is evidenced in children�s food and drink consumption. Following numerous complaints from members of their Parents Jury, in 2003 the Food Commission launched a new campaign to Chuck Snacks off the Checkout!,publishing figures (see Chart 10)142 which showed that school-aged children increased their consumption of sugary drinks, crisps and confectionery between 1983 and 1997. These figures, they claim, are likely to significantly underestimate the real quantities of sugary drinks and savoury snacks consumed.
Chart 10
1983 1997 Increase Sugary drinks 1,442 ml/per week 2,361 ml/per week +919ml per week
Savoury snacks 99 g/per week 120 g/per week +21 g per week Confectionery 210 g/per week 235 g/per week +25 g per week
In 2000, the National Diet and Nutrition Survey of British school-age children reported that on average four out of five children aged 4-18 regularly ate snack foods such as crisps, biscuits and chocolate. About two thirds of young people ate sugar confectionery during the 7-day recording period and 84% boys and 80% of girls ate chocolate.
The W.H.O. (2004),143 collating data reports across 34 European countries and the USA, report that, on average, over a quarter (27%) of young people eat sweets or chocolates once or more a day. The daily consumption of Scottish and English children is above average (45% and 32%, respectively). Welsh children are slightly below average for sweet consumption. Eating sweets is not age or gender related. (See Chart 11).
140 Source: Catering for the Consumer IGD Consumer Unit, 2000.
141 http://www.infores.com/public/uk/newsEvents/thoughtleadership/uk_new_081402.htm
142 Data from: the Food Standards Agency's National Diet & Nutrition Survey of four and a half to eighteen year olds (2000) and the Department of Health's report: Diets of British Schoolchildren (1989) Cited on the Food Commission�s Parent�s Jury website, http://www.users.totalise.co.uk/~foodcomm/parents_jury/csoc_why.htm. The Food Commission is an independent food watchdog campaigning for safer, healthier food in the UK. It coordinates the Parents Jury of over 1,300 parents which seeks to improve the quality of children's foods and drinks in the UK.
143 W.H.O. (2004) Young people�s health in context. Health Behaviour in School-aged Children (HBSC) study: international report from the 2001/2002 survey, Eating habits pp110-119 ISBN 92 890 1372 9. http://www.euro.who.int/Document/e82923.pdf. This report covers children aged 11, 13 and 15.
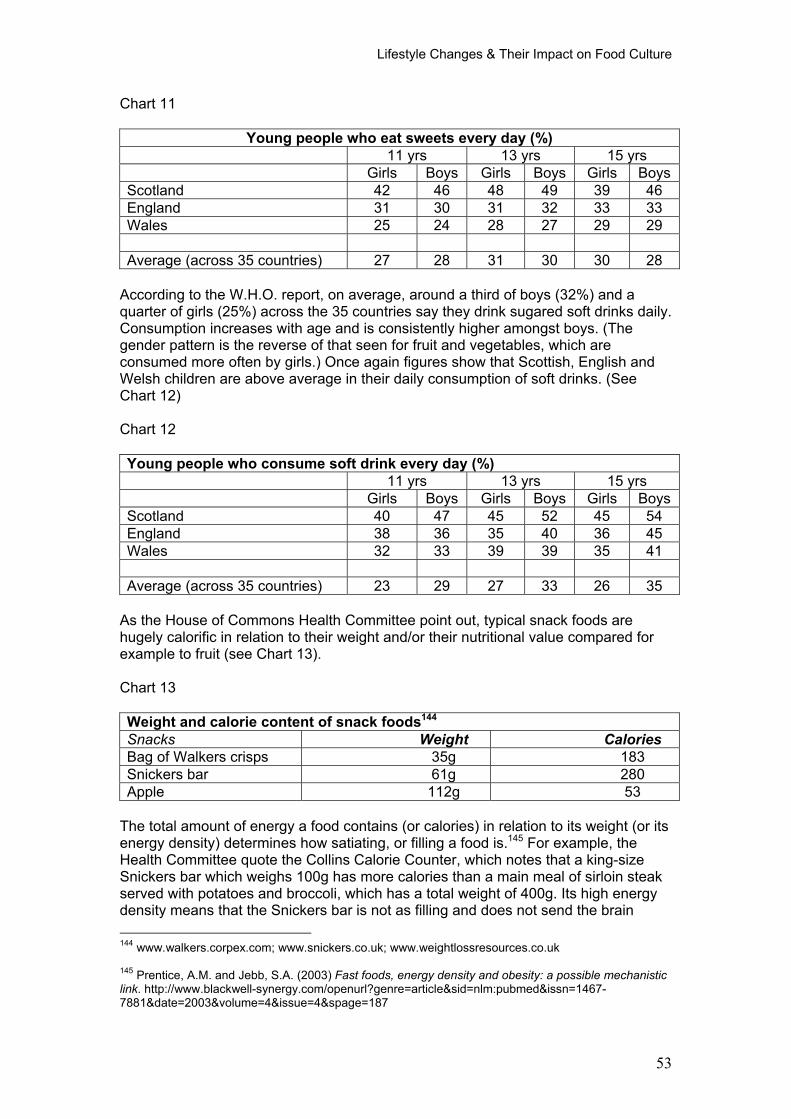
Lifestyle Changes & Their Impact on Food Culture
53
Chart 11
Young people who eat sweets every day (%) 11 yrs 13 yrs 15 yrs Girls Boys Girls Boys Girls Boys Scotland 42 46 48 49 39 46 England 31 30 31 32 33 33 Wales 25 24 28 27 29 29 Average (across 35 countries) 27 28 31 30 30 28
According to the W.H.O. report, on average, around a third of boys (32%) and a quarter of girls (25%) across the 35 countries say they drink sugared soft drinks daily. Consumption increases with age and is consistently higher amongst boys. (The gender pattern is the reverse of that seen for fruit and vegetables, which are consumed more often by girls.) Once again figures show that Scottish, English and Welsh children are above average in their daily consumption of soft drinks. (See Chart 12)
Chart 12
Young people who consume soft drink every day (%) 11 yrs 13 yrs 15 yrs Girls Boys Girls Boys Girls Boys Scotland 40 47 45 52 45 54 England 38 36 35 40 36 45 Wales 32 33 39 39 35 41 Average (across 35 countries) 23 29 27 33 26 35
As the House of Commons Health Committee point out, typical snack foods are hugely calorific in relation to their weight and/or their nutritional value compared for example to fruit (see Chart 13).
Chart 13
Weight and calorie content of snack foods144
Snacks Weight Calories Bag of Walkers crisps 35g 183 Snickers bar 61g 280 Apple 112g 53
The total amount of energy a food contains (or calories) in relation to its weight (or its energy density) determines how satiating, or filling a food is.145 For example, the Health Committee quote the Collins Calorie Counter, which notes that a king-size Snickers bar which weighs 100g has more calories than a main meal of sirloin steak served with potatoes and broccoli, which has a total weight of 400g. Its high energy density means that the Snickers bar is not as filling and does not send the brain
144 www.walkers.corpex.com; www.snickers.co.uk; www.weightlossresources.co.uk
145 Prentice, A.M. and Jebb, S.A. (2003) Fast foods, energy density and obesity: a possible mechanistic link. http://www.blackwell-synergy.com/openurl?genre=article&sid=nlm:pubmed&issn=1467-7881&date=2003&volume=4&issue=4&spage=187
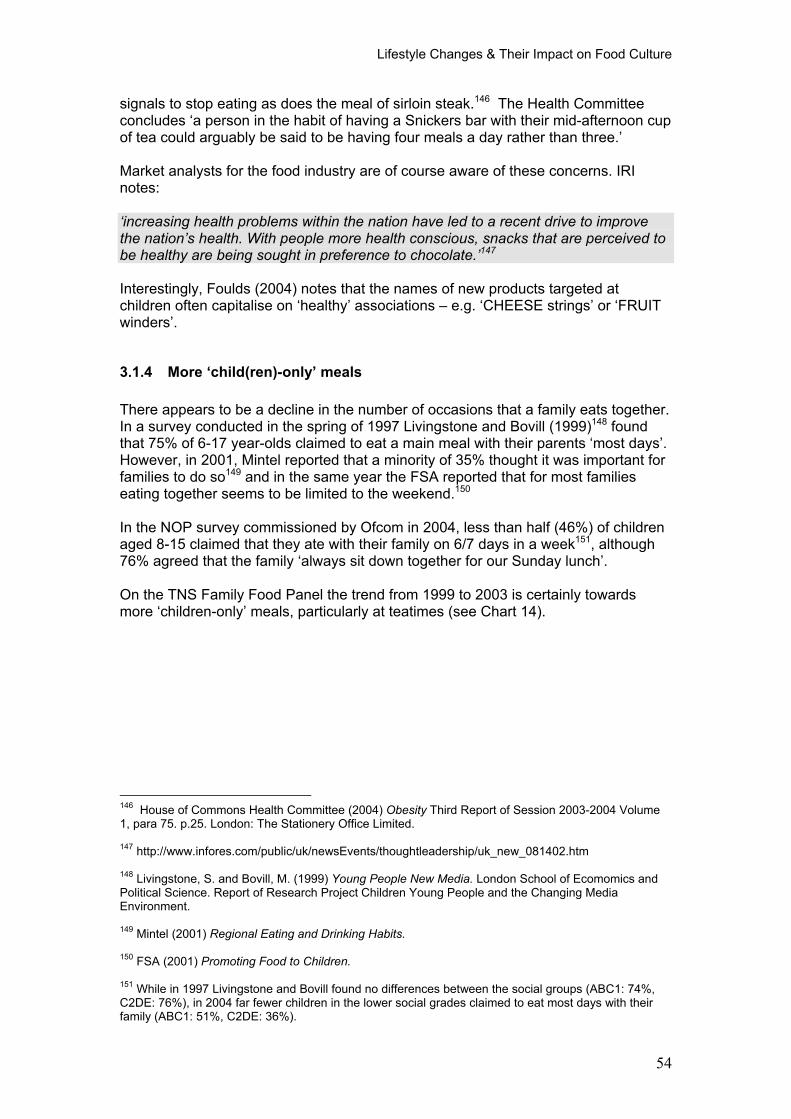
Lifestyle Changes & Their Impact on Food Culture
54
signals to stop eating as does the meal of sirloin steak.146 The Health Committee concludes �a person in the habit of having a Snickers bar with their mid-afternoon cup of tea could arguably be said to be having four meals a day rather than three.�
Market analysts for the food industry are of course aware of these concerns. IRI notes:
�increasing health problems within the nation have led to a recent drive to improve the nation�s health. With people more health conscious, snacks that are perceived to be healthy are being sought in preference to chocolate.�147
Interestingly, Foulds (2004) notes that the names of new products targeted at children often capitalise on �healthy� associations � e.g. �CHEESE strings� or �FRUIT winders�.
3.1.4 More �child(ren)-only� meals
There appears to be a decline in the number of occasions that a family eats together. In a survey conducted in the spring of 1997 Livingstone and Bovill (1999)148 found that 75% of 6-17 year-olds claimed to eat a main meal with their parents �most days�. However, in 2001, Mintel reported that a minority of 35% thought it was important for families to do so149 and in the same year the FSA reported that for most families eating together seems to be limited to the weekend.150
In the NOP survey commissioned by Ofcom in 2004, less than half (46%) of children aged 8-15 claimed that they ate with their family on 6/7 days in a week151, although 76% agreed that the family �always sit down together for our Sunday lunch�.
On the TNS Family Food Panel the trend from 1999 to 2003 is certainly towards more �children-only� meals, particularly at teatimes (see Chart 14).
146 House of Commons Health Committee (2004) Obesity Third Report of Session 2003-2004 Volume 1, para 75. p.25. London: The Stationery Office Limited.
147 http://www.infores.com/public/uk/newsEvents/thoughtleadership/uk_new_081402.htm
148 Livingstone, S. and Bovill, M. (1999) Young People New Media. London School of Ecomomics and Political Science. Report of Research Project Children Young People and the Changing Media Environment.
149 Mintel (2001) Regional Eating and Drinking Habits.
150 FSA (2001) Promoting Food to Children.
151 While in 1997 Livingstone and Bovill found no differences between the social groups (ABC1: 74%, C2DE: 76%), in 2004 far fewer children in the lower social grades claimed to eat most days with their family (ABC1: 51%, C2DE: 36%).
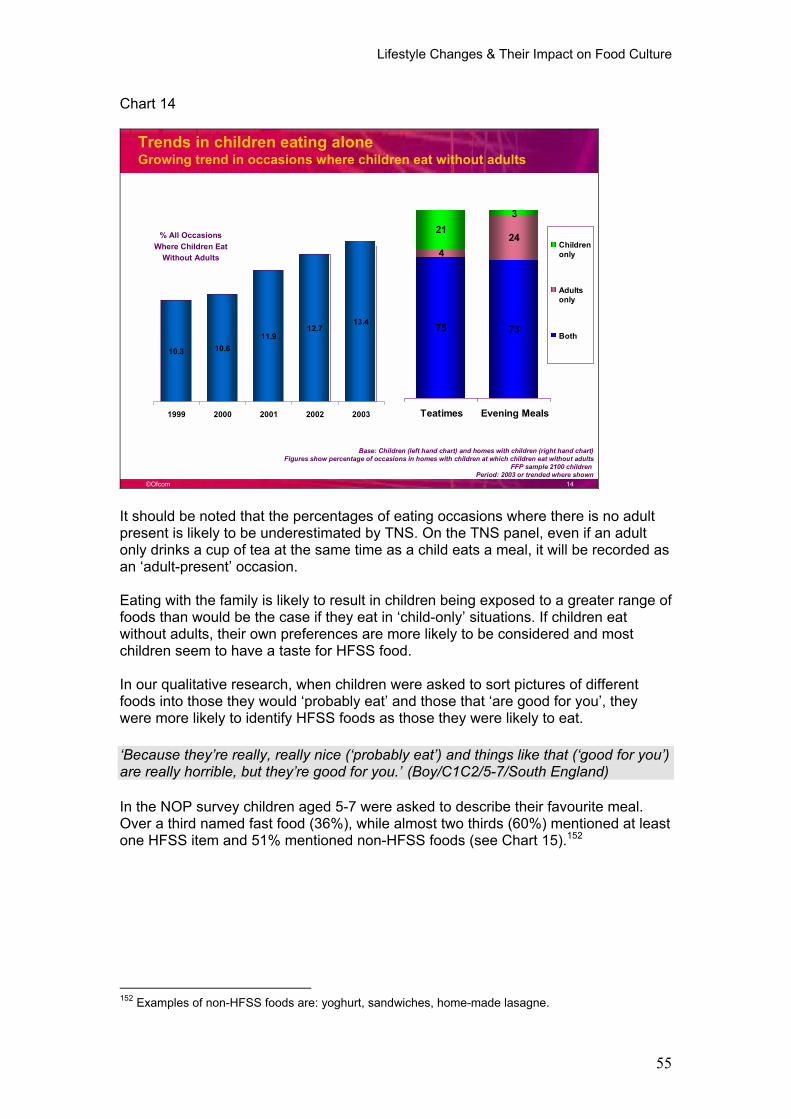
Lifestyle Changes & Their Impact on Food Culture
55
Chart 14
©Ofcom 14
10.3 10.611.9
12.713.4
1999 2000 2001 2002 2003
Trends in children eating aloneGrowing trend in occasions where children eat without adults
% All Occasions Where Children Eat
Without Adults
75 73
424
213
Teatimes Evening Meals
Childrenonly
Adultsonly
Both
Base: Children (left hand chart) and homes with children (right hand chart)Figures show percentage of occasions in homes with children at which children eat without adults
FFP sample 2100 children Period: 2003 or trended where shown
It should be noted that the percentages of eating occasions where there is no adult present is likely to be underestimated by TNS. On the TNS panel, even if an adult only drinks a cup of tea at the same time as a child eats a meal, it will be recorded as an �adult-present� occasion.
Eating with the family is likely to result in children being exposed to a greater range of foods than would be the case if they eat in �child-only� situations. If children eat without adults, their own preferences are more likely to be considered and most children seem to have a taste for HFSS food.
In our qualitative research, when children were asked to sort pictures of different foods into those they would �probably eat� and those that �are good for you�, they were more likely to identify HFSS foods as those they were likely to eat.
�Because they�re really, really nice (�probably eat�) and things like that (�good for you�) are really horrible, but they�re good for you.� (Boy/C1C2/5-7/South England)
In the NOP survey children aged 5-7 were asked to describe their favourite meal. Over a third named fast food (36%), while almost two thirds (60%) mentioned at least one HFSS item and 51% mentioned non-HFSS foods (see Chart 15).152
152 Examples of non-HFSS foods are: yoghurt, sandwiches, home-made lasagne.
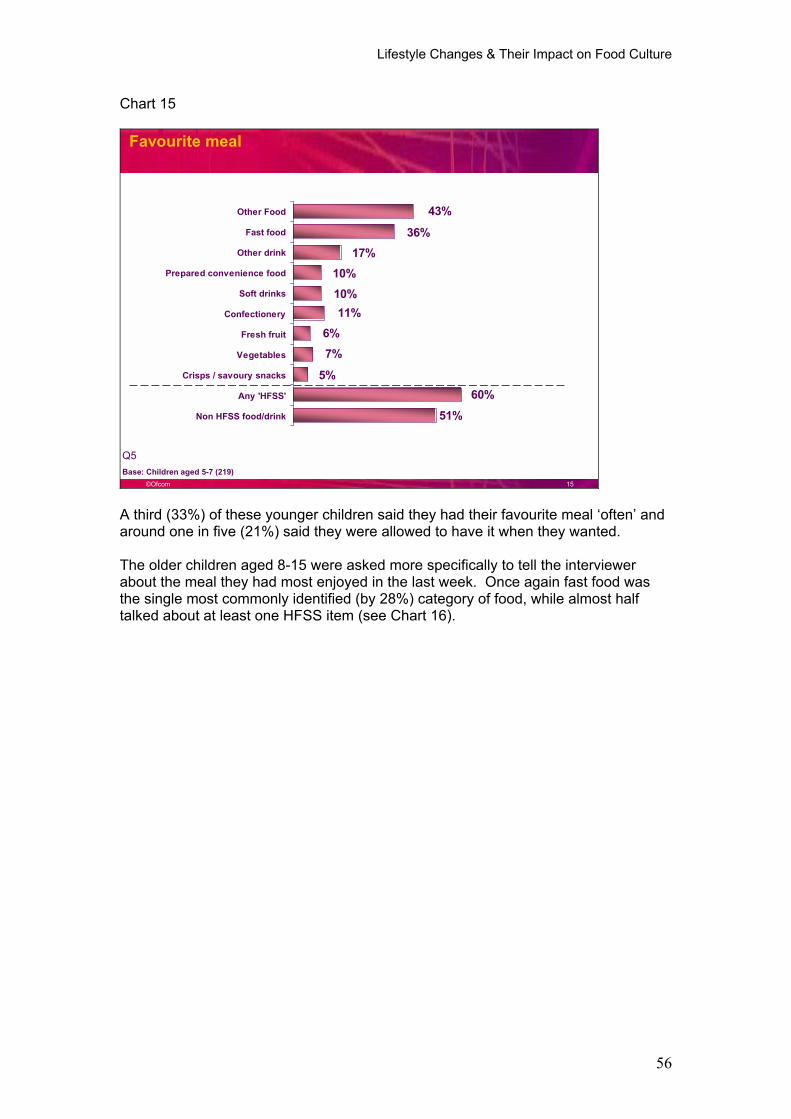
Lifestyle Changes & Their Impact on Food Culture
56
Chart 15
©Ofcom 15
51%
43%
36%17%
10%10%11%
6%7%
5%60%
Other Food
Fast food
Other drink
Prepared convenience food
Soft drinks
Confectionery
Fresh fruit
Vegetables
Crisps / savoury snacks
Any 'HFSS'
Non HFSS food/drink
Favourite meal
Q5Base: Children aged 5-7 (219)
A third (33%) of these younger children said they had their favourite meal �often� and around one in five (21%) said they were allowed to have it when they wanted.
The older children aged 8-15 were asked more specifically to tell the interviewer about the meal they had most enjoyed in the last week. Once again fast food was the single most commonly identified (by 28%) category of food, while almost half talked about at least one HFSS item (see Chart 16).
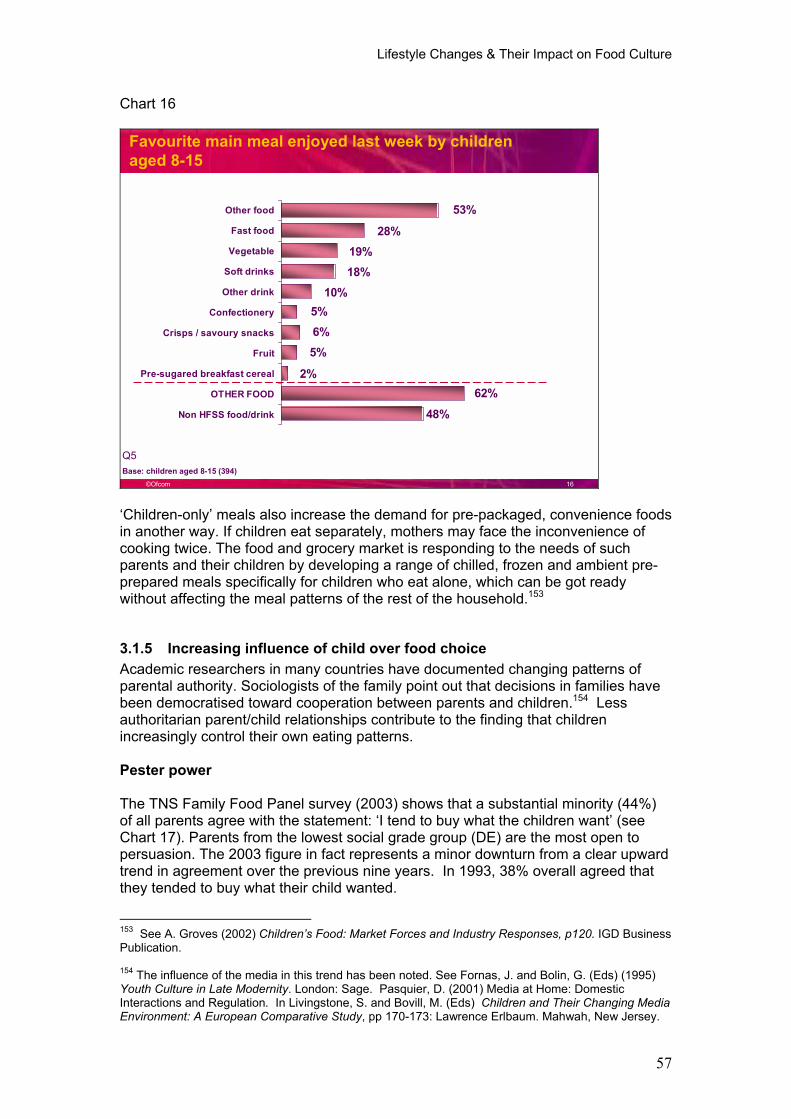
Lifestyle Changes & Their Impact on Food Culture
57
Chart 16
©Ofcom 16
48%
62%2%
5%6%5%
10%18%19%
28%
53%Other food
Fast food
Vegetable
Soft drinks
Other drink
Confectionery
Crisps / savoury snacks
Fruit
Pre-sugared breakfast cereal
OTHER FOOD
Non HFSS food/drink
Favourite main meal enjoyed last week by children aged 8-15
Base: children aged 8-15 (394)
Q5
�Children-only� meals also increase the demand for pre-packaged, convenience foods in another way. If children eat separately, mothers may face the inconvenience of cooking twice. The food and grocery market is responding to the needs of such parents and their children by developing a range of chilled, frozen and ambient pre-prepared meals specifically for children who eat alone, which can be got ready without affecting the meal patterns of the rest of the household.153
3.1.5 Increasing influence of child over food choice Academic researchers in many countries have documented changing patterns of parental authority. Sociologists of the family point out that decisions in families have been democratised toward cooperation between parents and children.154 Less authoritarian parent/child relationships contribute to the finding that children increasingly control their own eating patterns.
Pester power
The TNS Family Food Panel survey (2003) shows that a substantial minority (44%) of all parents agree with the statement: �I tend to buy what the children want� (see Chart 17). Parents from the lowest social grade group (DE) are the most open to persuasion. The 2003 figure in fact represents a minor downturn from a clear upward trend in agreement over the previous nine years. In 1993, 38% overall agreed that they tended to buy what their child wanted.
153 See A. Groves (2002) Children�s Food: Market Forces and Industry Responses, p120. IGD Business Publication.
154 The influence of the media in this trend has been noted. See Fornas, J. and Bolin, G. (Eds) (1995) Youth Culture in Late Modernity. London: Sage. Pasquier, D. (2001) Media at Home: Domestic Interactions and Regulation. In Livingstone, S. and Bovill, M. (Eds) Children and Their Changing Media Environment: A European Comparative Study, pp 170-173: Lawrence Erlbaum. Mahwah, New Jersey.
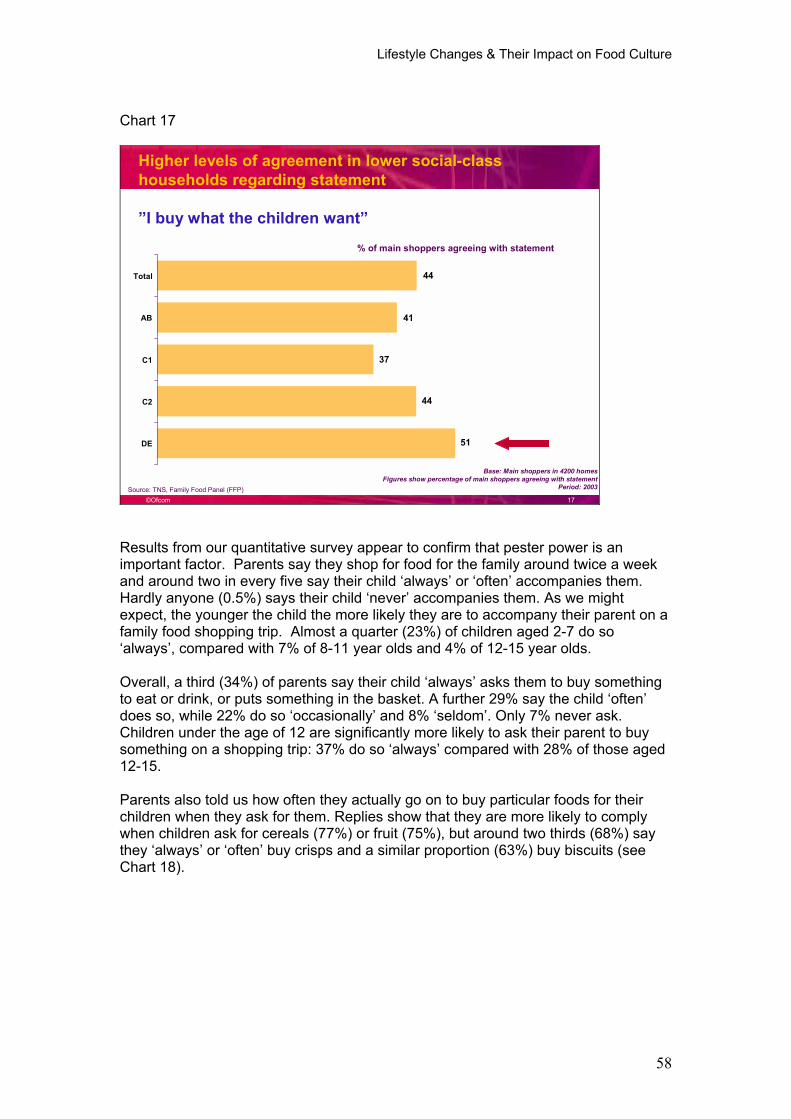
Lifestyle Changes & Their Impact on Food Culture
58
Chart 17
©Ofcom 17
Higher levels of agreement in lower social-class households regarding statement
�I buy what the children want�
% of main shoppers agreeing with statement
Base: Main shoppers in 4200 homesFigures show percentage of main shoppers agreeing with statement
Period: 2003
44
41
44
37
Total
AB
C1
C2
DE
Source: TNS, Family Food Panel (FFP)
51
Results from our quantitative survey appear to confirm that pester power is an important factor. Parents say they shop for food for the family around twice a week and around two in every five say their child �always� or �often� accompanies them. Hardly anyone (0.5%) says their child �never� accompanies them. As we might expect, the younger the child the more likely they are to accompany their parent on a family food shopping trip. Almost a quarter (23%) of children aged 2-7 do so �always�, compared with 7% of 8-11 year olds and 4% of 12-15 year olds.
Overall, a third (34%) of parents say their child �always� asks them to buy something to eat or drink, or puts something in the basket. A further 29% say the child �often� does so, while 22% do so �occasionally� and 8% �seldom�. Only 7% never ask. Children under the age of 12 are significantly more likely to ask their parent to buy something on a shopping trip: 37% do so �always� compared with 28% of those aged 12-15.
Parents also told us how often they actually go on to buy particular foods for their children when they ask for them. Replies show that they are more likely to comply when children ask for cereals (77%) or fruit (75%), but around two thirds (68%) say they �always� or �often� buy crisps and a similar proportion (63%) buy biscuits (see Chart 18).
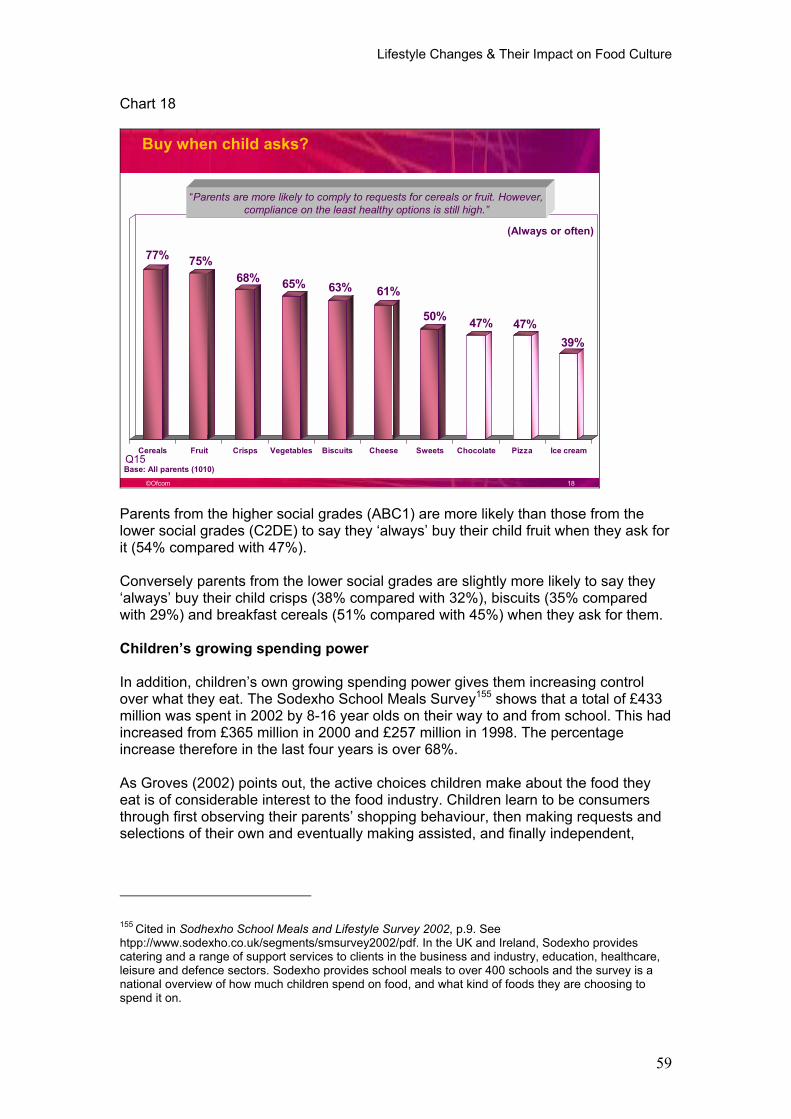
Lifestyle Changes & Their Impact on Food Culture
59
Chart 18
©Ofcom 18
Buy when child asks?
(Always or often)
77% 75%68% 65% 63% 61%
50% 47% 47%39%
Cereals Fruit Crisps Vegetables Biscuits Cheese Sweets Chocolate Pizza Ice cream
�Parents are more likely to comply to requests for cereals or fruit. However, compliance on the least healthy options is still high.�
Base: All parents (1010)Q15
Parents from the higher social grades (ABC1) are more likely than those from the lower social grades (C2DE) to say they �always� buy their child fruit when they ask for it (54% compared with 47%).
Conversely parents from the lower social grades are slightly more likely to say they �always� buy their child crisps (38% compared with 32%), biscuits (35% compared with 29%) and breakfast cereals (51% compared with 45%) when they ask for them.
Children�s growing spending power
In addition, children�s own growing spending power gives them increasing control over what they eat. The Sodexho School Meals Survey155 shows that a total of £433 million was spent in 2002 by 8-16 year olds on their way to and from school. This had increased from £365 million in 2000 and £257 million in 1998. The percentage increase therefore in the last four years is over 68%.
As Groves (2002) points out, the active choices children make about the food they eat is of considerable interest to the food industry. Children learn to be consumers through first observing their parents� shopping behaviour, then making requests and selections of their own and eventually making assisted, and finally independent,
155 Cited in Sodhexho School Meals and Lifestyle Survey 2002, p.9. See htpp://www.sodexho.co.uk/segments/smsurvey2002/pdf. In the UK and Ireland, Sodexho provides catering and a range of support services to clients in the business and industry, education, healthcare, leisure and defence sectors. Sodexho provides school meals to over 400 schools and the survey is a national overview of how much children spend on food, and what kind of foods they are choosing to spend it on.
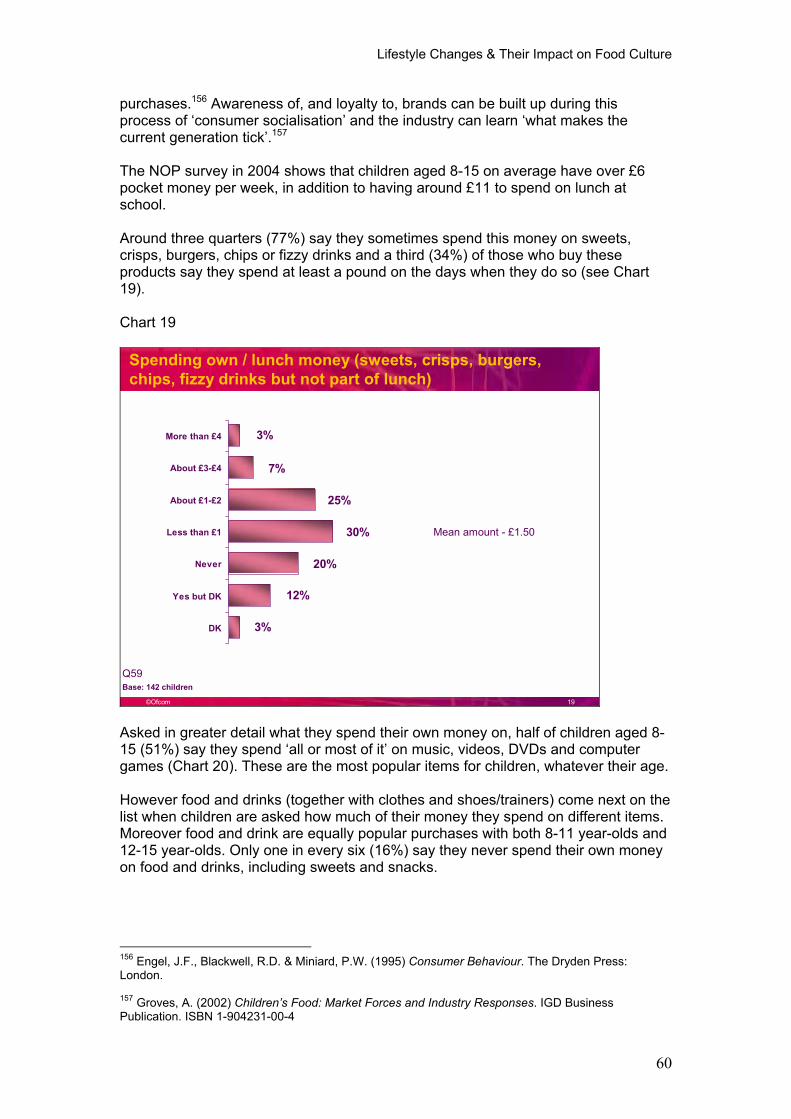
Lifestyle Changes & Their Impact on Food Culture
60
purchases.156 Awareness of, and loyalty to, brands can be built up during this process of �consumer socialisation� and the industry can learn �what makes the current generation tick�.157
The NOP survey in 2004 shows that children aged 8-15 on average have over £6 pocket money per week, in addition to having around £11 to spend on lunch at school.
Around three quarters (77%) say they sometimes spend this money on sweets, crisps, burgers, chips or fizzy drinks and a third (34%) of those who buy these products say they spend at least a pound on the days when they do so (see Chart 19).
Chart 19
©Ofcom 19
3%
12%
20%
30%
25%
7%
3%More than £4
About £3-£4
About £1-£2
Less than £1
Never
Yes but DK
DK
Spending own / lunch money (sweets, crisps, burgers, chips, fizzy drinks but not part of lunch)
Base: 142 children
Mean amount - £1.50
Q59
Asked in greater detail what they spend their own money on, half of children aged 8-15 (51%) say they spend �all or most of it� on music, videos, DVDs and computer games (Chart 20). These are the most popular items for children, whatever their age.
However food and drinks (together with clothes and shoes/trainers) come next on the list when children are asked how much of their money they spend on different items. Moreover food and drink are equally popular purchases with both 8-11 year-olds and 12-15 year-olds. Only one in every six (16%) say they never spend their own money on food and drinks, including sweets and snacks.
156 Engel, J.F., Blackwell, R.D. & Miniard, P.W. (1995) Consumer Behaviour. The Dryden Press: London.
157 Groves, A. (2002) Children�s Food: Market Forces and Industry Responses. IGD Business Publication. ISBN 1-904231-00-4
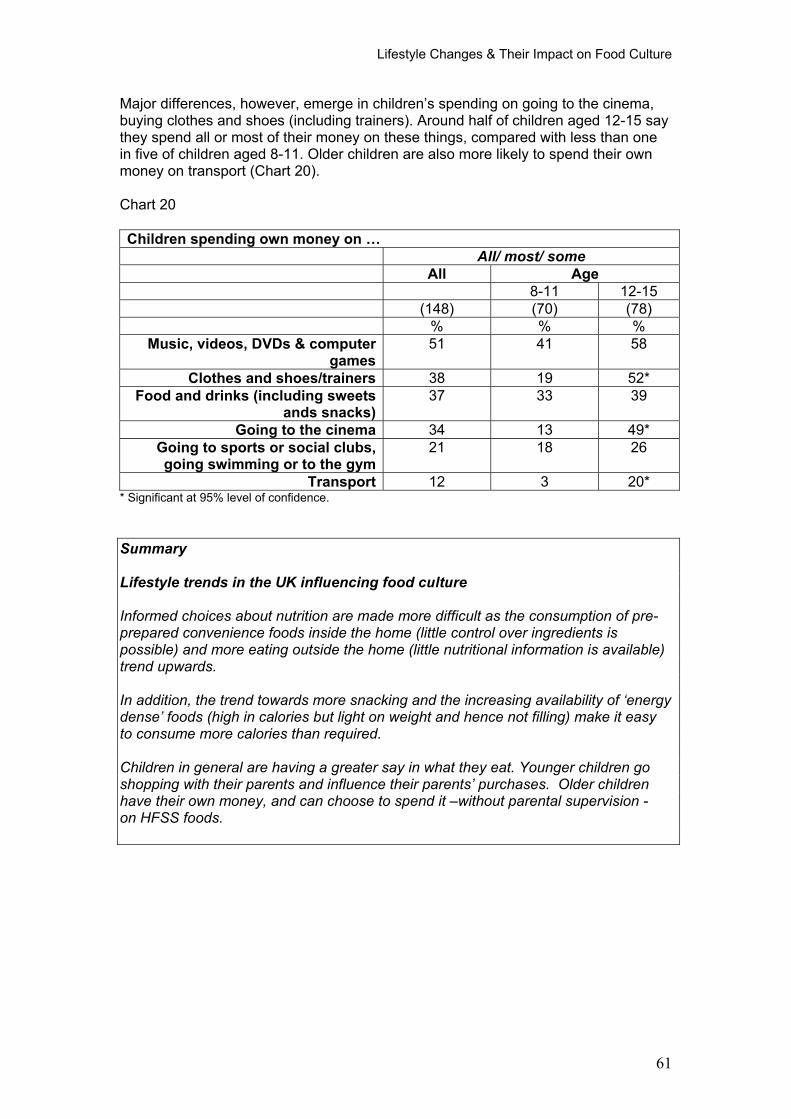
Lifestyle Changes & Their Impact on Food Culture
61
Major differences, however, emerge in children�s spending on going to the cinema, buying clothes and shoes (including trainers). Around half of children aged 12-15 say they spend all or most of their money on these things, compared with less than one in five of children aged 8-11. Older children are also more likely to spend their own money on transport (Chart 20).
Chart 20
Children spending own money on � All/ most/ some
All Age 8-11 12-15 (148) (70) (78) % % %
Music, videos, DVDs & computer games
51 41 58
Clothes and shoes/trainers 38 19 52* Food and drinks (including sweets
ands snacks)37 33 39
Going to the cinema 34 13 49* Going to sports or social clubs, going swimming or to the gym
21 18 26
Transport 12 3 20* * Significant at 95% level of confidence.
Summary
Lifestyle trends in the UK influencing food culture
Informed choices about nutrition are made more difficult as the consumption of pre-prepared convenience foods inside the home (little control over ingredients is possible) and more eating outside the home (little nutritional information is available) trend upwards.
In addition, the trend towards more snacking and the increasing availability of �energy dense� foods (high in calories but light on weight and hence not filling) make it easy to consume more calories than required.
Children in general are having a greater say in what they eat. Younger children go shopping with their parents and influence their parents� purchases. Older children have their own money, and can choose to spend it �without parental supervision - on HFSS foods.
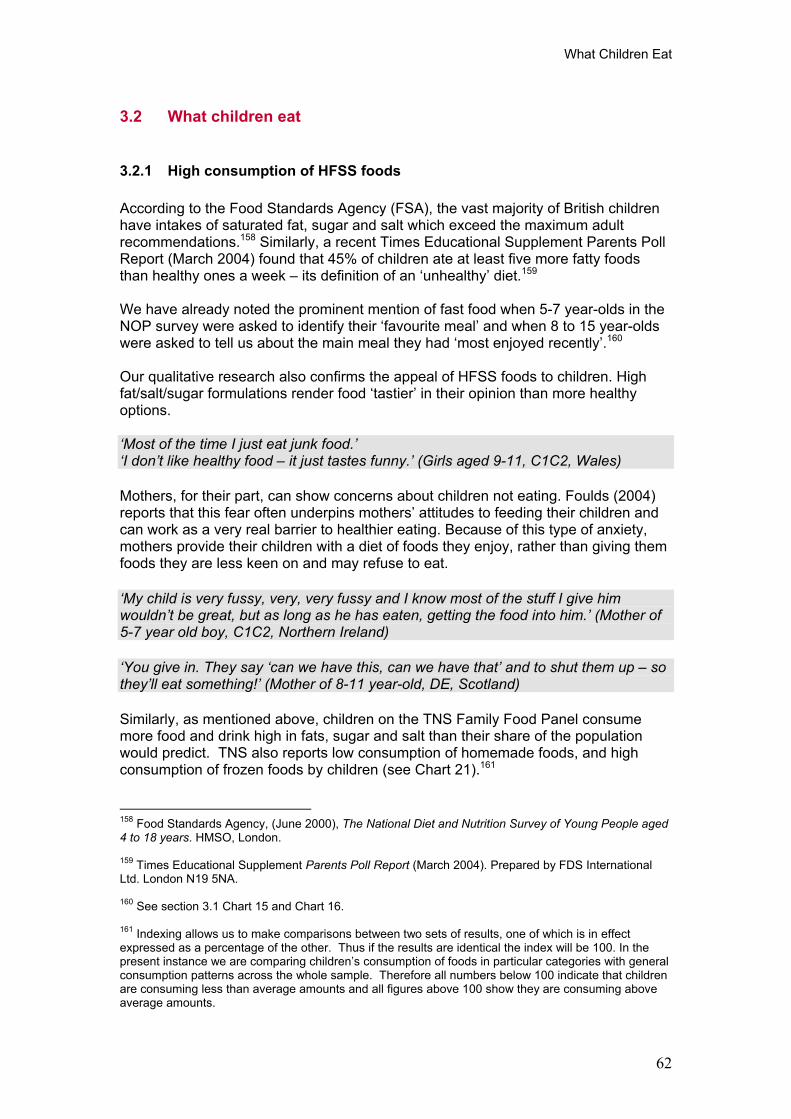
What Children Eat
62
3.2 What children eat
3.2.1 High consumption of HFSS foods
According to the Food Standards Agency (FSA), the vast majority of British children have intakes of saturated fat, sugar and salt which exceed the maximum adult recommendations.158 Similarly, a recent Times Educational Supplement Parents Poll Report (March 2004) found that 45% of children ate at least five more fatty foods than healthy ones a week � its definition of an �unhealthy� diet.159
We have already noted the prominent mention of fast food when 5-7 year-olds in the NOP survey were asked to identify their �favourite meal� and when 8 to 15 year-olds were asked to tell us about the main meal they had �most enjoyed recently�.160
Our qualitative research also confirms the appeal of HFSS foods to children. High fat/salt/sugar formulations render food �tastier� in their opinion than more healthy options.
�Most of the time I just eat junk food.� �I don�t like healthy food � it just tastes funny.� (Girls aged 9-11, C1C2, Wales)
Mothers, for their part, can show concerns about children not eating. Foulds (2004) reports that this fear often underpins mothers� attitudes to feeding their children and can work as a very real barrier to healthier eating. Because of this type of anxiety, mothers provide their children with a diet of foods they enjoy, rather than giving them foods they are less keen on and may refuse to eat.
�My child is very fussy, very, very fussy and I know most of the stuff I give him wouldn�t be great, but as long as he has eaten, getting the food into him.� (Mother of 5-7 year old boy, C1C2, Northern Ireland)
�You give in. They say �can we have this, can we have that� and to shut them up � so they�ll eat something!� (Mother of 8-11 year-old, DE, Scotland)
Similarly, as mentioned above, children on the TNS Family Food Panel consume more food and drink high in fats, sugar and salt than their share of the population would predict. TNS also reports low consumption of homemade foods, and high consumption of frozen foods by children (see Chart 21).161
158 Food Standards Agency, (June 2000), The National Diet and Nutrition Survey of Young People aged 4 to 18 years. HMSO, London.
159 Times Educational Supplement Parents Poll Report (March 2004). Prepared by FDS International Ltd. London N19 5NA.
160 See section 3.1 Chart 15 and Chart 16.
161 Indexing allows us to make comparisons between two sets of results, one of which is in effect expressed as a percentage of the other. Thus if the results are identical the index will be 100. In the present instance we are comparing children�s consumption of foods in particular categories with general consumption patterns across the whole sample. Therefore all numbers below 100 indicate that children are consuming less than average amounts and all figures above 100 show they are consuming above average amounts.
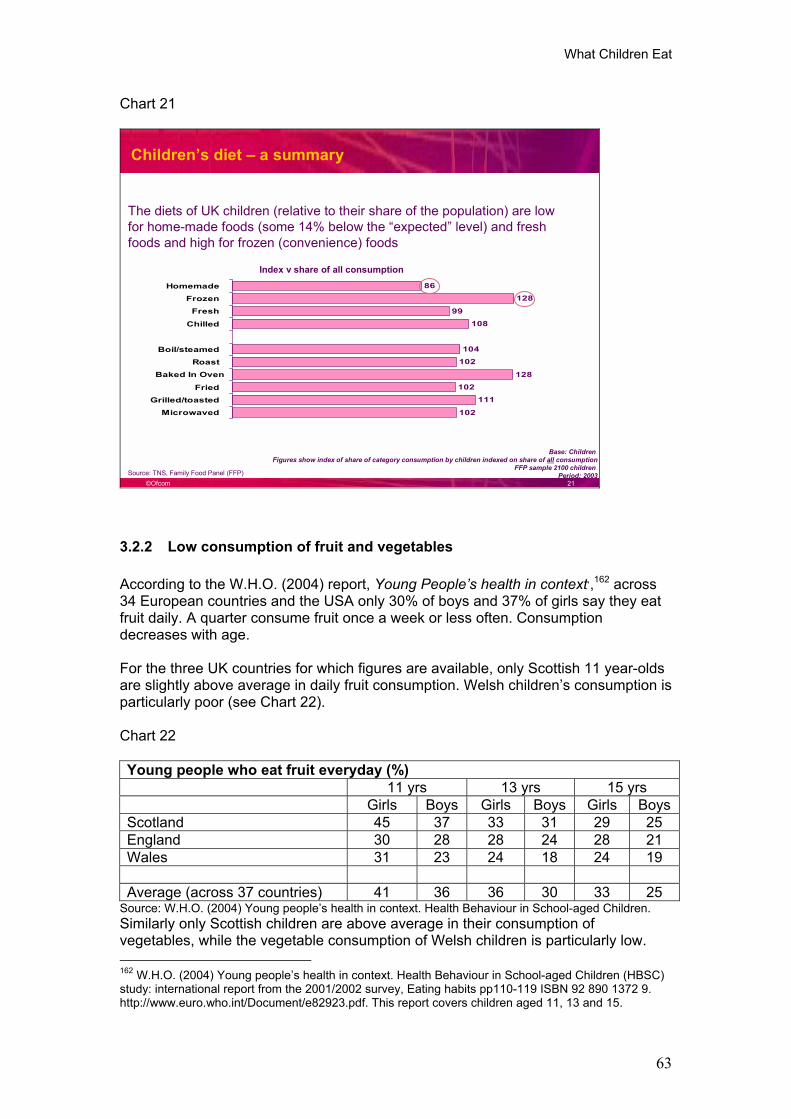
What Children Eat
63
Chart 21
©Ofcom 21
Children�s diet � a summary
Base: Children Figures show index of share of category consumption by children indexed on share of all consumption
FFP sample 2100 children Period: 2003
86
128
99
108
104
102
128
102
111
102
Homemade
Frozen
Fresh
Chilled
Boil/steamed
Roast
Baked In Oven
Fried
Grilled/toasted
Microwaved
Index v share of all consumption
Source: TNS, Family Food Panel (FFP)
The diets of UK children (relative to their share of the population) are low for home-made foods (some 14% below the �expected� level) and fresh foods and high for frozen (convenience) foods
3.2.2 Low consumption of fruit and vegetables
According to the W.H.O. (2004) report, Young People�s health in context,,162 across 34 European countries and the USA only 30% of boys and 37% of girls say they eat fruit daily. A quarter consume fruit once a week or less often. Consumption decreases with age.
For the three UK countries for which figures are available, only Scottish 11 year-olds are slightly above average in daily fruit consumption. Welsh children�s consumption is particularly poor (see Chart 22).
Chart 22
Young people who eat fruit everyday (%) 11 yrs 13 yrs 15 yrs Girls Boys Girls Boys Girls Boys Scotland 45 37 33 31 29 25 England 30 28 28 24 28 21 Wales 31 23 24 18 24 19 Average (across 37 countries) 41 36 36 30 33 25
Source: W.H.O. (2004) Young people�s health in context. Health Behaviour in School-aged Children. Similarly only Scottish children are above average in their consumption of vegetables, while the vegetable consumption of Welsh children is particularly low.
162 W.H.O. (2004) Young people�s health in context. Health Behaviour in School-aged Children (HBSC) study: international report from the 2001/2002 survey, Eating habits pp110-119 ISBN 92 890 1372 9. http://www.euro.who.int/Document/e82923.pdf. This report covers children aged 11, 13 and 15.
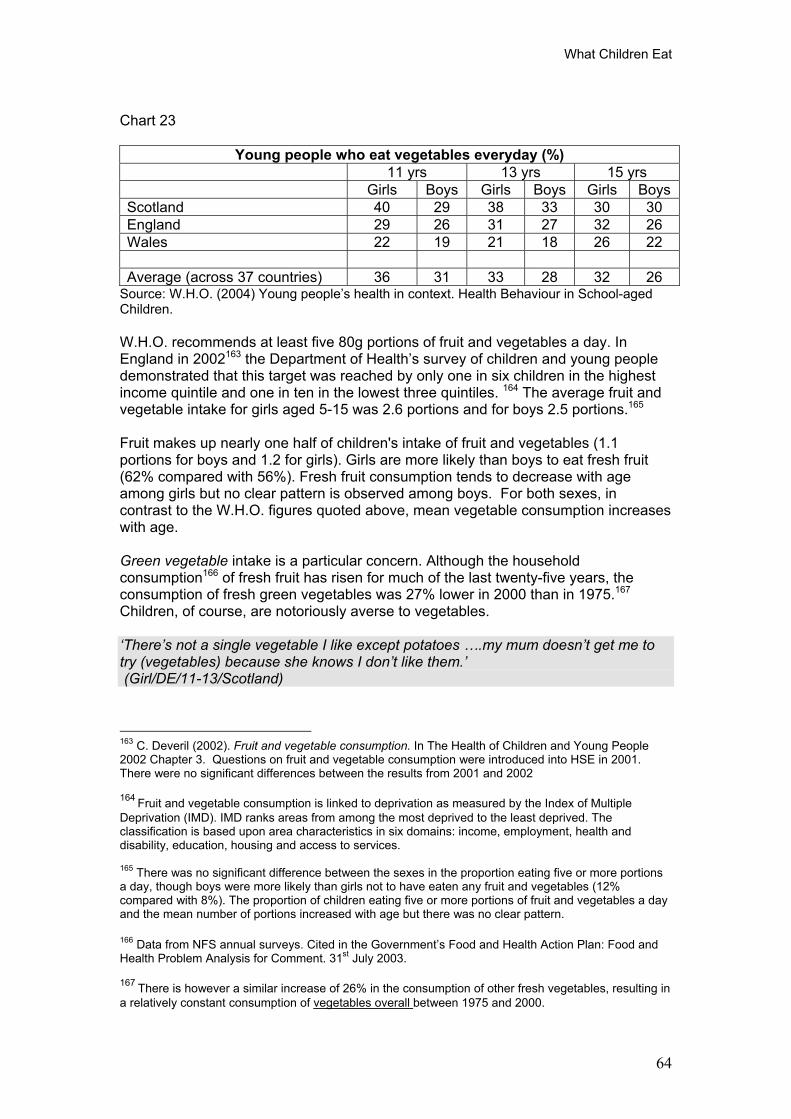
What Children Eat
64
Chart 23
Young people who eat vegetables everyday (%) 11 yrs 13 yrs 15 yrs Girls Boys Girls Boys Girls Boys Scotland 40 29 38 33 30 30 England 29 26 31 27 32 26 Wales 22 19 21 18 26 22 Average (across 37 countries) 36 31 33 28 32 26
Source: W.H.O. (2004) Young people�s health in context. Health Behaviour in School-aged Children.
W.H.O. recommends at least five 80g portions of fruit and vegetables a day. In England in 2002163 the Department of Health�s survey of children and young people demonstrated that this target was reached by only one in six children in the highest income quintile and one in ten in the lowest three quintiles. 164 The average fruit and vegetable intake for girls aged 5-15 was 2.6 portions and for boys 2.5 portions.165
Fruit makes up nearly one half of children's intake of fruit and vegetables (1.1 portions for boys and 1.2 for girls). Girls are more likely than boys to eat fresh fruit (62% compared with 56%). Fresh fruit consumption tends to decrease with age among girls but no clear pattern is observed among boys. For both sexes, in contrast to the W.H.O. figures quoted above, mean vegetable consumption increases with age.
Green vegetable intake is a particular concern. Although the household consumption166 of fresh fruit has risen for much of the last twenty-five years, the consumption of fresh green vegetables was 27% lower in 2000 than in 1975.167
Children, of course, are notoriously averse to vegetables.
�There�s not a single vegetable I like except potatoes �.my mum doesn�t get me to try (vegetables) because she knows I don�t like them.� (Girl/DE/11-13/Scotland)
163 C. Deveril (2002). Fruit and vegetable consumption. In The Health of Children and Young People 2002 Chapter 3. Questions on fruit and vegetable consumption were introduced into HSE in 2001. There were no significant differences between the results from 2001 and 2002
164 Fruit and vegetable consumption is linked to deprivation as measured by the Index of Multiple Deprivation (IMD). IMD ranks areas from among the most deprived to the least deprived. The classification is based upon area characteristics in six domains: income, employment, health and disability, education, housing and access to services.
165 There was no significant difference between the sexes in the proportion eating five or more portions a day, though boys were more likely than girls not to have eaten any fruit and vegetables (12% compared with 8%). The proportion of children eating five or more portions of fruit and vegetables a day and the mean number of portions increased with age but there was no clear pattern.
166 Data from NFS annual surveys. Cited in the Government�s Food and Health Action Plan: Food and Health Problem Analysis for Comment. 31st July 2003.
167 There is however a similar increase of 26% in the consumption of other fresh vegetables, resulting in a relatively constant consumption of vegetables overall between 1975 and 2000.
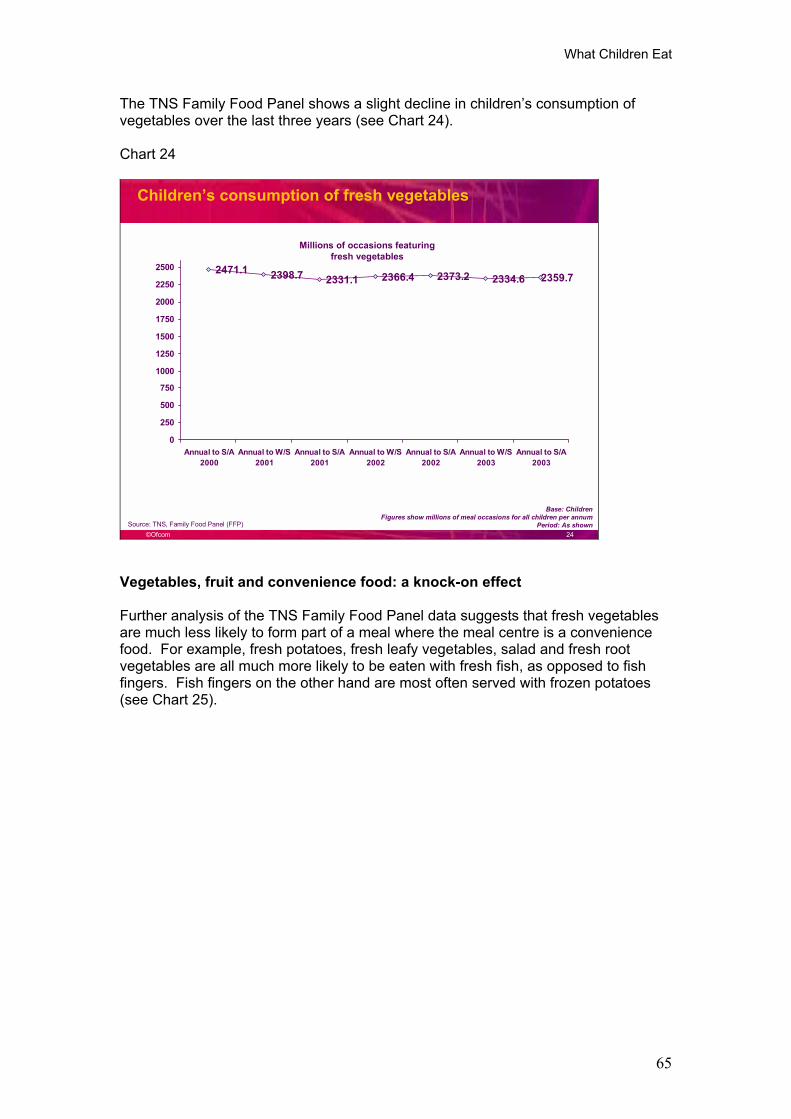
What Children Eat
65
The TNS Family Food Panel shows a slight decline in children�s consumption of vegetables over the last three years (see Chart 24).
Chart 24
©Ofcom 24
2471.1 2398.7 2331.1 2366.4 2373.2 2334.6 2359.7
0
250
500
750
1000
1250
1500
1750
2000
2250
2500
Annual to S/A2000
Annual to W/S2001
Annual to S/A2001
Annual to W/S2002
Annual to S/A2002
Annual to W/S2003
Annual to S/A2003
Children�s consumption of fresh vegetables
Base: ChildrenFigures show millions of meal occasions for all children per annum
Period: As shown
Millions of occasions featuring fresh vegetables
Source: TNS, Family Food Panel (FFP)
Vegetables, fruit and convenience food: a knock-on effect
Further analysis of the TNS Family Food Panel data suggests that fresh vegetables are much less likely to form part of a meal where the meal centre is a convenience food. For example, fresh potatoes, fresh leafy vegetables, salad and fresh root vegetables are all much more likely to be eaten with fresh fish, as opposed to fish fingers. Fish fingers on the other hand are most often served with frozen potatoes (see Chart 25).
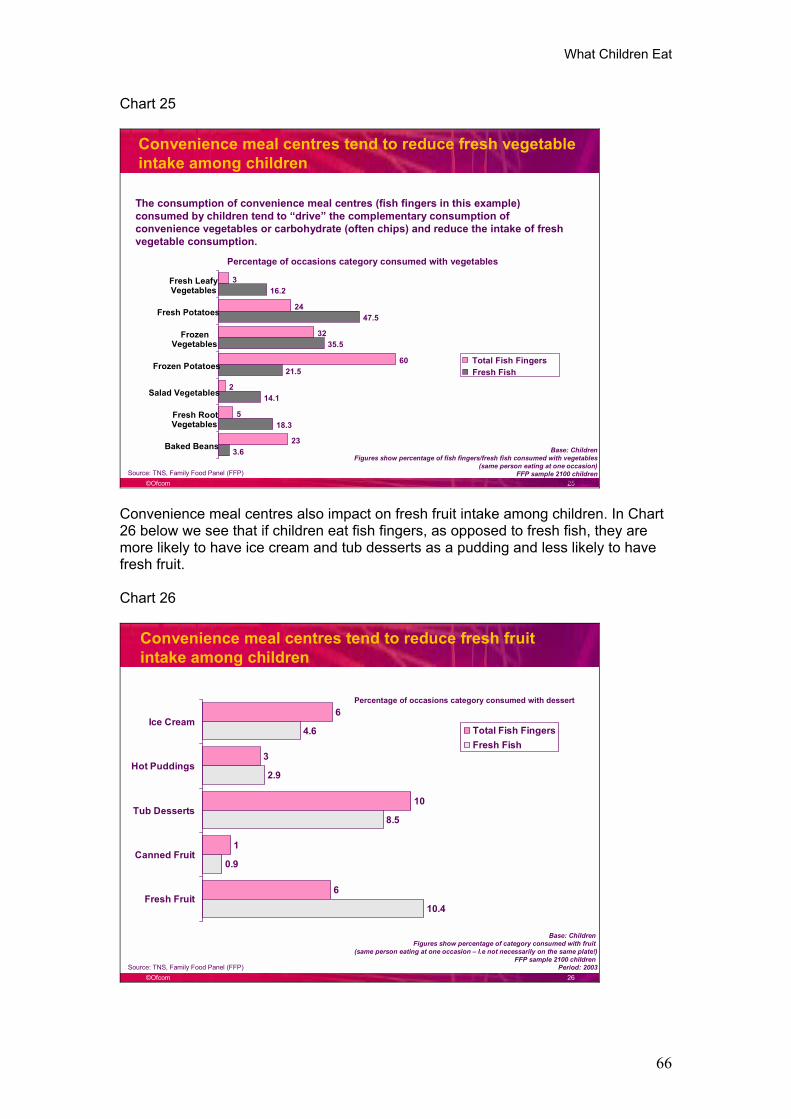
What Children Eat
66
Chart 25
©Ofcom 25
Convenience meal centres tend to reduce fresh vegetable intake among children
Base: Children Figures show percentage of fish fingers/fresh fish consumed with vegetables
(same person eating at one occasion)FFP sample 2100 children
Period: 2003
3
24
32
60
2
5
23
16.2
47.5
35.5
21.5
14.1
18.3
3.6
Fresh LeafyVegetables
Fresh Potatoes
FrozenVegetables
Frozen Potatoes
Salad Vegetables
Fresh RootVegetables
Baked Beans
Total Fish FingersFresh Fish
Percentage of occasions category consumed with vegetables
Source: TNS, Family Food Panel (FFP)
The consumption of convenience meal centres (fish fingers in this example) consumed by children tend to �drive� the complementary consumption of convenience vegetables or carbohydrate (often chips) and reduce the intake of fresh vegetable consumption.
Convenience meal centres also impact on fresh fruit intake among children. In Chart26 below we see that if children eat fish fingers, as opposed to fresh fish, they are more likely to have ice cream and tub desserts as a pudding and less likely to have fresh fruit.
Chart 26
©Ofcom 26
Convenience meal centres tend to reduce fresh fruit intake among children
6
3
10
1
6
4.6
2.9
8.5
0.9
10.4
Ice Cream
Hot Puddings
Tub Desserts
Canned Fruit
Fresh Fruit
Total Fish FingersFresh Fish
Base: Children Figures show percentage of category consumed with fruit
(same person eating at one occasion � I.e not necessarily on the same plate!)FFP sample 2100 children
Period: 2003
Percentage of occasions category consumed with dessert
Source: TNS, Family Food Panel (FFP)
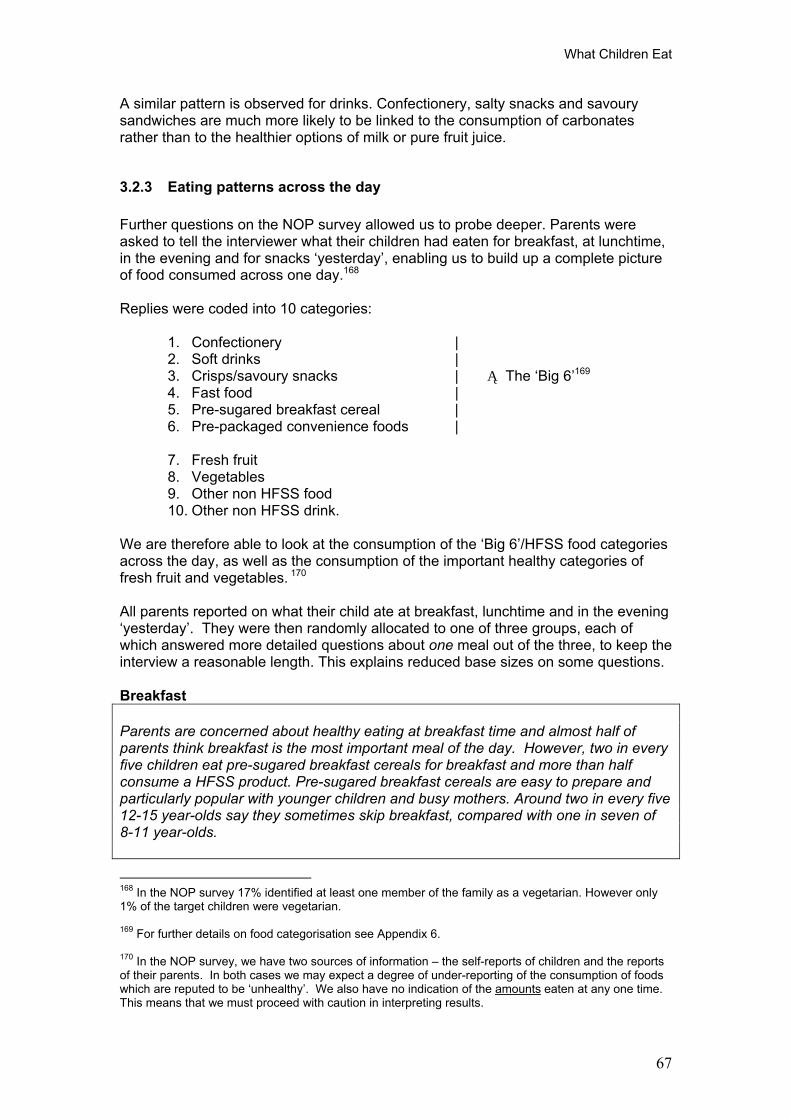
What Children Eat
67
A similar pattern is observed for drinks. Confectionery, salty snacks and savoury sandwiches are much more likely to be linked to the consumption of carbonates rather than to the healthier options of milk or pure fruit juice.
3.2.3 Eating patterns across the day
Further questions on the NOP survey allowed us to probe deeper. Parents were asked to tell the interviewer what their children had eaten for breakfast, at lunchtime, in the evening and for snacks �yesterday�, enabling us to build up a complete picture of food consumed across one day.168
Replies were coded into 10 categories:
1. Confectionery | 2. Soft drinks | 3. Crisps/savoury snacks | Ą The �Big 6�169
4. Fast food | 5. Pre-sugared breakfast cereal | 6. Pre-packaged convenience foods |
7. Fresh fruit 8. Vegetables 9. Other non HFSS food 10. Other non HFSS drink.
We are therefore able to look at the consumption of the �Big 6�/HFSS food categories across the day, as well as the consumption of the important healthy categories of fresh fruit and vegetables. 170
All parents reported on what their child ate at breakfast, lunchtime and in the evening �yesterday�. They were then randomly allocated to one of three groups, each of which answered more detailed questions about one meal out of the three, to keep the interview a reasonable length. This explains reduced base sizes on some questions.
Breakfast
Parents are concerned about healthy eating at breakfast time and almost half of parents think breakfast is the most important meal of the day. However, two in every five children eat pre-sugared breakfast cereals for breakfast and more than half consume a HFSS product. Pre-sugared breakfast cereals are easy to prepare and particularly popular with younger children and busy mothers. Around two in every five 12-15 year-olds say they sometimes skip breakfast, compared with one in seven of 8-11 year-olds.
168 In the NOP survey 17% identified at least one member of the family as a vegetarian. However only 1% of the target children were vegetarian.
169 For further details on food categorisation see Appendix 6.
170 In the NOP survey, we have two sources of information � the self-reports of children and the reports of their parents. In both cases we may expect a degree of under-reporting of the consumption of foods which are reputed to be �unhealthy�. We also have no indication of the amounts eaten at any one time. This means that we must proceed with caution in interpreting results.
What Children Eat
68
Foulds (2004) identified breakfast as an eating occasion when the household are at their most time-pressured � getting ready for school and work. The NOP survey shows that at breakfast time around half (51%) of children eat without an adult present (see Section 3.1.4). Mothers are concerned to provide food that can be prepared and eaten quickly and that children are willing to eat without coercion. The perceived importance of this meal and the need for speed and convenience makes it a �flash-point� for mothers and they are particularly open to products purpose-built for this eating occasion.
�They have the Jordan�s cereal bars. I went through practically every cereal on the shelf, you know you buy the multi-packs and I was left with half�. soggy cereal she wouldn�t eat. Then I tried her on the cereal bars and she will eat that with a glass of milk�. It took a long time to get to that. I used to shout �You can�t go out without eating anything!� because you feel they have got to eat before they go out.� (Mother, C1C2, child aged 12-15, South England)
As the quotation above illustrates, mothers are concerned that their children eat healthily. The TNS Family Food Panel confirms that at breakfast healthy eating is a relatively key need state. Unsurprisingly, the food industry has developed many products specifically targeted at breakfast and health claims abound, as well as other incentives to purchasing.
�She has cereal for breakfast � we do swap a lot. Mainly because they go for whatever toy�s in the box.� (Mother, DE, 5 year-old obese child, North England)
The NOP survey shows that pre-sugared breakfast cereals figure prominently in the diets of children at breakfast time. Asked what their child had for breakfast yesterday, 40% of parents told us that their child had a pre-sugared breakfast cereal.171 This was particularly true of the youngest children: 48% of parents of 2-4 year-olds said this was the case, compared with 31% of parents of 12-15 year-olds (see Chart 27).
Only 4% of parents say their children ate fruit �yesterday� for breakfast.
171 Data from TNS�s Food Panel give a lower figure of around 27% for pre-sugared cereals. Breakfast cereals as a whole, however, figure on 61% of breakfast occasions, according to TNS, and are by far the most common breakfast food. This difference may be due to either reporting or classificatory differences.
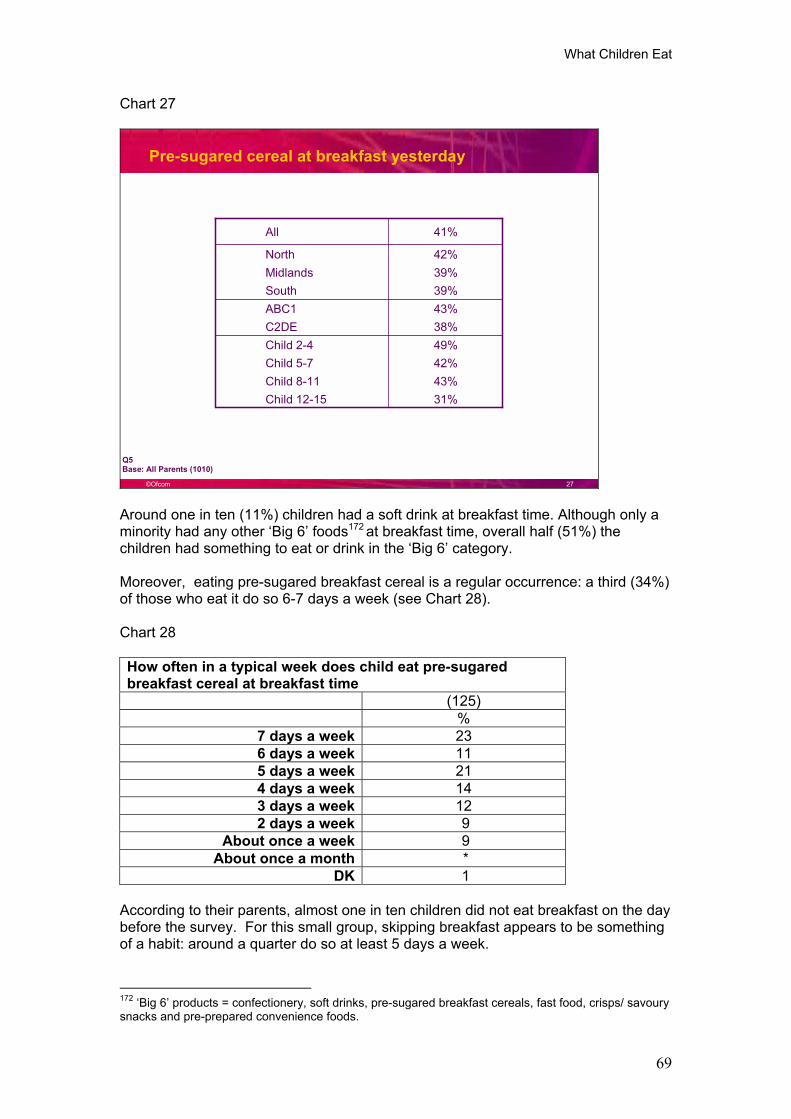
What Children Eat
69
Chart 27
©Ofcom 27
Pre-sugared cereal at breakfast yesterday
Base: All Parents (1010)Q5
31%Child 12-1543%Child 8-1142%Child 5-7
38%C2DE
39%Midlands42%North
49%Child 2-4
43%ABC139%South
41%All
Around one in ten (11%) children had a soft drink at breakfast time. Although only a minority had any other �Big 6� foods172 at breakfast time, overall half (51%) the children had something to eat or drink in the �Big 6� category.
Moreover, eating pre-sugared breakfast cereal is a regular occurrence: a third (34%) of those who eat it do so 6-7 days a week (see Chart 28).
Chart 28
How often in a typical week does child eat pre-sugared breakfast cereal at breakfast time (125) %
7 days a week 236 days a week 115 days a week 214 days a week 143 days a week 122 days a week 9
About once a week 9 About once a month *
DK 1
According to their parents, almost one in ten children did not eat breakfast on the day before the survey. For this small group, skipping breakfast appears to be something of a habit: around a quarter do so at least 5 days a week.
172 �Big 6� products = confectionery, soft drinks, pre-sugared breakfast cereals, fast food, crisps/ savoury snacks and pre-prepared convenience foods.
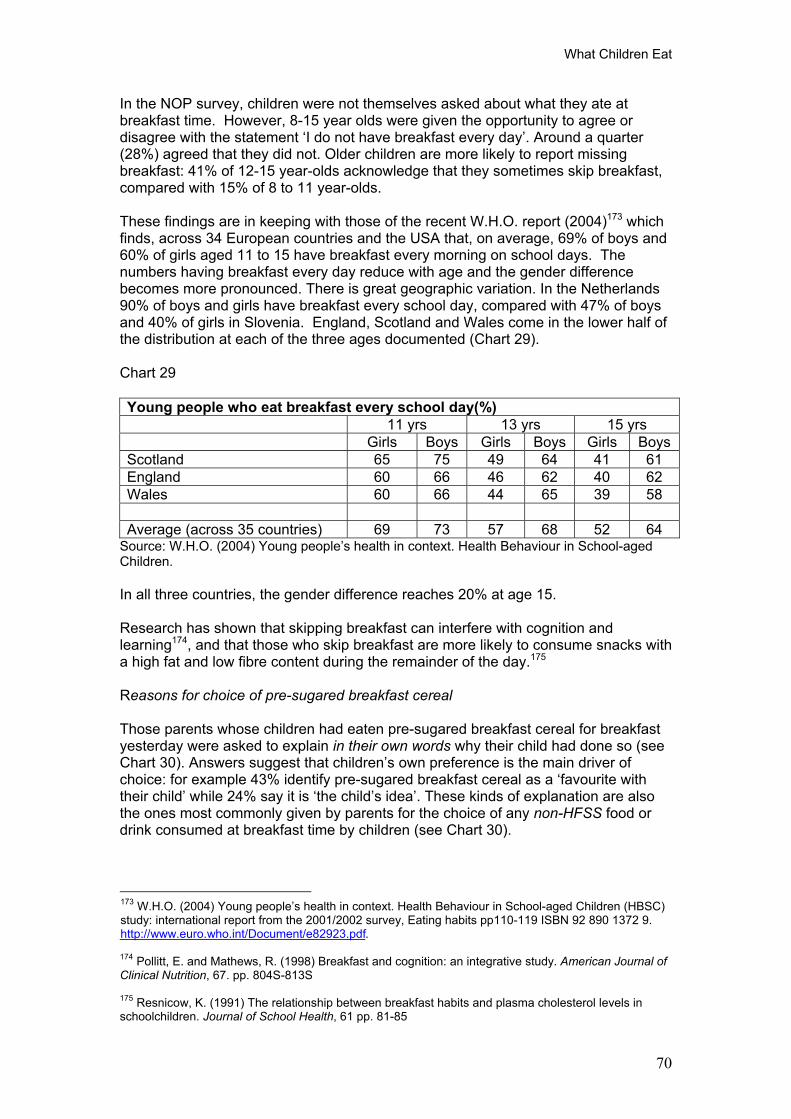
What Children Eat
70
In the NOP survey, children were not themselves asked about what they ate at breakfast time. However, 8-15 year olds were given the opportunity to agree or disagree with the statement �I do not have breakfast every day�. Around a quarter (28%) agreed that they did not. Older children are more likely to report missing breakfast: 41% of 12-15 year-olds acknowledge that they sometimes skip breakfast, compared with 15% of 8 to 11 year-olds.
These findings are in keeping with those of the recent W.H.O. report (2004)173 which finds, across 34 European countries and the USA that, on average, 69% of boys and 60% of girls aged 11 to 15 have breakfast every morning on school days. The numbers having breakfast every day reduce with age and the gender difference becomes more pronounced. There is great geographic variation. In the Netherlands 90% of boys and girls have breakfast every school day, compared with 47% of boys and 40% of girls in Slovenia. England, Scotland and Wales come in the lower half of the distribution at each of the three ages documented (Chart 29).
Chart 29
Young people who eat breakfast every school day(%) 11 yrs 13 yrs 15 yrs Girls Boys Girls Boys Girls Boys Scotland 65 75 49 64 41 61 England 60 66 46 62 40 62 Wales 60 66 44 65 39 58 Average (across 35 countries) 69 73 57 68 52 64
Source: W.H.O. (2004) Young people�s health in context. Health Behaviour in School-aged Children.
In all three countries, the gender difference reaches 20% at age 15.
Research has shown that skipping breakfast can interfere with cognition and learning174, and that those who skip breakfast are more likely to consume snacks with a high fat and low fibre content during the remainder of the day.175
Reasons for choice of pre-sugared breakfast cereal
Those parents whose children had eaten pre-sugared breakfast cereal for breakfast yesterday were asked to explain in their own words why their child had done so (see Chart 30). Answers suggest that children�s own preference is the main driver of choice: for example 43% identify pre-sugared breakfast cereal as a �favourite with their child� while 24% say it is �the child�s idea�. These kinds of explanation are also the ones most commonly given by parents for the choice of any non-HFSS food or drink consumed at breakfast time by children (see Chart 30).
173 W.H.O. (2004) Young people�s health in context. Health Behaviour in School-aged Children (HBSC) study: international report from the 2001/2002 survey, Eating habits pp110-119 ISBN 92 890 1372 9. http://www.euro.who.int/Document/e82923.pdf.
174 Pollitt, E. and Mathews, R. (1998) Breakfast and cognition: an integrative study. American Journal of Clinical Nutrition, 67. pp. 804S-813S
175 Resnicow, K. (1991) The relationship between breakfast habits and plasma cholesterol levels in schoolchildren. Journal of School Health, 61 pp. 81-85
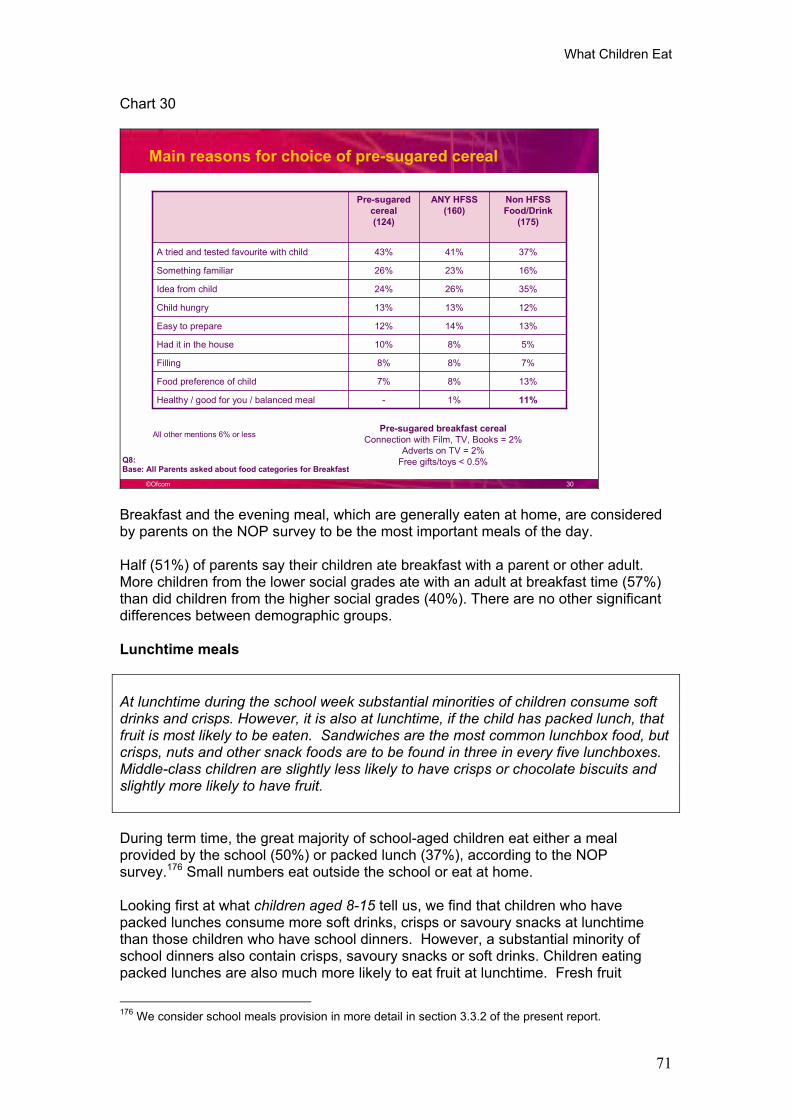
What Children Eat
71
Chart 30
©Ofcom 30
Main reasons for choice of pre-sugared cereal
Pre-sugared breakfast cerealConnection with Film, TV, Books = 2%
Adverts on TV = 2%Free gifts/toys < 0.5%
Base: All Parents asked about food categories for BreakfastQ8:
All other mentions 6% or less
11%1%-Healthy / good for you / balanced meal
13%8%7%Food preference of child
16%23%26%Something familiar
7%8%8%Filling
5%8%10%Had it in the house
13%14%12%Easy to prepare
12%13%13%Child hungry
35%26%24%Idea from child
37%41%43%A tried and tested favourite with child
Non HFSS Food/Drink
(175)
ANY HFSS(160)
Pre-sugared cereal(124)
Breakfast and the evening meal, which are generally eaten at home, are considered by parents on the NOP survey to be the most important meals of the day.
Half (51%) of parents say their children ate breakfast with a parent or other adult. More children from the lower social grades ate with an adult at breakfast time (57%) than did children from the higher social grades (40%). There are no other significant differences between demographic groups.
Lunchtime meals
At lunchtime during the school week substantial minorities of children consume soft drinks and crisps. However, it is also at lunchtime, if the child has packed lunch, that fruit is most likely to be eaten. Sandwiches are the most common lunchbox food, but crisps, nuts and other snack foods are to be found in three in every five lunchboxes. Middle-class children are slightly less likely to have crisps or chocolate biscuits and slightly more likely to have fruit.
During term time, the great majority of school-aged children eat either a meal provided by the school (50%) or packed lunch (37%), according to the NOP survey.176 Small numbers eat outside the school or eat at home.
Looking first at what children aged 8-15 tell us, we find that children who have packed lunches consume more soft drinks, crisps or savoury snacks at lunchtime than those children who have school dinners. However, a substantial minority of school dinners also contain crisps, savoury snacks or soft drinks. Children eating packed lunches are also much more likely to eat fruit at lunchtime. Fresh fruit
176 We consider school meals provision in more detail in section 3.3.2 of the present report.
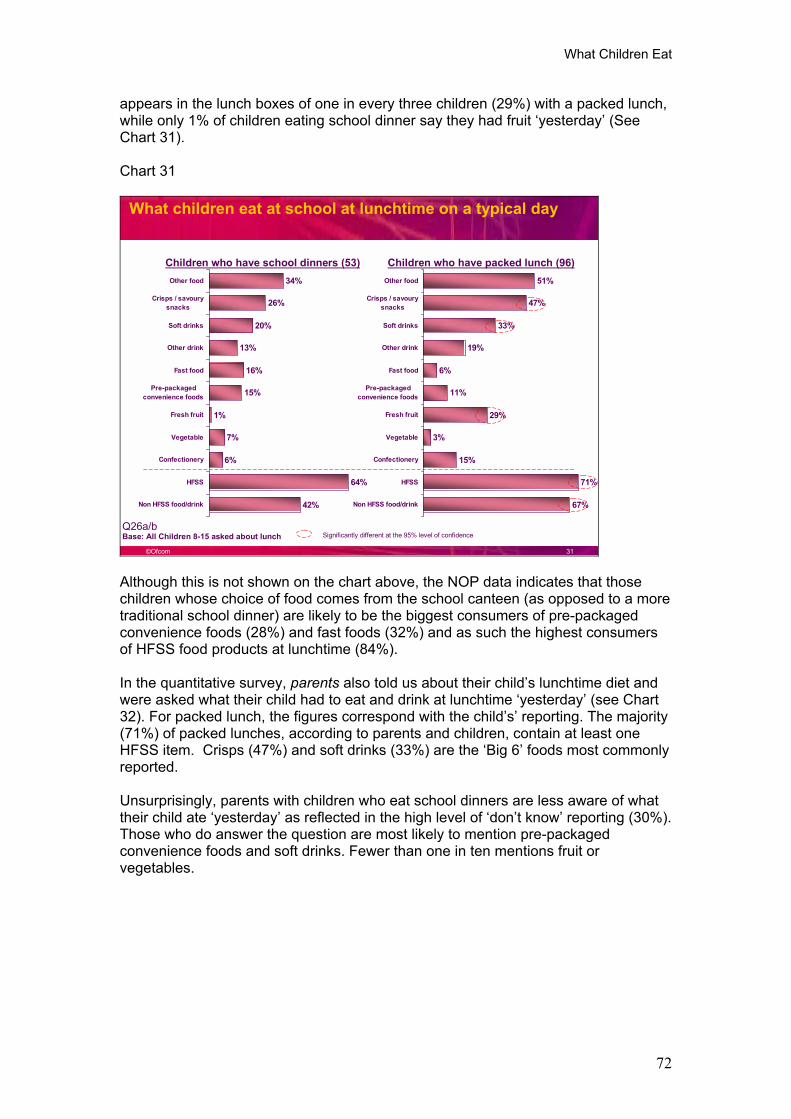
What Children Eat
72
appears in the lunch boxes of one in every three children (29%) with a packed lunch, while only 1% of children eating school dinner say they had fruit �yesterday� (See Chart 31).
Chart 31
©Ofcom 31
34%
26%
20%
13%
16%
15%
1%
7%
6%
64%
42%
Other food
Crisps / savourysnacks
Soft drinks
Other drink
Fast food
Pre-packagedconvenience foods
Fresh fruit
Vegetable
Confectionery
HFSS
Non HFSS food/drink
Base: All Children 8-15 asked about lunchQ26a/b
Children who have school dinners (53)51%
47%
33%
19%
6%
11%
29%
3%
15%
71%
67%
Other food
Crisps / savourysnacks
Soft drinks
Other drink
Fast food
Pre-packagedconvenience foods
Fresh fruit
Vegetable
Confectionery
HFSS
Non HFSS food/drink
Children who have packed lunch (96)
Significantly different at the 95% level of confidence
What children eat at school at lunchtime on a typical day
Although this is not shown on the chart above, the NOP data indicates that those children whose choice of food comes from the school canteen (as opposed to a more traditional school dinner) are likely to be the biggest consumers of pre-packaged convenience foods (28%) and fast foods (32%) and as such the highest consumers of HFSS food products at lunchtime (84%).
In the quantitative survey, parents also told us about their child�s lunchtime diet and were asked what their child had to eat and drink at lunchtime �yesterday� (see Chart 32). For packed lunch, the figures correspond with the child�s� reporting. The majority (71%) of packed lunches, according to parents and children, contain at least one HFSS item. Crisps (47%) and soft drinks (33%) are the �Big 6� foods most commonly reported.
Unsurprisingly, parents with children who eat school dinners are less aware of what their child ate �yesterday� as reflected in the high level of �don�t know� reporting (30%). Those who do answer the question are most likely to mention pre-packaged convenience foods and soft drinks. Fewer than one in ten mentions fruit or vegetables.
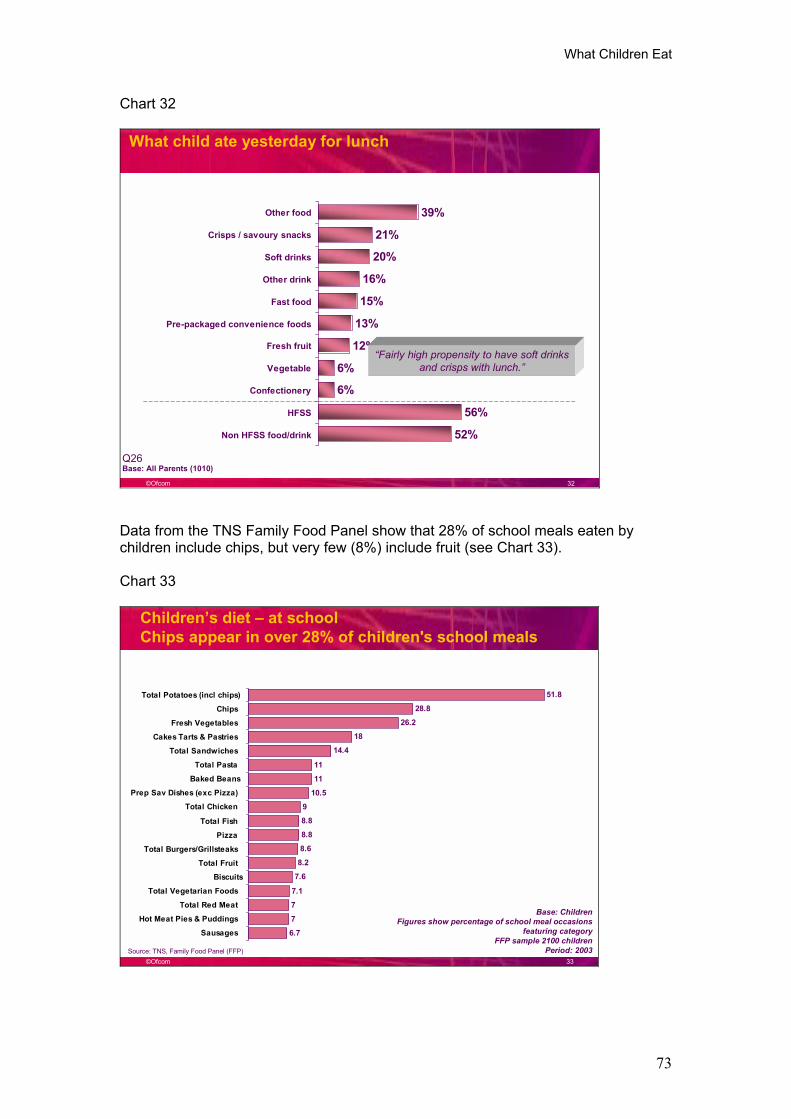
What Children Eat
73
Chart 32
©Ofcom 32
39%
21%
20%
16%
15%
13%
12%
6%
6%
56%
52%
Other food
Crisps / savoury snacks
Soft drinks
Other drink
Fast food
Pre-packaged convenience foods
Fresh fruit
Vegetable
Confectionery
HFSS
Non HFSS food/drink
What child ate yesterday for lunch
Base: All Parents (1010)Q26
�Fairly high propensity to have soft drinks and crisps with lunch.�
Data from the TNS Family Food Panel show that 28% of school meals eaten by children include chips, but very few (8%) include fruit (see Chart 33).
Chart 33
©Ofcom 33
Children�s diet � at schoolChips appear in over 28% of children's school meals
51.8
28.8
26.2
18
14.4
11
11
10.5
9
8.8
8.8
8.6
8.2
7.6
7.1
7
7
6.7
Total Potatoes (incl chips)
Chips
Fresh Vegetables
Cakes Tarts & Pastries
Total Sandwiches
Total Pasta
Baked Beans
Prep Sav Dishes (exc Pizza)
Total Chicken
Total Fish
Pizza
Total Burgers/Grillsteaks
Total Fruit
Biscuits
Total Vegetarian Foods
Total Red Meat
Hot Meat Pies & Puddings
Sausages
Base: Children Figures show percentage of school meal occasions
featuring categoryFFP sample 2100 children
Period: 2003Source: TNS, Family Food Panel (FFP)
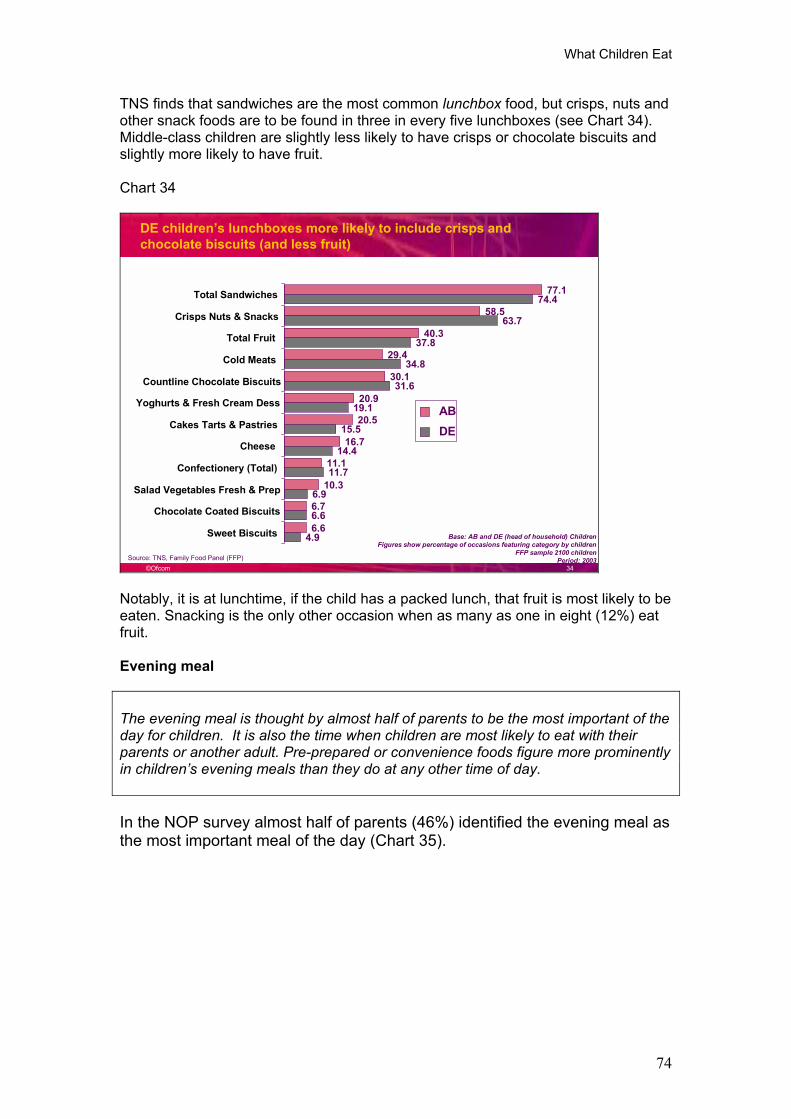
What Children Eat
74
TNS finds that sandwiches are the most common lunchbox food, but crisps, nuts and other snack foods are to be found in three in every five lunchboxes (see Chart 34). Middle-class children are slightly less likely to have crisps or chocolate biscuits and slightly more likely to have fruit.
Chart 34
©Ofcom 34
77.1
58.5
40.3
29.4
30.1
20.9
20.5
16.7
11.1
10.3
6.7
6.6
74.4
63.7
37.8
34.8
31.6
19.1
15.5
14.4
11.7
6.9
6.6
4.9
Total Sandwiches
Crisps Nuts & Snacks
Total Fruit
Cold Meats
Countline Chocolate Biscuits
Yoghurts & Fresh Cream Dess
Cakes Tarts & Pastries
Cheese
Confectionery (Total)
Salad Vegetables Fresh & Prep
Chocolate Coated Biscuits
Sweet Biscuits
ABDE
DE children�s lunchboxes more likely to include crisps and chocolate biscuits (and less fruit)
Base: AB and DE (head of household) Children Figures show percentage of occasions featuring category by children
FFP sample 2100 children Period: 2003Source: TNS, Family Food Panel (FFP)
Notably, it is at lunchtime, if the child has a packed lunch, that fruit is most likely to be eaten. Snacking is the only other occasion when as many as one in eight (12%) eat fruit.
Evening meal
The evening meal is thought by almost half of parents to be the most important of the day for children. It is also the time when children are most likely to eat with their parents or another adult. Pre-prepared or convenience foods figure more prominently in children�s evening meals than they do at any other time of day.
In the NOP survey almost half of parents (46%) identified the evening meal as the most important meal of the day (Chart 35).
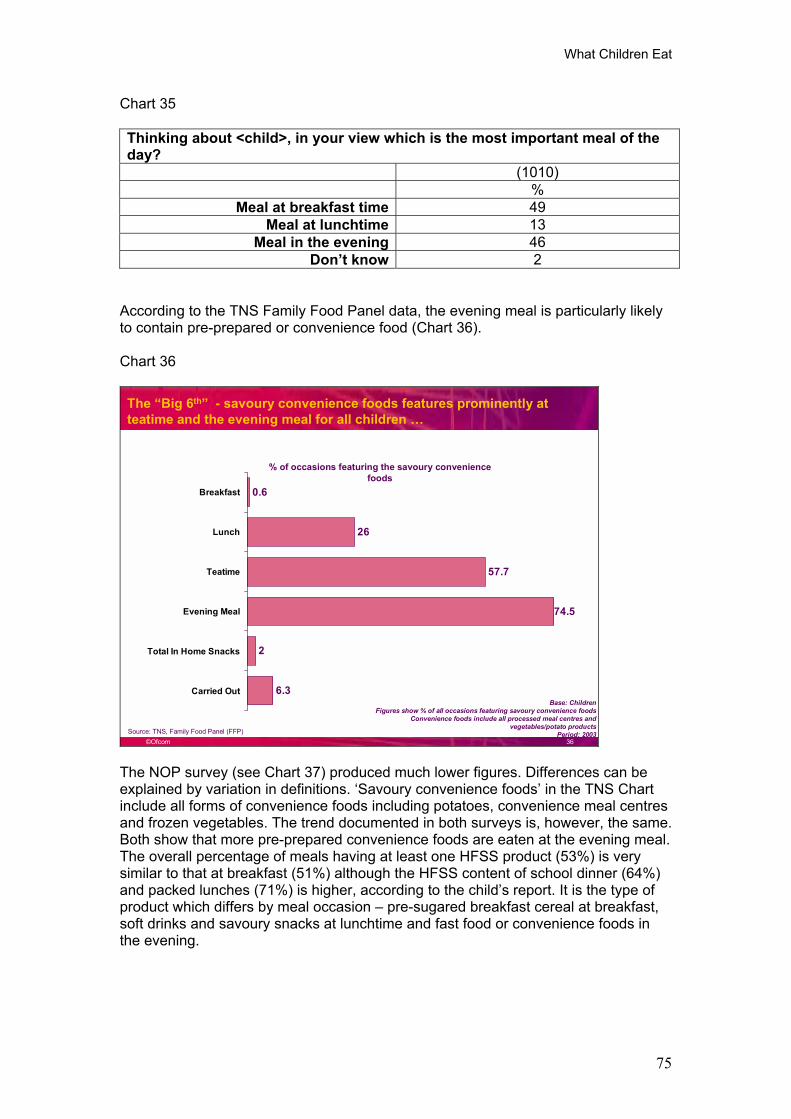
What Children Eat
75
Chart 35
Thinking about <child>, in your view which is the most important meal of the day?
(1010) %
Meal at breakfast time 49Meal at lunchtime 13
Meal in the evening 46Don�t know 2
According to the TNS Family Food Panel data, the evening meal is particularly likely to contain pre-prepared or convenience food (Chart 36).
Chart 36
©Ofcom 36
The �Big 6th� - savoury convenience foods features prominently at teatime and the evening meal for all children �
0.6
26
57.7
74.5
2
6.3
Breakfast
Lunch
Teatime
Evening Meal
Total In Home Snacks
Carried Out
% of occasions featuring the savoury convenience foods
Base: ChildrenFigures show % of all occasions featuring savoury convenience foods
Convenience foods include all processed meal centres and vegetables/potato products
Period: 2003Source: TNS, Family Food Panel (FFP)
The NOP survey (see Chart 37) produced much lower figures. Differences can be explained by variation in definitions. �Savoury convenience foods� in the TNS Chart include all forms of convenience foods including potatoes, convenience meal centres and frozen vegetables. The trend documented in both surveys is, however, the same. Both show that more pre-prepared convenience foods are eaten at the evening meal. The overall percentage of meals having at least one HFSS product (53%) is very similar to that at breakfast (51%) although the HFSS content of school dinner (64%) and packed lunches (71%) is higher, according to the child�s report. It is the type of product which differs by meal occasion � pre-sugared breakfast cereal at breakfast, soft drinks and savoury snacks at lunchtime and fast food or convenience foods in the evening.
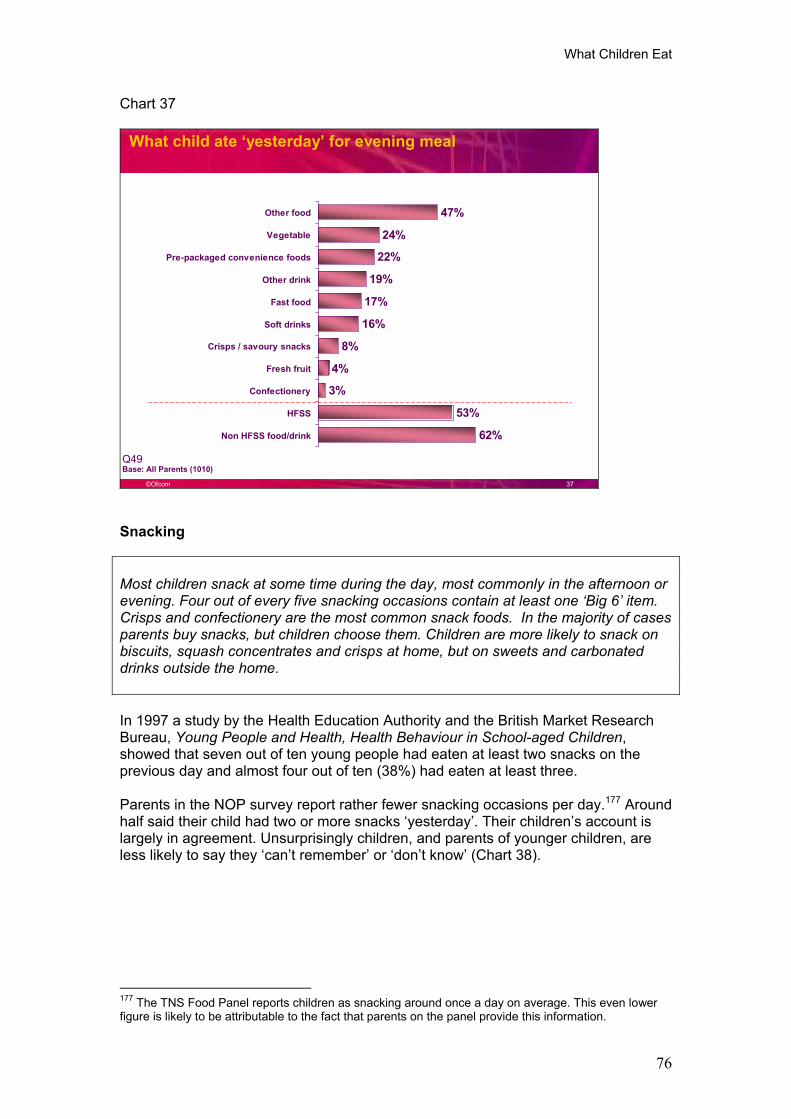
What Children Eat
76
Chart 37
©Ofcom 37
47%
24%
22%
19%
17%
16%
8%
4%
3%
53%
62%
Other food
Vegetable
Pre-packaged convenience foods
Other drink
Fast food
Soft drinks
Crisps / savoury snacks
Fresh fruit
Confectionery
HFSS
Non HFSS food/drink
What child ate �yesterday� for evening meal
Base: All Parents (1010)Q49
Snacking
Most children snack at some time during the day, most commonly in the afternoon or evening. Four out of every five snacking occasions contain at least one �Big 6� item. Crisps and confectionery are the most common snack foods. In the majority of cases parents buy snacks, but children choose them. Children are more likely to snack on biscuits, squash concentrates and crisps at home, but on sweets and carbonated drinks outside the home.
In 1997 a study by the Health Education Authority and the British Market Research Bureau, Young People and Health, Health Behaviour in School-aged Children,showed that seven out of ten young people had eaten at least two snacks on the previous day and almost four out of ten (38%) had eaten at least three.
Parents in the NOP survey report rather fewer snacking occasions per day.177 Around half said their child had two or more snacks �yesterday�. Their children�s account is largely in agreement. Unsurprisingly children, and parents of younger children, are less likely to say they �can�t remember� or �don�t know� (Chart 38).
177 The TNS Food Panel reports children as snacking around once a day on average. This even lower figure is likely to be attributable to the fact that parents on the panel provide this information.
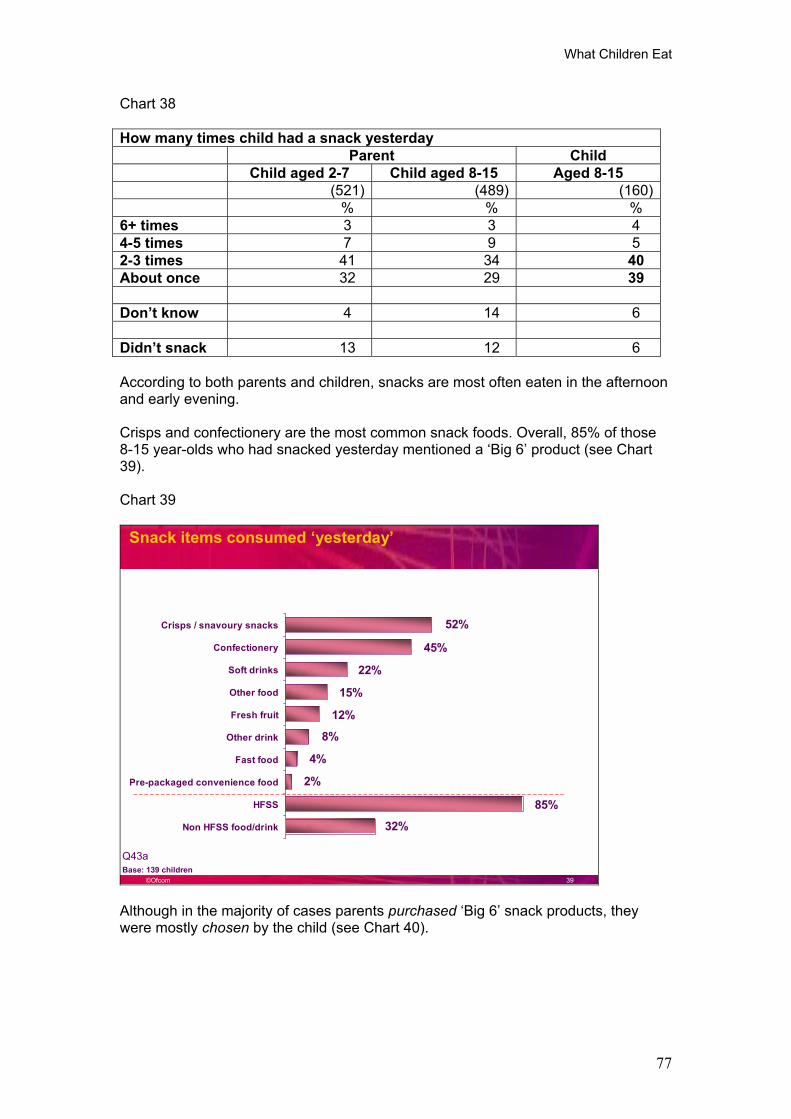
What Children Eat
77
Chart 38
How many times child had a snack yesterday Parent Child
Child aged 2-7 Child aged 8-15 Aged 8-15 (521) (489) (160) % % %
6+ times 3 3 4 4-5 times 7 9 5 2-3 times 41 34 40About once 32 29 39
Don�t know 4 14 6
Didn�t snack 13 12 6
According to both parents and children, snacks are most often eaten in the afternoon and early evening.
Crisps and confectionery are the most common snack foods. Overall, 85% of those 8-15 year-olds who had snacked yesterday mentioned a �Big 6� product (see Chart 39).
Chart 39
©Ofcom 39
52%
45%
22%
15%
12%
8%
4%
2%
85%
32%
Crisps / snavoury snacks
Confectionery
Soft drinks
Other food
Fresh fruit
Other drink
Fast food
Pre-packaged convenience food
HFSS
Non HFSS food/drink
Snack items consumed �yesterday�
Base: 139 childrenQ43a
Although in the majority of cases parents purchased �Big 6� snack products, they were mostly chosen by the child (see Chart 40).
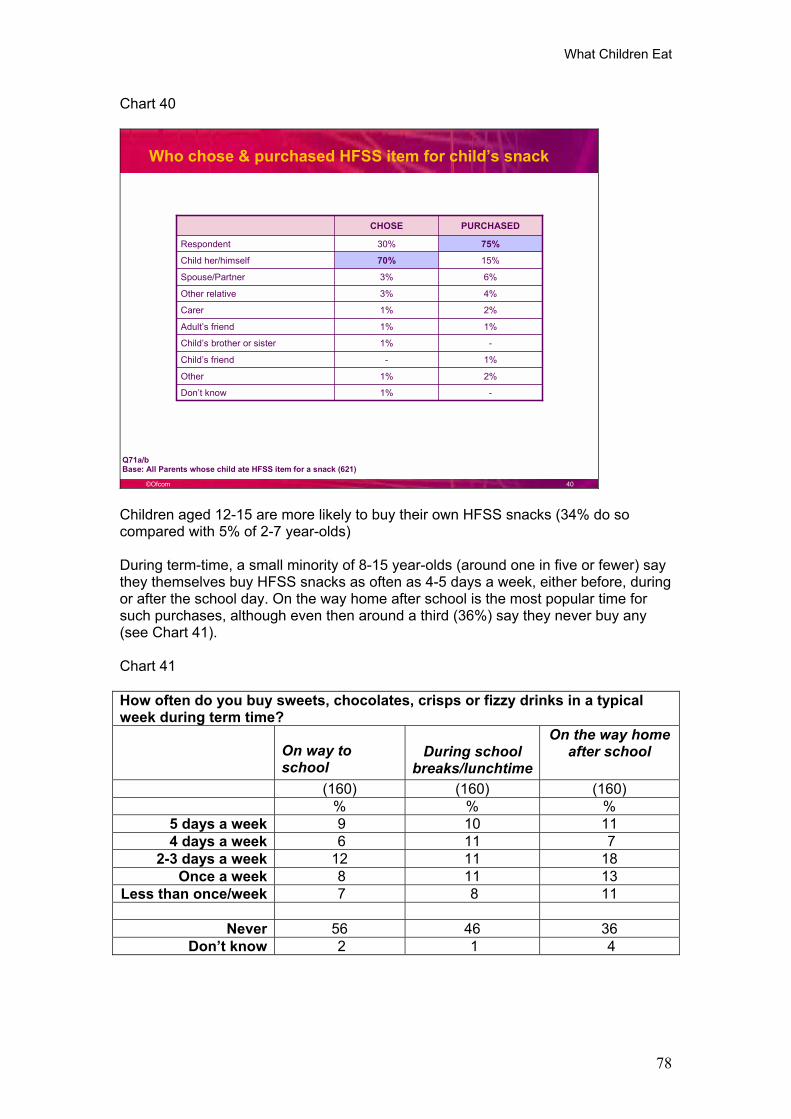
What Children Eat
78
Chart 40
©Ofcom 40
Who chose & purchased HFSS item for child�s snack
Base: All Parents whose child ate HFSS item for a snack (621) Q71a/b
1%1%Adult�s friend
2%1%Carer
4%3%Other relative
15%70%Child her/himself
-
2%
1%
-
6%
75%
PURCHASEDCHOSE
1%Don�t know
1%Other
-Child�s friend
3%Spouse/Partner
1%Child�s brother or sister
30%Respondent
Children aged 12-15 are more likely to buy their own HFSS snacks (34% do so compared with 5% of 2-7 year-olds)
During term-time, a small minority of 8-15 year-olds (around one in five or fewer) say they themselves buy HFSS snacks as often as 4-5 days a week, either before, during or after the school day. On the way home after school is the most popular time for such purchases, although even then around a third (36%) say they never buy any (see Chart 41).
Chart 41
How often do you buy sweets, chocolates, crisps or fizzy drinks in a typical week during term time?
On way to school
During school breaks/lunchtime
On the way home after school
(160) (160) (160) % % %
5 days a week 9 10 11 4 days a week 6 11 7
2-3 days a week 12 11 18 Once a week 8 11 13
Less than once/week 7 8 11
Never 56 46 36 Don�t know 2 1 4
What Children Eat
79
Children on The TNS Family Food Panel tend to consume biscuits, squash concentrates and crisps for snacks at home. Carbonated drinks and sweets figure more highly than crisps where out-of-home snacks are concerned.178
3.2.4 HFSS consumption: correlational analysis of the NOP survey data
Overall HFSS consumption was assessed by summing the total number of mentions of the �Big 6� food categories across the day for each child. Correlations between HFSS consumption and a subset of key variables were examined.179180
Findings are consistent with the view that although most children consume HFSS products, children from higher income, more middle-class homes with better-educated mothers tend to consume more fruit and vegetables and consequently have a more balanced diet. 181
The investigation confirmed that there is an association between income182 and higher levels of consumption of all food categories, including HFSS products.183 This may reflect increased levels of consumption generally amongst those who are relatively wealthy. (Higher incomes are also associated with ownership of more media - television, computers etc184).
HFSS consumption, however, does not discriminate well between families, as children in most households regularly eat HFSS products, which are staples across a range of diets. The most discriminating food by far is fruit.
Similarly, levels of exposure to HFSS foods do not relate to BMI, but levels of exposure to healthy foods (fruit and vegetables) do. The indications are, therefore, that the availability of a balanced diet is critical.
The authors therefore conclude from the data set, that the salient difference is not between households with high levels of HFSS consumption and those with low levels, but between households that offer their children a balanced diet, supplementing HFSS foods with healthy options, such as fruit, and those that do not.
178 It should be noted that while there are some differences between the percentages recorded by the TNS Family Food Panel and the NOP survey for consumption of products, the trends indicated are similar and most differences can be accounted for by differences in coding or methodology.
179 In order to mine more fully the information collected across the day in the NOP survey Dr Peter Lunt of University College London and Ellen Helsper of the London School of Economics and Political Science were asked to look at the food and drink consumption patterns across the day.
180 Further analytic work on the full data set is continuing into July/August 2004.
181 The authors, discussing the problem of potentially overlapping variance in the separate analyses, point out that the generally very low levels of interrelationship between variables means that it is unlikely that the same variance is being explained over and over again. However, they note the desirability of further analysis to check for overlapping variances in any relations.
182 Income is positively correlated with social grade, as we would expect.
183 Correlation between HFSS consumption and income: R = .077, p < .031, N = 702.
184 Correlation between HFSS consumption and Index of Media Access R = .089, p < .006, N = 953.
What Children Eat
80
It should be remembered that the measure used to assess consumption of HFSS products in the NOP survey does not take into account the amount consumed. This may at least partially explain why overall exposure to HFSS products, unlike fruit consumption, does not distinguish between households.
SummaryEating patterns across the day
Breakfast and the evening meal, which are generally eaten at home, are considered by parents to be the most important meals of the day.
Just over half of meals at breakfast (51%) and in the evening (53%) and 71% of lunchboxes contain at least one HFSS product.
Only around one in every twenty have fruit at breakfast (5%), school dinner (6%) and the evening meal (4%). One in eight (12%) eat fruit for a snack. However as many as one in three packed lunchboxes contain fruit (29%).
The type of HFSS product differs by meal occasion � pre-sugared breakfast cereal at breakfast, soft drinks and savoury snacks at lunchtime and fast food or convenience foods in the evening.
At breakfast time 51% of children ate without an adult being present, compared with 64% at lunchtime, when the majority were at school. Only 17% ate without an adult being present in the evening.
Most children snack at some time during the day, most commonly in the afternoon or evening. Four out of every five snacking occasions contain at least one �Big 6� item. Crisps and confectionery are the most common snack foods.
Almost all children eat at least some HFSS products. The salient difference is between households that offer their children a balanced diet, supplementing HFSS foods with healthy options, such as fruit, and those that do not.
Factors Influencing Children�s Food Choice
81
3.3 Factors influencing children�s food choice
The story so far
Obesity amongst children (and adults) is a growing national problem and has been linked, among other factors, with the consumption of products high in saturated fats salt and sugar (HFSS). Children and young people have a taste for such products and these foods and drinks are figuring prominently in their diets (see Section 3.2). Changes in British lifestyles have led to changes in the �food culture� of families (see Section 3.1) that encourage such consumption patterns. Eating outside the home and eating convenience foods inside the home are both on the increase. Children nowadays have a greater influence on what they eat and are increasingly eating without adults around. These changes make it more difficult for parents to monitor their children�s food and drink intake. In this context, the advertising of HFSS foods to children on television has come under scrutiny.
If any proposed regulatory changes are to be targeted and proportionate, we need to know more about the role of television advertising in the context of the overall range of influences on children�s diets.
Overview of the factors influencing children�s food choice
There is general consensus that food choice is multi-determined and that much is still to be learned about the interplay of influences.
�Future research must evaluate the relative contribution of each domain [social, physiological, etc] to the development of food choice patterns, food preferences, and eating style.�185
Following Story et al (2002)186, Livingstone and Helsper (2004) 187 recommend a multi-level approach, which distinguishes four levels of factors that influence eating behaviour (see below).
1) Individual (intrapersonal)
At this level research has identified: ¶ psychosocial factors (such as food preferences, taste, health and
nutrition, meanings of food, self-efficacy and food knowledge), ¶ biological factors (such as heredity, hunger and gender) ¶ behavioural factors (such as time and convenience, cost, meal
patterns, dieting)
185 Young, B., Webley, P., Hetherington, M., and Zeedyk, S. (1996). The role of television advertising in children�s food choice. Report commissioned by the Ministry of Agriculture, Fisheries and Food.
186 Story, M., Neumark-Sztainer, D., and French, S. (2002). Individual and environmental influences on adolescent eating behaviors. Journal of the American Dietetic Association, 102(3), S40-S51.
187 Livingstone, S. and Helsper, E. (2004) Advertising HFSS foods to children: Understanding Promotion In The Context Of Children�s Daily Lives. See Appendix 2.
Factors Influencing Children�s Food Choice
82
2) Social environmental (interpersonal)
Factors at this level involve: ¶ family (income, working status of mother, family eating patterns,
parental weight, diet and knowledge) ¶ friends (conformity, norms and peer networks)
3) Physical environment (community)
Here research has focussed on: ¶ schools (schools sell HFSS snacks, contract with commercial
suppliers for vending machines, accept sponsorship.) ¶ commercial sites (fast food restaurants, vending machines and
stores near schools provide an �unhealthy� diet. Poor areas have often limited access to healthy food options.)
4) Macrosystem (societal)
Here research has pointed to the role of the mass media and advertising, social and cultural norms, production and policies and distribution and pricing systems. ¶ consumerism (youth market and pester power) ¶ media (food promotion, TV exposure)
This multi-factorial account of food choice has been used to guide the research approach adopted in new qualitative and quantitative projects undertaken by Ofcom in the course of the present inquiry. The outline given above makes it abundantly clear that our main focus, exposure to television advertising (see above), figures as only one of many competing influences, and that there are unlikely to be any simple answers to what is an exceedingly complex problem.
�Unfortunately many members of government, even heads of state, the public and some health professionals still see obesity simply as a matter of eating too much and exercising too little, when in fact it is a complex, multifactorial disorder of appetite regulation and energy metabolism, that involves genetics, physiology, biochemistry and the neurosciences, as well as environmental, psychological and cultural factors.�188
We already have indications that socio-economic factors (family income and social grade, the relative deprivation of an area), lifestyle changes (more working mothers, longer working hours, higher incomes) and biological factors (taste/heredity/sex) are powerful determinants of food choice.189 Over and above these and other factors, can television advertising be shown to have a significant effect on children�s food preferences, consumption and behaviour? How does its influence compare with that of other forms of food promotion?
188 Thomas, P.R. (ed.) (1995) Weighing the options National Academy Press. Washington.
189 Story, M., Neumark-Sztainer, D., and French, S. (2002). Individual and environmental influences on adolescent eating behaviors. Journal of the American Dietetic Association, 102(3), S40-S51.
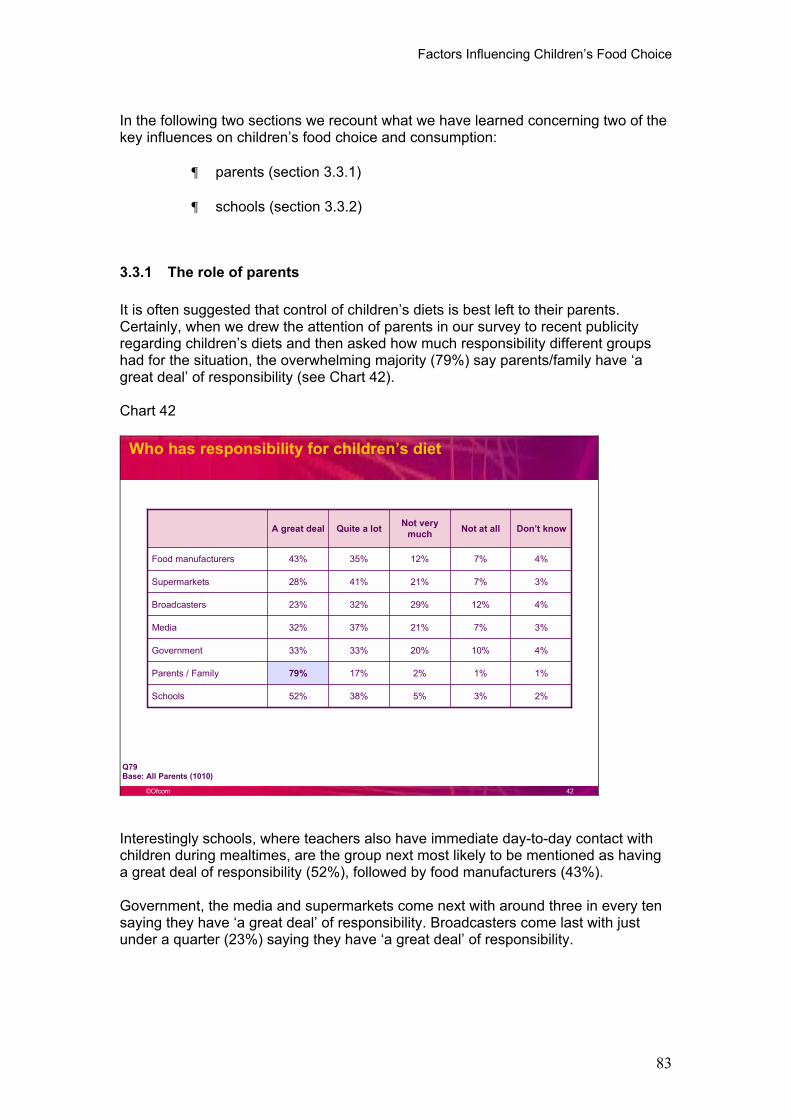
Factors Influencing Children�s Food Choice
83
In the following two sections we recount what we have learned concerning two of the key influences on children�s food choice and consumption:
¶ parents (section 3.3.1)
¶ schools (section 3.3.2)
3.3.1 The role of parents
It is often suggested that control of children�s diets is best left to their parents. Certainly, when we drew the attention of parents in our survey to recent publicity regarding children�s diets and then asked how much responsibility different groups had for the situation, the overwhelming majority (79%) say parents/family have �a great deal� of responsibility (see Chart 42).
Chart 42
©Ofcom 42
Who has responsibility for children�s diet
Base: All Parents (1010)Q79
2%3%5%38%52%Schools
1%1%2%17%79%Parents / Family
4%10%20%33%33%Government
3%7%21%37%32%Media
4%12%29%32%23%Broadcasters
3%7%21%41%28%Supermarkets
4%7%12%35%43%Food manufacturers
Don�t knowNot at allNot very muchQuite a lotA great deal
Interestingly schools, where teachers also have immediate day-to-day contact with children during mealtimes, are the group next most likely to be mentioned as having a great deal of responsibility (52%), followed by food manufacturers (43%).
Government, the media and supermarkets come next with around three in every ten saying they have �a great deal� of responsibility. Broadcasters come last with just under a quarter (23%) saying they have �a great deal� of responsibility.
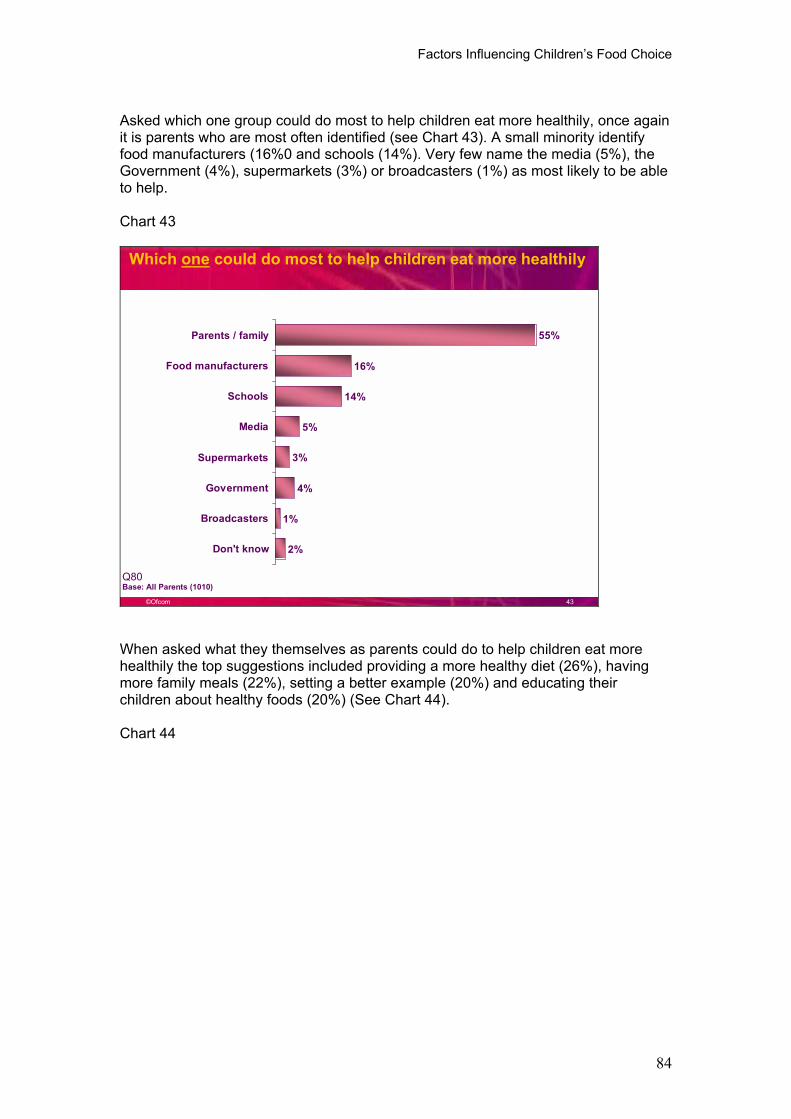
Factors Influencing Children�s Food Choice
84
Asked which one group could do most to help children eat more healthily, once again it is parents who are most often identified (see Chart 43). A small minority identify food manufacturers (16%0 and schools (14%). Very few name the media (5%), the Government (4%), supermarkets (3%) or broadcasters (1%) as most likely to be able to help.
Chart 43
©Ofcom 43
55%
16%
14%
5%
3%
4%
1%
2%
Parents / family
Food manufacturers
Schools
Media
Supermarkets
Government
Broadcasters
Don't know
Which one could do most to help children eat more healthily
Base: All Parents (1010)Q80
When asked what they themselves as parents could do to help children eat more healthily the top suggestions included providing a more healthy diet (26%), having more family meals (22%), setting a better example (20%) and educating their children about healthy foods (20%) (See Chart 44).
Chart 44
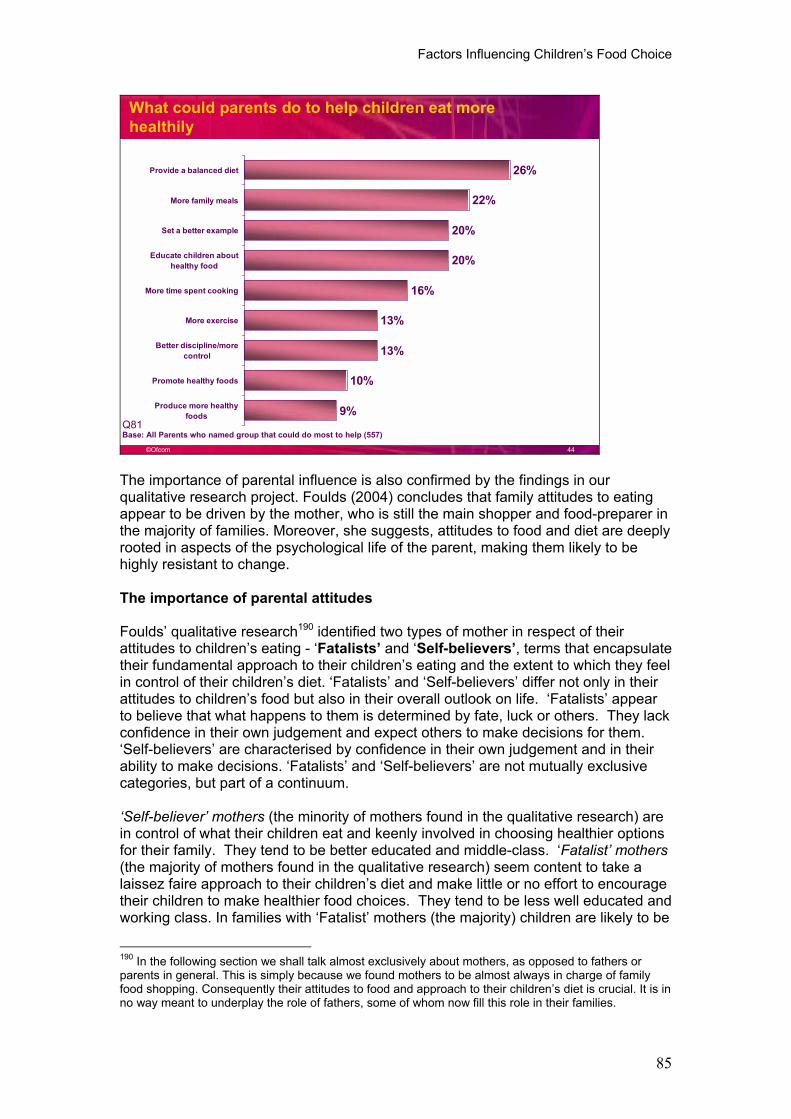
Factors Influencing Children�s Food Choice
85
©Ofcom 44
26%
22%
20%
20%
16%
13%
13%
10%
9%
Provide a balanced diet
More family meals
Set a better example
Educate children abouthealthy food
More time spent cooking
More exercise
Better discipline/morecontrol
Promote healthy foods
Produce more healthyfoods
What could parents do to help children eat more healthily
Base: All Parents who named group that could do most to help (557)Q81
The importance of parental influence is also confirmed by the findings in our qualitative research project. Foulds (2004) concludes that family attitudes to eating appear to be driven by the mother, who is still the main shopper and food-preparer in the majority of families. Moreover, she suggests, attitudes to food and diet are deeply rooted in aspects of the psychological life of the parent, making them likely to be highly resistant to change.
The importance of parental attitudes
Foulds� qualitative research190 identified two types of mother in respect of their attitudes to children�s eating - �Fatalists� and �Self-believers�, terms that encapsulate their fundamental approach to their children�s eating and the extent to which they feel in control of their children�s diet. �Fatalists� and �Self-believers� differ not only in their attitudes to children�s food but also in their overall outlook on life. �Fatalists� appear to believe that what happens to them is determined by fate, luck or others. They lack confidence in their own judgement and expect others to make decisions for them. �Self-believers� are characterised by confidence in their own judgement and in their ability to make decisions. �Fatalists� and �Self-believers� are not mutually exclusive categories, but part of a continuum.
�Self-believer� mothers (the minority of mothers found in the qualitative research) are in control of what their children eat and keenly involved in choosing healthier options for their family. They tend to be better educated and middle-class. �Fatalist� mothers(the majority of mothers found in the qualitative research) seem content to take a laissez faire approach to their children�s diet and make little or no effort to encourage their children to make healthier food choices. They tend to be less well educated and working class. In families with �Fatalist� mothers (the majority) children are likely to be
190 In the following section we shall talk almost exclusively about mothers, as opposed to fathers or parents in general. This is simply because we found mothers to be almost always in charge of family food shopping. Consequently their attitudes to food and approach to their children�s diet is crucial. It is in no way meant to underplay the role of fathers, some of whom now fill this role in their families.
Factors Influencing Children�s Food Choice
86
driving the food choices made for them and their diets are generally unhealthy. There is a high reliance on processed foods and other HFSS foods.
�She says �I really need one� and I say �No� and it goes on like that � I do give in a lot.� (Fatalist Mother of obese 5 year-old/DE/North England)
In families with �Self-believer� mothers, the mothers are in control of food choices and the children�s diets are generally healthy with a good proportion of fresh foods and of home cooked foods and fewer HFSS and nutrient-poor foods. Snacks are confined to certain times, rather than a continual grazing pattern.
�I decide what goes in the packed lunches � I am the mother ��they might occasionally say, �Can we have some chocolate?� and I might say �Yes� or I might say �No you can�t� ��Like Poppy said earlier, �Can I have something to eat?� � my answer �There is always, there is fruit in there�. So they can have an apple or a pear or a banana.� (Self-believer mother of 14 year-old/AB/South England)
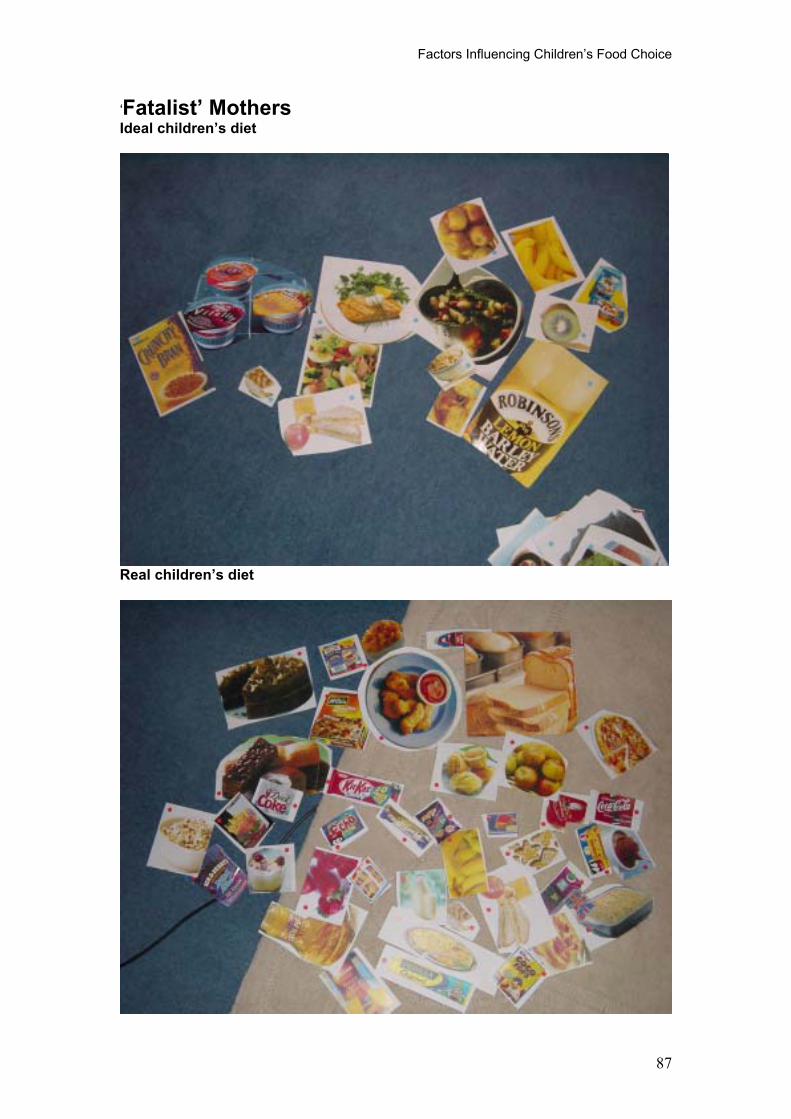
Factors Influencing Children�s Food Choice
87
�Fatalist� Mothers Ideal children�s diet
Real children�s diet
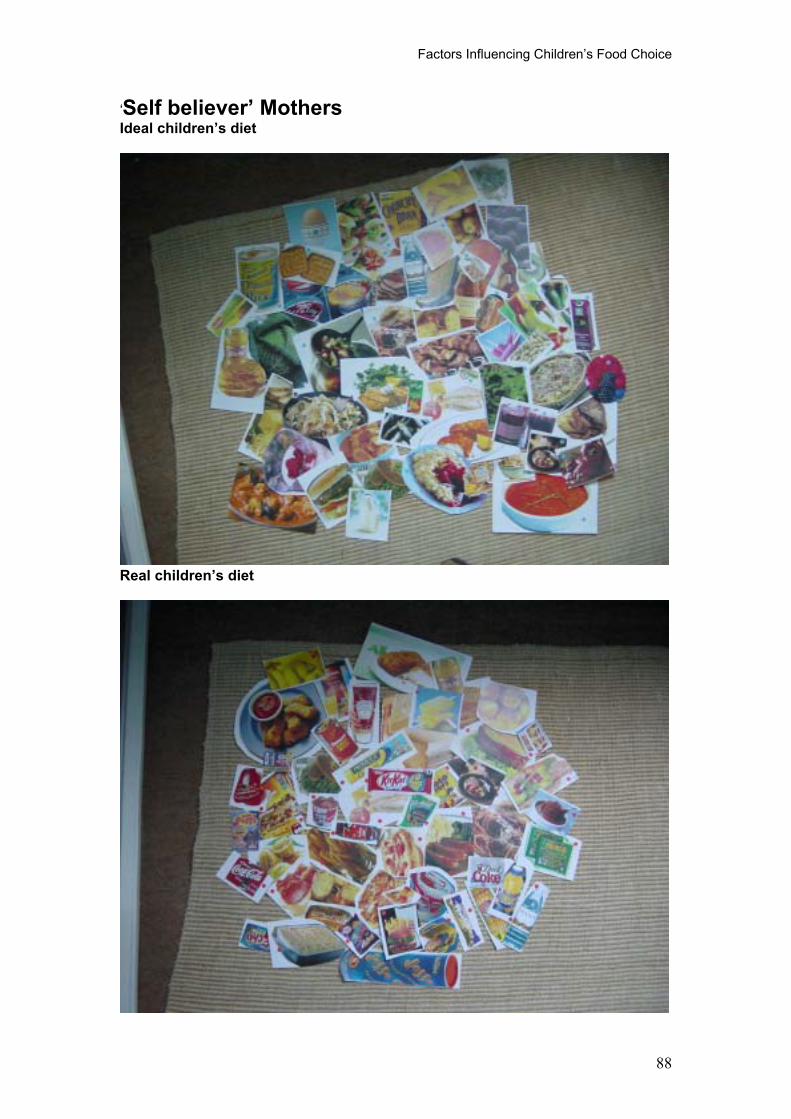
Factors Influencing Children�s Food Choice
88
�Self believer� MothersIdeal children�s diet
Real children�s diet
Factors Influencing Children�s Food Choice
89
Data from the TNS Family Food Panel confirm that middle-class parents in general are somewhat stricter and more self-confident when it comes to controlling their children�s diet.
Perceptions of the �ideal diet�: a barrier to healthy eating
The qualitative research gave interesting insights into the differences between �Self-believer� and �Fatalist� mothers� perceptions of the �ideal diet�, which may help explain some of the thinking which helps to maintain the �Fatalist� tendency to rely more on �unhealthy� foods.
Both mothers and children were asked to identify what an �ideal diet� for children would be and what children �really eat�. Although the two categories were not markedly different for a minority (mainly middle-class families with better educated parents) the majority of parents and children admitted that the �real� or actual diet was very different from the one they thought to be �ideal�.
Firstly, �Fatalist� as well as �Self-believer� mothers know that convenience foods are less healthy than home-cooked foods. They are both aware of the need for fresh vegetables, fruit and foods containing protein and calcium in their children�s diets. However they differ in their assessment of the related health benefits. �Fatalist� mothers think in terms of the outcomes of healthy eating outlined in the media � lessening the risk of obesity and better dental health. Their approach is essentially reactive � if their child is of normal weight and has no specific health problem then they make only token gestures towards establishing healthier eating patterns. �Self-believer� mothers are more proactive and aware of other long-term risks, such as heart disease, diabetes and cancer.
�Fatalist� mothers are also hampered by their lack of ability to conceptualise an attractive, affordable and varied healthy diet. The photographs above show clearly the sparseness of choice and the number of branded products in the �ideal diet� of �Fatalist� mothers, compared with the more varied choice exemplified in the �ideal diet� of �Self-believer mothers�. In putting together their �ideal diet for a child� Fatalist mothers are likely to feel they have to reject whole categories of foods: fats, dairy products, sugar and carbohydrates. Consequently their notion of the �ideal diet� is extremely austere and perceived to be unattainable. �Self-believer� mothers� �ideal diet� is more inclusive and consequently more attainable. They do not exclude whole categories of food, but reject HFSS foods and are also more likely to exclude processed foods and those with artificial additives.
�I try not to ban things completely � just to let them know that it�s OK in moderation.� (�Self-believer� mother of overweight 11 year-old/C1C2/ South England)
The common perception of healthy food as expensive was also a barrier to healthier eating. Convenience foods are heavily price-promoted and there are large numbers of special offers on these sorts of food in supermarkets, compared with the relatively fewer price promotions on raw foods or �ingredients�. Furthermore healthy convenience foods are often premium priced and it is only the more affluent who can afford them. �Fatalist� mothers, with their perception of a carbohydrate-free �ideal diet� think that children will need a larger quantity of �healthy� foods to feel satisfied, with a consequently greater spend.
Factors Influencing Children�s Food Choice
90
Locus of Control
The �Self-believer� and �Fatalist� descriptors developed in the qualitative research were noted by Foulds (2004) to have much in common with the social psychological measure, Locus of Control.191.
Locus of Control is very widely used in health-related research, and a vast amount of work has been devoted to the development of health-specific scales. The measure combines belief in fate/external influences, the value an individual puts on health, and the level of responsibility that they assume for their own health. This composite score aims to discriminate between those with an Internal Locus of Control (individuals who are less inclined to believe in fate/external influences, who value health and take personal responsibility for their health) from those who have an External Locus of Control. Internal Locus of Control therefore corresponds to the �Self believer� group in the qualitative research and the External Locus of Control to the �Fatalist� group.
In order to further investigate this issue, questions were included on the quantitative research carried out by NOP that were designed to measure the component elements of the Locus of Control composite.
The questions incorporated measured the following three dimensions:
11. Belief in chance/fate192
12. Belief in powerful others193
13. Lack of belief in one�s own ability to control things194
Correlation and cluster analyses195 were then conducted to drill down into the Locus of Control composites in order to further understand parental attitudes and their impact on children�s food choices.
191 See Rotter, J.B. (1954) Social Learning and Clinical Psychology. New York: Prentice Hall. More recent research using this approach has been found to have relevance to Health issues. In the current survey scales developed by Wallston and Wallston have been used. See: http://www.vanderbilt.edu/nursing/kwallston/mhlcscales.htm
192 Tapped in the NOP survey by agreement with two statements: �Often I feel that no matter what I do, if I am going to get ill, I will get ill.� �When I become ill, it's a matter of fate.�
193 Tapped in the NOP survey by agreement with the question �Other people play a big part in whether I stay healthy or become sick.�
194 Tapped in the NOP survey by disagreement with two statements �My physical well-being depends on how well I take care of myself.� �Whatever goes wrong with my health is my own fault.�
195 The Locus of Control analysis was carried out by Dr Peter Lunt of University College London and Ellen Helsper of the London School of Economics and Political Science. The analysis followed two strategies:
1) Isolating key variables (Locus of Control, HFSS consumption, Income, BMI) and examining correlates of these variables in the data set.
2) Segmenting the sample on variables that might discriminate between lifestyles and examining descriptives of these segmentations.
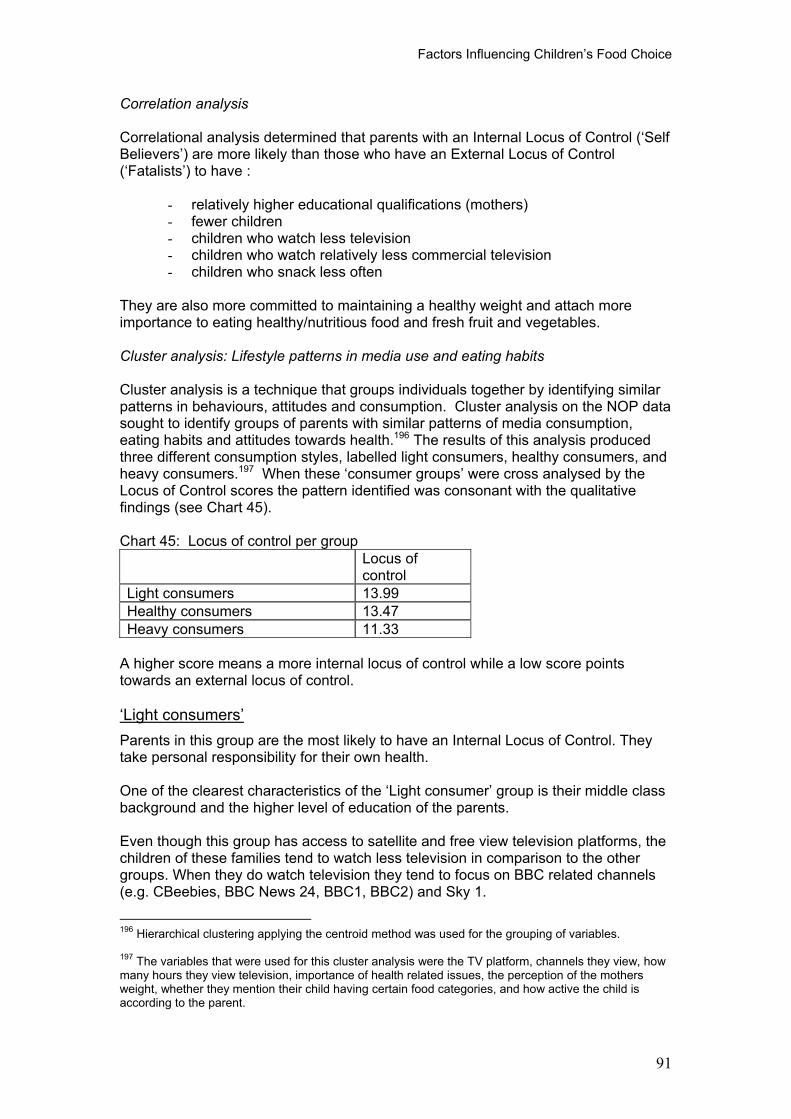
Factors Influencing Children�s Food Choice
91
Correlation analysis
Correlational analysis determined that parents with an Internal Locus of Control (�Self Believers�) are more likely than those who have an External Locus of Control (�Fatalists�) to have :
- relatively higher educational qualifications (mothers) - fewer children - children who watch less television - children who watch relatively less commercial television - children who snack less often
They are also more committed to maintaining a healthy weight and attach more importance to eating healthy/nutritious food and fresh fruit and vegetables.
Cluster analysis: Lifestyle patterns in media use and eating habits
Cluster analysis is a technique that groups individuals together by identifying similar patterns in behaviours, attitudes and consumption. Cluster analysis on the NOP data sought to identify groups of parents with similar patterns of media consumption, eating habits and attitudes towards health.196 The results of this analysis produced three different consumption styles, labelled light consumers, healthy consumers, and heavy consumers.197 When these �consumer groups� were cross analysed by the Locus of Control scores the pattern identified was consonant with the qualitative findings (see Chart 45).
Chart 45: Locus of control per group Locus of control
Light consumers 13.99 Healthy consumers 13.47 Heavy consumers 11.33
A higher score means a more internal locus of control while a low score points towards an external locus of control.
�Light consumers�Parents in this group are the most likely to have an Internal Locus of Control. They take personal responsibility for their own health.
One of the clearest characteristics of the �Light consumer� group is their middle class background and the higher level of education of the parents.
Even though this group has access to satellite and free view television platforms, the children of these families tend to watch less television in comparison to the other groups. When they do watch television they tend to focus on BBC related channels (e.g. CBeebies, BBC News 24, BBC1, BBC2) and Sky 1.
196 Hierarchical clustering applying the centroid method was used for the grouping of variables.
197 The variables that were used for this cluster analysis were the TV platform, channels they view, how many hours they view television, importance of health related issues, the perception of the mothers weight, whether they mention their child having certain food categories, and how active the child is according to the parent.
Factors Influencing Children�s Food Choice
92
In comparison to the other groups, these family types are intermediate in their perception of the importance of healthy living habits. When it comes to actual eating patterns this group is on the healthy side of the spectrum indicating more eating of vegetables than the other groups and a relatively high consumption of fruits. However, they also record fairly high levels of consumption for HFSS foods.
�Healthy consumers��Healthy consumers� also show a tendency towards an Internal Locus of Control, although they score slightly lower than �Light consumers�.
This group is middle/lower class, has parents with middle education levels and very young children. Their access to other media, such as computers or the Internet is lower than in the other groups
�Healthy consumers� are more likely than the other two groups to have only terrestrial television. This limits the number of channels that they watch but not their viewing time. The children of these households are heavy viewers of non-commercial channels. Moreover, their heavy viewing is concentrated on just a few channels; within the range of terrestrial channels they are more likely than the other groups to watch Channels 4 and 5.
The healthy consumer group combines its heavy terrestrial viewing with the attribution of great importance to a whole range of issues related to healthy eating and a more frequent perception that the mother in the family is underweight.
They are less likely to report their children eating any of the categories of food, with the exception of soft drinks. There is a general sense of healthy living in this type of family since they also perceive their child to be slightly more active than the others and they have lower BMI scores.
�Heavy consumers�The Locus of Control is more external in this group. They, like the �Fatalist� mothers in the qualitative research, tend to believe that external factors determine their health.
This group tends to come from the middle or lower social grades. The parents overall have fewer years of education and the children are older.
�Heavy consumers� have high levels of access, not only to other media, but also to different television platforms. They are more likely than the other groups to have cable and satellite and are heavy viewers of both digital and terrestrial channels. Channel 5 and 4, and the commercial BBC related channels are less popular. They are much more likely than the other groups to watch sports, music, and non-BBC children�s channels.
�Heavy consumers� tend to attach less importance than the other groups to all kinds of issues related to healthy eating. They also show unhealthy eating patterns in that they are higher than the other groups in their mention of confectionery foods and fast food. In general they show high levels of consumption for both food and media in comparison to the other groups. However, they do report lower levels of consumption
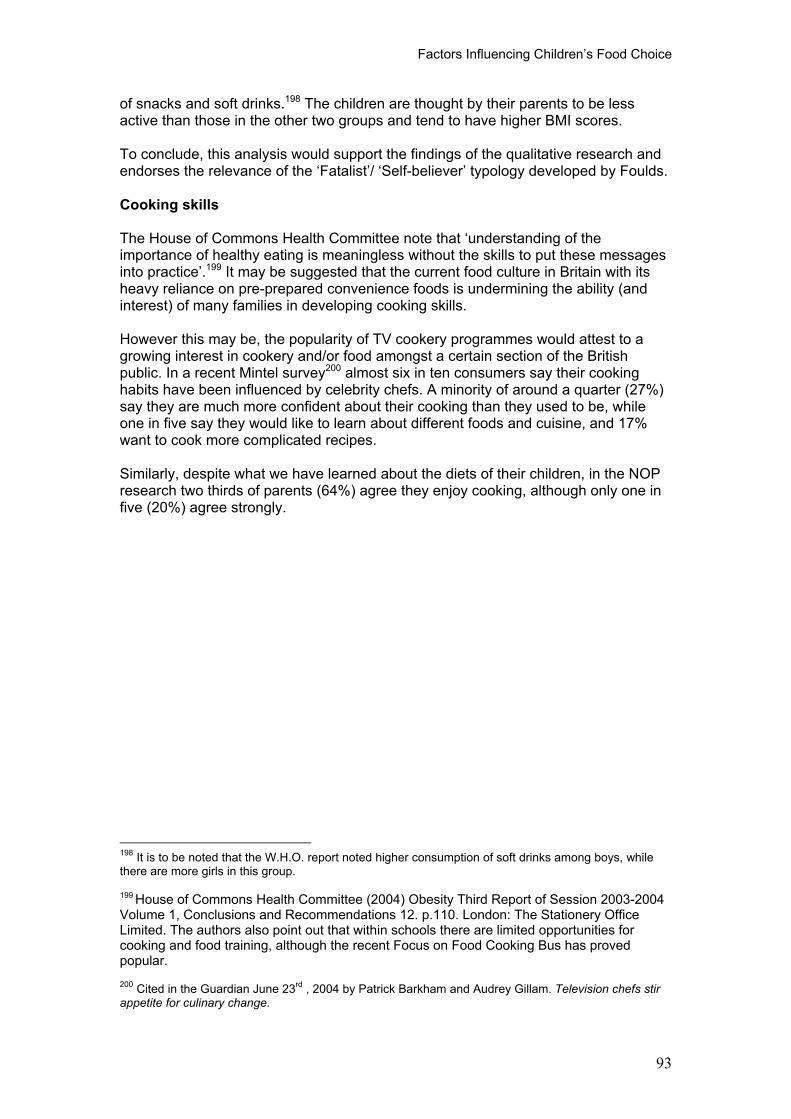
Factors Influencing Children�s Food Choice
93
of snacks and soft drinks.198 The children are thought by their parents to be less active than those in the other two groups and tend to have higher BMI scores.
To conclude, this analysis would support the findings of the qualitative research and endorses the relevance of the �Fatalist�/ �Self-believer� typology developed by Foulds.
Cooking skills
The House of Commons Health Committee note that �understanding of the importance of healthy eating is meaningless without the skills to put these messages into practice�.199 It may be suggested that the current food culture in Britain with its heavy reliance on pre-prepared convenience foods is undermining the ability (and interest) of many families in developing cooking skills.
However this may be, the popularity of TV cookery programmes would attest to a growing interest in cookery and/or food amongst a certain section of the British public. In a recent Mintel survey200 almost six in ten consumers say their cooking habits have been influenced by celebrity chefs. A minority of around a quarter (27%) say they are much more confident about their cooking than they used to be, while one in five say they would like to learn about different foods and cuisine, and 17% want to cook more complicated recipes.
Similarly, despite what we have learned about the diets of their children, in the NOP research two thirds of parents (64%) agree they enjoy cooking, although only one in five (20%) agree strongly.
198 It is to be noted that the W.H.O. report noted higher consumption of soft drinks among boys, while there are more girls in this group.
199 House of Commons Health Committee (2004) Obesity Third Report of Session 2003-2004 Volume 1, Conclusions and Recommendations 12. p.110. London: The Stationery Office Limited. The authors also point out that within schools there are limited opportunities for cooking and food training, although the recent Focus on Food Cooking Bus has proved popular. 200 Cited in the Guardian June 23rd , 2004 by Patrick Barkham and Audrey Gillam. Television chefs stir appetite for culinary change.
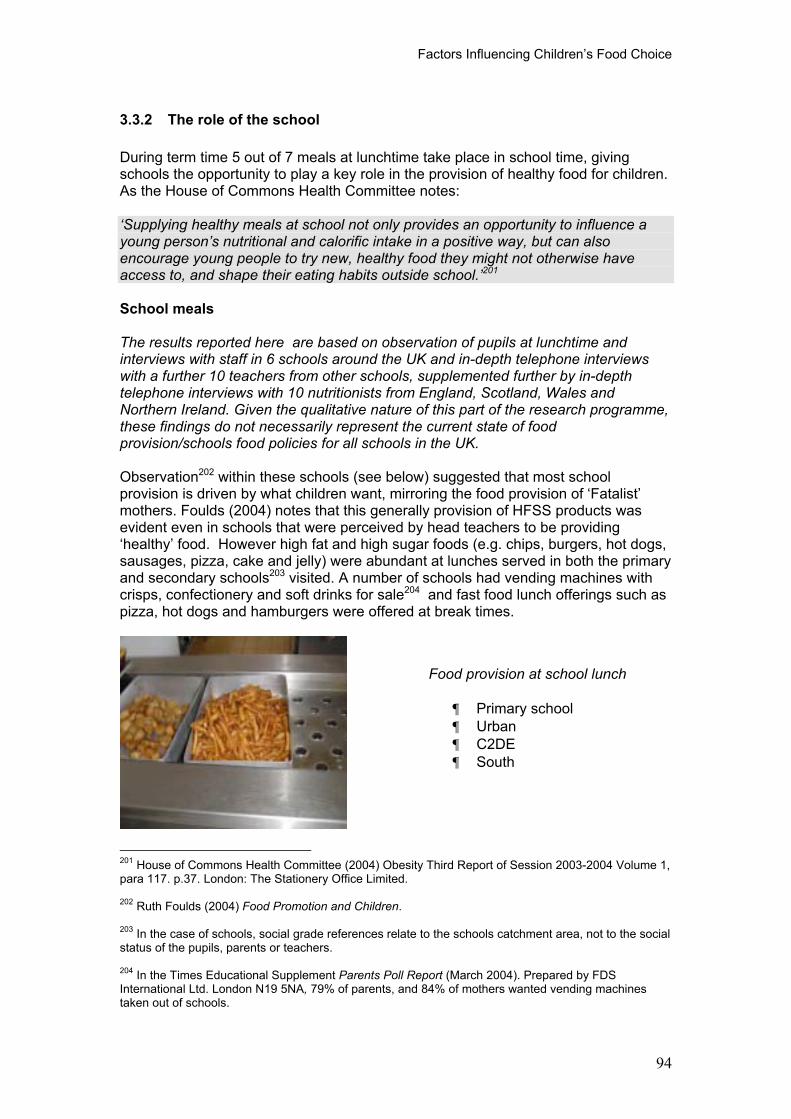
Factors Influencing Children�s Food Choice
94
3.3.2 The role of the school
During term time 5 out of 7 meals at lunchtime take place in school time, giving schools the opportunity to play a key role in the provision of healthy food for children. As the House of Commons Health Committee notes:
�Supplying healthy meals at school not only provides an opportunity to influence a young person�s nutritional and calorific intake in a positive way, but can also encourage young people to try new, healthy food they might not otherwise have access to, and shape their eating habits outside school.�201
School meals
The results reported here are based on observation of pupils at lunchtime and interviews with staff in 6 schools around the UK and in-depth telephone interviews with a further 10 teachers from other schools, supplemented further by in-depth telephone interviews with 10 nutritionists from England, Scotland, Wales and Northern Ireland. Given the qualitative nature of this part of the research programme, these findings do not necessarily represent the current state of food provision/schools food policies for all schools in the UK.
Observation202 within these schools (see below) suggested that most school provision is driven by what children want, mirroring the food provision of �Fatalist� mothers. Foulds (2004) notes that this generally provision of HFSS products was evident even in schools that were perceived by head teachers to be providing �healthy� food. However high fat and high sugar foods (e.g. chips, burgers, hot dogs, sausages, pizza, cake and jelly) were abundant at lunches served in both the primary and secondary schools203 visited. A number of schools had vending machines with crisps, confectionery and soft drinks for sale204 and fast food lunch offerings such as pizza, hot dogs and hamburgers were offered at break times.
201 House of Commons Health Committee (2004) Obesity Third Report of Session 2003-2004 Volume 1, para 117. p.37. London: The Stationery Office Limited.
202 Ruth Foulds (2004) Food Promotion and Children.
203 In the case of schools, social grade references relate to the schools catchment area, not to the social status of the pupils, parents or teachers.
204 In the Times Educational Supplement Parents Poll Report (March 2004). Prepared by FDS International Ltd. London N19 5NA, 79% of parents, and 84% of mothers wanted vending machines taken out of schools.
Food provision at school lunch
¶ Primary school ¶ Urban ¶ C2DE ¶ South
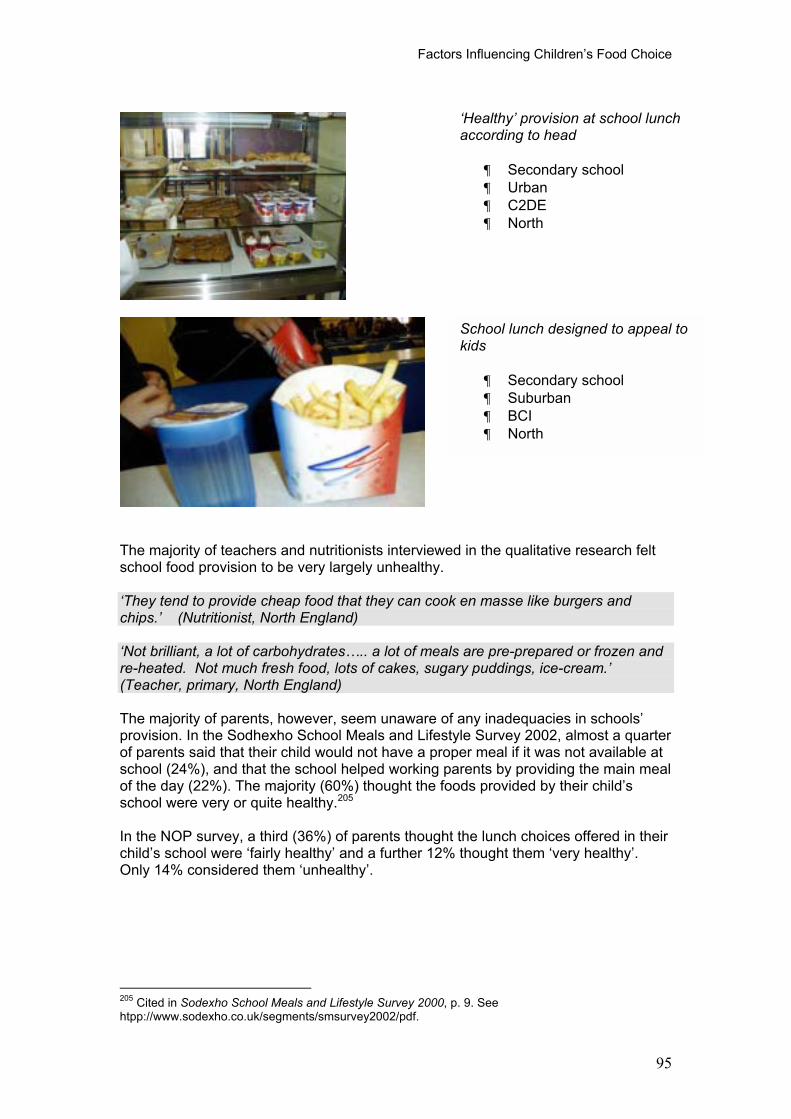
Factors Influencing Children�s Food Choice
95
The majority of teachers and nutritionists interviewed in the qualitative research felt school food provision to be very largely unhealthy.
�They tend to provide cheap food that they can cook en masse like burgers and chips.� (Nutritionist, North England)
�Not brilliant, a lot of carbohydrates�.. a lot of meals are pre-prepared or frozen and re-heated. Not much fresh food, lots of cakes, sugary puddings, ice-cream.� (Teacher, primary, North England)
The majority of parents, however, seem unaware of any inadequacies in schools� provision. In the Sodhexho School Meals and Lifestyle Survey 2002, almost a quarter of parents said that their child would not have a proper meal if it was not available at school (24%), and that the school helped working parents by providing the main meal of the day (22%). The majority (60%) thought the foods provided by their child�s school were very or quite healthy.205
In the NOP survey, a third (36%) of parents thought the lunch choices offered in their child�s school were �fairly healthy� and a further 12% thought them �very healthy�. Only 14% considered them �unhealthy�.
205 Cited in Sodexho School Meals and Lifestyle Survey 2000, p. 9. See htpp://www.sodexho.co.uk/segments/smsurvey2002/pdf.
School lunch designed to appeal to kids
¶ Secondary school ¶ Suburban ¶ BCI ¶ North
�Healthy� provision at school lunch according to head
¶ Secondary school ¶ Urban ¶ C2DE ¶ North
Factors Influencing Children�s Food Choice
96
Packed lunch
Foulds (2004) also found that schools have few, if any, rules regarding the food pupils bring in to eat during the school day. She notes that packed lunches and snacks brought in for breaks at school contained �a proliferation of processed foods and branded goods�. The photograph below of a rubbish bin at the end of a lunch session at a primary school attests eloquently to the abundance of brands present inpacked lunches. While many children did bring sandwiches (often made with white bread and often with a jam or chocolate spread filling) most other packed lunch items were HFSS foods.
As we have seen (Chart 34), the TNS Family Food Panel analysis also shows that in children�s lunchboxes sandwiches and salty snacks are commonplace, and chocolate biscuits feature on around a third of occasions.
Both the NOP survey and the TNS Family Food Panel identify lunchboxes as particularly likely to contain fruit (see Charts 32 and 34). In the qualitative research fruit did figure in a number of lunchboxes, but often be uneaten or partly eaten.
(Primary school/urban/C2DE/South)
Moreover, in the qualitative research Foulds (2004) found little active supervision of what children choose to eat at lunchtimes in schools in our research. Teachers appeared to see their role with regard to children�s eating as being educational, with formal coverage of the topic in classrooms, encouraging pupils to make healthy food choices. Schools in our sample did not, however, lead by example. Their role as regards school provision (often in the hands of outside caterers) and in laying down rules about food brought in by pupils, was largely unacknowledged.
Barriers to healthier provision in schools
The House of Commons Health Committee stress the importance of what children eat at school, but describe the actual school meals provision at present as a missed opportunity:
�Supplying healthy meals at school not only provides an opportunity to influence a young person�s calorific intake in a positive way, but can also encourage young people to try new, healthy food they might not otherwise have access to, and shape their eating habits outside school. However our evidence suggests that, far from doing this, school catering arrangements allow children to eat very unhealthily. The
Factors Influencing Children�s Food Choice
97
prevalence of cafeteria-style food outlets that allow pupils to opt out of very healthy choices in favour of �unhealthy� ones remains high in schools and a report by the Consumers� Association argued that the majority of school lunch menus �read like fast food menus�.�206
In addition, the Committee express surprise at the full extent of food promotion now taking place in schools and deep concern over recent sponsorship initiatives, such as those by Cadbury�s and Walkers, which rewarded children for eating their products with sports equipment for school.
�We feel that the school environment can have a strong influence over children�s developing nutritional habits ... Healthy eating messages learnt through the national curriculum and Government healthy eating initiatives such as the schools fruit campaign will be contradicted and undermined if, within that same school environment, children are exposed to sponsorship messages from unhealthy food manufacturers, and given access to vending machines selling unhealthy products.�207
Foulds (2004) notes that finance is a key barrier to healthier provision by schools. If their food provision is to be cost-effective, schools are pushed towards selling �unhealthy� foods, as these are what children like, want and will buy. Vending machines, for example, bring in much needed income.208
��we got just over £5,000 income from the vending machines, a significant amount of money to lose�� (Head teacher, secondary school, suburban, BC1, North England)
The provision in schools may further disadvantage poorer children, for whom lunch may well be the main meal of the day. The pricing of food in some schools can mean that the free meal allowance is not enough.
�I am sometimes concerned that the free meals children need to top up their allowance in order to get a proper meal and a drink. We�ve considered a package deal � with a sandwich and a drink in a bag � but we couldn�t price it�. It was too expensive for us.)� (Catering supervisor/secondary school/ BC1/ South England)
Schools also often lack control over food provision. A number of head teachers and teachers speak about contracted catering companies holding the reins in terms of what food is provided. These companies can be very resistant to moves towards healthier provision that may be less popular with pupils and affect the profits or financial viability of their operation.
Foulds (2004), however, found at least one example where a scheme to provide free fruit was having considerable success.
�They love it � the idea of getting fruit sitting in class (at break)�.. They can help themselves to as much fruit as they like (at lunch).� (Administrative assistant, primary, urban, C2DE, Scotland)
206 House of Commons Health Committee (2004) Obesity Third Report of Session 2003-2004 Volume 1, para 117. p.37.
207 House of Commons Health Committee (2004) Obesity Third Report of Session 2003-2004 Volume 1, para 199. p.37.
208 Schools may receive an income of £10-15,000 per annum. See www.laca.co.uk.
Factors Influencing Children�s Food Choice
98
The Health Committee also point to the success of a pilot study funded by the FSA, in which vending machines were installed which provided healthier drinks such as milk, water and fruit juice.209 During the 24 week trial approximately 70,000 healthier drinks were bought in the 12 schools involved. Such interventions suggest that, given the option, some children at least some of the time will make healthier choices.
Summary
Factors influencing children�s food choice
Role of parents
The overwhelming majority of parents (80%) in the NOP survey say parents themselves have �a great deal� of responsibility for the situation outlined in the recent publicity about children�s diets. However other groups are also seen as having an important part to play, in particular schools (52%) and food manufacturers (43%). Just one third see the Government (33%) and the media (32%) as having �a great deal of responsibility� and even fewer the supermarkets (28%) and broadcasters (24%).
Asked which ONE of the same groups could do most to ensure that children eat healthily, �parents/family� are again named by the majority (55%). Only a small minority name food manufacturers (16%) and schools (14%). Very few name the media (5%0, the Government (4%), supermarkets (3%) and the broadcasters (1%).
The majority of parents (more often those from lower socio-economic groups) do however defer to their children�s food preferences, and tend to rely more on processed, HFSS foods. Only a minority of parents (usually from higher socio-economic groups) seem to exercise effective control over their children�s food choices.
The role of the school
There is formal coverage of diet and nutrition in classrooms, where teachers educate pupils about healthy food choices. On the other hand, the qualitative research suggests there may be little active supervision of what children actually choose to eat at lunchtimes in schools. The school�s role as regards teaching by example seemed to be largely unacknowledged.
Most school provision appears to be driven by what children want and can be seen as giving a seal of approval to HFSS products. Many schools have few, if any, rules regarding the food pupils bring in to eat during the school day. Packed lunches and snacks brought in for breaks at school often contain branded, processed, and HFSS foods.
Most parents are happy with their child�s school�s provision.
209 http://www.food.gov.uk/multimedia/pdfs/vendingreport.pdf.
Role of TV Advertising
99
3.4 The role of television advertising
In this section we turn to previous and newly commissioned research on the effects of television advertising, and ask:
¶ Does academic research show any significant effects of TV advertising on food preference, consumption and behaviour? (section 3.4.1)
¶ What is the relative importance of TV advertising in the UK, compared with other influences on food preference, consumption and behaviour? (section 3.4.2)
¶ A discussion of the indirect effects of advertising and the associated problems of measurement, drawing on the literature review commissioned by Ofcom (section 3.4.3)
3.4.1 The effects of television advertising
Television viewing
Among the many influences on obesity, television viewing is consistently reported as a key factor. Surveys confirm that hours spent in television viewing correlate with measures of poor diet, poor health and obesity among both children and adults. Three explanations for this have been offered:
- television viewing is a sedentary activity that reduces metabolic rates and displaces physical exercise. 210
- television viewing is associated with frequent snacking, pre-prepared meals and/or fast food consumption211
- television viewing includes exposure to advertisements for HFSS products.212
There is support for each of these explanations213, although little empirical research attempts to disentangle them. Most expert commentators appear to assume that all three have some purchase. Exercise levels, meal habits and exposure to advertising each make an independent contribution to accounting for variation in food choice, health and obesity, and they may interact with each other, thereby also indirectly affecting these outcome measures among children.
210 Kaiser (2004) notes �while logic suggests that extensive television viewing is part of a more sedentary lifestyle, the evidence for this relationship has been surprisingly weak to date�.
211 Coon, Goldberg, Rogers and Tucker (2001).
212 See Hastings et al (2003).
213 Robinson (2001); Proctor, Moore, Gao, Cupples, Bradlee, Hood and Ellison (2003); Dietz and Gortmaker (1985); Kleges, Shelton and Kleges (1993).
Role of TV Advertising
100
Television advertising research: an imperfect field
Studies of television advertising dominate the published literature on food promotions to children.214 This body of research extends over forty or more years, and has been produced in response to fluctuating levels of concern in different countries and in order to inform varying policy options. There are however many gaps and biases.215
Little has been produced in the UK and little attention has been paid to other promotional channels, apart from television, or to the effects of cross-promotion. Most research concerns direct effects rather than indirect effects and examines the effects of promoting �unhealthy� rather than �healthy� foods. Children are defined differently in different studies and so forth.
There are also methodological weaknesses. Many studies are designed to identify correlations not causes. Possible confounding factors tend to be examined where convenient to measure (e.g. age, gender) rather than appropriate (e.g. parental diet, peers� exposure to media). There are a number of studies with small samples, simple measures, paucity of longitudinal designs, and few replications.
However, as Livingstone (February, 2004) points out, researchers are not to be blamed for failure to design the perfect test. Neither experimental research nor research in a naturalistic setting is ever likely to produce definitive answers. Experiments can demonstrate causality, but are vulnerable to the charge that they do not realistically reflect the conditions of everyday life � in other words, their findings are not generalisable. On the other hand attempts to conduct naturalistic research or �field experiments� typically run into difficulties. First, it almost impossible to eliminate all the confounding factors that distinguish children exposed to many, as opposed to a few, promotional messages. We cannot therefore be sure that any observed effects are due to variation in message exposure only. Secondly, there are serious ethical difficulties in exposing children to hypothesised harmful influences, making it unlikely that such an experiment would be permitted.
Direct effects of exposure to TV advertising
Notwithstanding the many and hotly contested arguments regarding the methodology, comprehensiveness, bias, and so forth of academic research in this area, Livingstone (February, 2004) concludes that �a careful reading of apparently conflicting reports suggests that there exists a tacit consensus across the field in favour of modest direct effects� of TV advertising on children�s food preferences, consumption and behaviour and that �on a precautionary but proportionate basis, causality may be reasonably inferred from consensus amongst a variety of approaches�.216
Regrettably the research literature does not make a distinction between interventions which result in category as opposed to brand switching. Instead it distinguishes between �healthy� and �unhealthy� food choices. The effects found, therefore, are generally effects in which it is demonstrated that, following watching advertisements for a HFSS product, children are more likely to choose/prefer/ask for such a product,
214 See Hastings et al, 2003, p6.
215 See Hastings et al (2003). Paliwoda et al (2003): Young, B. (2003): Livingstone (February 2004).
216 Sonia Livingstone (2004) A commentary on the research evidence regarding the effects of food promotion on children. See Appendix 1.
Role of TV Advertising
101
compared with various other options. These other options generally include �healthier� foods, but may also include other �unhealthy�, but non-advertised foods.217
There is, moreover, little evidence regarding the size of this effect, other than it is small.218 One much-cited US study found that food advertising, in the broad array of factors that influence eating habits, independently contributes to 2% of the variance explained.219 This is consistent with findings in other domains of media effects studies. For example, in the case of TV violence, meta-analysis shows that both correlational and experimental studies tend to reveal fairly consistent but fairly modest effects, accounting for some 5% of the variance in the dependent variable.
3.4.2 The relative importance of TV advertising: what parents and children say
The UK-wide NOP survey commissioned by Ofcom provides a unique opportunity to examine, using one data source, the relative impact of exposure to television advertising on children�s food-related preferences, consumption and behaviour, in the context of a wide spectrum of other potential influences. The survey allows us to approach this issue in a number of different ways. We examine:
- reasons for food choice (child�s and parent�s view) - reasons for putting food/drink in shopping basket (parent�s view) - where adverts usually seen (parent�s view) - reasons for brand switching (parent�s view) - the relationship between consumption of HFSS food and amount of
television viewed
217 Personal communication from Sonia Livingstone. The House of Commons Health Committee on the other hand have little doubt that category switching as well as brand switching is intended by advertisers. See Obesity report, para 112, p36.
218 As Sonia Livingstone (2004) points out �George Gerbner argued persuasively that, since �television tells most of the stories to most of the people most of the time�, experiments comparing those who receive a short television exposure with a control group who do not are unlikely to demonstrate significant effects.
219 Hearold, S. (1986). A synthesis of 1043 effects of television on social behaviour. In G. Comstock (Ed.), Public Communications and Behaviour: Volume 1 (Vol. 1, pp. 65-133). New York: Academic Press. Hearold conducted a very large-scale meta-analysis of 1043 media effects reported in 230 studies with over 100,000 subjects over the past 60 years. In general, the correlations between viewing and effect vary between 0.1 and 0.3.
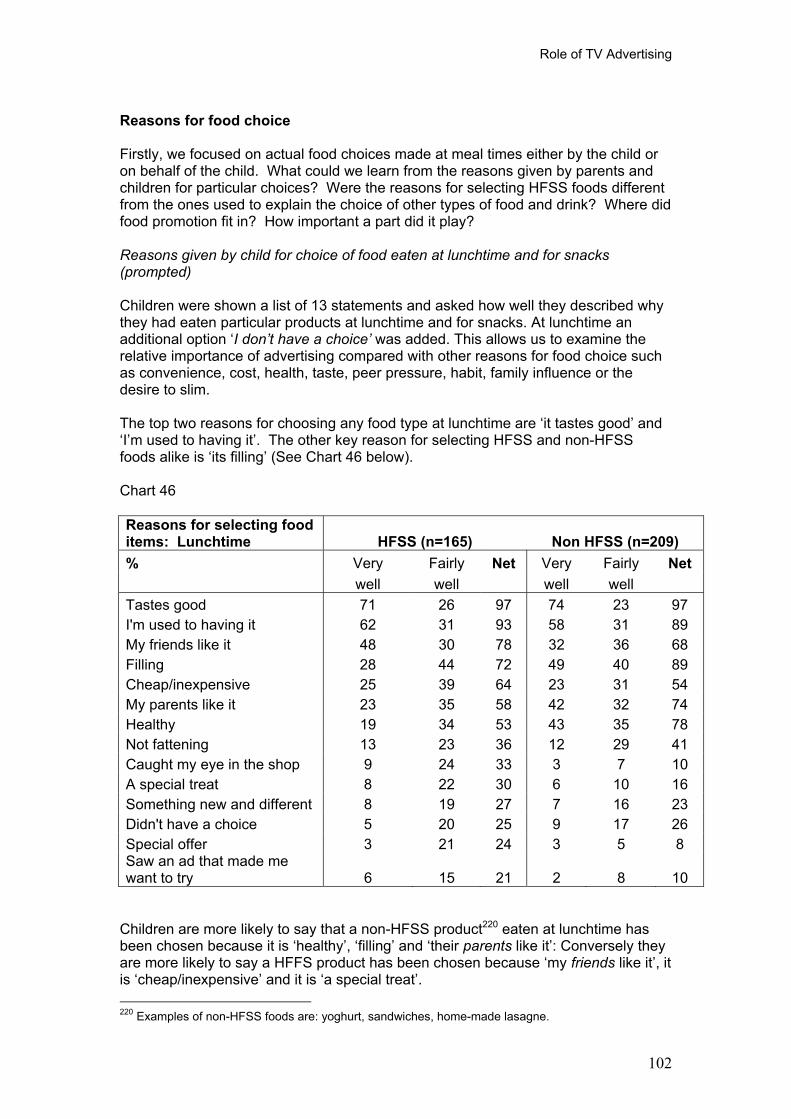
Role of TV Advertising
102
Reasons for food choice
Firstly, we focused on actual food choices made at meal times either by the child or on behalf of the child. What could we learn from the reasons given by parents and children for particular choices? Were the reasons for selecting HFSS foods different from the ones used to explain the choice of other types of food and drink? Where did food promotion fit in? How important a part did it play?
Reasons given by child for choice of food eaten at lunchtime and for snacks (prompted)
Children were shown a list of 13 statements and asked how well they described why they had eaten particular products at lunchtime and for snacks. At lunchtime an additional option �I don�t have a choice� was added. This allows us to examine the relative importance of advertising compared with other reasons for food choice such as convenience, cost, health, taste, peer pressure, habit, family influence or the desire to slim.
The top two reasons for choosing any food type at lunchtime are �it tastes good� and �I�m used to having it�. The other key reason for selecting HFSS and non-HFSS foods alike is �its filling� (See Chart 46 below).
Chart 46
Reasons for selecting food items: Lunchtime HFSS (n=165) Non HFSS (n=209) % Very Fairly Net Very Fairly Net
well well well well Tastes good 71 26 97 74 23 97 I'm used to having it 62 31 93 58 31 89 My friends like it 48 30 78 32 36 68 Filling 28 44 72 49 40 89 Cheap/inexpensive 25 39 64 23 31 54 My parents like it 23 35 58 42 32 74 Healthy 19 34 53 43 35 78 Not fattening 13 23 36 12 29 41 Caught my eye in the shop 9 24 33 3 7 10 A special treat 8 22 30 6 10 16 Something new and different 8 19 27 7 16 23 Didn't have a choice 5 20 25 9 17 26 Special offer 3 21 24 3 5 8 Saw an ad that made me want to try 6 15 21 2 8 10
Children are more likely to say that a non-HFSS product220 eaten at lunchtime has been chosen because it is �healthy�, �filling� and �their parents like it�: Conversely they are more likely to say a HFFS product has been chosen because �my friends like it�, it is �cheap/inexpensive� and it is �a special treat�.
220 Examples of non-HFSS foods are: yoghurt, sandwiches, home-made lasagne.
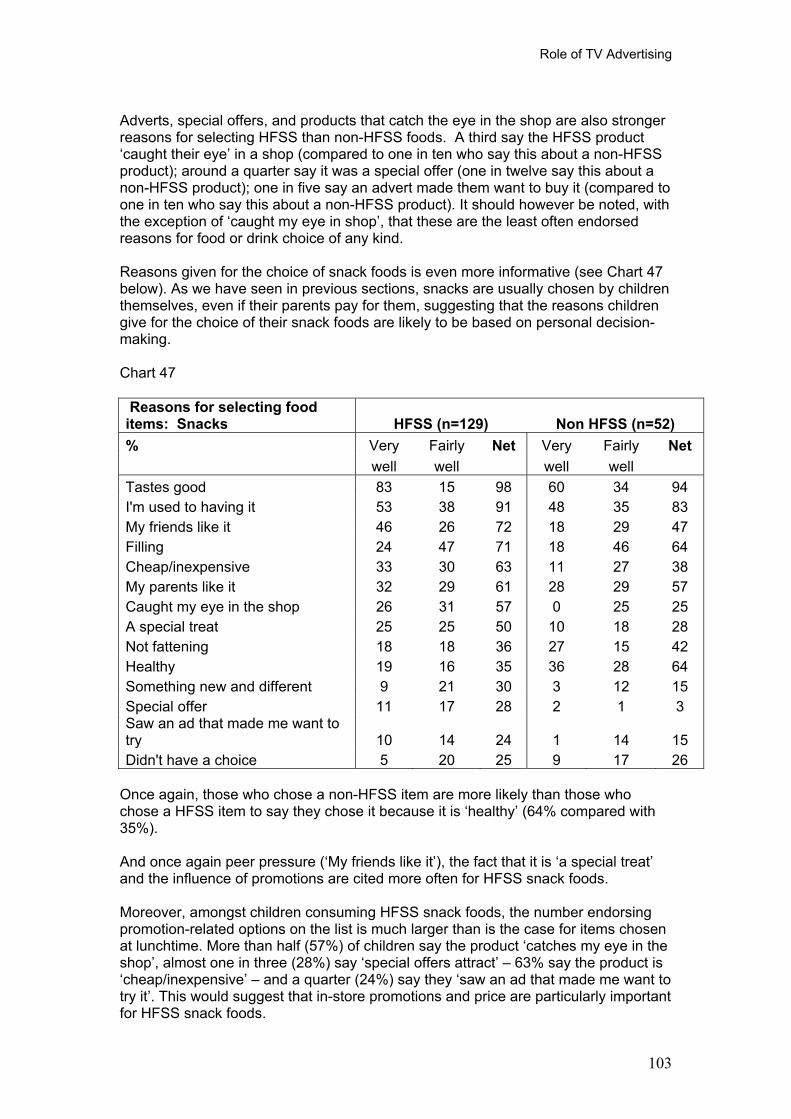
Role of TV Advertising
103
Adverts, special offers, and products that catch the eye in the shop are also stronger reasons for selecting HFSS than non-HFSS foods. A third say the HFSS product �caught their eye� in a shop (compared to one in ten who say this about a non-HFSS product); around a quarter say it was a special offer (one in twelve say this about a non-HFSS product); one in five say an advert made them want to buy it (compared to one in ten who say this about a non-HFSS product). It should however be noted, with the exception of �caught my eye in shop�, that these are the least often endorsed reasons for food or drink choice of any kind.
Reasons given for the choice of snack foods is even more informative (see Chart 47 below). As we have seen in previous sections, snacks are usually chosen by children themselves, even if their parents pay for them, suggesting that the reasons children give for the choice of their snack foods are likely to be based on personal decision-making.
Chart 47
Reasons for selecting food items: Snacks HFSS (n=129) Non HFSS (n=52) % Very Fairly Net Very Fairly Net
well well well well Tastes good 83 15 98 60 34 94 I'm used to having it 53 38 91 48 35 83 My friends like it 46 26 72 18 29 47 Filling 24 47 71 18 46 64 Cheap/inexpensive 33 30 63 11 27 38 My parents like it 32 29 61 28 29 57 Caught my eye in the shop 26 31 57 0 25 25 A special treat 25 25 50 10 18 28 Not fattening 18 18 36 27 15 42 Healthy 19 16 35 36 28 64 Something new and different 9 21 30 3 12 15 Special offer 11 17 28 2 1 3 Saw an ad that made me want to try 10 14 24 1 14 15 Didn't have a choice 5 20 25 9 17 26
Once again, those who chose a non-HFSS item are more likely than those who chose a HFSS item to say they chose it because it is �healthy� (64% compared with 35%).
And once again peer pressure (�My friends like it�), the fact that it is �a special treat� and the influence of promotions are cited more often for HFSS snack foods.
Moreover, amongst children consuming HFSS snack foods, the number endorsing promotion-related options on the list is much larger than is the case for items chosen at lunchtime. More than half (57%) of children say the product �catches my eye in the shop�, almost one in three (28%) say �special offers attract� � 63% say the product is �cheap/inexpensive� � and a quarter (24%) say they �saw an ad that made me want to try it�. This would suggest that in-store promotions and price are particularly important for HFSS snack foods.
Role of TV Advertising
104
Reasons given by parent for choice of child�s food/drink (prompted)
Parents were shown a list of 13 reasons which might have influenced the choice of what the child ate at breakfast, lunchtime and in the evening. As with the previous list shown to children, this list included advertisements and promotions, making it possible to contextualise their effect compared with other influences, such as the child�s own taste and the healthiness, convenience or affordability of the product. There was one difference. Whereas children had the option �a special treat�, this was removed from list and �quick and easy to prepare� added. Parents were then asked:
�So we can get an idea of how important these reasons are for why <child> ended up having<food/drink> at <breakfast/lunchtime/in the evening> yesterday, please imagine you have 100 points to share between them. You can give no points to things that are not at all important. If only one thing is important, give all 100 points to that. Or you can share out the points among a number of reasons.�
Children�s own preference emerges as the most important reason for the provision of both HFSS and non-HFSS foods on all three meal occasions (see Charts 48, 49 and 50). Around a third of the points (between 30 to 37) are consistently allotted to �child likes it�.
The convenience of preparation comes a regular second, with �quick and easy to prepare� being assigned between 19 to 27 points.
The healthiness of the product with between 16 to 20 of the 100 points comes third for non-HFSS foods at breakfast and lunch but slides down the list to 7th position for HFSS foods during the evening meal. Only at breakfast time are HFSS foods given a sizeable proportion of points (13) for being �healthy�. Presumably many parents think of pre-sugared breakfast cereals as a healthy option. No other single reason averages more than 8 points.
Promotions and advertising, together with �slimming� are given the lowest ranking of all on each of the three meal occasions.
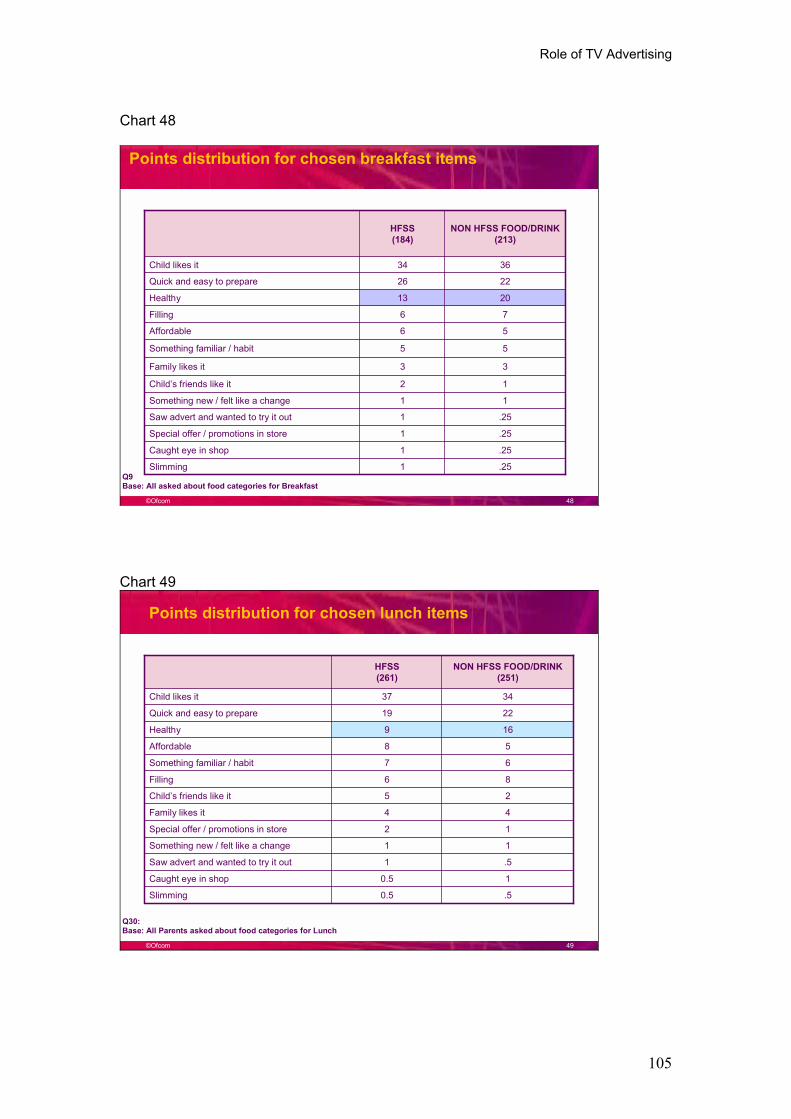
Role of TV Advertising
105
Chart 48
©Ofcom 48
Points distribution for chosen breakfast items
Base: All asked about food categories for BreakfastQ9
55Something familiar / habit
76Filling
2013Healthy
3634Child likes it
.251Caught eye in shop
.251Special offer / promotions in store
.251Saw advert and wanted to try it out
11Something new / felt like a change
33Family likes it
56Affordable
2226Quick and easy to prepare
.251Slimming
12Child�s friends like it
NON HFSS FOOD/DRINK(213)
HFSS (184)
Chart 49
©Ofcom 49
Points distribution for chosen lunch items
Base: All Parents asked about food categories for LunchQ30:
12Special offer / promotions in store
25Child�s friends like it
67Something familiar / habit
169Healthy
3437Child likes it
44Family likes it
86Filling
10.5Caught eye in shop
.51Saw advert and wanted to try it out
11Something new / felt like a change
58Affordable
2219Quick and easy to prepare
.50.5Slimming
NON HFSS FOOD/DRINK(251)
HFSS (261)
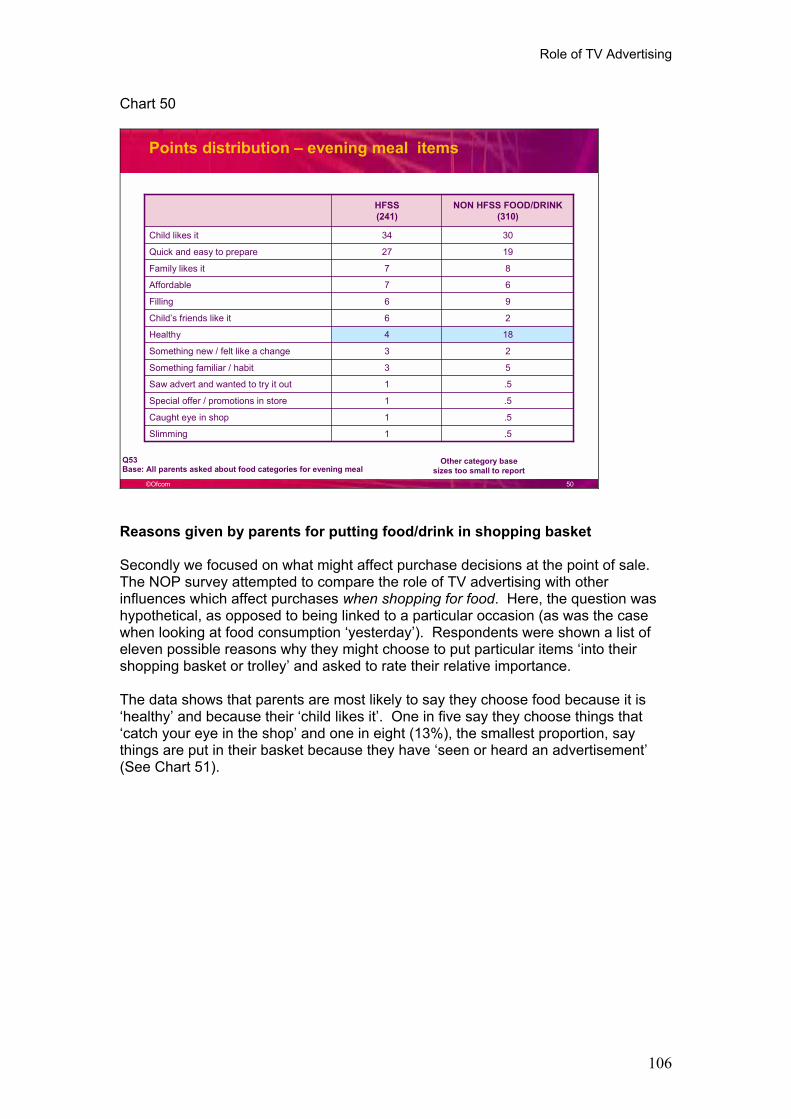
Role of TV Advertising
106
Chart 50
©Ofcom 50
Points distribution � evening meal items
Base: All parents asked about food categories for evening mealQ53
184Healthy
87Family likes it
3034Child likes it
96Filling
.51Caught eye in shop
.51Special offer / promotions in store
.51Saw advert and wanted to try it out
23Something new / felt like a change
26Child�s friends like it
67Affordable
1927Quick and easy to prepare
.51Slimming
53Something familiar / habit
NON HFSS FOOD/DRINK(310)
HFSS (241)
Other category base sizes too small to report
Reasons given by parents for putting food/drink in shopping basket
Secondly we focused on what might affect purchase decisions at the point of sale. The NOP survey attempted to compare the role of TV advertising with other influences which affect purchases when shopping for food. Here, the question was hypothetical, as opposed to being linked to a particular occasion (as was the case when looking at food consumption �yesterday�). Respondents were shown a list of eleven possible reasons why they might choose to put particular items �into their shopping basket or trolley� and asked to rate their relative importance.
The data shows that parents are most likely to say they choose food because it is �healthy� and because their �child likes it�. One in five say they choose things that �catch your eye in the shop� and one in eight (13%), the smallest proportion, say things are put in their basket because they have �seen or heard an advertisement� (See Chart 51).
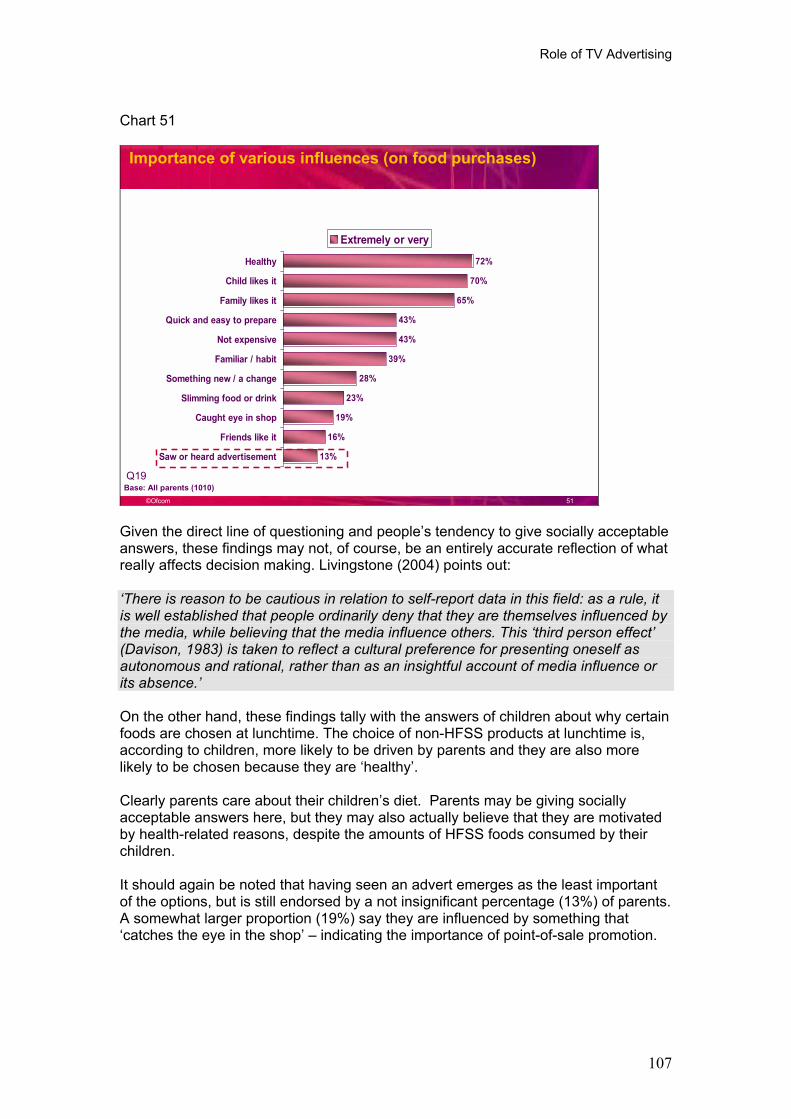
Role of TV Advertising
107
Chart 51
©Ofcom 51
72%
70%
65%
43%
43%
39%
28%
23%
19%
16%
13%
Healthy
Child likes it
Family likes it
Quick and easy to prepare
Not expensive
Familiar / habit
Something new / a change
Slimming food or drink
Caught eye in shop
Friends like it
Saw or heard advertisement
Extremely or very
Importance of various influences (on food purchases)
Base: All parents (1010)Q19
Given the direct line of questioning and people�s tendency to give socially acceptable answers, these findings may not, of course, be an entirely accurate reflection of what really affects decision making. Livingstone (2004) points out:
�There is reason to be cautious in relation to self-report data in this field: as a rule, it is well established that people ordinarily deny that they are themselves influenced by the media, while believing that the media influence others. This �third person effect� (Davison, 1983) is taken to reflect a cultural preference for presenting oneself as autonomous and rational, rather than as an insightful account of media influence or its absence.�
On the other hand, these findings tally with the answers of children about why certain foods are chosen at lunchtime. The choice of non-HFSS products at lunchtime is, according to children, more likely to be driven by parents and they are also more likely to be chosen because they are �healthy�.
Clearly parents care about their children�s diet. Parents may be giving socially acceptable answers here, but they may also actually believe that they are motivated by health-related reasons, despite the amounts of HFSS foods consumed by their children.
It should again be noted that having seen an advert emerges as the least important of the options, but is still endorsed by a not insignificant percentage (13%) of parents. A somewhat larger proportion (19%) say they are influenced by something that �catches the eye in the shop� � indicating the importance of point-of-sale promotion.
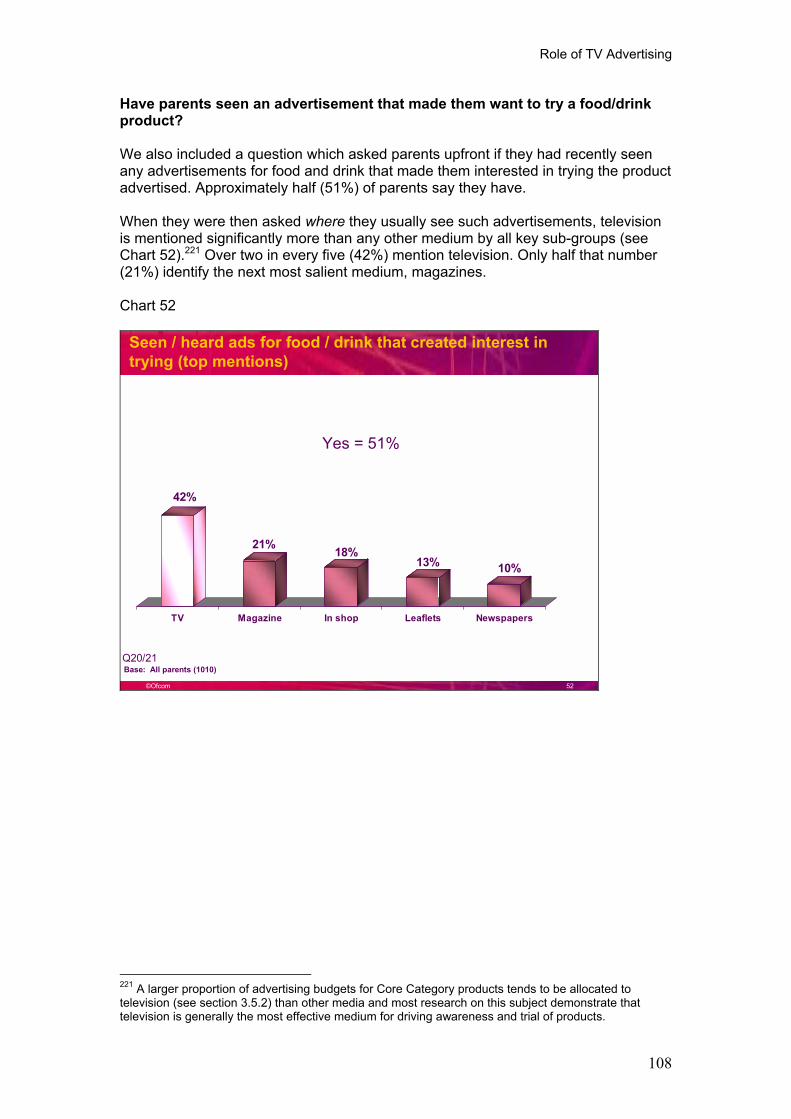
Role of TV Advertising
108
Have parents seen an advertisement that made them want to try a food/drink product?
We also included a question which asked parents upfront if they had recently seen any advertisements for food and drink that made them interested in trying the product advertised. Approximately half (51%) of parents say they have.
When they were then asked where they usually see such advertisements, television is mentioned significantly more than any other medium by all key sub-groups (see Chart 52).221 Over two in every five (42%) mention television. Only half that number (21%) identify the next most salient medium, magazines.
Chart 52
©Ofcom 52
42%
21% 18%13% 10%
TV Magazine In shop Leaflets Newspapers
Seen / heard ads for food / drink that created interest in trying (top mentions)
Base: All parents (1010)
Yes = 51%
Q20/21
221 A larger proportion of advertising budgets for Core Category products tends to be allocated to television (see section 3.5.2) than other media and most research on this subject demonstrate that television is generally the most effective medium for driving awareness and trial of products.
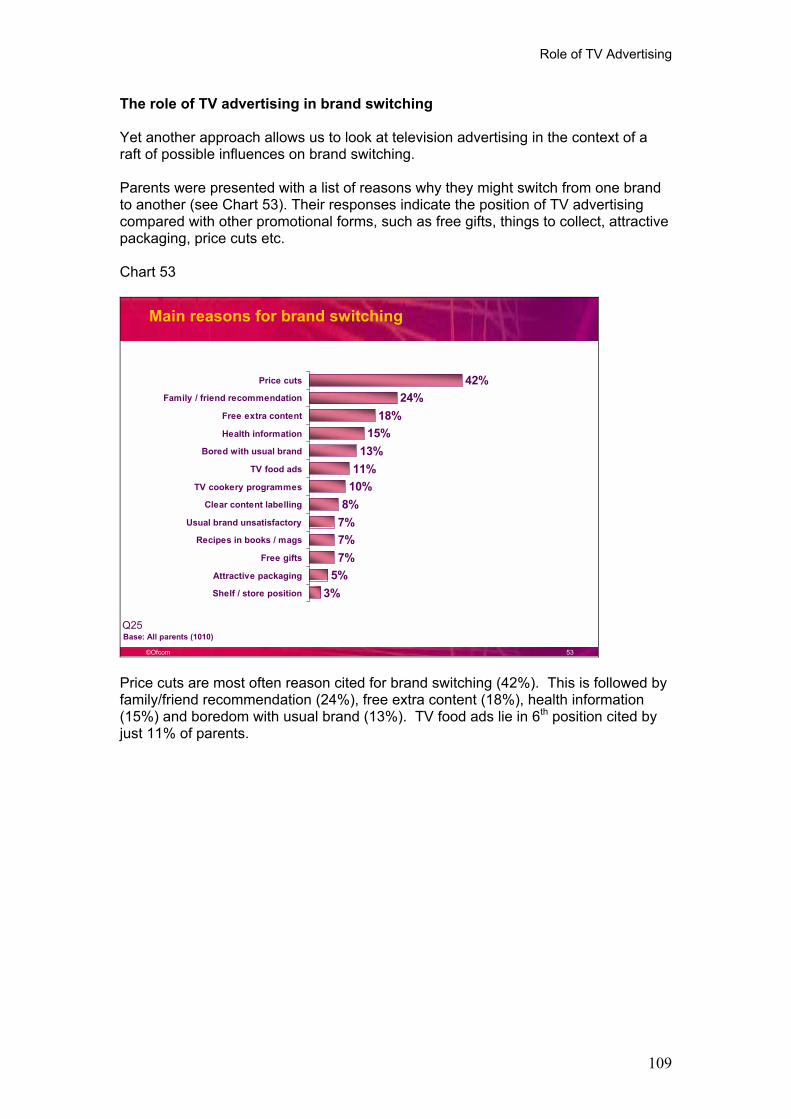
Role of TV Advertising
109
The role of TV advertising in brand switching
Yet another approach allows us to look at television advertising in the context of a raft of possible influences on brand switching.
Parents were presented with a list of reasons why they might switch from one brand to another (see Chart 53). Their responses indicate the position of TV advertising compared with other promotional forms, such as free gifts, things to collect, attractive packaging, price cuts etc.
Chart 53
©Ofcom 53
42%24%
18%15%
13%11%
10%8%
7%7%7%
5%3%
Price cuts
Family / friend recommendation
Free extra content
Health information
Bored with usual brand
TV food ads
TV cookery programmes
Clear content labelling
Usual brand unsatisfactory
Recipes in books / mags
Free gifts
Attractive packaging
Shelf / store position
Main reasons for brand switching
Base: All parents (1010)Q25
Price cuts are most often reason cited for brand switching (42%). This is followed by family/friend recommendation (24%), free extra content (18%), health information (15%) and boredom with usual brand (13%). TV food ads lie in 6th position cited by just 11% of parents.
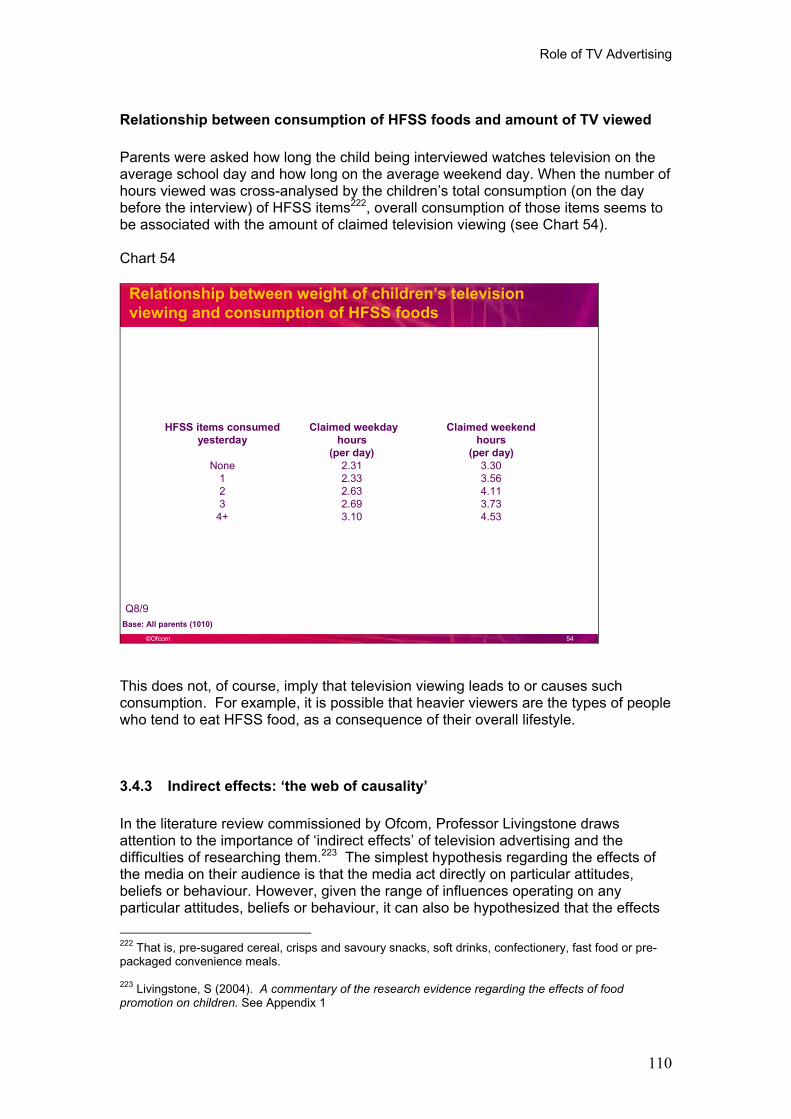
Role of TV Advertising
110
Relationship between consumption of HFSS foods and amount of TV viewed
Parents were asked how long the child being interviewed watches television on the average school day and how long on the average weekend day. When the number of hours viewed was cross-analysed by the children�s total consumption (on the day before the interview) of HFSS items222, overall consumption of those items seems to be associated with the amount of claimed television viewing (see Chart 54).
Chart 54
©Ofcom 54
Relationship between weight of children�s television viewing and consumption of HFSS foods
HFSS items consumed Claimed weekday Claimed weekendyesterday hours hours
(per day) (per day)None 2.31 3.30
1 2.33 3.562 2.63 4.113 2.69 3.73
4+ 3.10 4.53
Base: All parents (1010)
Q8/9
This does not, of course, imply that television viewing leads to or causes such consumption. For example, it is possible that heavier viewers are the types of people who tend to eat HFSS food, as a consequence of their overall lifestyle.
3.4.3 Indirect effects: �the web of causality�
In the literature review commissioned by Ofcom, Professor Livingstone draws attention to the importance of �indirect effects� of television advertising and the difficulties of researching them.223 The simplest hypothesis regarding the effects of the media on their audience is that the media act directly on particular attitudes, beliefs or behaviour. However, given the range of influences operating on any particular attitudes, beliefs or behaviour, it can also be hypothesized that the effects
222 That is, pre-sugared cereal, crisps and savoury snacks, soft drinks, confectionery, fast food or pre-packaged convenience meals.
223 Livingstone, S (2004). A commentary of the research evidence regarding the effects of food promotion on children. See Appendix 1
Role of TV Advertising
111
of the media work indirectly, first influencing mediating/other variables. These, in their turn, influence the attitude, belief or behaviour of interest. Thus a two-step process is envisaged, and research must seek not only the mediating variables but also establish the evidence for both steps of the process (media Ą mediating variable Ąeffect on audience).
Indirect effects are generally acknowledged to be important,224 but are less often researched. There are however some indicative studies.225 For example it has been shown that television may normalize the image of an �unhealthy� diet and consequently have an influence on �unhealthy� food choices.226 Television viewing can also influence meal habits, which in turn may affect diet.227 Advertising on TV can lead to children pestering their parents for products, which may, if they are successful, lead to increased consumption of �unhealthy� foods.228 Conversely, advertising, if mediated by parental comments, may have less effect.229 Similarly the consistent correlation between television viewing and �unhealthy� food choices and/or childhood obesity has been hypothesised as being mediated by displacement of physical exercise and increased snacking.230 TV programmes and advertising have also been implicated in encouraging unrealistic expectations of ideal body size, especially for teenage girls, resulting in discontent with body image and attempts to diet.231
Our qualitative research illustrates such indirect effects. Television advertising, according to parents, has an all-pervasive influence. It colours the views of parents and peers.
224 In the academic seminar convened to evaluate Professor Hastings�s report for the FSA (2004), it was concluded that �on the balance of evidence, the Hastings review had provided sufficient evidence to indicate a causal link between promotional activity and children�s food knowledge, preferences and behaviours.� Peer review concluded that the evidence is likely to understate the effects for two reasons � indirect effects and other marketing activity are insufficiently taken into account.
225 See Livingstone, S. and Helsper, E. (2004) Advertising �unhealthy� foods to children: Understanding Promotion In The Context Of Children�s Daily Lives. pp 27-29.
226 Reducing television viewing seems to stimulate fruit and vegetable consumption (Gortmaker, Peterson, Wiecha, Sobol, Dixit, Fox and Laird 1999, Boynton-Jarett, Thomas, Peterson, Wiecha, Sobol and Gortmaker 2003, Coon et al 2001) and is associated with unhealthy perceptions of nutrition (Signorielli and Staples 1997)
227 An association between viewing television while eating and the choice of easy to prepare meals shows that households that eat during viewing make less effort in feeding children and so, in turn, they eat fewer vegetables (Coon, Goldberg, Rogers and Tucker 2001).
228 Buijzen and Valkenburg (2003; see also Bandyopadhyay, Kindra and Sharp 2001) showed that the culture of advertising in general affects children�s materialism, and their purchase requests to parents and so affects the food choices parents make for their children.
229 The experiment by Galst (1980) also shows the helpful mediating role of adult comments during viewing television advertisements. The positive effect of adult comments when viewing raises questions of literacy (helping children understand the intentions behind advertising) and/or of social norms (permitting children to distance themselves from the normative claims of advertising (see also Boush 2001).
230 Utter, Neumark-Sztainer, Jeffrey and Story (2003)
231 For example, Maltby, Giles, Barber and McCutcheon (in press) found that intense worship of celebrities can lead to negative body images in teenage girls. Giles and Maltby (2004) found that interest in celebrities is related to decreasing attachment to parents, suggesting that media figures might take over from parents as teen role models.
Role of TV Advertising
112
�Everyone thinks that Sugar Puffs monster is quite cool.� Boy, AB, Aged 9-11, South England)
The use of celebrities and characters within television advertising helps to determine what is socially acceptable and influences young people in their search for a �cool� personal identity.
�It�s the fashion and everything, so it�s like I am drinking Pepsi, Beyoncé drinks that.� (Boy, C1C2, aged 11-13, North England)
�You think sports stars are cool and you want to be like them so you buy the product.� (Boy, C1C2, aged 13-15, Northern Ireland)
It primes viewers to take note of other forms of promotion.
�Sometimes when they see something on TV it�s not triggered until they go shopping.� Mother, AB, child aged 5-7, South England)
Interestingly, in the ITC�s qualitative research report Copycat Kids? (2000), two of the three effects attributed most commonly to television advertising by parents were indirect. As with television generally, parents thought television advertising �must have an effect� but had relatively few examples to offer. They identified one direct effect (copying of behaviour seen in advertisements) and two indirect effects � pester power and �a subliminal or very gradual effect on attitudes through communication of (often antisocial) ideas or cultural norms�. 232
�It�s very subtle isn�t it? You can�t point to one advert and say that has a major effect on children�s behaviour in the 20th century. It�s not like that, is it? It�s a subtle bombardment of many things, I think you�ve got to make sure that the right messages come across.�233
Moreover, in the two preceding sections of this report on the role of parents and schools, we have seen that the influence of food promotion has figured prominently. Many parents look to advertised brands to provide quality products and feed their children accordingly. Vending machines and sponsorship in schools provide a platform for advertisers, and school meals sell themselves to pupils by modelling themselves on commercial principles. When children and their parents point to the importance of in-store promotions, they may have been primed to notice these by having previously seen a television advert. Television advertising sits within a whole web of interconnected influences. It feeds into other forms of promotion and affects children not only directly, but indirectly, through their friends and parents, who also watch television and see adverts and then go on to have their own separate impact on children�s food choice.
232 ITC (2000), Copycat kids? The influence of Television Advertising on Children and Teenagers. p.33 http://www.ofcom.org.uk/research/consumer_audience_research/tv_audience_reports/copycat_kids.pdf
233 Comment from member of school staff. In Copycat kids? The influence of Television Advertising on Children and Teenagers. Report by Pam Hanley, ITC in conjunction with Wendy Hayward, Leah Sims, Joss Jones of The Qualitative Consultancy. p.47 October 2000.
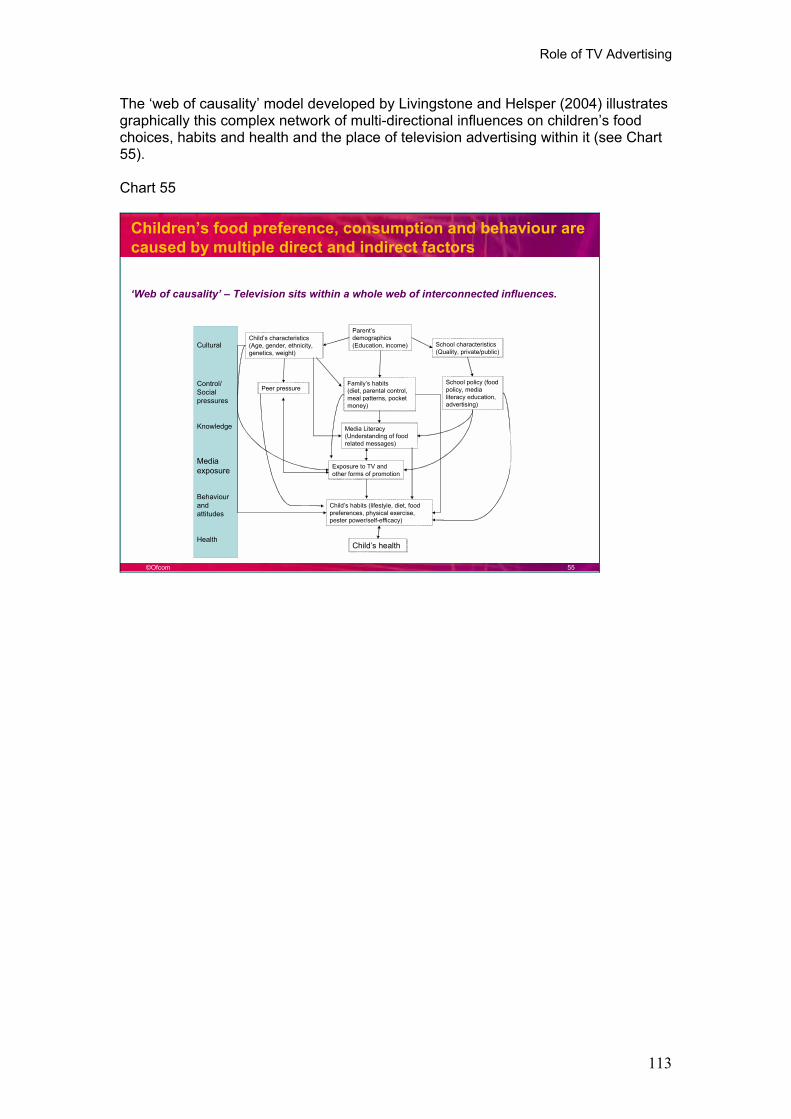
Role of TV Advertising
113
The �web of causality� model developed by Livingstone and Helsper (2004) illustrates graphically this complex network of multi-directional influences on children�s food choices, habits and health and the place of television advertising within it (see Chart 55).
Chart 55
©Ofcom 55
Cultural
Control/ Social pressures
Knowledge
Media exposure
Behaviour and attitudes
Health
School policy (food policy, media literacy education, advertising)
Child�s characteristics (Age, gender, ethnicity, genetics, weight)
Parent�s demographics (Education, income) School characteristics
(Quality, private/public)
Family�s habits (diet, parental control, meal patterns, pocket money)
Peer pressure
Media Literacy (Understanding of food related messages)
Exposure to TV and other forms of promotion
Child�s habits (lifestyle, diet, food preferences, physical exercise, pester power/self-efficacy)
Child�s health
Children�s food preference, consumption and behaviour are caused by multiple direct and indirect factors
�Web of causality� � Television sits within a whole web of interconnected influences.
Role of TV Advertising
114
Summary
Role of television advertising
Academic research shows �modest direct effects� of television advertising on food preference, consumption and behaviour. There is insufficient evidence to determine the relative size of the effect of TV advertising on children�s food choice by comparison with other relevant factors. Nor does a clear consensus exist yet regarding the nature of these other factors
In the context of the multiplicity of influences mentioned above, it is not surprising that the direct contribution of TV advertising has been found to be modest.
In the NOP survey, when television advertising is put in the context of other influences, we see that it does have an impact on food choice among both parents and children, but it is small compared to other influences.
For example, to parent and child alike, the child�s own taste preferences are paramount and price and familiarity are also important. Peer pressure (�My friends like it�) is also a notable influence on food choice for children. Parents are influenced by the healthiness of the products, although when actually serving food or drink, convenience (�Quick and easy to prepare�) is a more powerful motivator.
That said, promotions , (e.g. special offer/in store promotion, caught eye in shop, saw TV ad) appear to play a relatively greater role in the choice of HFSS products compared with non-HFSS products.
There is insufficient evidence to show that TV advertising has a larger, indirect effect on children�s food choices, however it is widely argued in the fields of social and developmental psychology and in consumer and marketing research that substantial indirect effects occur.
Example of indirect effects: television advertising affects the views of the child�s parents and peers about diet (parents� and peers� attitudes and behaviour subsequently have an impact on the child); it may normalize the image of a particular diet; it may prime the target audience to notice other forms of promotion.
In many such indirect ways television advertising can have a powerful, if largely un-researched and possibly un-researchable, influence on young people�s food preferences, consumption and behaviour.
Children�s Viewing Patterns & Advertising Impact
115
3.5 Children�s viewing patterns and advertising size, spend and impact
A key aspect of investigating the effect of advertising on children is to look at exactly what children are exposed to, and when, in front of the television set.
How long do children spend watching television? When are they watching and which channels are they tuned into? How much television advertising are they exposed to, both during dedicated children�s airtime and during all other times of the day when they may be watching? How do advertisers adapt their creative techniques when targeting children?
In order to build a picture of children�s viewing experience, in this section we examine:
- the amount of time spent by children in a commercial viewing environment (How extensive is the window of opportunity for TV food advertisers? Section 3.5.1)
- advertising size, spend and impact (How much do TV food advertisers invest in television compared with other forms of promotion? How much advertising for Core Category products is seen by children? Where do they see it? (Section 3.5.2)
�Core Category� foods
When analysing the size and spend of the food market, we have used the following categories as defined by Nielsen Media:
- Food � including all sub-sectors
- Soft Drinks � including all sub-sectors
- Chain Restaurants.
These have been grouped together to create what is referred to throughout the analysis of the advertising market as �Core Category� foods234.
234 It should be noted that our definition therefore covers more sub-sectors than the �Big 5� (Confectionery, Savoury Snacks, Soft Drinks, Fast Food and Pre-sugared Cereals) highlighted by the FSA. Products are not always classified by Nielsen Media as one would expect. For example, KraftDairylea Dunkers is classified under the Dairy Products & Substitutes/Cheese sub-sector rather than under the Prepared & Convenience Foods/Dipper Snacks category. And instead of finding home-cook chips in the Prepared & Convenience category, these brands are classified under the Frozen Vegetables sub-sector of the Fruit, Vegetables, Pasta category. Our decision was therefore to adopt an inclusive approach. �Core Category� foods covers all foods and drinks, including the category which our research has identified as important Prepared & Convenience Foods (e.g. convenience desserts, canned ready-to-eat, pizza, frozen ready-to-eat meals). For further details on food categorisation see Appendix 6.
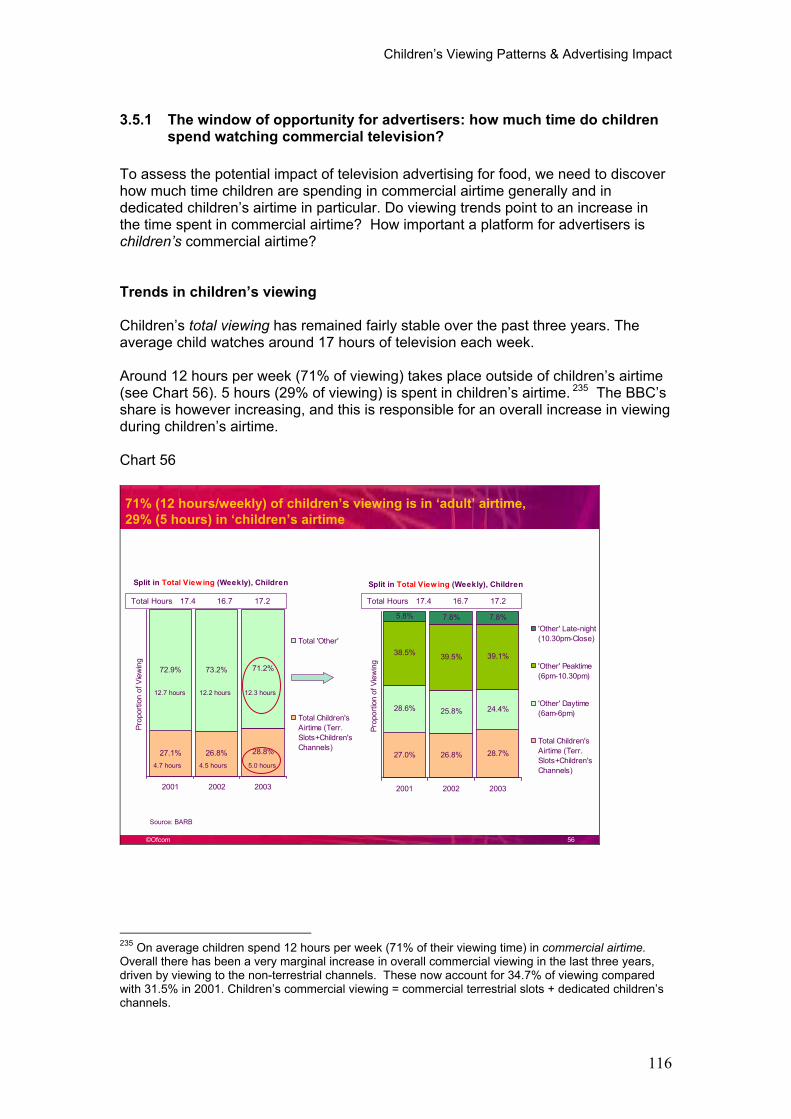
Children�s Viewing Patterns & Advertising Impact
116
3.5.1 The window of opportunity for advertisers: how much time do children spend watching commercial television?
To assess the potential impact of television advertising for food, we need to discover how much time children are spending in commercial airtime generally and in dedicated children�s airtime in particular. Do viewing trends point to an increase in the time spent in commercial airtime? How important a platform for advertisers is children�s commercial airtime?
Trends in children�s viewing
Children�s total viewing has remained fairly stable over the past three years. The average child watches around 17 hours of television each week.
Around 12 hours per week (71% of viewing) takes place outside of children�s airtime (see Chart 56). 5 hours (29% of viewing) is spent in children�s airtime. 235 The BBC�s share is however increasing, and this is responsible for an overall increase in viewing during children�s airtime.
Chart 56
©Ofcom 56
Split in Total View ing (Weekly), Children
27.0% 26.8% 28.7%
28.6% 25.8% 24.4%
38.5% 39.5% 39.1%
5.8% 7.8% 7.8%
2001 2002 2003
Prop
ortio
n of
Vie
win
g
'Other' Late-night(10.30pm-Close)
'Other' Peaktime(6pm-10.30pm)
'Other' Daytime(6am-6pm)
Total Children'sAirtime (Terr.Slots+Children'sChannels)
Split in Total View ing (Weekly), Children
27.1% 26.8% 28.8%
72.9% 73.2% 71.2%
2001 2002 2003
Prop
ortio
n of
Vie
win
g
Total 'Other'
Total Children'sAirtime (Terr.Slots+Children'sChannels)
Source: BARB
Total Hours 17.4 16.7 17.2
71% (12 hours/weekly) of children�s viewing is in �adult� airtime, 29% (5 hours) in �children�s airtime
Total Hours 17.4 16.7 17.2
4.7 hours 4.5 hours 5.0 hours
12.7 hours 12.2 hours 12.3 hours
235 On average children spend 12 hours per week (71% of their viewing time) in commercial airtime.Overall there has been a very marginal increase in overall commercial viewing in the last three years, driven by viewing to the non-terrestrial channels. These now account for 34.7% of viewing compared with 31.5% in 2001. Children�s commercial viewing = commercial terrestrial slots + dedicated children�s channels.
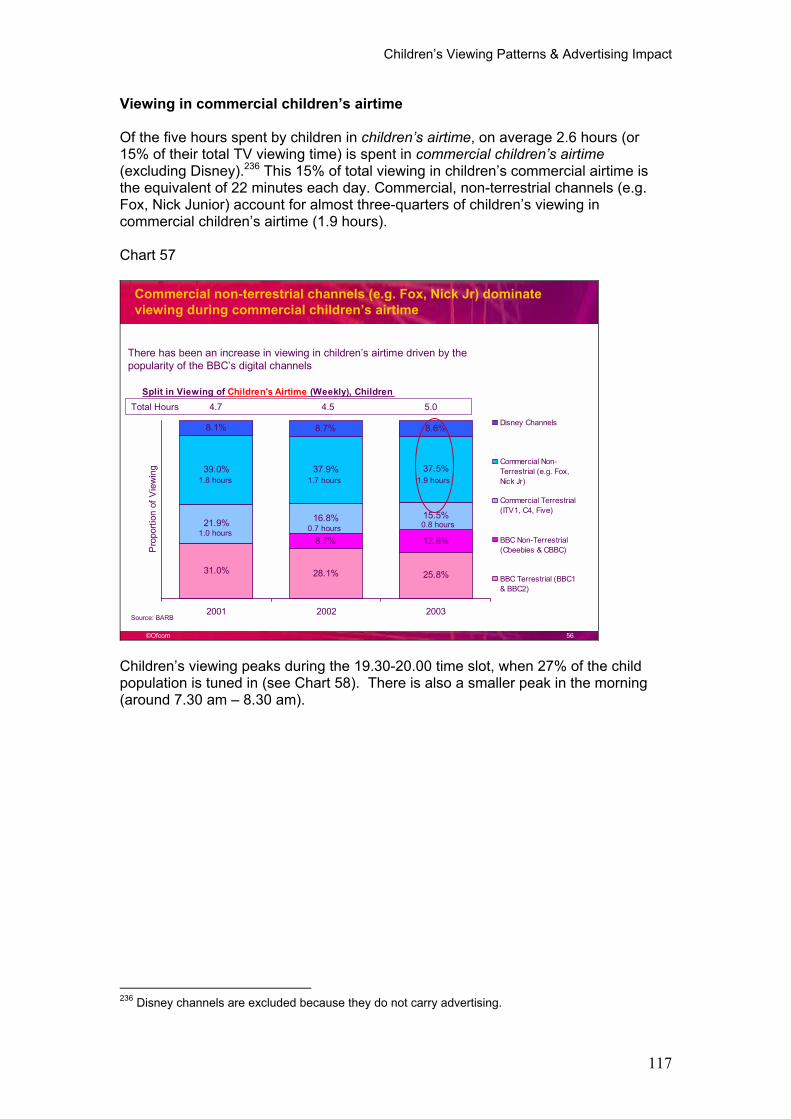
Children�s Viewing Patterns & Advertising Impact
117
Viewing in commercial children�s airtime
Of the five hours spent by children in children�s airtime, on average 2.6 hours (or 15% of their total TV viewing time) is spent in commercial children�s airtime (excluding Disney).236 This 15% of total viewing in children�s commercial airtime is the equivalent of 22 minutes each day. Commercial, non-terrestrial channels (e.g. Fox, Nick Junior) account for almost three-quarters of children�s viewing in commercial children�s airtime (1.9 hours).
Chart 57
©Ofcom 56
Commercial non-terrestrial channels (e.g. Fox, Nick Jr) dominate viewing during commercial children�s airtime
Source: BARB
Split in Viewing of Children's Airtime (Weekly), Children
31.0% 28.1% 25.8%
8.7% 12.8%
21.9% 16.8% 15.5%
39.0% 37.9% 37.5%
8.1% 8.6%8.7%
2001 2002 2003
Pro
porti
on o
f Vie
win
g
Disney Channels
Commercial Non-Terrestrial (e.g. Fox,Nick Jr)
Commercial Terrestrial(ITV1, C4, Five)
BBC Non-Terrestrial(Cbeebies & CBBC)
BBC Terrestrial (BBC1& BBC2)
Total Hours 4.7 4.5 5.0
1.8 hours 1.7 hours 1.9 hours
1.0 hours 0.7 hours 0.8 hours
There has been an increase in viewing in children�s airtime driven by the popularity of the BBC�s digital channels
Children�s viewing peaks during the 19.30-20.00 time slot, when 27% of the child population is tuned in (see Chart 58). There is also a smaller peak in the morning (around 7.30 am � 8.30 am).
236 Disney channels are excluded because they do not carry advertising.
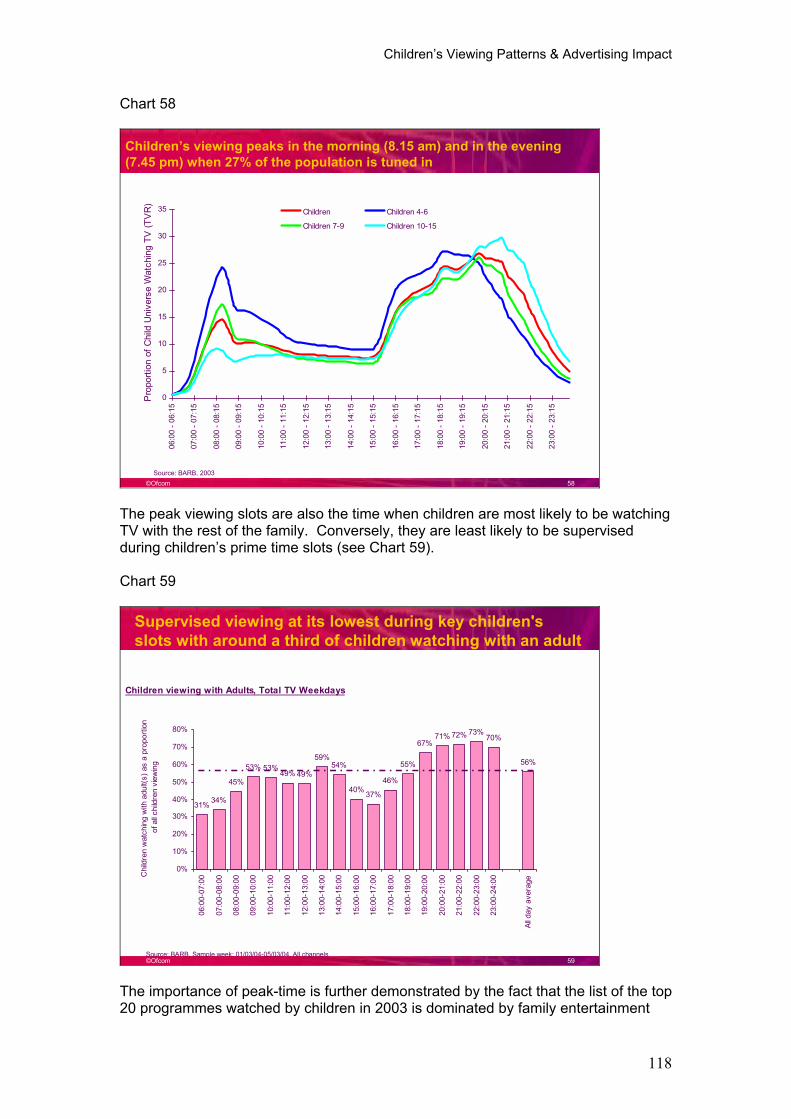
Children�s Viewing Patterns & Advertising Impact
118
Chart 58
©Ofcom 58
Children�s viewing peaks in the morning (8.15 am) and in the evening (7.45 pm) when 27% of the population is tuned in
0
5
10
15
20
25
30
35
06:0
0 - 0
6:15
07:0
0 - 0
7:15
08:0
0 - 0
8:15
09:0
0 - 0
9:15
10:0
0 - 1
0:15
11:0
0 - 1
1:15
12:0
0 - 1
2:15
13:0
0 - 1
3:15
14:0
0 - 1
4:15
15:0
0 - 1
5:15
16:0
0 - 1
6:15
17:0
0 - 1
7:15
18:0
0 - 1
8:15
19:0
0 - 1
9:15
20:0
0 - 2
0:15
21:0
0 - 2
1:15
22:0
0 - 2
2:15
23:0
0 - 2
3:15
Pro
porti
on o
f Chi
ld U
nive
rse
Wat
chin
g TV
(TV
R)
Children Children 4-6
Children 7-9 Children 10-15
Source: BARB, 2003
The peak viewing slots are also the time when children are most likely to be watching TV with the rest of the family. Conversely, they are least likely to be supervised during children�s prime time slots (see Chart 59).
Chart 59
©Ofcom 59
Supervised viewing at its lowest during key children's slots with around a third of children watching with an adult
Children viewing with Adults, Total TV Weekdays
31% 34%
45%
53% 53%49% 49%
59%54%
40% 37%
46%
55%
67%71% 72% 73%
70%
56%
0%
10%
20%
30%
40%
50%
60%
70%
80%
06:
00-0
7:00
07:
00-0
8:00
08:
00-0
9:00
09:
00-1
0:00
10:
00-1
1:00
11:
00-1
2:00
12:
00-1
3:00
13:
00-1
4:00
14:
00-1
5:00
15:
00-1
6:00
16:
00-1
7:00
17:
00-1
8:00
18:
00-1
9:00
19:
00-2
0:00
20:
00-2
1:00
21:
00-2
2:00
22:
00-2
3:00
23:
00-2
4:00
All d
ay a
vera
ge
Chi
ldre
n w
atch
ing
with
adu
lt(s)
as
a pr
opor
tion
of a
ll chi
ldre
n vi
ewin
g
Source: BARB, Sample week: 01/03/04-05/03/04, All channels
The importance of peak-time is further demonstrated by the fact that the list of the top 20 programmes watched by children in 2003 is dominated by family entertainment
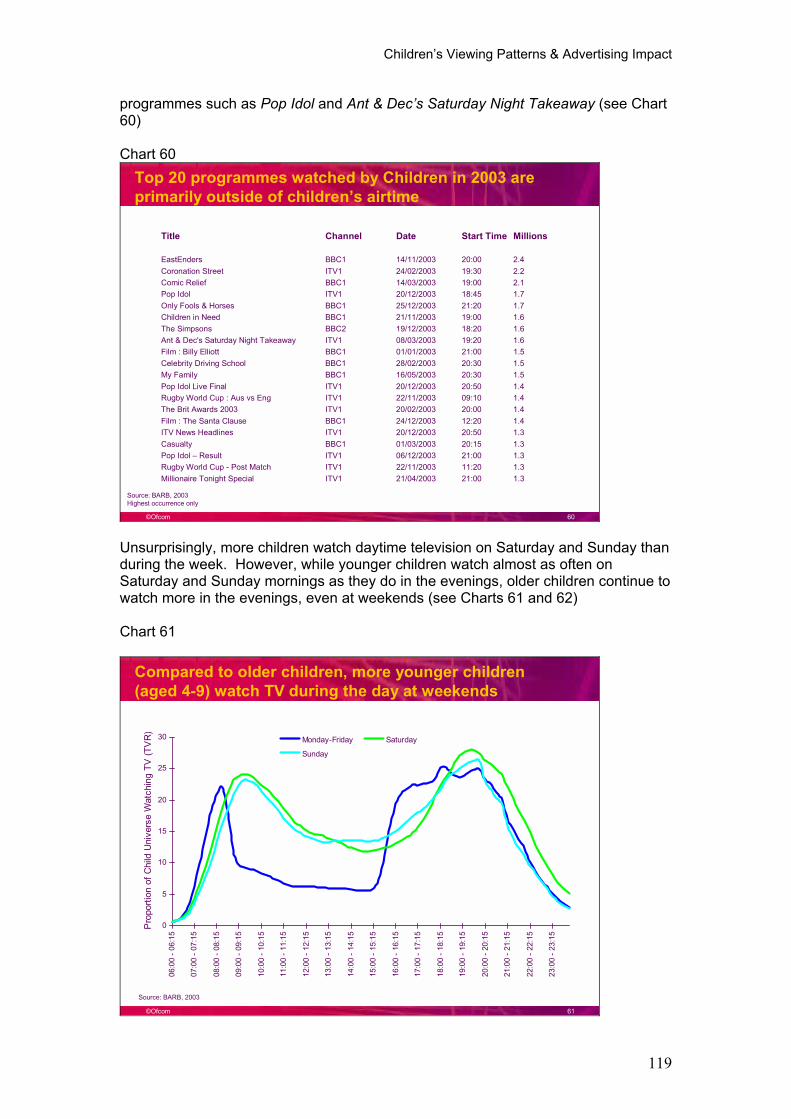
Children�s Viewing Patterns & Advertising Impact
119
programmes such as Pop Idol and Ant & Dec�s Saturday Night Takeaway (see Chart 60)
Chart 60
©Ofcom 60
Source: BARB, 2003Highest occurrence only
Title Channel Date Start Time Millions
EastEnders BBC1 14/11/2003 20:00 2.4Coronation Street ITV1 24/02/2003 19:30 2.2Comic Relief BBC1 14/03/2003 19:00 2.1Pop Idol ITV1 20/12/2003 18:45 1.7Only Fools & Horses BBC1 25/12/2003 21:20 1.7Children in Need BBC1 21/11/2003 19:00 1.6The Simpsons BBC2 19/12/2003 18:20 1.6Ant & Dec's Saturday Night Takeaway ITV1 08/03/2003 19:20 1.6Film : Billy Elliott BBC1 01/01/2003 21:00 1.5Celebrity Driving School BBC1 28/02/2003 20:30 1.5My Family BBC1 16/05/2003 20:30 1.5Pop Idol Live Final ITV1 20/12/2003 20:50 1.4Rugby World Cup : Aus vs Eng ITV1 22/11/2003 09:10 1.4The Brit Awards 2003 ITV1 20/02/2003 20:00 1.4Film : The Santa Clause BBC1 24/12/2003 12:20 1.4ITV News Headlines ITV1 20/12/2003 20:50 1.3Casualty BBC1 01/03/2003 20:15 1.3Pop Idol � Result ITV1 06/12/2003 21:00 1.3Rugby World Cup - Post Match ITV1 22/11/2003 11:20 1.3Millionaire Tonight Special ITV1 21/04/2003 21:00 1.3
Top 20 programmes watched by Children in 2003 are primarily outside of children�s airtime
Unsurprisingly, more children watch daytime television on Saturday and Sunday than during the week. However, while younger children watch almost as often on Saturday and Sunday mornings as they do in the evenings, older children continue to watch more in the evenings, even at weekends (see Charts 61 and 62)
Chart 61
©Ofcom 61
Compared to older children, more younger children (aged 4-9) watch TV during the day at weekends
0
5
10
15
20
25
30
06:0
0 - 0
6:15
07:0
0 - 0
7:15
08:0
0 - 0
8:15
09:0
0 - 0
9:15
10:0
0 - 1
0:15
11:0
0 - 1
1:15
12:0
0 - 1
2:15
13:0
0 - 1
3:15
14:0
0 - 1
4:15
15:0
0 - 1
5:15
16:0
0 - 1
6:15
17:0
0 - 1
7:15
18:0
0 - 1
8:15
19:0
0 - 1
9:15
20:0
0 - 2
0:15
21:0
0 - 2
1:15
22:0
0 - 2
2:15
23:0
0 - 2
3:15
Pro
porti
on o
f Chi
ld U
nive
rse
Wat
chin
g TV
(TV
R)
Monday-Friday Saturday
Sunday
Source: BARB, 2003
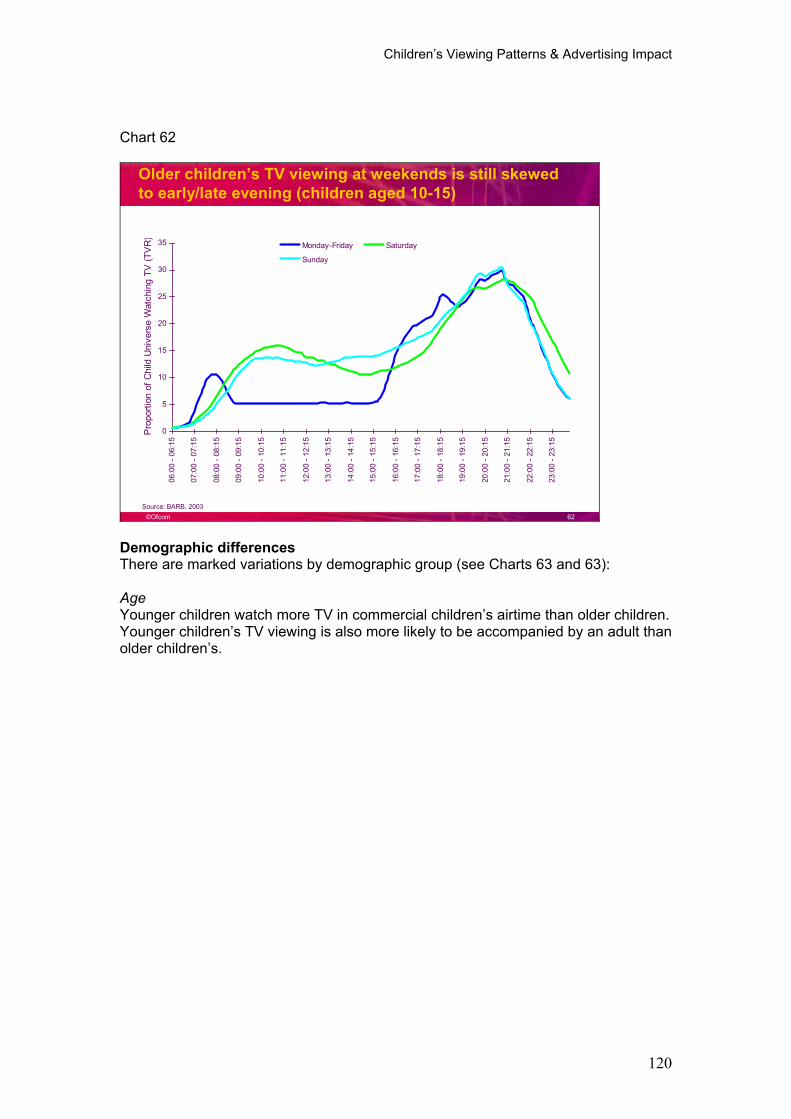
Children�s Viewing Patterns & Advertising Impact
120
Chart 62
©Ofcom 62
Older children�s TV viewing at weekends is still skewed to early/late evening (children aged 10-15)
0
5
10
15
20
25
30
35
06:0
0 - 0
6:15
07:0
0 - 0
7:15
08:0
0 - 0
8:15
09:0
0 - 0
9:15
10:0
0 - 1
0:15
11:0
0 - 1
1:15
12:0
0 - 1
2:15
13:0
0 - 1
3:15
14:0
0 - 1
4:15
15:0
0 - 1
5:15
16:0
0 - 1
6:15
17:0
0 - 1
7:15
18:0
0 - 1
8:15
19:0
0 - 1
9:15
20:0
0 - 2
0:15
21:0
0 - 2
1:15
22:0
0 - 2
2:15
23:0
0 - 2
3:15
Pro
porti
on o
f Chi
ld U
nive
rse
Wat
chin
g TV
(TV
R)
Monday-Friday Saturday
Sunday
Source: BARB, 2003
Demographic differences There are marked variations by demographic group (see Charts 63 and 63):
AgeYounger children watch more TV in commercial children�s airtime than older children. Younger children�s TV viewing is also more likely to be accompanied by an adult than older children�s.
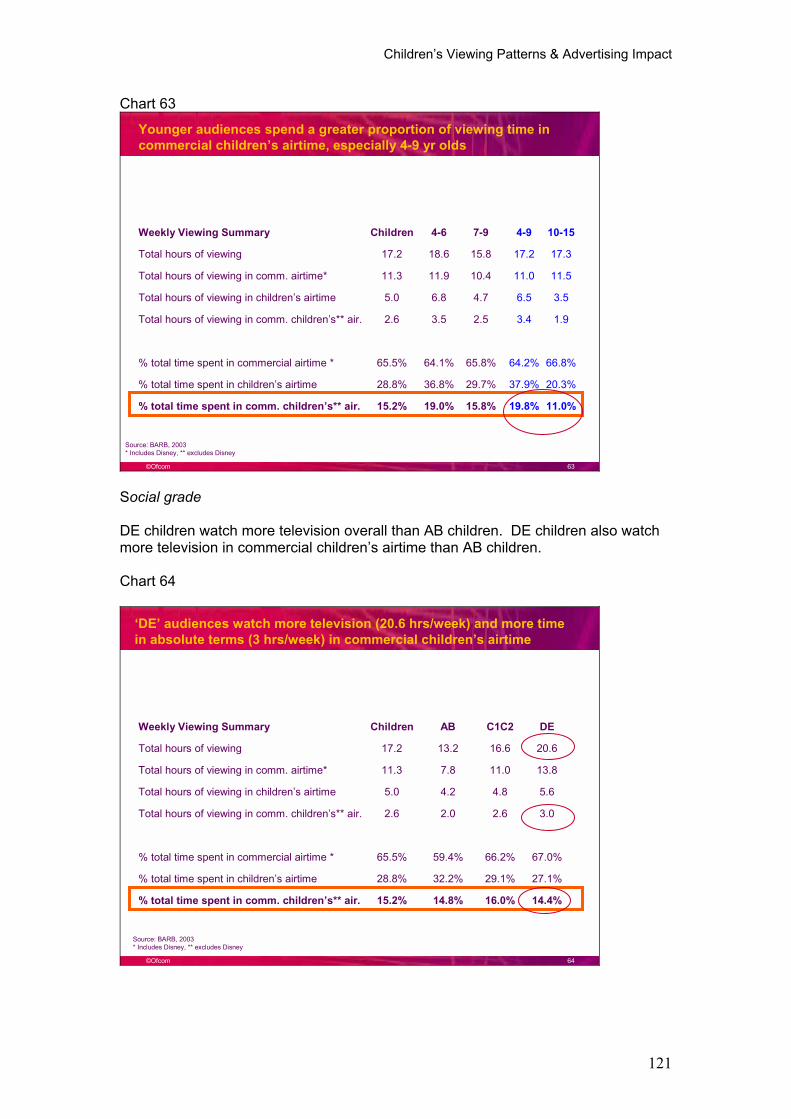
Children�s Viewing Patterns & Advertising Impact
121
Chart 63
©Ofcom 63
Weekly Viewing Summary Children 4-6 7-9 4-9 10-15
Total hours of viewing 17.2 18.6 15.8 17.2 17.3
Total hours of viewing in comm. airtime* 11.3 11.9 10.4 11.0 11.5
Total hours of viewing in children�s airtime 5.0 6.8 4.7 6.5 3.5
Total hours of viewing in comm. children�s** air. 2.6 3.5 2.5 3.4 1.9
% total time spent in commercial airtime * 65.5% 64.1% 65.8% 64.2% 66.8%
% total time spent in children�s airtime 28.8% 36.8% 29.7% 37.9% 20.3%
% total time spent in comm. children�s** air. 15.2% 19.0% 15.8% 19.8% 11.0%
Younger audiences spend a greater proportion of viewing time in commercial children�s airtime, especially 4-9 yr olds
Source: BARB, 2003* Includes Disney, ** excludes Disney
Social grade
DE children watch more television overall than AB children. DE children also watch more television in commercial children�s airtime than AB children.
Chart 64
©Ofcom 64
�DE� audiences watch more television (20.6 hrs/week) and more time in absolute terms (3 hrs/week) in commercial children�s airtime
Weekly Viewing Summary Children AB C1C2 DE
Total hours of viewing 17.2 13.2 16.6 20.6
Total hours of viewing in comm. airtime* 11.3 7.8 11.0 13.8
Total hours of viewing in children�s airtime 5.0 4.2 4.8 5.6
Total hours of viewing in comm. children�s** air. 2.6 2.0 2.6 3.0
% total time spent in commercial airtime * 65.5% 59.4% 66.2% 67.0%
% total time spent in children�s airtime 28.8% 32.2% 29.1% 27.1%
% total time spent in comm. children�s** air. 15.2% 14.8% 16.0% 14.4%
Source: BARB, 2003* Includes Disney, ** excludes Disney
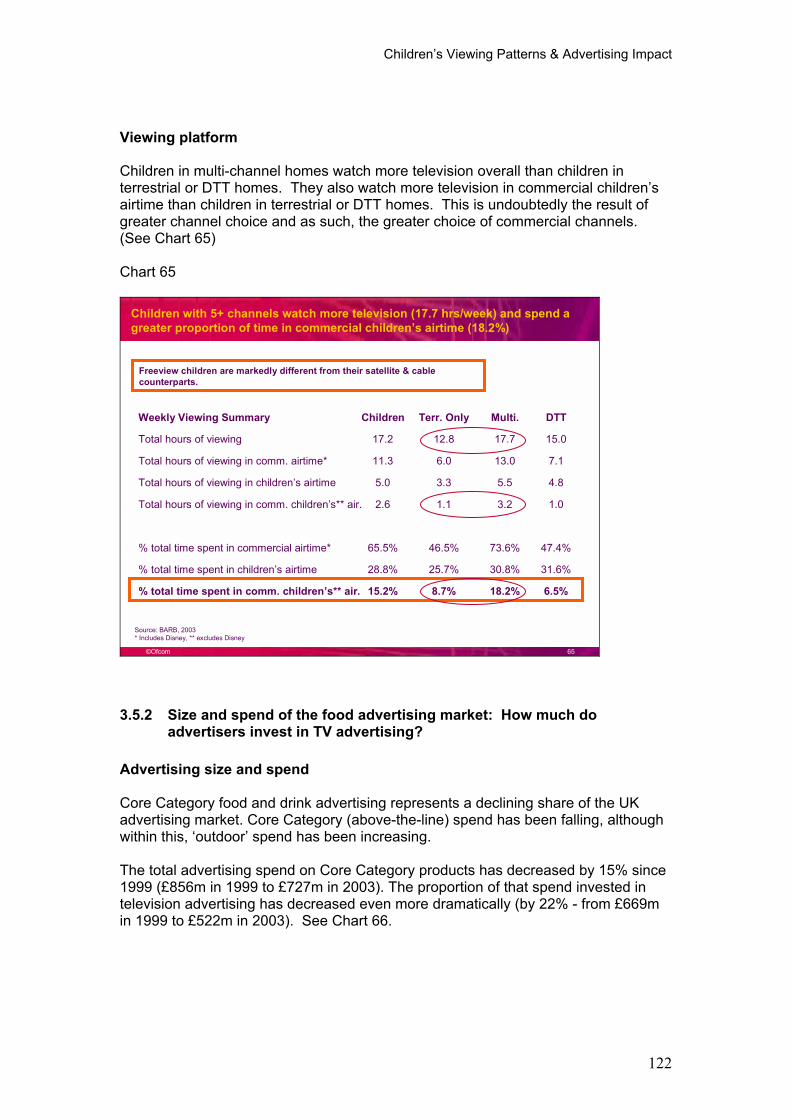
Children�s Viewing Patterns & Advertising Impact
122
Viewing platform
Children in multi-channel homes watch more television overall than children in terrestrial or DTT homes. They also watch more television in commercial children�s airtime than children in terrestrial or DTT homes. This is undoubtedly the result of greater channel choice and as such, the greater choice of commercial channels. (See Chart 65)
Chart 65
©Ofcom 65
Children with 5+ channels watch more television (17.7 hrs/week) and spend a greater proportion of time in commercial children�s airtime (18.2%)
Weekly Viewing Summary Children Terr. Only Multi. DTT
Total hours of viewing 17.2 12.8 17.7 15.0
Total hours of viewing in comm. airtime* 11.3 6.0 13.0 7.1
Total hours of viewing in children�s airtime 5.0 3.3 5.5 4.8
Total hours of viewing in comm. children�s** air. 2.6 1.1 3.2 1.0
% total time spent in commercial airtime* 65.5% 46.5% 73.6% 47.4%
% total time spent in children�s airtime 28.8% 25.7% 30.8% 31.6%
% total time spent in comm. children�s** air. 15.2% 8.7% 18.2% 6.5%
Source: BARB, 2003* Includes Disney, ** excludes Disney
Freeview children are markedly different from their satellite & cable counterparts.
3.5.2 Size and spend of the food advertising market: How much do advertisers invest in TV advertising?
Advertising size and spend
Core Category food and drink advertising represents a declining share of the UK advertising market. Core Category (above-the-line) spend has been falling, although within this, �outdoor� spend has been increasing.
The total advertising spend on Core Category products has decreased by 15% since 1999 (£856m in 1999 to £727m in 2003). The proportion of that spend invested in television advertising has decreased even more dramatically (by 22% - from £669m in 1999 to £522m in 2003). See Chart 66.
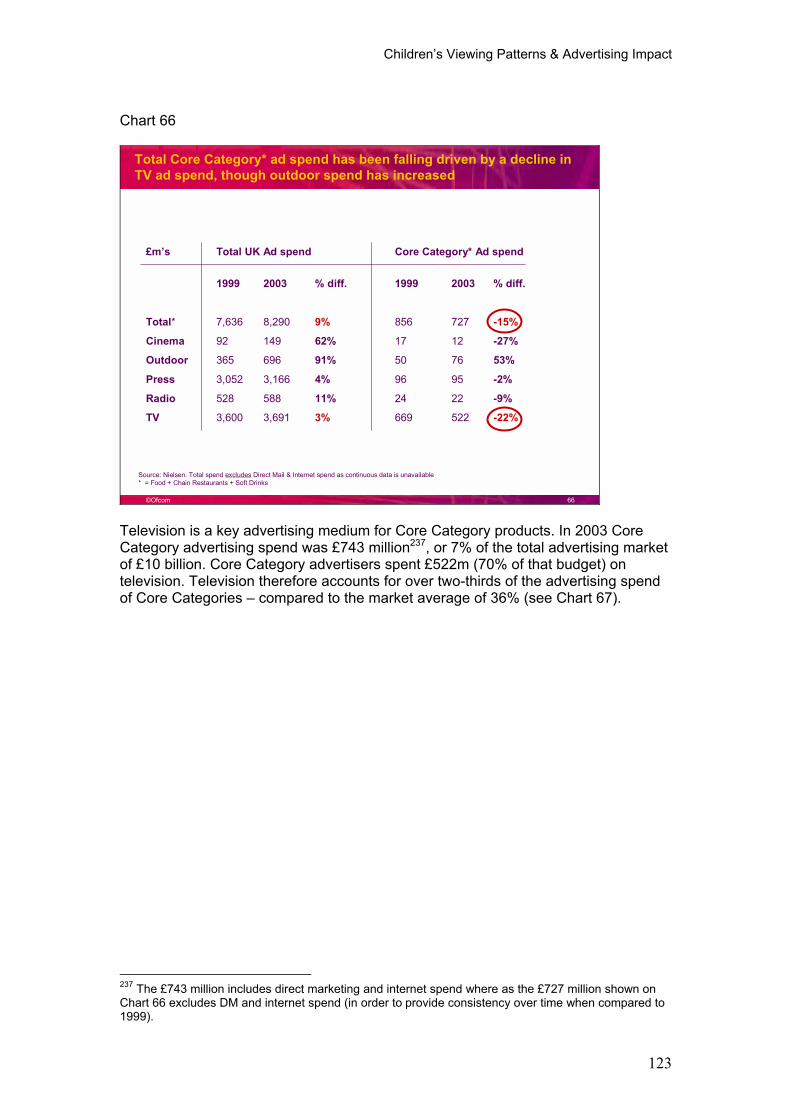
Children�s Viewing Patterns & Advertising Impact
123
Chart 66
©Ofcom 66
Total Core Category* ad spend has been falling driven by a decline in TV ad spend, though outdoor spend has increased
£m�s Total UK Ad spend Core Category* Ad spend
1999 2003 % diff. 1999 2003 % diff.
Total* 7,636 8,290 9% 856 727 -15%
Cinema 92 149 62% 17 12 -27%
Outdoor 365 696 91% 50 76 53%
Press 3,052 3,166 4% 96 95 -2%
Radio 528 588 11% 24 22 -9%
TV 3,600 3,691 3% 669 522 -22%
Source: Nielsen. Total spend excludes Direct Mail & Internet spend as continuous data is unavailable* = Food + Chain Restaurants + Soft Drinks
Television is a key advertising medium for Core Category products. In 2003 Core Category advertising spend was £743 million237, or 7% of the total advertising market of £10 billion. Core Category advertisers spent £522m (70% of that budget) on television. Television therefore accounts for over two-thirds of the advertising spend of Core Categories � compared to the market average of 36% (see Chart 67).
237 The £743 million includes direct marketing and internet spend where as the £727 million shown on Chart 66 excludes DM and internet spend (in order to provide consistency over time when compared to 1999).
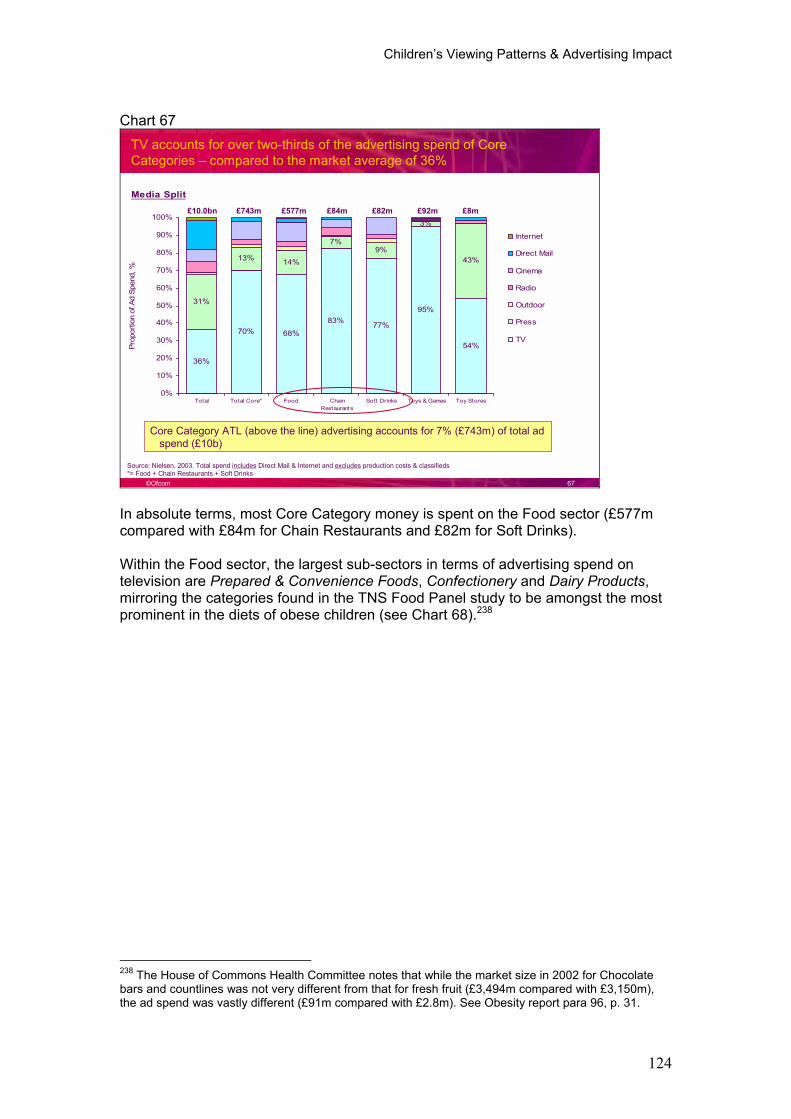
Children�s Viewing Patterns & Advertising Impact
124
Chart 67
©Ofcom 67
TV accounts for over two-thirds of the advertising spend of Core Categories � compared to the market average of 36%
Source: Nielsen, 2003. Total spend includes Direct Mail & Internet and excludes production costs & classifieds *= Food + Chain Restaurants + Soft Drinks
Core Category ATL (above the line) advertising accounts for 7% (£743m) of total ad spend (£10b)
Media Split
36%
70% 68%
83% 77%
95%
54%
31%
13% 14%
7%9%
3%
43%
0%
10%
20%
30%
40%
50%
60%
70%
80%
90%
100%
Total Total Core* Food ChainRestaurants
Soft Drinks Toys & Games Toy Stores
Prop
ortio
n of
Ad
Spen
d, %
Internet
Direct Mail
Cinema
Radio
Outdoor
Press
TV
£10.0bn £577m £84m £82m £92m £8m£743m
In absolute terms, most Core Category money is spent on the Food sector (£577m compared with £84m for Chain Restaurants and £82m for Soft Drinks).
Within the Food sector, the largest sub-sectors in terms of advertising spend on television are Prepared & Convenience Foods, Confectionery and Dairy Products,mirroring the categories found in the TNS Food Panel study to be amongst the most prominent in the diets of obese children (see Chart 68).238
238 The House of Commons Health Committee notes that while the market size in 2002 for Chocolate bars and countlines was not very different from that for fresh fruit (£3,494m compared with £3,150m), the ad spend was vastly different (£91m compared with £2.8m). See Obesity report para 96, p. 31.
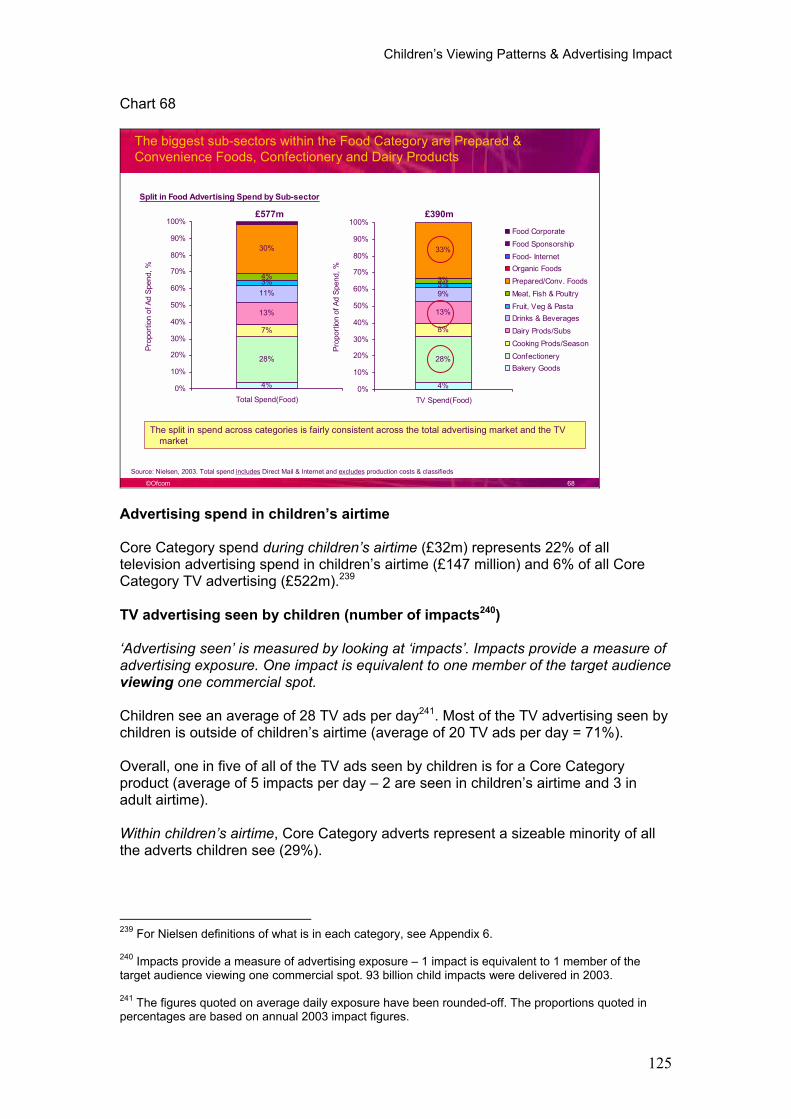
Children�s Viewing Patterns & Advertising Impact
125
Chart 68
©Ofcom 68
The biggest sub-sectors within the Food Category are Prepared & Convenience Foods, Confectionery and Dairy Products
Split in Food Advertising Spend by Sub-sector
4%
28%
7%
13%
11%3%4%
30%
0%
10%
20%
30%
40%
50%
60%
70%
80%
90%
100%
Total Spend(Food)
Prop
ortio
n of
Ad
Spen
d, %
Source: Nielsen, 2003. Total spend includes Direct Mail & Internet and excludes production costs & classifieds
The split in spend across categories is fairly consistent across the total advertising market and the TV market
£577m £390m
4%
28%
8%
13%
9%3%3%
33%
0%
10%
20%
30%
40%
50%
60%
70%
80%
90%
100%
TV Spend(Food)
Prop
ortio
n of
Ad
Spen
d, %
Food CorporateFood SponsorshipFood- InternetOrganic FoodsPrepared/Conv. FoodsMeat, Fish & PoultryFruit, Veg & PastaDrinks & BeveragesDairy Prods/SubsCooking Prods/SeasonConfectioneryBakery Goods
Advertising spend in children�s airtime
Core Category spend during children�s airtime (£32m) represents 22% of all television advertising spend in children�s airtime (£147 million) and 6% of all Core Category TV advertising (£522m).239
TV advertising seen by children (number of impacts240)
�Advertising seen� is measured by looking at �impacts�. Impacts provide a measure of advertising exposure. One impact is equivalent to one member of the target audience viewing one commercial spot.
Children see an average of 28 TV ads per day241. Most of the TV advertising seen by children is outside of children�s airtime (average of 20 TV ads per day = 71%).
Overall, one in five of all of the TV ads seen by children is for a Core Category product (average of 5 impacts per day � 2 are seen in children�s airtime and 3 in adult airtime).
Within children�s airtime, Core Category adverts represent a sizeable minority of all the adverts children see (29%).
239 For Nielsen definitions of what is in each category, see Appendix 6.
240 Impacts provide a measure of advertising exposure � 1 impact is equivalent to 1 member of the target audience viewing one commercial spot. 93 billion child impacts were delivered in 2003.
241 The figures quoted on average daily exposure have been rounded-off. The proportions quoted in percentages are based on annual 2003 impact figures.
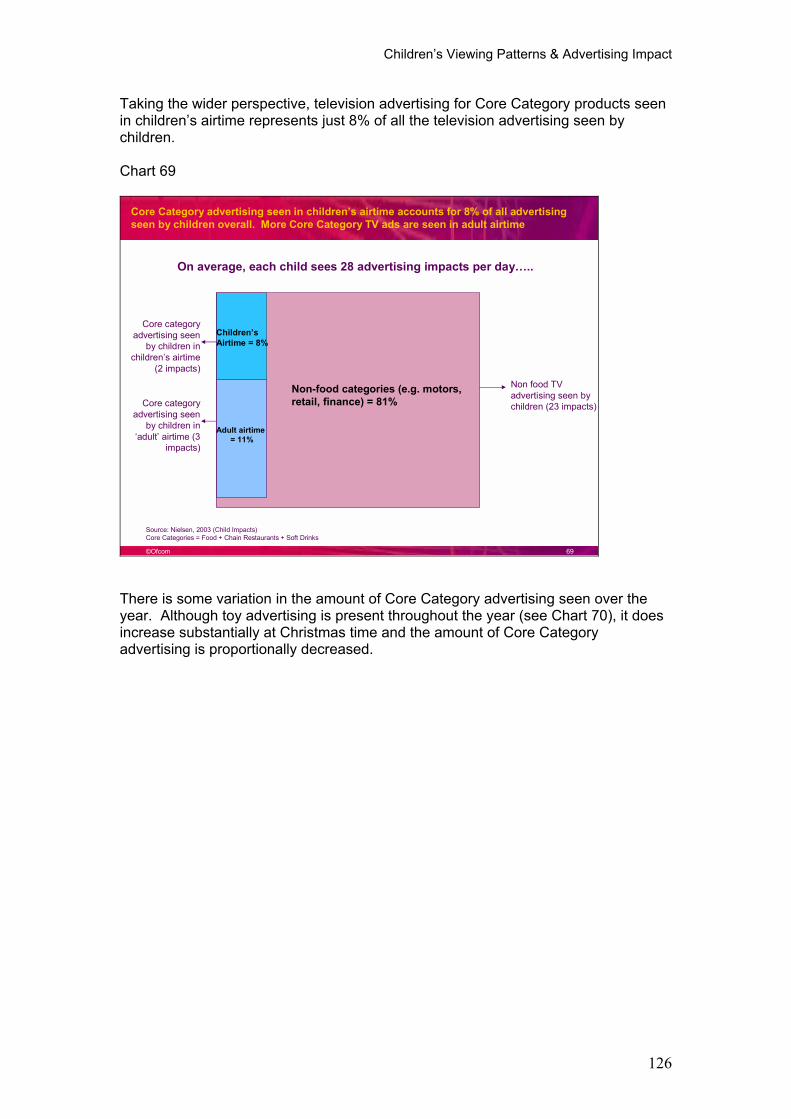
Children�s Viewing Patterns & Advertising Impact
126
Taking the wider perspective, television advertising for Core Category products seen in children�s airtime represents just 8% of all the television advertising seen by children.
Chart 69
©Ofcom 69
Core Category advertising seen in children�s airtime accounts for 8% of all advertising seen by children overall. More Core Category TV ads are seen in adult airtime
Source: Nielsen, 2003 (Child Impacts)Core Categories = Food + Chain Restaurants + Soft Drinks
Non-food categories (e.g. motors, retail, finance) = 81%
Adult airtime= 11%
Children�sAirtime = 8%
Non food TV advertising seen by children (23 impacts)Core category
advertising seen by children in
�adult� airtime (3 impacts)
Core category advertising seen
by children in children�s airtime
(2 impacts)
On average, each child sees 28 advertising impacts per day�..
There is some variation in the amount of Core Category advertising seen over the year. Although toy advertising is present throughout the year (see Chart 70), it does increase substantially at Christmas time and the amount of Core Category advertising is proportionally decreased.
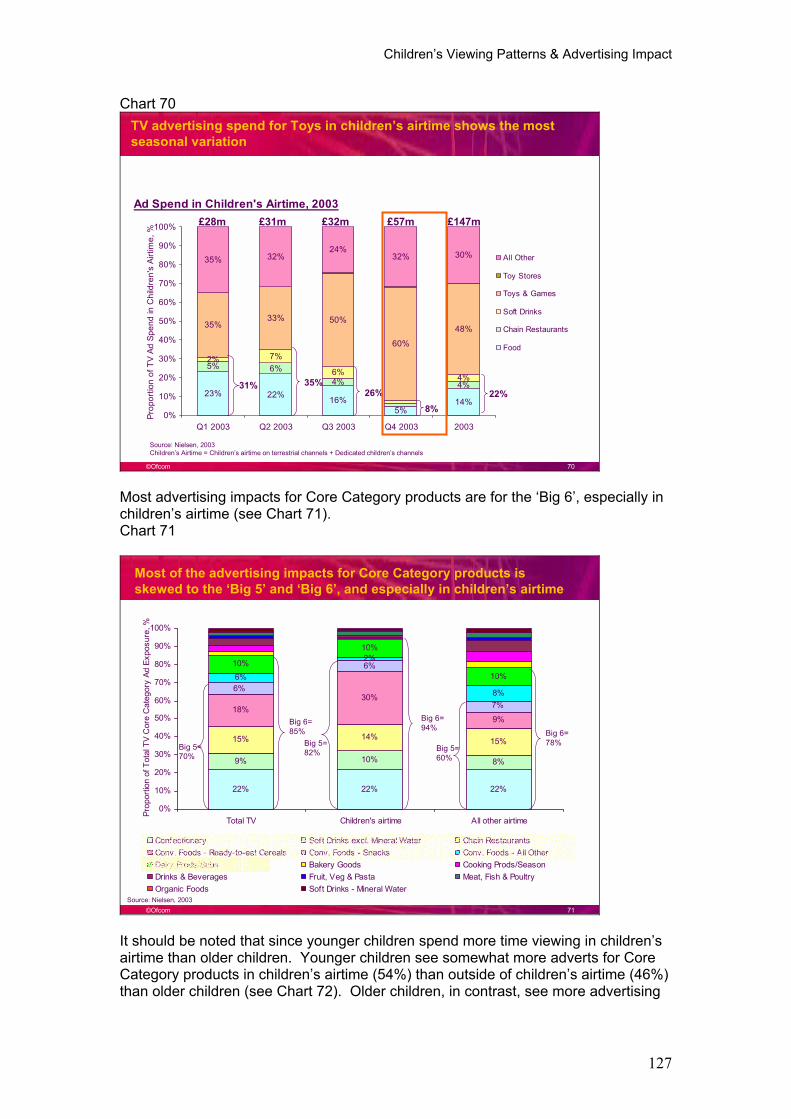
Children�s Viewing Patterns & Advertising Impact
127
Chart 70
©Ofcom 70
TV advertising spend for Toys in children�s airtime shows the most seasonal variation
Source: Nielsen, 2003Children�s Airtime = Children�s airtime on terrestrial channels + Dedicated children�s channels
Ad Spend in Children's Airtime, 2003
23% 22% 16%5%
14%
5%
4% 4%
2%6% 4%
60%
48%
35% 32%24%
32% 30%
6%7%
33% 50%35%
0%
10%
20%
30%
40%
50%
60%
70%
80%
90%
100%
Q1 2003 Q2 2003 Q3 2003 Q4 2003 2003
Prop
ortio
n of
TV
Ad S
pend
in C
hild
ren'
s Ai
rtim
e, %
All Other
Toy Stores
Toys & Games
Soft Drinks
Chain Restaurants
Food
31% 35%26%
8%22%
£28m £31m £32m £57m £147m
Most advertising impacts for Core Category products are for the �Big 6�, especially in children�s airtime (see Chart 71). Chart 71
©Ofcom 71
Most of the advertising impacts for Core Category products is skewed to the �Big 5� and �Big 6�, and especially in children�s airtime
Source: Nielsen, 2003
22% 22% 22%
9% 10% 8%
15% 14% 15%
18%30%
9%
8%
10%
10%
10%
7%
6%
6%
2%
6%
0%
10%
20%
30%
40%
50%
60%
70%
80%
90%
100%
Total TV Children's airtime All other airtime
Prop
ortio
n of
Tot
al T
V C
ore
Cat
egor
y Ad
Exp
osur
e, %
Confectionery Soft Drinks excl. Mineral Water Chain RestaurantsConv. Foods - Ready-to-eat Cereals Conv. Foods - Snacks Conv. Foods - All OtherDairy Prods/Subs Bakery Goods Cooking Prods/SeasonDrinks & Beverages Fruit, Veg & Pasta Meat, Fish & PoultryOrganic Foods Soft Drinks - Mineral Water
Big 5=70%
Big 5=82% Big 5=
60%
Big 6=94%
Big 6=78%
Big 6=85%
It should be noted that since younger children spend more time viewing in children�s airtime than older children. Younger children see somewhat more adverts for Core Category products in children�s airtime (54%) than outside of children�s airtime (46%) than older children (see Chart 72). Older children, in contrast, see more advertising
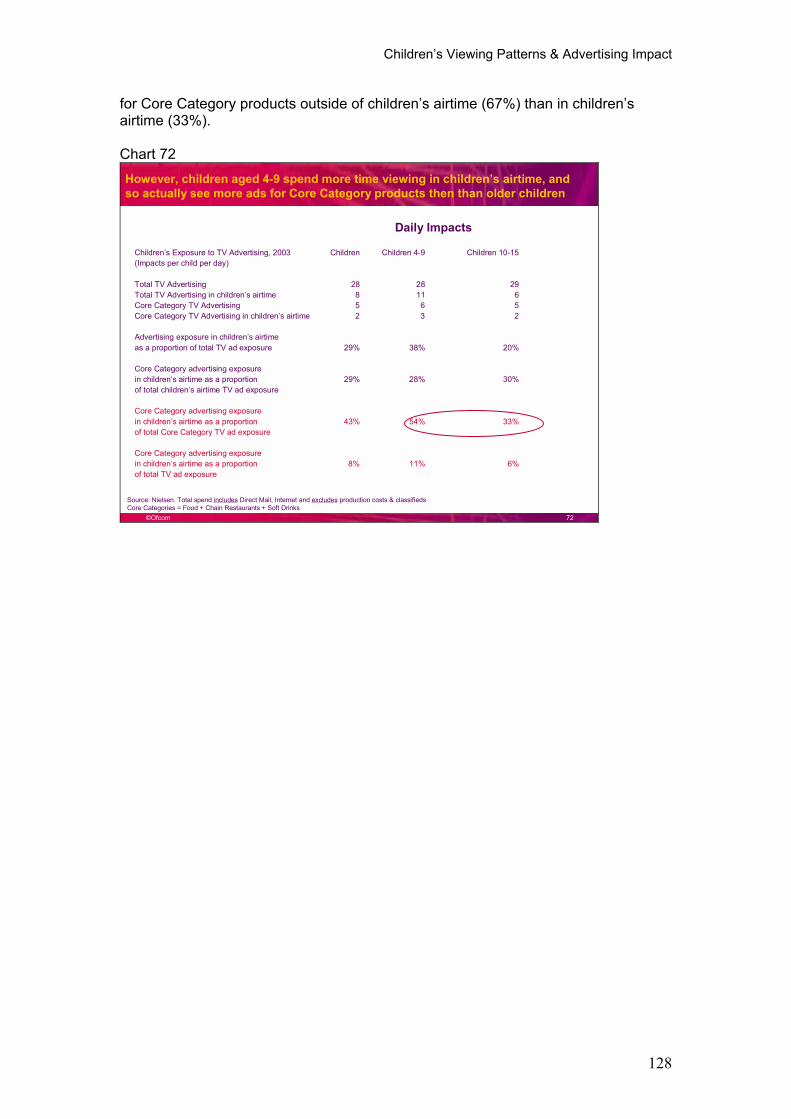
Children�s Viewing Patterns & Advertising Impact
128
for Core Category products outside of children�s airtime (67%) than in children�s airtime (33%).
Chart 72
©Ofcom 72
However, children aged 4-9 spend more time viewing in children�s airtime, and so actually see more ads for Core Category products then than older children
Source: Nielsen. Total spend includes Direct Mail, Internet and excludes production costs & classifieds Core Categories = Food + Chain Restaurants + Soft Drinks
Children�s Exposure to TV Advertising, 2003 Children Children 4-9 Children 10-15(Impacts per child per day)
Total TV Advertising 28 28 29Total TV Advertising in children�s airtime 8 11 6Core Category TV Advertising 5 6 5Core Category TV Advertising in children�s airtime 2 3 2
Advertising exposure in children�s airtimeas a proportion of total TV ad exposure 29% 38% 20%
Core Category advertising exposurein children�s airtime as a proportion 29% 28% 30%of total children�s airtime TV ad exposure
Core Category advertising exposurein children�s airtime as a proportion 43% 54% 33%of total Core Category TV ad exposure
Core Category advertising exposurein children�s airtime as a proportion 8% 11% 6%of total TV ad exposure
Daily Impacts
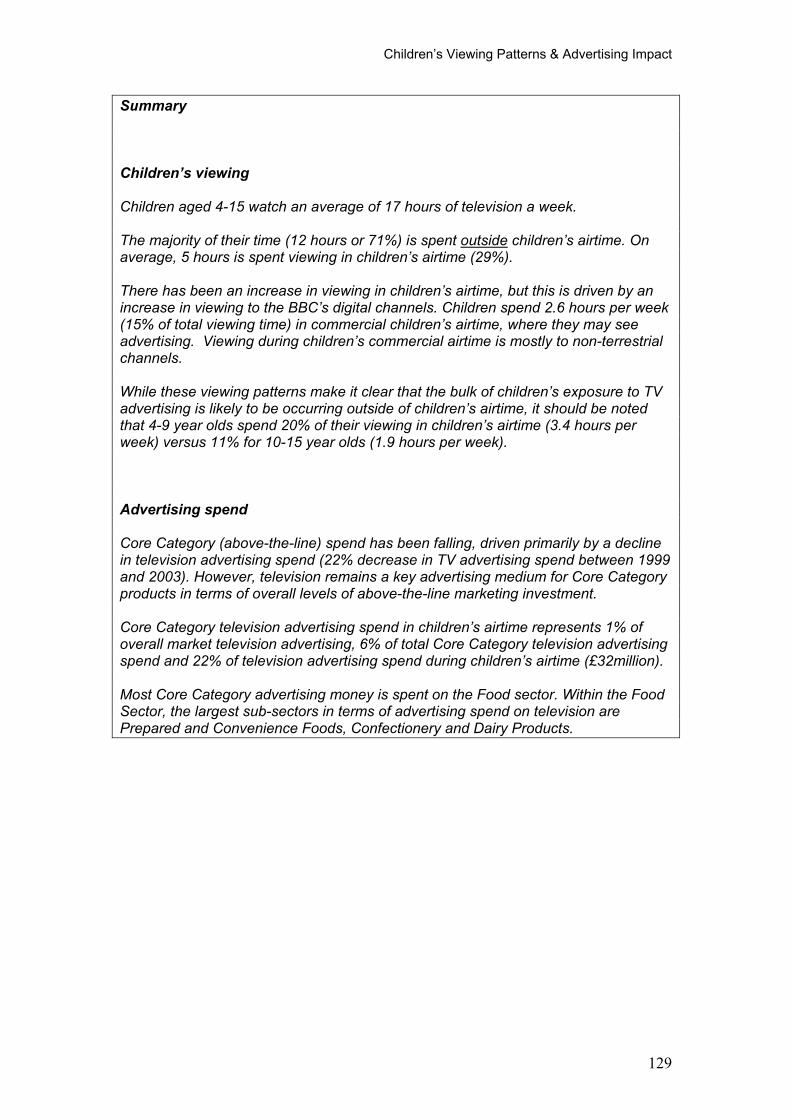
Children�s Viewing Patterns & Advertising Impact
129
Summary
Children�s viewing
Children aged 4-15 watch an average of 17 hours of television a week.
The majority of their time (12 hours or 71%) is spent outside children�s airtime. On average, 5 hours is spent viewing in children�s airtime (29%).
There has been an increase in viewing in children�s airtime, but this is driven by an increase in viewing to the BBC�s digital channels. Children spend 2.6 hours per week (15% of total viewing time) in commercial children�s airtime, where they may see advertising. Viewing during children�s commercial airtime is mostly to non-terrestrial channels.
While these viewing patterns make it clear that the bulk of children�s exposure to TV advertising is likely to be occurring outside of children�s airtime, it should be noted that 4-9 year olds spend 20% of their viewing in children�s airtime (3.4 hours per week) versus 11% for 10-15 year olds (1.9 hours per week).
Advertising spend
Core Category (above-the-line) spend has been falling, driven primarily by a decline in television advertising spend (22% decrease in TV advertising spend between 1999 and 2003). However, television remains a key advertising medium for Core Category products in terms of overall levels of above-the-line marketing investment.
Core Category television advertising spend in children�s airtime represents 1% of overall market television advertising, 6% of total Core Category television advertising spend and 22% of television advertising spend during children�s airtime (£32million).
Most Core Category advertising money is spent on the Food sector. Within the Food Sector, the largest sub-sectors in terms of advertising spend on television are Prepared and Convenience Foods, Confectionery and Dairy Products.
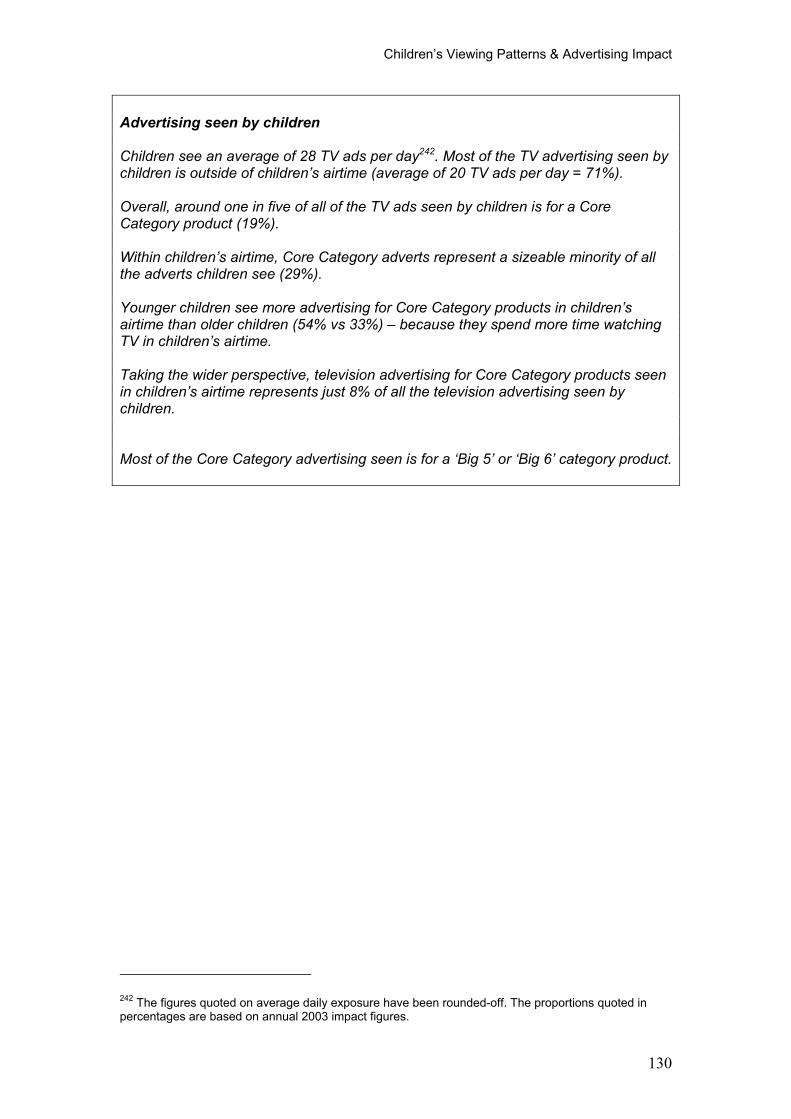
Children�s Viewing Patterns & Advertising Impact
130
Advertising seen by children
Children see an average of 28 TV ads per day242. Most of the TV advertising seen by children is outside of children�s airtime (average of 20 TV ads per day = 71%).
Overall, around one in five of all of the TV ads seen by children is for a Core Category product (19%).
Within children�s airtime, Core Category adverts represent a sizeable minority of all the adverts children see (29%).
Younger children see more advertising for Core Category products in children�s airtime than older children (54% vs 33%) � because they spend more time watching TV in children�s airtime.
Taking the wider perspective, television advertising for Core Category products seen in children�s airtime represents just 8% of all the television advertising seen by children.
Most of the Core Category advertising seen is for a �Big 5� or �Big 6� category product.
242 The figures quoted on average daily exposure have been rounded-off. The proportions quoted in percentages are based on annual 2003 impact figures.
Processes of Persuasion � How Advertising Works
131
3.6 Processes of persuasion � how advertising works
The House of Commons Health Committee (2004)had privileged access to contact reports, client briefs, creative briefs, media briefs and schedules, advertising budgets, links to marketing strategy and other communications as well as market research reports of advertising agencies working for a number of fast food, carbonated drink, cereal and confectionery manufacturers. On the basis of what it saw, it concludes:
�It is clear advertisers use their increasingly sophisticated knowledge of children�s cognitive and social development, and careful consumer research into their motivations, values, preferences and interests, to ensure that their messages have maximum appeal.�243
What then have we learned from academic research about the processes of persuasion upon which advertising relies? How does this relate to children�s and young people�s ability to understand the commercial motivations of advertisers? Are there any age-related differences? As children get older and become more �media literate� are they less likely to be influenced by advertising?
3.6.1 Age-related differences in media/advertising literacy
Media literacy has been defined by Ofcom as a range of skills that include the ability to access, analyse, evaluate and produce communications in a variety of forms. It is an area that has been widely researched amongst children. Media literacy develops with age and is commonly related to children�s growing ability to understand the persuasive intent of advertising. It is generally agreed244 that before four or five years old, children regard advertising as simply entertainment, while between four and seven, they begin to be able to distinguish advertising from programmes. The majority have generally grasped the intention to persuade by the age of eight, but it is only after eleven or twelve that they can articulate a critical understanding of advertising. Children younger than 8 are not able to judge accurately, or reflect critically upon commercial messages. Indeed Robertson and Rossiter (1974) found that two thirds (64.8%) of 6-7 year olds reported �trusting all commercials�.245
3.6.2 Advertising literacy: how does it relate to advertising effects?
Surprisingly little is known of how advertising actually affects children at different ages, although it is commonly assumed that young children are more readily influenced by advertising than more media-literate teenagers.
243 House of Commons Health Committee (2004) Obesity Third Report of Session 2003-2004 Volume 1, para 105. p.34. London: The Stationery Office Limited.
244 See Bandyopadhyay, Kindra and Sharp 2001, Hastings et al 2003, Valkenburg and Cantor 2001, van Evra 1998, Young et al 1996, Young 2003
245 Robertson, T.S. and Rossiter, J.R. (1974) �Children and commercial persuasion: an attribution theory analysis�, Journal of Consumer Research, 1974, pp 13-20. Cited in the House of Commons Health Committee report on Obesity, para 104. p 33.
Processes of Persuasion � How Advertising Works
132
When Livingstone and Helsper (2004)246 categorised published research investigating the effects of television advertising on children�s food choice according to the nature of the finding (evidence for effects or otherwise) and the age of the children in the sample (according to three standard age bands), results were counter-intuitive. They showed that mixed findings are more common among the youngest age group. Research is more likely to show clear evidence of media effects among 6-12 year olds and, even more so, among teenagers. Consequently, they conclude, we must rethink our assumptions. As children become developmentally more sophisticated, they gain in �advertising literacy�, but do not necessarily acquire a greater ability to resist or defend against the messages of advertising.
How then can we explain the fact that advertising continues to be effective with older children, despite their greater �advertising literacy�?
3.6.3 Towards a model of persuasion
Livingstone and Helsper conclude that all age groups may be successfully targeted by advertising, but in different ways. The findings reviewed can be seen as consistent with the Elaboration Likelihood Model of Persuasion,247 a widely-adopted socio-cognitive model which proposes two �routes� to persuasion:
¶ Peripheral Route (Here people remain relatively unengaged by the message content but may still be persuaded by the status of its celebrity source or the intensity of the message (colour, sound, emotion) that do not directly relate to the arguments given.)
¶ Central Route (Here people pay attention to the content of the message, and so are persuaded precisely because they attend to, and engage with, the arguments put forward for a position or product.)
Livingstone and Helsper suggest that less literate viewers (generally younger children) are more likely to be persuaded primarily by the peripheral route. They are more influenced by superficial features of advertising such as the use of bright colours, lively music, and simple messages. A key indicator of peripheral route persuasion is the importance of �source credibility� � being persuaded not by the qualities of the product but by the qualities of the source recommending the product.
Ross et al (1984)248, in a much-cited study, found that children older than eleven were less influenced by celebrity endorsement than those aged eight to ten. This supports the argument that peripheral route processing � and hence the effectiveness of celebrity endorsement � is typical of younger rather than older children. Van Evra (1998)249 reviews evidence that shows that for younger children, celebrities are seen as experts and increase the popularity of the product. Interestingly, they need not be a real celebrity, but merely be perceived as such by
246 Livingstone, S. and Helsper, E. (2004) Advertising �unhealthy� foods to children: Understanding Promotion In The Context Of Children�s Daily Lives.
247 Petty and Cacioppo (1986), Eagly and Chaiken (1993)
248 Ross (1984)
249 VanEvra, J. (1998). Television and Child Development. London: Lawrence Erlbaum Associates.
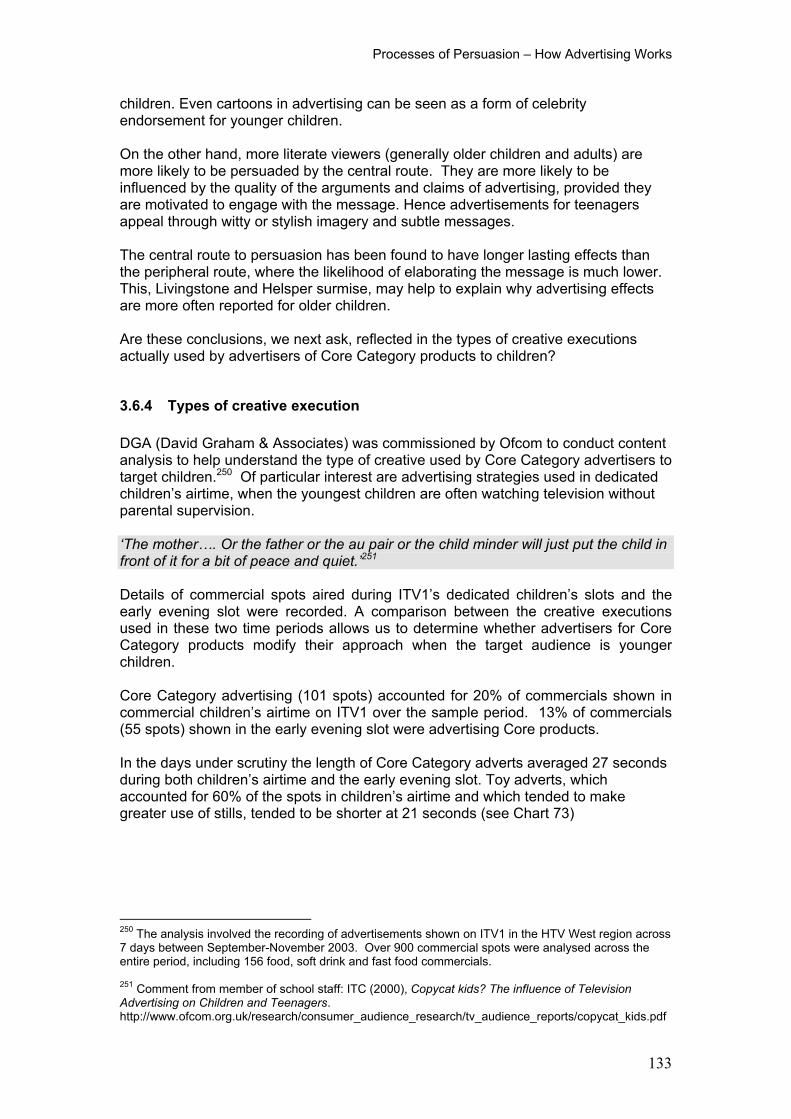
Processes of Persuasion � How Advertising Works
133
children. Even cartoons in advertising can be seen as a form of celebrity endorsement for younger children.
On the other hand, more literate viewers (generally older children and adults) are more likely to be persuaded by the central route. They are more likely to be influenced by the quality of the arguments and claims of advertising, provided they are motivated to engage with the message. Hence advertisements for teenagers appeal through witty or stylish imagery and subtle messages.
The central route to persuasion has been found to have longer lasting effects than the peripheral route, where the likelihood of elaborating the message is much lower. This, Livingstone and Helsper surmise, may help to explain why advertising effects are more often reported for older children.
Are these conclusions, we next ask, reflected in the types of creative executions actually used by advertisers of Core Category products to children?
3.6.4 Types of creative execution
DGA (David Graham & Associates) was commissioned by Ofcom to conduct content analysis to help understand the type of creative used by Core Category advertisers to target children.250 Of particular interest are advertising strategies used in dedicated children�s airtime, when the youngest children are often watching television without parental supervision.
�The mother�. Or the father or the au pair or the child minder will just put the child in front of it for a bit of peace and quiet.�251
Details of commercial spots aired during ITV1�s dedicated children�s slots and the early evening slot were recorded. A comparison between the creative executions used in these two time periods allows us to determine whether advertisers for Core Category products modify their approach when the target audience is younger children.
Core Category advertising (101 spots) accounted for 20% of commercials shown in commercial children�s airtime on ITV1 over the sample period. 13% of commercials (55 spots) shown in the early evening slot were advertising Core products.
In the days under scrutiny the length of Core Category adverts averaged 27 seconds during both children�s airtime and the early evening slot. Toy adverts, which accounted for 60% of the spots in children�s airtime and which tended to make greater use of stills, tended to be shorter at 21 seconds (see Chart 73)
250 The analysis involved the recording of advertisements shown on ITV1 in the HTV West region across 7 days between September-November 2003. Over 900 commercial spots were analysed across the entire period, including 156 food, soft drink and fast food commercials.
251 Comment from member of school staff: ITC (2000), Copycat kids? The influence of Television Advertising on Children and Teenagers.http://www.ofcom.org.uk/research/consumer_audience_research/tv_audience_reports/copycat_kids.pdf
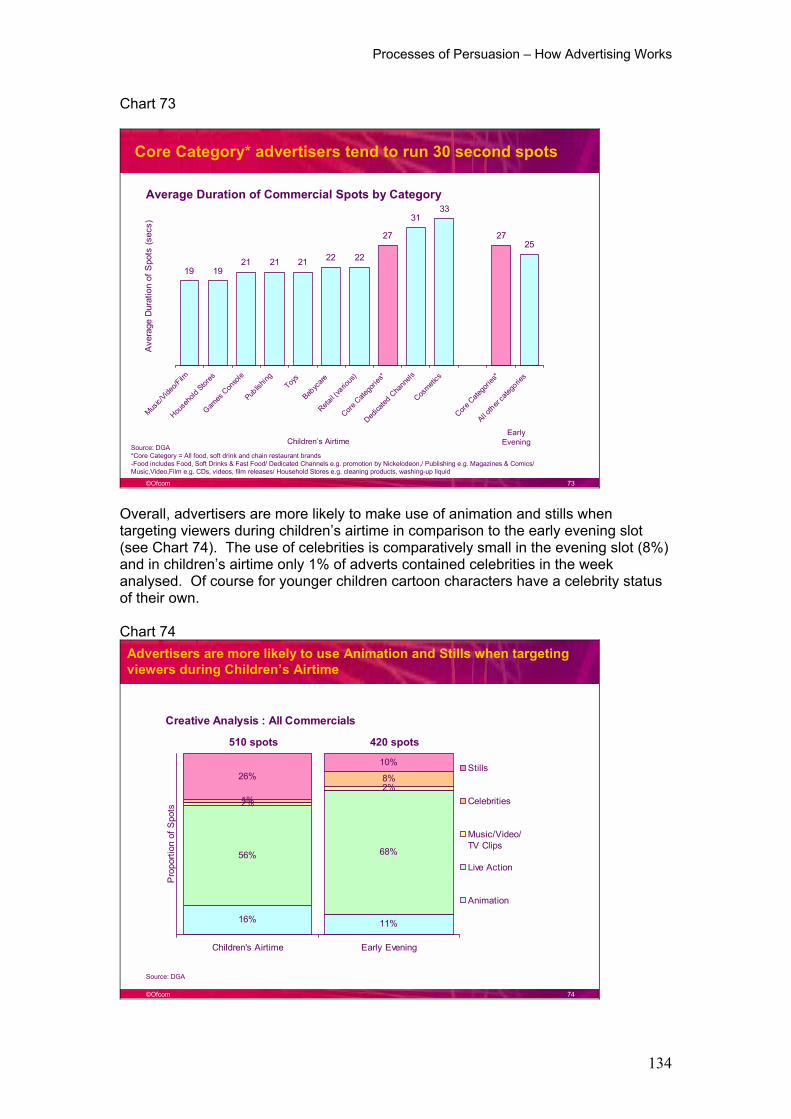
Processes of Persuasion � How Advertising Works
134
Chart 73
©Ofcom 73
Core Category* advertisers tend to run 30 second spots
19 1921 21 21 22 22
27
3133
2725
Music/
Video/F
ilm
House
hold
Stores
Games
Con
sole
Publish
ingToy
s
Babyc
are
Retail (
vario
us)
Core C
atego
ries*
Dedica
tedCha
nnels
Cosmeti
cs
Core C
atego
ries*
All other
categ
ories
Ave
rage
Dur
atio
n of
Spo
ts (s
ecs)
Average Duration of Commercial Spots by Category
Source: DGA*Core Category = All food, soft drink and chain restaurant brands-Food includes Food, Soft Drinks & Fast Food/ Dedicated Channels e.g. promotion by Nickelodeon,/ Publishing e.g. Magazines & Comics/ Music,Video,Film e.g. CDs, videos, film releases/ Household Stores e.g. cleaning products, washing-up liquid
Children�s AirtimeEarly
Evening
Overall, advertisers are more likely to make use of animation and stills when targeting viewers during children�s airtime in comparison to the early evening slot (see Chart 74). The use of celebrities is comparatively small in the evening slot (8%) and in children�s airtime only 1% of adverts contained celebrities in the week analysed. Of course for younger children cartoon characters have a celebrity status of their own.
Chart 74
©Ofcom 74
Creative Analysis : All Commercials
16% 11%
56% 68%
2%
2%1%
8%26%10%
Children's Airtime Early Evening
Pro
porti
on o
f Spo
ts
Stills
Celebrities
Music/Video/TV Clips
Live Action
Animation
Source: DGA
Advertisers are more likely to use Animation and Stills when targeting viewers during Children�s Airtime
510 spots 420 spots
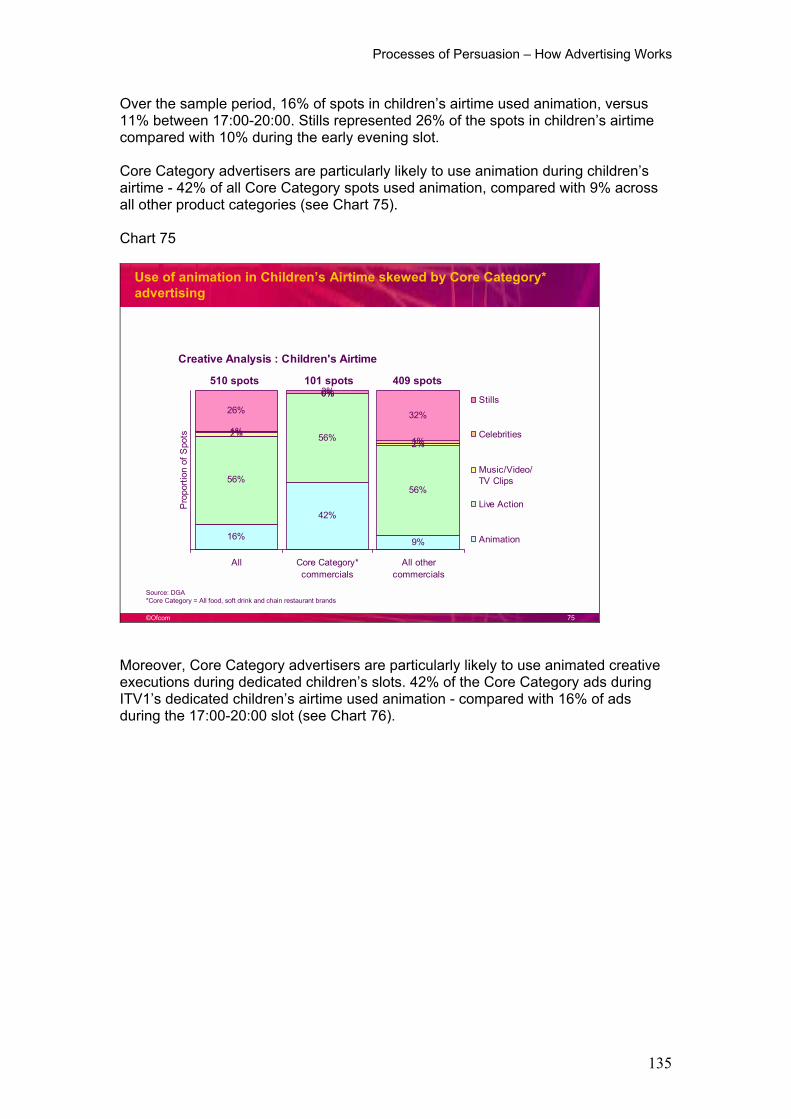
Processes of Persuasion � How Advertising Works
135
Over the sample period, 16% of spots in children�s airtime used animation, versus 11% between 17:00-20:00. Stills represented 26% of the spots in children�s airtime compared with 10% during the early evening slot.
Core Category advertisers are particularly likely to use animation during children�s airtime - 42% of all Core Category spots used animation, compared with 9% across all other product categories (see Chart 75).
Chart 75
©Ofcom 75
Use of animation in Children�s Airtime skewed by Core Category* advertising
Creative Analysis : Children's Airtime
16%
42%
9%
56%
56%
56%
2%
0%
2%1%
0%
1%
26%
2%
32%
All Core Category*commercials
All othercommercials
Pro
porti
on o
f Spo
ts
Stills
Celebrities
Music/Video/TV Clips
Live Action
Animation
510 spots 101 spots 409 spots
Source: DGA*Core Category = All food, soft drink and chain restaurant brands
Moreover, Core Category advertisers are particularly likely to use animated creative executions during dedicated children�s slots. 42% of the Core Category ads during ITV1�s dedicated children�s airtime used animation - compared with 16% of ads during the 17:00-20:00 slot (see Chart 76).
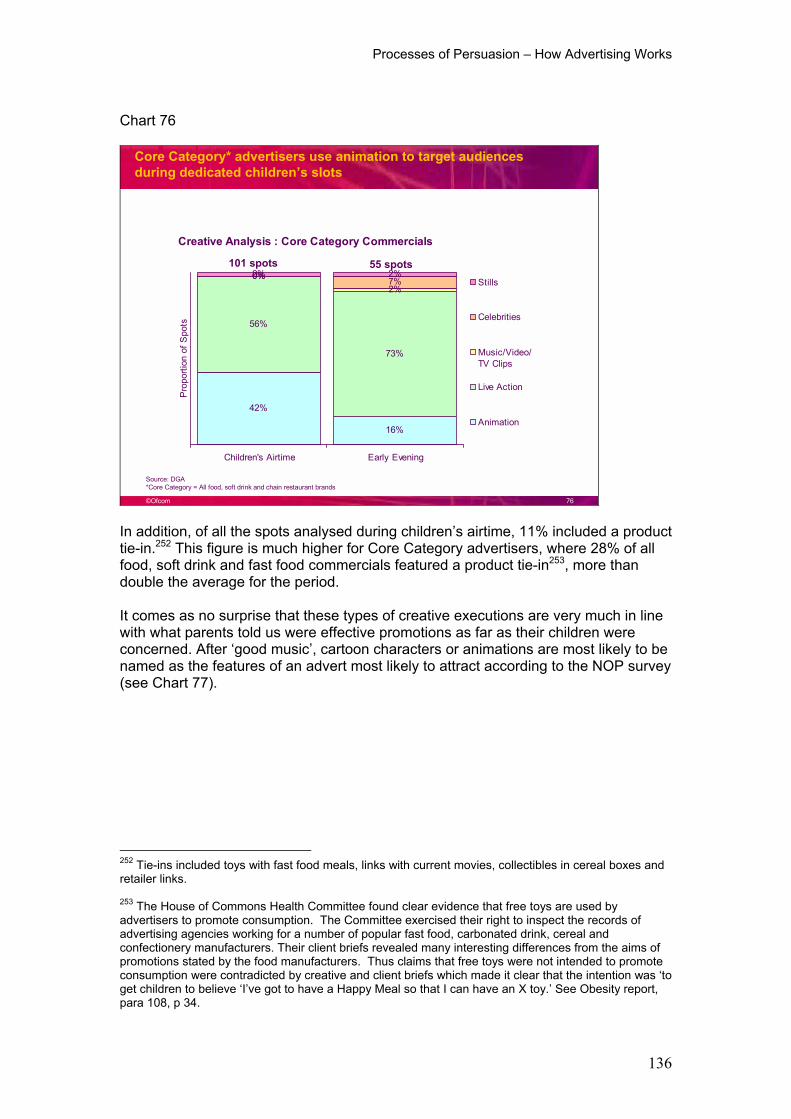
Processes of Persuasion � How Advertising Works
136
Chart 76
©Ofcom 76
Source: DGA*Core Category = All food, soft drink and chain restaurant brands
Core Category* advertisers use animation to target audiences during dedicated children�s slots
Creative Analysis : Core Category Commercials
42%
16%
56%
73%
0%2%
0% 7%2% 2%
Children's Airtime Early Evening
Pro
porti
on o
f Spo
ts
Stills
Celebrities
Music/Video/TV Clips
Live Action
Animation
101 spots 55 spots
In addition, of all the spots analysed during children�s airtime, 11% included a product tie-in.252 This figure is much higher for Core Category advertisers, where 28% of all food, soft drink and fast food commercials featured a product tie-in253, more than double the average for the period.
It comes as no surprise that these types of creative executions are very much in line with what parents told us were effective promotions as far as their children were concerned. After �good music�, cartoon characters or animations are most likely to be named as the features of an advert most likely to attract according to the NOP survey (see Chart 77).
252 Tie-ins included toys with fast food meals, links with current movies, collectibles in cereal boxes and retailer links.
253 The House of Commons Health Committee found clear evidence that free toys are used by advertisers to promote consumption. The Committee exercised their right to inspect the records of advertising agencies working for a number of popular fast food, carbonated drink, cereal and confectionery manufacturers. Their client briefs revealed many interesting differences from the aims of promotions stated by the food manufacturers. Thus claims that free toys were not intended to promote consumption were contradicted by creative and client briefs which made it clear that the intention was �to get children to believe �I�ve got to have a Happy Meal so that I can have an X toy.� See Obesity report, para 108, p 34.

Processes of Persuasion � How Advertising Works
137
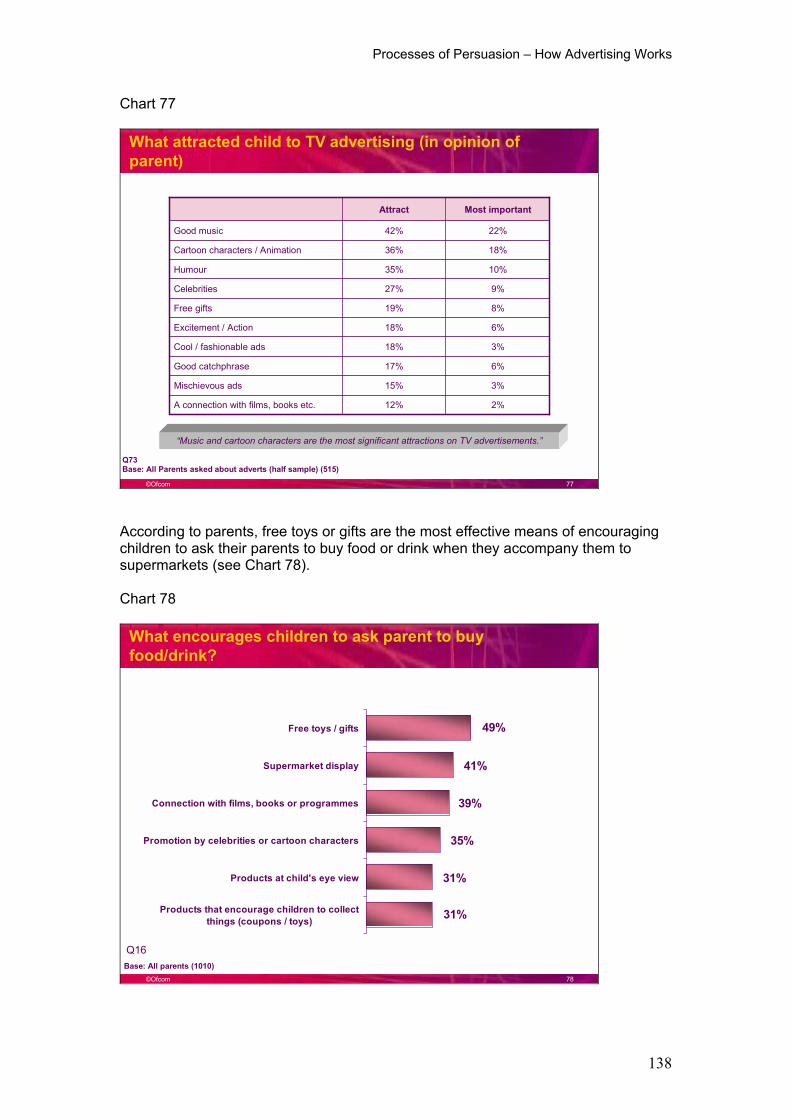
Processes of Persuasion � How Advertising Works
138
Chart 77
©Ofcom 77
What attracted child to TV advertising (in opinion of parent)
Base: All Parents asked about adverts (half sample) (515)Q73
�Music and cartoon characters are the most significant attractions on TV advertisements.�
3%18%Cool / fashionable ads
9%27%Celebrities
18%36%Cartoon characters / Animation
2%
3%
6%
6%
8%
10%
22%
Most importantAttract
12%A connection with films, books etc.
15%Mischievous ads
18%Excitement / Action
35%Humour
17%Good catchphrase
19%Free gifts
42%Good music
According to parents, free toys or gifts are the most effective means of encouraging children to ask their parents to buy food or drink when they accompany them to supermarkets (see Chart 78).
Chart 78
©Ofcom 78
31%
31%
35%
39%
41%
49%Free toys / gifts
Supermarket display
Connection with films, books or programmes
Promotion by celebrities or cartoon characters
Products at child's eye view
Products that encourage children to collectthings (coupons / toys)
What encourages children to ask parent to buy food/drink?
Base: All parents (1010)
Q16
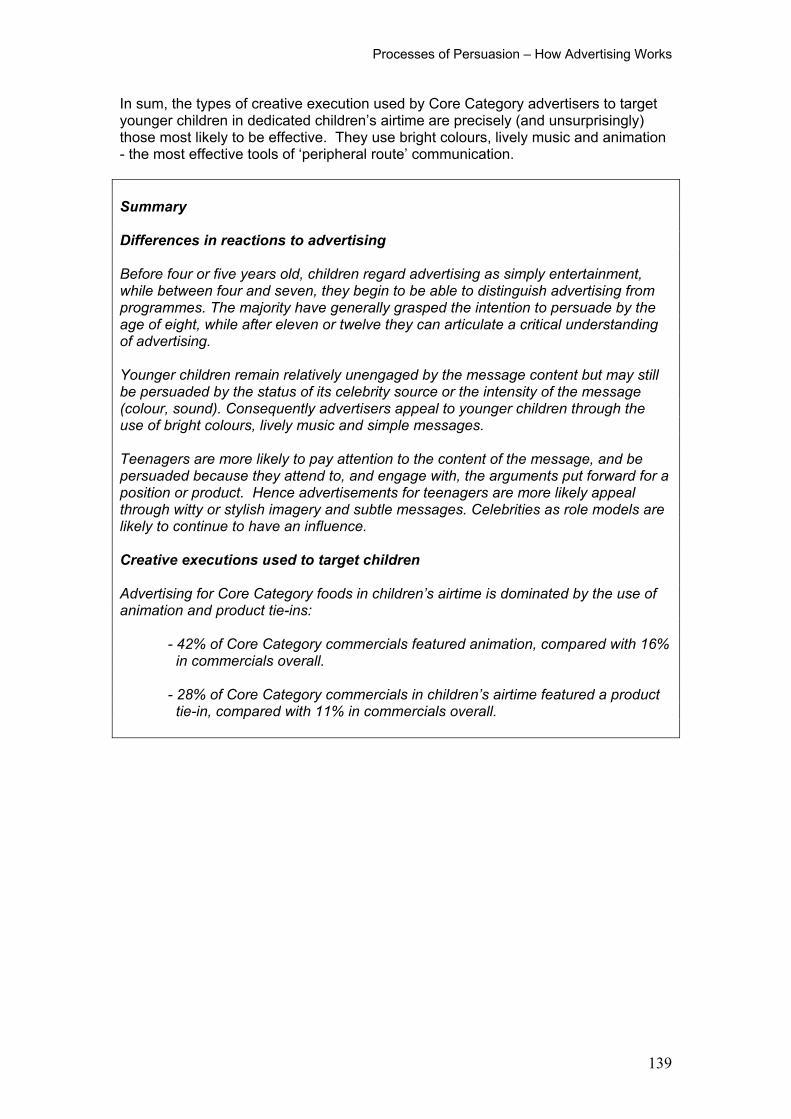
Processes of Persuasion � How Advertising Works
139
In sum, the types of creative execution used by Core Category advertisers to target younger children in dedicated children�s airtime are precisely (and unsurprisingly) those most likely to be effective. They use bright colours, lively music and animation - the most effective tools of �peripheral route� communication.
Summary
Differences in reactions to advertising
Before four or five years old, children regard advertising as simply entertainment, while between four and seven, they begin to be able to distinguish advertising from programmes. The majority have generally grasped the intention to persuade by the age of eight, while after eleven or twelve they can articulate a critical understanding of advertising.
Younger children remain relatively unengaged by the message content but may still be persuaded by the status of its celebrity source or the intensity of the message (colour, sound). Consequently advertisers appeal to younger children through the use of bright colours, lively music and simple messages.
Teenagers are more likely to pay attention to the content of the message, and be persuaded because they attend to, and engage with, the arguments put forward for a position or product. Hence advertisements for teenagers are more likely appeal through witty or stylish imagery and subtle messages. Celebrities as role models are likely to continue to have an influence.
Creative executions used to target children
Advertising for Core Category foods in children�s airtime is dominated by the use of animation and product tie-ins:
- 42% of Core Category commercials featured animation, compared with 16% in commercials overall.
- 28% of Core Category commercials in children�s airtime featured a product tie-in, compared with 11% in commercials overall.
What Parents & Children Say About TV Advertising
140
3.7 What do parents and children say about television advertising?
In this section we examine:
- the reactions of children and their parents to television advertising in general
- the influence of branding - parents� views on the regulation of advertising to children - regulation of advertising to children in other countries.
3.7.1 Children�s reactions
Ofcom�s qualitative research shows that children actively enjoy television advertising. It entertains them and is part of the pleasure they derive from watching television. It is also part of a shared culture with family and friends.
�With quite funny ones you go to school and say �Have you seen that ad?� like the Kinder boy and the chocolate ad�..Sometimes talk about really boring ones.. start making fun of them.� (Boy aged 9-11, AB, South England)
They also see adverts as their most frequent source of information about food products.
�TV is where I hear about things that are the most yummy.� (Boy aged 7-9, DE South England)
When the moderators in our qualitative groups asked children to free-associate with brand names, it was television advertising imagery which framed how they talked about products. This imagery was invariably positive.
E.g. Moderator says �Frosties?�
�Frosties bar.� �My breakfast.� �Frosties cereals. �Frosties tiger. �Tiger roaring �Cock-a-doodle-doo, that�s Kellogg�s cornflakes because they get you up in the morning.�
(Boys aged 7-9, DE, South England: Brand imagery exercise)
The NOP survey asked which kinds of adverts appealed to them most. The results showed that children most often mentioned funny adverts (28%) with good music (25%), and the next largest proportion talked about adverts with celebrities (15%).254
254 According to their parents, children are most attracted to adverts with good music (22%), and cartoon characters (18%). Humorous adverts came next (10%) and then adverts with celebrities (9%).
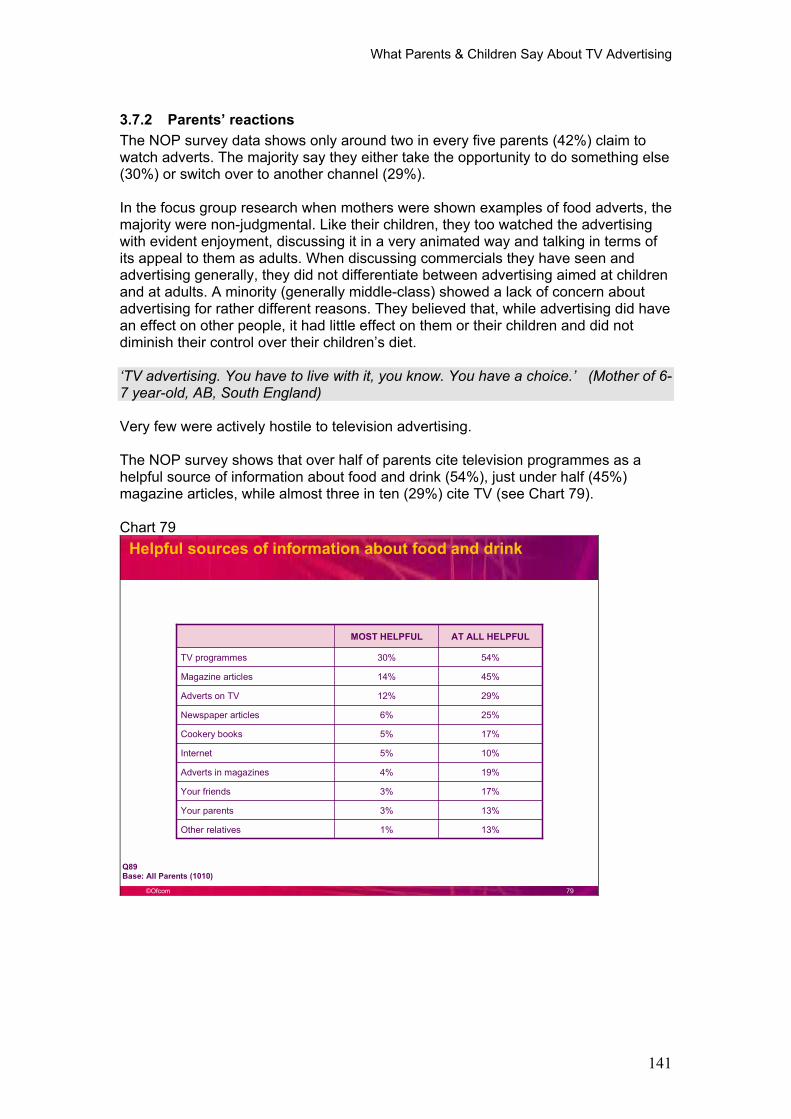
What Parents & Children Say About TV Advertising
141
3.7.2 Parents� reactions The NOP survey data shows only around two in every five parents (42%) claim to watch adverts. The majority say they either take the opportunity to do something else (30%) or switch over to another channel (29%).
In the focus group research when mothers were shown examples of food adverts, the majority were non-judgmental. Like their children, they too watched the advertising with evident enjoyment, discussing it in a very animated way and talking in terms of its appeal to them as adults. When discussing commercials they have seen and advertising generally, they did not differentiate between advertising aimed at children and at adults. A minority (generally middle-class) showed a lack of concern about advertising for rather different reasons. They believed that, while advertising did have an effect on other people, it had little effect on them or their children and did not diminish their control over their children�s diet.
�TV advertising. You have to live with it, you know. You have a choice.� (Mother of 6-7 year-old, AB, South England)
Very few were actively hostile to television advertising.
The NOP survey shows that over half of parents cite television programmes as a helpful source of information about food and drink (54%), just under half (45%) magazine articles, while almost three in ten (29%) cite TV (see Chart 79).
Chart 79
©Ofcom 79
Helpful sources of information about food and drink
Base: All Parents (1010)Q89
13%1%Other relatives
17%5%Cookery books
25%6%Newspaper articles
45%14%Magazine articles
13%
17%
19%
10%
29%
54%
AT ALL HELPFULMOST HELPFUL
3%Your parents
3%Your friends
4%Adverts in magazines
12%Adverts on TV
5%Internet
30%TV programmes
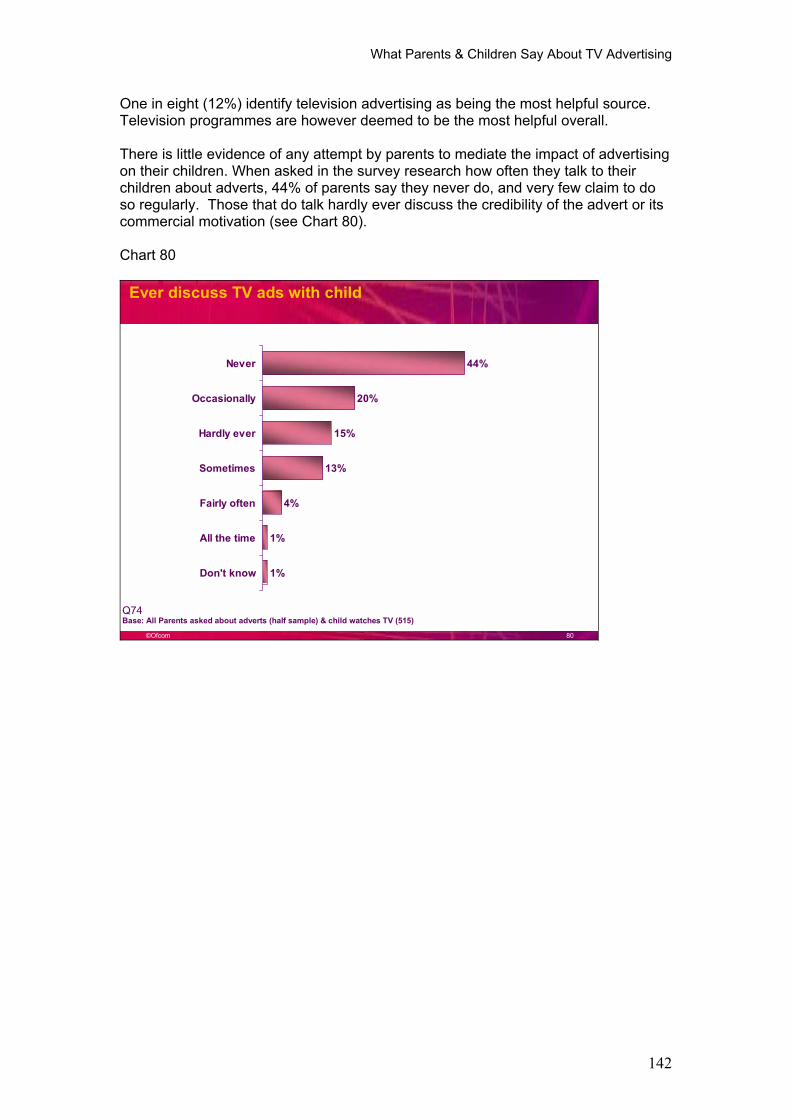
What Parents & Children Say About TV Advertising
142
One in eight (12%) identify television advertising as being the most helpful source. Television programmes are however deemed to be the most helpful overall.
There is little evidence of any attempt by parents to mediate the impact of advertising on their children. When asked in the survey research how often they talk to their children about adverts, 44% of parents say they never do, and very few claim to do so regularly. Those that do talk hardly ever discuss the credibility of the advert or its commercial motivation (see Chart 80).
Chart 80
©Ofcom 80
44%
20%
15%
13%
4%
1%
1%
Never
Occasionally
Hardly ever
Sometimes
Fairly often
All the time
Don't know
Ever discuss TV ads with child
Base: All Parents asked about adverts (half sample) & child watches TV (515)Q74
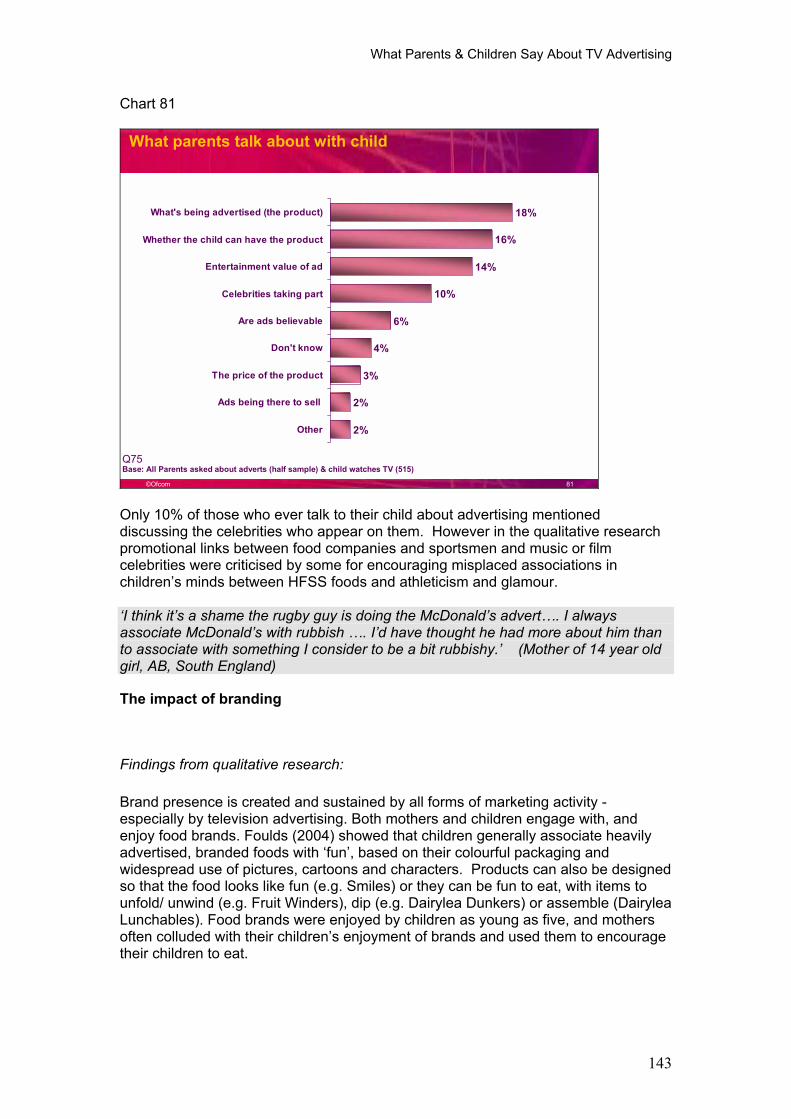
What Parents & Children Say About TV Advertising
143
Chart 81
©Ofcom 81
18%
16%
14%
10%
6%
4%
3%
2%
2%
What's being advertised (the product)
Whether the child can have the product
Entertainment value of ad
Celebrities taking part
Are ads believable
Don't know
The price of the product
Ads being there to sell
Other
What parents talk about with child
Base: All Parents asked about adverts (half sample) & child watches TV (515)Q75
Only 10% of those who ever talk to their child about advertising mentioned discussing the celebrities who appear on them. However in the qualitative research promotional links between food companies and sportsmen and music or film celebrities were criticised by some for encouraging misplaced associations in children�s minds between HFSS foods and athleticism and glamour.
�I think it�s a shame the rugby guy is doing the McDonald�s advert�. I always associate McDonald�s with rubbish �. I�d have thought he had more about him than to associate with something I consider to be a bit rubbishy.� (Mother of 14 year old girl, AB, South England)
The impact of branding
Findings from qualitative research:
Brand presence is created and sustained by all forms of marketing activity - especially by television advertising. Both mothers and children engage with, and enjoy food brands. Foulds (2004) showed that children generally associate heavily advertised, branded foods with �fun�, based on their colourful packaging and widespread use of pictures, cartoons and characters. Products can also be designed so that the food looks like fun (e.g. Smiles) or they can be fun to eat, with items to unfold/ unwind (e.g. Fruit Winders), dip (e.g. Dairylea Dunkers) or assemble (Dairylea Lunchables). Food brands were enjoyed by children as young as five, and mothers often colluded with their children�s enjoyment of brands and used them to encourage their children to eat.
What Parents & Children Say About TV Advertising
144
�I used to buy just normal shop spaghetti and they wouldn�t eat it, but they will eat Bob the Builder on �.. you show them the tin and what I�m cooking them, then they will eat.� (Mother of obese 5 year-old girl/ North England)
Children�s potential as consumers is of course well recognised by marketers, as instanced in the development of �cradle-to-grave� marketing in which attempts are made to build up a relationship between the child and a brand.255 Effectively marketed, brands generate recognition, familiarity and even affection amongst both mothers and children. Well-known brands impart status or �cool� to the user and in the area of food for children there appear to be a proliferation of �cool� brands.256
�Coke and Dr Pepper is cool ��the taste �� and you drink it with your mates and everything.� (Girl/ C1C2/9-11/Wales)
�People might put Sainsbury�s own or Tesco�s own crisps and put it in the child�s lunchbox and children make fun of them because they haven�t got Walkers or McCoys. �Your mum can�t afford to.� It�s peer pressure.� (Mother of 3-4 year �old/DE/Scotland)
Brands are also seen as quality indicators, intrinsically better than unbranded goods.
�If I was a rich man, do you think I would buy him rubbish like that <supermarket own label>? I�d buy him a known brand� (Father of obese 8 year old/DE/South England)
�Normally you look for a brand, like a quality kind of thing.� (Boy/C1C2/11-13/North England)
Foulds (2004) found that many mothers are receptive to health claims in commercials for children�s food. However, well-known brands can promote �unhealthy� foods and sometimes assert health claims (e.g. high in calcium) for foods that have other �unhealthy� aspects (e.g. high in salt).257
This can produce confusion amongst mothers about healthy dietary options. Consequently, misleading health claims are a source of concern:
�Fruit Winders � I thought they would be good but they�re not. Full of sugar � terrible for teeth. But it�s the way they say it � �fruit� and �Kellogg�s�. You think it�ll be good.� (Mother/DE/8-11/Scotland)
255 M.F. Ji, Children�s relationship with brands: �True Love� or �One-Night Stand�? Psychology and Marketing, 19 (4). 369-87; M Lindstrom and P Seybold, BRANDchild, 2003. Cited in House of Commons Health Committee (2004) Obesity Third Report of Session 2003-2004 Volume 1, para 103. p.33. London: The Stationery Office Limited.
256 The House of Commons Health Committee confirms that �marketing efforts come together in evocative brands that have great emotional and psychological power. In a world increasingly dominated by such brands it is noticeable that the market leaders in the food industry � Coca Cola, McDonalds, Walkers � represent relatively unhealthy food options and are aimed heavily at children.� Obesity Third Report of Session 2003-2004 Volume 1, para 99. p.31. London: The Stationery Office Limited.
257 The House of Commons Health Committee (see para 204, p 60 of its Obesity report) were particularly struck by the example of the Kellogg�s cereal Frosties Turbos, which claims to be low in fat as well as good for bones, concentration and heart health. The eye-catching symbols on the front of the packet make no mention however of the fact that the product is 40% sugar and that other less sugary cereals might provide the same benefits with fewer calories.
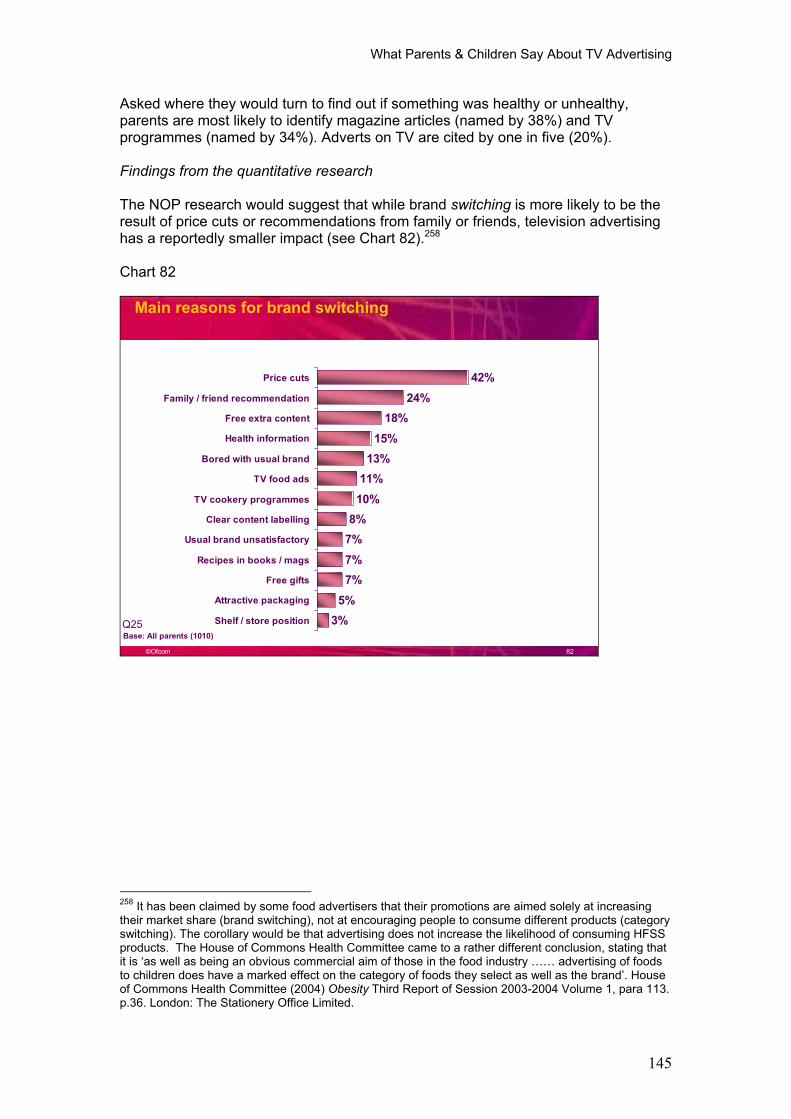
What Parents & Children Say About TV Advertising
145
Asked where they would turn to find out if something was healthy or unhealthy, parents are most likely to identify magazine articles (named by 38%) and TV programmes (named by 34%). Adverts on TV are cited by one in five (20%).
Findings from the quantitative research
The NOP research would suggest that while brand switching is more likely to be the result of price cuts or recommendations from family or friends, television advertising has a reportedly smaller impact (see Chart 82).258
Chart 82
©Ofcom 82
42%24%
18%15%
13%11%
10%8%
7%7%7%
5%3%
Price cuts
Family / friend recommendation
Free extra content
Health information
Bored with usual brand
TV food ads
TV cookery programmes
Clear content labelling
Usual brand unsatisfactory
Recipes in books / mags
Free gifts
Attractive packaging
Shelf / store position
Main reasons for brand switching
Base: All parents (1010)Q25
258 It has been claimed by some food advertisers that their promotions are aimed solely at increasing their market share (brand switching), not at encouraging people to consume different products (category switching). The corollary would be that advertising does not increase the likelihood of consuming HFSS products. The House of Commons Health Committee came to a rather different conclusion, stating that it is �as well as being an obvious commercial aim of those in the food industry �� advertising of foods to children does have a marked effect on the category of foods they select as well as the brand�. House of Commons Health Committee (2004) Obesity Third Report of Session 2003-2004 Volume 1, para 113. p.36. London: The Stationery Office Limited.
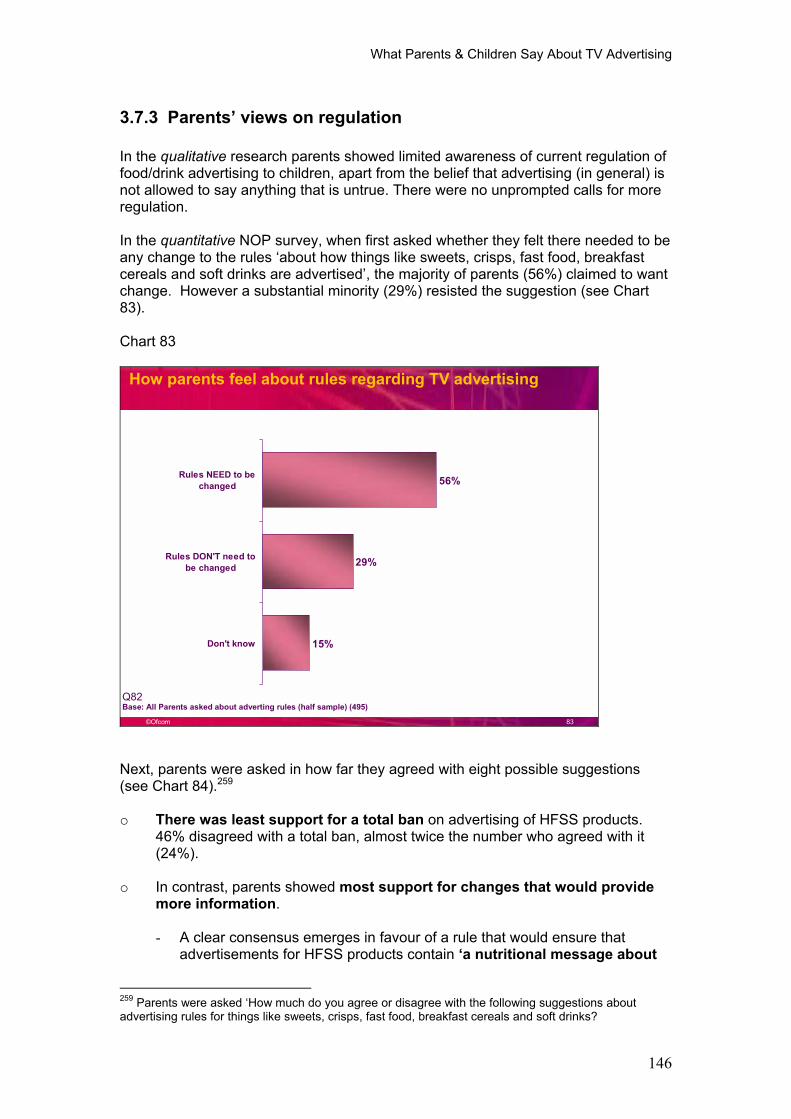
What Parents & Children Say About TV Advertising
146
3.7.3 Parents� views on regulation
In the qualitative research parents showed limited awareness of current regulation of food/drink advertising to children, apart from the belief that advertising (in general) is not allowed to say anything that is untrue. There were no unprompted calls for more regulation.
In the quantitative NOP survey, when first asked whether they felt there needed to be any change to the rules �about how things like sweets, crisps, fast food, breakfast cereals and soft drinks are advertised�, the majority of parents (56%) claimed to want change. However a substantial minority (29%) resisted the suggestion (see Chart 83).
Chart 83
©Ofcom 83
56%
29%
15%
Rules NEED to bechanged
Rules DON'T need tobe changed
Don't know
How parents feel about rules regarding TV advertising
Base: All Parents asked about adverting rules (half sample) (495)Q82
Next, parents were asked in how far they agreed with eight possible suggestions (see Chart 84).259
o There was least support for a total ban on advertising of HFSS products. 46% disagreed with a total ban, almost twice the number who agreed with it (24%).
o In contrast, parents showed most support for changes that would provide more information.
- A clear consensus emerges in favour of a rule that would ensure that advertisements for HFSS products contain �a nutritional message about
259 Parents were asked �How much do you agree or disagree with the following suggestions about advertising rules for things like sweets, crisps, fast food, breakfast cereals and soft drinks?
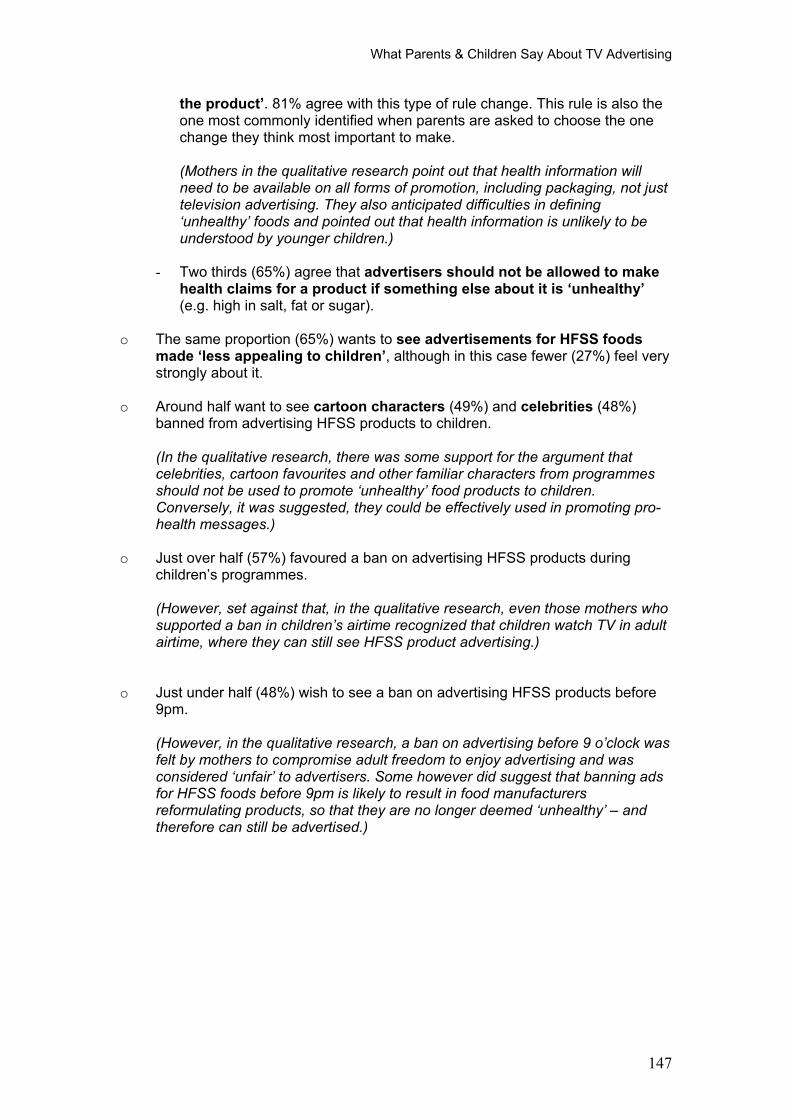
What Parents & Children Say About TV Advertising
147
the product�. 81% agree with this type of rule change. This rule is also the one most commonly identified when parents are asked to choose the one change they think most important to make.
(Mothers in the qualitative research point out that health information will need to be available on all forms of promotion, including packaging, not just television advertising. They also anticipated difficulties in defining �unhealthy� foods and pointed out that health information is unlikely to be understood by younger children.)
- Two thirds (65%) agree that advertisers should not be allowed to make health claims for a product if something else about it is �unhealthy�(e.g. high in salt, fat or sugar).
o The same proportion (65%) wants to see advertisements for HFSS foods made �less appealing to children�, although in this case fewer (27%) feel very strongly about it.
o Around half want to see cartoon characters (49%) and celebrities (48%) banned from advertising HFSS products to children.
(In the qualitative research, there was some support for the argument that celebrities, cartoon favourites and other familiar characters from programmes should not be used to promote �unhealthy� food products to children. Conversely, it was suggested, they could be effectively used in promoting pro-health messages.)
o Just over half (57%) favoured a ban on advertising HFSS products during children�s programmes.
(However, set against that, in the qualitative research, even those mothers who supported a ban in children�s airtime recognized that children watch TV in adult airtime, where they can still see HFSS product advertising.)
o Just under half (48%) wish to see a ban on advertising HFSS products before 9pm.
(However, in the qualitative research, a ban on advertising before 9 o�clock was felt by mothers to compromise adult freedom to enjoy advertising and was considered �unfair� to advertisers. Some however did suggest that banning ads for HFSS foods before 9pm is likely to result in food manufacturers reformulating products, so that they are no longer deemed �unhealthy� � and therefore can still be advertised.)
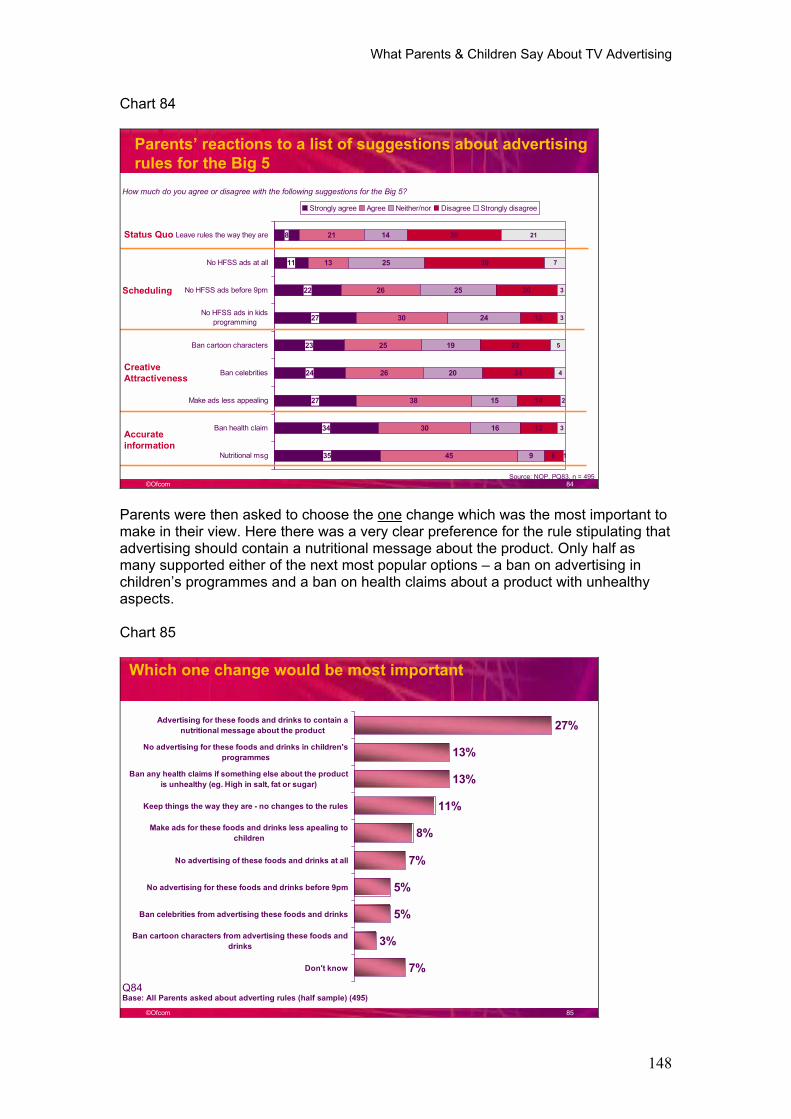
What Parents & Children Say About TV Advertising
148
Chart 84
©Ofcom 84
Parents� reactions to a list of suggestions about advertising rules for the Big 5
35
34
27
24
23
27
22
11
8
45
30
38
26
25
30
26
13
21
9
16
15
20
19
24
25
25
14
6
12
14
24
23
12
20
39
30
1
3
2
4
5
3
3
7
21
Nutritional msg
Ban health claim
Make ads less appealing
Ban celebrities
Ban cartoon characters
No HFSS ads in kidsprogramming
No HFSS ads before 9pm
No HFSS ads at all
Leave rules the way they are
Strongly agree Agree Neither/nor Disagree Strongly disagree
How much do you agree or disagree with the following suggestions for the Big 5?
Source: NOP, PQ83, n = 495
Status Quo
Scheduling
Creative Attractiveness
Accurate information
Parents were then asked to choose the one change which was the most important to make in their view. Here there was a very clear preference for the rule stipulating that advertising should contain a nutritional message about the product. Only half as many supported either of the next most popular options � a ban on advertising in children�s programmes and a ban on health claims about a product with unhealthy aspects.
Chart 85
©Ofcom 85
27%
13%
13%
11%
8%
7%
5%
5%
3%
7%
Advertising for these foods and drinks to contain anutritional message about the product
No advertising for these foods and drinks in children'sprogrammes
Ban any health claims if something else about the productis unhealthy (eg. High in salt, fat or sugar)
Keep things the way they are - no changes to the rules
Make ads for these foods and drinks less apealing tochildren
No advertising of these foods and drinks at all
No advertising for these foods and drinks before 9pm
Ban celebrities from advertising these foods and drinks
Ban cartoon characters from advertising these foods anddrinks
Don't know
Which one change would be most important
Base: All Parents asked about adverting rules (half sample) (495)Q84
What Parents & Children Say About TV Advertising
149
At this point parents were once again given the opportunity of saying that no changes should be made. Having been exposed to the change options, there was a substantial drop in the numbers against change. Now only 11% wanted to �keep things they way they are�.
Teachers and nutritionists
Teachers and nutritionists were also approached in the qualitative project and asked for their views. These professional groups, like parents, showed little awareness of present regulation beyond an understanding that advertisers are not allowed to make false claims for a product. They felt there was a need for more regulation and tighter control of advertising and other forms of promotion of foods aimed at children. However they were sceptical about its effectiveness. They believed that advertisers would find ways to circumvent any restrictions imposed upon them. The regulatory options which they felt to be the most promising were:
- no advertising of HFSS foods to be shown round children�s programmes
- make the advertising of HFSS foods less attractive to children
- ban any kind of health/nutritional claim if the product has unhealthy aspects.
What Parents & Children Say About TV Advertising
150
3.7.4 Regulation of advertising to children in other countries
Regulation regarding advertising in relation to children is now in place in some European countries. Sweden represents the most extreme case: there is a ban on all advertising directed at children (defined as all under the age of 12). In addition, advertisers are not allowed to use children�s voices or show children buying products or asking their parents to buy products on any other type of advertising even when directed at adults. After 21:00 the rules are relaxed, but if there is a special event that children might be likely to watch, then the same strictness applies.
Regulation aimed specifically at food advertising is rare260 and seems to have sprung from a concern for dental health and so has focussed on sugary food products.261 In the Netherlands, for example, advertising must not stimulate or justify excessive use of sweet products; and should not suggest that sweets can replace common meals. Advertising must not portray those who do not wish to consume sweets in a negative way; it should not associate sweets with health or say that low sugared sweets cause fewer cavities. No situations can be shown in which sweets are consumed just before going to bed or just after brushing teeth. An icon of a toothbrush must be shown on all advertisements for sweets and for children under 14 years old this toothbrush has to have a minimum size of 1.5x1.0 cm.
However, a recurring problem with all television and broadcasting regulations in the Netherlands and Sweden is that broadcasters based in other countries are not obliged to comply with these rules and thus the regulations are not as effective as they were intended to be.
More significantly, in most cases the effects of regulation have been little evaluated. Indeed, Livingstone and Helsper (2004) contend that �the instigation and implementation of regulation draws more on moral anxieties than on evidence-based policy making�.262
Where there has been research on the effectiveness of bans on food advertising in relation to obesity, the conclusions are, at best, both unclear and contested. Goldberg (1990)263 and Caron (1994)264 have argued that the banning of advertising on Canadian television did have an effect, as evidenced by the lower rates of obesity among French-speaking children (who were subject to the ban) than English-speaking children (who could still watch American commercial television from across the border). However, since no baseline measures were taken before the ban was implemented, the possibility remains that the French/English difference is long-standing and cultural rather than a result of the ban. Indeed, a recent study on the effect of advertising bans on childhood obesity shows that obesity does not diminish
260 See Hastings et al 2003.
261 These regulations are now being reconsidered for their applicability towards other non-healthy foods, such as fast foods and soft drinks.
262 See Livingstone, S and Helsper, E. (April, 2004) Advertising HFSS foods to children: Understanding Promotion In The Context Of Children�s Daily Lives, p31.
263 Goldberg, M. E. (1990). A Quasi-Experiment Assessing the Effectiveness of TV- Advertising Directed to Children. Journal of Marketing Research, 27(4), 445-454.
264 Caron, A. (1994). Children, advertising and television choices in a new media environment. Paper presented at the Children and advertising: a fair game?
What Parents & Children Say About TV Advertising
151
in countries (Sweden and Quebec) where advertising to children has been banned (Ashton 2004).265 This report also claimed that the evidence would lead us to blame not calorie intake but lack of exercise (itself potentially related to television viewing) for the growing problem of obesity. On the other hand, within the advertising industry it is argued that ceasing to advertise results in reduced consumption of the product � hence the use of �defensive advertising� (Johnson and Daniels 2000).266
In view of the paucity of research evidence on the effectiveness of banning food advertising, many researchers look to studies of tobacco and alcohol advertising bans to predict if a ban of �unhealthy� food advertising could make a difference.
Bans on alcohol and tobacco advertising
Two main arguments are advanced by those who contend that extrapolation from research on tobacco and alcohol advertising to HFSS food advertising is inappropriate:
- tobacco and alcohol are physically addictive while food is not.
- food is essential for survival, while alcohol and tobacco are for the most part detrimental to health.
These reservations apart, research findings on the effectiveness of banning alcohol and tobacco advertising are inconclusive at best.
For example, in countries which have banned alcohol advertising, there are lower levels of alcohol abuse and related negative effects of alcohol use (Young 1993).267
However, countries that already have lower levels of alcohol abuse are also more likely to impose bans on alcohol advertising. When Young (1993)268 controlled for such cultural factors, the relationship between bans and alcohol consumption disappeared (see also Fisher 1993).269
A similar pattern emerges when data are analysed on an aggregate level for bans on tobacco advertising. An international comparison across countries that have advertising bans on smoking found that they neither have lower levels of smokers nor was smoking reduced, following imposition of a ban (Bedewing 1994)270, although health warnings on cigarette packages do seem to have an effect (Stewart 1993).271
265 Ashton, D. (2004). Food advertising and obesity. Journal of the Royal Society of Medicine, 97 (2), 51-52.
266 Johnson, M., and Daniels, M. (2000). Why happy meals advertising makes McDonalds smile. A demonstration of advertising in a defensive role. Sydney: Advertising federation of Australia.
267 Young, D. J. (1993). Alcohol Advertising Bans and Alcohol-Abuse - Comment. Journal of Health Economics, 12(2), 213-228.
268 Young, D. J. (1993). Alcohol Advertising Bans and Alcohol-Abuse - Comment. Journal of Health Economics, 12(2), 213-228.
269 Fisher, J. C. (1993). Advertising, alcohol consumption, and abuse. A worldwide survey. Westport: Greenwood Press.
270 Boddewyn, J. J. (1994). The Effects of Tobacco Sales Promotion on Initiation of Smoking. Scandinavian Journal of Social Medicine, 22(3), 235-236.
271 Stewart, M. J. (1993). The effect on Tobacco Consumption of advertising in OECD countries. International Journal of Advertising, 12, 155-180.
What Parents & Children Say About TV Advertising
152
A number of meta-analysis studies have been conducted, and in general they show that tobacco advertising bans have at most weak and temporary effects (Duffy 1996,272 Lancaster and Lancaster (2003273). Ambler (1996)274 studied the effect of advertising bans on the consumption of tobacco and found no support for either the weak theory (that there is an indirect effect of advertising) or for the strong theory (direct effect advertising bans); indeed, he found that advertising does not affect total market size. Since in general, then, advertising bans have been found to be ineffective, Duffy (1996)275 recommends that research should now examine the possibility of different effects for different groups (teenagers, adults etc) instead of just measuring effects for the population in aggregate.
It is also suggested that bans are only likely to work if they encompass all forms of promotion. They are unlikely to be effective if only one medium (e.g. television advertising) is restricted. The W.H.O. state:
�Policy makers who are interested in controlling tobacco need to know whether cigarette advertising and promotion affect consumption. The answer is that they almost certainly do, although the data are not straightforward. The key conclusion is that bans on advertising and promotion prove effective, but only if they are comprehensive, covering all media and all uses of brand names and logos�.
When governments ban tobacco advertising in one medium, such as TV, the industry can substitute advertising in other media with little or no effect on overall marketing expenditures... . A recent study of 22 high income countries based on data from 1970 to 1992 concluded that comprehensive bans on cigarette advertising and promotion can reduce smoking, but more limited partial bans have little or no effect. If the most comprehensive restrictions were in place, the study concluded, tobacco consumption would fall by more than 6% in high income countries..�276
272 Duffy, M. (1996). Econometric Studies of Advertising, Advertising restrictions and cigarette demand: a survey. International journal of advertising, 15, 1-23. Lancaster, K. M., and Lancaster, A.R. (2003). The economics of tobacco advertising: spending, demand, and the effects of bans. International journal of advertising, 22(1), 41-65.
273 Lancaster, K. M., and Lancaster, A.R. (2003). The economics of tobacco advertising: spending, demand, and the effects of bans. International journal of advertising, 22(1), 41-65.
274 Ambler, T. (1996). Can alcohol misuse be reduced by banning advertising? International journal of advertising, 15, 167-174.
275 Duffy, M. (1996). Econometric Studies of Advertising, Advertising restrictions and cigarette demand: a survey. International journal of advertising, 15, 1-23.
276 W.H.O. Curbing the Epidemic � Governments and the Economics of Tobacco Control. ISBN 0-8213-4519-2.
What Parents & Children Say About TV Advertising
153
Cultural differences between UK and other countries
We may also query whether lessons from elsewhere can necessarily be applied in the UK context. Interestingly, there is rather little discussion about this within the academic literature.
Livingstone and Helsper (2004)277 point to a number of cross-national variations that could affect the interpretation of findings across countries. For example, in studies of eating patterns across Europe (EUFIC 1999, 2002)278, the UK differs in one important aspect from other European countries: UK children apparently eat without their parents present more often than children in other EU countries. While children in Italy, Germany and France eat at least half of their daytime meals (breakfast and lunch) with their parents, in the UK only one third do so. This suggests that in the UK there may be less parental monitoring of what children eat and, perhaps, a greater frequency of eating while watching television.
In studies of children�s leisure across Europe (Livingstone and Bovill, 2001)279, the UK again stands out, this time for a higher frequency of children having a television and other media goods in their bedrooms, and a higher dissatisfaction among UK children when evaluating the leisure opportunities available outside the home. Taken together, this suggests that UK children may have a more sedentary lifestyle, take less exercise and have more individualised, home-based habits.280 Such factors could well be expected to mediate the effect of television advertising on children and result in stronger media-related effects.
In conclusion, however, it should be noted that none of the research conducted on the effects of television advertising in the UK contradicts findings obtained from other countries. This suggests that the potential is there to learn from outcomes in other countries. Unfortunately, there is an absence of clear-cut lessons developed elsewhere that can be applied in the UK.
277 Livingstone, S and Helsper, E. (April, 2004) Advertising HFSS foods to children: Understanding Promotion In The Context Of Children�s Daily Lives, p32.
278 Eufic. (1999). Current eating and drinking patterns. London: Eufic. Eufic. (2002). Exess weight in childhood and adolescence: prevalence and problems. London: Eufic.
279 Livingstone, S. and Bovill, M. (2001). Children and their Changing Media Environment: A European Comparative Study. Hillsdale, N.J.: Lawrence Erlbaum Associates.
280 See Livingstone, S and Helsper, E. (April, 2004) Advertising HFSS foods to children: Understanding Promotion In The Context Of Children�s Daily Lives
What Parents & Children Say About TV Advertising
154
Summary
Views about advertisingParents and children actively enjoy television advertising. It entertains them and is part of the pleasure they derive from watching television. It is also part of a shared culture with family and friends.
Parents rarely attempt to discuss adverts with their children, and when they do, hardly ever talk about the credibility of the advert or its commercial motivation.
Both mothers and children engage with and enjoy food brands. Children generally associate heavily advertised, branded foods with �fun�, based on their colourful packaging and widespread use of pictures, cartoons and characters.
Brand presence is created and sustained by all forms of marketing activity � but especially by television advertising. Television advertising imagery frames how children talk about products. This imagery is invariably positive.
Views about regulation Parents show limited awareness of current regulation of food/drink advertising to children, apart from the belief that advertising (in general) is not allowed to say anything that is untrue.
Asked whether they feel there needs to be any change to the rules governing the advertising of HFSS foods, the majority of parents (58%) want some change. However a substantial minority (28%) resist the suggestion.
While least support came for a total ban on advertising for HFSS foods, parents do show a very clear preference for changes that will provide more information. A clear consensus (81%) emerges in favour of a rule that would ensure that advertisements for HFSS products contains �a nutritional message about the product�. This was also identified as the ONE rule change which was most likely to help.
Two thirds (65%) feel that advertisers should not be allowed to make health claims for any product if something else about it is unhealthy (e.g. high in salt, fat or sugar). A similar proportion, although fewer feel very strongly about it, want to see advertisements for HFSS foods made �less appealing to children�.
Just over half (57%) agree with a ban on advertising HFSS products during children�s programmes, and just under half a ban on advertising HFSS products before 9pm.
Surprisingly little research has sought to evaluate the effectiveness of television advertising regulation and there is even less on the banning of food advertising on TV. However, where there has been research on the effectiveness of TV advertising bans on food advertising in relation to obesity in other countries, the conclusions are at best both unclear and contested.
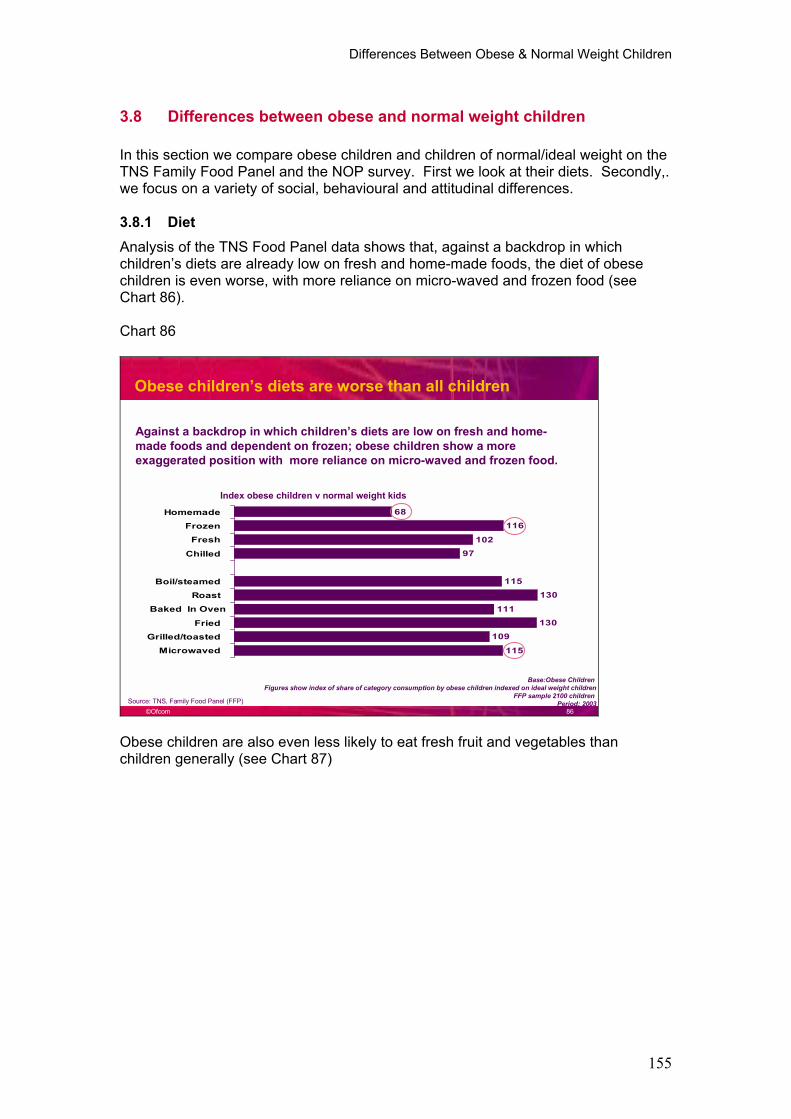
Differences Between Obese & Normal Weight Children
155
3.8 Differences between obese and normal weight children
In this section we compare obese children and children of normal/ideal weight on the TNS Family Food Panel and the NOP survey. First we look at their diets. Secondly,. we focus on a variety of social, behavioural and attitudinal differences.
3.8.1 Diet Analysis of the TNS Food Panel data shows that, against a backdrop in which children�s diets are already low on fresh and home-made foods, the diet of obese children is even worse, with more reliance on micro-waved and frozen food (see Chart 86).
Chart 86
©Ofcom 86
Obese children�s diets are worse than all children
Base:Obese Children Figures show index of share of category consumption by obese children indexed on ideal weight children
FFP sample 2100 children Period: 2003
68
116
10297
115
130
111130
109
115
Homemade
Frozen
Fresh
Chilled
Boil/steamed
Roast
Baked In Oven
Fried Grilled/toasted
Microwaved
Index obese children v normal weight kids
Source: TNS, Family Food Panel (FFP)
Against a backdrop in which children�s diets are low on fresh and home-made foods and dependent on frozen; obese children show a more exaggerated position with more reliance on micro-waved and frozen food.
Obese children are also even less likely to eat fresh fruit and vegetables than children generally (see Chart 87)
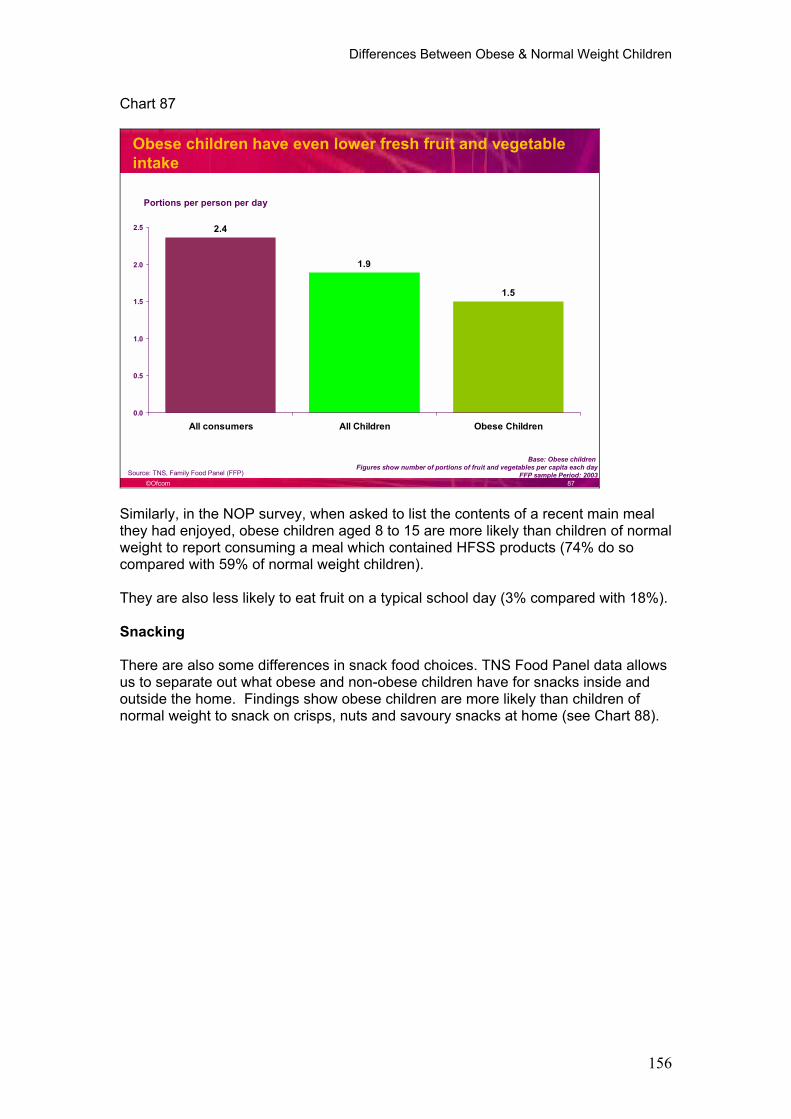
Differences Between Obese & Normal Weight Children
156
Chart 87
©Ofcom 87
Obese children have even lower fresh fruit and vegetable intake
2.4
1.9
1.5
0.0
0.5
1.0
1.5
2.0
2.5
All consumers All Children Obese Children
Portions per person per day
Base: Obese children Figures show number of portions of fruit and vegetables per capita each day
FFP sample Period: 2003Source: TNS, Family Food Panel (FFP)
Similarly, in the NOP survey, when asked to list the contents of a recent main meal they had enjoyed, obese children aged 8 to 15 are more likely than children of normal weight to report consuming a meal which contained HFSS products (74% do so compared with 59% of normal weight children).
They are also less likely to eat fruit on a typical school day (3% compared with 18%).
Snacking
There are also some differences in snack food choices. TNS Food Panel data allows us to separate out what obese and non-obese children have for snacks inside and outside the home. Findings show obese children are more likely than children of normal weight to snack on crisps, nuts and savoury snacks at home (see Chart 88).
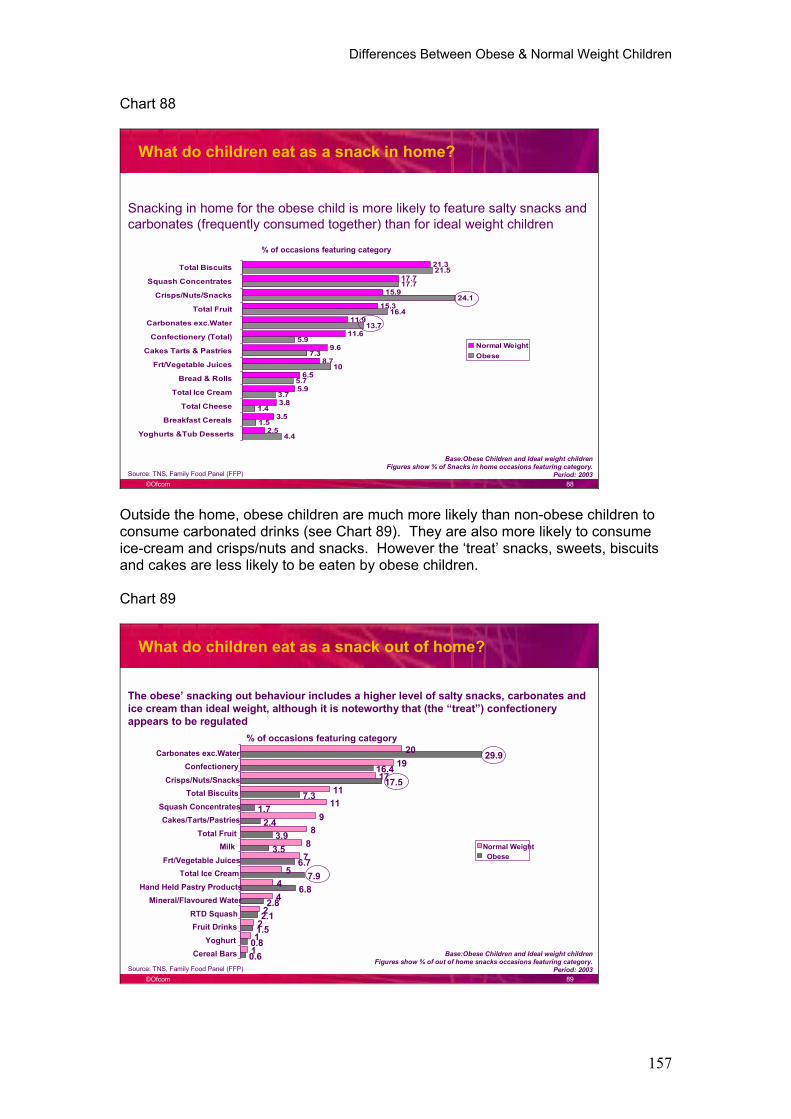
Differences Between Obese & Normal Weight Children
157
Chart 88
©Ofcom 88
What do children eat as a snack in home?
Base:Obese Children and Ideal weight childrenFigures show % of Snacks in home occasions featuring category.
Period: 2003
% of occasions featuring category
Source: TNS, Family Food Panel (FFP)
21.3
17.7
15.9
15.3
11.9
11.6
9.6
8.7
6.5
5.9
3.8
3.5
2.5
21.5
17.7
24.1
16.4
13.7
5.9
7.3
10
5.7
3.7
1.4
1.5
4.4
Total Biscuits
Squash Concentrates
Crisps/Nuts/Snacks
Total Fruit
Carbonates exc.Water
Confectionery (Total)
Cakes Tarts & Pastries
Frt/Vegetable Juices
Bread & Rolls
Total Ice Cream
Total Cheese
Breakfast Cereals
Yoghurts &Tub Desserts
Normal WeightObese
Snacking in home for the obese child is more likely to feature salty snacks and carbonates (frequently consumed together) than for ideal weight children
Outside the home, obese children are much more likely than non-obese children to consume carbonated drinks (see Chart 89). They are also more likely to consume ice-cream and crisps/nuts and snacks. However the �treat� snacks, sweets, biscuits and cakes are less likely to be eaten by obese children.
Chart 89
©Ofcom 89
What do children eat as a snack out of home?
Base:Obese Children and Ideal weight childrenFigures show % of out of home snacks occasions featuring category.
Period: 2003
% of occasions featuring category20
1917
1111
98
87
544
22
11
29.916.4
17.57.3
1.72.4
3.93.5
6.77.9
6.82.8
2.11.5
0.80.6
Carbonates exc.WaterConfectionery
Crisps/Nuts/Snacks Total Biscuits
Squash Concentrates Cakes/Tarts/Pastries
Total Fruit Milk
Frt/Vegetable Juices Total Ice Cream
Hand Held Pastry Products Mineral/Flavoured Water
RTD Squash Fruit Drinks
Yoghurt Cereal Bars
Normal WeightObese
Source: TNS, Family Food Panel (FFP)
The obese� snacking out behaviour includes a higher level of salty snacks, carbonates and ice cream than ideal weight, although it is noteworthy that (the �treat�) confectionery appears to be regulated
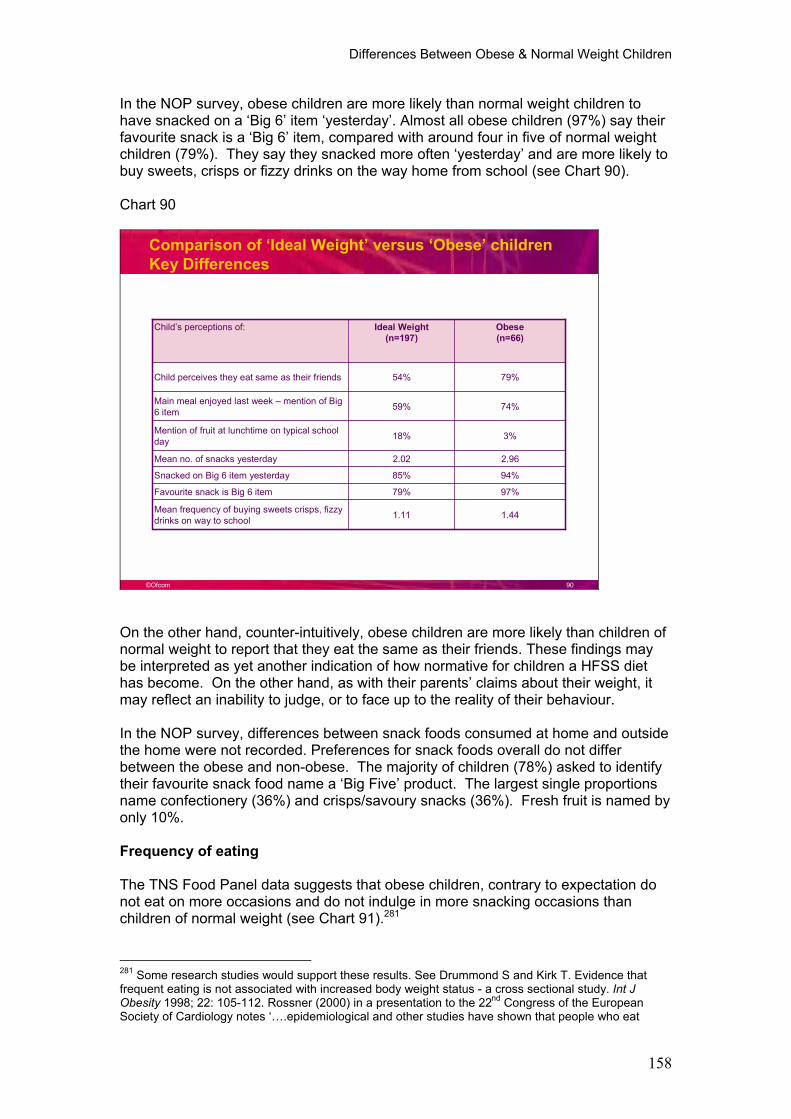
Differences Between Obese & Normal Weight Children
158
In the NOP survey, obese children are more likely than normal weight children to have snacked on a �Big 6� item �yesterday�. Almost all obese children (97%) say their favourite snack is a �Big 6� item, compared with around four in five of normal weight children (79%). They say they snacked more often �yesterday� and are more likely to buy sweets, crisps or fizzy drinks on the way home from school (see Chart 90).
Chart 90
©Ofcom 90
Comparison of �Ideal Weight� versus �Obese� childrenKey Differences
1.441.11Mean frequency of buying sweets crisps, fizzy drinks on way to school
97%79%Favourite snack is Big 6 item
79%54%Child perceives they eat same as their friends
94%85%Snacked on Big 6 item yesterday
2.962.02Mean no. of snacks yesterday
3%18%Mention of fruit at lunchtime on typical school day
74%59%Main meal enjoyed last week � mention of Big 6 item
Obese(n=66)
Ideal Weight(n=197)
Child�s perceptions of:
On the other hand, counter-intuitively, obese children are more likely than children of normal weight to report that they eat the same as their friends. These findings may be interpreted as yet another indication of how normative for children a HFSS diet has become. On the other hand, as with their parents� claims about their weight, it may reflect an inability to judge, or to face up to the reality of their behaviour.
In the NOP survey, differences between snack foods consumed at home and outside the home were not recorded. Preferences for snack foods overall do not differ between the obese and non-obese. The majority of children (78%) asked to identify their favourite snack food name a �Big Five� product. The largest single proportions name confectionery (36%) and crisps/savoury snacks (36%). Fresh fruit is named by only 10%.
Frequency of eating
The TNS Food Panel data suggests that obese children, contrary to expectation do not eat on more occasions and do not indulge in more snacking occasions than children of normal weight (see Chart 91).281
281 Some research studies would support these results. See Drummond S and Kirk T. Evidence that frequent eating is not associated with increased body weight status - a cross sectional study. Int J Obesity 1998; 22: 105-112. Rossner (2000) in a presentation to the 22nd Congress of the European Society of Cardiology notes ��.epidemiological and other studies have shown that people who eat
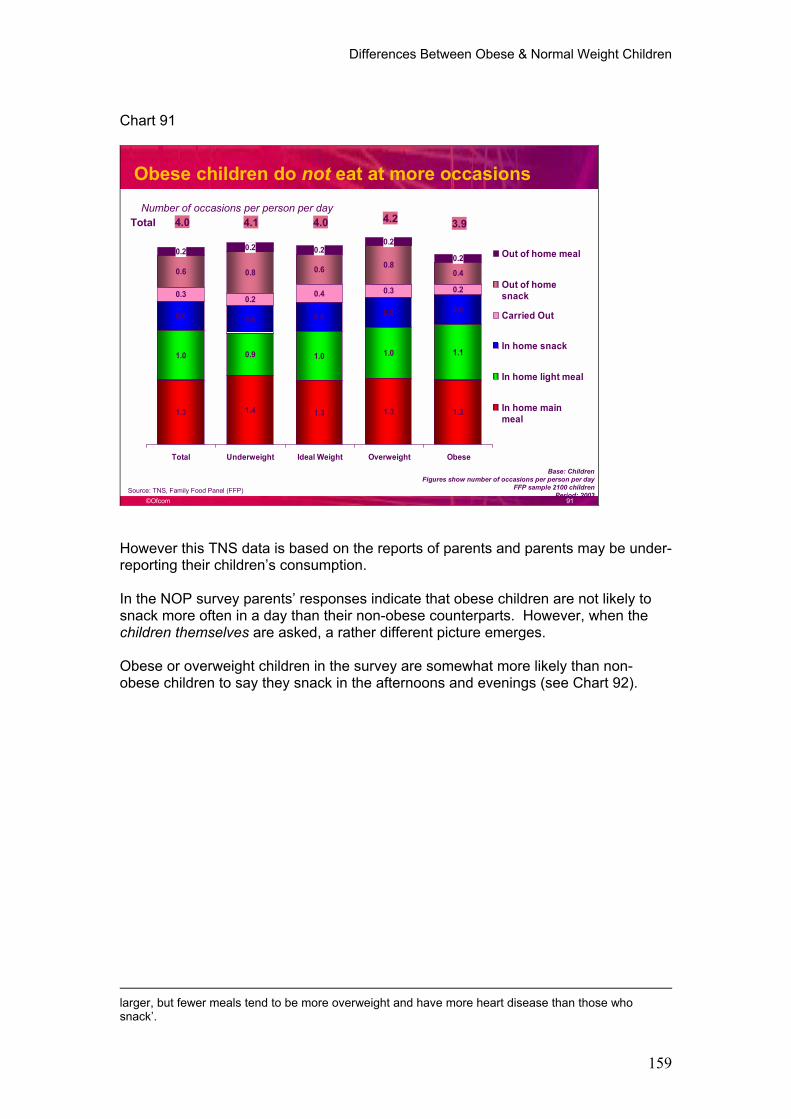
Differences Between Obese & Normal Weight Children
159
Chart 91
©Ofcom 91
1.3 1.4 1.3 1.3 1.3
1.0 0.9 1.0 1.0 1.1
0.6 0.6 0.6 0.6 0.6
0.3 0.2 0.4 0.3 0.2
0.6 0.8 0.6 0.80.4
0.2 0.2 0.20.2
0.2
Total Underweight Ideal Weight Overweight Obese
Out of home meal
Out of homesnack
Carried Out
In home snack
In home light meal
In home mainmeal
Obese children do not eat at more occasionsNumber of occasions per person per day
4.0 4.1 4.0 4.2 3.9Total
Base: ChildrenFigures show number of occasions per person per day
FFP sample 2100 children Period: 2003
Source: TNS, Family Food Panel (FFP)
However this TNS data is based on the reports of parents and parents may be under-reporting their children�s consumption.
In the NOP survey parents� responses indicate that obese children are not likely to snack more often in a day than their non-obese counterparts. However, when the children themselves are asked, a rather different picture emerges.
Obese or overweight children in the survey are somewhat more likely than non-obese children to say they snack in the afternoons and evenings (see Chart 92).
larger, but fewer meals tend to be more overweight and have more heart disease than those who snack�.
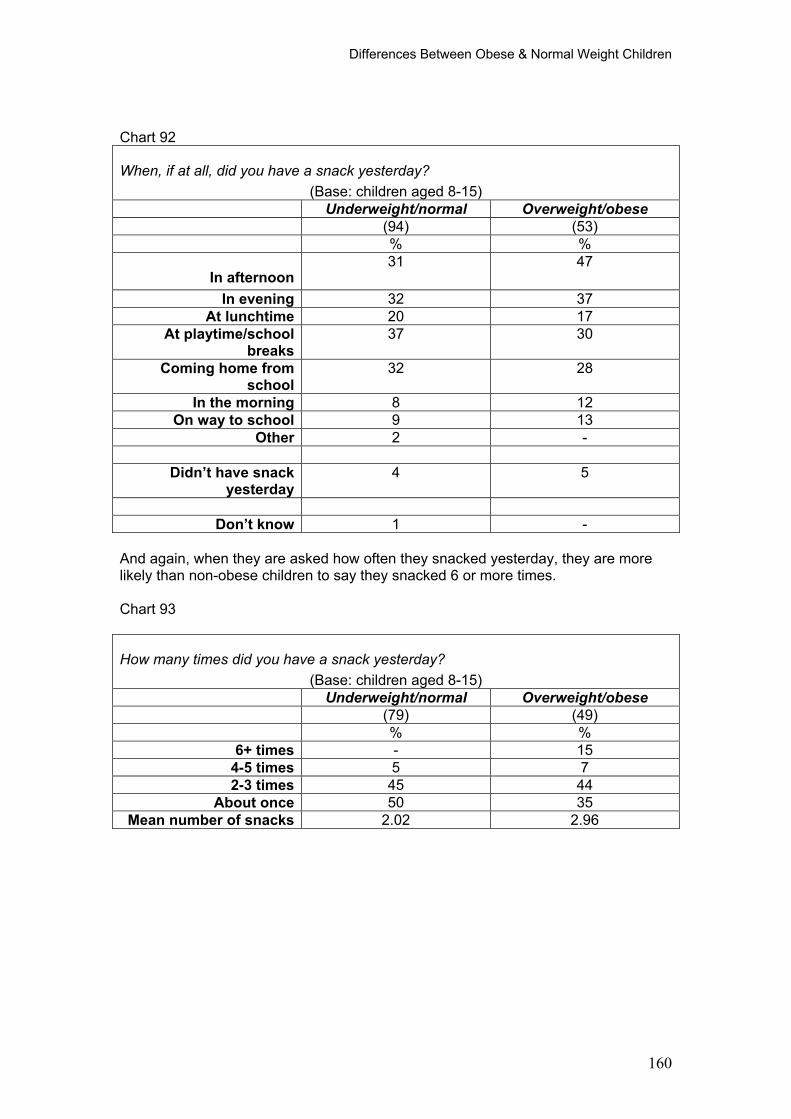
Differences Between Obese & Normal Weight Children
160
Chart 92
When, if at all, did you have a snack yesterday? (Base: children aged 8-15)
Underweight/normal Overweight/obese (94) (53) % %
In afternoon 31 47
In evening 32 37 At lunchtime 20 17
At playtime/school breaks
37 30
Coming home from school
32 28
In the morning 8 12 On way to school 9 13
Other 2 -
Didn�t have snack yesterday
4 5
Don�t know 1 -
And again, when they are asked how often they snacked yesterday, they are more likely than non-obese children to say they snacked 6 or more times.
Chart 93
How many times did you have a snack yesterday? (Base: children aged 8-15)
Underweight/normal Overweight/obese (79) (49) % %
6+ times - 15 4-5 times 5 7 2-3 times 45 44
About once 50 35 Mean number of snacks 2.02 2.96
Differences Between Obese & Normal Weight Children
161
3.8.2 Profiles
Demographics
In 2002, The Health of Children and Young People survey reported around a quarter of children aged 2-15 to be either overweight or obese (27.5% of girls and 21.8% of boys). Around one in 20 boys (5.7%) and one in 15 girls (7.8%) was obese. It should be noted that the data used in this survey was collected in 2000.282
In both the TNS panel and the NOP survey children�s BMI measures were calculated using the International classification, also adopted in the Health Survey for England (2002).
The TNS Family Food Panel consists of a sample of 11,000 individuals recording all food and drink consumed in self-completion diaries every six months. The children in the sample number 2,100 of which 325 are classified as obese. Weighted back to population characteristics, the child sample breaks down as follows:
- Obese 21.7% - Overweight 20% - Normal weight 44.2% - Underweight 13.3%
In the NOP survey, where 1,010 parents/child pairs were interviewed in a face to face survey, the figures for children were as follows:
- Obese 20.7% - Overweight 14.5% - Normal weight 45.5% - Underweight 19.3%
282 These figures are based on the International classification for obesity. Obesity estimates based on National BMI percentiles are even higher. (16% of boys and 15.9% of girls classified as obese). The tendency for more girls to be obese compared with boys is contested. It has been suggested that the International classification may exaggerate the sex differences by under-estimating prevalence for boys.Chinn S, Rona, RJ. International definitions of overweight and obesity for children: a lasting solution?Ann Hum Biol, 2002; 29: 306-313.
Differences Between Obese & Normal Weight Children
162
The NOP and TNS results are therefore consistent with each other, but should not be taken as evidence that there has been a rise in obesity levels when compared with figures in The Health of Children and Young People 2002 survey. Methodological differences, possible inconsistencies in weighing procedures and refusal rates may have influenced results.
It should be noted that in the NOP survey 38% of parents refused to allow their child�s height and weight to be measured. The W.H.O. report (2004)283, also reported a high proportion (over 25%) of missing BMI data. It was particularly high in France, Belgium, England, Greenland, Ireland, Lithuania, Malta and Scotland. In Scotland the rate of refusal was 52% for 13 year-old girls and 56% for boys. In England the comparable figures were 38% of girls and 42% of boys, and in Wales 17% of boys and 21% of girls. With the exception of Belgium, Ireland and Lithuania, these countries also have a higher prevalence of overweight and obesity. Further analysis of the characteristics of young people who did not report their height and weight compared with those who did, show they are:
- less likely to come from higher socio-economic groups - less likely to be physically active - more likely to be dieting or feel the need to lose weight - more likely to consume less fruit, vegetables and perhaps surprisingly,
sweets (13 year-olds only).
The authors of the W.H.O. report conclude that those who refuse are more likely to be obese or overweight. In view of these figures, which are based on the less intrusive self-reporting of height and weight rather than actual measurements as in the NOP survey, the refusal rate in the present survey is to be expected.
Other research has also indicated that there is a link between obesity, low socio-economic status, relative poverty and living in areas of multiple deprivation.284 In the TNS Family Food Panel data obesity rates among children in DE households tend to be higher (25.5% compared to 21.7% across all households). In the NOP survey no association is found between social grade and obesity level. This discrepancy may be due to the fact that refusal rates(45% of C2DEs, compared with 30% of ABC1s) are higher amongst lower social grade families, where we would expect the prevalence of obesity to be higher.
Nevertheless, the TNS Family Food Panel and the NOP survey do provide substantial samples of obese and normal weight children and their parents, whose attitudes towards, and perceptions of, food and obesity related issues can be compared. In this section, the following areas are addressed:
- Perceived health and general well-being - Leisure pursuits - Knowledge about healthy eating
283 W.H.O. (2004) Young people�s health in context. Health Behaviour in School-aged Children (HBSC) study: international report from the 2001/2002 survey. Body image, weight control and body weight. P120-129ISBN 92 890 1372 9. http://www.euro.who.int/Document/e82923.pdf
284 See Stamatakis, E. 9 Anthropometric measurements, overweight and obesity. In The Health of Children and Young People (2002). The Health of Children and Young People (2002) survey shows increases between 1995 and 2002 in the prevalence of childhood obesity of 4% among manual classes compared with only 2.4% amongst non-manual classes. In the two least deprived IMD quintiles there are 4.9% obese boys aged 2-15 and 5.5 obese girls. In the three most deprived quintiles there are 5.8% boys and 8% girls.
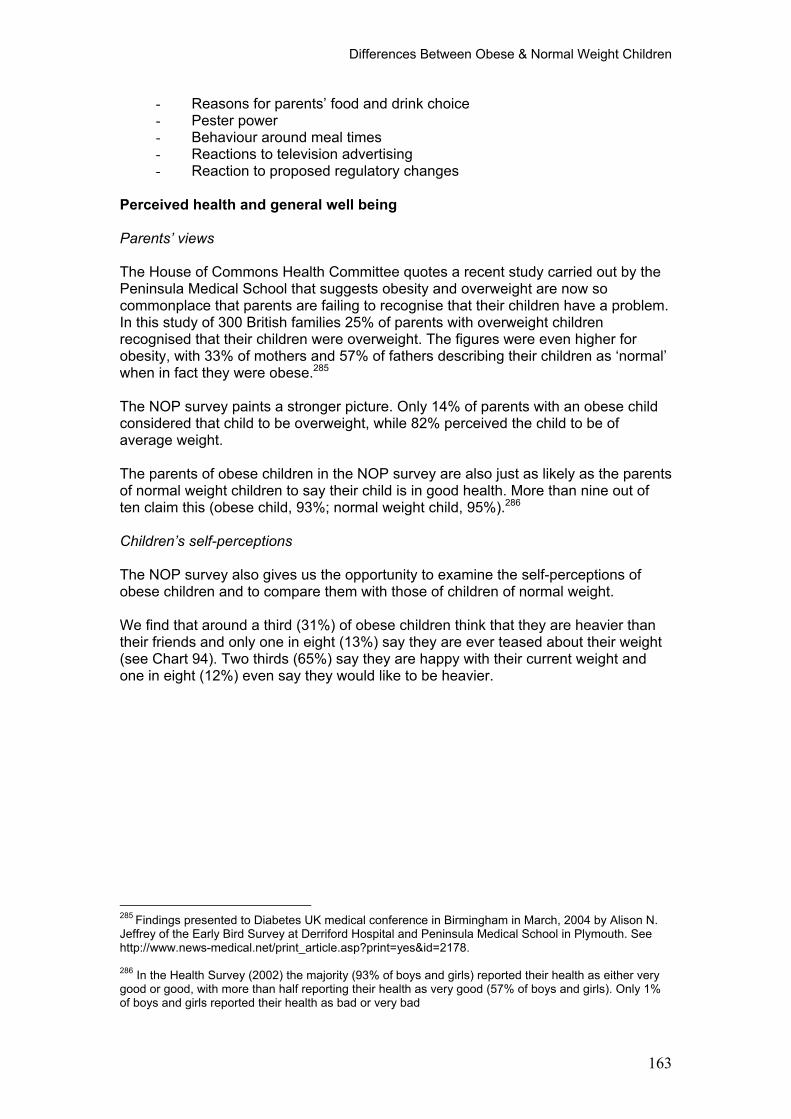
Differences Between Obese & Normal Weight Children
163
- Reasons for parents� food and drink choice - Pester power - Behaviour around meal times - Reactions to television advertising - Reaction to proposed regulatory changes
Perceived health and general well being
Parents� views
The House of Commons Health Committee quotes a recent study carried out by the Peninsula Medical School that suggests obesity and overweight are now so commonplace that parents are failing to recognise that their children have a problem. In this study of 300 British families 25% of parents with overweight children recognised that their children were overweight. The figures were even higher for obesity, with 33% of mothers and 57% of fathers describing their children as �normal� when in fact they were obese.285
The NOP survey paints a stronger picture. Only 14% of parents with an obese child considered that child to be overweight, while 82% perceived the child to be of average weight.
The parents of obese children in the NOP survey are also just as likely as the parents of normal weight children to say their child is in good health. More than nine out of ten claim this (obese child, 93%; normal weight child, 95%).286
Children�s self-perceptions
The NOP survey also gives us the opportunity to examine the self-perceptions of obese children and to compare them with those of children of normal weight.
We find that around a third (31%) of obese children think that they are heavier than their friends and only one in eight (13%) say they are ever teased about their weight (see Chart 94). Two thirds (65%) say they are happy with their current weight and one in eight (12%) even say they would like to be heavier.
285 Findings presented to Diabetes UK medical conference in Birmingham in March, 2004 by Alison N. Jeffrey of the Early Bird Survey at Derriford Hospital and Peninsula Medical School in Plymouth. See http://www.news-medical.net/print_article.asp?print=yes&id=2178.
286 In the Health Survey (2002) the majority (93% of boys and girls) reported their health as either very good or good, with more than half reporting their health as very good (57% of boys and girls). Only 1% of boys and girls reported their health as bad or very bad
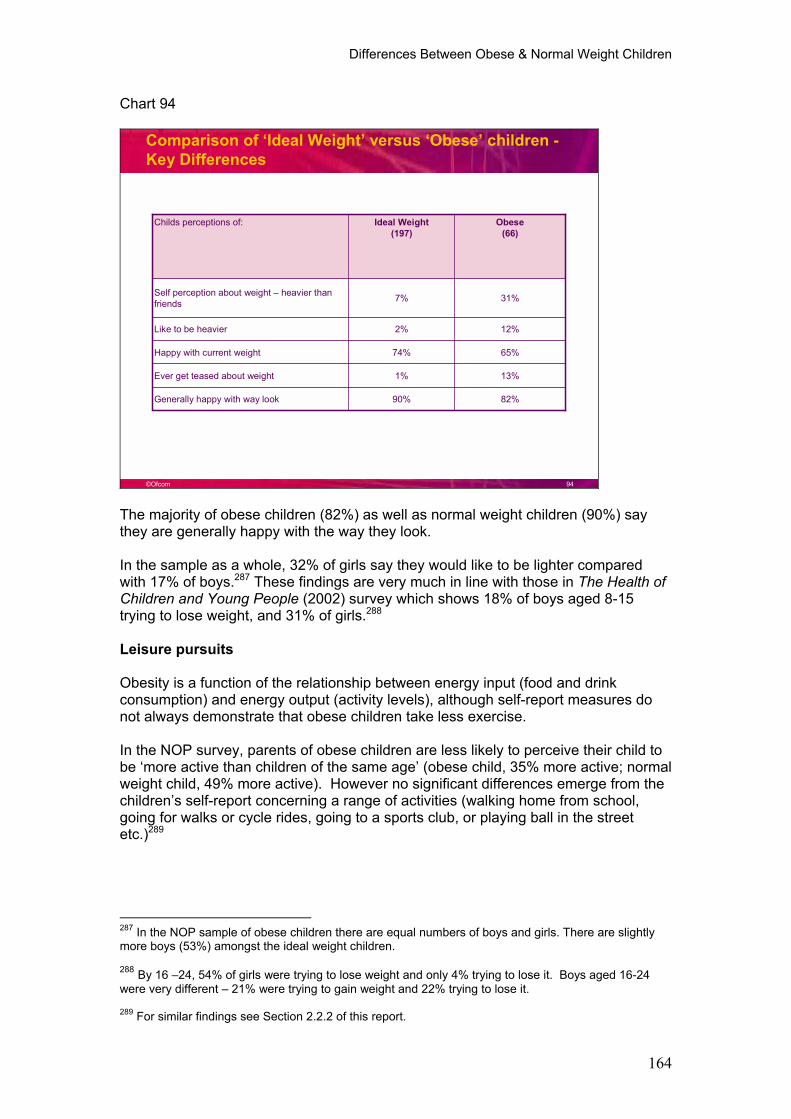
Differences Between Obese & Normal Weight Children
164
Chart 94
©Ofcom 94
Comparison of �Ideal Weight� versus �Obese� children -Key Differences
65%74%Happy with current weight
13%1%Ever get teased about weight
82%90%Generally happy with way look
12%2%Like to be heavier
31%7%Self perception about weight � heavier than friends
Obese(66)
Ideal Weight(197)
Childs perceptions of:
The majority of obese children (82%) as well as normal weight children (90%) say they are generally happy with the way they look.
In the sample as a whole, 32% of girls say they would like to be lighter compared with 17% of boys.287 These findings are very much in line with those in The Health of Children and Young People (2002) survey which shows 18% of boys aged 8-15 trying to lose weight, and 31% of girls.288
Leisure pursuits
Obesity is a function of the relationship between energy input (food and drink consumption) and energy output (activity levels), although self-report measures do not always demonstrate that obese children take less exercise.
In the NOP survey, parents of obese children are less likely to perceive their child to be �more active than children of the same age� (obese child, 35% more active; normal weight child, 49% more active). However no significant differences emerge from the children�s self-report concerning a range of activities (walking home from school, going for walks or cycle rides, going to a sports club, or playing ball in the street etc.)289
287 In the NOP sample of obese children there are equal numbers of boys and girls. There are slightly more boys (53%) amongst the ideal weight children.
288 By 16 �24, 54% of girls were trying to lose weight and only 4% trying to lose it. Boys aged 16-24 were very different � 21% were trying to gain weight and 22% trying to lose it.
289 For similar findings see Section 2.2.2 of this report.
Differences Between Obese & Normal Weight Children
165
Nor are the obese children in the NOP sample more likely than the children of normal weight to have sedentary leisure interests. They do not play computer games, use the Internet, read, listen to the radio or watch television more often as measured by a frequency of activity scale (although the actual number of hours are not recorded). They do however claim a larger proportion of their television viewing is to commercial channels.
Knowledge about healthy eating
The majority of children and their parents are aware, in theory, that they should eat fresh fruit and vegetables. However, findings in the NOP survey show that the parents of obese children attach less importance to eating fresh fruit and vegetables than parents of normal weight children.290 They attach more importance than the other group of parents to avoiding eating processed foods.291
In addition, data from the TNS Family Food Panel suggests that obese children are less informed about healthy foods. They are much less likely than normal-weight children to identify fresh salad vegetables as a healthy eating option. Similarly, they are more likely to consider tinned fruits, yoghurt and canned fish to be healthy options (see Chart 95).
Chart 95
©Ofcom 95
What do children regard as healthy?
Most children see fruit as healthy.Obese children are less likely to regard salad and veg. as healthy and morelikely to rate yoghurt, canned fish and canned fruit as healthy
% of occasions
Base:Obese Children and Ideal weight childrenPeriod: 2003
Source: TNS, Family Food Panel (FFP)
43
39.4
11.9
19.8
44.6
33.6
12.7
29.8
22.3
25.5
14.5
13.7
24
42
37
33
33
32
31
25
22
22
19
17
16
15
Total Fruit
Fresh Leaf Vegetables
Tinned & Vacuum Fruits
Yoghurt
Salad Vegetables Fresh & Prep
Fresh Root Vegetables (Not Pots)
Canned Fish
Mineral/Flavoured Water
Fromage Frais
Pure Juice
Fresh Potatoes
Rice
Frozen Vegetables
Ideal WeightObese
290 Eating fresh fruit and vegetables: mean importance scores for parents of obese children, 4.35, for parents of ideal weight children 4.52 � these differences are significantly different. (These mean scores are calculated using a scale of 1-5 where 5 represents very important and 1 represents very unimportant).
291 Avoid eating processed foods: mean importance scores for parents of obese children, 3.73, for parents of ideal weight children, 3.50 � these differences are significantly different. (These mean scores are calculated using a scale of 1-5 where 5 represents very important and 1 represents very unimportant).
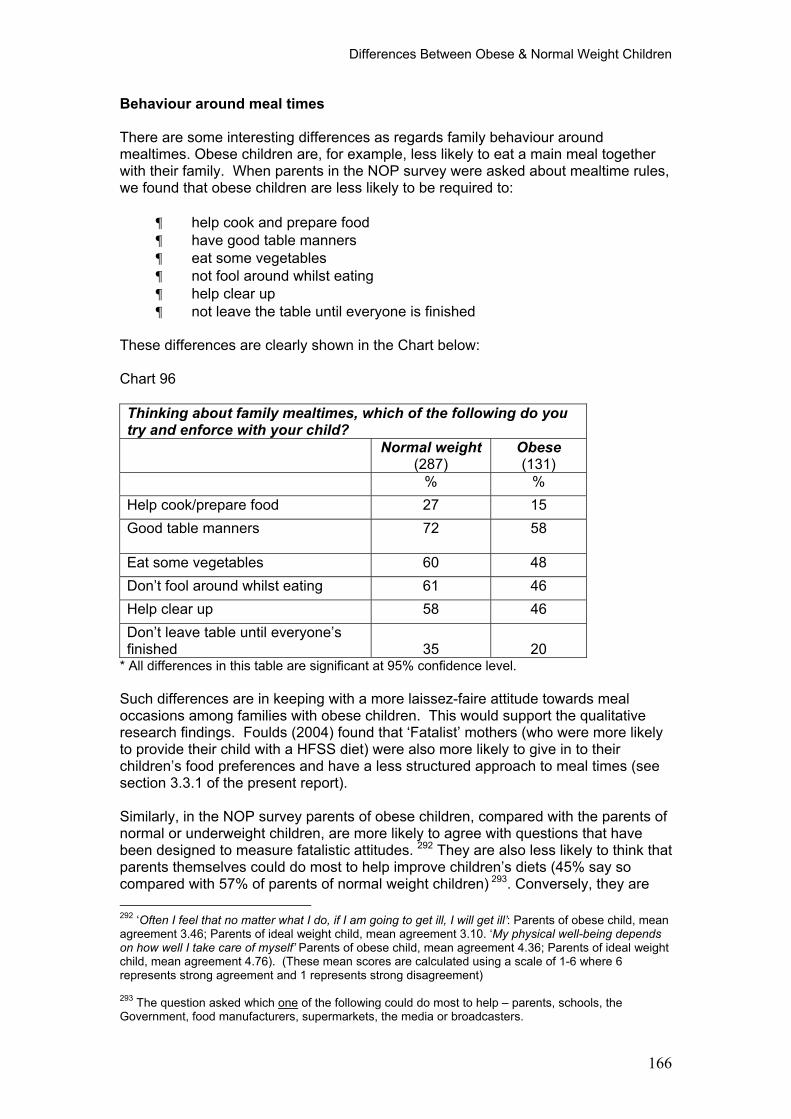
Differences Between Obese & Normal Weight Children
166
Behaviour around meal times
There are some interesting differences as regards family behaviour around mealtimes. Obese children are, for example, less likely to eat a main meal together with their family. When parents in the NOP survey were asked about mealtime rules, we found that obese children are less likely to be required to:
¶ help cook and prepare food ¶ have good table manners ¶ eat some vegetables ¶ not fool around whilst eating ¶ help clear up ¶ not leave the table until everyone is finished
These differences are clearly shown in the Chart below:
Chart 96
Thinking about family mealtimes, which of the following do you try and enforce with your child?
Normal weight (287)
Obese(131)
% % Help cook/prepare food 27 15 Good table manners 72 58
Eat some vegetables 60 48 Don�t fool around whilst eating 61 46 Help clear up 58 46 Don�t leave table until everyone�s finished 35 20
* All differences in this table are significant at 95% confidence level.
Such differences are in keeping with a more laissez-faire attitude towards meal occasions among families with obese children. This would support the qualitative research findings. Foulds (2004) found that �Fatalist� mothers (who were more likely to provide their child with a HFSS diet) were also more likely to give in to their children�s food preferences and have a less structured approach to meal times (see section 3.3.1 of the present report).
Similarly, in the NOP survey parents of obese children, compared with the parents of normal or underweight children, are more likely to agree with questions that have been designed to measure fatalistic attitudes. 292 They are also less likely to think that parents themselves could do most to help improve children�s diets (45% say so compared with 57% of parents of normal weight children) 293. Conversely, they are
292 �Often I feel that no matter what I do, if I am going to get ill, I will get ill�: Parents of obese child, mean agreement 3.46; Parents of ideal weight child, mean agreement 3.10. �My physical well-being depends on how well I take care of myself� Parents of obese child, mean agreement 4.36; Parents of ideal weight child, mean agreement 4.76). (These mean scores are calculated using a scale of 1-6 where 6 represents strong agreement and 1 represents strong disagreement)
293 The question asked which one of the following could do most to help � parents, schools, the Government, food manufacturers, supermarkets, the media or broadcasters.
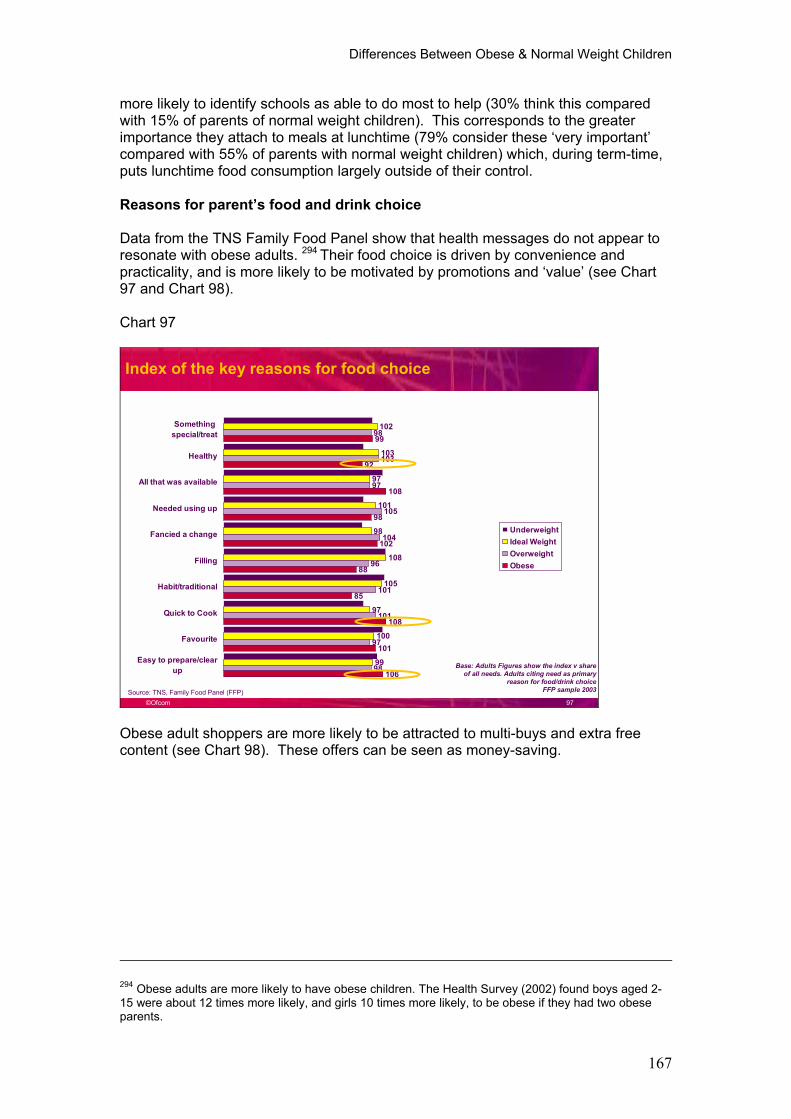
Differences Between Obese & Normal Weight Children
167
more likely to identify schools as able to do most to help (30% think this compared with 15% of parents of normal weight children). This corresponds to the greater importance they attach to meals at lunchtime (79% consider these �very important� compared with 55% of parents with normal weight children) which, during term-time, puts lunchtime food consumption largely outside of their control.
Reasons for parent�s food and drink choice
Data from the TNS Family Food Panel show that health messages do not appear to resonate with obese adults. 294 Their food choice is driven by convenience and practicality, and is more likely to be motivated by promotions and �value� (see Chart 97 and Chart 98).
Chart 97
©Ofcom 97
Index of the key reasons for food choice
Source: TNS, Family Food Panel (FFP)
102
103
97
101
98
108
105
97
100
99
98
103
97
105
104
96
101
101
97
98
99
92
108
98
102
88
85
108
101
106
Somethingspecial/treat
Healthy
All that was available
Needed using up
Fancied a change
Filling
Habit/traditional
Quick to Cook
Favourite
Easy to prepare/clearup
UnderweightIdeal WeightOverweightObese
Base: Adults Figures show the index v share of all needs. Adults citing need as primary
reason for food/drink choiceFFP sample 2003
Obese adult shoppers are more likely to be attracted to multi-buys and extra free content (see Chart 98). These offers can be seen as money-saving.
294 Obese adults are more likely to have obese children. The Health Survey (2002) found boys aged 2-15 were about 12 times more likely, and girls 10 times more likely, to be obese if they had two obese parents.
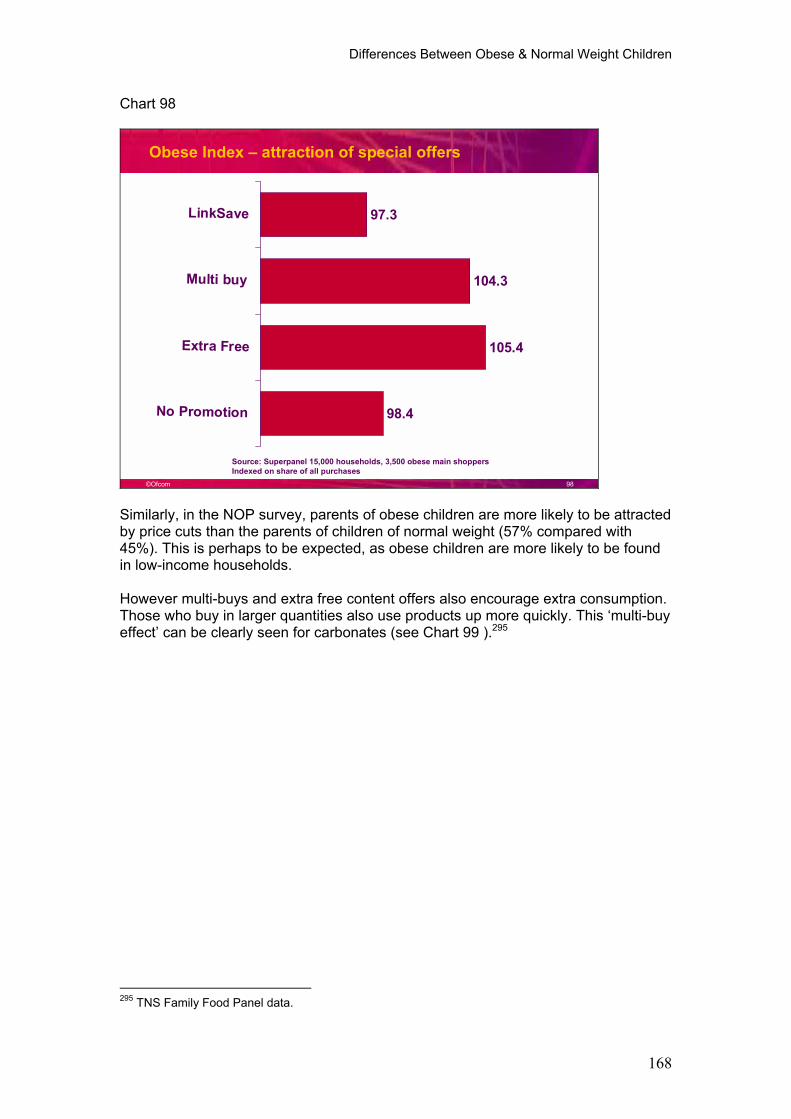
Differences Between Obese & Normal Weight Children
168
Chart 98
©Ofcom 98
97.3
104.3
105.4
98.4
LinkSave
Multi buy
Extra Free
No Promotion
Obese Index � attraction of special offers
Source: Superpanel 15,000 households, 3,500 obese main shoppersIndexed on share of all purchases
Similarly, in the NOP survey, parents of obese children are more likely to be attracted by price cuts than the parents of children of normal weight (57% compared with 45%). This is perhaps to be expected, as obese children are more likely to be found in low-income households.
However multi-buys and extra free content offers also encourage extra consumption. Those who buy in larger quantities also use products up more quickly. This �multi-buy effect� can be clearly seen for carbonates (see Chart 99 ).295
295 TNS Family Food Panel data.
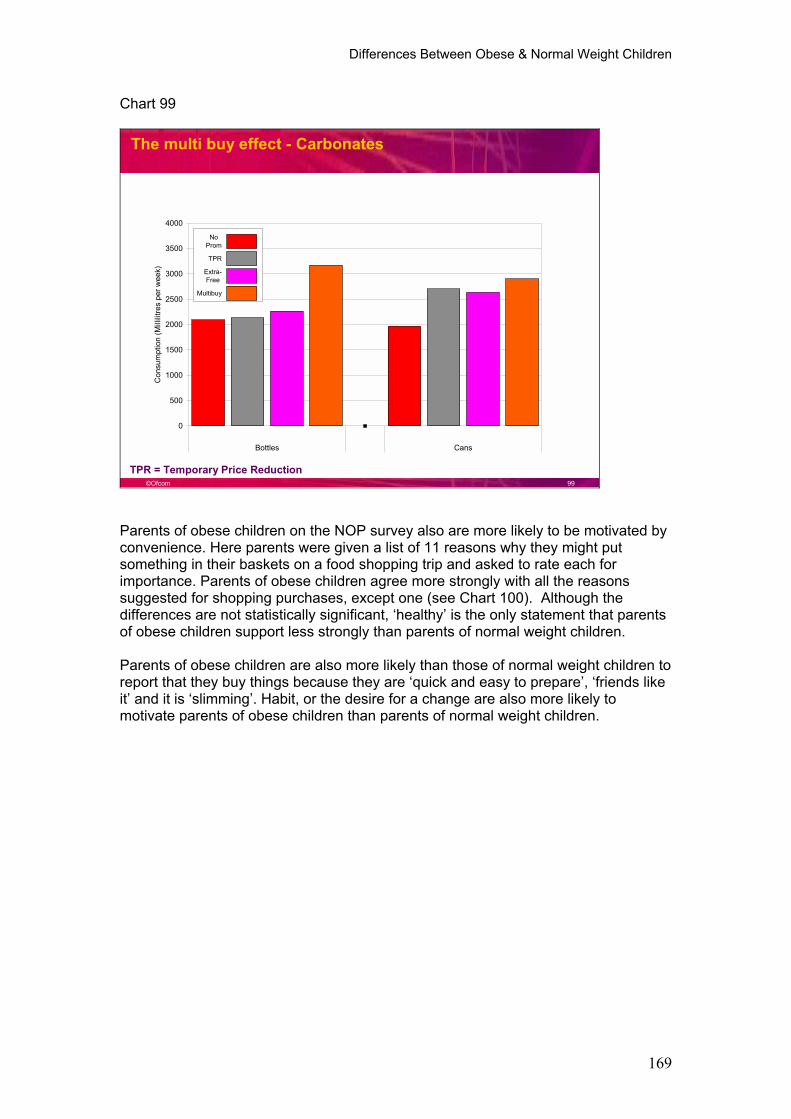
Differences Between Obese & Normal Weight Children
169
Chart 99
©Ofcom 99
0
500
1000
1500
2000
2500
3000
3500
4000
Bottles Cans
Con
sum
ptio
n (M
illili
tres
per w
eek)
NoProm
TPR
Extra-Free
Multibuy
The multi buy effect - Carbonates
TPR = Temporary Price Reduction
Parents of obese children on the NOP survey also are more likely to be motivated by convenience. Here parents were given a list of 11 reasons why they might put something in their baskets on a food shopping trip and asked to rate each for importance. Parents of obese children agree more strongly with all the reasons suggested for shopping purchases, except one (see Chart 100). Although the differences are not statistically significant, �healthy� is the only statement that parents of obese children support less strongly than parents of normal weight children.
Parents of obese children are also more likely than those of normal weight children to report that they buy things because they are �quick and easy to prepare�, �friends like it� and it is �slimming�. Habit, or the desire for a change are also more likely to motivate parents of obese children than parents of normal weight children.
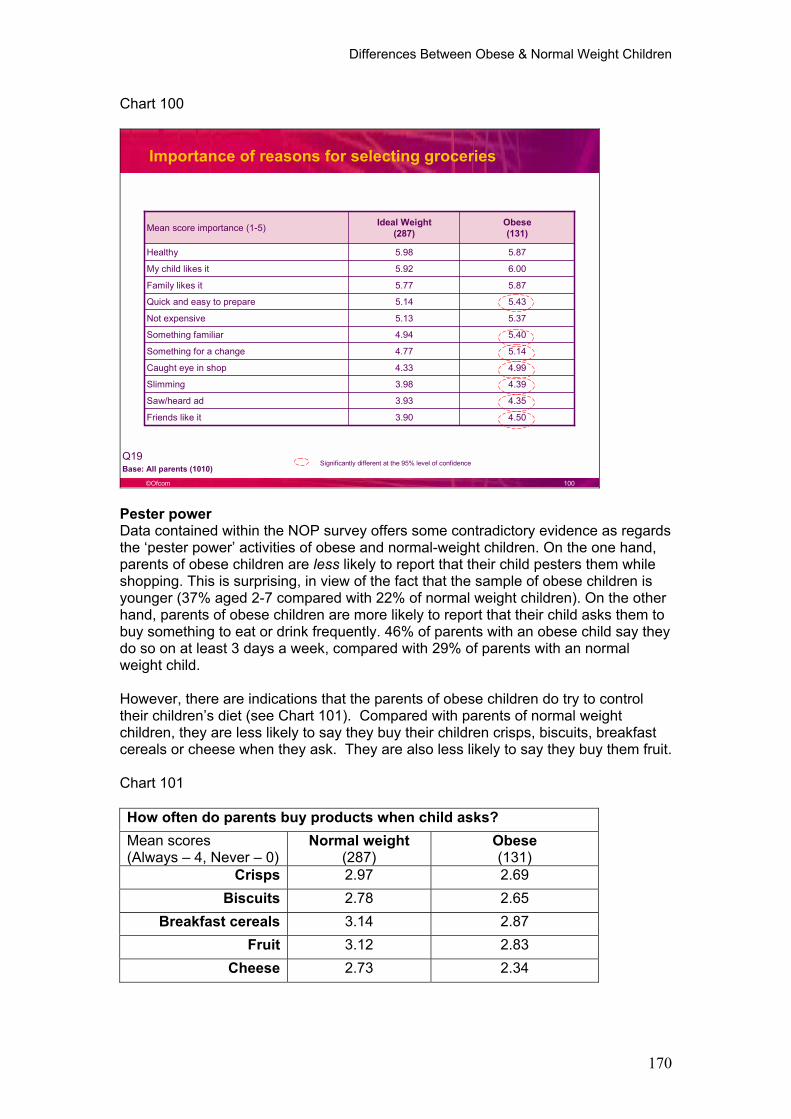
Differences Between Obese & Normal Weight Children
170
Chart 100
©Ofcom 100
Importance of reasons for selecting groceries
4.353.93Saw/heard ad
4.393.98Slimming
5.144.77Something for a change
5.404.94Something familiar
4.994.33Caught eye in shop
5.875.77Family likes it
6.005.92My child likes it
5.875.98Healthy
5.375.13Not expensive
4.503.90Friends like it
5.435.14Quick and easy to prepare
Obese(131)
Ideal Weight(287)Mean score importance (1-5)
Significantly different at the 95% level of confidenceQ19Base: All parents (1010)
Pester power Data contained within the NOP survey offers some contradictory evidence as regards the �pester power� activities of obese and normal-weight children. On the one hand, parents of obese children are less likely to report that their child pesters them while shopping. This is surprising, in view of the fact that the sample of obese children is younger (37% aged 2-7 compared with 22% of normal weight children). On the other hand, parents of obese children are more likely to report that their child asks them to buy something to eat or drink frequently. 46% of parents with an obese child say they do so on at least 3 days a week, compared with 29% of parents with an normal weight child.
However, there are indications that the parents of obese children do try to control their children�s diet (see Chart 101). Compared with parents of normal weight children, they are less likely to say they buy their children crisps, biscuits, breakfast cereals or cheese when they ask. They are also less likely to say they buy them fruit.
Chart 101
How often do parents buy products when child asks? Mean scores (Always � 4, Never � 0)
Normal weight (287)
Obese(131)
Crisps 2.97 2.69 Biscuits 2.78 2.65
Breakfast cereals 3.14 2.87 Fruit 3.12 2.83
Cheese 2.73 2.34
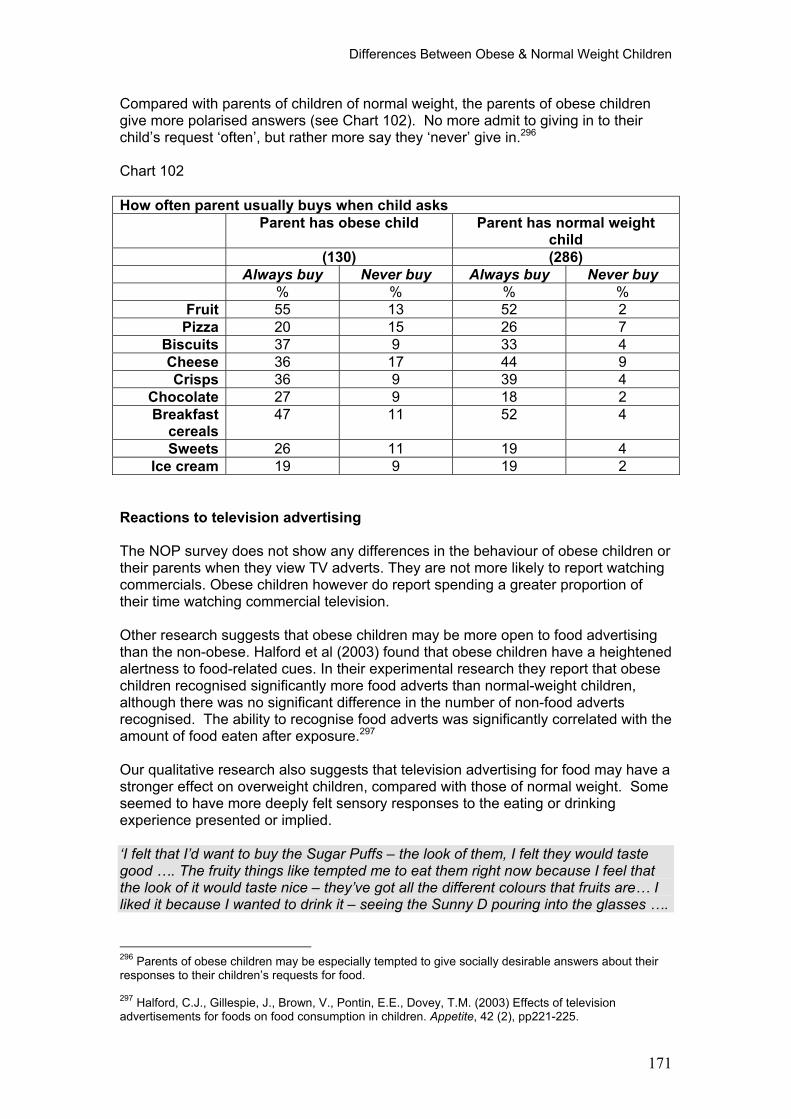
Differences Between Obese & Normal Weight Children
171
Compared with parents of children of normal weight, the parents of obese children give more polarised answers (see Chart 102). No more admit to giving in to their child�s request �often�, but rather more say they �never� give in.296
Chart 102
How often parent usually buys when child asks Parent has obese child Parent has normal weight
child(130) (286)
Always buy Never buy Always buy Never buy % % % %
Fruit 55 13 52 2 Pizza 20 15 26 7
Biscuits 37 9 33 4 Cheese 36 17 44 9 Crisps 36 9 39 4
Chocolate 27 9 18 2 Breakfast
cereals47 11 52 4
Sweets 26 11 19 4 Ice cream 19 9 19 2
Reactions to television advertising
The NOP survey does not show any differences in the behaviour of obese children or their parents when they view TV adverts. They are not more likely to report watching commercials. Obese children however do report spending a greater proportion of their time watching commercial television.
Other research suggests that obese children may be more open to food advertising than the non-obese. Halford et al (2003) found that obese children have a heightened alertness to food-related cues. In their experimental research they report that obese children recognised significantly more food adverts than normal-weight children, although there was no significant difference in the number of non-food adverts recognised. The ability to recognise food adverts was significantly correlated with the amount of food eaten after exposure.297
Our qualitative research also suggests that television advertising for food may have a stronger effect on overweight children, compared with those of normal weight. Some seemed to have more deeply felt sensory responses to the eating or drinking experience presented or implied.
�I felt that I�d want to buy the Sugar Puffs � the look of them, I felt they would taste good �. The fruity things like tempted me to eat them right now because I feel that the look of it would taste nice � they�ve got all the different colours that fruits are� I liked it because I wanted to drink it � seeing the Sunny D pouring into the glasses �.
296 Parents of obese children may be especially tempted to give socially desirable answers about their responses to their children�s requests for food.
297 Halford, C.J., Gillespie, J., Brown, V., Pontin, E.E., Dovey, T.M. (2003) Effects of television advertisements for foods on food consumption in children. Appetite, 42 (2), pp221-225.

Differences Between Obese & Normal Weight Children
172
I thought that I would like to go to that McDonalds � he just looked at the burger � I would like to eat it � they taste a hundred and ten per cent.� (Obese girl aged 9, North England: Reactions to Sugar Puffs, Screamin� Fruit Spurters, Sunny D and McDonalds adverts)
Reactions to proposed regulatory changes
Parents on the NOP survey were given a list of seven potential changes to the advertising rules and asked which one in their view would make the most difference. They also had the option of choosing �no change�. The choices made by parents of obese children are very different from those of parents of normal weight and over-weight children (see Chart 103).
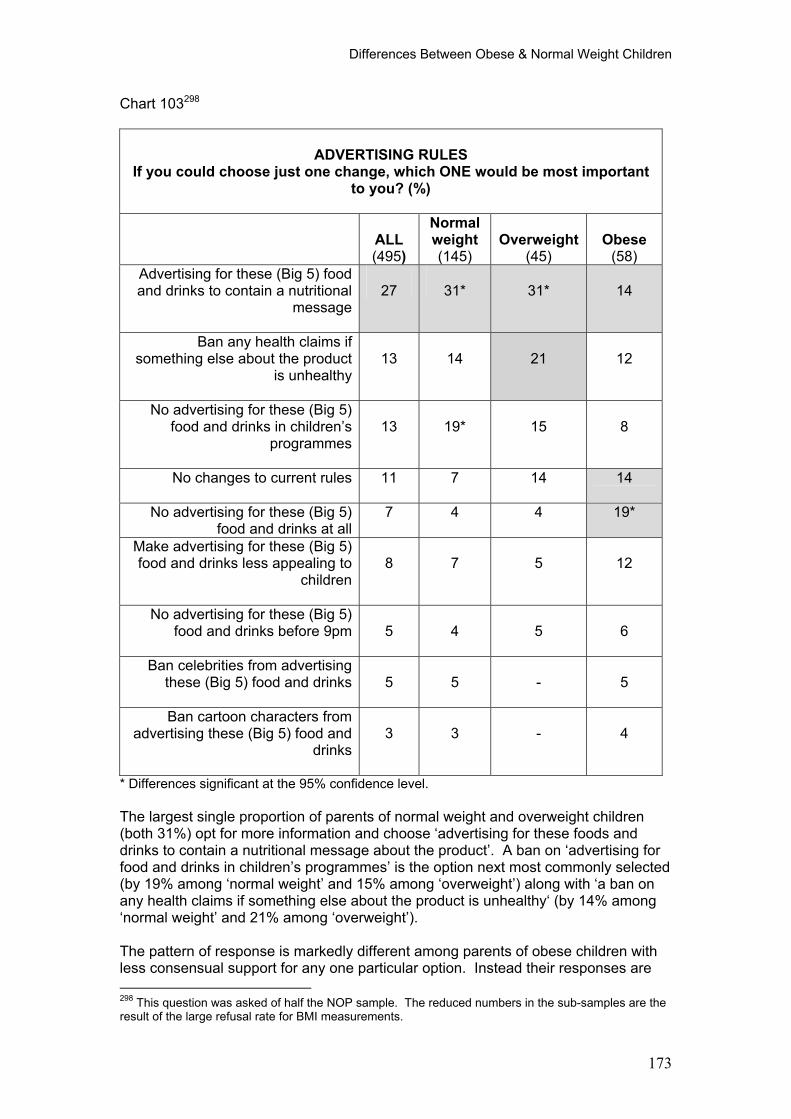
Differences Between Obese & Normal Weight Children
173
Chart 103298
ADVERTISING RULES If you could choose just one change, which ONE would be most important
to you? (%)
ALL(495)
Normalweight (145)
Overweight (45)
Obese(58)
Advertising for these (Big 5) food and drinks to contain a nutritional
message27 31* 31* 14
Ban any health claims if something else about the product
is unhealthy13 14 21 12
No advertising for these (Big 5) food and drinks in children�s
programmes13 19* 15 8
No changes to current rules 11 7 14 14
No advertising for these (Big 5) food and drinks at all
7 4 4 19*
Make advertising for these (Big 5) food and drinks less appealing to
children8 7 5 12
No advertising for these (Big 5) food and drinks before 9pm 5 4 5 6
Ban celebrities from advertising these (Big 5) food and drinks 5 5 - 5
Ban cartoon characters from advertising these (Big 5) food and
drinks3 3 - 4
* Differences significant at the 95% confidence level.
The largest single proportion of parents of normal weight and overweight children (both 31%) opt for more information and choose �advertising for these foods and drinks to contain a nutritional message about the product�. A ban on �advertising for food and drinks in children�s programmes� is the option next most commonly selected (by 19% among �normal weight� and 15% among �overweight�) along with �a ban on any health claims if something else about the product is unhealthy� (by 14% among �normal weight� and 21% among �overweight�).
The pattern of response is markedly different among parents of obese children with less consensual support for any one particular option. Instead their responses are
298 This question was asked of half the NOP sample. The reduced numbers in the sub-samples are the result of the large refusal rate for BMI measurements.
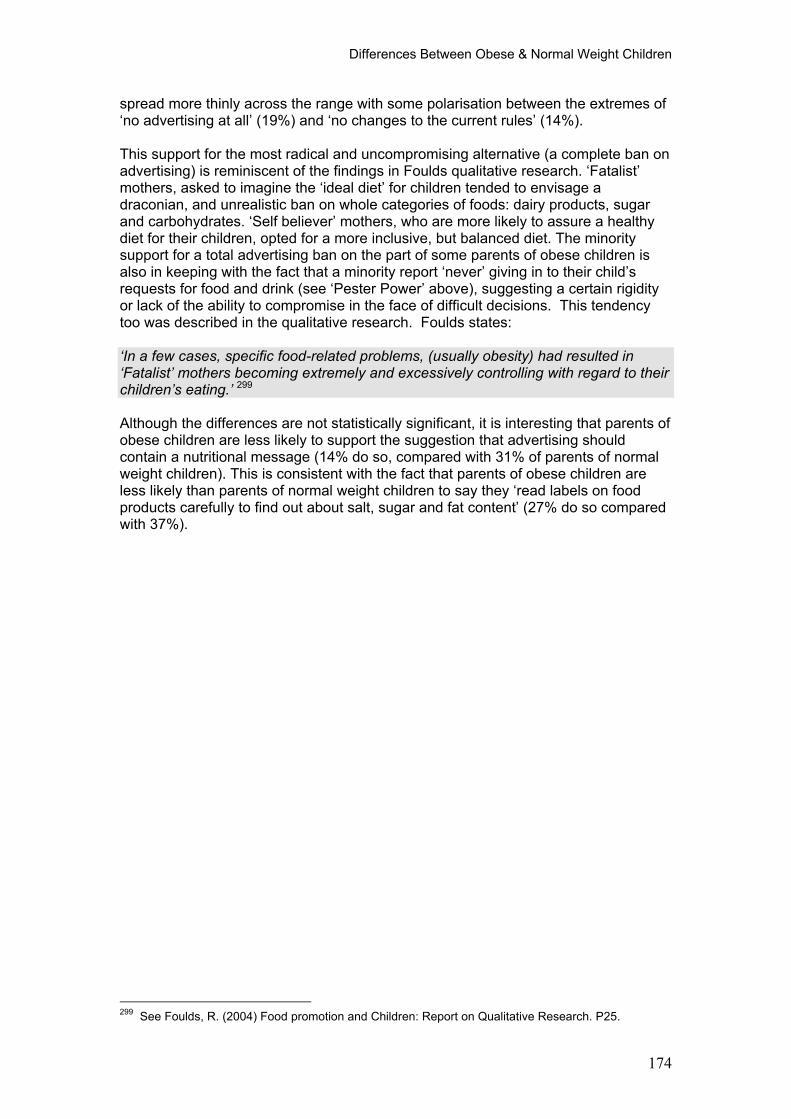
Differences Between Obese & Normal Weight Children
174
spread more thinly across the range with some polarisation between the extremes of �no advertising at all� (19%) and �no changes to the current rules� (14%).
This support for the most radical and uncompromising alternative (a complete ban on advertising) is reminiscent of the findings in Foulds qualitative research. �Fatalist� mothers, asked to imagine the �ideal diet� for children tended to envisage a draconian, and unrealistic ban on whole categories of foods: dairy products, sugar and carbohydrates. �Self believer� mothers, who are more likely to assure a healthy diet for their children, opted for a more inclusive, but balanced diet. The minority support for a total advertising ban on the part of some parents of obese children is also in keeping with the fact that a minority report �never� giving in to their child�s requests for food and drink (see �Pester Power� above), suggesting a certain rigidity or lack of the ability to compromise in the face of difficult decisions. This tendency too was described in the qualitative research. Foulds states:
�In a few cases, specific food-related problems, (usually obesity) had resulted in �Fatalist� mothers becoming extremely and excessively controlling with regard to their children�s eating.� 299
Although the differences are not statistically significant, it is interesting that parents of obese children are less likely to support the suggestion that advertising should contain a nutritional message (14% do so, compared with 31% of parents of normal weight children). This is consistent with the fact that parents of obese children are less likely than parents of normal weight children to say they �read labels on food products carefully to find out about salt, sugar and fat content� (27% do so compared with 37%).
299 See Foulds, R. (2004) Food promotion and Children: Report on Qualitative Research. P25.
Differences Between Obese & Normal Weight Children
175
Summary
Differences between obese and normal weight children
DietCompared with children of normal weight, obese children consume less home-made food, fewer vegetables and less fruit. They consume more frozen food, micro-waved food and more carbonated drinks.
Obese children themselves tend to report snacking more often than children of normal weight. When they do snack, they are more likely than children of normal weight to consume crisps and nuts inside the home and carbonated drinks outside it.
Attitudes and behaviour Obese children are considered healthy, and of �average weight� by the majority of their parents. Most of the children themselves say they are happy with their current weight and about the way they look.
Compared with children and parents in families where the child is of normal weight, both obese children and their parents are less knowledgeable about healthy eating and less likely to appreciate the importance of eating fresh fruit and vegetables.
Parents of obese children compared with parents of normal weight children are less motivated by health and more motivated by convenience and price when choosing food.
Although television advertising has only a relatively small influence on obese children�s food choice compared with other factors such as taste, the influence of friends (for children) and convenience (for parents), it may have a more powerful influence than on children of normal weight, engaging them in a more emotional/physical way.
Parents of obese children tend to have a more �laissez faire� attitude to mealtimes and seem generally less confident than parents of normal weight children about their own ability to have an influence on their children�s diets. They are more likely to rely on schools to make a difference and consider lunchtime meals to be more important than do parents of normal weight.
They are concerned about their children�s weight, but tend to go to extremes when considering what to do about it. Minorities support either �no change� to rules governing the advertising of food and drink to children, or the most radical and uncompromising alternative � a complete ban on advertising food and drinks. (Similarly, asked to imagine the �ideal diet� mothers who were more likely to provide a poor diet for their children tended to envisage an unrealistic avoidance of whole categories of food.)
Conclusions
176
4 Conclusions Context
¶ Children�s food preference, consumption and behaviour are multi-determined.
¶ The rise in obesity levels amongst children is similarly multi-determined, against a backdrop of key lifestyle changes over the past few decades.
¶ People see parents as primarily responsible for improving children�s diets. Schools and food manufacturers are also seen to play an important role. The role of government, the media, supermarkets and broadcasters is not perceived to be as important as these three.
¶ There is a trend for children to increasingly influence their own diet with the acquiescence of their parents.
¶ TV advertising forms a smaller part of a larger social issue.
¶ Solutions to the problem of obesity need to be multi-faceted.
The role of television advertising
There is sufficient empirical evidence to conclude that:
¶ TV advertising has a modest, direct effect on children�s food choices.
¶ While indirect effects are likely to be larger, there is insufficient evidence to determine the relative size of the effect of TV advertising on children�s food choice, by comparison with other relevant factors.
o This does not however mean that the indirect effects of television advertising are negligible. It is widely argued in the fields of social and developmental psychology and in consumer marketing research that substantial indirect effects occur.
¶ In the context of the multiplicity of influences of children�s food choice, it is perhaps not surprising that the direct effect of TV advertising has been found to be �modest�. While from our qualitative research we found that TV plays an important role, in our quantitative research we saw that more important are, for example, the child�s own taste preference, price, familiarity, peer pressure, healthiness and convenience.
Children�s television viewing
Analysis of children�s viewing behaviour reveals:
¶ On average children aged 4-15 watch far more television in adult airtime than they do in children�s airtime (12 hours vs 5 hours/week)
Conclusions
177
¶ Most of their viewing in commercial children�s airtime (2.6 hours/week) is with non-terrestrial channels (1.9 hours/week)
¶ Children watch an average of 22 minutes a day of commercial children�s TV.
¶ Overall, around one in five ads seen by children is for a Core Category product.
¶ On average, over half of these Core Category TV ads are seen by children outside of children�s airtime. However:
o children aged 4 � 9 see just over half of the Core Category advertisements that they are exposed to in children�s airtime
o children aged 10 � 15 see around one third in children�s airtime.
¶ 29% of the advertising impacts in children�s airtime are for Core Category products.
¶ Most of the TV advertising Core Category products that children see is for confectionery, savoury snacks, soft drinks, fast food and pre-sugared breakfast cereals (the �Big Five�).
Parents� views on regulation
¶ Most parents believe that the rules about how the �Big Five� are advertised on television need to be changed.
o Least support was registered for an outright ban on the advertising of HFSS products on TV
o Most support emerged for ensuring that there is accurate information in advertising (i.e. the provision of nutritional information; banning health claims if something else about the product is �unhealthy�)
o There is also support for
¶ targeting the attractiveness of advertising to children (in general, not using celebrities or cartoon characters)
¶ targeted scheduling restrictions (a ban during children�s airtime or before 9 o�clock in the evening � even though in our qualitative research mothers acknowledged that regarding the former, children watch TV in adult airtime where they can still see HFSS advertising, and that, regarding the latter, such a ban was felt to compromise adult freedom to enjoy advertising.)
Experience in other countries
Little research has been done to evaluate the effectiveness of banning food advertising on TV and where there has been research in other countries on the
Conclusions
178
effectiveness of bans on food advertising in relation to obesity, the conclusions are at best both unclear and contested.
Conclusions
179
Implications for regulatory change
Solutions to the problems of obesity/children�s health need to be multi-faceted. While the research suggests that regulation of TV advertising has a role to play, changing the rules around the advertising of HFSS products alone as a single approach to combat obesity seems highly unlikely to succeed.
Addressing how HFSS products are advertised on television will need to be accompanied by comparable action in a number of other areas, for example:
- Improved access to healthy foods in areas of multiple deprivation300
- improved food provision in schools - promotion of physical exercise - educational programmes to promote healthy eating - promotion of media and advertising literacy - food pricing - labelling of foods - regulation of other forms of promotion.
Furthermore, a necessary prerequisite for any proportionate and targeted intervention would be a practical, actionable definition of what defines a HFSS/�unhealthy� product, and conversely, what constitutes a healthy food.
300 The Index of Multiple Deprivation (IMD) ranks areas from among the most deprived to the least deprived. The classification is based upon area characteristics in six domains: income, employment, health and disability, education, housing and access to services. Obesity is consistently linked to IMD. Access to fast food on high streets is lower income areas is often easier than to fruit and vegetables (Inconvenience Food, Demos 1999). Cited in Henley Centre report prepared for Ofcom.