Embed Size (px)
Citation preview
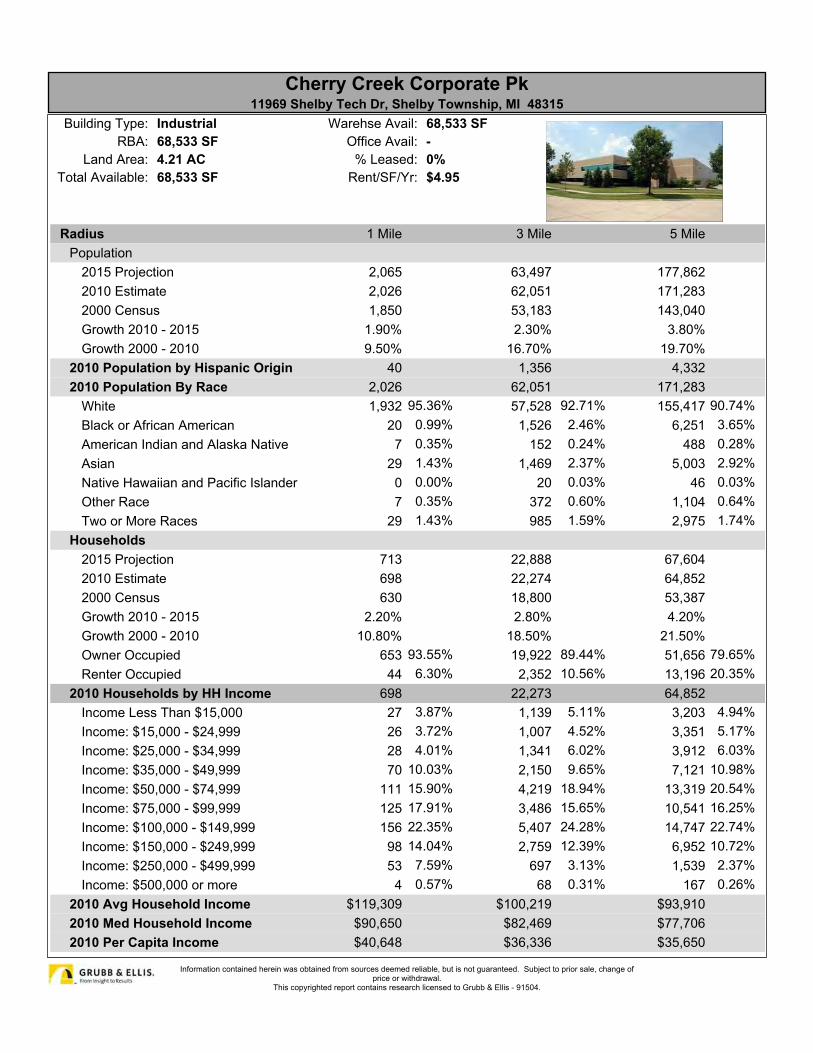
0%-68,533 SF
68,533 SF4.21 AC68,533 SFIndustrial
% Leased:Office Avail:
Warehse Avail:
Total Available:Land Area:
RBA:Building Type:
Rent/SF/Yr: $4.95
Radius 1 Mile 3 Mile 5 MilePopulation
2015 Projection 2,065 63,497 177,8622010 Estimate 2,026 62,051 171,2832000 Census 1,850 53,183 143,040Growth 2010 - 2015 1.90% 2.30% 3.80%Growth 2000 - 2010 9.50% 16.70% 19.70%
2010 Population by Hispanic Origin 40 1,356 4,3322010 Population By Race 2,026 62,051 171,283
White 1,932 95.36% 57,528 92.71% 155,417 90.74%Black or African American 20 0.99% 1,526 2.46% 6,251 3.65%American Indian and Alaska Native 7 0.35% 152 0.24% 488 0.28%Asian 29 1.43% 1,469 2.37% 5,003 2.92%Native Hawaiian and Pacific Islander 0 0.00% 20 0.03% 46 0.03%Other Race 7 0.35% 372 0.60% 1,104 0.64%Two or More Races 29 1.43% 985 1.59% 2,975 1.74%
Households2015 Projection 713 22,888 67,6042010 Estimate 698 22,274 64,8522000 Census 630 18,800 53,387Growth 2010 - 2015 2.20% 2.80% 4.20%Growth 2000 - 2010 10.80% 18.50% 21.50%Owner Occupied 653 93.55% 19,922 89.44% 51,656 79.65%Renter Occupied 44 6.30% 2,352 10.56% 13,196 20.35%
2010 Households by HH Income 698 22,273 64,852Income Less Than $15,000 27 3.87% 1,139 5.11% 3,203 4.94%Income: $15,000 - $24,999 26 3.72% 1,007 4.52% 3,351 5.17%Income: $25,000 - $34,999 28 4.01% 1,341 6.02% 3,912 6.03%Income: $35,000 - $49,999 70 10.03% 2,150 9.65% 7,121 10.98%Income: $50,000 - $74,999 111 15.90% 4,219 18.94% 13,319 20.54%Income: $75,000 - $99,999 125 17.91% 3,486 15.65% 10,541 16.25%Income: $100,000 - $149,999 156 22.35% 5,407 24.28% 14,747 22.74%Income: $150,000 - $249,999 98 14.04% 2,759 12.39% 6,952 10.72%Income: $250,000 - $499,999 53 7.59% 697 3.13% 1,539 2.37%Income: $500,000 or more 4 0.57% 68 0.31% 167 0.26%
2010 Avg Household Income $119,309 $100,219 $93,9102010 Med Household Income $90,650 $82,469 $77,7062010 Per Capita Income $40,648 $36,336 $35,650
Cherry Creek Corporate Pk11969 Shelby Tech Dr, Shelby Township, MI 48315
Information contained herein was obtained from sources deemed reliable, but is not guaranteed. Subject to prior sale, change ofprice or withdrawal.
This copyrighted report contains research licensed to Grubb & Ellis - 91504.
0%-68,533 SF
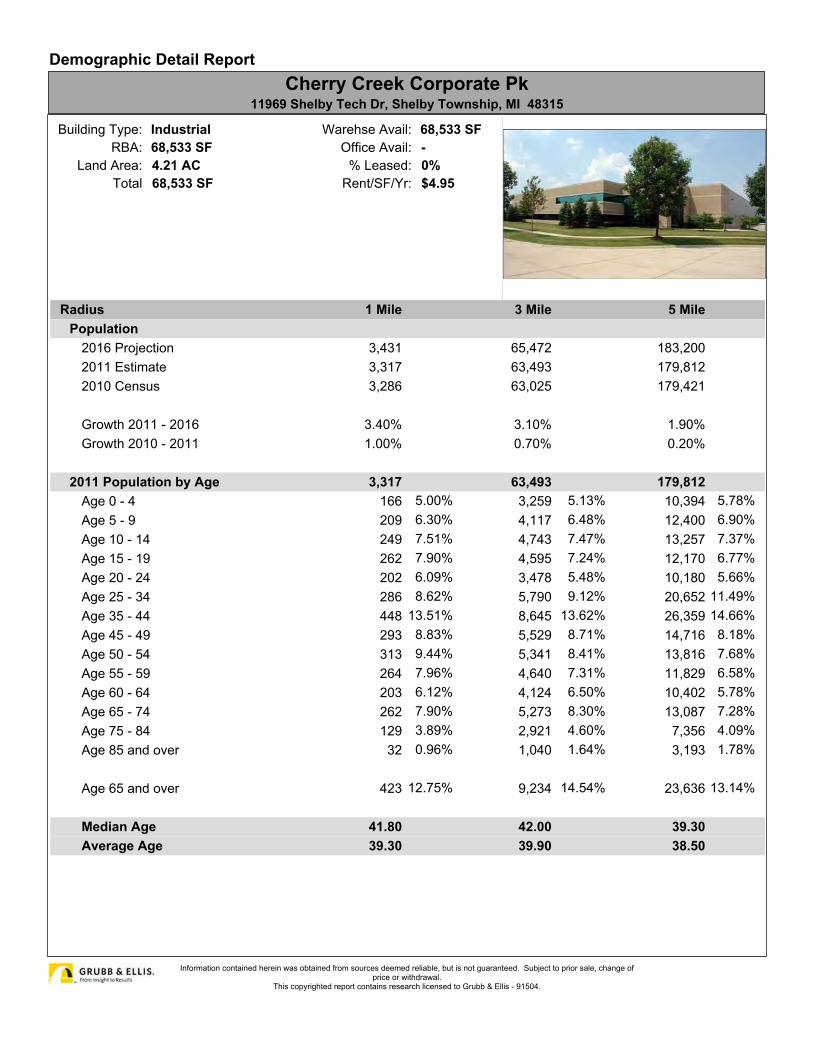
68,533 SF4.21 AC68,533 SFIndustrial
% Leased:Office Avail:
Warehse Avail:
TotalLand Area:
RBA:Building Type:
Rent/SF/Yr: $4.95
Radius 1 Mile 3 Mile 5 MilePopulation
2016 Projection 3,431 65,472 183,2002011 Estimate 3,317 63,493 179,8122010 Census 3,286 63,025 179,421
Growth 2011 - 2016 3.40% 3.10% 1.90%Growth 2010 - 2011 1.00% 0.70% 0.20%
2011 Population by Age 3,317 63,493 179,812Age 0 - 4 166 5.00% 3,259 5.13% 10,394 5.78%Age 5 - 9 209 6.30% 4,117 6.48% 12,400 6.90%Age 10 - 14 249 7.51% 4,743 7.47% 13,257 7.37%Age 15 - 19 262 7.90% 4,595 7.24% 12,170 6.77%Age 20 - 24 202 6.09% 3,478 5.48% 10,180 5.66%Age 25 - 34 286 8.62% 5,790 9.12% 20,652 11.49%Age 35 - 44 448 13.51% 8,645 13.62% 26,359 14.66%Age 45 - 49 293 8.83% 5,529 8.71% 14,716 8.18%Age 50 - 54 313 9.44% 5,341 8.41% 13,816 7.68%Age 55 - 59 264 7.96% 4,640 7.31% 11,829 6.58%Age 60 - 64 203 6.12% 4,124 6.50% 10,402 5.78%Age 65 - 74 262 7.90% 5,273 8.30% 13,087 7.28%Age 75 - 84 129 3.89% 2,921 4.60% 7,356 4.09%Age 85 and over 32 0.96% 1,040 1.64% 3,193 1.78%
Age 65 and over 423 12.75% 9,234 14.54% 23,636 13.14%
Median Age 41.80 42.00 39.30Average Age 39.30 39.90 38.50
Demographic Detail ReportCherry Creek Corporate Pk
11969 Shelby Tech Dr, Shelby Township, MI 48315
Information contained herein was obtained from sources deemed reliable, but is not guaranteed. Subject to prior sale, change ofprice or withdrawal.
This copyrighted report contains research licensed to Grubb & Ellis - 91504.
Demographic Detail ReportCherry Creek Corporate Pk
11969 Shelby Tech Dr, Shelby Township, MI 48315Radius 1 Mile 3 Mile 5 Mile
2011 Population By Race 3,317 63,493 179,812White 3,090 93.16% 59,178 93.20% 163,389 90.87%Black or African American 72 2.17% 1,158 1.82% 5,861 3.26%American Indian and Alaska Native 12 0.36% 152 0.24% 456 0.25%Asian 87 2.62% 1,861 2.93% 5,590 3.11%Native Hawaiian and Pacific Islander 1 0.03% 11 0.02% 36 0.02%Other Race 6 0.18% 265 0.42% 1,522 0.85%Two or More Races 49 1.48% 868 1.37% 2,959 1.65%
2011 Population by Hispanic Origin 3,317 63,493 179,813Not Hispanic or Latino 3,253 98.07% 62,246 98.04% 174,632 97.12%Hispanic or Latino 64 1.93% 1,247 1.96% 5,181 2.88%
2011 Age 5+ Language at Home 1,678 57,627 157,534Speak Only English 1,430 85.22% 49,056 85.13% 133,330 84.64%Speak Asian or Pacific Island 5 0.30% 1,016 1.76% 2,927 1.86%Speak IndoEuropean 195 11.62% 5,476 9.50% 14,969 9.50%Speak Spanish 9 0.54% 735 1.28% 3,162 2.01%Speak Other Language 39 2.32% 1,344 2.33% 3,146 2.00%
2011 Median Age, Male 41.00 40.90 38.202011 Average Age, Male 38.60 38.90 37.50
Median Age, Female 42.50 42.90 40.40Average Age, Female 39.90 40.90 39.60
2011 Population by OccupationClassification (Age 16+)
774 28,089 81,988
Blue Collar 119 15.37% 5,183 18.45% 15,683 19.13%White Collar 516 66.67% 19,101 68.00% 54,105 65.99%Service 139 17.96% 3,805 13.55% 12,200 14.88%
2011 Population by Marital Status(Age 15+)
1,460 48,804 133,575
Total, Never Married 361 24.73% 12,176 24.95% 35,204 26.36%Married 932 63.84% 30,641 62.78% 79,779 59.73%Widowed 97 6.64% 2,631 5.39% 7,362 5.51%Divorced 70 4.79% 3,356 6.88% 11,230 8.41%
Information contained herein was obtained from sources deemed reliable, but is not guaranteed. Subject to prior sale, change ofprice or withdrawal.
This copyrighted report contains research licensed to Grubb & Ellis - 91504.
Demographic Detail ReportCherry Creek Corporate Pk
11969 Shelby Tech Dr, Shelby Township, MI 48315Radius 1 Mile 3 Mile 5 Mile
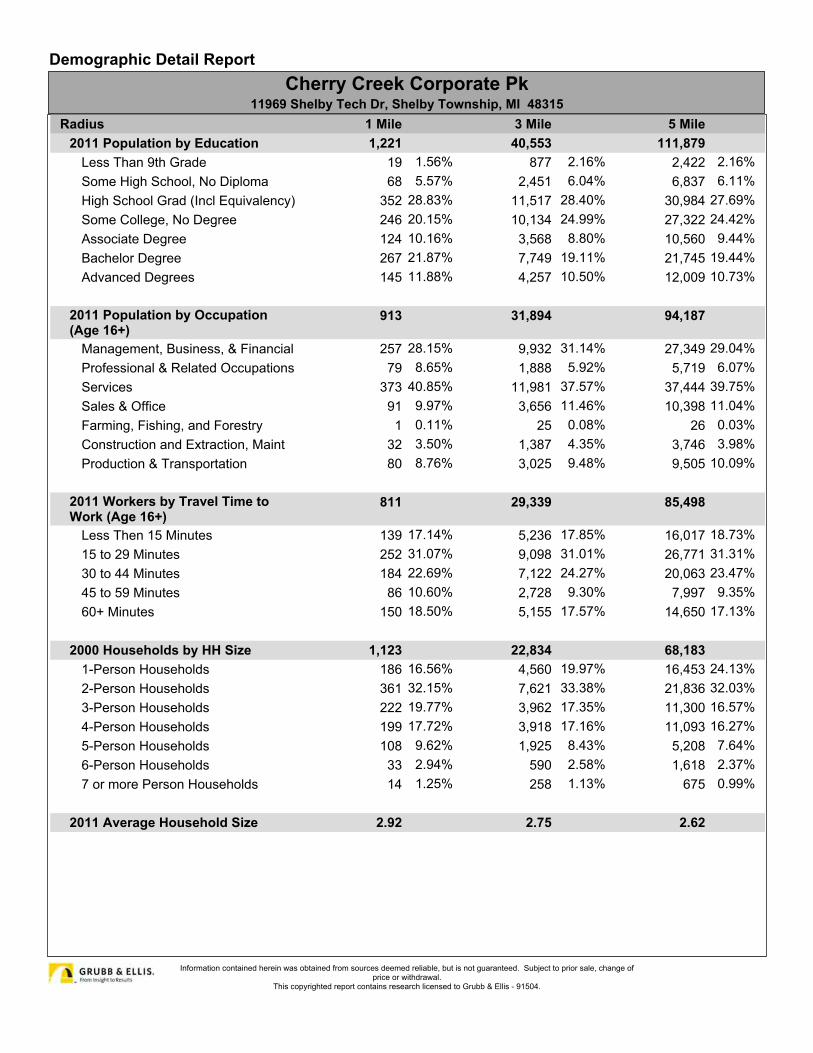
2011 Population by Education 1,221 40,553 111,879Less Than 9th Grade 19 1.56% 877 2.16% 2,422 2.16%Some High School, No Diploma 68 5.57% 2,451 6.04% 6,837 6.11%High School Grad (Incl Equivalency) 352 28.83% 11,517 28.40% 30,984 27.69%Some College, No Degree 246 20.15% 10,134 24.99% 27,322 24.42%Associate Degree 124 10.16% 3,568 8.80% 10,560 9.44%Bachelor Degree 267 21.87% 7,749 19.11% 21,745 19.44%Advanced Degrees 145 11.88% 4,257 10.50% 12,009 10.73%
2011 Population by Occupation(Age 16+)
913 31,894 94,187
Management, Business, & Financial 257 28.15% 9,932 31.14% 27,349 29.04%Professional & Related Occupations 79 8.65% 1,888 5.92% 5,719 6.07%Services 373 40.85% 11,981 37.57% 37,444 39.75%Sales & Office 91 9.97% 3,656 11.46% 10,398 11.04%Farming, Fishing, and Forestry 1 0.11% 25 0.08% 26 0.03%Construction and Extraction, Maint 32 3.50% 1,387 4.35% 3,746 3.98%Production & Transportation 80 8.76% 3,025 9.48% 9,505 10.09%
2011 Workers by Travel Time toWork (Age 16+)
811 29,339 85,498
Less Then 15 Minutes 139 17.14% 5,236 17.85% 16,017 18.73%15 to 29 Minutes 252 31.07% 9,098 31.01% 26,771 31.31%30 to 44 Minutes 184 22.69% 7,122 24.27% 20,063 23.47%45 to 59 Minutes 86 10.60% 2,728 9.30% 7,997 9.35%60+ Minutes 150 18.50% 5,155 17.57% 14,650 17.13%
2000 Households by HH Size 1,123 22,834 68,1831-Person Households 186 16.56% 4,560 19.97% 16,453 24.13%2-Person Households 361 32.15% 7,621 33.38% 21,836 32.03%3-Person Households 222 19.77% 3,962 17.35% 11,300 16.57%4-Person Households 199 17.72% 3,918 17.16% 11,093 16.27%5-Person Households 108 9.62% 1,925 8.43% 5,208 7.64%6-Person Households 33 2.94% 590 2.58% 1,618 2.37%7 or more Person Households 14 1.25% 258 1.13% 675 0.99%
2011 Average Household Size 2.92 2.75 2.62
Information contained herein was obtained from sources deemed reliable, but is not guaranteed. Subject to prior sale, change ofprice or withdrawal.
This copyrighted report contains research licensed to Grubb & Ellis - 91504.
Demographic Detail ReportCherry Creek Corporate Pk
11969 Shelby Tech Dr, Shelby Township, MI 48315Radius 1 Mile 3 Mile 5 Mile
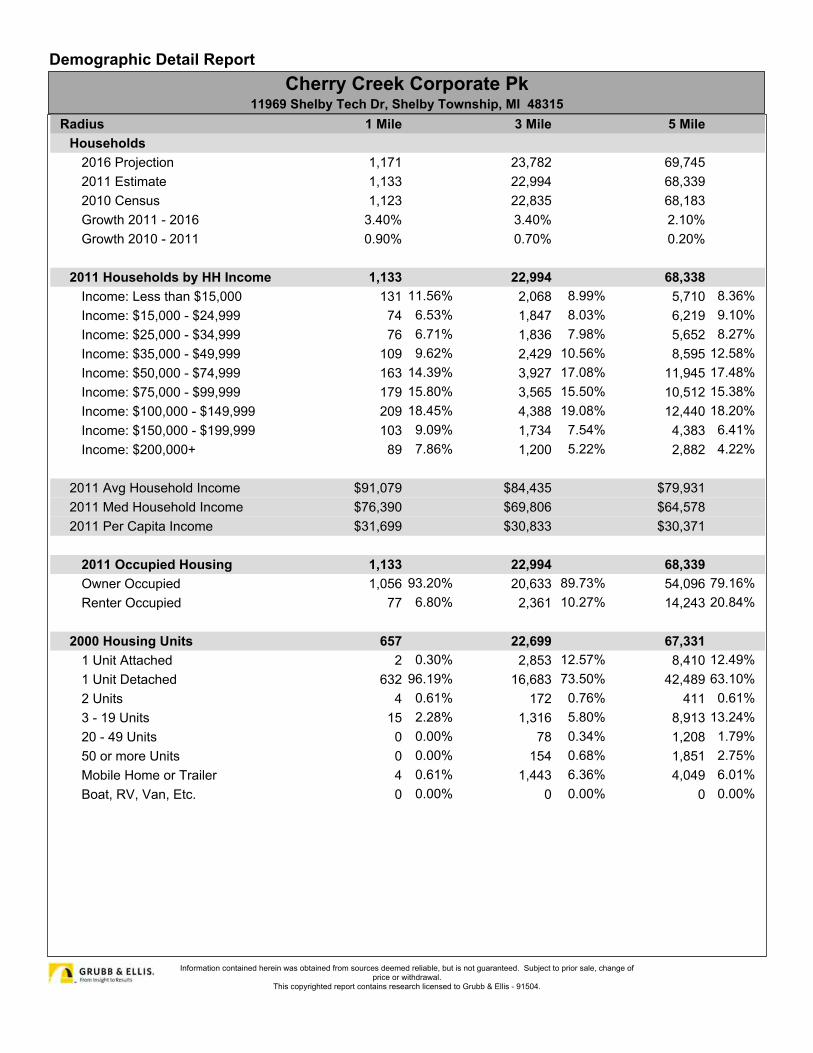
Households2016 Projection 1,171 23,782 69,7452011 Estimate 1,133 22,994 68,3392010 Census 1,123 22,835 68,183Growth 2011 - 2016 3.40% 3.40% 2.10%Growth 2010 - 2011 0.90% 0.70% 0.20%
2011 Households by HH Income 1,133 22,994 68,338Income: Less than $15,000 131 11.56% 2,068 8.99% 5,710 8.36%Income: $15,000 - $24,999 74 6.53% 1,847 8.03% 6,219 9.10%Income: $25,000 - $34,999 76 6.71% 1,836 7.98% 5,652 8.27%Income: $35,000 - $49,999 109 9.62% 2,429 10.56% 8,595 12.58%Income: $50,000 - $74,999 163 14.39% 3,927 17.08% 11,945 17.48%Income: $75,000 - $99,999 179 15.80% 3,565 15.50% 10,512 15.38%Income: $100,000 - $149,999 209 18.45% 4,388 19.08% 12,440 18.20%Income: $150,000 - $199,999 103 9.09% 1,734 7.54% 4,383 6.41%Income: $200,000+ 89 7.86% 1,200 5.22% 2,882 4.22%
2011 Avg Household Income $91,079 $84,435 $79,9312011 Med Household Income $76,390 $69,806 $64,5782011 Per Capita Income $31,699 $30,833 $30,371
2011 Occupied Housing 1,133 22,994 68,339Owner Occupied 1,056 93.20% 20,633 89.73% 54,096 79.16%Renter Occupied 77 6.80% 2,361 10.27% 14,243 20.84%
2000 Housing Units 657 22,699 67,3311 Unit Attached 2 0.30% 2,853 12.57% 8,410 12.49%1 Unit Detached 632 96.19% 16,683 73.50% 42,489 63.10%2 Units 4 0.61% 172 0.76% 411 0.61%3 - 19 Units 15 2.28% 1,316 5.80% 8,913 13.24%20 - 49 Units 0 0.00% 78 0.34% 1,208 1.79%50 or more Units 0 0.00% 154 0.68% 1,851 2.75%Mobile Home or Trailer 4 0.61% 1,443 6.36% 4,049 6.01%Boat, RV, Van, Etc. 0 0.00% 0 0.00% 0 0.00%
Information contained herein was obtained from sources deemed reliable, but is not guaranteed. Subject to prior sale, change ofprice or withdrawal.
This copyrighted report contains research licensed to Grubb & Ellis - 91504.
Demographic Detail ReportCherry Creek Corporate Pk
11969 Shelby Tech Dr, Shelby Township, MI 48315Radius 1 Mile 3 Mile 5 Mile
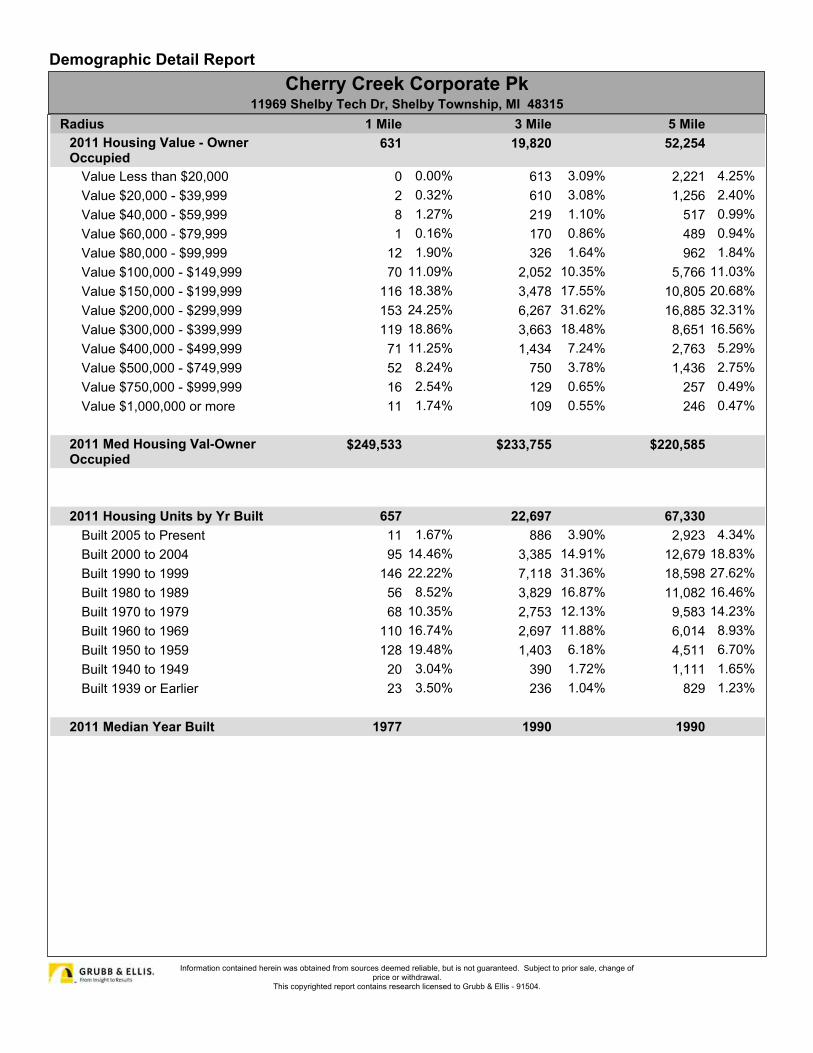
2011 Housing Value - OwnerOccupied
631 19,820 52,254
Value Less than $20,000 0 0.00% 613 3.09% 2,221 4.25%Value $20,000 - $39,999 2 0.32% 610 3.08% 1,256 2.40%Value $40,000 - $59,999 8 1.27% 219 1.10% 517 0.99%Value $60,000 - $79,999 1 0.16% 170 0.86% 489 0.94%Value $80,000 - $99,999 12 1.90% 326 1.64% 962 1.84%Value $100,000 - $149,999 70 11.09% 2,052 10.35% 5,766 11.03%Value $150,000 - $199,999 116 18.38% 3,478 17.55% 10,805 20.68%Value $200,000 - $299,999 153 24.25% 6,267 31.62% 16,885 32.31%Value $300,000 - $399,999 119 18.86% 3,663 18.48% 8,651 16.56%Value $400,000 - $499,999 71 11.25% 1,434 7.24% 2,763 5.29%Value $500,000 - $749,999 52 8.24% 750 3.78% 1,436 2.75%Value $750,000 - $999,999 16 2.54% 129 0.65% 257 0.49%Value $1,000,000 or more 11 1.74% 109 0.55% 246 0.47%
2011 Med Housing Val-OwnerOccupied
$249,533 $233,755 $220,585
2011 Housing Units by Yr Built 657 22,697 67,330Built 2005 to Present 11 1.67% 886 3.90% 2,923 4.34%Built 2000 to 2004 95 14.46% 3,385 14.91% 12,679 18.83%Built 1990 to 1999 146 22.22% 7,118 31.36% 18,598 27.62%Built 1980 to 1989 56 8.52% 3,829 16.87% 11,082 16.46%Built 1970 to 1979 68 10.35% 2,753 12.13% 9,583 14.23%Built 1960 to 1969 110 16.74% 2,697 11.88% 6,014 8.93%Built 1950 to 1959 128 19.48% 1,403 6.18% 4,511 6.70%Built 1940 to 1949 20 3.04% 390 1.72% 1,111 1.65%Built 1939 or Earlier 23 3.50% 236 1.04% 829 1.23%
2011 Median Year Built 1977 1990 1990
Information contained herein was obtained from sources deemed reliable, but is not guaranteed. Subject to prior sale, change ofprice or withdrawal.
This copyrighted report contains research licensed to Grubb & Ellis - 91504.
0%-68,533 SF
68,533 SF4.21 AC68,533 SFIndustrial
% Leased:Office Avail:
Warehse Av:
Total Available:Land Area:
RBA:Building Type:
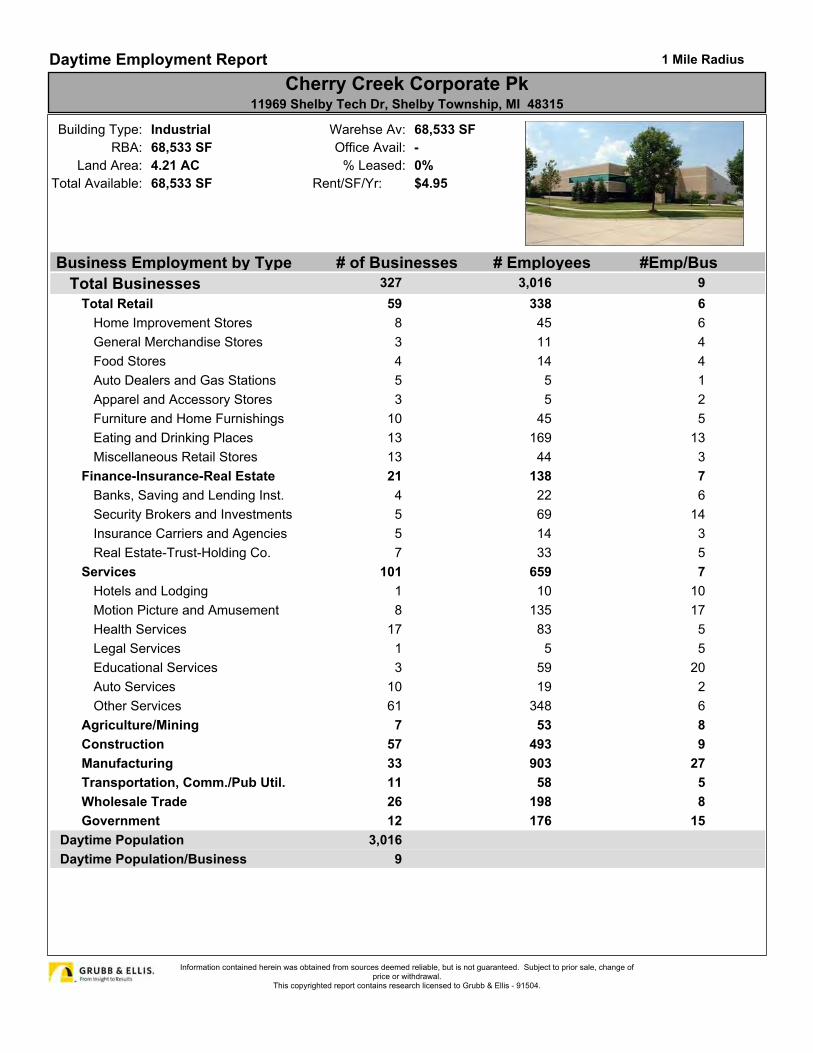
Business Employment by Type # of Businesses # Employees #Emp/Bus
Rent/SF/Yr: $4.95
Total Businesses 327 3,016 9Total Retail 59 338 6
Home Improvement Stores 8 45 6General Merchandise Stores 3 11 4Food Stores 4 14 4Auto Dealers and Gas Stations 5 5 1Apparel and Accessory Stores 3 5 2Furniture and Home Furnishings 10 45 5Eating and Drinking Places 13 169 13Miscellaneous Retail Stores 13 44 3
Finance-Insurance-Real Estate 21 138 7Banks, Saving and Lending Inst. 4 22 6Security Brokers and Investments 5 69 14Insurance Carriers and Agencies 5 14 3Real Estate-Trust-Holding Co. 7 33 5
Services 101 659 7Hotels and Lodging 1 10 10Motion Picture and Amusement 8 135 17Health Services 17 83 5Legal Services 1 5 5Educational Services 3 59 20Auto Services 10 19 2Other Services 61 348 6
Agriculture/Mining 7 53 8Construction 57 493 9Manufacturing 33 903 27Transportation, Comm./Pub Util. 11 58 5Wholesale Trade 26 198 8Government 12 176 15
Daytime Population 3,016Daytime Population/Business 9
Daytime Employment Report 1 Mile Radius
Cherry Creek Corporate Pk11969 Shelby Tech Dr, Shelby Township, MI 48315
Information contained herein was obtained from sources deemed reliable, but is not guaranteed. Subject to prior sale, change ofprice or withdrawal.
This copyrighted report contains research licensed to Grubb & Ellis - 91504.
0%-68,533 SF68,533 SF4.21 AC68,533 SFIndustrial
% Leased:Office Avail:
Warehse Avail:Total Available:
Land Area:RBA:
Building Type:
Rent/SF/Yr: $4.95
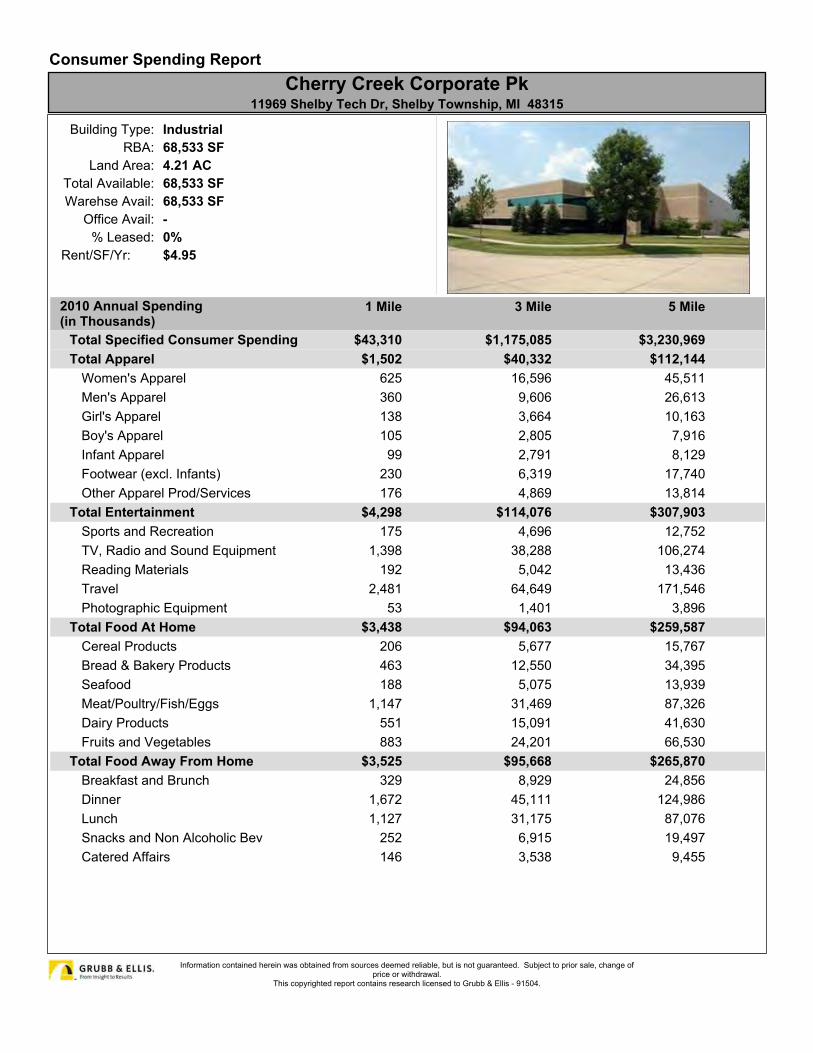
2010 Annual Spending(in Thousands)
1 Mile 3 Mile 5 Mile
Total Specified Consumer Spending $43,310 $1,175,085 $3,230,969Total Apparel $1,502 $40,332 $112,144
Women's Apparel 625 16,596 45,511Men's Apparel 360 9,606 26,613Girl's Apparel 138 3,664 10,163Boy's Apparel 105 2,805 7,916Infant Apparel 99 2,791 8,129Footwear (excl. Infants) 230 6,319 17,740Other Apparel Prod/Services 176 4,869 13,814
Total Entertainment $4,298 $114,076 $307,903Sports and Recreation 175 4,696 12,752TV, Radio and Sound Equipment 1,398 38,288 106,274Reading Materials 192 5,042 13,436Travel 2,481 64,649 171,546Photographic Equipment 53 1,401 3,896
Total Food At Home $3,438 $94,063 $259,587Cereal Products 206 5,677 15,767Bread & Bakery Products 463 12,550 34,395Seafood 188 5,075 13,939Meat/Poultry/Fish/Eggs 1,147 31,469 87,326Dairy Products 551 15,091 41,630Fruits and Vegetables 883 24,201 66,530
Total Food Away From Home $3,525 $95,668 $265,870Breakfast and Brunch 329 8,929 24,856Dinner 1,672 45,111 124,986Lunch 1,127 31,175 87,076Snacks and Non Alcoholic Bev 252 6,915 19,497Catered Affairs 146 3,538 9,455
Consumer Spending ReportCherry Creek Corporate Pk
11969 Shelby Tech Dr, Shelby Township, MI 48315
Information contained herein was obtained from sources deemed reliable, but is not guaranteed. Subject to prior sale, change ofprice or withdrawal.
This copyrighted report contains research licensed to Grubb & Ellis - 91504.
Consumer Spending ReportCherry Creek Corporate Pk
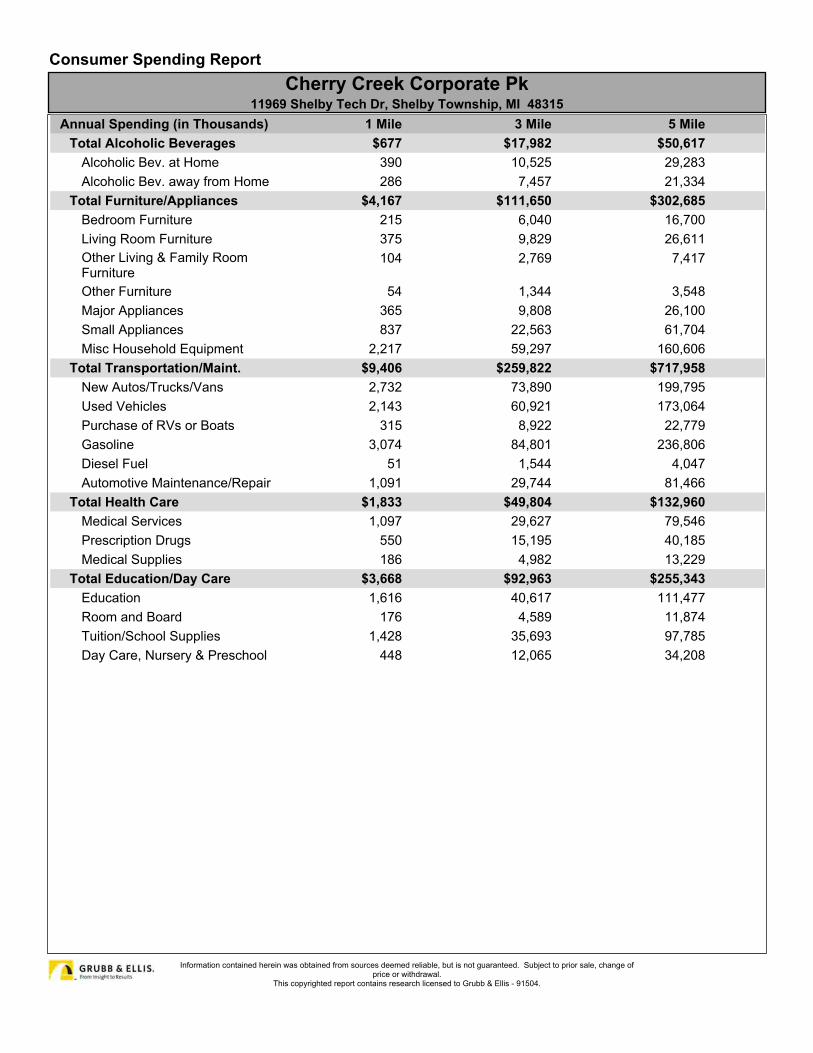
11969 Shelby Tech Dr, Shelby Township, MI 48315Annual Spending (in Thousands) 1 Mile 3 Mile 5 Mile
Total Alcoholic Beverages $677 $17,982 $50,617Alcoholic Bev. at Home 390 10,525 29,283Alcoholic Bev. away from Home 286 7,457 21,334
Total Furniture/Appliances $4,167 $111,650 $302,685Bedroom Furniture 215 6,040 16,700Living Room Furniture 375 9,829 26,611Other Living & Family RoomFurniture
104 2,769 7,417
Other Furniture 54 1,344 3,548Major Appliances 365 9,808 26,100Small Appliances 837 22,563 61,704Misc Household Equipment 2,217 59,297 160,606
Total Transportation/Maint. $9,406 $259,822 $717,958New Autos/Trucks/Vans 2,732 73,890 199,795Used Vehicles 2,143 60,921 173,064Purchase of RVs or Boats 315 8,922 22,779Gasoline 3,074 84,801 236,806Diesel Fuel 51 1,544 4,047Automotive Maintenance/Repair 1,091 29,744 81,466
Total Health Care $1,833 $49,804 $132,960Medical Services 1,097 29,627 79,546Prescription Drugs 550 15,195 40,185Medical Supplies 186 4,982 13,229
Total Education/Day Care $3,668 $92,963 $255,343Education 1,616 40,617 111,477Room and Board 176 4,589 11,874Tuition/School Supplies 1,428 35,693 97,785Day Care, Nursery & Preschool 448 12,065 34,208
Information contained herein was obtained from sources deemed reliable, but is not guaranteed. Subject to prior sale, change ofprice or withdrawal.
This copyrighted report contains research licensed to Grubb & Ellis - 91504.
0%-68,5
33 S
F68
,533
SF
4.21
AC
68,5
33 S
FIn
dust
rial
% L
ease
d:O
ffice
Ava
il:W
areh
se A
vail:
Tota
l Ava
ilabl
e:La
nd A
rea:
RB
A:
Bui
ldin
g Ty
pe:
Ren
t/SF/
Yr:
$4.9
5
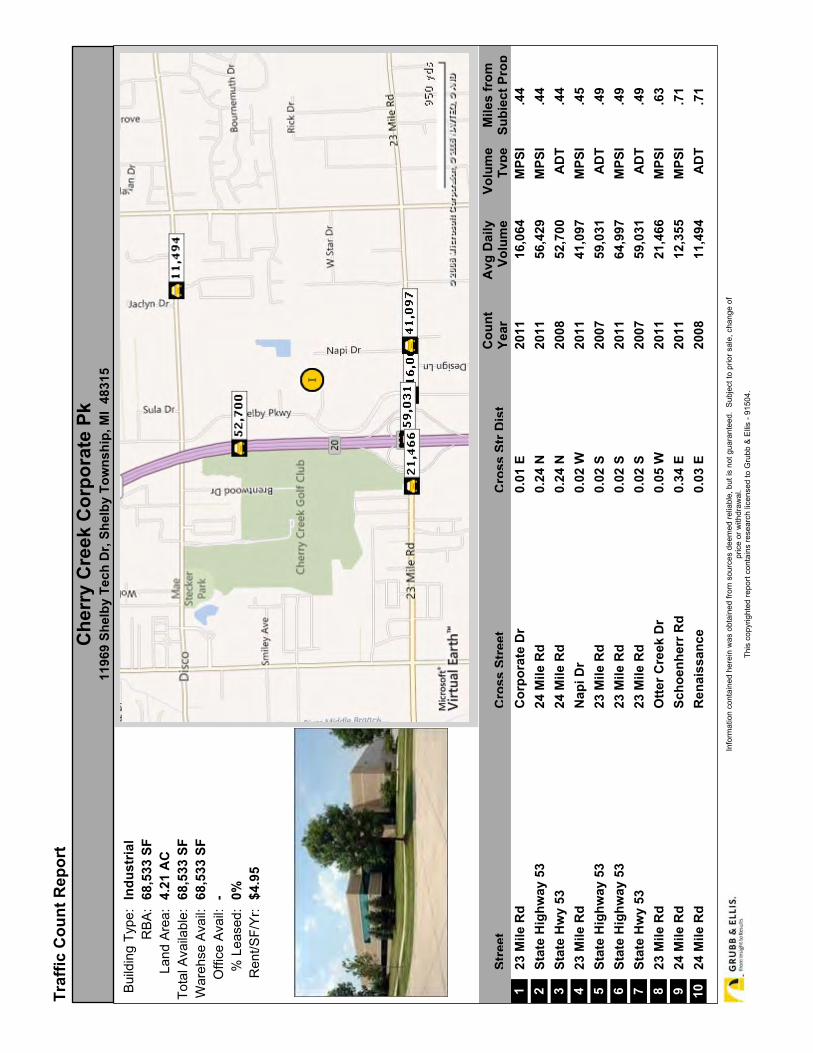
Stre
etC
ross
Str
eet
Cro
ss S
tr D
ist
Cou
ntYe
arA
vg D
aily
Volu
me
Volu
me
Type
Mile
s fr
omSu
bjec
t Pro
p1
23 M
ile R
dC
orpo
rate
Dr
0.01
E20
1116
,064
MPS
I.4
42
Stat
e H
ighw
ay 5
324
Mile
Rd
0.24
N20
1156
,429
MPS
I.4
43
Stat
e H
wy
5324
Mile
Rd
0.24
N20
0852
,700
AD
T.4
44
23 M
ile R
dN
api D
r0.
02 W
2011
41,0
97M
PSI
.45
5St
ate
Hig
hway
53
23 M
ile R
d0.
02 S
2007
59,0
31A
DT
.49
6St
ate
Hig
hway
53
23 M
ile R
d0.
02 S
2011
64,9
97M
PSI
.49
7St
ate
Hw
y 53
23 M
ile R
d0.
02 S
2007
59,0
31A
DT
.49
823
Mile
Rd
Otte
r Cre
ek D
r0.
05 W
2011
21,4
66M
PSI
.63
924
Mile
Rd
Scho
enhe
rr R
d0.
34 E
2011
12,3
55M
PSI
.71
1024
Mile
Rd
Ren
aiss
ance
0.03
E20
0811
,494
AD
T.7
1
Traf
fic C
ount
Rep
ort
Che
rry
Cre
ek C
orpo
rate
Pk
1196
9 Sh
elby
Tec
h D
r, Sh
elby
Tow
nshi
p, M
I 48
315
Info
rmat
ion
cont
aine
d he
rein
was
obt
aine
d fro
m s
ourc
es d
eem
ed re
liabl
e, b
ut is
not
gua
rant
eed.
Sub
ject
to p
rior s
ale,
cha
nge
ofpr
ice
or w
ithdr
awal
.Th
is c
opyr
ight
ed re
port
cont
ains
rese
arch
lice
nsed
to G
rubb
& E
llis
- 915
04.
0%-68,533 SF
68,533 SF4.21 AC68,533 SFIndustrial
% Leased:Office Avail:
Warehse Avail:
Total Available:Land Area:
RBA:Building Type:
Rent/SF/Yr: $4.95
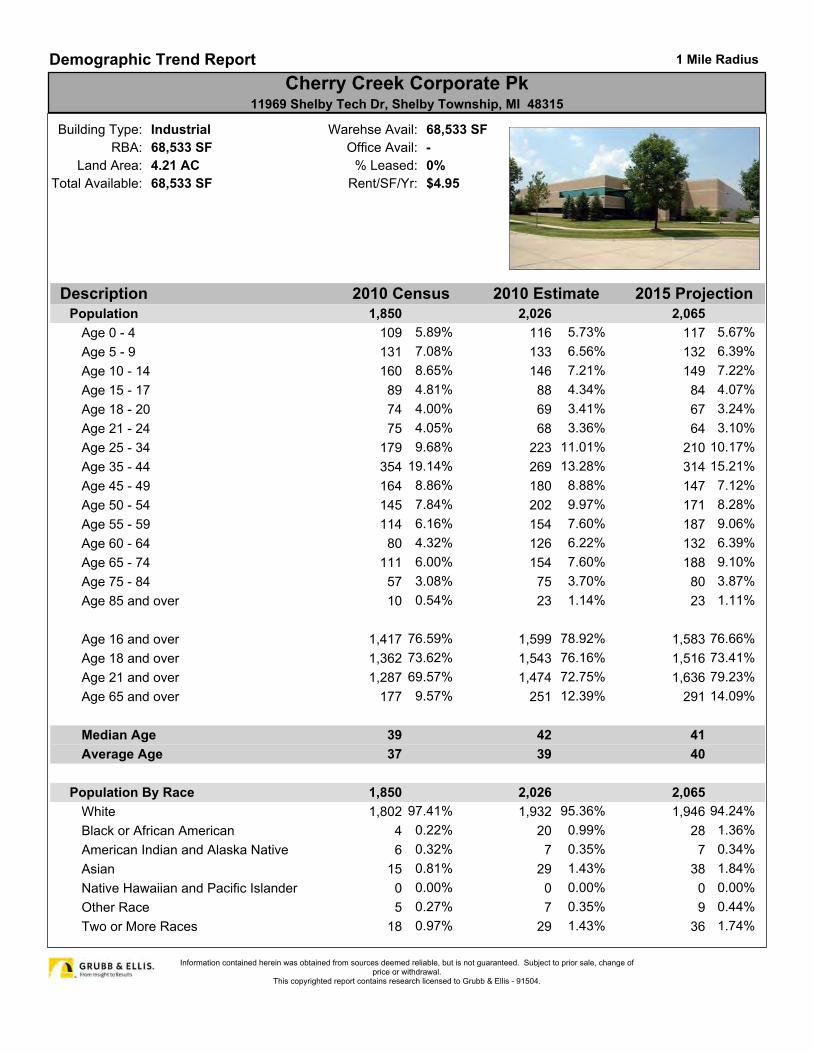
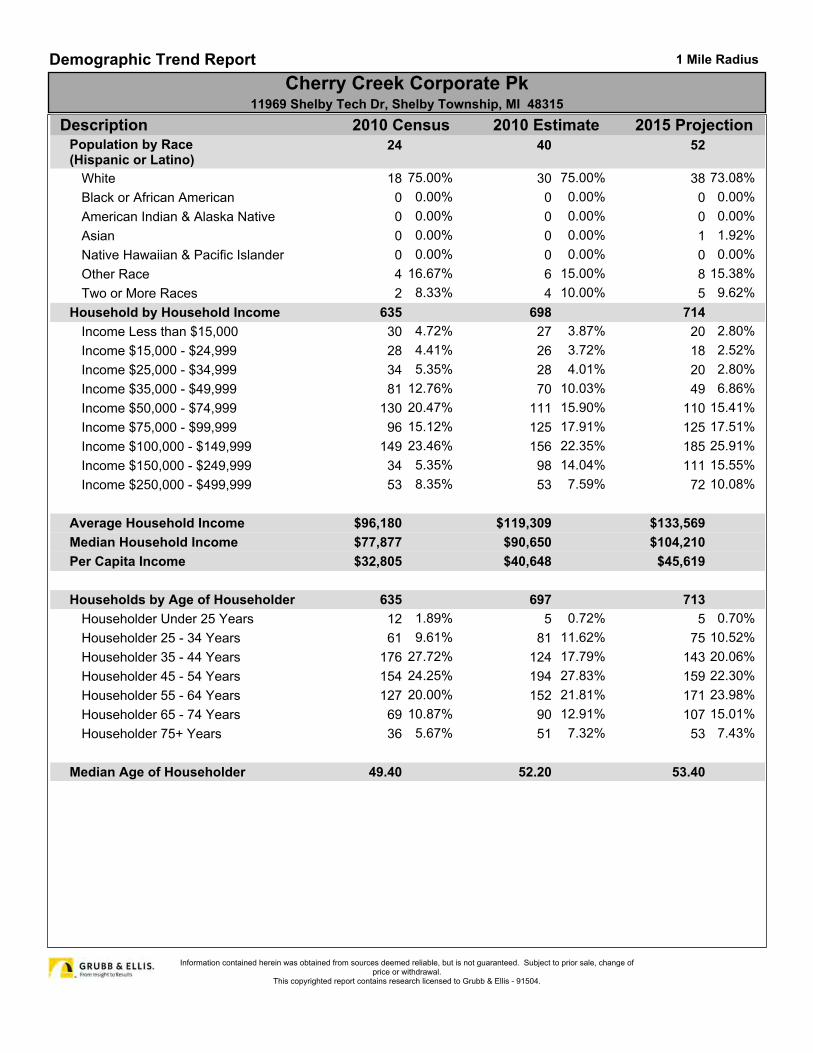
Description 2010 Census 2010 Estimate 2015 ProjectionPopulation 1,850 2,026 2,065
Age 0 - 4 109 5.89% 116 5.73% 117 5.67%Age 5 - 9 131 7.08% 133 6.56% 132 6.39%Age 10 - 14 160 8.65% 146 7.21% 149 7.22%Age 15 - 17 89 4.81% 88 4.34% 84 4.07%Age 18 - 20 74 4.00% 69 3.41% 67 3.24%Age 21 - 24 75 4.05% 68 3.36% 64 3.10%Age 25 - 34 179 9.68% 223 11.01% 210 10.17%Age 35 - 44 354 19.14% 269 13.28% 314 15.21%Age 45 - 49 164 8.86% 180 8.88% 147 7.12%Age 50 - 54 145 7.84% 202 9.97% 171 8.28%Age 55 - 59 114 6.16% 154 7.60% 187 9.06%Age 60 - 64 80 4.32% 126 6.22% 132 6.39%Age 65 - 74 111 6.00% 154 7.60% 188 9.10%Age 75 - 84 57 3.08% 75 3.70% 80 3.87%Age 85 and over 10 0.54% 23 1.14% 23 1.11%
Age 16 and over 1,417 76.59% 1,599 78.92% 1,583 76.66%Age 18 and over 1,362 73.62% 1,543 76.16% 1,516 73.41%Age 21 and over 1,287 69.57% 1,474 72.75% 1,636 79.23%Age 65 and over 177 9.57% 251 12.39% 291 14.09%
Median Age 39 42 41Average Age 37 39 40
Population By Race 1,850 2,026 2,065White 1,802 97.41% 1,932 95.36% 1,946 94.24%Black or African American 4 0.22% 20 0.99% 28 1.36%American Indian and Alaska Native 6 0.32% 7 0.35% 7 0.34%Asian 15 0.81% 29 1.43% 38 1.84%Native Hawaiian and Pacific Islander 0 0.00% 0 0.00% 0 0.00%Other Race 5 0.27% 7 0.35% 9 0.44%Two or More Races 18 0.97% 29 1.43% 36 1.74%
Demographic Trend Report 1 Mile Radius
Cherry Creek Corporate Pk11969 Shelby Tech Dr, Shelby Township, MI 48315
Information contained herein was obtained from sources deemed reliable, but is not guaranteed. Subject to prior sale, change ofprice or withdrawal.
This copyrighted report contains research licensed to Grubb & Ellis - 91504.
Demographic Trend Report 1 Mile Radius
Cherry Creek Corporate Pk11969 Shelby Tech Dr, Shelby Township, MI 48315
Description 2010 Census 2010 Estimate 2015 ProjectionPopulation by Race(Hispanic or Latino)
24 40 52
White 18 75.00% 30 75.00% 38 73.08%Black or African American 0 0.00% 0 0.00% 0 0.00%American Indian & Alaska Native 0 0.00% 0 0.00% 0 0.00%Asian 0 0.00% 0 0.00% 1 1.92%Native Hawaiian & Pacific Islander 0 0.00% 0 0.00% 0 0.00%Other Race 4 16.67% 6 15.00% 8 15.38%Two or More Races 2 8.33% 4 10.00% 5 9.62%
Household by Household Income 635 698 714Income Less than $15,000 30 4.72% 27 3.87% 20 2.80%Income $15,000 - $24,999 28 4.41% 26 3.72% 18 2.52%Income $25,000 - $34,999 34 5.35% 28 4.01% 20 2.80%Income $35,000 - $49,999 81 12.76% 70 10.03% 49 6.86%Income $50,000 - $74,999 130 20.47% 111 15.90% 110 15.41%Income $75,000 - $99,999 96 15.12% 125 17.91% 125 17.51%Income $100,000 - $149,999 149 23.46% 156 22.35% 185 25.91%Income $150,000 - $249,999 34 5.35% 98 14.04% 111 15.55%Income $250,000 - $499,999 53 8.35% 53 7.59% 72 10.08%
Average Household Income $96,180 $119,309 $133,569Median Household Income $77,877 $90,650 $104,210Per Capita Income $32,805 $40,648 $45,619
Households by Age of Householder 635 697 713Householder Under 25 Years 12 1.89% 5 0.72% 5 0.70%Householder 25 - 34 Years 61 9.61% 81 11.62% 75 10.52%Householder 35 - 44 Years 176 27.72% 124 17.79% 143 20.06%Householder 45 - 54 Years 154 24.25% 194 27.83% 159 22.30%Householder 55 - 64 Years 127 20.00% 152 21.81% 171 23.98%Householder 65 - 74 Years 69 10.87% 90 12.91% 107 15.01%Householder 75+ Years 36 5.67% 51 7.32% 53 7.43%
Median Age of Householder 49.40 52.20 53.40
Information contained herein was obtained from sources deemed reliable, but is not guaranteed. Subject to prior sale, change ofprice or withdrawal.
This copyrighted report contains research licensed to Grubb & Ellis - 91504.
26555 Evergreen Road, Suite 500, Southfield, MI 48076 T 248.350.9500 F 248.357.0923 ECONOMIC
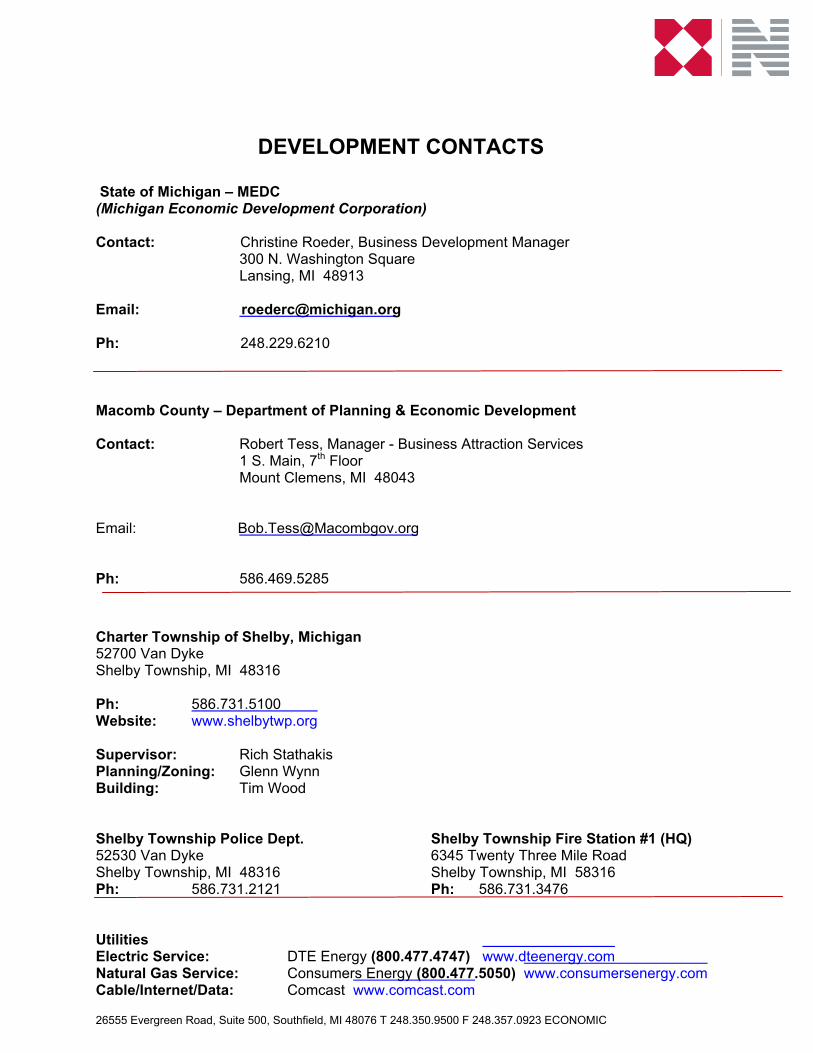
DEVELOPMENT CONTACTS
State of Michigan – MEDC (Michigan Economic Development Corporation) Contact: Christine Roeder, Business Development Manager 300 N. Washington Square Lansing, MI 48913 Email: [email protected] Ph: 248.229.6210 Macomb County – Department of Planning & Economic Development Contact: Robert Tess, Manager - Business Attraction Services 1 S. Main, 7th Floor Mount Clemens, MI 48043 Email: [email protected] Ph: 586.469.5285
Charter Township of Shelby, Michigan 52700 Van Dyke Shelby Township, MI 48316 Ph: 586.731.5100 Website: www.shelbytwp.org Supervisor: Rich Stathakis Planning/Zoning: Glenn Wynn Building: Tim Wood Shelby Township Police Dept. Shelby Township Fire Station #1 (HQ) 52530 Van Dyke 6345 Twenty Three Mile Road Shelby Township, MI 48316 Shelby Township, MI 58316 Ph: 586.731.2121 Ph: 586.731.3476 Utilities Electric Service: DTE Energy (800.477.4747) www.dteenergy.com Natural Gas Service: Consumers Energy (800.477.5050) www.consumersenergy.com Cable/Internet/Data: Comcast www.comcast.com
DETROIT INDUSTRIAL MARKET TRENDS REPORT
4th QUARTER
2012
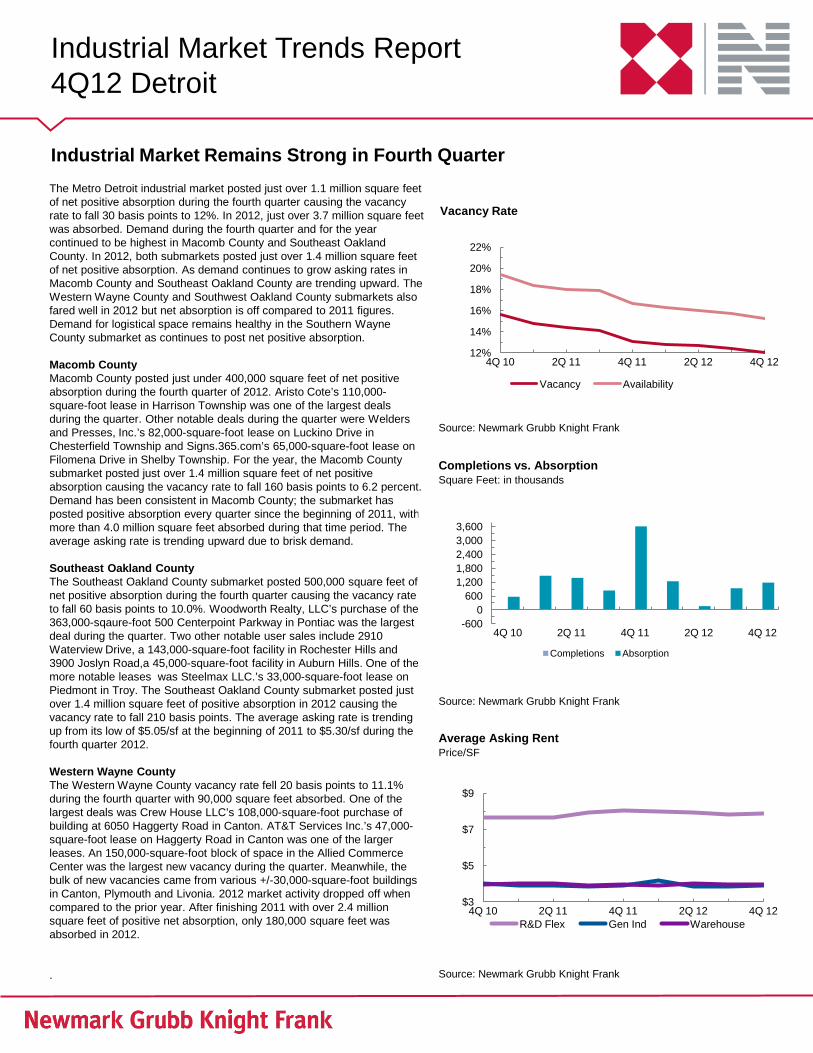
The Metro Detroit industrial market posted just over 1.1 million square feet of net positive absorption during the fourth quarter causing the vacancy rate to fall 30 basis points to 12%. In 2012, just over 3.7 million square feet was absorbed. Demand during the fourth quarter and for the year continued to be highest in Macomb County and Southeast Oakland County. In 2012, both submarkets posted just over 1.4 million square feet of net positive absorption. As demand continues to grow asking rates in Macomb County and Southeast Oakland County are trending upward. The Western Wayne County and Southwest Oakland County submarkets also fared well in 2012 but net absorption is off compared to 2011 figures. Demand for logistical space remains healthy in the Southern Wayne County submarket as continues to post net positive absorption. Macomb County Macomb County posted just under 400,000 square feet of net positive absorption during the fourth quarter of 2012. Aristo Cote’s 110,000-square-foot lease in Harrison Township was one of the largest deals during the quarter. Other notable deals during the quarter were Welders and Presses, Inc.’s 82,000-square-foot lease on Luckino Drive in Chesterfield Township and Signs.365.com’s 65,000-square-foot lease on Filomena Drive in Shelby Township. For the year, the Macomb County submarket posted just over 1.4 million square feet of net positive absorption causing the vacancy rate to fall 160 basis points to 6.2 percent. Demand has been consistent in Macomb County; the submarket has posted positive absorption every quarter since the beginning of 2011, with more than 4.0 million square feet absorbed during that time period. The average asking rate is trending upward due to brisk demand. Southeast Oakland County The Southeast Oakland County submarket posted 500,000 square feet of net positive absorption during the fourth quarter causing the vacancy rate to fall 60 basis points to 10.0%. Woodworth Realty, LLC’s purchase of the 363,000-sqaure-foot 500 Centerpoint Parkway in Pontiac was the largest deal during the quarter. Two other notable user sales include 2910 Waterview Drive, a 143,000-square-foot facility in Rochester Hills and 3900 Joslyn Road,a 45,000-square-foot facility in Auburn Hills. One of the more notable leases was Steelmax LLC.’s 33,000-square-foot lease on Piedmont in Troy. The Southeast Oakland County submarket posted just over 1.4 million square feet of positive absorption in 2012 causing the vacancy rate to fall 210 basis points. The average asking rate is trending up from its low of $5.05/sf at the beginning of 2011 to $5.30/sf during the fourth quarter 2012. Western Wayne County The Western Wayne County vacancy rate fell 20 basis points to 11.1% during the fourth quarter with 90,000 square feet absorbed. One of the largest deals was Crew House LLC’s 108,000-square-foot purchase of building at 6050 Haggerty Road in Canton. AT&T Services Inc.’s 47,000-square-foot lease on Haggerty Road in Canton was one of the larger leases. An 150,000-square-foot block of space in the Allied Commerce Center was the largest new vacancy during the quarter. Meanwhile, the bulk of new vacancies came from various +/-30,000-square-foot buildings in Canton, Plymouth and Livonia. 2012 market activity dropped off when compared to the prior year. After finishing 2011 with over 2.4 million square feet of positive net absorption, only 180,000 square feet was absorbed in 2012. .
Industrial Market Trends Report 4Q12 Detroit
Industrial Market Remains Strong in Fourth Quarter
Vacancy Rate
Source: Newmark Grubb Knight Frank
Completions vs. Absorption Square Feet: in thousands
Source: Newmark Grubb Knight Frank
Average Asking Rent Price/SF
Source: Newmark Grubb Knight Frank
12%
14%
16%
18%
20%
22%
4Q 10 2Q 11 4Q 11 2Q 12 4Q 12
Vacancy Availability
$3
$5
$7
$9
4Q 10 2Q 11 4Q 11 2Q 12 4Q 12 R&D Flex Gen Ind Warehouse
-600 0
600 1,200 1,800 2,400 3,000 3,600
4Q 10 2Q 11 4Q 11 2Q 12 4Q 12
Completions Absorption
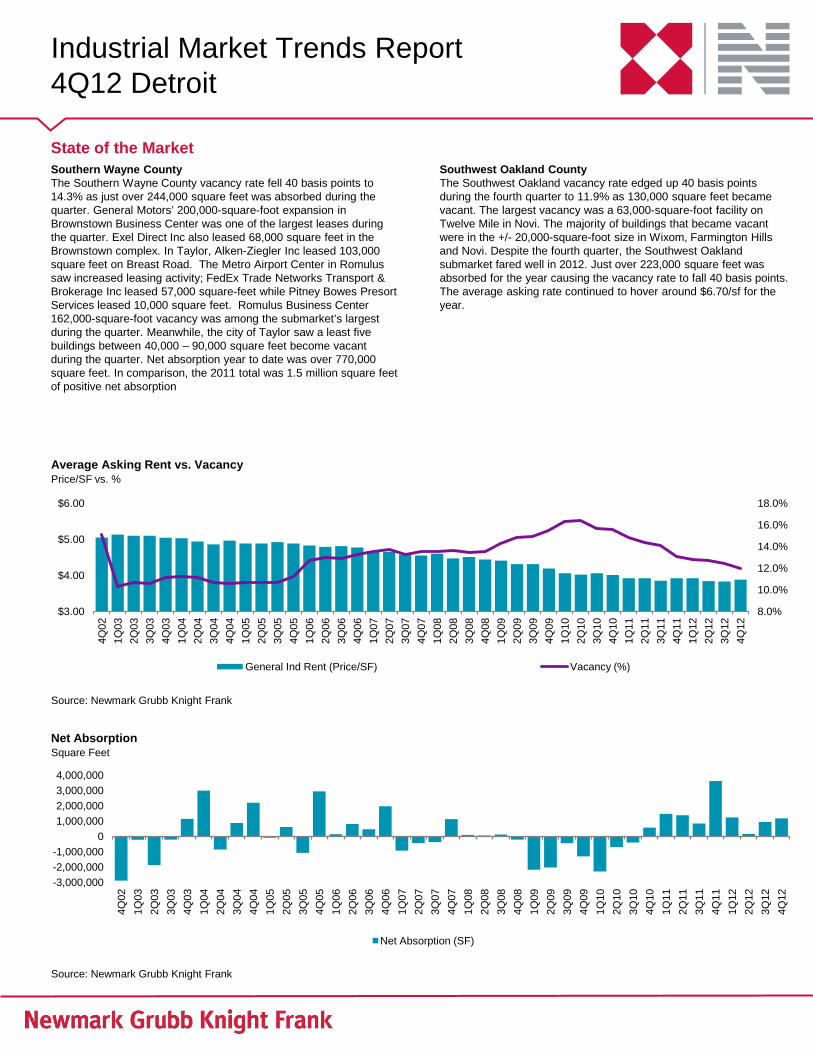
Southern Wayne County The Southern Wayne County vacancy rate fell 40 basis points to 14.3% as just over 244,000 square feet was absorbed during the quarter. General Motors’ 200,000-square-foot expansion in Brownstown Business Center was one of the largest leases during the quarter. Exel Direct Inc also leased 68,000 square feet in the Brownstown complex. In Taylor, Alken-Ziegler Inc leased 103,000 square feet on Breast Road. The Metro Airport Center in Romulus saw increased leasing activity; FedEx Trade Networks Transport & Brokerage Inc leased 57,000 square-feet while Pitney Bowes Presort Services leased 10,000 square feet. Romulus Business Center 162,000-square-foot vacancy was among the submarket’s largest during the quarter. Meanwhile, the city of Taylor saw a least five buildings between 40,000 – 90,000 square feet become vacant during the quarter. Net absorption year to date was over 770,000 square feet. In comparison, the 2011 total was 1.5 million square feet of positive net absorption
Southwest Oakland County The Southwest Oakland vacancy rate edged up 40 basis points during the fourth quarter to 11.9% as 130,000 square feet became vacant. The largest vacancy was a 63,000-square-foot facility on Twelve Mile in Novi. The majority of buildings that became vacant were in the +/- 20,000-square-foot size in Wixom, Farmington Hills and Novi. Despite the fourth quarter, the Southwest Oakland submarket fared well in 2012. Just over 223,000 square feet was absorbed for the year causing the vacancy rate to fall 40 basis points. The average asking rate continued to hover around $6.70/sf for the year.
Industrial Market Trends Report 4Q12 Detroit
State of the Market
-3,000,000 -2,000,000 -1,000,000
0 1,000,000 2,000,000 3,000,000 4,000,000
4Q02
1Q03
2Q03
3Q03
4Q03
1Q04
2Q04
3Q04
4Q04
1Q05
2Q05
3Q05
4Q05
1Q06
2Q06
3Q06
4Q06
1Q07
2Q07
3Q07
4Q07
1Q08
2Q08
3Q08
4Q08
1Q09
2Q09
3Q09
4Q09
1Q10
2Q10
3Q10
4Q10
1Q11
2Q11
3Q11
4Q11
1Q12
2Q12
3Q12
4Q12
Net Absorption (SF)
8.0%
10.0%
12.0%
14.0%
16.0%
18.0%
$3.00
$4.00
$5.00
$6.00
4Q02
1Q03
2Q03
3Q03
4Q03
1Q04
2Q04
3Q04
4Q04
1Q05
2Q05
3Q05
4Q05
1Q06
2Q06
3Q06
4Q06
1Q07
2Q07
3Q07
4Q07
1Q08
2Q08
3Q08
4Q08
1Q09
2Q09
3Q09
4Q09
1Q10
2Q10
3Q10
4Q10
1Q11
2Q11
3Q11
4Q11
1Q12
2Q12
3Q12
4Q12
General Ind Rent (Price/SF) Vacancy (%)
Average Asking Rent vs. Vacancy Price/SF vs. %
Source: Newmark Grubb Knight Frank
Net Absorption Square Feet
Source: Newmark Grubb Knight Frank
Industrial Market Trends Report 4Q12 Detroit
Year To Date
(32,143)
(281,964)
9,771
1,424,541
1,411,821
773,097
223,153
180,762
3,709,038
11.4%6.7%
13.4%12.5%
12.0%
NET ABSORPTION Under ASKING RENTBy Submarket Total SF Vacant SF Vacancy % Available % Current
QtrConstruction
SF WH/Dist R&D/Flex
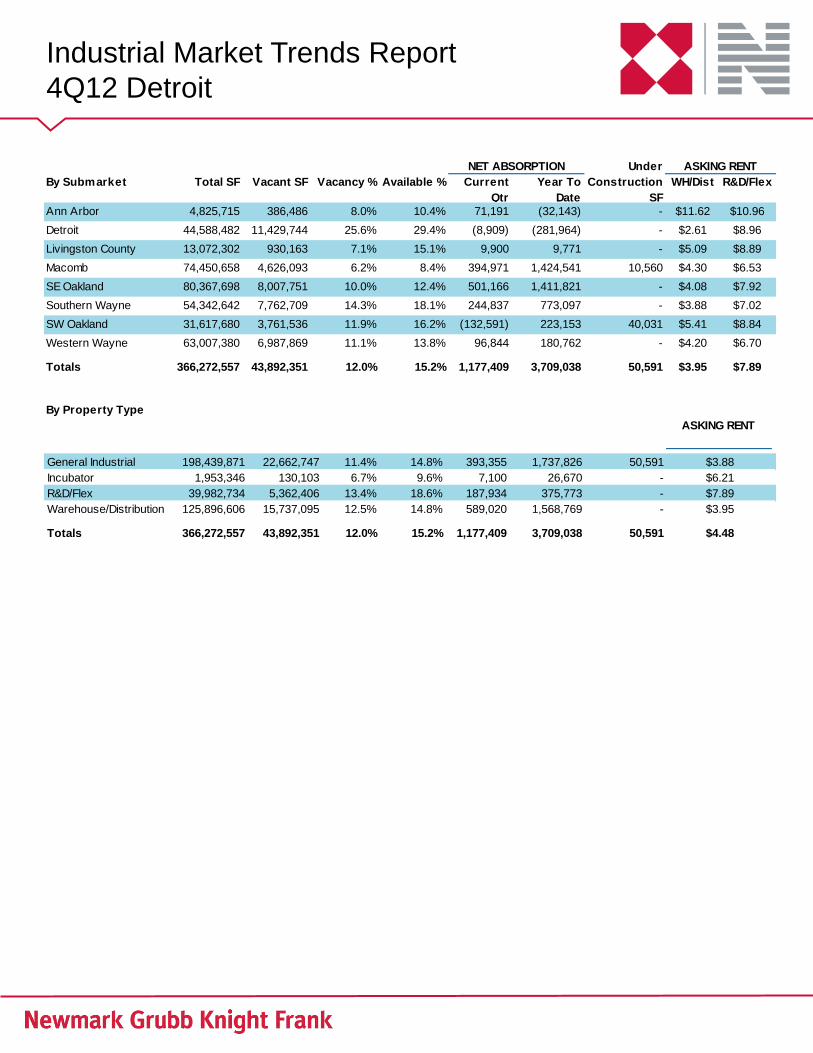
Ann Arbor 4,825,715 386,486 8.0% 10.4% 71,191 - $11.62 $10.96
Detroit 44,588,482 11,429,744 25.6% 29.4% (8,909) - $2.61 $8.96
Livingston County 13,072,302 930,163 7.1% 15.1% 9,900 - $5.09 $8.89
Macomb 74,450,658 4,626,093 6.2% 8.4% 394,971 10,560 $4.30 $6.53
SE Oakland 80,367,698 8,007,751 10.0% 12.4% 501,166 - $4.08 $7.92
Southern Wayne 54,342,642 7,762,709 14.3% 18.1% 244,837 - $3.88 $7.02
SW Oakland 31,617,680 3,761,536 11.9% 16.2% (132,591) 40,031 $5.41 $8.84
Western Wayne 63,007,380 6,987,869 11.1% 13.8% 96,844 - $4.20 $6.70
Totals 366,272,557 43,892,351 12.0% 15.2% 1,177,409 50,591 $3.95 $7.89
By Property TypeASKING RENT
General Industrial 198,439,871 22,662,747 14.8% 393,355 1,737,826 50,591 $3.88Incubator 1,953,346 130,103 9.6% 7,100 26,670 - $6.21R&D/Flex 39,982,734 5,362,406 18.6% 187,934 375,773 - $7.89Warehouse/Distribution 125,896,606 15,737,095 14.8% 589,020 1,568,769 - $3.95
50,591 $4.48Totals 366,272,557 43,892,351 15.2% 1,177,409 3,709,038
Newmark Grubb Knight Frank Research Reports are also available at www.newmarkkf.com/research.
By using any report or information provided by Newmark Grubb Knight Frank (“Newmark”), the recipient hereby acknowledges and agrees that: (a) Newmark makes no express or implied representations or warranties with respect to the information and guarantees no particular outcome or result; (b) Newmark does not provide legal advice and does not represent or guarantee that any particular course of conduct, strategy, or action suggested by it conforms to any applicable law or regulation; (c) While Newmark has used its commercially diligent efforts to verify any underlying assumptions used in the report, some assumptions may not transpire and unforeseen events and circumstances may arise which may affect any such projections; (d) Although all information furnished in the report are from sources Newmark deems as reliable, such information has not been verified and no express representation is made nor is any to be implied as to the accuracy thereof and it is submitted subject to errors, omissions, change of price, rental or other conditions; (e) All proprietary information, which may include ideas, concepts, frameworks, know-how, methodologies, analytical approaches, databases, business insights, products, software, and descriptions thereof developed by Newmark shall be the property of Newmark; the ownership of the report does not include any rights of electronic data processing files, programs or models completed for research, unless specifically agreed to in writing by Newmark; (f) Such report shall be used for the sole purpose for which it is prepared and no other parties shall be deemed third party beneficiaries of such report; and (g) Any report may not be published, resold, distributed or communicated to the public without the prior written consent of Newmark. ™ Newmark and Knight Frank are trademarks of their respective owners.
John DeGroot Vice President, Research 248.357.6588 [email protected]
Newmark Grubb Knight Frank 26555 Evergreen Road Suite 500 Southfield, MI 48076 248.350.9500
Africa
Botswana
Kenya
Malawi
Nigeria
South Africa
Tanzania
Uganda
Zambia
Zimbabwe
Middle East
Bahrain
United Arab Emirates
Qatar
Asia-Pacific
Australia
Cambodia
China
Hong Kong
India
Indonesia
Malaysia
New Zealand
Singapore
South Korea
Thailand
Vietnam
North America
Canada
Mexico
United States
Europe
Austria
Belgium
Czech Republic
France
Germany
Ireland
Italy
Netherlands
Poland
Portugal
Romania
Russia
Spain
Switzerland
Ukraine
United Kingdom
July 2006 Page 7
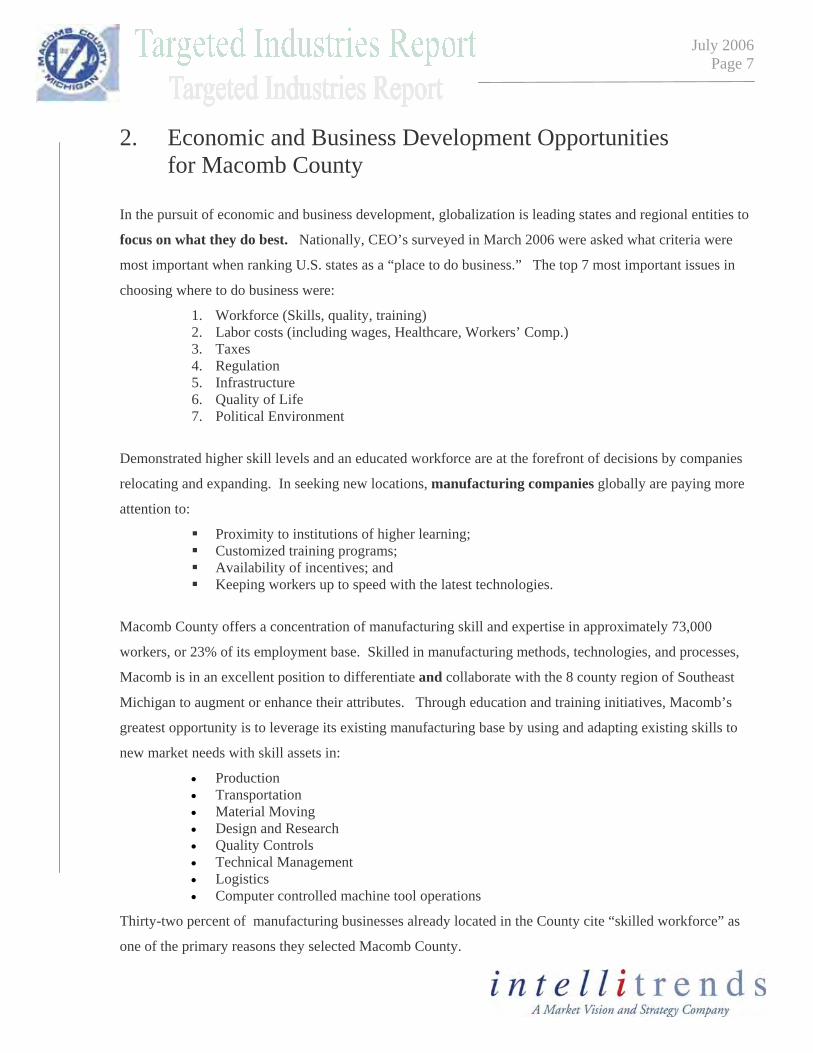
2. Economic and Business Development Opportunities for Macomb County In the pursuit of economic and business development, globalization is leading states and regional entities to
focus on what they do best. Nationally, CEO’s surveyed in March 2006 were asked what criteria were
most important when ranking U.S. states as a “place to do business.” The top 7 most important issues in
choosing where to do business were:
1. Workforce (Skills, quality, training) 2. Labor costs (including wages, Healthcare, Workers’ Comp.) 3. Taxes 4. Regulation 5. Infrastructure 6. Quality of Life 7. Political Environment
Demonstrated higher skill levels and an educated workforce are at the forefront of decisions by companies
relocating and expanding. In seeking new locations, manufacturing companies globally are paying more
attention to:
Proximity to institutions of higher learning; Customized training programs; Availability of incentives; and Keeping workers up to speed with the latest technologies.
Macomb County offers a concentration of manufacturing skill and expertise in approximately 73,000
workers, or 23% of its employment base. Skilled in manufacturing methods, technologies, and processes,
Macomb is in an excellent position to differentiate and collaborate with the 8 county region of Southeast
Michigan to augment or enhance their attributes. Through education and training initiatives, Macomb’s
greatest opportunity is to leverage its existing manufacturing base by using and adapting existing skills to
new market needs with skill assets in:
Production • • • • • • • •
Transportation Material Moving Design and Research Quality Controls Technical Management Logistics Computer controlled machine tool operations
Thirty-two percent of manufacturing businesses already located in the County cite “skilled workforce” as
one of the primary reasons they selected Macomb County.
8/15/2006
July 2006 Page 8
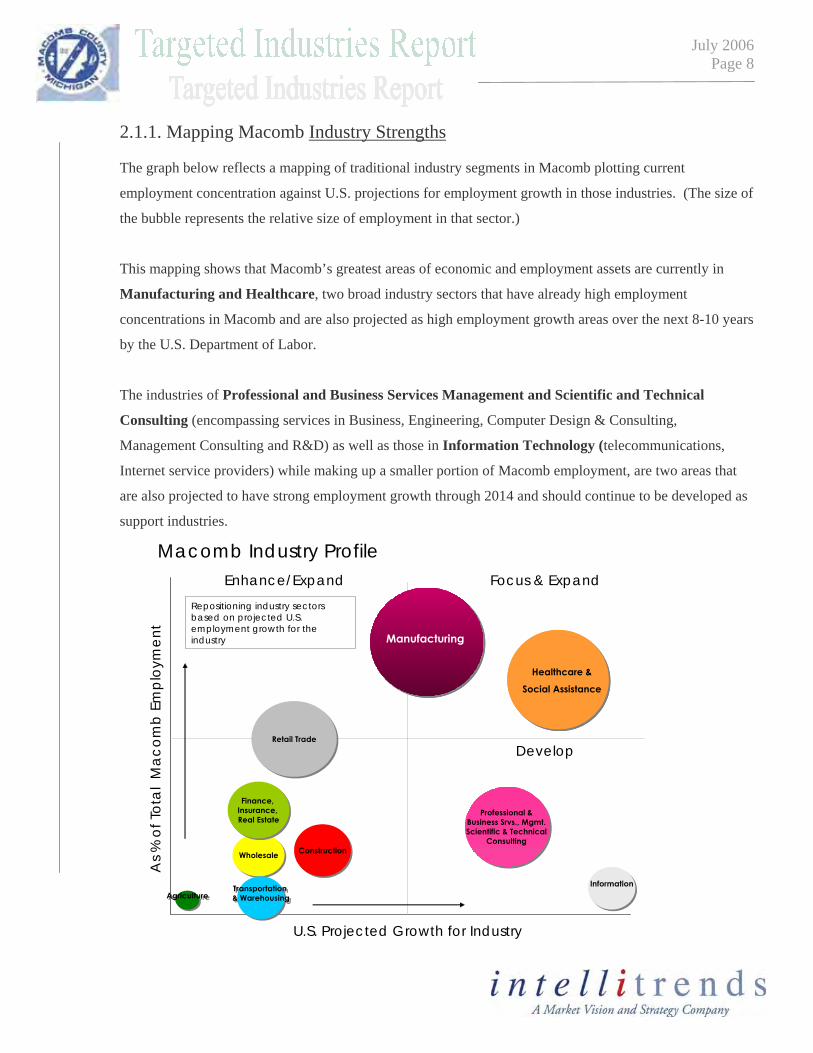
2.1.1. Mapping Macomb Industry Strengths The graph below reflects a mapping of traditional industry segments in Macomb plotting current
employment concentration against U.S. projections for employment growth in those industries. (The size of
the bubble represents the relative size of employment in that sector.)
This mapping shows that Macomb’s greatest areas of economic and employment assets are currently in
Manufacturing and Healthcare, two broad industry sectors that have already high employment
concentrations in Macomb and are also projected as high employment growth areas over the next 8-10 years
by the U.S. Department of Labor.
The industries of Professional and Business Services Management and Scientific and Technical
Consulting (encompassing services in Business, Engineering, Computer Design & Consulting,
Management Consulting and R&D) as well as those in Information Technology (telecommunications,
Internet service providers) while making up a smaller portion of Macomb employment, are two areas that
are also projected to have strong employment growth through 2014 and should continue to be developed as
support industries.
ConstructionConstruction
InformationInformation
U.S. Projected Growth for Industry
As %
of T
otal
Mac
omb
Em
ploy
men
t
Enhance/Expand Focus & Expand
Low Develop
ManufacturingManufacturing
Healthcare &
Social Assistance
Healthcare &
Social Assistance
WholesaleWholesale
Retail TradeRetail Trade
Finance, Insurance, Real Estate
Finance, Insurance, Real Estate
Transportation & WarehousingTransportation & Warehousing
Professional & Business Srvs., Mgmt. Scientific & Technical
Consulting
Professional & Business Srvs., Mgmt. Scientific & Technical
Consulting
Macomb Industry Profile
AgricultureAgriculture
Repositioning industry sectors based on projected U.S. employment growth for the industry
8/15/2006
July 2006 Page 9
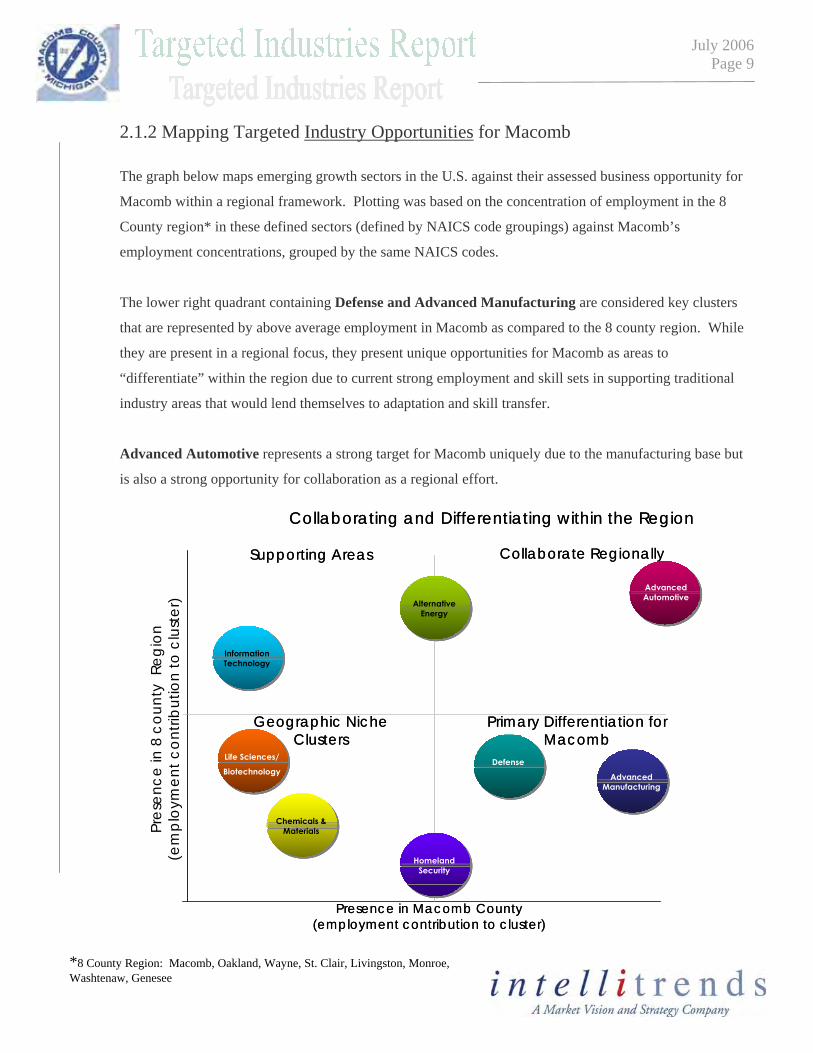
2.1.2 Mapping Targeted Industry Opportunities for Macomb
The graph below maps emerging growth sectors in the U.S. against their assessed business opportunity for
Macomb within a regional framework. Plotting was based on the concentration of employment in the 8
County region* in these defined sectors (defined by NAICS code groupings) against Macomb’s
employment concentrations, grouped by the same NAICS codes.
The lower right quadrant containing Defense and Advanced Manufacturing are considered key clusters
that are represented by above average employment in Macomb as compared to the 8 county region. While
they are present in a regional focus, they present unique opportunities for Macomb as areas to
“differentiate” within the region due to current strong employment and skill sets in supporting traditional
industry areas that would lend themselves to adaptation and skill transfer.
Advanced Automotive represents a strong target for Macomb uniquely due to the manufacturing base but
is also a strong opportunity for collaboration as a regional effort.
Pres
ence
in 8
cou
nty
Reg
ion
(em
ploy
men
t con
tribu
tion
to c
lust
er)
Supporting Areas Collaborate Regionally
Geographic Niche Clusters
Primary Differentiation for Macomb
Presence in Macomb County (employment contribution to cluster)
Advanced Automotive
Advanced Manufacturing
Life Sciences/
Biotechnology
Chemicals & Materials
Homeland Security
Information Technology
Alternative Energy
Defense
Collaborating and Differentiating within the Region
Pres
ence
in 8
cou
nty
Reg
ion
(em
ploy
men
t con
tribu
tion
to c
lust
er)
Supporting Areas Collaborate Regionally
Geographic Niche Clusters
Primary Differentiation for Macomb
Presence in Macomb County (employment contribution to cluster)
Advanced AutomotiveAdvanced Automotive
Advanced Manufacturing
Advanced Manufacturing
Life Sciences/
Biotechnology
Life Sciences/
Biotechnology
Chemicals & Materials
Chemicals & Materials
Homeland Security
Homeland Security
Information Technology Information Technology
Alternative Energy
Alternative Energy
DefenseDefense
Collaborating and Differentiating within the Region
8/15/2006
*8 County Region: Macomb, Oakland, Wayne, St. Clair, Livingston, Monroe, Washtenaw, Genesee
July 2006 Page 10
Clusters in the lower left quadrant (Life sciences/Bio-technology, Chemical & Materials) do not represent
primary areas of strength for Macomb based on employment in those clusters. They tend to be more
geographically concentrated in other areas of the 8 county region and particularly for Life sciences/Bio-
technology, have workforce requirements that are not primary assets in the Macomb employee base.
Likewise, Information Technology while a strength for the region as a whole is not considered a unique
strength for Macomb due to limited presence of these types of companies. However, they can be targeted
as a “supporting sector” in that the opportunity is for sub-set development under one of the 3 primary
targets.
Two emerging sectors, with high projected growth, yet unknown “quantifiable” presence in the region are
Alternative Energy and Homeland Security. Due to their direct link with both Advanced Automotive and
Defense respectively, they represent emerging sectors for further focus.
8/15/2006
July 2006 Page 11
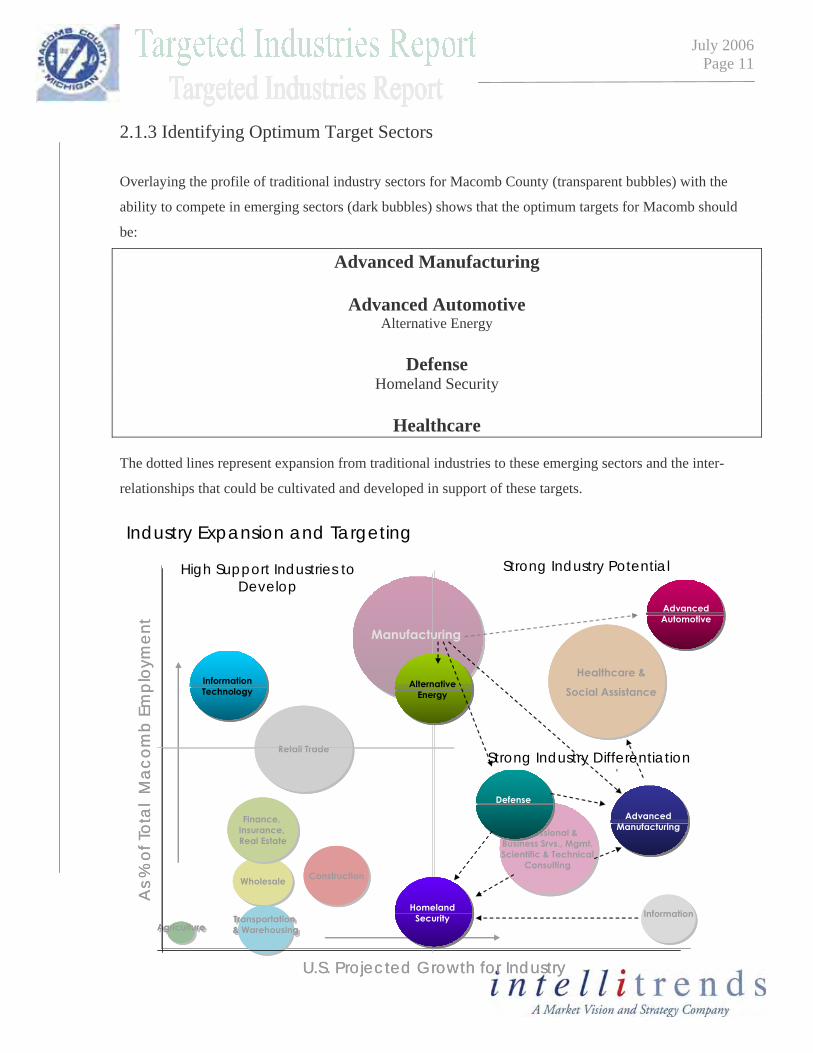
2.1.3 Identifying Optimum Target Sectors Overlaying the profile of traditional industry sectors for Macomb County (transparent bubbles) with the
ability to compete in emerging sectors (dark bubbles) shows that the optimum targets for Macomb should
be:
Advanced Manufacturing
Advanced Automotive Alternative Energy
Defense
Homeland Security
Healthcare The dotted lines represent expansion from traditional industries to these emerging sectors and the inter-
relationships that could be cultivated and developed in support of these targets.
8/15/2006
ConstructionConstruction
InformationInformation
U.S. Projected Growth for Industry
As %
of T
otal
Mac
omb
Empl
oym
ent
Enhance/Expand Leverage
Low Develop
Manufacturing
Healthcare &
Social Assistance
WholesaleWholesale
Retail TradeRetail Trade
Finance, Insurance, Real Estate
Finance, Insurance, Real Estate
Transportation & WarehousingTransportation & Warehousing
Professional & Business Srvs., Mgmt. Scientific & Technical
Consulting
Professional & Business Srvs., Mgmt. Scientific & Technical
Consulting
Macomb Industry Profile
AgricultureAgriculture
ConstructionConstruction
InformationInformation
U.S. Projected Growth for Industry
As %
of T
otal
Mac
omb
Empl
oym
ent
Enhance/Expand Leverage
Low Develop
ManufacturingManufacturing
Healthcare &
Social Assistance
Healthcare &
Social Assistance
WholesaleWholesale
Retail TradeRetail Trade
Finance, Insurance, Real Estate
Finance, Insurance, Real Estate
Transportation & WarehousingTransportation & Warehousing
Professional & Business Srvs., Mgmt. Scientific & Technical
Consulting
Professional & Business Srvs., Mgmt. Scientific & Technical
Consulting
Macomb Industry Profile
AgricultureAgriculture
High Support Industries to Develop
Strong Industry Potential
Strong Industry Differentiation
Advanced AutomotiveAdvanced Automotive
Advanced Manufacturing
Advanced Manufacturing
Homeland Security
Homeland Security
Information Technology Information Technology
Alternative Energy
Alternative Energy
DefenseDefense
Industry Expansion and Targeting
Newmark Grubb Knight FrankTenant & Landlord Representation � Global Corporate Services � Investment Sales & Capital Markets � Property Management � Facilities Management � Appraisal � Project Management � ����� � Industrial � Retail � Multi-family � Hospitality
TWO GREAT BRANDS. ONE REAL ESTATE POWERHOUSE.
are coming together to create a game-changing platform in commercial real estate – Newmark Grubb Knight Frank.
��������� �������� ���� ��������� ����� �� ���� ������� ������������������������ �� ��������� ����������� ��� ���������� �������������� !"��������#���$�� ��������� ����% ����� ��#�'�(�)� �� ���������� �������������������� ��������� ��� ��������!���� ��������� �#��� �����*���������� ����������������������������+��������������!�,��������������� ���� ����������������� ����� ��������%
+
Newmark Grubb Knight Frank 26555 Evergreen, Suite 500 Southfield, MI 48076 248.350.9500 248.357.0923 fax
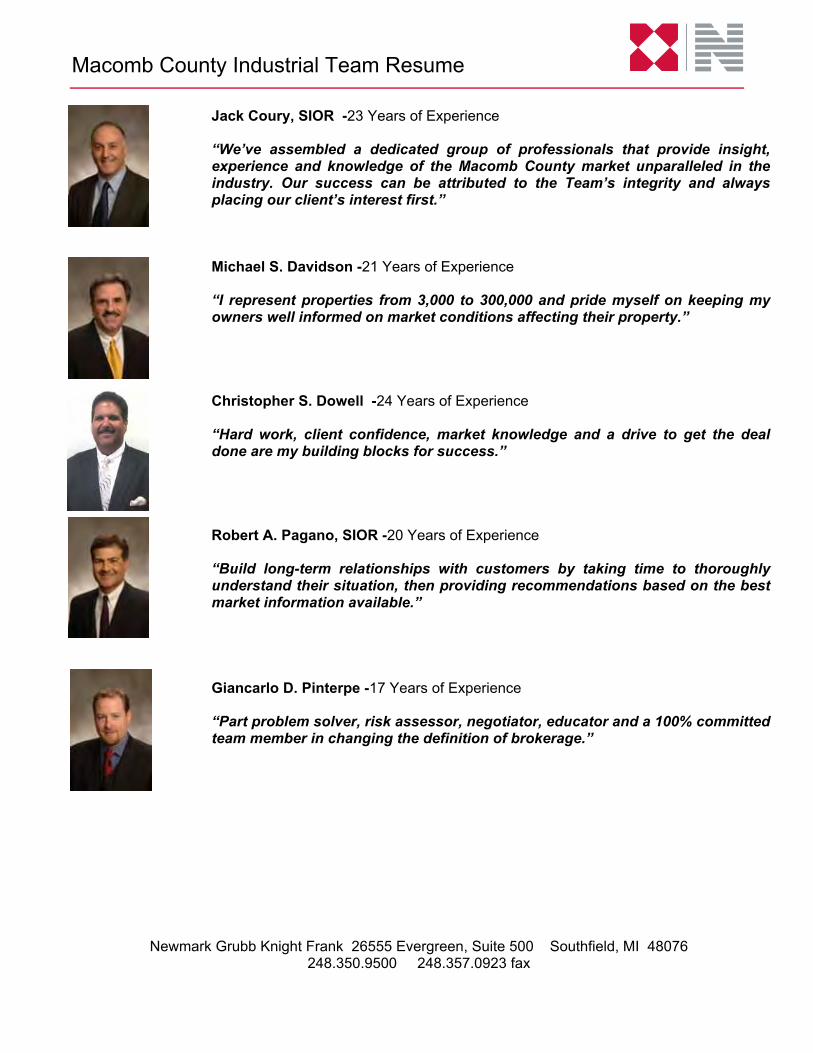
Jack Coury, SIOR -23 Years of Experience
“We’ve assembled a dedicated group of professionals that provide insight, experience and knowledge of the Macomb County market unparalleled in the industry. Our success can be attributed to the Team’s integrity and always placing our client’s interest first.”
Michael S. Davidson -21 Years of Experience
“I represent properties from 3,000 to 300,000 and pride myself on keeping my owners well informed on market conditions affecting their property.”
Christopher S. Dowell -24 Years of Experience
“Hard work, client confidence, market knowledge and a drive to get the deal done are my building blocks for success.”
Robert A. Pagano, SIOR -20 Years of Experience
“Build long-term relationships with customers by taking time to thoroughly understand their situation, then providing recommendations based on the best market information available.”
Giancarlo D. Pinterpe -17 Years of Experience
“Part problem solver, risk assessor, negotiator, educator and a 100% committed team member in changing the definition of brokerage.”
Macomb County Industrial Team Resume
Address City Square Feet Date Buyer/Tenant TermsAcres
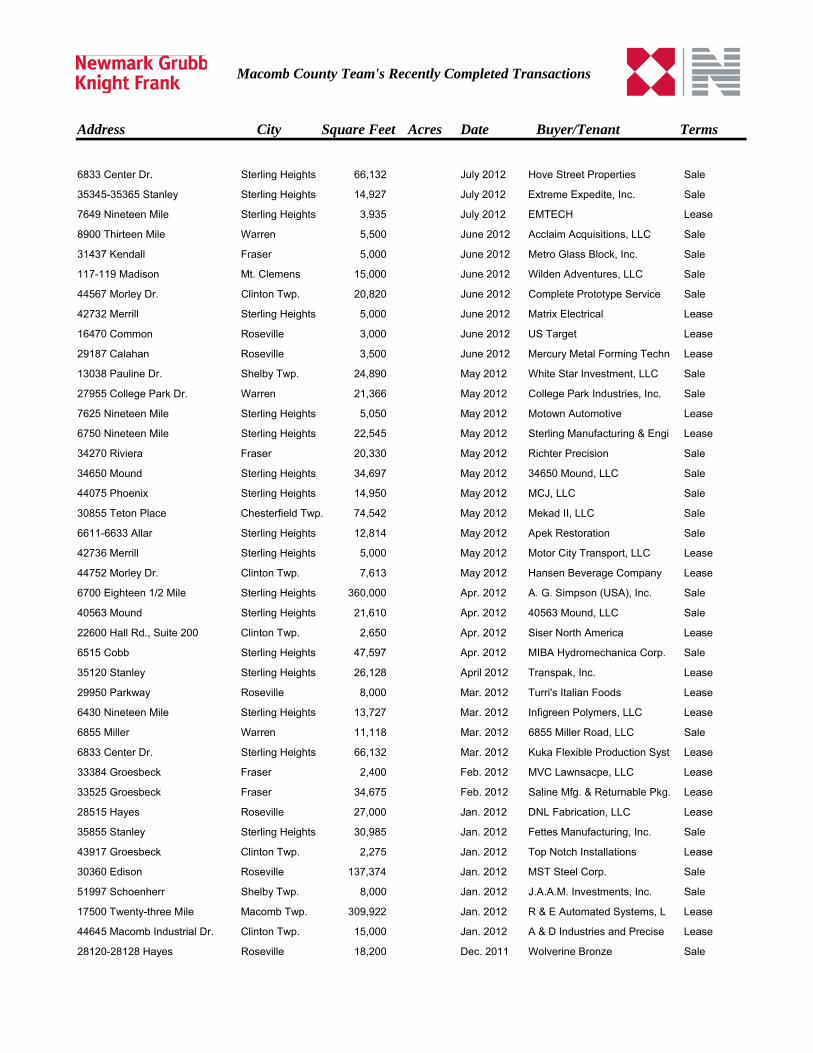
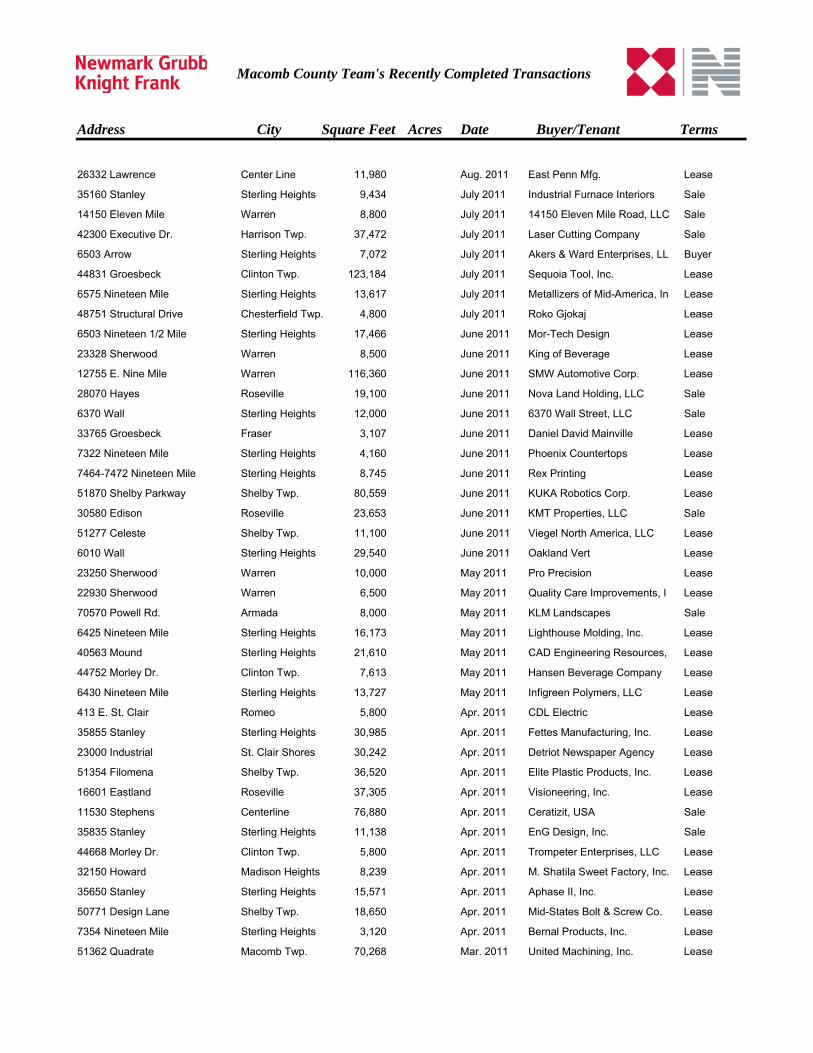
Macomb County Team's Recently Completed Transactions
6833 Center Dr. Sterling Heights 66,132 July 2012 Hove Street Properties Sale
35345-35365 Stanley Sterling Heights 14,927 July 2012 Extreme Expedite, Inc. Sale
7649 Nineteen Mile Sterling Heights 3,935 July 2012 EMTECH Lease
8900 Thirteen Mile Warren 5,500 June 2012 Acclaim Acquisitions, LLC Sale
31437 Kendall Fraser 5,000 June 2012 Metro Glass Block, Inc. Sale
117-119 Madison Mt. Clemens 15,000 June 2012 Wilden Adventures, LLC Sale
44567 Morley Dr. Clinton Twp. 20,820 June 2012 Complete Prototype Service Sale
42732 Merrill Sterling Heights 5,000 June 2012 Matrix Electrical Lease
16470 Common Roseville 3,000 June 2012 US Target Lease
29187 Calahan Roseville 3,500 June 2012 Mercury Metal Forming Techn Lease
13038 Pauline Dr. Shelby Twp. 24,890 May 2012 White Star Investment, LLC Sale
27955 College Park Dr. Warren 21,366 May 2012 College Park Industries, Inc. Sale
7625 Nineteen Mile Sterling Heights 5,050 May 2012 Motown Automotive Lease
6750 Nineteen Mile Sterling Heights 22,545 May 2012 Sterling Manufacturing & Engi Lease
34270 Riviera Fraser 20,330 May 2012 Richter Precision Sale
34650 Mound Sterling Heights 34,697 May 2012 34650 Mound, LLC Sale
44075 Phoenix Sterling Heights 14,950 May 2012 MCJ, LLC Sale
30855 Teton Place Chesterfield Twp. 74,542 May 2012 Mekad II, LLC Sale
6611-6633 Allar Sterling Heights 12,814 May 2012 Apek Restoration Sale
42736 Merrill Sterling Heights 5,000 May 2012 Motor City Transport, LLC Lease
44752 Morley Dr. Clinton Twp. 7,613 May 2012 Hansen Beverage Company Lease
6700 Eighteen 1/2 Mile Sterling Heights 360,000 Apr. 2012 A. G. Simpson (USA), Inc. Sale
40563 Mound Sterling Heights 21,610 Apr. 2012 40563 Mound, LLC Sale
22600 Hall Rd., Suite 200 Clinton Twp. 2,650 Apr. 2012 Siser North America Lease
6515 Cobb Sterling Heights 47,597 Apr. 2012 MIBA Hydromechanica Corp. Sale
35120 Stanley Sterling Heights 26,128 April 2012 Transpak, Inc. Lease
29950 Parkway Roseville 8,000 Mar. 2012 Turri's Italian Foods Lease
6430 Nineteen Mile Sterling Heights 13,727 Mar. 2012 Infigreen Polymers, LLC Lease
6855 Miller Warren 11,118 Mar. 2012 6855 Miller Road, LLC Sale
6833 Center Dr. Sterling Heights 66,132 Mar. 2012 Kuka Flexible Production Syst Lease
33384 Groesbeck Fraser 2,400 Feb. 2012 MVC Lawnsacpe, LLC Lease
33525 Groesbeck Fraser 34,675 Feb. 2012 Saline Mfg. & Returnable Pkg. Lease
28515 Hayes Roseville 27,000 Jan. 2012 DNL Fabrication, LLC Lease
35855 Stanley Sterling Heights 30,985 Jan. 2012 Fettes Manufacturing, Inc. Sale
43917 Groesbeck Clinton Twp. 2,275 Jan. 2012 Top Notch Installations Lease
30360 Edison Roseville 137,374 Jan. 2012 MST Steel Corp. Sale
51997 Schoenherr Shelby Twp. 8,000 Jan. 2012 J.A.A.M. Investments, Inc. Sale
17500 Twenty-three Mile Macomb Twp. 309,922 Jan. 2012 R & E Automated Systems, L Lease
44645 Macomb Industrial Dr. Clinton Twp. 15,000 Jan. 2012 A & D Industries and Precise Lease
28120-28128 Hayes Roseville 18,200 Dec. 2011 Wolverine Bronze Sale
Address City Square Feet Date Buyer/Tenant TermsAcres
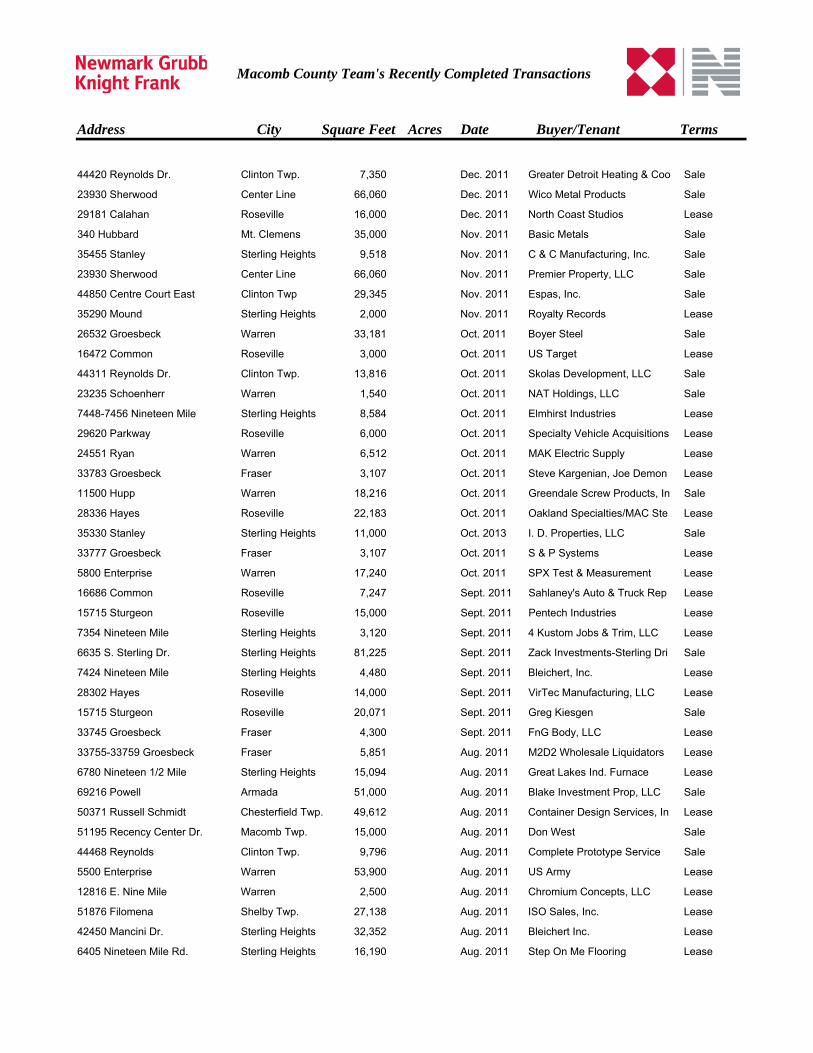
Macomb County Team's Recently Completed Transactions
44420 Reynolds Dr. Clinton Twp. 7,350 Dec. 2011 Greater Detroit Heating & Coo Sale
23930 Sherwood Center Line 66,060 Dec. 2011 Wico Metal Products Sale
29181 Calahan Roseville 16,000 Dec. 2011 North Coast Studios Lease
340 Hubbard Mt. Clemens 35,000 Nov. 2011 Basic Metals Sale
35455 Stanley Sterling Heights 9,518 Nov. 2011 C & C Manufacturing, Inc. Sale
23930 Sherwood Center Line 66,060 Nov. 2011 Premier Property, LLC Sale
44850 Centre Court East Clinton Twp 29,345 Nov. 2011 Espas, Inc. Sale
35290 Mound Sterling Heights 2,000 Nov. 2011 Royalty Records Lease
26532 Groesbeck Warren 33,181 Oct. 2011 Boyer Steel Sale
16472 Common Roseville 3,000 Oct. 2011 US Target Lease
44311 Reynolds Dr. Clinton Twp. 13,816 Oct. 2011 Skolas Development, LLC Sale
23235 Schoenherr Warren 1,540 Oct. 2011 NAT Holdings, LLC Sale
7448-7456 Nineteen Mile Sterling Heights 8,584 Oct. 2011 Elmhirst Industries Lease
29620 Parkway Roseville 6,000 Oct. 2011 Specialty Vehicle Acquisitions Lease
24551 Ryan Warren 6,512 Oct. 2011 MAK Electric Supply Lease
33783 Groesbeck Fraser 3,107 Oct. 2011 Steve Kargenian, Joe Demon Lease
11500 Hupp Warren 18,216 Oct. 2011 Greendale Screw Products, In Sale
28336 Hayes Roseville 22,183 Oct. 2011 Oakland Specialties/MAC Ste Lease
35330 Stanley Sterling Heights 11,000 Oct. 2013 I. D. Properties, LLC Sale
33777 Groesbeck Fraser 3,107 Oct. 2011 S & P Systems Lease
5800 Enterprise Warren 17,240 Oct. 2011 SPX Test & Measurement Lease
16686 Common Roseville 7,247 Sept. 2011 Sahlaney's Auto & Truck Rep Lease
15715 Sturgeon Roseville 15,000 Sept. 2011 Pentech Industries Lease
7354 Nineteen Mile Sterling Heights 3,120 Sept. 2011 4 Kustom Jobs & Trim, LLC Lease
6635 S. Sterling Dr. Sterling Heights 81,225 Sept. 2011 Zack Investments-Sterling Dri Sale
7424 Nineteen Mile Sterling Heights 4,480 Sept. 2011 Bleichert, Inc. Lease
28302 Hayes Roseville 14,000 Sept. 2011 VirTec Manufacturing, LLC Lease
15715 Sturgeon Roseville 20,071 Sept. 2011 Greg Kiesgen Sale
33745 Groesbeck Fraser 4,300 Sept. 2011 FnG Body, LLC Lease
33755-33759 Groesbeck Fraser 5,851 Aug. 2011 M2D2 Wholesale Liquidators Lease
6780 Nineteen 1/2 Mile Sterling Heights 15,094 Aug. 2011 Great Lakes Ind. Furnace Lease
69216 Powell Armada 51,000 Aug. 2011 Blake Investment Prop, LLC Sale
50371 Russell Schmidt Chesterfield Twp. 49,612 Aug. 2011 Container Design Services, In Lease
51195 Recency Center Dr. Macomb Twp. 15,000 Aug. 2011 Don West Sale
44468 Reynolds Clinton Twp. 9,796 Aug. 2011 Complete Prototype Service Sale
5500 Enterprise Warren 53,900 Aug. 2011 US Army Lease
12816 E. Nine Mile Warren 2,500 Aug. 2011 Chromium Concepts, LLC Lease
51876 Filomena Shelby Twp. 27,138 Aug. 2011 ISO Sales, Inc. Lease
42450 Mancini Dr. Sterling Heights 32,352 Aug. 2011 Bleichert Inc. Lease
6405 Nineteen Mile Rd. Sterling Heights 16,190 Aug. 2011 Step On Me Flooring Lease
Address City Square Feet Date Buyer/Tenant TermsAcres
Macomb County Team's Recently Completed Transactions
26332 Lawrence Center Line 11,980 Aug. 2011 East Penn Mfg. Lease
35160 Stanley Sterling Heights 9,434 July 2011 Industrial Furnace Interiors Sale
14150 Eleven Mile Warren 8,800 July 2011 14150 Eleven Mile Road, LLC Sale
42300 Executive Dr. Harrison Twp. 37,472 July 2011 Laser Cutting Company Sale
6503 Arrow Sterling Heights 7,072 July 2011 Akers & Ward Enterprises, LL Buyer
44831 Groesbeck Clinton Twp. 123,184 July 2011 Sequoia Tool, Inc. Lease
6575 Nineteen Mile Sterling Heights 13,617 July 2011 Metallizers of Mid-America, In Lease
48751 Structural Drive Chesterfield Twp. 4,800 July 2011 Roko Gjokaj Lease
6503 Nineteen 1/2 Mile Sterling Heights 17,466 June 2011 Mor-Tech Design Lease
23328 Sherwood Warren 8,500 June 2011 King of Beverage Lease
12755 E. Nine Mile Warren 116,360 June 2011 SMW Automotive Corp. Lease
28070 Hayes Roseville 19,100 June 2011 Nova Land Holding, LLC Sale
6370 Wall Sterling Heights 12,000 June 2011 6370 Wall Street, LLC Sale
33765 Groesbeck Fraser 3,107 June 2011 Daniel David Mainville Lease
7322 Nineteen Mile Sterling Heights 4,160 June 2011 Phoenix Countertops Lease
7464-7472 Nineteen Mile Sterling Heights 8,745 June 2011 Rex Printing Lease
51870 Shelby Parkway Shelby Twp. 80,559 June 2011 KUKA Robotics Corp. Lease
30580 Edison Roseville 23,653 June 2011 KMT Properties, LLC Sale
51277 Celeste Shelby Twp. 11,100 June 2011 Viegel North America, LLC Lease
6010 Wall Sterling Heights 29,540 June 2011 Oakland Vert Lease
23250 Sherwood Warren 10,000 May 2011 Pro Precision Lease
22930 Sherwood Warren 6,500 May 2011 Quality Care Improvements, I Lease
70570 Powell Rd. Armada 8,000 May 2011 KLM Landscapes Sale
6425 Nineteen Mile Sterling Heights 16,173 May 2011 Lighthouse Molding, Inc. Lease
40563 Mound Sterling Heights 21,610 May 2011 CAD Engineering Resources, Lease
44752 Morley Dr. Clinton Twp. 7,613 May 2011 Hansen Beverage Company Lease
6430 Nineteen Mile Sterling Heights 13,727 May 2011 Infigreen Polymers, LLC Lease
413 E. St. Clair Romeo 5,800 Apr. 2011 CDL Electric Lease
35855 Stanley Sterling Heights 30,985 Apr. 2011 Fettes Manufacturing, Inc. Lease
23000 Industrial St. Clair Shores 30,242 Apr. 2011 Detriot Newspaper Agency Lease
51354 Filomena Shelby Twp. 36,520 Apr. 2011 Elite Plastic Products, Inc. Lease
16601 Eastland Roseville 37,305 Apr. 2011 Visioneering, Inc. Lease
11530 Stephens Centerline 76,880 Apr. 2011 Ceratizit, USA Sale
35835 Stanley Sterling Heights 11,138 Apr. 2011 EnG Design, Inc. Sale
44668 Morley Dr. Clinton Twp. 5,800 Apr. 2011 Trompeter Enterprises, LLC Lease
32150 Howard Madison Heights 8,239 Apr. 2011 M. Shatila Sweet Factory, Inc. Lease
35650 Stanley Sterling Heights 15,571 Apr. 2011 Aphase II, Inc. Lease
50771 Design Lane Shelby Twp. 18,650 Apr. 2011 Mid-States Bolt & Screw Co. Lease
7354 Nineteen Mile Sterling Heights 3,120 Apr. 2011 Bernal Products, Inc. Lease
51362 Quadrate Macomb Twp. 70,268 Mar. 2011 United Machining, Inc. Lease
Address City Square Feet Date Buyer/Tenant TermsAcres
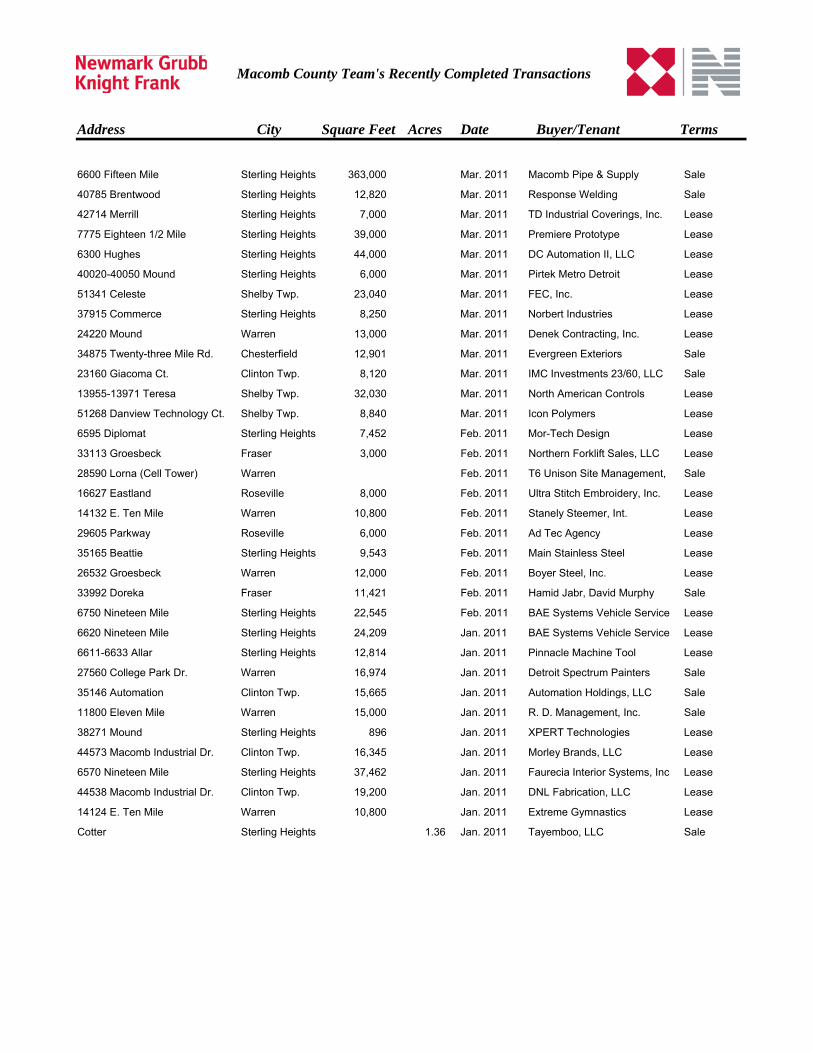
Macomb County Team's Recently Completed Transactions
6600 Fifteen Mile Sterling Heights 363,000 Mar. 2011 Macomb Pipe & Supply Sale
40785 Brentwood Sterling Heights 12,820 Mar. 2011 Response Welding Sale
42714 Merrill Sterling Heights 7,000 Mar. 2011 TD Industrial Coverings, Inc. Lease
7775 Eighteen 1/2 Mile Sterling Heights 39,000 Mar. 2011 Premiere Prototype Lease
6300 Hughes Sterling Heights 44,000 Mar. 2011 DC Automation II, LLC Lease
40020-40050 Mound Sterling Heights 6,000 Mar. 2011 Pirtek Metro Detroit Lease
51341 Celeste Shelby Twp. 23,040 Mar. 2011 FEC, Inc. Lease
37915 Commerce Sterling Heights 8,250 Mar. 2011 Norbert Industries Lease
24220 Mound Warren 13,000 Mar. 2011 Denek Contracting, Inc. Lease
34875 Twenty-three Mile Rd. Chesterfield 12,901 Mar. 2011 Evergreen Exteriors Sale
23160 Giacoma Ct. Clinton Twp. 8,120 Mar. 2011 IMC Investments 23/60, LLC Sale
13955-13971 Teresa Shelby Twp. 32,030 Mar. 2011 North American Controls Lease
51268 Danview Technology Ct. Shelby Twp. 8,840 Mar. 2011 Icon Polymers Lease
6595 Diplomat Sterling Heights 7,452 Feb. 2011 Mor-Tech Design Lease
33113 Groesbeck Fraser 3,000 Feb. 2011 Northern Forklift Sales, LLC Lease
28590 Lorna (Cell Tower) Warren Feb. 2011 T6 Unison Site Management, Sale
16627 Eastland Roseville 8,000 Feb. 2011 Ultra Stitch Embroidery, Inc. Lease
14132 E. Ten Mile Warren 10,800 Feb. 2011 Stanely Steemer, Int. Lease
29605 Parkway Roseville 6,000 Feb. 2011 Ad Tec Agency Lease
35165 Beattie Sterling Heights 9,543 Feb. 2011 Main Stainless Steel Lease
26532 Groesbeck Warren 12,000 Feb. 2011 Boyer Steel, Inc. Lease
33992 Doreka Fraser 11,421 Feb. 2011 Hamid Jabr, David Murphy Sale
6750 Nineteen Mile Sterling Heights 22,545 Feb. 2011 BAE Systems Vehicle Service Lease
6620 Nineteen Mile Sterling Heights 24,209 Jan. 2011 BAE Systems Vehicle Service Lease
6611-6633 Allar Sterling Heights 12,814 Jan. 2011 Pinnacle Machine Tool Lease
27560 College Park Dr. Warren 16,974 Jan. 2011 Detroit Spectrum Painters Sale
35146 Automation Clinton Twp. 15,665 Jan. 2011 Automation Holdings, LLC Sale
11800 Eleven Mile Warren 15,000 Jan. 2011 R. D. Management, Inc. Sale
38271 Mound Sterling Heights 896 Jan. 2011 XPERT Technologies Lease
44573 Macomb Industrial Dr. Clinton Twp. 16,345 Jan. 2011 Morley Brands, LLC Lease
6570 Nineteen Mile Sterling Heights 37,462 Jan. 2011 Faurecia Interior Systems, Inc Lease
44538 Macomb Industrial Dr. Clinton Twp. 19,200 Jan. 2011 DNL Fabrication, LLC Lease
14124 E. Ten Mile Warren 10,800 Jan. 2011 Extreme Gymnastics Lease
Cotter Sterling Heights Jan. 2011 Tayemboo, LLC Sale1.36