Embed Size (px)
Citation preview

ONCOLOGYONCOLOGYMay, 2017

ChemPartner Discovery Biology Expertise
In Vitro Biology/HTS/Assay Technology In Vivo Biology/ Pharmacology
Assay Development HTS
Oncology Panel Screening (>700 cell lines)
HTS Target Classes
GPCRs: (32) Nuclear receptors (22)
Cell line‐derived xenograft models (>160) Patient‐derived xenograft models (>200) Tumor immunology
Neuroscience Kinases (161) Epigenetic enzymes (>100) Metabolic enzymes (>40) Ion channels transporters
Behavioral Neuropharmacology In Vitro Electrophysiology (QPatch, Brain Slice) In Vivo Microdialysis & Receptor Occupancy Primate Cognitive NeuropharmacologyIon channels, transporters
Anti‐infectious assays 150+ clients, 200+ projects, 6.5M+ data points
Metabolic & Cardiovascular Diseases DIO, db/db, ZDF Diabetes & Metabolic Diseases (Diabetic
Nephropathy)
Cell Biology
Target Validation (siRNA, shRNA, CRISPR, cDNA,
Inflammation & Immunology Primary Immune Cell Assays CIA, AIA, IBD, lung fibrosis, PD models
Biomarkerlentivirus)
Target to Hit, Hit to Lead assays Cancer cell line panel screening HCA, ELISA, AlphaScreen, FACS, Luminex
PK/PD correlation PD biomarkers: Western blot, qPCR, ELISA, Luminex,
MSD, LC/MS/MS Pathology service
© 2017 ChemPartner 2
, , p , ,

In Vitro BiologyIn Vitro Biology
© 2017 ChemPartner 3

Assays by Target Type GPCR Kinase and PDE
Calcium flux (FLIPR)cAMP assay (HTRF, LANCE, cAMP‐Glo)Receptor binding assay
GPCR Kinase and PDE
Caliper mobility shift assay[33P] ATP filter binding assayFRET assayReceptor binding assay
Receptor occupancy on brain homogenateReporter gene (luciferase, b‐gal, bla)β‐arrestin assayIP O HTRF
FRET assayTR‐FRET assayFP transcreener assayLanthaScreen Eu kinase binding assayIMAPIP‐One HTRF assay
IP3 AlphaScreen assay Ion Channel and TransporterNuclear Receptor
TR‐FRET assay
IMAP assay
Membrane Potential assayQ‐PatchTR FRET assay
Luciferase reporter assayFull‐length NRLBD‐GAL4
R t bi di
Q PatchManual PatchFluxOR screening with potassium channelsPredictor hERG FP assayT t t k
Anti‐bacteria testing serviceAnti HBV and HCV testing service
Epigenetic TargetsMicrobiology
Receptor binding assay In‐Cell protein: protein interaction assay
AlphaLISA/ AlphaScreen
Transporter uptake assay
Anti HBV and HCV testing service
Others
AlphaLISA/ AlphaScreenRadioisotopeFluorimetryLance Ultra Assay Development
© 2017 ChemPartner 4
Mobility shift assayy p

Kinase Panel: 161 Kinase Assays Established Tyrosine Kinase
A F tABLARGBLK BRKBTKCSK
ALKALK (L1196M)AXLcKIT
FGFR2FGFR3FGFR4FLT1/VEGFR1FLT3
Caliper mobility shift assayKinase-glo assay
ADP-Glo assayLanthaScreen assay
LanceUltra assay
Assay Formats
CSKFAKFES FERFGRFYNHCK
cMETECK/EphA2EGFR EGFR (d746‐750)EGFR (L858R)
FLT4/VEGFR3KDR/VEGFR2HER2HER4 IGF1RINSRLTK
MAPKAPK5MARK1 MARK2
AMPKα1BRSK1 BRSK2
AKT1AKT2AKT3MSK1
PKCηPKCθPKCιPKN1
PI3K
HCKITKJAK1 JAK2 JAK3LCK LYNa
(L858R) EGFR (T790M)EGFR (T790M,L858R)EGFR (T790M L746‐750)
LTKMUSKPDGFRa PDGFRb RETRON ROS
MEK1MINKMST1MST2MAP4K2 MAP4K4
MARK2 MARK3 MYLK2PIM1 PIM2PKD1PKD2
BRSK2CAMK2αCAMK2βCAMK2γCAMK2δ CAMK4CHK1
MSK2p70S6KPDK1PKACαPKCαPKCβ1PKCβ2
PKN2PKN3PRKG1ROCK1ROCK2RSK1RSK2 PI3K
PI3KPI3KPI3Kmr
SRCSYKTYK2 YESZAP70
(T790M, L746 750)EphA1 EphB1 EphB2FGFR1
ROS TIE2TRK‐A
MASKPAK2PAK4TAOK2 TNIK
PKD2PKD3 SIK TSSK1TSSK2
CHK1 CHK2 DCAMKL2 MAPKAPK2MAPKAPK3
PKCβ2PKCγPKCδ PKCεPKCζ
RSK2RSK3SGKSGK2SGK3
STECAMK
AGC
Atypical
IRAK1 C K1 K2 CK1δ
STE
CMGC CK1
CAMK
Other
Atypical
TKL
IRAK1IRAK4BRAFBRAF(600E)CRAF
CDK1CDK2 CDK4CDK6 CDK7CDK9DYRK1α
ERK2GSK3α GSK3β JNK2JNK3P38αP38β
CK1δCK1ε
AUR AAUR BAUR CIKKβNEK2
© 2017 ChemPartner 5
DYRK1αDYRK1βERK1
P38βP38γ P38δ

Epigenetic Panel: 120 Assays Established Assay FormatsAssay Formats
HDAC1HDAC2
NSD1NSD2NSD3PRDM9
DOT1LEHMT1
EZH1EZH2
ATAD2A BAZ1BBAZ2B
BRD2(1,2)BRD2(D1)
CECR2CREBBPEP300FALZPBRM1(D1)
Radiometric assayAlphaLisa assayFluorescence Intensity
HTRF assayAlphaScreen assayMobility Shift assay
Assay FormatsAssay FormatsMulti‐colours stands for multi‐methods
HDAC2HDAC3HDAC4HDAC5HDAC6HDAC7
PRMT1PRMT3
CBPEP300
PRDM9SETD1BSETD7SETD8SETDB1
EZH2EZH2 (Y641F)EZH2 (Y641C)EZH2 (Y641N)EZH2 (Y641S)
JARID1A JARID1BJARID1C
JMJD2DJMJD2EJMJD3
BRD2(D1)BRD2(D2)BRD3(1,2)BRD3(D1)BRD3(D2)BRD4(1 2)
PBRM1(D1)PBRM1(D4)PBRM1(D5)PBRM1(D6)SMARCA2SMARCA4
Fluorescence IntensityLANCE Ultra
Mobility Shift assayMTase-Glo assay
NatDPCAF
HDAC7HDAC8HDAC9
HDAC10HDAC11
SIRT1SIRT2SIRT3
PRMT4PRMT5PRMT6PRMT7PRMT8
GCN5 HAT1KAT5KAT6BKAT7
SMYD2SMYD3SUV39H1SUV39H2SUV420H1
EZH2 (A677G)G9a
MLL1MLL2MLL3
JARID1CJMJD1AJMJD1BJMJD2AJMJD2B
JMJD3LSD1PHF8UTXFBXL10
BRD4(1,2)BRD4(D1)BRD4(D2)
BRD7BRD9
BRDT(D1)
SMARCA4SP140SP140LTAF1(D2)TRIM24
L3MBTL1L3MBTL3
me me ac
HKMT HKDM HDAC&SIRT HATHRMT
Histone Mark
PRMT8 KAT7KAT8
SUV420H1SUV420H2
MLL3MLL4 JMJD2C FBXL11 BRDT(D1)
BRDT(D2)MethylReader Bromodomain
R KKmeDNMT
DNMT1AKT1AKT2
IKKaJAK2
PIM1PKCb1
CpGmDNMT1DNMT3ADNMT3B
AKT3AurB
MSK1MSK2
Histone Mark PKinase
PKN1RSK2
© 2017 ChemPartner 6
S/T/Y

HDAC: Long-Term SAR Program
Reference IC50 on Target HDAC-X
Historical Reference IC50 on HDAC-X
8 0
8.5
9.0
ef IC
50)
20
40
60
80
100
120
IC50 = 5.6 nM
Inhi
bitio
n %
2 2 2 2 2 2 2 2 2 2 2 2 2 2 2 3 3 3 3 3 3 3 3 3 3 3 3 3 3 3 3 3 3 3 3 3 3 3 3 3 3 3 3 3 3 3 3 3 3 3 3 3 3 3 3 4
7.0
7.5
8.0
-Log
(Re
-2 -1 0 1 2 3 4-20
0
20
Log Concentration (nM)
I
1/4/
2012
1/10
/201
21/
17/2
012
2/7/
2012
2/13
/201
22/
21/2
012
2/28
/201
23/
6/20
123/
13/2
012
3/20
/201
23/
27/2
012
4/10
/201
24/
17/2
012
4/24
/201
212
/17/
2012
1/14
/201
31/
22/2
013
1/28
/201
32/
5/20
132/
18/2
013
2/25
/201
33/
11/2
013
3/18
/201
34/
1/20
134/
8/20
134/
15/2
013
4/22
/201
34/
27/2
013
5/6/
2013
5/13
/201
35/
20/2
013
5/27
/201
36/
3/20
136/
17/2
013
6/24
/201
37/
1/20
137/
8/20
137/
15/2
013
7/22
/201
38/
26/2
013
9/2/
2013
9/16
/201
39/
23/2
013
10/8
/201
310
/14/
2013
10/2
2/20
1310
/28/
2013
11/4
/201
311
/11/
2013
11/1
8/20
1311
/25/
2013
12/2
/201
312
/9/2
013
12/2
3/20
1312
/30/
2013
1/6/
2014
Assay Date
Selectivity against HDAC-S1, S2 and S3 IC50 of CPD-1 (nM) Selectivity
HDAC-X 2.1 n/aHDAC-S1 356 169HDAC-S2 380 181HDAC-S3 1785 850
© 2017 ChemPartner 7
HDAC S3 1785 850

MOA study: Modality of Inhibition
Competitve cmpd Non competitve cmpd Un competitve cmpd
Global fitting for MoICompetitve cmpdMixed mode fitting
10
1541.0024.6014.768.865.313.19
eloc
ity
Non-competitve cmpdMixed mode fitting
10
15804020105el
ocity
Un-competitve cmpdMixed mode fitting
4
6
80.1240.0620.0310.0160.008el
ocity
0 2000 4000 60000
5
0
1.911.150.690.41
Substrate conc. [uM]
Ve
0 500 1000 1500 20000
5 0
Substrate conc. [uM]
Ve
0 50 100 150 200 2500
20.00
Substrate conc. [uM]
Ve
Lineweaver-Burk plotC titi d
Lineweaver-Burk plotN titi d
Lineweaver-Burk plotU titi d
Lineweaver–Burk plot (double reciprocal plot) for MoI
Competitive cmpd
1.0
1.5
2.014.768.865.313.191.910
1/V
Non-competitive cmpd
4
6
88040201050
1/V
Un-competitive cmpd
0.4
0.6
0.80.1240.0620.0310.0160.0080.00
1/V
Competitive cmpd
0.000 0.002 0.004 0.006 0.0080.0
0.50
1/S
Non competitive cmpd
0.00 0.01 0.02 0.03 0.040
20
1/S
Un competitive cmpd
0.00 0.01 0.02 0.03 0.04 0.050.0
0.20.00
1/S
© 2017 ChemPartner 8
Competitive cmpd Non‐competitive cmpd Un‐competitive cmpd

MOA study: Slow-on/Slow-off Characterization
Kon test for slow‐on cmpds and irreversible cmpds
Kon and Koff determination
© 2017 ChemPartner 9

Cell BiologyCell Biology
© 2017 ChemPartner 10

Cell Biology Overview
Target Validation Cancer Cell Line Panel ScreenTarget Validation Cell Line Selection for Target Validation siRNA-Mediated Gene Knockdown shRNA-Mediated Gene Knockdown
Cancer Cell Line Panel Screen 700+ cell line collection Mycoplasma tested and STR verified Various assay formats to choose from
CRISPR-based Gene Knockout Stable Cell Line Generation with Lentivirus Rescue to Prove On-Target Effect In Vivo Target Validation
y Dedicated team with 8 years experience Assay validated by uniformity test and
test/retest Stringent in-study QCg
200+ new targets have been validated in 100+ cell lines by siRNA or shRNA KD, 1000+ stable cell lines generated
g y30+ panel screens conducted and 600,000+ high-quality data points delivered each year
Assay PlatformsCell-based Assays
Cell functional assays Proliferation
Assay Platforms Absorbance-based assays Luminescence-based assays Fluorescence-based assays
Cytotoxicity Migration Apoptosis Cell cycle
y High content analysis Flow cytometry & cell sorting Quantitative PCR Western blot, ELISA, Luminex, y
Cell signaling assays Cell metabolite assays50+ clients, 600+ studies, functional service or part of drug discovery programs to support
, , ,AlphaScreen, etc.
We customized our assays to suit your project needs
© 2017 ChemPartner 11
p g y p g ppSAR finding

siRNA Transient Gene Knockdown
Knock down target gene by siRNA pool or individual oligos Taqman or Western blot analysis to confirm the knockdown efficiency at mRNA level or
protein level, respectively The effect of tumor cell growth inhibition is monitored by CellTiter Glo cell viability assay
(2D) and/or soft agar colony formation assay (3D)
siRNA Anti‐Proliferation CTG Assay in Cell Line XTaqman KD Evaluation siRNA Anti‐Proliferation CTG Assay in Cell Line XTaqman KD Evaluation
siRNA Soft Agar Screen in Cell Line XWestern Blot KD Evaluation (GAPDH as an example)Day 2 Day 3 Day 4 Day 5 Day 6
GAPDH
Actin
© 2017 ChemPartner 12

Constitutive and Inducible shRNA Knockdown
pTRIPZ System (Open Biosystems) – tet‐inducible target gene knockdown pTRIPZ System (Open Biosystems) tet inducible target gene knockdown
pSLIK System (ATCC) – tet‐inducible target gene knockdown
pGIPZ System (Open Biosystems) – constitutive target gene knockdownp y ( p y ) g g
pLKO1 System (Open Biosystems) – constitutive target gene knockdownVerify Inducible Target KD in Stable Cell Lines by RT‐TaqmanCommercially
purchased shRNAsClient provided
shRNAs
40%60%80%
100%120%
ativ
e m
RN
A
Leve
l
Dox-D
In‐house made shRNAs
0%20%
shRNA1 shRNA2 shRNA4 shRNA6
Rel
a Dox+
Verify Target KD in Stable Cell Lines by Western blot
Packaging Lentivirus
Generate shRNA‐containing bl ll li
Gene A
Cell Line 1
M WT NT sh5 sh6 M
Gene B
M WT NT 1025 1462 M
Cell Line 2Verify Target KD in Stable Cell Lines by Western blotstable cell lines
Validate stable cell lines by Taqman and Western blot
56 kDa 25 kDa
ActinActin
2D CellTiter Glo Cell Viability Assay
2D Clonogenic Assay
3D Soft Agar Colony Formation Assay
Apoptosis Assay
Downstream pathway/biomarker
In Vivo target lid ti
© 2017 ChemPartner 13
validation
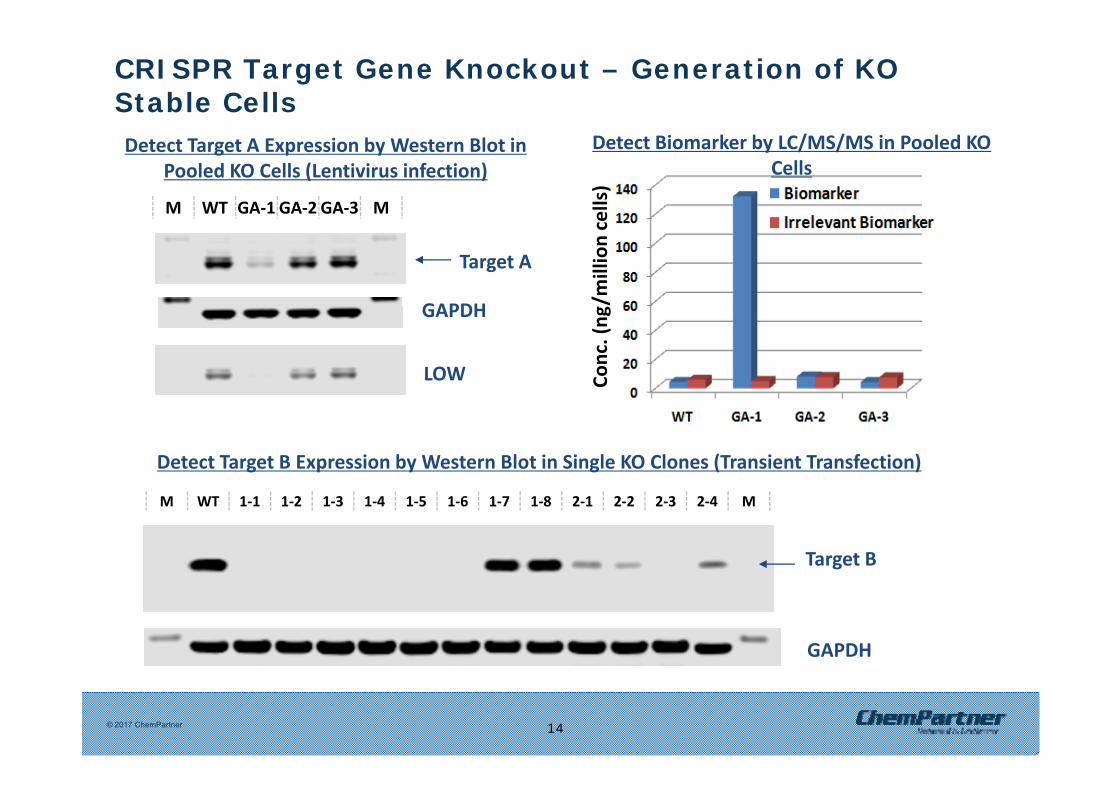
CRISPR Target Gene Knockout – Generation of KO Stable Cells
M WT GA‐1 GA‐2 GA‐3 M
Detect Target A Expression by Western Blot in Pooled KO Cells (Lentivirus infection)
ells)
Detect Biomarker by LC/MS/MS in Pooled KO Cells
GAPDH
Target A
/million ce
GAPDH
LOW Conc. (ng
Detect Target B Expression by Western Blot in Single KO Clones (Transient Transfection)
Target B
M WT 1‐1 1‐2 1‐3 1‐4 1‐5 1‐6 1‐7 1‐8 2‐1 2‐2 2‐3 2‐4 M
GAPDH
© 2017 ChemPartner 14

CRISPR Target Gene Knockout – Phenotypic Study
2D Clonogenic Assay in A549 WT/Cas9 cells following sgCopGFP/sgPCNA virus infection
A549‐wt
A549 WT cells A549‐Cas9 cells
sgGFPInfect with pRSG16‐sgGFP or sgPCNA
sgPCNA
Puromycin Selection
Replate into 6 well plates
A549‐Cas9
Replate into 6‐well plates
Colony FormationsgGFP
Knockout of PCNA, an essential gene for cell survival, by Lenti‐sgRNA
y
sgPCNAfor cell survival, by Lenti sgRNA infection, led to scarce colony
formation
© 2017 ChemPartner 15

Cellular Functional Assays
• Cell proliferation/viability Soft Agar Colony Formation Assay• Cell proliferation/viability‒ CellTiter‐Glo cell viability assay‒ CyQuant assay
MTT/MTS
Apoptosis Analysis
Soft Agar Colony Formation AssayStaurosporine(Rel_IC50=0.00073μM) on A375 cell line by soft agar assay
80
100
DMSO treated‒ MTT/MTS assays‒ Direct cell counting by HCA‒ Clonogenic assay
inhi
bitio
n%
0
20
40
60DMSO treated
‒ 14‐day long‐term proliferation assay
• 3D growth‒ Soft agar colony formation assay
Cell Cycle Analysis
Compound Concentration(μM)1x10⁻⁵ 0.001 0.1
-20
‒ Matrigel 3D assay‒ Ultra‐low attachment assay
• Cytotoxicity: LDH release assay
Cell Cycle AnalysisDMSO Cisplatin (5
μM) STS treated
y y• Apoptosis
‒ FACS (AnnexinV & PI)‒ Caspase 3/7 Glo PI (FL3‐A)
Num
ber
Caspase 3/7 Glo‒ Cell death detection ELISA
• Cell Cycle: FACST ll i ti T ll
Cell cycle was changed in A549 after cells being treated with Cisplatin for 48h.
PI (FL3 A)
© 2017 ChemPartner 16
• Tumor cell migration: Transwell assay

14-day Long-Term Proliferation Assay- To Support Epigenetics Program
Cell Line X, Compound Y-day4 Cell Line X, Compound Y-day7120
Day 4 Day 7
row
th In
hibi
tion
20
40
60
80
100
row
th In
hibi
tion
20
40
60
80
100
concentration(uM)0.001 0.1 10
%G
-20
0
20
concentration(uM)0.001 1
%G
-20
0
20
D 14Cell Line X, Compound Y-day11
ition 100
Cell Line X, Compound Y-day14
ition 100
Day 11 Day 14
%G
row
th In
hib
10
40
70
%G
row
th In
hib
10
40
70
A long‐term proliferation assay (time courses on Day4, 7, 11,and 14) was performed to
concentration(uM)0.001 0.1 10
-20
concentration(uM)0.001 0.1 10
-20
© 2017 ChemPartner 17
determine the anti‐proliferation effect by a compound targeting an epigenetic target.

Cell Signaling Assays Protein Phosphorylation
473
p‐Akt detected by AlphaScreen SureFire™Western blot Cell‐based ELISA AlphaScreen SureFire
pAKT473 in Suspension Cells ByAlphaScreen SureFire
100
150
Cpd
ition
High content analysis MSD FACS
-2 0 2-50
0
50
Log[compound] uM
%in
hib
Nanopro
Nuclear Translocation Reporter Gene Assay Afatinib Erlotinib
Afatinib Erlotinibp‐EGFR and p‐HER2 detected by ELISA
p y
C d ( M)
Doxycycline +++ ++-
0 2-- 202 200
Phospho‐Protein detected by Western Blot
%in
hibi
tion
10
30
50
70
90
Erlotinib
%in
hibi
tion
20
40
60
80
100
GFR
(pan
‐Tyr)
Compound (nM)
Total target protein
160kD
110kD-P-target protein
0.2-- 202 200
160kD
Cmpd Concontration (nM)0.01 10
-10
10
Cmpd Concontration (nM)1 1000
0
Afatinib
n
90
Erlotinib
n
90
P‐EG
‐Tyr)
GAPDH40kD
30kD
g p110kD
Cmpd Concontration (nM)1 1000
%in
hibi
tion
10
30
50
70
Cmpd Concontration (nM)10 1000 100000
%in
hibi
tion
10
30
50
70
P‐HER
2 (pan
‐
© 2017 ChemPartner 18
C pd Co co t at o ( ) C pd Co co t at o ( )

Cell-based Metabolite Assays using LC/MS/MS- To Support Cancer Metabolism Programs
C di i l M di ( d b li )Compounds
Conditional Medium (secreted metabolites)
Cell Extracts (intracellular metabolites)
Assay Optimization‐ Find the best condition that
biologically makes sense and also is
Assay Reproducibility‐ Include a reference compound in each round of the screening as QC
Routine Screening‐Medium throughput, over 5,000 data points per assay per week
robust enough for routine screening
4 cell‐based metabolite assays are being carried out routinely, to guide SAR in various programs The candidate compound from 2 of such programs is now in Phase II trial We newly developed metabolomics platform, in which >100 metabolites can be quantified
© 2017 ChemPartner 19
simultaneously in one single cell extract

Largest Cancer Cell Line Collection among CROs 700+ well‐selected cancer cell lines ready‐for‐screening700+ well selected cancer cell lines ready for screening
>80% of the cell lines are in CCLE panel with genetic annotations Representative of genomic diversity, tissue and ethnic origins High quality cell panel guaranteed by STR verification and mycoplasma testing
Primary Cancer Lines /PDCs No.liver 14
pancreas 20others 10+
Tumor Type No. Of Cell Lines
Lung 153
ChemPartner proprietary
Asian (JCRB/RIKEN/KCLB/SIBS) No.lung 21brain 18
esophagus 13stomach 12
Brain 50Leukemia 49Breast 48
Lymphoma 45l liver 11
ovary 9pharynx 7leukemia 6
adrenal gland 4
Melanoma 38Colon 37
Pancreas 31Liver 31Ovary 25 tongue 4
kidney 3pancreas 3
endometrial 2skin 2
Ovary 25Esophagus 25Kidney 20Stomach 19Bone 17
Human Normal Cells/Cell Lines No.kidney 2skin 2breast 1
Others 12Bone 17
Bladder 12Tongue 12Myeloma 11Prostate 7
© 2017 ChemPartner 20
umbilical cord e 1Others 73

State-of-the-Art Facility and Instrumentation
f l l f l7,500 sq.ft. First‐class tissue culture facility Well‐equipped with cutting‐edge technology & instruments
C d H dli A R d tCell Counting & Plating Compound Handling Assay Readout
Flexstation 3Vi‐Cell Cell Viability Analyzer Caliper Zephyr Envision
EnSpire
Hamilton Starlet
Multidrop CombiHP D300
E h 550INCELL 2000
Acumen eX3
© 2017 ChemPartner 21
Echo 550

Stringent QC at Different LevelsC ll Li Ch i iCell Line Characterization: Growth Property Doubling Time Cell Seeding Density
Cell Lines from Vendor
Master Cell Bank (20 vials) Ce Seed g e s ty
Routine Assays
Master Cell Bank (20 vials)Backup Cell Bank (2 vials)
k ll k ( l )Routine Assays
>2 passages post recovery
Assay and Data QC
Working Cell Bank (20 vials)
Cell Identification
MycoplasmaTest
Cell Morphology Compound Solubility &
(STR Verification)
Historical IC50s of STS Compound Solubility &
Precipitation Max/Min Signals Uniformity and Edge Effect Z factor and SW Replicates Variation Historical IC50s of Reference
Cmpds
© 2017 ChemPartner 22
Cmpds

PharmacologyPharmacology
© 2017 ChemPartner 23

Cancer Pharmacology Overview
• 8+ years of experience
• SPF animal facility (former CRL facility): Cell Biology
– AAALAC accreditation, OLAW assurance
• Early Discovery to Clinical Development
(Ph II lik li i l t i l i )
Cell Biology48% In Vivo
Pharmacology46%Ex Vivo– (Phase II‐like clinical trial in mouse)
• Functional service or part of integrated services
46%Ex Vivo6%
• Study Types
– Cell line‐Derived Xenograft (CDX)– Patient‐Derived Xenograft (PDX) Oncology Studies
Conducted
Compounds / Data Points Major Client
Numbersg ( )– Cancer Immunology & Syngeneic models– In Vivo Drug Efficacy
PK/PD (with CP Bioanalytic)
Conducted Screened Numbers
In Vitro (Cell
Biology)~ 700 > 4 million
data points >100– PK/PD (with CP Bioanalytic)– Biomarkers and Pathology – New model development (in collaboration
with Cell Biology & hospitals)
Biology)
In Vivo ~ 2,400> 1,000
compounds > 100
© 2017 ChemPartner 24

In Vivo Pharmacology Models
Model Type Highlights
Cell line‐derived
Xenograft (CDX)
• 160+ optimized models (growth curves, standard of care treatment)• Compatible with Cancer Cell Panel screen• Experience : Epigenetics, Cancer Metabolism, ADC
Patient
• ~270 optimized models (growth curves, standard of care treatment)• Specialized in cholangiocarcinoma with 17+ PDX modelsPatient
derived‐Xenograft (PDX)
• Facilitating model selection: Whole genome sequencing and RNA‐seq data Ex vivo chemosensitivity assay 40+ PDX derived primary cancer cell lines 40+ PDX‐derived primary cancer cell lines
i
• ~20 in vivo models (sc, iv, orthotopic, resection settings)• Efficacy studies with immunotherapy & combination therapiesSyngeneic
tumor models
Efficacy studies with immunotherapy & combination therapies• Ex vivo analyses
Flow cytometry IHC, soluble factors, genetic profiling
© 2017 ChemPartner 25

1. Breast cancer (10): MDA-MB-231 (+M); MCF-7(+M); ZR-75-1 (+M); HCC70 (+M); BT-474 (+M); MDA-MB-468 (+M); T-47D(+M);
Cell Line Derived Xenograft Models 160+
Subcutaneous model (136)
( ) ( ); ( ); ( ); ( ); ( ); ( ); ( );MCF-7-Her2(+M); MX-1(+M); DU4475
2. Colorectal cancer (9): HCT-116; SW620; HT-29; SW480; DLD-1; COLO 205; NCI-H716(+M); RKO; SW948(+M)3. Gastric cancer (6): SGC-7901 (+M); BGC-823; HGC-27 (+M); MKN-45; AGS (+M); NCI-N874. Glioblastoma (2): U87MG; U87MG(rat,+M) 5. Kidney cancer (4): Caki-1 (+M); A-498; 786-O(+M); G-401(+M)6. Lung cancer (41): A549; NCI-H460; SPC-A-1; NCI-H1975; NCI-H292 ;NCI-H2009(+M); NCI-H1299(+M); NCI-H2122; NCI-H522(+M);
Calu-3(+M); Calu-6(+M); NCI-H441; NCI-H446(+M); NCI-H1155(+M); NCI-H2171(+M); NCI-H841(+M); SHP-77(+M); DMS 53(+M); NCI-H69(+M); NCI-H209(+M); NCI-H524(+M); NCI-H1048(+M); NCI-H1930(+M); DMS 79(+M); NCI-H2081(+M); NCI-H1092(+M); ChaGo-K-1(+M); NCI-H1770(+M); NCI-H146(+M); DMS 153(+M); NCI-H2029(+M); NCI-H1417 (M); NCI-H2030(+M); NCI-H1703(+M); NCI-H1650(+M); NCI-H596(+M); NCI-H1395;A-427(+M); NCI-H510(+M); NCI-H526(+M); NCI-H838(+M); NCI-H226(+M);
7. Liver cancer (4): BEL-7402; BEL-7404; SMMC-7721; Hep 3B2.1-78. Melanoma (2): A375; A20589 Nasopharyngeal (1): CNE9. Nasopharyngeal (1): CNE10.Neuroblastoma (2): BE(2)-C (+M); SH-SY5Y11. Ovarian cancer (4): OVCAR-3(+M) ; A2780; Caov-3; SKOV-3 (+M)12. Pancreatic cancer (6): MIA PaCa-2; Capan-1; PANC-1; AsPC-1;CFPAC-1; BxPC-3(+M)13. Prostate cancer (3): PC-3; LNCaP (+M); DU14514. Leukemia (13): K562 (+M); HL-60(+M); MV-4-11; MOLT-4 (+M); Kasumi-1(+M); KU812(+M); THP-1(+M); TF-1(+M); HEL 92.1.7(+M);
SKM-1 (+M) ;NOMO-1; ARH-77; Kopn-8SKM 1 (+M) ;NOMO 1; ARH 77; Kopn 815. Lymphoma (14): NAMALWA(+M) ; Daudi; Raji(+M); Mino(+M); DB(+M); Toledo(+M); SU-DHL-6(+M); MC116; OCI-Ly19; WSU-DLCL2; Z-
138; REC-1; Granta-519; RPMI 6666; Pfeiffer 16. Myeloma (4): RPMI 8226 (+M); MM.1S(+M); NCI-H929; U266B1(+M)17. Medulloblastoma (1): Daoy (+M)18. Bladder cancer (2): RT112; HT-1376(+M)19. Fibrosarcoma (1): HT-1080( )20. Medullary thyroid carcinoma (1): TT21. Hypopharyngeal (1): FaDu22. Cervical adenocarcinoma(1): Hela23. Mesothelioma (2): MSTO211H; NCI-H28
Blue font: NSCLC; Red font: SCLC
+M, Matrigel usedBreast cancer (1): MDA-MB-231 (+M)
Orthotopic model (3) Liver cancer (1): Hep 3B-Luc; Glioblastoma (1): U87MG (survival)
Systemic-survival model (12)
Leukemia (6): HL-60; K562; MV-4-11; HEL 92.1.7; KU812; THP-1;Lymphoma (3): NAMALWA; Daudi; RajiMyeloma (1): NCI-H929 Neuroblastoma (1): BE(2)-C
© 2017 ChemPartner 26
Neuroblastoma (1): BE(2) C Liver cancer (1): Hep G2-Luc

In Vivo Live ImagingXenogen Lumina XR
Human Primary +
Xenogen Lumina XRCancer cell lines (CDX)expressing luciferase
yTumor primary tumor
CellsRFP
Lenti‐virus
Orthotopic Gastric Cancer Model
PDX
Tumor growth80
Vehicle106 p
/s])
Orthotopic Gastric Cancer Model
Vehicle
20
40
60 DDP 5 mg/kg Q7dIrrinotecan 100 mg/kg Q7d
e (T
otal
Flu
x [
DDP
10 20 30-20
0
Days post administration
Tum
or v
olum
Irinotecan
© 2017 ChemPartner 27

Patient Derived Xenograft Models: Genetic Annotations
Cancer type Number of established models Sequenced
HCC 38 28 (WGS+RNAseq)Cholangiocarcinoma 16 13 (RNAseq)Pancreatic cancer 34 30 (WGS+RNAseq)( q)Colorectal cancer 75 34 (WGS+RNAseq)Gastric cancer 33 0Lung cancer 23 NSCLC +3 SCLC 13+3 (RNAseq)
RNA‐seq will be completed for all models g ( q)
Esophageal cancer 25 0Head & Neck 9 0
Gall bladder cancer 2 1
soon.
Ovarian cancer 4 0Kidney cancer 1 0Breast Cancer 2 0
Endometrial Cancer 2 0Cervical Cancer 3 0
© 2017 ChemPartner 28

Patient-Derived Cell Lines and Applications SNP
Cell panel screen
2‐3 wksLIX012 LIXC012
SNPs
One of the proprietary PDX related cell line
172914145
sensitive validation biomarkers
Proprietary cell line derived xenograft: PK/PD + efficacy + biomarker
1.5 months
Original PDX model: PK/PD + efficacy + biomarker6‐9 months
© 2017 ChemPartner 29

Immuno-Oncology Platforms
Immune‐Modulating Target
•Chemical synthesis Compound•Hybridoma•Chemical synthesis
•MedChemCompound generation
•Target specific assays: enzyme cell based Compound
•Phage display•hIg transgenic mice
Ab generation
•Binding assaysLead enzyme, cell‐based• Immune functional assays
ppool
• Syngeneic models•Combination therapies Early leads
g y• Target specific assays
Lead identification
•HumanizationLead•Combination therapies
•Ex vivo analysesEarly leads
•hPBMC assaysA ti ifi it
Lead(s)
•Affinity maturationoptimization
•MLR& other PBMC assays• In vivo efficacy(humanized
Lead characterization •Antigen specificity
( )
Candidate
y(mouse model)
characterization
Candidate
© 2017 ChemPartner 30
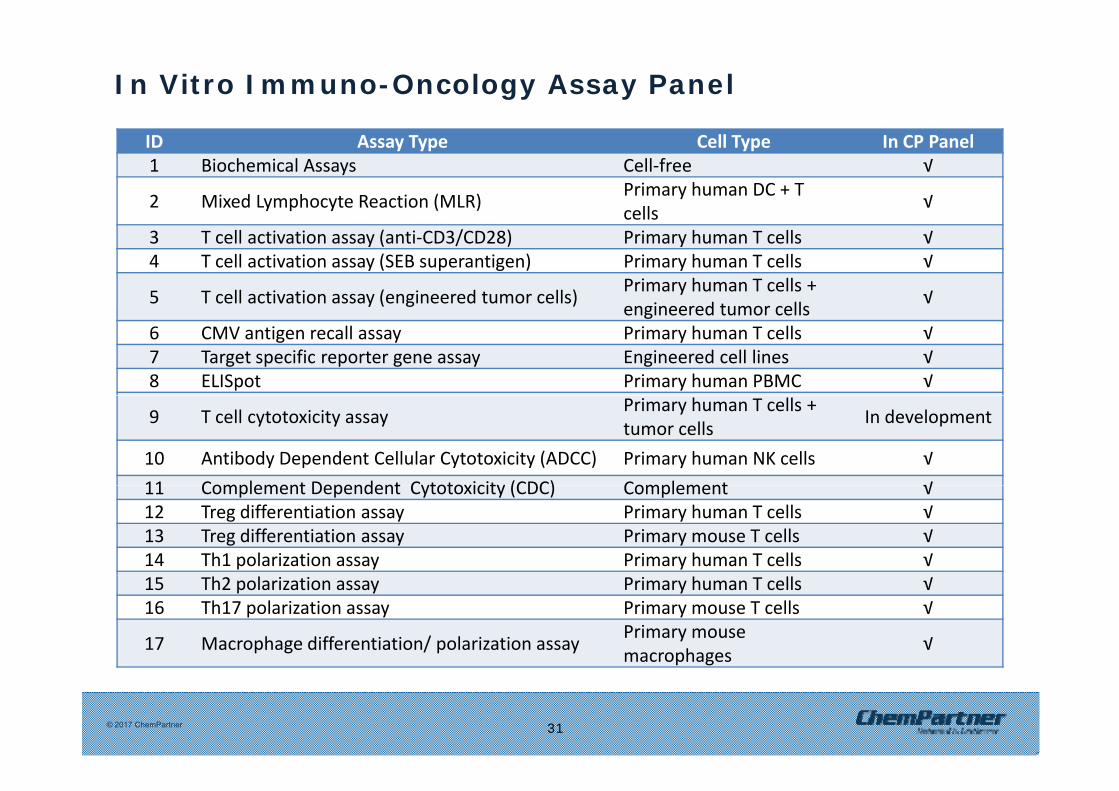
In Vitro Immuno-Oncology Assay Panel
ID Assay Type Cell Type In CP Panel1 Biochemical Assays Cell‐free √
2 Mixed Lymphocyte Reaction (MLR) Primary human DC + T cells √cells
3 T cell activation assay (anti‐CD3/CD28) Primary human T cells √4 T cell activation assay (SEB superantigen) Primary human T cells √
5 T cell activation assay (engineered tumor cells) Primary human T cells + engineered t mor cells √y ( g ) engineered tumor cells
6 CMV antigen recall assay Primary human T cells √7 Target specific reporter gene assay Engineered cell lines √8 ELISpot Primary human PBMC √
9 T cell cytotoxicity assay Primary human T cells + tumor cells In development
10 Antibody Dependent Cellular Cytotoxicity (ADCC) Primary human NK cells √11 Complement Dependent Cytotoxicity (CDC) Complement √11 Complement Dependent Cytotoxicity (CDC) Complement √12 Treg differentiation assay Primary human T cells √13 Treg differentiation assay Primary mouse T cells √14 Th1 polarization assay Primary human T cells √15 Th2 polarization assay Primary human T cells √16 Th17 polarization assay Primary mouse T cells √
17 Macrophage differentiation/ polarization assay Primary mouse macrophages √
© 2017 ChemPartner 31
p g

Mixed Lymphocyte Reaction (MLR)
MLR IFN Dose-Response60000
MLR IL-2 Dose-Response300
40000
00.01 ug/ml0.03 ug/ml0.1 ug/ml0.3 ug/ml1 ug/ml
Antibody Conc.
pg/m
l200
g/m
l
20000
1 ug/ml3 ug/ml10 ug/ml
IFN
- p
100IL-2
pg
Dendritic cells derived from primary human monocytes are co‐cultured with allogeneic CD3 T cells for 5 days. IFN‐and IL 2 production were measured to evaluate the effect of immune checkpoint inhibitors on MLR
Ab1 Ab2 Ab3 Ab4 Ab5 Ab60
Ab1 Ab2 Ab3 Ab4 Ab5 Ab60
© 2017 ChemPartner 32
and IL‐2 production were measured to evaluate the effect of immune checkpoint inhibitors on MLR.

Combination with Immune Checkpoint Inhibitors
SyngeneicM d l
Melanoma B16‐F10 (sc, iv, orthotopic, resection), B16‐F1, B16‐F0
Breast cancer 4T1 (orthotopic, resection), EMT6 (orthotopic), EpH4.1424, JC
Models Lung cancers Lewis lung carcinoma (sc, iv) Colon cancer CT26 (sc, orthotopic), MC‐38Renal cancer RENCA , RAG (sc, orthotopic)Leukemia/myeloma A20 (iv, sc), EL4, L1210, P815Liver cancer Hepa 1‐6 (sc, orthotopic), H22Fibrosarcoma WEHI 164, M7Reticulum cell sarcoma J774A.1
Tumor Growth - CT26 Model
2000
2500 IgG control
Compound X
PD-L1mm
3 )
Survival - CT model
100
val
1000
1500aPD-L1+Cpnd X
or v
olum
e (m
50 Vehicle ControlNormal IgG
**
rcen
t sur
viv
0 5 10 15 20 250
500
D t d i i t ti
Tum
o
0 20 400
Normal IgGPD-L1Compound XPD-L1+Compound X
***Pe
r
© 2017 ChemPartner 33
Days post administration Days post administration

Ex Vivo Immuno-Profiling: Tregs
Tumor Tumor‐Draining Lymph Node
Total Lymphocytes
CD4 T cells CD4 T cells
CD4CD4 CD4
l llTregs
TregsTotal CD4+ cells
FoxP3 F P3
© 2017 ChemPartner 34
FoxP3 FoxP3

Case 1: an IS Project
1 Early lead CpdKick off
Month 0 Month 1 Month 2 Month 9
Goal• Chemistry• Protein production• Biochemistry Assays
• Chemistry: ~50 cpds• Protein: active protein delivered
• BioChemistry Assays:
• Crystal Structures: Crystal structure with Ref
• Chemistry: ~500 cpds; grams of scale‐ups
• Protein: supply for all biochemical assays• Biochemistry Assays
• Cellular Assays• hPBMC Assays• Syngeneic tumor
on‐line• Cellular Assays: basic assay on‐line, build monoclonal
• BioChemistry Assays: near 1,000 cpds; MOA
• Cellular Assays: near 500 cpds
models• ADME Assays• PK/PD • Crystal Structures
• hPBMC Assays: Optimization
• Efficacy & PK/PD: 1ststudies w/ ref.
• Efficacy & PK/PD: multiple cpds; combination
• ADME Assays: multiple cpds testedCrystal Structures • ADME Assays
• Crystal Structures• Crystal Structures: 3 solved, more crystalized
• Initial safety• Key in vivo assays
© 2017 ChemPartner 35

Case 2: Pharmacology for a Lead Compound
A l d d
Efficacy in orthotopic 4T1 model,
MOA: immune
Combination efficacy
Immune memory &
A lead cpd w/ good PK, efficacy in 1 CDX model 1st i M i C bi i R h ll
1o tumor, metastasis response Specificity
1st syngeneic model
More syngeneic & nude mice
Combination Re‐challenge
CT26 Tumor growth-118 days after 1st inoculation of CT26Orthotopic 4T1 Model Tumor growth in nude mice
(4T1 cell line)Tumor growth
(CT26) y
500
1000
1500Naive mouseRechallenge mouse
Tum
or v
olum
e (m
m3 )
0
500
1000
1500
2000 VehicleCPD X,50mg/kgCPD X,100mg/kgCPD X,200mg/kg
***
******
Tum
or v
olum
e (m
m3 )
(4T1 cell line)
0
500
1000
1500
2000vehicle controlCPD X, 50mg/kgCPD X, 100mg/kgCPD X, 200mg/kg
Tum
or v
olum
e(m
m3)
( )
500
1000
1500
2000
2500 IgG control
Compound X
PD-L1
PD-L1+Cpnd X
Tum
or v
olum
e (m
m3 )
0 5 10 15 20 250
Days post inoculation
0 10 20 30 400
Days post administration
Lung Weight
1.5
###
****
***
g)
Tumor growth(CT26)
800 Vehicle Control
CPD X 25mg/kgm3 )
0 10 20 300
Days post administration0 5 10 15 20 25
0
Days post administration
CT26 model
100al
A20 Tumor growth-3 months after 2nd challenge of CT26
2000Naive
Rechallenged micem3 )
vehicl
ePD X
, 50m
g/kg
DX, 1
00mg/kg
DX, 2
00mg/k
g
naive
0.0
0.5
1.0
Lung
wei
ght(
g
0 5 10 15 200
200
400
600CPD X, 25mg/kgCPD X, 50mg/kg
CPD X, 100mg/kgCPD X, 200mg/kg
Tum
or v
olum
e (m
m
0 20 400
50 Vehicle ControlNormal IgGPD-L1Compound XPD-L1+Compound X
***
**
Days post administration
Perc
ent s
urvi
va
10 15 20 25 300
500
1000
1500Rechallenged mice
NS
NS, not statistically significant;
Days post inoculation
Tum
or v
olum
e (m
m
© 2017 ChemPartner 36
CPD
CPD X
CPD X Days post administration Days post administration NS, not statistically significant;Repeated measurement Two-way ANOVA

Thank You!Thank You!
© 2017 ChemPartner 37