Embed Size (px)
Citation preview

Chemometrics in Quantitative RamanSpectroscopy
Steven E.J. Bell,Queen’s
University, Belfast

Raman Spectroscopy- identify andquantify molecular materials through lightscattering
• Irradiate sample with monochromatic radiation• Collect inelastically scattered light• Frequency difference gives vibrational spectrum
Todetector
h
hlaser in
h
h’
hh’Sample
h
Collectionlens
Background
Raman Shift /cm-1
Rayleigh
Inte
nsi
ty
0
Raman
’
3000 2500 2000 1500 1000 500Wavenumber /cm-1
IR transmission
Raman Scattering
Sca
tter
ing
Inte
nsity
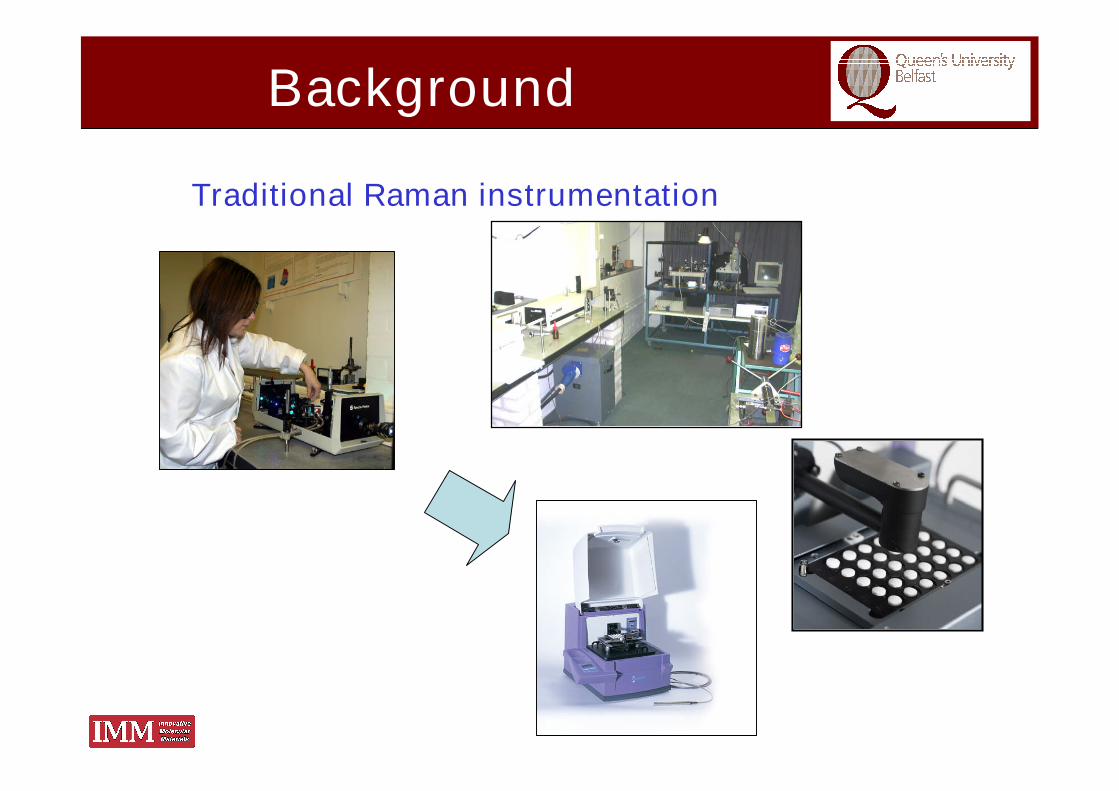
Traditional Raman instrumentation
Background

ADVANTAGESADVANTAGES
o No sample preparation
• Non-destructive• Water backgrounds are low• Rich spectroscopic data (unique fingerprints)
DISADVANTAGESDISADVANTAGES•Scattering probability low
- expense and difficulty
Raman “pros” and “cons”

500 1000 1500 2000 2500 3000 3500500 1000 1500 2000 2500 3000 3500
Wavenumber /cm-1
Glucose
Sucrose
200 400 600 800 1000 1200 1400
Wavenumber /cm-1
Glucose
Sucrose
Rich and Unique Spectra
350 400 450 500 550350 400 450 500 550
Wavenumber /cm-1
Glucose
Sucrose

Drug profiles in Intravaginal Rings (IVRs)TMC120 is a potent HIV microbicide which canprevent infection.
It can be applied as a semi-solid gel asrequired but would be preferable to havedosage form that releases at >inhibitoryconcentration for very extended periods(months) to give continuous protectionagainst HIV infection.
IVR now well established (e.g. in HRT)
-reservoir of drug in core
--release through diffusion of drug through siliconesheath layer
-want to observe and understand this process
Simple Quantitation

3000 2500 2000 1500 1000 500
Core
Non-medicated sheath
In TMC 120 core is more difficult toobserve optically but spectra of drugand silicone elastomer very distinct
Wavenumber /cm-1
Simple Quantitation

5000
10000
15000
3050 3000 2950 2900 2850 2800 2750 2700 2650 26003050 3000 2950 2900 2850 2800 2750 2700 2650 2600
5000
10000
15000
2280 2260 2240 2220 2200 2180 21602280 2260 2240 2220 2200 2180 2160
Wavenumber /cm-1 Wavenumber /cm-1
Line scan 50 m steps x-y-z macro stage
Raw Raman data- from exterior into sheath
-CNSilicone
0
0.5
1
1.5
2
2.5
3
3.5
1 21 41 61 81 101 121 141
CORE
Step number
Dru
g/m
atri
x
Drugdetected outto exteriorsurfacelayer
Quantitation- drugs

Quantitation- drugs
Rationale – even for simple analytical problems use multivariate
methods because they can detect UNEXPECTED sources of
variance in the data.
Either :
1. Include them in the model.
2. Alter the experiment to eliminate the variance- results inparsimonious models with low numbers of factors(simple, stable and understandable).

500 1000 1500 2000
Wavenumber /cm-1
0
10
20
30
0 10 20 30Actual % MDEA
Pre
dict
ed%
MD
EA
Inte
nsity
/Arb
itr.u
nits { M
DE
A
Pre-processed by scaling on the strongest sorbitol band, mean centering, taking 1st derivative (Savitsky-Golay 15 pts) and including the spectral range 678-818 cm-1). The model is entirely as expected with a univariate system, using just a single principal component gives a calibration plot with R2 = 0.988 and anRMS error of 1.1 %
Quantitation- “Ecstasy” drugs
Sor
bito
l
PLS1R2 = 0.988,RMS error = 1.1 %

900800700600500400300
Wavenumber /cm-1
Inte
nsity
/Arb
itr.u
nits
(a)
(c)
(b)
(d)
(e)
Sampling error - “Ecstasy”

400 500 600 700 800 900 1000 1100
Wavenumber /cm-1
(f)
(h)
(g)
(a)
(c)
(b)
(d)
(e)
552
cm-1
527
cm-1
808
cm-1
Inte
nsity
/Arb
itr.u
nits
Sampling error - “Ecstasy”

500 1000 1500 2000
Crystal
Solution
Raw data
Solution
Crystal
1st deriv.
Wavenumber /cm-1
Simple Crystallization

PCA F3
0.05 0.1 0.15 0.2 0.25 0.3 0.35 0.4 0.45
F1-0.4
-0.3
-0.2
-0.1
0
0.1
0.2
0.3
0.4
F2
Score vs score
400 600 800 1000 1200 1400 1600 1800
Expt soln.
Expt cryst.
PCA F1
PCA F2
Wavenumber /cm-1
Simple Crystallization

ADVANTAGESADVANTAGES
o No sample preparation
• Non-destructive• Water backgrounds are low• Rich spectroscopic data (unique fingerprints)
DISADVANTAGESDISADVANTAGES•Scattering probability low unless enhanced.
Raman “pros” and “cons”

SERS increases sensitivity of Raman experiments–enhancements up to x1012.
Single molecule SERS signals known.
In SERS the analyte is adsorbed to a microscopically roughmetal (Ag or Au) surface.
Either add analyte to solution orapply a drop of colloid to thesample.
Most common medium is asuspension of Au or Ag metalnanoparticles (10’s of nm) -metalcolloid.
TEM image ofColloid particles
100 nm
Problem -- colloids do change over time.
SERS background

N
N
HCH3
Nicotine increasingly important withintroduction of nicotine replacement therapies.
Standard method is HPLC but not well-suited forhigh throughput analysis and there are problemsassociated with the matrix in some dosage forms.
SERS – Nicotine
Few mg/dose

d5-pyridineinternalstandard
Nicotine
Wavenumber /cm-1
0 ppm
0.2 ppm
10 ppm
5 ppm
2 ppm1 ppm
Choose internal standard to be as chemically similar to the analyte as possible sothat any changes in the enhancement of the standard track those of the analyte.
SERS – Nicotine
0
1
2
3
4
5
6
0 1 2 3 4 5Actual Concentration (µg/ml)
Pre
dic
ted
(µg
/ml)
StandardsUnknownsLine (Standards)
RMSEP < 0.1 ppm
Calibration is extremely stable

Can Raman provide any realadvantages over established
techniques?
Light Microscopy
PyGC-MS
50
60
70
80
90
100
3500 3000 2500 2000 1500 1000
FT-IR Microscopy SEM/EDX
www.rjlg.com
Paint Analysis

BinderBinder Modified alkyd resins, oxidising resins
PigmentsPigments Dioxazine dyes, phthalocyanines,toluidine reds
ExtendersExtenders TiO2 (rutile), talc, CaCO3,china clay,/Fillers/Fillers BaSO4 etc.
51 lilac paints investigated51 lilac paints investigated(from sub(from sub--judicejudice case)case)
Paint Composition

785 nm excitation
500Wavenumber /cm–1
15001000
Lilac Paints

Despite diversity between spectra the lilac paints are predominantlycomposed of three different constituents in different relative amounts
Rel
.Int
ensi
ty
Rutile
Component 2
Component 1
Wavenumber/cm–1500 1000 1500
1
24
35
8
910
11
Lilac Paints

The two major constituents can be identified…The two major constituents can be identified…
Wavenumber/cm–1800600 1000 16001200 1400
N
N
O
O
N
N
H5C 2
Cl
Cl
H5C 2
CuN
N
N
N
N
N N
N
Lilac Paint
Violet 23
Blue 15.1
Lilac Paint
Violet 23
Blue 15.1785 nm
514 nm
Lilac Paints

Discriminate on the basis of the intensities of the three major constituents ?Discriminate on the basis of the intensities of the three major constituents ?
Component 1 (Blue)
0.5
1
1.5
2
2.5
3
3.5
0.5 1.5 2.5 3.5 4.5
Co
mp
on
ent
2(v
iole
t)
1.2
1.6
2
Component 1
4746
Com
pone
nt2
1.3 1.5 1.7 1.9
Lilac Paints
Batch variation

However, can also measure the minor constituents, e.g. CaCO3.
Rel
.In
ten
sity
Rutile
Blue 15.1
Violet 23
Wavenumber/cm–1500 1000 1500
1 7
24
35
8
910
11Extender CaCO3
6
Lilac Paints

Lilac 43
3 6 7 9 10 110
0.10.20.30.40.50.6
0.70.80.9
1
00.10.20.30.40.50.60.70.80.91
3 6 7 9 10 11
Lilac 7
00.10.20.30.40.50.60.70.80.91
3 6 7 9 10 11
500 1000 1500500
Wavenumber /cm–1
Lilac Paints
6
6

Build a spectral library of all51 paints to search against-this automatically includesthe minor bands.
Hit Position Number ofSamples /20
Top 16
Top 2 18
Top 5 20
Hit Position Number ofSamples /20
Top 16
Top 2 18
Top 5 20
Test with 20 samples-essentially100 % identification in 40seconds even with single layers.
100 % success in blind trialsmatch sample to manufacturer,colour and finish.
400 800 1200 1600
Wavenumber /cm-1
Crown Matt emulsionViva® BreatheEasy
Lilac Paints
Major advantage – can addnew samples at any time.

0
1x10⁶
2x10⁶
3x10⁶
4x10⁶
2500 2000 1500 1000 500
Co
unts
Wavenumber /cm-1
Raman bandRaman band
Fluorescence

750 800 850 900 950100 200 300 400 500 600 700 800 900
With strongly fluorescent samples, even if accumulate sufficient counts ( often not difficult)to reduce shot noise can still see apparent “noise” on the spectra which is due toirregularity in detector response (FPR).
Fluorescence

0 (414) 1000200 (895) 400(1376) 600(1857) 800(2338)
100% Mannitol
92.5% Mannitol, 7.5% Salicylic acid
87.5% Mannitol, 12.5% Salicylic acid
97.5% Mannitol, 2.5% Salicylic acid
90% Mannitol, 10% Salicylic acid
85% Mannitol, 15% Salicylic acid
95% Mannitol, 5% Salicylic acid
Column Number (Raman shift /cm-1)
ModelModel mannitolmannitol/salicylic acid tablets/salicylic acid tablets
Fluorescence model samples

0 (414) 200(895) 400(1376) 600(1857) 800(2338) 1000
97.5% Mannitol, 2.5% salicylic acid doped with increasing conc’n of laser dye.
Column Number (Raman shift /cm-1)
Fluorescence model samples

10000(414) 200(895) 400(1376) 600(1857) 800(2338)
823139
Column Number(Raman shift /cm-1)
2nd derivatives with increasing laser dye concentration
Dye
conc
entr
atio
n
Conventional 2nd derivative
2nd derivatives of the raw data removes baseline. Also increases FPRbut use multivariate data analysis to include it in the calibration model.
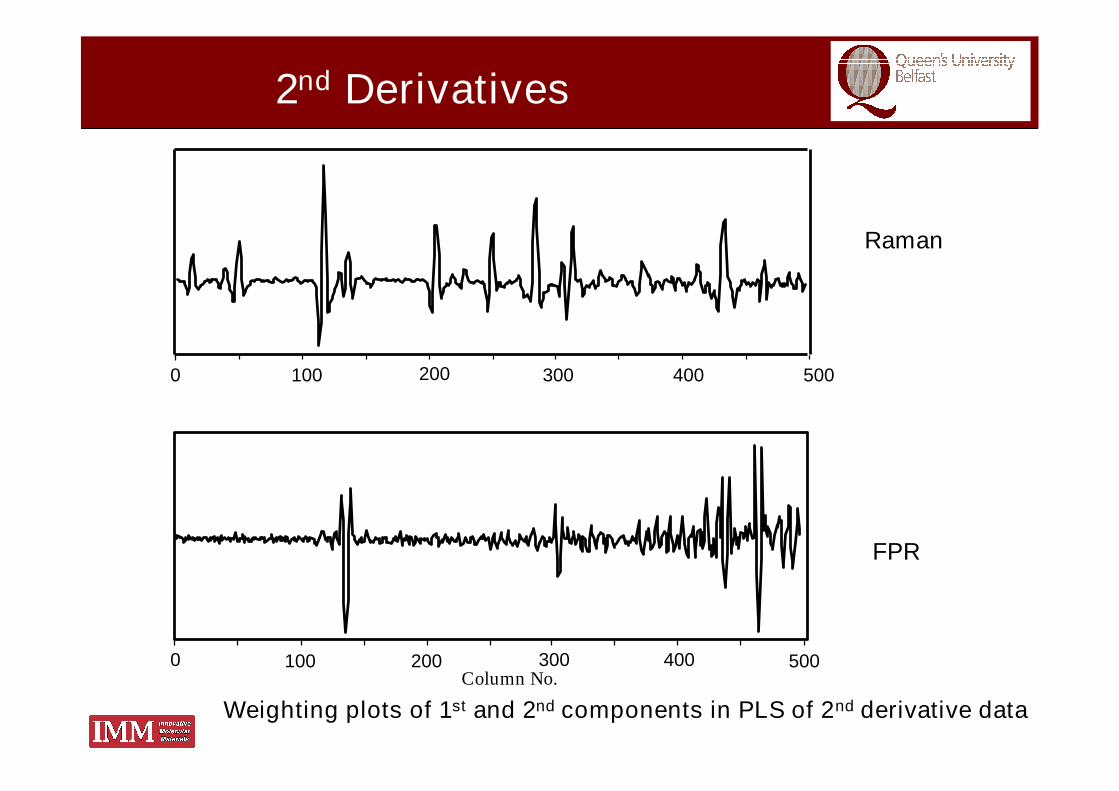
0 300100 200 400 500
Column No.100 200 300 400 5000
Weighting plots of 1st and 2nd components in PLS of 2nd derivative data
Raman
FPR
2nd Derivatives

PLS which includes the FPR as a component in themodel can work.
Predictions are good(standard error of prediction =0.66%)
BUT must keep the FPR the same and any change inexperimental conditions (change in fluorescenceprofile, wavelength recalibration during servicing)causes problems.
Alternative, is to remove the FPR before building themodel.
Enhanced Sensitivity

Strategy- correct for irregular response by recording pairs of spectra attwo slightly different grating positions and then subtracting them.
Wavenumber /cm-1
0
1x10⁷
2x10⁷
3x10⁷
4x10⁷
5x10⁷
3000 2500 2000 1500
3000 2800 27002900
Cou
nts
Shifted subtracted Raman (SSRS)

Obs
erve
d
84
86
88
90
92
94
96
98
100
84 85 86 87 88 89 90 91 92 93 94 95 96 97 98 99 100Predicted
Standards Conc1 Conc2 Conc3Shifted Coumarin
0 200 400 600 800 1000Column Number
SEP < 0.5% evenSEP < 0.5% evenwith different dyewith different dyebackgroundsbackgrounds
Shifted subtracted Raman (SSRS)

Fatty acid methyl esters FAMEs
• Used as modelcompounds forunderstanding chemicaland physical propertiesof triglycerides in ediblefats and oils.
• Affect melting/softeningtemperatures of spreadingfats.
• Nutritional values –saturation, CLAs.
• Storage
O
O
CH2
CH2
CH2
Important properties;(a) length of alkyl chain.(b) number of double
bonds in alkyl chain.
O
O
O
O
O
O

Mass Unsaturation(C=C bonds per CH2)
0
1
2
3
4
5
0 0.1 0.2
Ram
an(C
=C
)/(C
H2)
0.3
Systematic changesin intensity of C=C band withincreasing unsaturation.
950 1150 1350 1550 1750
18:3c
18:0
18:1c
18:1t
18:2c
C=C
C=C
C=
OC
=OC
HC
H22
CH
CH
22
DFT on FamesFames Expt. Data
Wavenumber /cm-1
Note careful definition ofunsaturation- correlation withiodine value is non-linear.

Addition of CH2 groups does not givesimple incremental changes in spectra.
Some spectra appear to have more bandsthan expected, or bands that do not followthe smooth trends.
-vibrational bands do not arise fromisolated motions of individual CH2 units.
2:0
4:0
7:0
8:0
10:0
20:0
Wavenumber/cm-1200 400 600 800 1000 1200 1400 1600 1800
Fames Expt. Data

800 1000 1200 1400 1600 1800Raman Shift / cm-1
Ram
anIn
tens
ity
Beef
Lamb
Pork
Chicken
1.1901.97720 C unsat
0.10.1320:0
0.090.1818:3c Δ6,9,12
0.931.7118:3c Δ9,12,15
1.131.2518:2t Δ9,12
10.9911.1818:2c Δ9,12
1.561.37118:1t
5.4838.6118:1c Δ9
3.7810.4618:0
0.360.4717:1c Δ10
0.50.6817:0
2.034.5116:1c Δ9
4.0825.316:0
0.480.515:0
0.740.7114:1c Δ9
1.662.5514:0
Triglycerides - Adipose
4 species, various breeds etc gives samples with a range of fatty acid profiles

3562.544.011.62.010.97312.617.3PUFA
8733.8117.791.44.660.4996.575.1Cis/Trans
3730.02017.982.70.0220.5160.030.026Trans Unsaturation
3730.0414.76.20.0450.9650.240.73Cis Unsaturation
3730.0334.65.40.0410.9650.220.76Unsaturation
3730.03716.30.30.0460.5750.0715.51Saturation
3730.0546.90.40.0630.9220.2317.3Chain Length
No.FactorsSamplesRMSEE
RMSEP(% 4)
RMSEP(% s)RMSEPR2Mean
Triglycerides - Adipose
Prediction of bulk properties
Good prediction of chain length & unsaturation-saturation poor (low range).
PUFA important due to perceived health benefits.

Measured / % of total fatty acid
Pre
dic
ted
/%o
ftot
alfa
tty
acid
0
5
10
15
20
25
30
35
40
0 5 10 15 20 25 30 3525
30
35
40
45
50
25 30 35 40 45 50
PorkChicken
BeefLamb
18:1c Δ9 18:2c Δ9,12
Triglycerides - Adipose
2.0580.96510.9911.1818:2c Δ9,12
2.4760.7965.4838.6118:1c Δ9
RMSEPR2Mean
14.9026.552.181.03
45.0532.7039.3737.53
ChickenPorkBeefLamb

5540.458.219.80.3920.8901.1901.97720 C unsat
4540.02913.842.50.0550.7190.10.1320:0
6540.03014.729.70.0530.5930.090.1818:3c Δ6,9,12
3540.2057.616.60.2840.9320.931.7118:3c Δ9,12,15
3380.59715.957.50.7190.6131.131.2518:2t Δ9,12
3722.2784.718.42.0580.96510.9911.1818:2c Δ9,12
4630.84313.059.10.810.7521.561.37118:1t
2721.84211.36.42.4760.7965.4838.6118:1c Δ9
3721.4038.3121.2570.893.7810.4618:0
5540.05414.343.90.2060.70.360.4717:1c Δ10
37250.15010.530.80.210.8190.50.6817:0
3720.6849.917.80.8040.8342.034.5116:1c Δ9
17251.3628.05.21.3040.8924.0825.316:0
4720.06310.540.30.2020.8230.480.515:0
4530.41617.572.70.5170.4720.740.7114:1c Δ9
4720.49411.329.50.7510.7931.662.5514:0
No.Factors
SamplesRMSEE
RMSEP(% 4)
RMSEP(% s)
RMSEPR2Mean
Triglycerides (II) - Adipose
Cross-correlation ?

16:0
14:1c 917:0
15:0
18:3c 6,9,1216:1c 9
18:2c9,12 20:xa
0.2-0.4 -0.2 0.4
18:3c9,12,15
20:xc
20:xb20:0 18:0
14:017:1c
18:1t
18:2t9,12
18:1c 9
t [1]
0
-0.4
-0.2
0.2
0.4
0.6
t[2]
Group 1Group 2Group 3Group 4Group 5
3731.627.312.21.310.88418.010.77Group 5
7730.429.023.80.300.9253.41.27Group 4
2731.9615.831.62.000.92612.66.35Group 3
7733.769.56.32.700.86128.442.94Group 2
3732.325.916.62.070.97134.812.46Group 1
No.Factors
SamplesRMSEE
RMSEP(% 4)
RMSEP(% s)RMSEPR2Mean
Separation intogroups by PCA.
Prediction of Groupsby PLS1 allows cross-correlation to beexplicitly included.
Triglycerides (II) - Adipose

t[3]
t[2]
ChickenPork
BeefLamb
10000-10000 0
10000
5000
0
-5000
-10000
PLSDA scatter plot showing the discrimination of adiposespecies by multivariate analysis of Raman spectra800 1000 1200 1400 1600 1800
Raman Shift / cm-1
Ram
anIn
ten
sity
Beef
Lamb
Pork
Chicken
Adipose Tissue –Speciation
Model built with 102 samples, tested on 153 independent samples.
PLSDA > 99% correct classification of species in the test set (1 error)
JR Beattie, SEJ Bell, C Borgaard, A Fearon, BW Moss: Classification of AdiposeTissue Species using Raman Spectroscopy . Lipids 42 (2007) 679-685.

Conclusions & Acknowledgements• Raman methods have great potential for non-contact characterisation of abroad range of sample types.
With simple samples multivariate methods can be used to detectunexpected variance. This can then be designed-out or interpreted.
• For complex multicomponent samples the richness of the data allowsquantitation of individual constituents even in extremely complex spectra.
Acknowledgements
£££££’sE.P.S.R.C., Royal Society of Chemistry, RoyalSociety, F.S.N.I, Avalon Instruments Ltd, E.U.,D.E.N.I., D.A.R.D., I.N.I., Andor Technology Ltd
Rene BeattieRoma OakesN.M.S. SirimuthuJulien VillaumieLindsay BarrettLouise FidoIain Larmour
Bruce MossAnne FearonLinda FarmerJim SpeersLaota PetersKarl MalcolmDavid WolfsonKlaus Borgaard