Embed Size (px)
Citation preview
Int. J. Electrochem. Sci., 8 (2013) 3851 - 3865
International Journal of
ELECTROCHEMICAL SCIENCE
www.electrochemsci.org
Chemical Speciation Measurements of Silver Ions in Alkaline
Carbonate Electrolytes Using Differential Pulse Stripping
Voltammetry on Glassy Carbon Compared With Ion Selective
Electrode Measurements
Troy A. Lowe1,2
, Jonas Hedberg1, Maria Lundin
1,2, Susanna Wold
1 and Inger Odnevall Wallinder
*,1
1 KTH Royal Institute of Technology, School of Chemical Science and Technology, Surface and
Corrosion Science, SE-100 44 Stockholm, Sweden 2
KTH Royal Institute of Technology, School of Chemical Science and Technology, Applied Physical
Chemistry, SE-100 44 Stockholm, Sweden *E-mail: [email protected]
Received: 19 December 2012 / Accepted: 22 January 2013 / Published: 1 March 2013
Given the increasing incorporation of silver nanoparticles as an antibacterial additive in washing
machines and textiles, sensitive methods for accurate determination of Ag+ ions in laundry relevant
electrolytes (alkaline carbonate) are required. The most widely reported method, the silver ion
selective electrode (ISE), lacked sensitivity and accuracy and was affected by the concentration of
Na2CO3 in solution. Differential pulse stripping voltammetry (DPSV) on glassy carbon electrodes
(GCE) was therefore investigated as an alternative technique. Surface preparation of the GCE surface
was essential and a suitable procedure was developed. A linear response was observed from 0 to 180
mg L-1
with a lower detection limit of 500 ng L-1
(5 nM). DPSV was shown to be significantly more
sensitive and accurate in determining the Ag+ activity than the silver ISE technique, particularly below
200 nM.
Keywords: Silver ion; alkaline electrolytes; laundry solutions; differential pulse stripping
voltammetry; ion selective electrode
1. INTRODUCTION
Silver nanoparticles (Ag NPs) have recently emerged as attractive antimicrobial additive for
incorporation into a range of consumer products. Currently there are 313 products listed by the Project
on Emerging Nanotechnologies (PEN) as containing Ag NPs, by far the largest number for
commercially used nanomaterial.[1] The increasing incorporation of Ag NPs into such products will
inevitably result in environmental and human exposure. To assess potential risks, the chemical
Int. J. Electrochem. Sci., Vol. 8, 2013
3852
speciation of the released silver from these products and its interaction in different environments needs
to be established from a fundamental perspective.[2]
One of the largest applications of Ag NPs is their incorporation into textiles for the medical
industry and consumer clothing, such as sportswear and socks, to inhibit the growth of bacteria.
Commercially available, silver impregnated socks have been shown to release silver in both ionic and
colloidal forms in distilled water and simulated washing conditions.[3-5] The chemical speciation of
the released silver is particularly relevant given that the microbial toxicity of silver appears to be due to
the ion, rather than the metallic or complexed states.[6, 7] Thus, the accurate determination of non-
complexed silver ions in laundry solutions is necessary.
Determination of the total silver content is straight forward using traditional analytical tools
such as atomic adsorption spectroscopy or inductively coupled plasma. However measuring the
concentration of Ag+ ions in solution is more challenging. Reported studies investigating the release of
silver from textiles have used the silver ion selective electrode (ISE) as the preferred method to
determine the concentration of Ag+ ions.[3, 5] Work by Geranio et al. show that in conditions
representative of washing (pH 10, carbonate electrolyte), the amount of ionic silver released from
commercial textiles after two hours was below the detection limit of the ISE (10-7
M, 10.8 µg L-1
),
unless an oxidant was added to increase the Ag+ ion concentration.[5] Work by Benn et al. in distilled
water showed that the concentration of ionic silver released from textiles ranged from below detection
limit of the ISE up to 1 x 10⁻⁵
M.[3] Both authors postulate that in the presence of complexing agents
and surfactants present in laundry detergent formulations, the activity of Ag+ ions would likely be
lower. These publications and the reported unreliability of ISEs in solutions with little silver buffering
capacity[8] encourage use of a method that offers more sensitive and reproducible determination of the
Ag+ ion concentration in alkaline environments.
An alternative method to the ISE that offers a more sensitive response to changes in silver ion
concentration and a lower detection limit is differential pulse stripping voltammetry (DPSV). Using
DPSV, a detection limit as low as 2.5 pM (27 ng L-1
) has been reported under favourable
conditions.[9] Determination of trace levels of Ag+ ions using DPSV has been reported for neutral
solutions of low ionic strength, such as surface waters. However, in these cases measurements were
made in an acidic, buffered electrolyte of high ionic strength.[8-11] While such an electrolyte reduces
the Ohmic drop and provides a stable pH,[12] which are required for analysis, the chemical speciation
may be altered and an erroneous silver ion activity estimated.
Ideally, DPSV measurement of silver in laundry solutions should be performed in a carbonate
electrolyte buffered around pH 10, without supporting electrolyte. Surprisingly, there have been no
reports to the best knowledge of the authors detailing the use of DPSV for the determination of silver
in alkaline, carbonate electrolytes.
In this work, the method of differential pulse stripping voltammetry using glassy carbon
electrodes was investigated to enable accurate analysis in solutions analogous to a laundry formulation,
namely, alkaline electrolytes buffered to pH 10 with carbonate.[13] The variation in electrochemical
response inherent in commercially supplied glassy carbon electrodes was quantified and a suitable
surface preparation technique was identified and reported. The effect of Na2CO3 concentration on the
Int. J. Electrochem. Sci., Vol. 8, 2013
3853
response to Ag+ was quantified and the results were compared with corresponding measurements from
an Ag+ ISE.
2. MATERIALS AND METHODS
DPSV measurements were conducted using an integrated system (797 VA Computrace,
Metrohm, Sweden) employing a three electrode cell consisting of a 2 mm diameter glassy carbon
working electrode (GCE) on a rotating stand (Metrohm, Sweden), a platinum counter electrode and 3
M KCl Ag|AgCl reference electrode with 2 M KNO3 used as a bridging electrolyte. All potentials
reported in the text are given versus this reference. The surface of the GCE was prepared by polishing
on clean alumina (0.3 μm, Struers, Sweden), washing with water and drying gently with tissue.
Electrochemical preparation of the GCE surface involved cyclic voltammetry (CV) of the
electrode from +0.5 V to -2.20 V at 1.0 V s-1
in 0.025 M Na2CO3 electrolyte adjusted to pH 10.0 ±
0.05. Cathodic current densities at the peak potential during this preparation were 1.0 to 5.0 mA cm-2
.
Electrodes were stored in 0.025 M Na2CO3 at pH 10 overnight before use.
DPSV measurements were conducted using an electrolyte volume of 10 mL that was de-aerated
for 3 minutes by bubbling with argon prior to each measurement. The oxygen reduction reaction was
used to confirm that the de-aeration time was suitable. The pH was buffered using 0.025 M Na2CO3
adjusted with nitric acid (13%) to pH 10. Na2CO3 was used as a buffering agent given its ubiquitous
use in laundry formulations.[13] The electrode was held at +0.45 V for 60 s prior to measurement to
remove any silver on the surface. Deposition was conducted at -0.40 V for 120 s while the electrode
was rotated at 2000 rpm. Stripping was conducted on a stationary electrode by sweeping the potential
from 0.00 V to +0.50 V at 0.040 V s-1
using a voltage step of 0.004 V. A differential pulse was applied
with an amplitude of 0.050 V and a width of 0.040 s. The total measurement time was 380 s from start
of de-aeration to the end of stripping. The 2 mm diameter glassy carbon electrodes were purchased
from Metrohm (Sweden) whose production numbers were 10705999, 10706048, 00791592, 01095155
and 01095187. Current densities were calculated using the GCE area (0.031 cm2). These values for
deposition potential, sweep rate, voltage step and pulse amplitude and width were chosen varying them
to optimise the peak height and signal to noise. 120 s deposition represents a compromise between
practical measurement time and a low detection limit.
A silver ion selective electrode (Metrohm, Sweden) was used with a low flow double junction
3 M KCl Ag|AgCl reference (Metrohm, Sweden) with 2 M KNO3 as a bridging electrolyte. Potentials
were measured using a high impedance ion meter (713 pH meter, Metrohm, Sweden) and the solution
was stirred continuously during measurement. Measurements were conducted until the drift was below
1.0 mV min-1
. The silver ISE was gently polished using 0.3 µm Al2O3 powder and prior to use, soaked
in 2000 ng silver/10 mL with 0.1 M KNO3 solution. Calibration was performed in 0.1 M KNO3 and
0.025 M Na2CO3. Using this electrolyte, the ionic strength was essentially constant when adding Ag
ions, thus avoiding possible effects of changes in Ag activity.
Int. J. Electrochem. Sci., Vol. 8, 2013
3854
3. RESULTS AND DISCUSSION
3.1 Elaboration of a reproducible surface preparation method for DPSV measurement of silver
on glassy carbon
Glassy carbon was used as the working electrode material on account of its large potential
range in the positive direction, favourably slow hydrogen evolution kinetics and commercial
availability.[14] However, anodic stripping of silver has been reported to exhibit poor reproducibility
on glassy carbon[14-16] and surface preparation is a critical step for successful results.[17, 18]
A number of surface preparation treatments were tested in this study including mechanical
grinding, polishing, soaking in acidic and alkaline electrolytes, electrochemical oxidation,
electrochemical reduction and variations of electrochemical cycling. To summarise these results, an
electrode polished on Al2O3 resulted in a baseline current of 2.0 to 5.0 μA cm-2
, a detection limit of 15
nM (1.6 μg L-1
) and a non-linear response. Similar, non-linear stripping behaviour has been reported
previously for otherwise unmodified GCEs.[11, 14] Mechanical grinding with SiC resulted in slightly
increased capacitive background current (5.0 μA cm-2
), a lower detection limit (12 nM) and a non-
linear response. Polishing followed by electrochemical oxidation resulted in increased background
current (that increased with increasing oxidation), a significantly higher detection limit, extra peaks in
the voltammogram and a non-linear response. Soaking in acidic or basic electrolyte had no significant
effect on the electrode response to DPSV of silver.
Best results, in terms of a linear electrode response, a low detection limit (4 nM), a low
capacitive background current (2.5 μA cm-2
) and good temporal stability of the electrode (1-2 weeks),
were achieved with a combination of polishing on Al2O3 and subsequent electrochemical reduction of
the surface using CV (cycling +0.5 V to -2.3 V at 1.0 V s-1
for 5 cycles, ending at +0.5 V) in 0.25 M
Na2CO3 adjusted to pH 10 with HNO3. A voltammogram of the last cycle of surface preparation is
shown in Figure 1.
The negative potential limit for the surface preparation was selected based on the magnitude of
the current density and satisfactory results were only obtained for values between 1.0 and 5.0 mA cm-2
.
At lower or higher values and the DPSV response to Ag+ became increasingly non-linear. Furthermore,
using more than 5 cycles inhibited the DPSV sensitivity.
It should be noted that the electrochemical reduction technique described above was not only
applicable for measurements at pH 10 but was also effective in electrolytes ranging from pH <1 to pH
10 (data not shown), provided that the negative potential limit was adjusted to produce the same
current density (due to the enhanced rate of hydrogen evolution in acidic solutions).
The reason that electrochemical reduction and hydrogen evolution on the surface improves the
electrode response was not clear. It has been proposed that mechanical polishing of glassy carbon on
alumina produces carbon radicals on the electrode surface, which form hydroxyl groups and C-O
functional groups such as carboxyls and carbonyl.[19]
Int. J. Electrochem. Sci., Vol. 8, 2013
3855
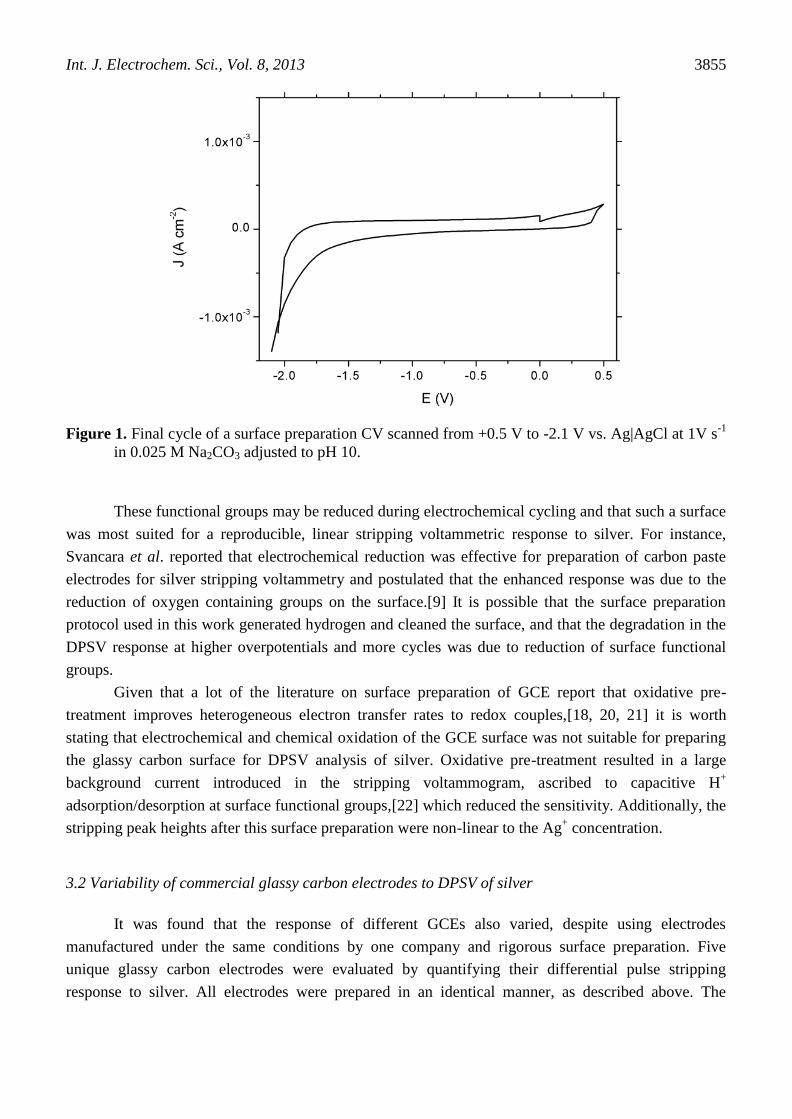
Figure 1. Final cycle of a surface preparation CV scanned from +0.5 V to -2.1 V vs. Ag|AgCl at 1V s-1
in 0.025 M Na2CO3 adjusted to pH 10.
These functional groups may be reduced during electrochemical cycling and that such a surface
was most suited for a reproducible, linear stripping voltammetric response to silver. For instance,
Svancara et al. reported that electrochemical reduction was effective for preparation of carbon paste
electrodes for silver stripping voltammetry and postulated that the enhanced response was due to the
reduction of oxygen containing groups on the surface.[9] It is possible that the surface preparation
protocol used in this work generated hydrogen and cleaned the surface, and that the degradation in the
DPSV response at higher overpotentials and more cycles was due to reduction of surface functional
groups.
Given that a lot of the literature on surface preparation of GCE report that oxidative pre-
treatment improves heterogeneous electron transfer rates to redox couples,[18, 20, 21] it is worth
stating that electrochemical and chemical oxidation of the GCE surface was not suitable for preparing
the glassy carbon surface for DPSV analysis of silver. Oxidative pre-treatment resulted in a large
background current introduced in the stripping voltammogram, ascribed to capacitive H+
adsorption/desorption at surface functional groups,[22] which reduced the sensitivity. Additionally, the
stripping peak heights after this surface preparation were non-linear to the Ag+ concentration.
3.2 Variability of commercial glassy carbon electrodes to DPSV of silver
It was found that the response of different GCEs also varied, despite using electrodes
manufactured under the same conditions by one company and rigorous surface preparation. Five
unique glassy carbon electrodes were evaluated by quantifying their differential pulse stripping
response to silver. All electrodes were prepared in an identical manner, as described above. The
Int. J. Electrochem. Sci., Vol. 8, 2013
3856
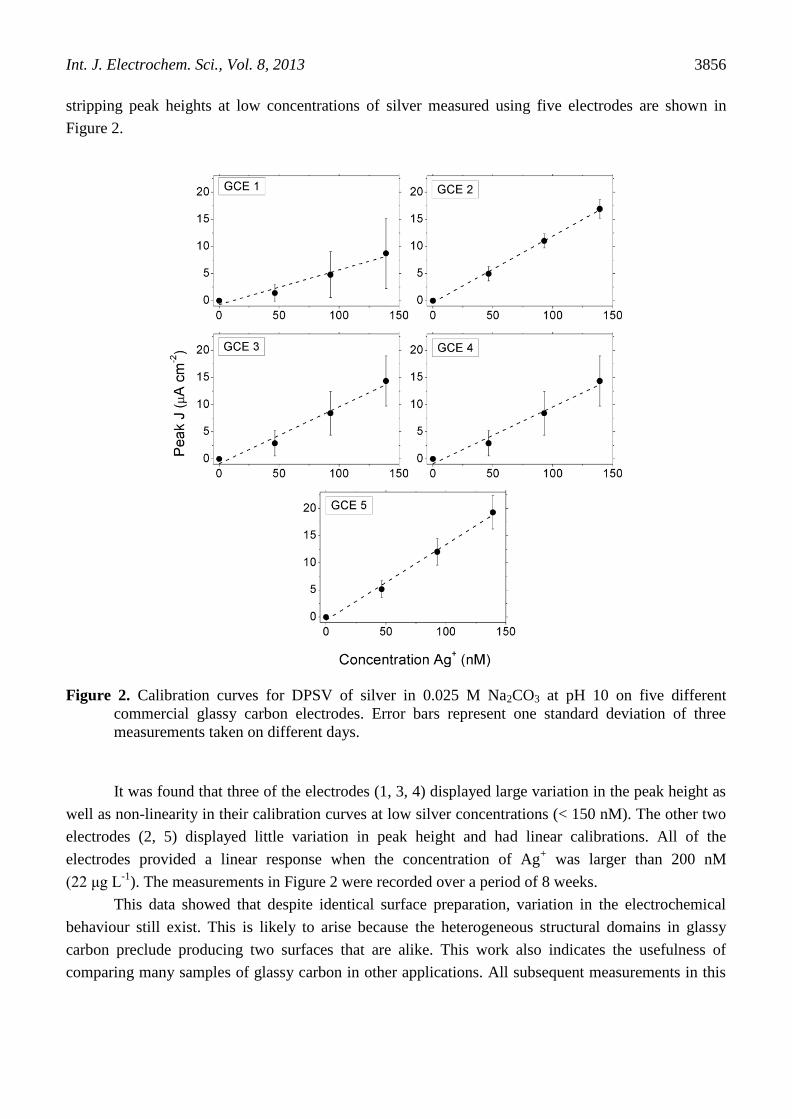
stripping peak heights at low concentrations of silver measured using five electrodes are shown in
Figure 2.
Figure 2. Calibration curves for DPSV of silver in 0.025 M Na2CO3 at pH 10 on five different
commercial glassy carbon electrodes. Error bars represent one standard deviation of three
measurements taken on different days.
It was found that three of the electrodes (1, 3, 4) displayed large variation in the peak height as
well as non-linearity in their calibration curves at low silver concentrations (< 150 nM). The other two
electrodes (2, 5) displayed little variation in peak height and had linear calibrations. All of the
electrodes provided a linear response when the concentration of Ag+ was larger than 200 nM
(22 μg L-1
). The measurements in Figure 2 were recorded over a period of 8 weeks.
This data showed that despite identical surface preparation, variation in the electrochemical
behaviour still exist. This is likely to arise because the heterogeneous structural domains in glassy
carbon preclude producing two surfaces that are alike. This work also indicates the usefulness of
comparing many samples of glassy carbon in other applications. All subsequent measurements in this
Int. J. Electrochem. Sci., Vol. 8, 2013
3857
study were conducted using the electrodes displaying reproducible and linear calibration with low
amounts of silver (electrodes 2 and 5).
3.3 Calibration concentration range and stripping behaviour
Differential pulse stripping voltammograms were recorded in 0.025 M Na2CO3 electrolytes
containing from 5 nM to 2500 nM Ag+. The voltammograms showed asymmetric stripping peaks, with
a long tail at the negative potential side and sharp drop off on the positive side. Some of the
voltammograms from the calibration are shown in Figure 3 and it was found that 5 nM was the
practical detection limit without increasing the deposition time (120 s). The stripping peak shifted to
more positive potentials with increasing silver concentration.
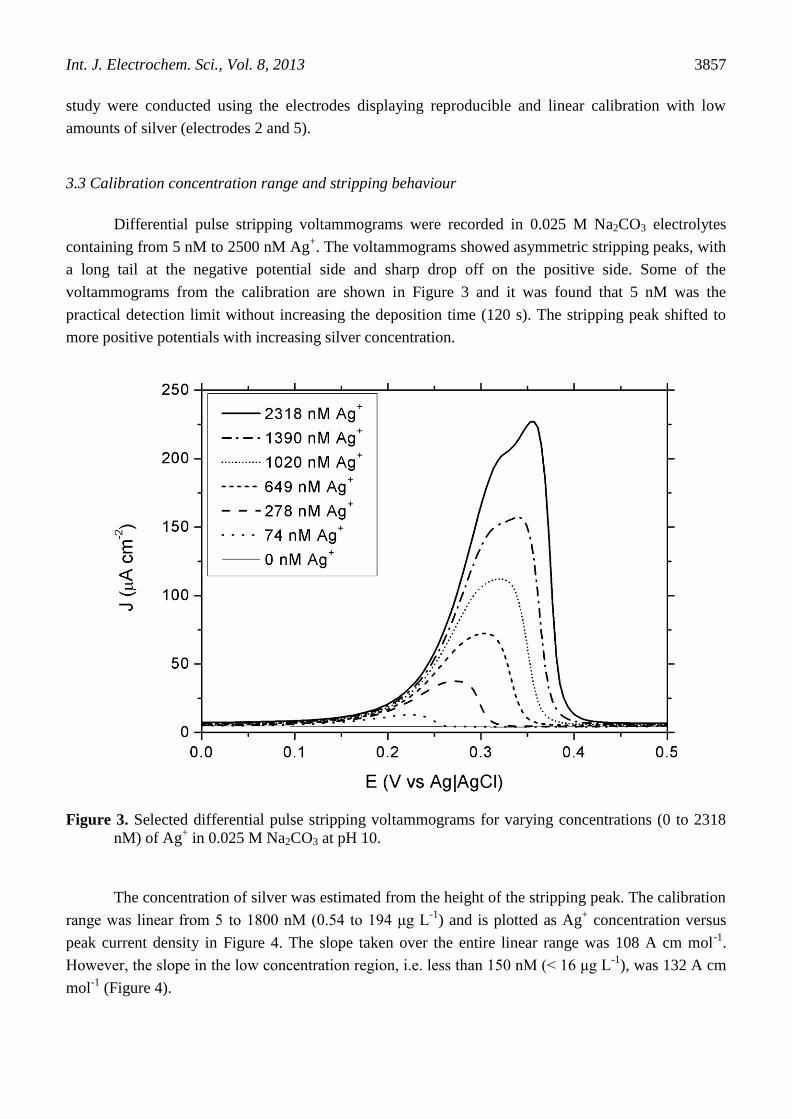
Figure 3. Selected differential pulse stripping voltammograms for varying concentrations (0 to 2318
nM) of Ag+ in 0.025 M Na2CO3 at pH 10.
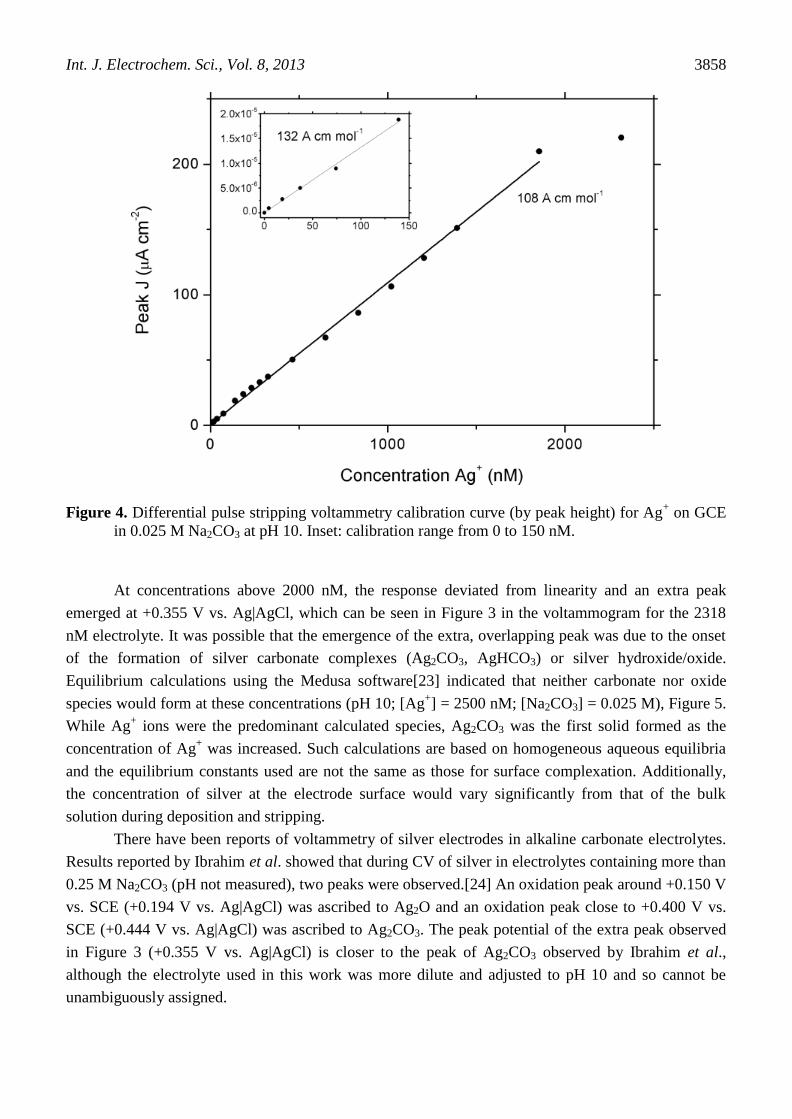
The concentration of silver was estimated from the height of the stripping peak. The calibration
range was linear from 5 to 1800 nM (0.54 to 194 μg L-1
) and is plotted as Ag+ concentration versus
peak current density in Figure 4. The slope taken over the entire linear range was 108 A cm mol-1
.
However, the slope in the low concentration region, i.e. less than 150 nM (< 16 μg L-1
), was 132 A cm
mol-1
(Figure 4).
Int. J. Electrochem. Sci., Vol. 8, 2013
3858
Figure 4. Differential pulse stripping voltammetry calibration curve (by peak height) for Ag+ on GCE
in 0.025 M Na2CO3 at pH 10. Inset: calibration range from 0 to 150 nM.
At concentrations above 2000 nM, the response deviated from linearity and an extra peak
emerged at +0.355 V vs. Ag|AgCl, which can be seen in Figure 3 in the voltammogram for the 2318
nM electrolyte. It was possible that the emergence of the extra, overlapping peak was due to the onset
of the formation of silver carbonate complexes (Ag2CO3, AgHCO3) or silver hydroxide/oxide.
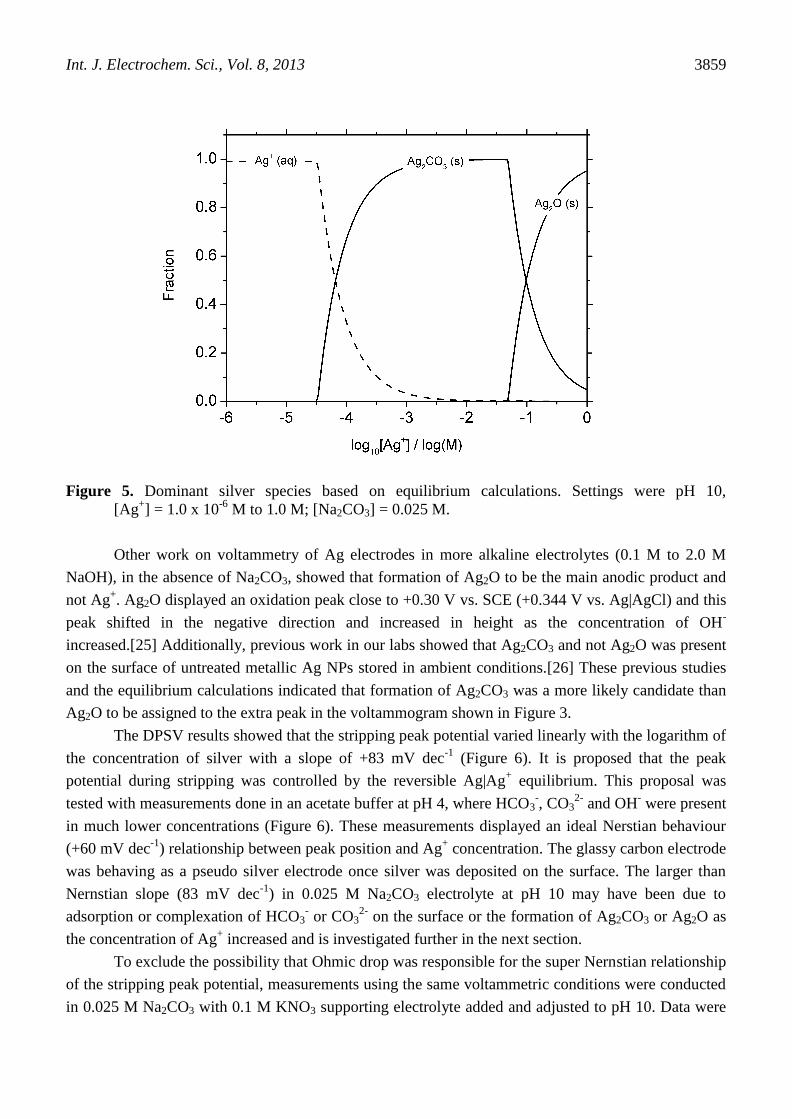
Equilibrium calculations using the Medusa software[23] indicated that neither carbonate nor oxide
species would form at these concentrations (pH 10; [Ag+] = 2500 nM; [Na2CO3] = 0.025 M), Figure 5.
While Ag+ ions were the predominant calculated species, Ag2CO3 was the first solid formed as the
concentration of Ag+ was increased. Such calculations are based on homogeneous aqueous equilibria
and the equilibrium constants used are not the same as those for surface complexation. Additionally,
the concentration of silver at the electrode surface would vary significantly from that of the bulk
solution during deposition and stripping.
There have been reports of voltammetry of silver electrodes in alkaline carbonate electrolytes.
Results reported by Ibrahim et al. showed that during CV of silver in electrolytes containing more than
0.25 M Na2CO3 (pH not measured), two peaks were observed.[24] An oxidation peak around +0.150 V
vs. SCE (+0.194 V vs. Ag|AgCl) was ascribed to Ag2O and an oxidation peak close to +0.400 V vs.
SCE (+0.444 V vs. Ag|AgCl) was ascribed to Ag2CO3. The peak potential of the extra peak observed
in Figure 3 (+0.355 V vs. Ag|AgCl) is closer to the peak of Ag2CO3 observed by Ibrahim et al.,
although the electrolyte used in this work was more dilute and adjusted to pH 10 and so cannot be
unambiguously assigned.
Int. J. Electrochem. Sci., Vol. 8, 2013
3859
Figure 5. Dominant silver species based on equilibrium calculations. Settings were pH 10,
[Ag+] = 1.0 x 10
-6 M to 1.0 M; [Na2CO3] = 0.025 M.
Other work on voltammetry of Ag electrodes in more alkaline electrolytes (0.1 M to 2.0 M
NaOH), in the absence of Na2CO3, showed that formation of Ag2O to be the main anodic product and
not Ag+. Ag2O displayed an oxidation peak close to +0.30 V vs. SCE (+0.344 V vs. Ag|AgCl) and this
peak shifted in the negative direction and increased in height as the concentration of OH-
increased.[25] Additionally, previous work in our labs showed that Ag2CO3 and not Ag2O was present
on the surface of untreated metallic Ag NPs stored in ambient conditions.[26] These previous studies
and the equilibrium calculations indicated that formation of Ag2CO3 was a more likely candidate than
Ag2O to be assigned to the extra peak in the voltammogram shown in Figure 3.
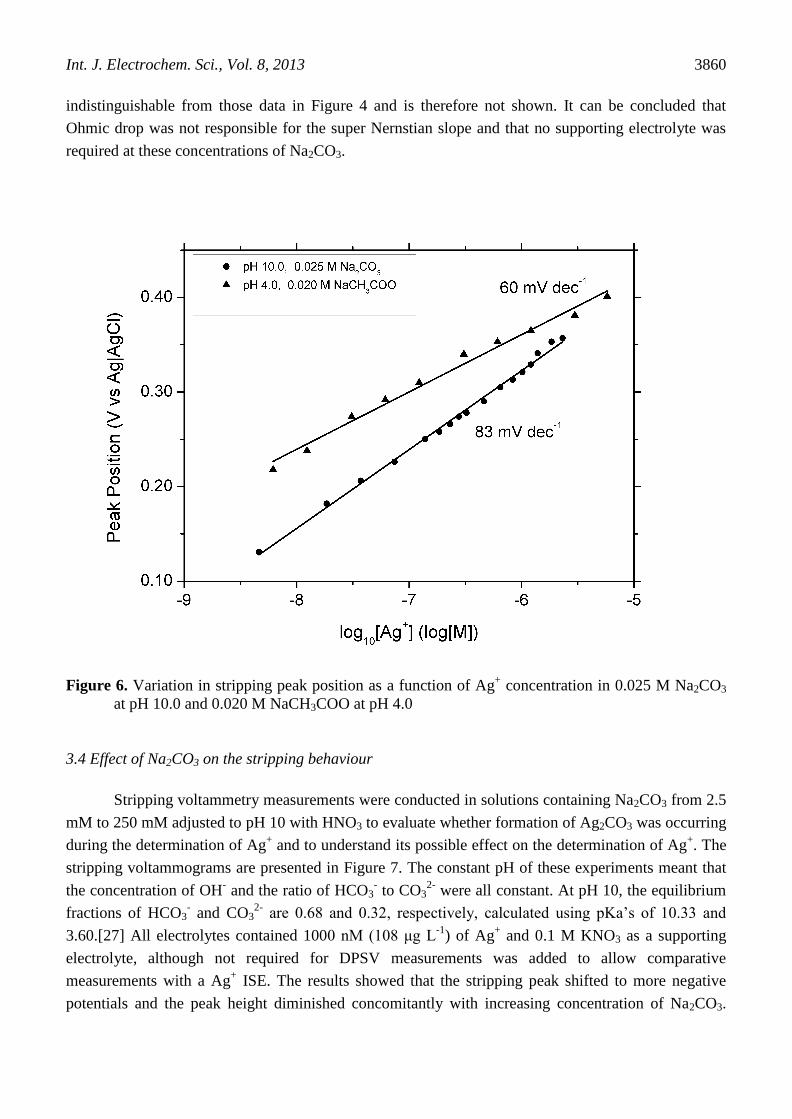
The DPSV results showed that the stripping peak potential varied linearly with the logarithm of
the concentration of silver with a slope of +83 mV dec-1
(Figure 6). It is proposed that the peak
potential during stripping was controlled by the reversible Ag|Ag+ equilibrium. This proposal was
tested with measurements done in an acetate buffer at pH 4, where HCO3-, CO3
2- and OH
- were present
in much lower concentrations (Figure 6). These measurements displayed an ideal Nerstian behaviour
(+60 mV dec-1
) relationship between peak position and Ag+ concentration. The glassy carbon electrode
was behaving as a pseudo silver electrode once silver was deposited on the surface. The larger than
Nernstian slope (83 mV dec-1
) in 0.025 M Na2CO3 electrolyte at pH 10 may have been due to
adsorption or complexation of HCO3- or CO3
2- on the surface or the formation of Ag2CO3 or Ag2O as
the concentration of Ag+ increased and is investigated further in the next section.
To exclude the possibility that Ohmic drop was responsible for the super Nernstian relationship
of the stripping peak potential, measurements using the same voltammetric conditions were conducted
in 0.025 M Na2CO3 with 0.1 M KNO3 supporting electrolyte added and adjusted to pH 10. Data were
Int. J. Electrochem. Sci., Vol. 8, 2013
3860
indistinguishable from those data in Figure 4 and is therefore not shown. It can be concluded that
Ohmic drop was not responsible for the super Nernstian slope and that no supporting electrolyte was
required at these concentrations of Na2CO3.
Figure 6. Variation in stripping peak position as a function of Ag+ concentration in 0.025 M Na2CO3
at pH 10.0 and 0.020 M NaCH3COO at pH 4.0
3.4 Effect of Na2CO3 on the stripping behaviour
Stripping voltammetry measurements were conducted in solutions containing Na2CO3 from 2.5
mM to 250 mM adjusted to pH 10 with HNO3 to evaluate whether formation of Ag2CO3 was occurring
during the determination of Ag+ and to understand its possible effect on the determination of Ag
+. The
stripping voltammograms are presented in Figure 7. The constant pH of these experiments meant that
the concentration of OH- and the ratio of HCO3
- to CO3
2- were all constant. At pH 10, the equilibrium
fractions of HCO3- and CO3
2- are 0.68 and 0.32, respectively, calculated using pKa’s of 10.33 and
3.60.[27] All electrolytes contained 1000 nM (108 μg L-1
) of Ag+ and 0.1 M KNO3 as a supporting
electrolyte, although not required for DPSV measurements was added to allow comparative
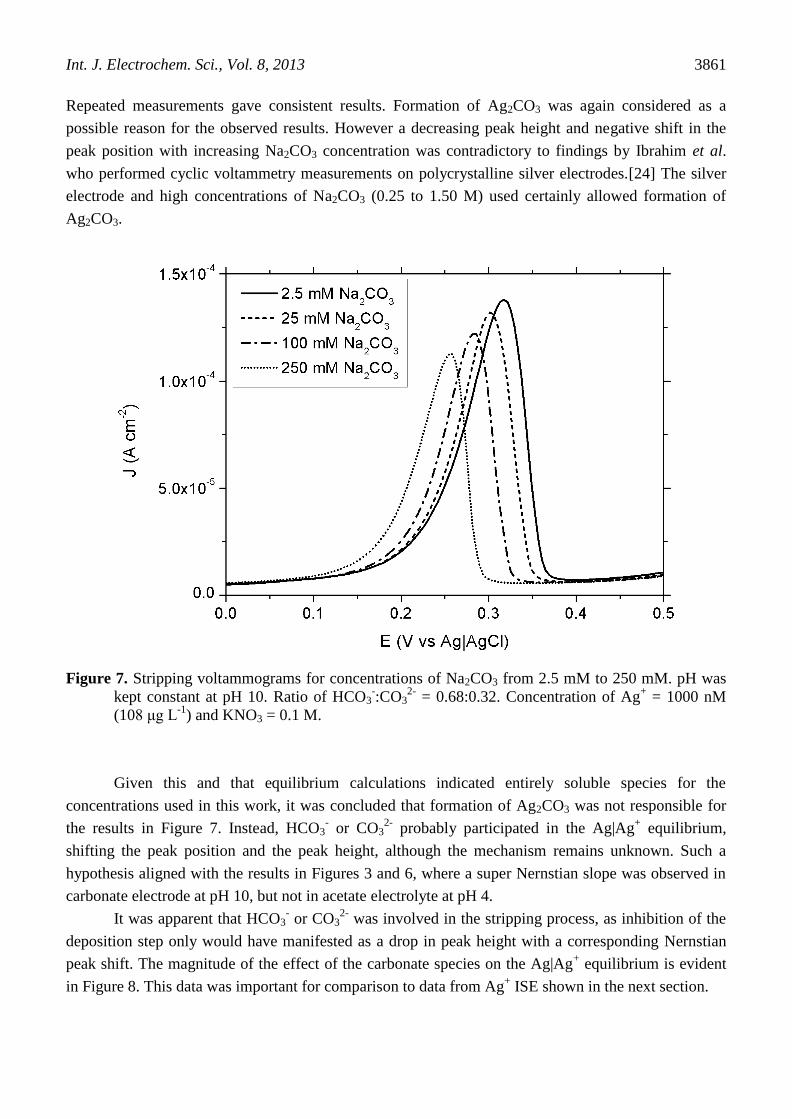
measurements with a Ag+ ISE. The results showed that the stripping peak shifted to more negative
potentials and the peak height diminished concomitantly with increasing concentration of Na2CO3.
Int. J. Electrochem. Sci., Vol. 8, 2013
3861
Repeated measurements gave consistent results. Formation of Ag2CO3 was again considered as a
possible reason for the observed results. However a decreasing peak height and negative shift in the
peak position with increasing Na2CO3 concentration was contradictory to findings by Ibrahim et al.
who performed cyclic voltammetry measurements on polycrystalline silver electrodes.[24] The silver
electrode and high concentrations of Na2CO3 (0.25 to 1.50 M) used certainly allowed formation of
Ag2CO3.
Figure 7. Stripping voltammograms for concentrations of Na2CO3 from 2.5 mM to 250 mM. pH was
kept constant at pH 10. Ratio of HCO3-:CO3
2- = 0.68:0.32. Concentration of Ag
+ = 1000 nM
(108 μg L-1
) and KNO3 = 0.1 M.
Given this and that equilibrium calculations indicated entirely soluble species for the
concentrations used in this work, it was concluded that formation of Ag2CO3 was not responsible for
the results in Figure 7. Instead, HCO3- or CO3
2- probably participated in the Ag|Ag
+ equilibrium,
shifting the peak position and the peak height, although the mechanism remains unknown. Such a
hypothesis aligned with the results in Figures 3 and 6, where a super Nernstian slope was observed in
carbonate electrode at pH 10, but not in acetate electrolyte at pH 4.
It was apparent that HCO3- or CO3
2- was involved in the stripping process, as inhibition of the
deposition step only would have manifested as a drop in peak height with a corresponding Nernstian
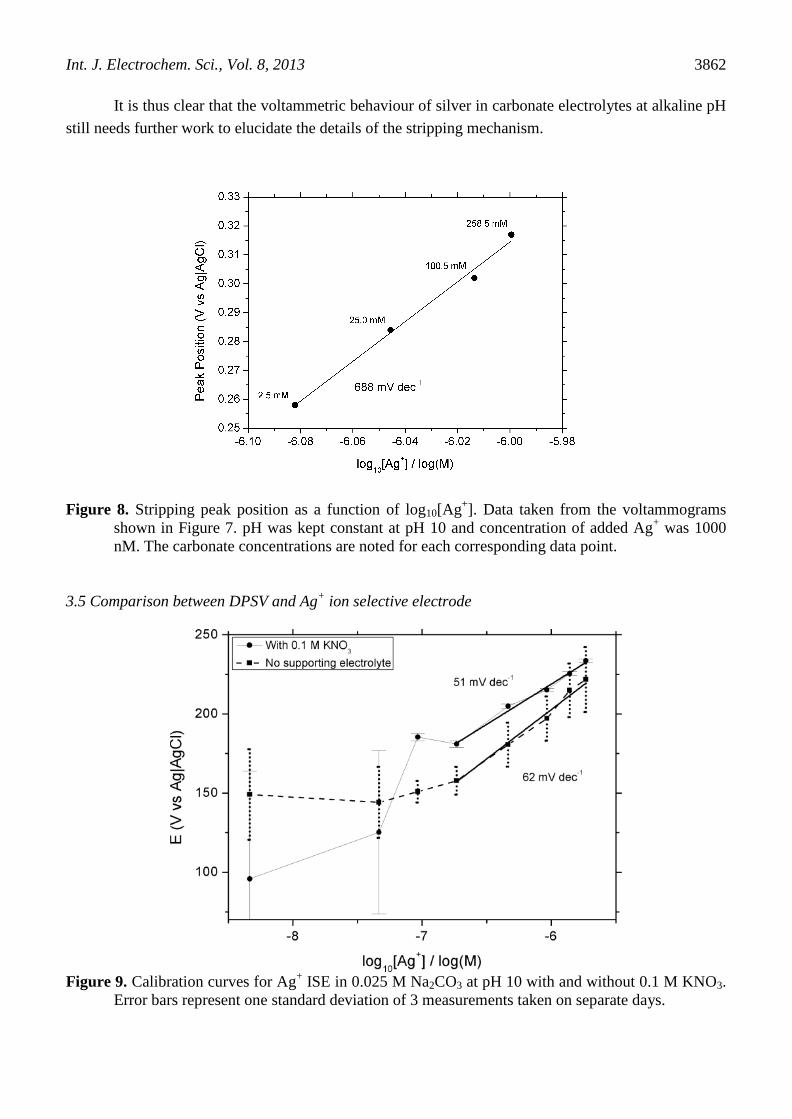
peak shift. The magnitude of the effect of the carbonate species on the Ag|Ag+ equilibrium is evident
in Figure 8. This data was important for comparison to data from Ag+ ISE shown in the next section.
Int. J. Electrochem. Sci., Vol. 8, 2013
3862
It is thus clear that the voltammetric behaviour of silver in carbonate electrolytes at alkaline pH
still needs further work to elucidate the details of the stripping mechanism.
Figure 8. Stripping peak position as a function of log10[Ag+]. Data taken from the voltammograms
shown in Figure 7. pH was kept constant at pH 10 and concentration of added Ag+ was 1000
nM. The carbonate concentrations are noted for each corresponding data point.
3.5 Comparison between DPSV and Ag+ ion selective electrode
Figure 9. Calibration curves for Ag
+ ISE in 0.025 M Na2CO3 at pH 10 with and without 0.1 M KNO3.
Error bars represent one standard deviation of 3 measurements taken on separate days.
Int. J. Electrochem. Sci., Vol. 8, 2013
3863
To compare the DPSV measurements to the most widely reported method, the Ag+ ISE, the
response of a Ag+ ISE to a range of Ag
+ ion concentrations was measured in 0.025 M Na2CO3
electrolyte at pH 10. Measurements were conducted with and without 0.1 M KNO3 (Figure 9), a
supporting electrolyte that is recommended by the manufacturer as an ionic strength adjustment buffer.
Some of this data has been included in our previous communication.[28]
The observed limit of detection of Ag+ in Na2CO3 at pH 10, with and without KNO3 added,
were consistent with the limit of detection of 10-7
M (108 μg L-1
) reported by the manufacturer
(Metrohm) for the Ag+ ISE. The data displayed a linear-log relationship down to 185 nM (20 μg L
-1).
A response time of minutes was observed for all data points below 1400 nM (151 μg L-1
). The KNO3
buffer did not improve the sensitivity or linearity of the electrode response, however it reduced the
deviation between measurements (Figure 9).
The effect of Na2CO3 on the ISE response was also examined. The ISE response was
determined in the same electrolytes used for the DPSV measurements presented in Figure 7. The
concentrations of Ag+ (determined using the calibration curve, (Figure 9) for the ISE compared with
the DPSV are shown in Figure 10(a). Some of the data showing the comparison of the Ag+ ISE and
DPSV techniques was included from our previous communication and is repeated here for
completeness.[28]
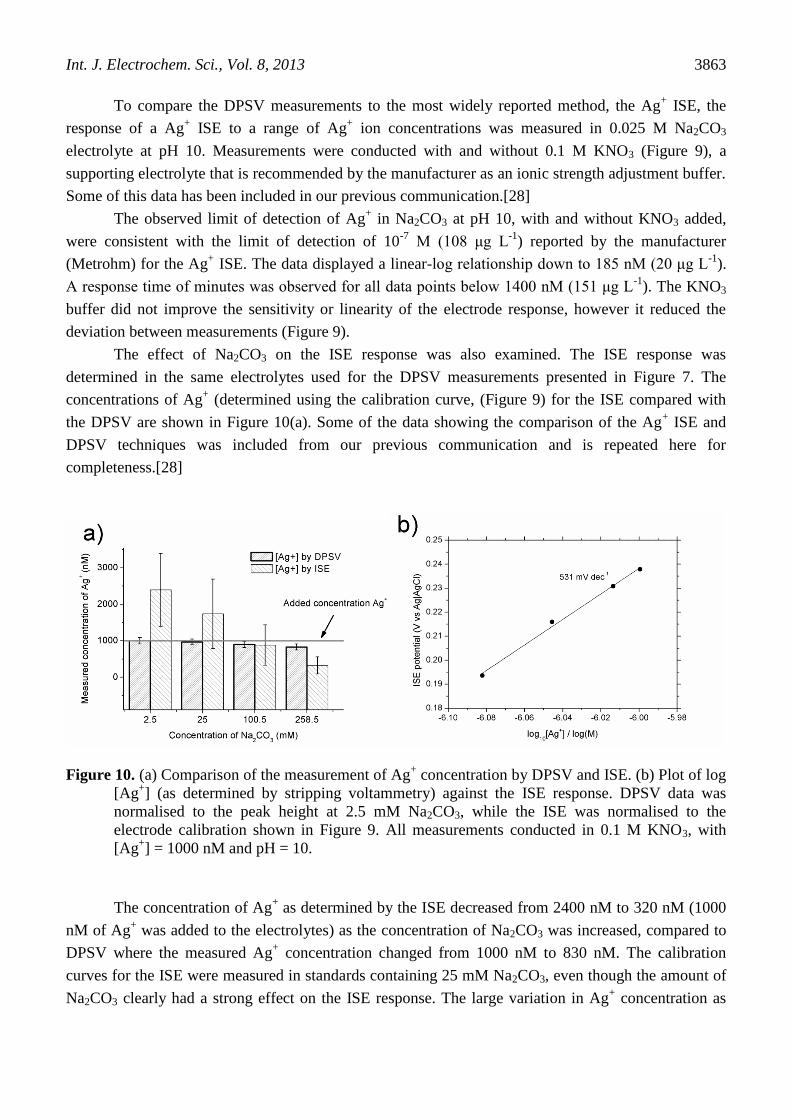
Figure 10. (a) Comparison of the measurement of Ag+ concentration by DPSV and ISE. (b) Plot of log
[Ag+] (as determined by stripping voltammetry) against the ISE response. DPSV data was
normalised to the peak height at 2.5 mM Na2CO3, while the ISE was normalised to the
electrode calibration shown in Figure 9. All measurements conducted in 0.1 M KNO3, with
[Ag+] = 1000 nM and pH = 10.
The concentration of Ag+ as determined by the ISE decreased from 2400 nM to 320 nM (1000
nM of Ag+ was added to the electrolytes) as the concentration of Na2CO3 was increased, compared to
DPSV where the measured Ag+ concentration changed from 1000 nM to 830 nM. The calibration
curves for the ISE were measured in standards containing 25 mM Na2CO3, even though the amount of
Na2CO3 clearly had a strong effect on the ISE response. The large variation in Ag+ concentration as
Int. J. Electrochem. Sci., Vol. 8, 2013
3864
determined by ISE may be ascribed to the shift in the potential for the Ag|Ag+ equilibrium reaction due
to Na2CO3, as observed in the DPSV measurements Figure 7. It is proposed that in samples were
carbonate concentration is not considered, this large shift in peak potential may result in an erroneous
estimate of the Ag+ concentration using ISE.
A plot of the log of the Ag+ concentration, as determined from the DPSV peak heights, versus
the ISE response revealed a linear relationship with a slope of 531 mV dec-1
(Figure 10 b). This large,
super Nernstian response was similar to the super Nernstian shift in stripping peak position observed
from DPSV.
The large difference between DPSV and ISE in measured Ag+ concentration as a function of
Na2CO3 concentration highlights the usefulness of DPSV to separate electrode potential (the stripping
peak position) from the amount of Ag+ (the stripping peak height).
4. CONCLUDING REMARKS
A reproducible and sensitive methodology to use glassy carbon electrodes for quantitative
DPSV of Ag+ in solution was elaborated. This work demonstrated that DPSV was a significantly more
sensitive technique compared to Ag+ ISE for the determination of low concentrations of Ag
+ ions (<
100 μg L-1
) in alkaline, carbonated electrolytes. An advantage of the DPSV technique over the ISE was
that the Ag+ concentration was determined by the stripping peak height, rather than the equilibrium
potential, which was strongly affected by the concentration of Na2CO3. Furthermore, the ISE showed a
lower reproducibility between measurements. It is evident that the mechanism for the voltammetric
behaviour of Ag+ in Na2CO3 electrolytes at pH 10 is not accounted for in existing literature and needs
further work. Finally, existing results from Ag+ ISE determinations in alkaline carbonate electrolytes
and laundry solutions should be verified by other methods such as DPSV, and the use of the Ag+ ISE
in alkaline carbonate electrolytes is discouraged.
ACKNOWLEDGEMENTS
The authors are grateful to Yolanda Hedberg, Div. Surface and Corrosion Science, KTH for valuable
discussions and comments. This work was financed via internal faculty funding and supported by the
director of KTH through the post-doc position of T.A. Lowe.
References
1. The Project on Emerging Nanotechnologies (http://www.nanotechproject.org/), An inventory of
nanotechnology-based consumer products currently on the market.
2. S.A. Blaser, M. Scheringer, M. Macleod, K. Hungerbühler, Science Total Environ. 390 (2008) 396.
3. T.M. Benn, P. Westerhoff, Environmental Sci. Technol. 42 (2008) 4133.
4. K. Kulthong, S. Srisung, K. Boonpavanitchakul, W. Kangwansupamonkon, R. Maniratanachote,
Particle and fibre toxicology 7 (2010) 8.
5. L. Geranio, M. Heuberger, B. Nowack, Environmental Sci. Technol. 43 (2009) 8113.
6. M. Rai, A. Yadav, A. Gade, Biotechnol Adv. 27 (2009) 76.
Int. J. Electrochem. Sci., Vol. 8, 2013
3865
7. J.R. Morones, J.L. Elechiguerra, A. Camacho, K. Holt, J.B. Kouri, J.T. Ramírez, M.J. Yacaman,
Nanotechnology 16 (2005) 2346.
8. D.E. Schildkraut, P.T. Dao, J.P. Twist, A.T. Davis, K.A. Robillard, Environ. Toxicol. Chem. 17
(1998) 642.
9. I. Švancara, K. Kalcher, W. Diewald, K. Vytřas, Electroanal. 8 (1996) 336.
10. S. Krizkova, O. Krystofova, L. Trnkova, J. Hubalek, V. Adam, M. Beklova, A. Horna, L. Havel, R.
Kizek, Sensors 9 (2009) 6934.
11. F. Wantz, C.E. Banks, R.G. Compton, Electroanal. 17 (2005) 655.
12. J. Wang, J. Zadeii, J. Electroanal. Chem. 246 (1988) 297.
13. E. Smulders, W. Rybinski, E. Sung, W. Rähse, J. Steber, A. Nordskog, Laundry Detergents,
Ullmann's Encyclopedia of Industrial Chemistry, John Wiley & Sons, New York, (2007).
14. A.M. Bond, T.A. O'Donnell, R.J. Taylor, Anal. Chem. 46 (1974) 1063.
15. E. Temmerman, F. Verbeek, Anal. Chim. Acta 58 (1972) 263.
16. M.E. Hyde, C.E. Banks, R.G. Compton, Electroanal. 16 (2004) 345.
17. P. Chen, R.L. McCreery, Anal. Chem. 68 (1996) 3958.
18. H.Y. Gu, A.M. Yu, H.Y. Chen, Anal. Lett. 34 (2001) 2361.
19. I.F. Hu, D.H. Karweik, T. Kuwana, J. Electroanal. Chem. 188 (1985) 59.
20. P. Heiduschka, A.W. Munz, W. Göpel, Electrochim. Acta 39 (1994) 2207.
21. K.K. Shiu, K. Shi, Electroanal. 10 (1998) 959.
22. D. Alliata, P. Häring, O. Haas, R. Kötz, H. Siegenthaler, Electrochem. Solid St. 2 (1999) 33.
23. I. Puigdomenech, HYDRA MEDUSA: Make Equilibrium Diagrams Using Sophisticated
Algorithms (http://www.kemi.kth.se/medusa/), KTH (Royal Institute of Technology), Stockholm,
Sweden, 2001.
24. M.A.M. Ibrahim, H.H. Hassan, S.S. Abd El Rehim, M.A. Amin, J. Solid State Electr. 3 (1999) 380.
25. S.S. Abd El Rehim, H.H. Hassan, M.A.M. Ibrahim, M.A. Amin, Monatsh. Chem. 129 (1998) 1103.
26. J. Hedberg, M. Lundin, T. Lowe, E. Blomberg, S. Wold, I.Odnevall Wallinder, J. Colloid Interf.
Sci. 369 (2012) 193.
27. CRC Handbook of Chemistry and Physics, 92nd ed., CRC Press/Taylor and Francis, Boca Raton,
FL, (2012).
28. J. Hedberg, T. Lowe, S. Wold, I.Odnevall Wallinder, Anal. Methods, (2012)
DOI:10.1039/C2AY26300A.
© 2013 by ESG (www.electrochemsci.org)


![Journal of Colloid and Interface Science - ntnlab.com · plex synthesis procedures. Therefore, ... [31], ferric ions [32], silver ions [33], as well as mer-cury ions [34] in water](https://img.pdfslide.us/doc/110x75/5ae38e9e7f8b9ad47c8e6e76/journal-of-colloid-and-interface-science-synthesis-procedures-therefore-.jpg)


![V. SPECIATION A. Allopatric Speciation B. Parapatric Speciation (aka Local or Progenitor - Derivative) C. Adaptive Radiation D. Sympatric Speciation [Polyploidy]](https://img.pdfslide.us/doc/110x75/56649d3f5503460f94a186e2/v-speciation-a-allopatric-speciation-b-parapatric-speciation-aka-local.jpg)