Embed Size (px)
Citation preview
BUSINESS
Chemical payrolls increased slightly last year The U.S. chemical industry is generally not labor intensive. As a result, while the industry contributes about 1.9% of the U.S. gross domestic product, the salaries, wages, and dividends the chemical industry paid out in 1993—totaling almost $61.4 billion—made up just 1.1% of the total $5.26 trillion in personal income in the U.S. last year, according to the Department of Commerce.
The restructuring and downsizing in the chemical industry have taken a toll on personal income growth. The $61.4 billion paid out in 1993 for chemicals and allied products was 2.6% higher than the previous year. Growth in 1992 was almost three times higher at 7.4%. And growth for total personal income was 4.4% in 1993, down from 6.1% the year before.
Chemicals and allied products is well down on the list of industries in terms of
contribution to total personal income. It is easily dwarfed by retail trade at $368 billion and, among the service industries, by health services at about $343 billion. However, among manufacturing industries in 1993, chemicals and allied products came in third following machinery and computer equipment, at $84.1 billion, and electronic equipment, excluding computers, at $63.3 billion.
Among the 50 states, New Jersey and Texas rank first and second in terms of personal income from chemicals, between them accounting for 22% of chemicals-derived income nationwide.
With New Jersey's large number of corporate headquarters providing higher paying jobs, and its concentration of the pharmaceutical industry, personal income from chemicals in the state last year was $6.86 billion, up a slight 0.5%
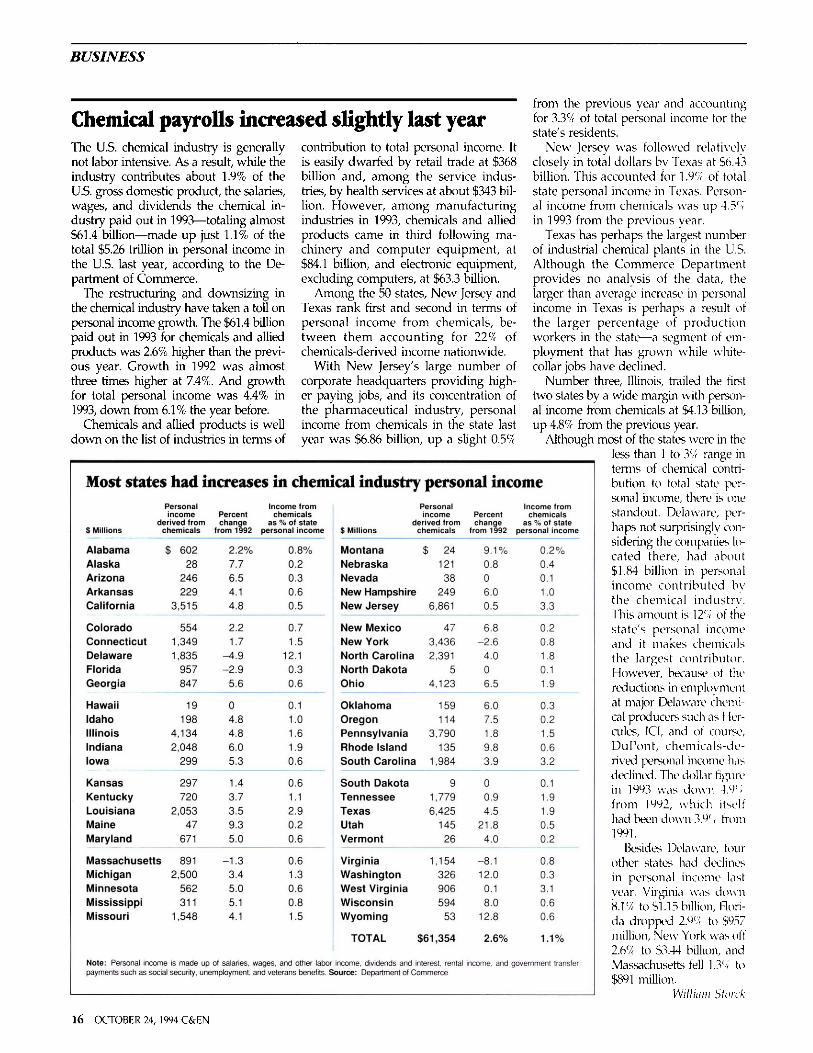
Most states had increases in chemical industry personal income
$ Millions
Alabama Alaska Arizona Arkansas California
Colorado Connecticut Delaware Florida Georgia
Hawaii Idaho Illinois Indiana Iowa
Kansas Kentucky Louisiana Maine Maryland
Personal income
derived from chemicals
$ 602 28
246 229
3,515
554 1,349 1,835
957 847
19 198
4,134 2,048
299
297 720
2,053 47
671
Massachusetts 891 Michigan Minnesota Mississippi Missouri
2,500 562 311
1,548
Percent change
from 1992
2.2% 7.7 6.5 4.1 4.8
2.2 1.7
-4.9 -2.9
5.6
0 4.8 4.8 6.0 5.3
1.4 3.7 3.5 9.3 5.0
-1.3 3.4 5.0 5.1 4.1
Note: Personal income is made up of salaries, payments such as social security, unemployment,
Income from chemicals
as % of state personal income
0.8% 0.2 0.3 0.6 0.5
0.7 1.5
12.1 0.3 0.6
0.1 1.0 1.6 1.9 0.6
0.6 1.1 2.9 0.2 0.6
0.6 1.3 0.6 0.8 1.5
Personal income
derived from $ Millions chemicals
Montana Nebraska Nevada New Hampshire New Jersey
New Mexico New York North Carolina North Dakota Ohio
Oklahoma Oregon Pennsylvania Rhode Island South Carolina
South Dakota Tennessee Texas Utah Vermont
Virginia Washington West Virginia Wisconsin Wyoming
TOTAL
$ 24 121 38
249 6,861
47 3,436 2,391
5 4,123
159 114
3,790 135
1,984
9 1,779 6,425
145 26
1,154 326 906 594
53
$61,354
/vages, and other labor income, dividends and interest, rental and veterans benefits. Source: Department of Commerce
Percent change
from 1992
9.1% 0.8 0 6.0 0.5
6.8 -2.6
4.0 0 6.5
6.0 7.5 1.8 9.8 3.9
0 0.9 4.5
21.8 4.0
-8.1 12.0 0.1 8.0
12.8
2.6%
income, and
Income from chemicals
as % of state personal income
0.2% 0.4 0.1 1.0 3.3
0.2 0.8 1.8 0.1 1.9
0.3 0.2 1.5 0.6 3.2
0.1 1.9 1.9 0.5 0.2
0.8 0.3 3.1 0.6 0.6
1.1%
government transfer
from the previous year and accounting for 3.3% of total personal income for the state's residents.
New Jersey was followed relatively closely in total dollars by Texas at $6.43 billion. This accounted for 1.9% of total state personal income in Texas. Personal income from chemicals was up 4.5% in 1993 from the previous year.
Texas has perhaps the largest number of industrial chemical plants in the U.S. Although the Commerce Department provides no analysis of the data, the larger than average increase in personal income in Texas is perhaps a result of the larger percentage of production workers in the state—a segment of employment that has grown while white-collar jobs have declined.
Number three, Illinois, trailed the first two states by a wide margin with personal income from chemicals at $4.13 billion, up 4.8% from the previous year.
Although most of the states were in the less than 1 to 3% range in terms of chemical contribution to total state personal income, there is one standout. Delaware, perhaps not surprisingly considering the companies located there, had about $1.84 billion in personal income contributed bv the chemical industry. This amount is 12% of the state's personal income and it makes chemicals the largest contributor. However, because of the reductions in employment at major Delaware chemical producers such as Hercules, ICI, and of course, DuPont, chemicals-derived personal income lias declined. The dollar figure in 1993 was down 4.9(; from 1992, which itself had been down 3.9% from 1991.
Besides Delaware, four other states had declines in personal income last year. Virginia was down 8.1% to $1.15 billion, Florida dropped 2.9% to $957 million, New York was off 2.6% to $3.44 billion, and Massachusetts fell 1.3% to $891 million.
William Storck
16 OCTOBER 24, 1994 C&EN