Embed Size (px)
Citation preview
Copenhagen Suborbitals
Flight report
HEAT-1X / Tycho Brahe
June 3rd 2011
Thomas Pedersen
Flemming Nyboe


1 Introduction
1.1 Launch!
On June 3rd 2011 Copenhagen Suborbitals launched its HEAT-1X rocket carrying the Tycho Brahespacecraft. The launch took place from a military shooting area, ESD 139, approximately 30 km eastof Bornholm. The launch was originally planned for the summer of 2010 but a faulty valve kept thevehicle on the ground, or rather, on the water. Since there is no land location in Denmark with asafety range in excess of 20 km the launch has to be done at sea. Thus a 12 ton heavy, 12 by 14meter Mobile Launch Platform (MLP) capable of carrying the rocket and all necessary componentsincluding personnel was built. The launch platform, named Sputnik, the HEAT-1X rocket and theTycho Brahe spacecraft are all seen in the image in Fig. 1.1.
The launch operation started at 7 AM on the morning of June 3rd. Sputnik and her three man crew(Kristian Elof Sørensen, Claus Nørregaard and Claus Mejling) were the first to leave Neksø harbour.They were followed by Leopold Rosenfeldt, a Search And Rescue ship who where to provide assis-tance in case of emergency. Leopold Rosenfeldt also carried part of the CS crew to the launch site.At 10 AM MHV 903 Hjortø, an inspection ship from the Danish Naval Home Guard, left Neksø boundfor ESD 139. The launch operation was directed from Hjortø who carried CS Mission Control, atelevision crew from Danish TV2 and a crew from Weibel Doppler Radars along with a doppler radarsetup. CS Mission control consisted of Flight Director Kristian von Bengtson, Fligt Dynamics OfficerSteen Andersen, COM Thomas Scherrer and Flemming Nyboe. Additionally two RIBs, RecoveryAlpha and Bravo, served as personnel transfer vehicles, photo platforms and recovery boats. Thus,the operation consisted of five vessels and during the final part of the fueling operation, the launchitself and the recovery operation a helicopter from Danish TV2 also participated.
Launch preparations started shortly after noon and where carried out by Pad Leader Niels Foldagerand Peter Madsen assisted by the Sputnik crew. The entire operation was supervised by MissionControl on Hjortø. During launch preparations Leopold Rosenfeldt and Hjortø spend a substantial
Figure 1.1: Sputnik carrying HEAT-1X / Tycho Brahe towards the shooting area early in the morningon June 3rd. The two large structures on either side of the deck are two 630 liter LOX tanks.
1
HEAT-1X Flight report
amount of time rejected traffic into the military shooting area which had been shut down for traffic.The air space was also shut down and incoming flights were diverted by air traffic controllers.
At 3.32 pm HEAT-1X took off from the launch platform in a massive plume of smoke and water vapor.As the vehicle cleared the tower it pitched over to fly at an angle of about 30 degrees to horizontal.As a consequence of the undesirable flight path the motor was shut down after 15 seconds at analtitude of 1400 meters. The low flight angle inevitably lead to a high horizontal velocity at themoment of parachute deployment. This lead to parachute malfunction and the booster impacted thewater at a very high speed causing it to disintegrate and sink. The spacecraft landed with a singlepartially torn parachute deployed causing significant damage. Despite being filled with water thespacecraft kept afloat and was recovered by Recovery Alpha.
For more information on the launch operation, videos and still images please visit www.copenhagensuborbitals.com.
1.2 Vehicle specifications
1.2.1 General
The launch vehicle and spacecraft are seen in Fig. 1.2. The total height is 9.38 meters excluding thearrow spike and the projected lift off weight is 1627 kg including propellants. The vehicle is dividedinto several sections as illustrated in Fig. 1.3. Component masses and their Center of Gravity (CG)relative to the aft booster flanger are listed in table 1.1.
1.2.2 Propulsion
The booster is a hybrid motor running on a solid polyurethane (PUR) grain in a 12+1 wagon wheelconfiguration and liquid oxygen (LOX). A drawing of the fuel grain is given in Fig. 1.4. The LOX
Figure 1.2: HEAT-1X and Tycho Brahe assembled in July 2010.
2 Copenhagen Suborbitals

HEAT-1X Flight report
Table 1.1: Table of component positions and masses used to calculate total CG.Positions are relative to the aft flange on the booster. Note that this tabledoes not include any components installed between LC 2010 and LC 2011. Thelargest component thus not included is the LOX chiller.
Start MECOComponent Position [cm] Mass [kg] Position [cm] Mass [kg]
Booster 206.3 452.1 206.3 452.1Fuel 125.5 305.6 128.1 94.6LOX 340.5 534.5 0 0BRM 539.4 35 539.4 35Spacecraft and SRM 733.5 300 733.5 300
Total 339.6 1627.2 390.5 881.7
tank has a volume of 700 liter but is only filled 2/3 with LOX. The tank is pressurized to 25 barwith helium and thus the ullage of pressurized helium feeds LOX through the injector and into thecombustion chamber. At ignition the propellant flow rate is in the order of 40-45 kg/s providing aninitial thrust of about 65 kN.
Booster LOX tank BRM SRM Spacecraft Arrow spike
CGCP
0.75D
Figure 1.3: Drawing of HEAT-1X / Tycho Brahe. BRM - Booster Recovery Module. SRM - SpacecraftRecovery Module. Center of Gravity (CG) and Center of Pressure (CP) are indicated on the figure.
Figure 1.4: 12+1 wagon wheel configuration fuel grain used in HEAT-1X.
3 Copenhagen Suborbitals

HEAT-1X Flight report
1.2.3 Electronics
The vehicle is fitted with custom made electronic solutions to serve a number of purposes. First ofall it has a radio controlled launch system. This system is activated upon reception of a certain 64bit code. When activated the internal computer takes control of the launch sequence and initiatesa 60 second countdown. At T-4 the pyrotechnic charges in the combustion chamber are fired andat T0 the LOX valve is opened and the vehicle lifts off. When the launch sequence is initiated atT-60 a warning light is lit and a horn is sounded on the launch platform to warn any personnelon board. Needles to say, no personnel should be on the launch platform at this stage but in thecase of untimely launch sequence activation the MLP is fitted with an abort button to abort the launch.
By the same radio control system booster and spacecraft separation, drogue deployment and parachutedeployment are initiated from Mission Control (MC). In the event of loss of radio communications withthe vehicle a timeout is programmed into the onboard computer such that the parachutes are releasedbefore nominal impact. The system is equipped with a safety feature such that MC can close theLOX valve and shutdown the motor by radio. This will be done if the trajectory is found to be indanger of bringing the vehicle outside the military shooting terrain.
The trajectory or flight path is monitored by the onboard computer. This unit basically consistsof three accelerometers, three gyroscopes and a microprocessor. Based on measurements from thesensors the microprocessor computes the velocity and position at a rate of about 200 Hz. All data isstored on a memory card, position data are however relayed by radio to MC where they are used bythe Flight Dynamics computer. This receives position data at a rate of about 2 Hz and uses this datato show the Flight Dynamics Officer (FIDO) important information such as speed, altitude, directionand other parameters. The information is also used to predict a landing or impact location. If thelanding or impact location is seen to move towards the edge of the military shooting terrain duringflight, FIDO will inform the Flight Director who will then abort the flight by shutting down the motorand initiate booster/spacecraft separation and parachute deployment.
4 Copenhagen Suborbitals
2 Motor performance
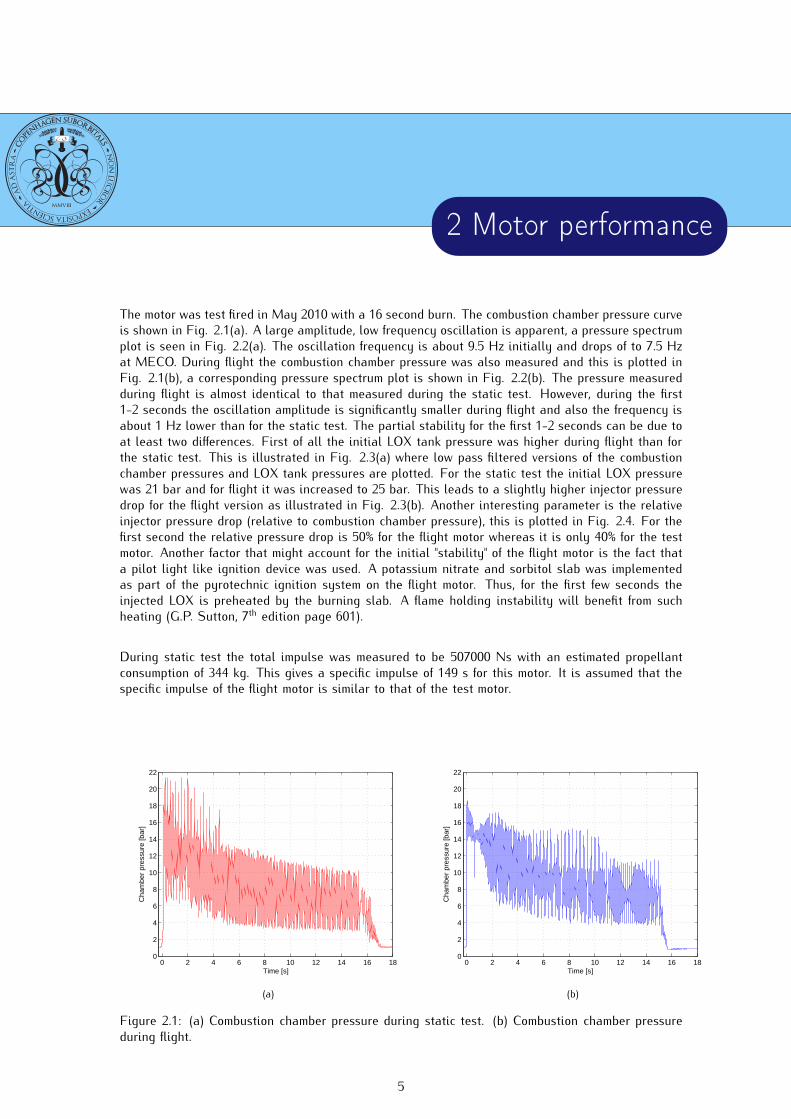
The motor was test fired in May 2010 with a 16 second burn. The combustion chamber pressure curveis shown in Fig. 2.1(a). A large amplitude, low frequency oscillation is apparent, a pressure spectrumplot is seen in Fig. 2.2(a). The oscillation frequency is about 9.5 Hz initially and drops of to 7.5 Hzat MECO. During flight the combustion chamber pressure was also measured and this is plotted inFig. 2.1(b), a corresponding pressure spectrum plot is shown in Fig. 2.2(b). The pressure measuredduring flight is almost identical to that measured during the static test. However, during the first1-2 seconds the oscillation amplitude is significantly smaller during flight and also the frequency isabout 1 Hz lower than for the static test. The partial stability for the first 1-2 seconds can be due toat least two differences. First of all the initial LOX tank pressure was higher during flight than forthe static test. This is illustrated in Fig. 2.3(a) where low pass filtered versions of the combustionchamber pressures and LOX tank pressures are plotted. For the static test the initial LOX pressurewas 21 bar and for flight it was increased to 25 bar. This leads to a slightly higher injector pressuredrop for the flight version as illustrated in Fig. 2.3(b). Another interesting parameter is the relativeinjector pressure drop (relative to combustion chamber pressure), this is plotted in Fig. 2.4. For thefirst second the relative pressure drop is 50% for the flight motor whereas it is only 40% for the testmotor. Another factor that might account for the initial "stability" of the flight motor is the fact thata pilot light like ignition device was used. A potassium nitrate and sorbitol slab was implementedas part of the pyrotechnic ignition system on the flight motor. Thus, for the first few seconds theinjected LOX is preheated by the burning slab. A flame holding instability will benefit from suchheating (G.P. Sutton, 7th edition page 601).
During static test the total impulse was measured to be 507000 Ns with an estimated propellantconsumption of 344 kg. This gives a specific impulse of 149 s for this motor. It is assumed that thespecific impulse of the flight motor is similar to that of the test motor.
0 2 4 6 8 10 12 14 16 180
2
4
6
8
10
12
14
16
18
20
22
Time [s]
Cha
mbe
r pr
essu
re [b
ar]
(a)
0 2 4 6 8 10 12 14 16 180
2
4
6
8
10
12
14
16
18
20
22
Time [s]
Cha
mbe
r pr
essu
re [b
ar]
(b)
Figure 2.1: (a) Combustion chamber pressure during static test. (b) Combustion chamber pressureduring flight.
5

HEAT-1X Flight report
Low pass filtered version of the combustion chamber pressure and the LOX tank pressure form bothstatic test and flight are shown in Fig. 2.3(a). From this it is possible to calculate the thrust fromthe flight motor as
F = Atkp (2.1)
where At is the nozzle throat area, k is the thrust coefficient and p is the combustion chamber pres-sure. The thrust coefficient is assumed to be k = 1.2 and hence the maximum thrust at lift off can becalculated to be around 75 kN. Thrust falls of with time and is about 30 kN at MECO.
(a) (b)
Figure 2.2: (a) Combustion chamber pressure spectrum during static test. (b) Combustion chamberpressure spectrum during flight.
0 2 4 6 8 10 12 14 16 180
5
10
15
20
25
Time [s]
Cha
mbe
r pr
essu
re [b
ar]
FlightStatic test
(a)
0 2 4 6 8 10 12 14 16 180
1
2
3
4
5
6
7
8
9
10
Time [s]
Pre
ssur
e [b
ar]
FlightStatic test
(b)
Figure 2.3: (a) Low pass filtered plots of the combustion chamber pressure and LOX tank pressureduring flight and the static test. (b) Injector pressure drop for flight and static test.
6 Copenhagen Suborbitals

HEAT-1X Flight report
0 2 4 6 8 10 12 14 16 180
10
20
30
40
50
60
70
80
90
100
Time [s]
Rel
ativ
e pr
essu
re [%
]
HEAT−1X relative injector pressure drop
FlightStatic test
Figure 2.4: Injector pressure drop relative to chamber pressure.
7 Copenhagen Suborbitals

HEAT-1X Flight report
8 Copenhagen Suborbitals

3 Flight performance
3.1 Introduction
For flight analysis two different coordinate systems are used. The onboard computer in Tycho worksin the coordinate system illustrated in Fig. 3.1(a). The sensor inputs are then used to calculateparameter values in a coordinate system relative to Sputnik as illustrated in Fig. 3.1(b). The twocoordinate systems will be referred to as onboard and global coordinate systems.
As the uncertainty of the onboard inertial system increases with time to the power of three anddue to the high forces experienced at separation (see section 3.4 for details) the data acquired afterseparation are associated with some error. After landing the horizontal velocity is measured to be 44m/s and the altitude is measured to be 130 meter. Both values should be zero and this is of coursea result of the accumulated error. Thus, the reader should bear in mind that data after separation(T+32) might have a significant error to it.
3.2 Acceleration and speed
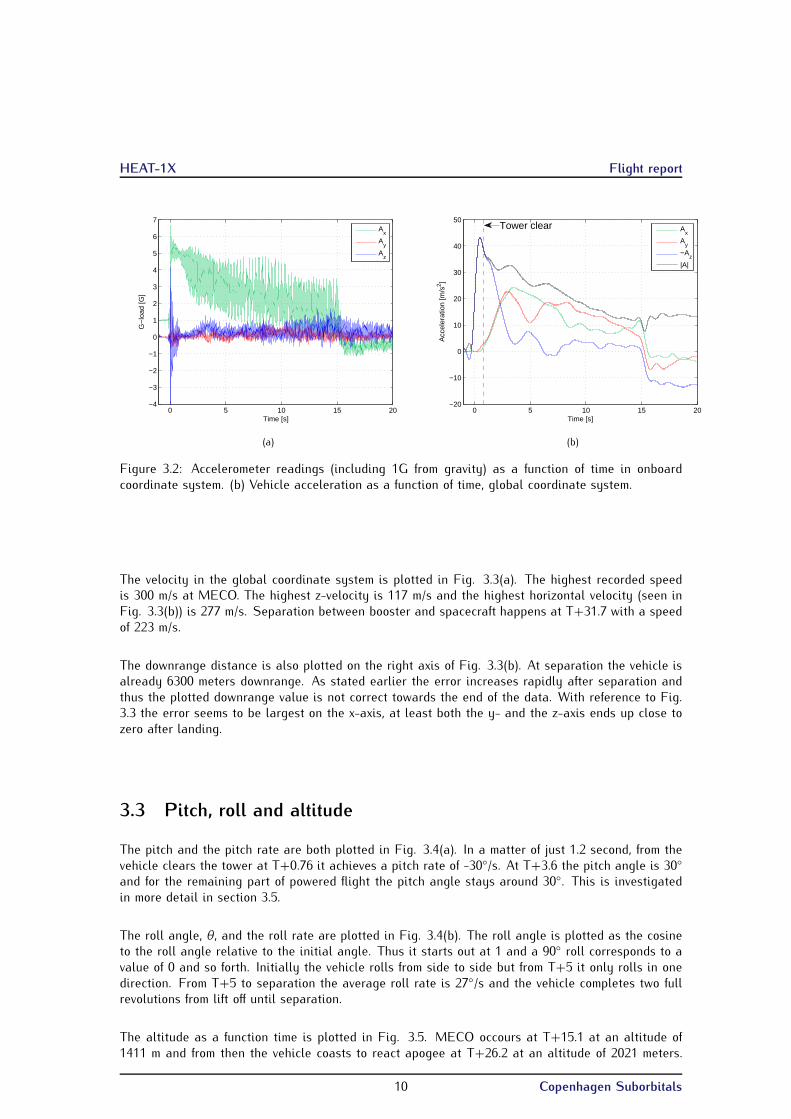
The acceleration measured by the onboard computer system is plotted in Fig. 3.2(a). The highamplitude oscillation from the booster is naturally also present in the accelerometer data. The ac-tual acceleration of the vehicle is plotted in 3.2(b) in global coordinates. The maximum accelerationrecorded is while the vehicle is still on the launch rail and is 43 m/s2. As the vehicle pithes over thez-component of acceleration drops and is only about 3 m/s2 for the last half of the powered flight.Instead the vehicle has a significant horizontal acceleration until MECO at T+15.1.
(a) (b)
Figure 3.1: (a) Definition of coordinate system onboard Tycho Brahe. (b) Coordinate system relativeto Sputnik.
9
HEAT-1X Flight report
0 5 10 15 20−4
−3
−2
−1
0
1
2
3
4
5
6
7
Time [s]
G−
load
[G]
A
x
Ay
Az
(a)
0 5 10 15 20−20
−10
0
10
20
30
40
50
Time [s]
Acc
eler
atio
n [m
/s2 ]
A
x
Ay
−Az
|A|
Tower clear
(b)
Figure 3.2: Accelerometer readings (including 1G from gravity) as a function of time in onboardcoordinate system. (b) Vehicle acceleration as a function of time, global coordinate system.
The velocity in the global coordinate system is plotted in Fig. 3.3(a). The highest recorded speedis 300 m/s at MECO. The highest z-velocity is 117 m/s and the highest horizontal velocity (seen inFig. 3.3(b)) is 277 m/s. Separation between booster and spacecraft happens at T+31.7 with a speedof 223 m/s.
The downrange distance is also plotted on the right axis of Fig. 3.3(b). At separation the vehicle isalready 6300 meters downrange. As stated earlier the error increases rapidly after separation andthus the plotted downrange value is not correct towards the end of the data. With reference to Fig.3.3 the error seems to be largest on the x-axis, at least both the y- and the z-axis ends up close tozero after landing.
3.3 Pitch, roll and altitude
The pitch and the pitch rate are both plotted in Fig. 3.4(a). In a matter of just 1.2 second, from thevehicle clears the tower at T+0.76 it achieves a pitch rate of -30◦/s. At T+3.6 the pitch angle is 30◦
and for the remaining part of powered flight the pitch angle stays around 30◦. This is investigatedin more detail in section 3.5.
The roll angle, θ, and the roll rate are plotted in Fig. 3.4(b). The roll angle is plotted as the cosineto the roll angle relative to the initial angle. Thus it starts out at 1 and a 90◦ roll corresponds to avalue of 0 and so forth. Initially the vehicle rolls from side to side but from T+5 it only rolls in onedirection. From T+5 to separation the average roll rate is 27◦/s and the vehicle completes two fullrevolutions from lift off until separation.
The altitude as a function time is plotted in Fig. 3.5. MECO occours at T+15.1 at an altitude of1411 m and from then the vehicle coasts to react apogee at T+26.2 at an altitude of 2021 meters.
10 Copenhagen Suborbitals

HEAT-1X Flight report
Separation occurs 5.76 s after apogee at an altitude of 1883 m.
3.4 G-load at separation and impact
Due to the close to horizontal trajectory of the vehicle separation occurred at a quite high horizontalspeed of 223 m/s. Immediately after separation the booster and spacecraft starts to tumble. Due tothe high speed this gives rise to a large force and rapid acceleration of the spacecraft. The G-load ofthe spacecraft at separation is seen in Fig. 3.6(a). A maximum load of 17 G is recorded. Impact withthe water is significantly more violent but the event only lasts about 150 ms. The G-load at impactis seen in Fig. 3.6(b). A maximum load of 29 G is recorded.
0 10 20 30 40 50 60 70 80 90−100
−50
0
50
100
150
200
250
300
Time [s]
Vel
ocity
[m/s
]
V
x
Vy
−Vz
|V|
(a)
0 10 20 30 40 50 60 70 80 900
1000
2000
3000
4000
5000
6000
7000
8000
9000
Dow
nran
ge [m
]
Time [s]0 10 20 30 40 50 60 70 80 90
0
50
100
150
200
250
300
Vxy
[m/s
]
MECO − 2240 m
Apogee − 5006 m
Separation − 6304 m
(b)
Figure 3.3: (a) Velocity as a function of time. (b) Distance from launch position and VXY as a functionof time.
0 5 10 15 20 25 30−100
−50
0
50
100
Pitc
h an
gle
[deg
rees
]
Time [s]0 5 10 15 20 25 30
−40
−30
−20
−10
0
10
20
30
40
Pitc
h ra
te [d
egre
es /
s]
Tower clear, V = 30 m/s
V = 108 m/s
V = 175 m/s
(a)
0 5 10 15 20 25 30−1
−0.75
−0.5
−0.25
0
0.25
0.5
0.75
1
CO
S(θ
)
Time [s]0 5 10 15 20 25 30
−80
−60
−40
−20
0
20
40
60
80
Rol
l rat
e [d
egre
es /
s]
(b)
Figure 3.4: (a) Pitch and pitch rate as a function of time. (b) Left axis: Roll angle as a function oftime. Right axis: Roll rate as a function of time.
11 Copenhagen Suborbitals

HEAT-1X Flight report
0 10 20 30 40 50 60 70 80 900
500
1000
1500
2000
2500
Time [s]
Alti
tude
[m]
MECO − 1411 m
Apogee − 2021 m
Separation − 1883 m
Figure 3.5: Altitude as a function of time.
30 35 40 45−15
−10
−5
0
5
10
15
20
Time [s]
G−
load
[G]
G
x
Gy
Gz
G
(a)
84 84.1 84.2 84.3 84.4 84.5−30
−20
−10
0
10
20
30
Time [s]
G−
load
[G]
G
x
Gy
Gz
G
(b)
Figure 3.6: (a) G-load at separation and (b) G-load at impact.
12 Copenhagen Suborbitals

HEAT-1X Flight report
3.5 Pitch analysis
As stated earlier the vehicle pitches over immediately after clearing the launch tower. The pitchangle and pitch rate are plotted in Fig. 3.4(a). According to the position data the tower is cleared atT+0.76. However, the pitch rate at this time is already -4 ◦/s indicating that the pitch started at anearlier time. The pitch and pitch rate from T+0.5 to T+1 are plotted in Fig. 3.7. The pitch rate iszero at T+0.65 and then starts to decrease from this point, suggesting that the pitch motion starts atthis time while the vehicle is still in contact with the launch tower. The pitch angular acceleration isfairly constant from T+0.65 to T+1.7 and is about 30◦/s2 or 0.5 rad/s2. The moment of inertia of thevehicle at lift off is estimated to be I = 11250 kg/m2 (m = 1630 kg and l = 9.20 m). Thus, the torqueworking on the vehicle is about 5600 Nm. At T+3.6 the pitch is about 30◦ and remains at this leveluntil MECO. This raises a few important questions:
• What gives rise to the initial torque of 5600 Nm?
• Why does it stop at about T+3.6?
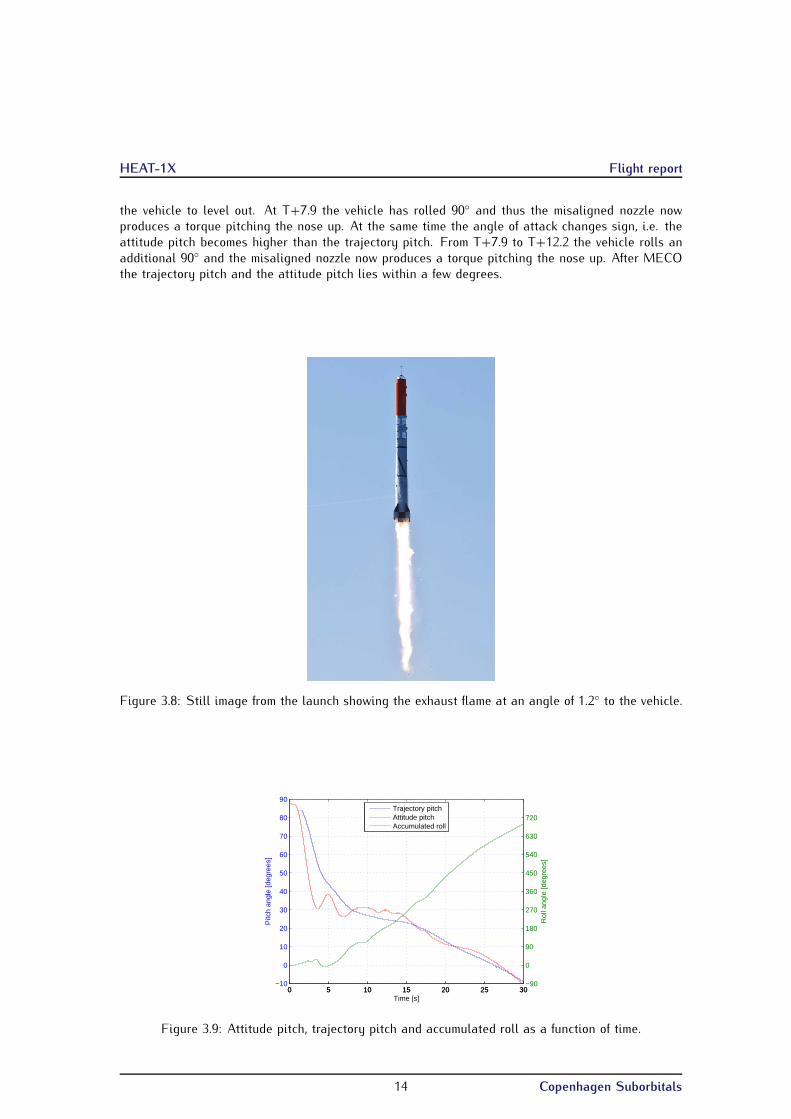
Our analysis indicates that the initial torque is due to a misalignment of the thrust vector which inturn is most probably due to a misaligned nozzle. The misalignment is illustrated in Fig. 3.8 wherethe jet is misaligned about 1.2◦ to the booster. From the still image the angle is measured to beabout 1.2 degrees. It is likely that the angle is larger than this since one will only see the actualangle in a picture taken at 90 degrees to the pitch plane. At T+0.76 the thrust from the motor isestimated to be 61 kN. The nozzle throat is positioned 282 cm behind the center of gravity. Thus thetorque provided by this misalignment is 3600 Nm. This is not enough to account for the observedtorque of 5600 Nm. For nozzle misalignment to account for the observed torque the actual anglehas to be 1.9◦. This could also very well be the case as the 1.2◦ measured on the image is a minimum.
The next question is then, if a misaligned thrust vector provides enough torque to turn the vehicle,why does it then stop at about T+3.6? The answer lies in Fig. 3.9. This figure shows the pitch ofthe actual path the vehicle is traveling and it shows the accumulated roll of the vehicle (right axis).
Initially the attitude pitch of the vehicle drops faster than the path pitch, this gives a large angleof attack on the fins. As the vehicle gains speed the correcting force from the fins increases and atabout T+3.6 at a speed of 108 m/s the torque provided by the fins becomes large enough to force
0.5 0.6 0.7 0.8 0.9 184
85
86
87
88
Pitc
h an
gle
[deg
rees
]
Time [s]0.5 0.6 0.7 0.8 0.9 1
−10
−7.5
−5
−2.5
0
Pitc
h ra
te [d
egre
es /
s]
Tower clear
Figure 3.7: Pitch and pitch rate as a function of time as the vehicle clears the tower.
13 Copenhagen Suborbitals
HEAT-1X Flight report
the vehicle to level out. At T+7.9 the vehicle has rolled 90◦ and thus the misaligned nozzle nowproduces a torque pitching the nose up. At the same time the angle of attack changes sign, i.e. theattitude pitch becomes higher than the trajectory pitch. From T+7.9 to T+12.2 the vehicle rolls anadditional 90◦ and the misaligned nozzle now produces a torque pitching the nose up. After MECOthe trajectory pitch and the attitude pitch lies within a few degrees.
Figure 3.8: Still image from the launch showing the exhaust flame at an angle of 1.2◦ to the vehicle.
0 5 10 15 20 25 30−10
0
10
20
30
40
50
60
70
80
90
Time [s]
Pitc
h an
gle
[deg
rees
]
0 5 10 15 20 25 30−90
0
90
180
270
360
450
540
630
720
Rol
l ang
le [d
egre
es]
Trajectory pitchAttitude pitchAccumulated roll
Figure 3.9: Attitude pitch, trajectory pitch and accumulated roll as a function of time.
14 Copenhagen Suborbitals
HEAT-1X Flight report
3.6 Comparison with doppler radar data
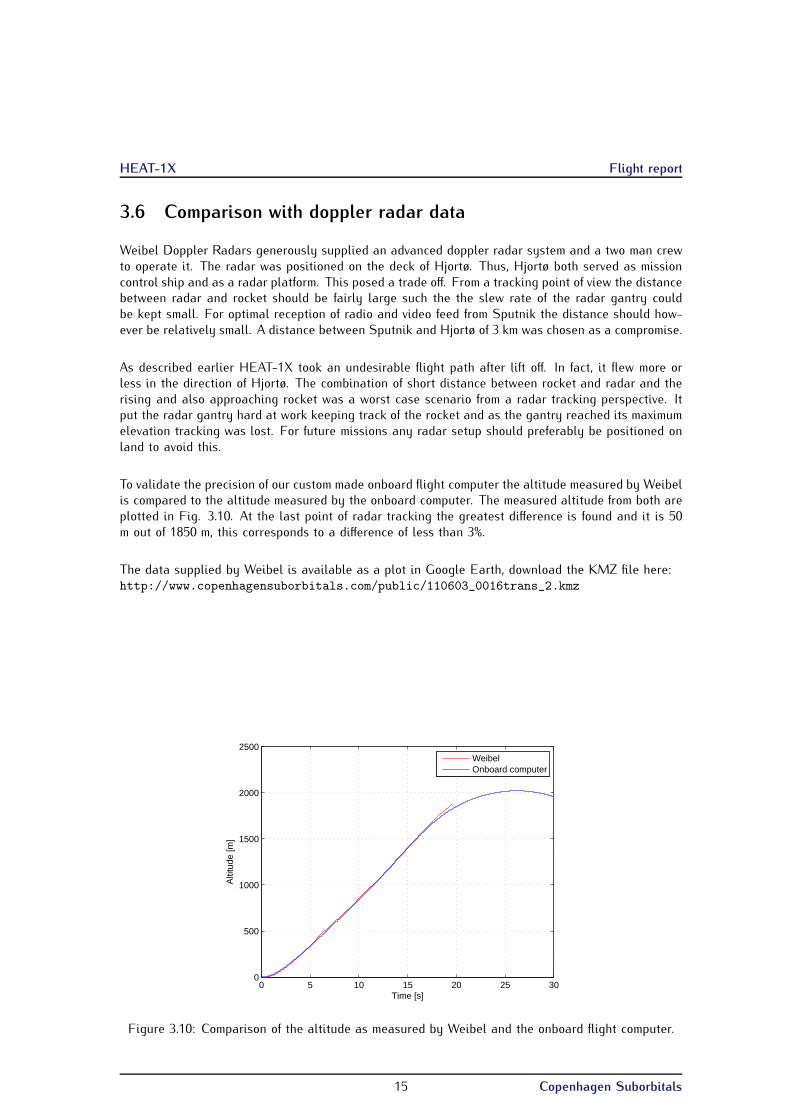
Weibel Doppler Radars generously supplied an advanced doppler radar system and a two man crewto operate it. The radar was positioned on the deck of Hjortø. Thus, Hjortø both served as missioncontrol ship and as a radar platform. This posed a trade off. From a tracking point of view the distancebetween radar and rocket should be fairly large such the the slew rate of the radar gantry couldbe kept small. For optimal reception of radio and video feed from Sputnik the distance should how-ever be relatively small. A distance between Sputnik and Hjortø of 3 km was chosen as a compromise.
As described earlier HEAT-1X took an undesirable flight path after lift off. In fact, it flew more orless in the direction of Hjortø. The combination of short distance between rocket and radar and therising and also approaching rocket was a worst case scenario from a radar tracking perspective. Itput the radar gantry hard at work keeping track of the rocket and as the gantry reached its maximumelevation tracking was lost. For future missions any radar setup should preferably be positioned onland to avoid this.
To validate the precision of our custom made onboard flight computer the altitude measured by Weibelis compared to the altitude measured by the onboard computer. The measured altitude from both areplotted in Fig. 3.10. At the last point of radar tracking the greatest difference is found and it is 50m out of 1850 m, this corresponds to a difference of less than 3%.
The data supplied by Weibel is available as a plot in Google Earth, download the KMZ file here:http://www.copenhagensuborbitals.com/public/110603_0016trans_2.kmz
0 5 10 15 20 25 300
500
1000
1500
2000
2500
Time [s]
Alti
tude
[m]
WeibelOnboard computer
Figure 3.10: Comparison of the altitude as measured by Weibel and the onboard flight computer.
15 Copenhagen Suborbitals

HEAT-1X Flight report
16 Copenhagen Suborbitals
4 Conclusions
4.1 Conclusions
First of all, the Copenhagen Suborbitals 2011 Launch Campaign has been a tremendous success!CS has proven itself capable of building a 12 ton heavy mobile launch facility and launch a 1630kg, 9.38 meter tall rocket from sea. This is a milestone in CS’s program to reach manned suborbitalspaceflight. Launching a rocket this size is however not only about technological ability. It is alsoabout building up a strong organization which is recognized by authorities and partners as a seriousproject. Thus, both technological and organizational experience from the 2011 LC will provide a solidplatform for future launches.
The undesirable trajectory forced a premature motor shutdown. The shutdown was performed byradio control and the decision to do so was made based on downlinked trajectory information andreal time trajectory interpolation and impact prediction. It is the first time in aviation and space flighthistory that a rocket flight is safely aborted in this way. This feature demonstrates CS’s commitmentto range safety and safety to CS and other participating personnel.
Based on the data measured during flight a number of important conclusions are made. Most sig-nificantly the cause of the pitching motion seems to have been identified as a misaligned nozzle.Unfortunately it will never be possible to verify this as the booster disintegrated on the high speedimpact with the water.
Comparison of doppler radar data with data from the onboard flight computer indicate that the on-board system has an high accuracy during powered flight.
17