Embed Size (px)
Citation preview
The University of AkronIdeaExchange@UAkron
Honors Research Projects The Dr. Gary B. and Pamela S. Williams HonorsCollege
Spring 2017
Chemical Modification of Crumb Rubber toIncrease Its Bonding with ConcreteMary T. [email protected]
Kendall J. [email protected]
Please take a moment to share how this work helps you through this survey. Your feedback will beimportant as we plan further development of our repository.Follow this and additional works at: http://ideaexchange.uakron.edu/honors_research_projects
Part of the Civil Engineering Commons, and the Other Chemical Engineering Commons
This Honors Research Project is brought to you for free and open access by The Dr. Gary B. and Pamela S. WilliamsHonors College at IdeaExchange@UAkron, the institutional repository of The University of Akron in Akron, Ohio,USA. It has been accepted for inclusion in Honors Research Projects by an authorized administrator ofIdeaExchange@UAkron. For more information, please contact [email protected], [email protected].
Recommended CitationMcCannon, Mary T. and Sweitzer, Kendall J., "Chemical Modification of Crumb Rubber to Increase Its Bondingwith Concrete" (2017). Honors Research Projects. 550.http://ideaexchange.uakron.edu/honors_research_projects/550
Chemical Modification of Crumb Rubber to Increase Its Bonding with Concrete
4200:497:002
The Williams Honors College
Mary McCannon
Associate Author: Kendall Sweitzer
April 28, 2017
McCannon 1
Table of Contents
Honors Abstract Addendum ........................................................................................................ 2
Executive Summary ...................................................................................................................... 3
Introduction ................................................................................................................................... 6
Background ................................................................................................................................... 9
Experimental Methods ............................................................................................................... 19
Data and Results ......................................................................................................................... 30
Discussion/Analysis ..................................................................................................................... 35
Literature Cited .......................................................................................................................... 43
Appendices ................................................................................................................................... 46
McCannon 2
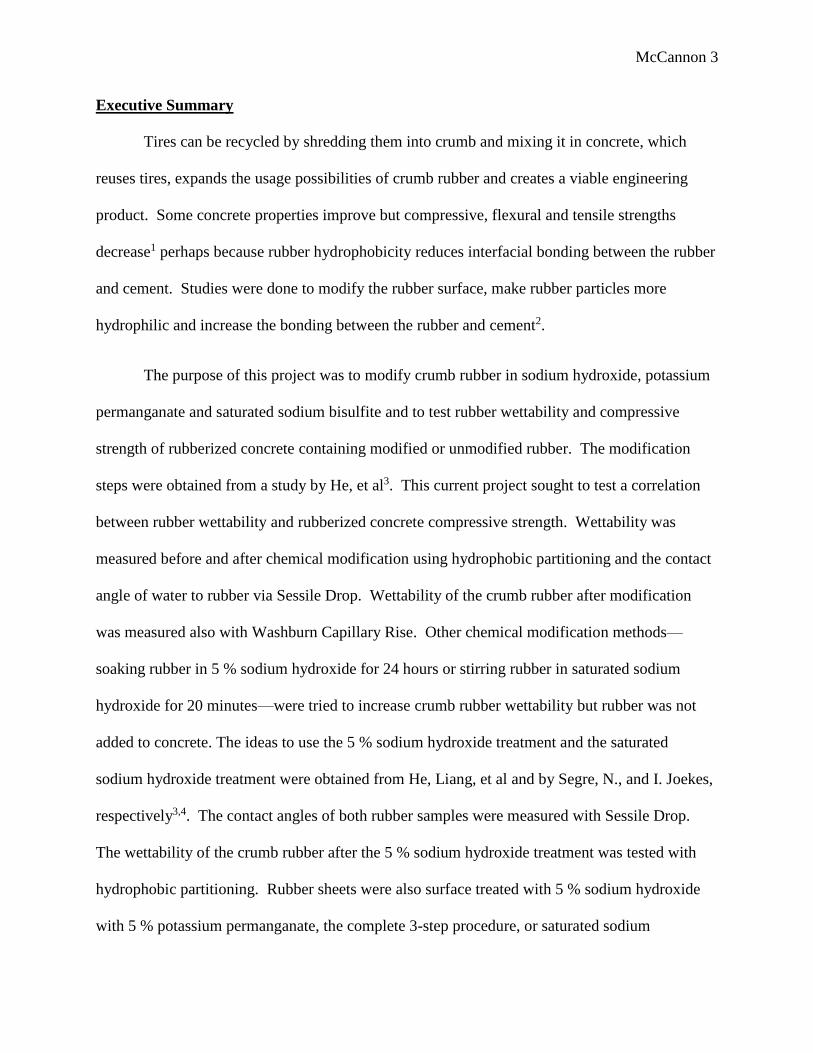
Honors Abstract Addendum
The hydrophilicity of crumb rubber was increased with wet chemical modification and added to
concrete to increase its adhesion with concrete, consequently the compressive strength relative to
that of concrete with untreated rubber. Other modification methods were tested on crumb rubber
and rubber sheets to yield an increase in hydrophilicity. Certain tests were less reliable for
powder testing or tedious and time consuming and concrete materials and rubber may not be
homogeneous.
For wet chemical modification, several approaches were attempted. First, crumb rubber was
soaked in 5% sodium hydroxide, 5% potassium permanganate and saturated sodium bisulfite,
tested for hydrophilicity using Sessile Drop, Washburn Capillary Rise and hydrophobic
partitioning and added to concrete cylinders tested for compressive strength. The results from the
Sessile Drop method show that water spread out and disappeared over the modified rubber
indicating hydrophilicity. The results from the Washburn Capillary Rise show that the modified
rubber has a contact angle of 89.4 ± 0.02°. The results from the Hydrophobic Partitioning
method show that rubber became somewhat more miscible with water. Results of compressive
strength testing show that the compressive strength of concrete containing unmodified rubber
was 40% lower than that of regular concrete but the compressive strength of concrete containing
modified rubber was 2% lower than that concrete containing unmodified rubber. Second, crumb
rubber was soaked in 5% sodium hydroxide for 24 hours or stirred in saturated sodium hydroxide
for 20 minutes and tested for hydrophilicity using Sessile Drop or hydrophobic partitioning. The
results from the Sessile Drop method show that unmodified crumb rubber has a contact angle of
121.8 ± 13.2°, crumb rubber soaked in 5 % NaOH for 24 hours has a contact angle of 115.8 ±
8.0° and crumb rubber stirred in saturated NaOH for 20 minutes has a contact angle of 121.5 ±
8.1°. Results from the Hydrophobic Partitioning method show that unmodified rubber and rubber
soaked in 5 % NaOH for 24 hours are not miscible with water at all (rubber soaked in saturated
NaOH was not tested). To gain some basic understanding on how rubber can be affected by
different treatment methods, rubber sheets were modified with sodium hydroxide, potassium
permanganate, sodium bisulfite, combinations of the three, as well as by ultraviolet radiation or
plasma radiation. Water contact angles on the treated rubber sheets were measured using the
sessile drop method. The results show that rubber sheets were made somewhat more hydrophilic
with the combinations of sodium hydroxide, potassium permanganate and sodium bisulfite
treatments and significantly with UV or plasma but not with sodium hydroxide alone.
McCannon 3
Executive Summary
Tires can be recycled by shredding them into crumb and mixing it in concrete, which
reuses tires, expands the usage possibilities of crumb rubber and creates a viable engineering
product. Some concrete properties improve but compressive, flexural and tensile strengths
decrease1 perhaps because rubber hydrophobicity reduces interfacial bonding between the rubber
and cement. Studies were done to modify the rubber surface, make rubber particles more
hydrophilic and increase the bonding between the rubber and cement2.
The purpose of this project was to modify crumb rubber in sodium hydroxide, potassium
permanganate and saturated sodium bisulfite and to test rubber wettability and compressive
strength of rubberized concrete containing modified or unmodified rubber. The modification
steps were obtained from a study by He, et al3. This current project sought to test a correlation
between rubber wettability and rubberized concrete compressive strength. Wettability was
measured before and after chemical modification using hydrophobic partitioning and the contact
angle of water to rubber via Sessile Drop. Wettability of the crumb rubber after modification
was measured also with Washburn Capillary Rise. Other chemical modification methods—
soaking rubber in 5 % sodium hydroxide for 24 hours or stirring rubber in saturated sodium
hydroxide for 20 minutes—were tried to increase crumb rubber wettability but rubber was not
added to concrete. The ideas to use the 5 % sodium hydroxide treatment and the saturated
sodium hydroxide treatment were obtained from He, Liang, et al and by Segre, N., and I. Joekes,
respectively3,4. The contact angles of both rubber samples were measured with Sessile Drop.
The wettability of the crumb rubber after the 5 % sodium hydroxide treatment was tested with
hydrophobic partitioning. Rubber sheets were also surface treated with 5 % sodium hydroxide
with 5 % potassium permanganate, the complete 3-step procedure, or saturated sodium
McCannon 4
hydroxide. Rubber sheets were treated also with ultraviolet (UV) radiation or plasma and
contact angle was measured immediately, 2 hours and 5 days after treatment. All contact angle
measurements for all samples were measured with Sessile Drop.
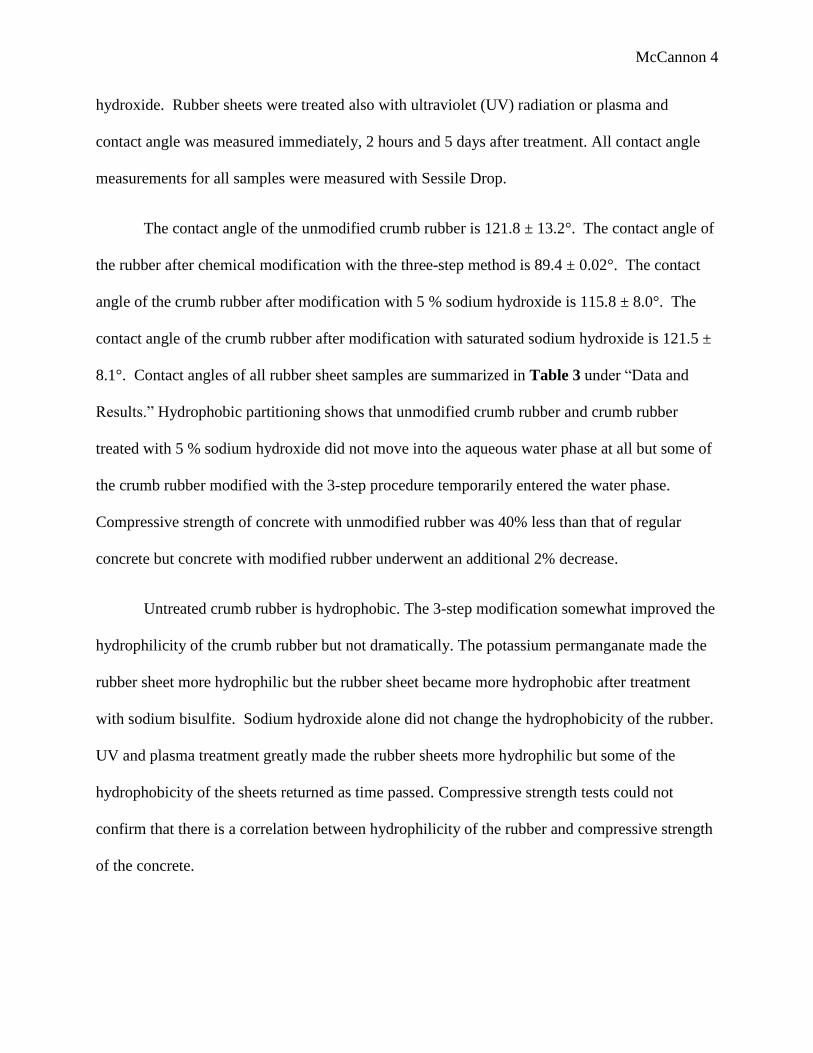
The contact angle of the unmodified crumb rubber is 121.8 ± 13.2°. The contact angle of
the rubber after chemical modification with the three-step method is 89.4 ± 0.02°. The contact
angle of the crumb rubber after modification with 5 % sodium hydroxide is 115.8 ± 8.0°. The
contact angle of the crumb rubber after modification with saturated sodium hydroxide is 121.5 ±
8.1°. Contact angles of all rubber sheet samples are summarized in Table 3 under “Data and
Results.” Hydrophobic partitioning shows that unmodified crumb rubber and crumb rubber
treated with 5 % sodium hydroxide did not move into the aqueous water phase at all but some of
the crumb rubber modified with the 3-step procedure temporarily entered the water phase.
Compressive strength of concrete with unmodified rubber was 40% less than that of regular
concrete but concrete with modified rubber underwent an additional 2% decrease.
Untreated crumb rubber is hydrophobic. The 3-step modification somewhat improved the
hydrophilicity of the crumb rubber but not dramatically. The potassium permanganate made the
rubber sheet more hydrophilic but the rubber sheet became more hydrophobic after treatment
with sodium bisulfite. Sodium hydroxide alone did not change the hydrophobicity of the rubber.
UV and plasma treatment greatly made the rubber sheets more hydrophilic but some of the
hydrophobicity of the sheets returned as time passed. Compressive strength tests could not
confirm that there is a correlation between hydrophilicity of the rubber and compressive strength
of the concrete.
McCannon 5
Washburn Capillary Rise is tedious and time consuming. Sessile Drop is not reliable for
measuring powder contact angle. Rubber and concrete materials are not truly homogeneous,
though they were assumed to be.
Skills regarding Washburn Capillary Rise and Sessile Drop tests and basic principles in
concrete mixing were learned. A stronger work ethic was developed by pushing to complete lab
work in addition to other academic obligations. Prioritizing and time management skills were
developed by coordinating lab work with work in other classes. Confidence was gained through
overcoming obstacles and through being self-driven and taking self-initiative in talking to
professors and getting all the necessary work done.
The results of this project could be of benefit to society. Recycling of rubber in this
manner will help curtail concerns with waste and improve concrete technology1.
Future recommendations would be to explore and test other and more chemical
modification techniques and to test rubber treated with plasma or UV in concrete formulations.
McCannon 6
Introduction
Piles of waste tires have led to issues regarding public health and the environment. To further
complicate the matter, it is not easy to recycle scrap rubber given that it is not thermoplastic5.
Used tires are shredded to convert to crumb rubber. Past research has been conducted to put this
rubber in Portland cement concrete. Doing so still produces good properties of the concrete mix.
For instance, the addition of crumb rubber to concrete mixes helps decrease the unit weight of
the material. Crumb rubber concrete is also more resilient to thermal changes relative to regular
concrete mixes. Crumb rubber concrete samples also remained intact during strength tests.
Crumb rubber concrete is more ductile than regular concrete and has similar toughness to regular
concrete. However, in crumb rubber concrete, flexural, tensile and compressive strengths all
decreased with more rubber added1.
It is believed that the hydrophobicity of rubber has a negative impact on interfacial bonding
between rubber and cement and leads to the strength loss2. Prior research has been done to
modify the rubber surface, to make rubber particles more hydrophilic and increase bonding
between rubber and cement2. One such study uses a 3 step procedure for modifying crumb
rubber. In it, crumb rubber was first soaked in 5% sodium hydroxide for 24 hours, rinsed with
water, soaked and heated in 5% potassium permanganate at 60°C for 2 hours while keeping the
pH around 2-3. Then, the rubber was rinsed with water and soaked and heated in saturated
sodium bisulfite at 60°C for 0.5-1 hours. The study reported success in lowering contact angle of
water on the rubber, and in recovering lost compressive strength3.
With a few changes and omissions, the treatment procedure outlined in this study was followed
for completion of this current project. The primary goal of this project was to use the provided
modification method to test the hydrophilicity of crumb rubber and add the rubber to concrete to
McCannon 7
test for its compressive strength relative to that of regular concrete and concrete containing
unmodified rubber. It was desired to test the hypothesis that increasing the hydrophilicity of
crumb rubber will enable it to recover lost compressive strength in concrete samples. After the
crumb rubber was modified in this fashion, it was tested for wettability. In this project, additional
chemical modification methods were used on crumb rubber but these samples were not added to
concrete formulations. A sample of crumb rubber was soaked in 5% sodium hydroxide for 24
hours to replicate only the first step done by He, et al3. Another earlier study stirred rubber
particles in saturated sodium hydroxide for 20 minutes4. In this current project, another sample of
crumb rubber was stirred in saturated sodium hydroxide. Rubber sheets were obtained and
chemically modified. One sheet was stirred in saturated sodium hydroxide. Another sheet was
soaked in 5% sodium hydroxide followed by soaking and heating in potassium permanganate.
Another sheet was soaked in 5% sodium hydroxide, followed by soaking and heating in
potassium permanganate, followed by soaking and heating in saturated sodium bisulfite. The
effects of UV and plasma radiation on rubber wettability was also investigated. With one sheet
used as a reference, another rubber sheet was treated with 8 minutes of UV and another sheet
was treated with 5 minutes of plasma.
For all rubber samples treated, the wettability was tested with Sessile Drop, Washburn Capillary
Rise or hydrophobic partitioning. During Sessile Drop tests, a drop of liquid is placed on the
surface being measured and the angle being measured is the angle at which all three phases meet.
Sessile Drop is more reliable when the surface is flat, has no pores and is smooth and is
unreliable for rough surfaces, cases where the liquid gets into the pores or cases where the
material swells6. There are means by which the contact angle can be adjusted to account for
surface roughness6,7. Washburn Capillary Rise is more reliable for measuring contact angle of
McCannon 8
powders6. For this project, the contact angle of all of the rubber sheets (including an unmodified
rubber sheet and a rubber sheet used as a reference for UV and plasma treatment) was measured
with Sessile Drop. Regarding the UV and plasma treatment, contact angle was measured
immediately following treatment, 2 hours following treatment and 5 days following treatment.
The contact angle of unmodified crumb rubber was measured with Sessile Drop by placing
powder on a glass slide and double-sided tape and using the aforementioned correction. The
hydrophobicity of the unmodified crumb rubber was ascertained qualitatively speaking by using
hydrophobic partitioning. The contact angle of crumb rubber modified using the complete three
step procedure was measured using Washburn Capillary Rise and the hydrophobicity was
characterized qualitatively with hydrophobic partitioning. The contact angle of crumb rubber
modified with either 5% or saturated sodium hydroxide was measured using Sessile Drop by
placing a sample on a slide and double-sided tape and using the correction. The hydrophobicity
of the crumb rubber modified with 5% sodium hydroxide was analyzed also by hydrophobic
partitioning.
The “Experimental Methods” section of this report provides detail as to how each chemical
modification and wettability testing was run. The “Data and Results” and “Appendices” sections
provide detail on all measurements and calculations.
McCannon 9
Background
A report notes about 2-3 billion waste tires in stockpiles in the United States1. While
dealing with waste tires, the environment and public health are concerns that emerge. Also, the
vulcanization of rubber makes it difficult for recycle and waste rubber is not biodegradable5.
Work has been done that favors minimizing tire waste and helps alleviate some of these
environmental issues. Used waste tires are shredded to make crumb rubber1. Putting waste tire
rubber in cement recycles tires helps the environment and saves resources2. Additionally, the
Arizona Department of Transportation (ADOT) paired with Arizona State University (ASU) did
research to use Portland cement concrete as a way to use crumb rubber and still have a useful
product. ADOT and ASU have worked together on projects to incorporate crumb rubber into
Portland Cement Concrete and to build sections of their formulation in a variety of areas, such as
part of the roads, sidewalks or wheel chair ramps to name a few. They carried out tests where
these sections, being built throughout the state were studied and lab tests were done at ASU.
Field tests showed that as rubber was added to the concrete, the unit weight went down. Also, as
rubber was added, strain at fail increased, meaning that mixes were more ductile and energy
absorbent. Increasing the amount of rubber would increase the amount of energy absorbed up to
a point before it drops off. During compressive strength tests and indirect tensile strength tests,
the samples with crumb rubber did not shatter, to prove that a good application for this kind of
concrete is where higher impact resistance is needed1. Putting waste tire rubber in concrete also
does a better job at insulating heat and noise, provides better freeze-thaw resistance and also
improves impermeability2. However, as more rubber is added to the concrete, compressive,
flexural and tensile strength goes down. Toughness was similar in mixes with no rubber and
mixes with rubber1.
McCannon 10
There are reasons to suggest why adding crumb rubber to concrete will lower the
strength. Cement is hydrophilic and crumb rubber is hydrophobic, which means that there is bad
adhesion between the two materials, meaning that the mechanical properties of the rubberized
cement suffers3. Therefore, the hypothesis being tested in the present study is that if rubber can
be made more hydrophilic then compressive strength of the concrete should improve.
There is a research study where the surface of crumb rubber was modified with waste
organic sulfur compounds. The results show that after the treatment, the rubber became more
hydrophilic, the modified rubber interacted better with cement than did unmodified rubber and
the modified rubber also increased the compressive strength of concrete samples8. In another
study, rubber particles were sprayed with a solution of acrylic acid, polyethylene glycol and
anhydrous ethanol and the rubber was added to concrete to be tested against control concrete and
concrete with unmodified rubber. Results of the study confirm that the rubber became more
hydrophilic after modification and that the modification of the rubber particles increases the
compressive strength of the concrete2. In another study, the procedure for which was used in this
current project (with some adjustments), crumb rubber was soaked in 5% sodium hydroxide for
24 hours, rinsed with water, soaked in 5% potassium permanganate (while pH was kept around
2-3) and heated at 60 degrees Celsius and stirred for 2 hours (oxidation reaction). The rubber was
then rinsed with water, soaked in saturated sodium bisulfite for between 0.5-1 hours and kept at
60 degrees Celsius (sulphonation reaction). FT-IR results of the study showed that the
pretreatment added “polar carbonyl, hydroxyl and sulfonate groups on the rubber surface of
rubber, which made a large number of hydrogen bond and ionic bond between rubber and
cement matrix, greatly improving the adhesive strength of rubber and cement matrix and the
mechanical properties of the rubber-cement matrix composites.” The modification changed the
McCannon 11
polarity of the rubber and that even after each step (after oxidation and after sulphonation), the
contact angle went down each time. The two step process increased bonding between the rubber
and the cement. Finally, the compressive strength reduction was slower in the modified rubber
than it was in the unmodified rubber3. Other studies have been conducted on modifying the
surface of rubber particles and in these studies, such treatments have been: washing the rubber
with water, washing rubber with water and carbon tetrachloride and soaking rubber in saturated
sodium hydroxide, all three of which were to remove plasticizers and contaminants and to make
rubber less hydrophobic. Other work has been done to increase the bonding between cement and
rubber, such as that using silane, Si69 or PVA. Unfortunately, in a number of studies,
contradictions have been found2. Some work has also treated crumb rubber with UV radiation
and it was found that this treatment improves the flexural strength3. Another study, the chemical
modification procedure for which is being utilized in this current project, has used saturated
sodium hydroxide to treat the surface of the rubber particles by stirring it for 20 minutes at room
temperature, filtering the rubber, washing it with water and letting it dry at normal temperature
conditions. Rubber particles treated with sodium hydroxide adhere better to cement but oddly the
treatment did not improve the compressive strength4. It is clear that research has been done to
attempt to modify the surface of crumb rubber with goals of either making it more hydrophilic,
adhere better to cement or to improve the mechanical properties of the rubberized concrete.
The wettability of a solid is determined by the angle that a liquid forms when it meets a
solid surface. The contact angle is the angle formed when all three phases—solid, liquid and
vapor—meet, depends on the interfacial tension between the solid-liquid, solid-vapor and liquid-
vapor phases6 and is the Young contact angle which is valid only when the surface is smooth and
McCannon 12
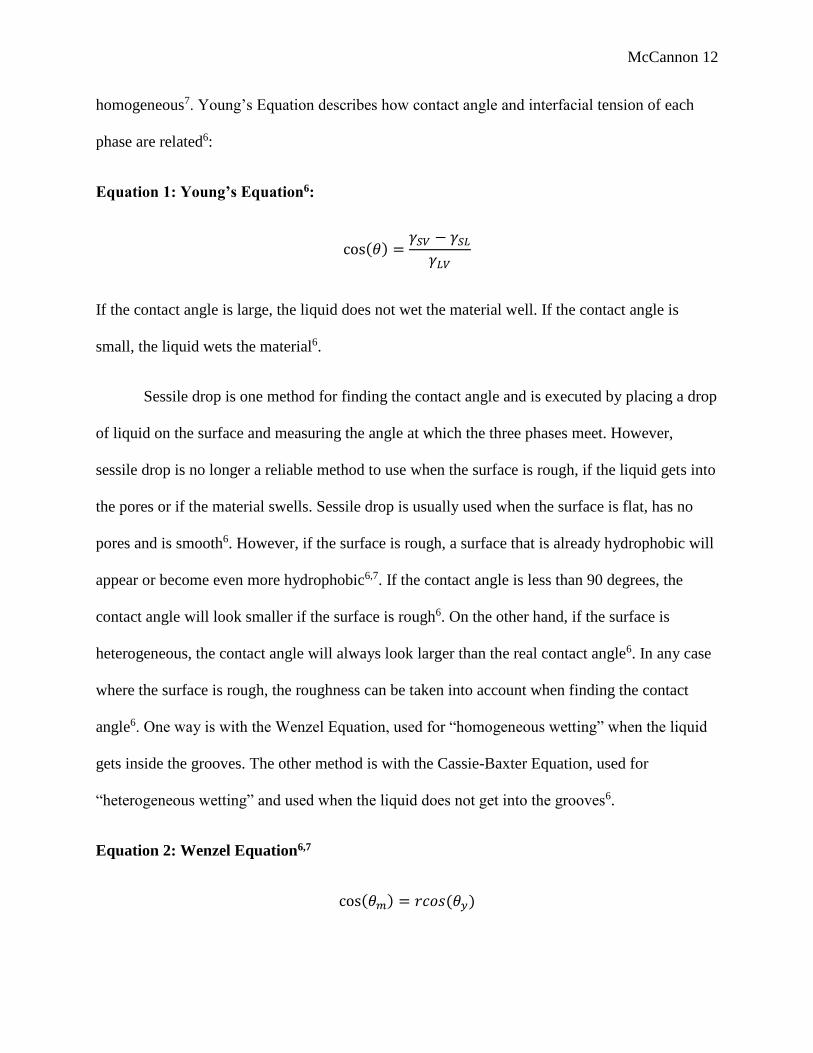
homogeneous7. Young’s Equation describes how contact angle and interfacial tension of each
phase are related6:
Equation 1: Young’s Equation6:
cos(𝜃) =𝛾𝑆𝑉 − 𝛾𝑆𝐿
𝛾𝐿𝑉
If the contact angle is large, the liquid does not wet the material well. If the contact angle is
small, the liquid wets the material6.
Sessile drop is one method for finding the contact angle and is executed by placing a drop
of liquid on the surface and measuring the angle at which the three phases meet. However,
sessile drop is no longer a reliable method to use when the surface is rough, if the liquid gets into
the pores or if the material swells. Sessile drop is usually used when the surface is flat, has no
pores and is smooth6. However, if the surface is rough, a surface that is already hydrophobic will
appear or become even more hydrophobic6,7. If the contact angle is less than 90 degrees, the
contact angle will look smaller if the surface is rough6. On the other hand, if the surface is
heterogeneous, the contact angle will always look larger than the real contact angle6. In any case
where the surface is rough, the roughness can be taken into account when finding the contact
angle6. One way is with the Wenzel Equation, used for “homogeneous wetting” when the liquid
gets inside the grooves. The other method is with the Cassie-Baxter Equation, used for
“heterogeneous wetting” and used when the liquid does not get into the grooves6.
Equation 2: Wenzel Equation6,7
cos(𝜃𝑚) = 𝑟𝑐𝑜𝑠(𝜃𝑦)
McCannon 13
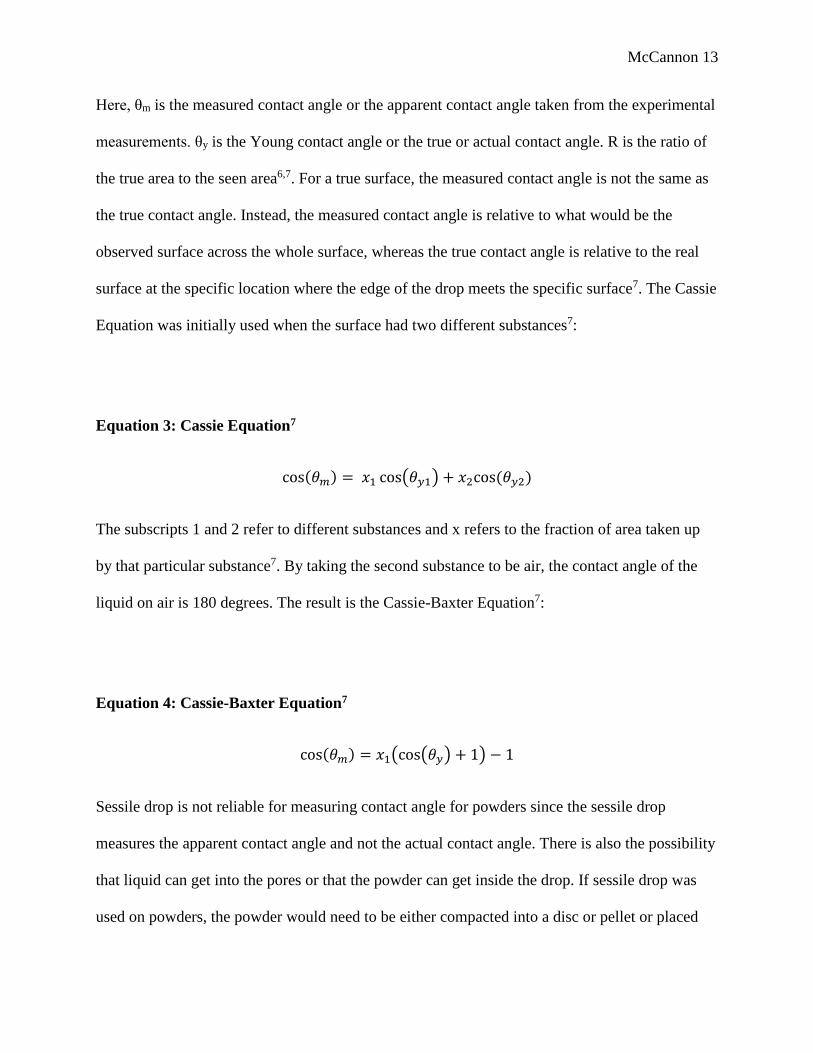
Here, θm is the measured contact angle or the apparent contact angle taken from the experimental
measurements. θy is the Young contact angle or the true or actual contact angle. R is the ratio of
the true area to the seen area6,7. For a true surface, the measured contact angle is not the same as
the true contact angle. Instead, the measured contact angle is relative to what would be the
observed surface across the whole surface, whereas the true contact angle is relative to the real
surface at the specific location where the edge of the drop meets the specific surface7. The Cassie
Equation was initially used when the surface had two different substances7:
Equation 3: Cassie Equation7
cos(𝜃𝑚) = 𝑥1 cos(𝜃𝑦1) + 𝑥2cos (𝜃𝑦2)
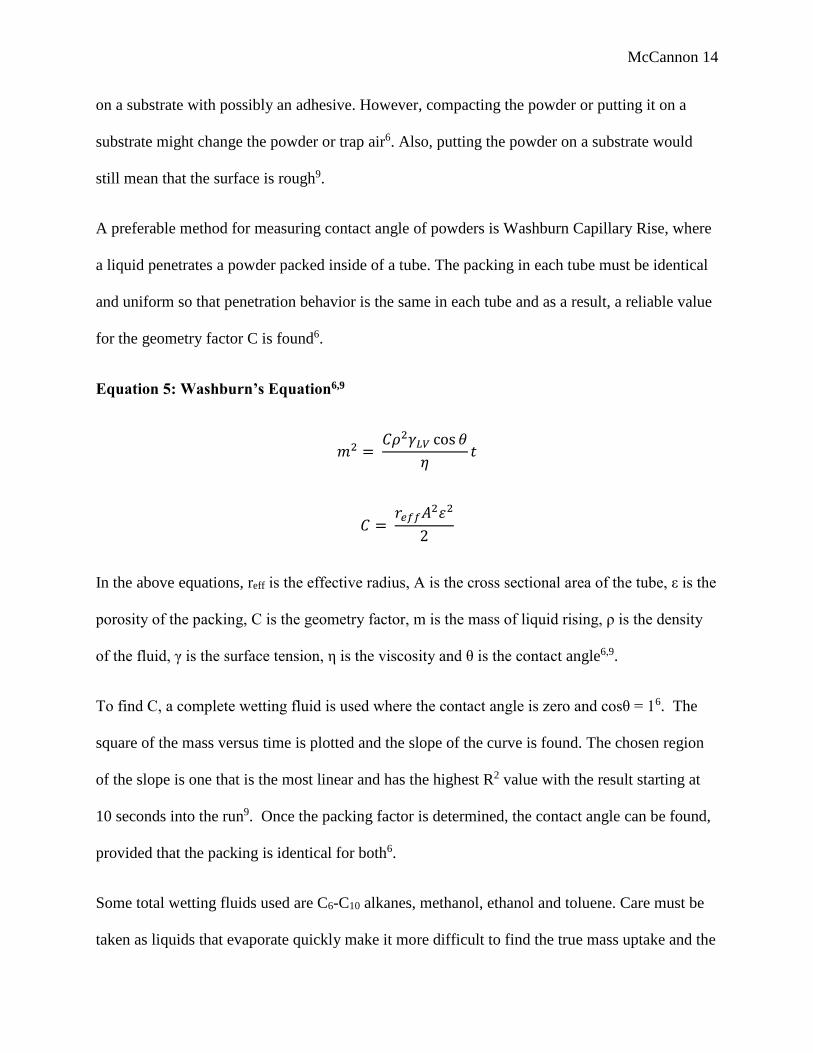
The subscripts 1 and 2 refer to different substances and x refers to the fraction of area taken up
by that particular substance7. By taking the second substance to be air, the contact angle of the
liquid on air is 180 degrees. The result is the Cassie-Baxter Equation7:
Equation 4: Cassie-Baxter Equation7
cos(𝜃𝑚) = 𝑥1(cos(𝜃𝑦) + 1) − 1
Sessile drop is not reliable for measuring contact angle for powders since the sessile drop
measures the apparent contact angle and not the actual contact angle. There is also the possibility
that liquid can get into the pores or that the powder can get inside the drop. If sessile drop was
used on powders, the powder would need to be either compacted into a disc or pellet or placed
McCannon 14
on a substrate with possibly an adhesive. However, compacting the powder or putting it on a
substrate might change the powder or trap air6. Also, putting the powder on a substrate would
still mean that the surface is rough9.
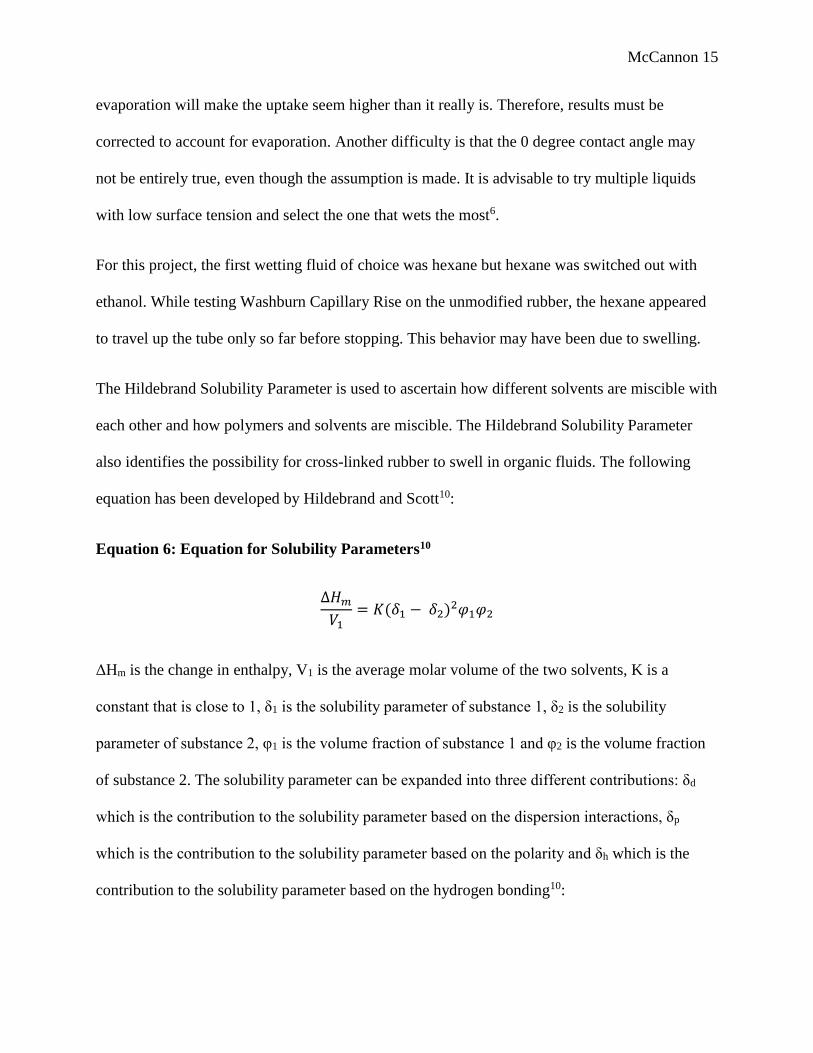
A preferable method for measuring contact angle of powders is Washburn Capillary Rise, where
a liquid penetrates a powder packed inside of a tube. The packing in each tube must be identical
and uniform so that penetration behavior is the same in each tube and as a result, a reliable value
for the geometry factor C is found6.
Equation 5: Washburn’s Equation6,9
𝑚2 = 𝐶𝜌2𝛾𝐿𝑉 cos 𝜃
𝜂𝑡
𝐶 = 𝑟𝑒𝑓𝑓𝐴2휀2
2
In the above equations, reff is the effective radius, A is the cross sectional area of the tube, ε is the
porosity of the packing, C is the geometry factor, m is the mass of liquid rising, ρ is the density
of the fluid, γ is the surface tension, η is the viscosity and θ is the contact angle6,9.
To find C, a complete wetting fluid is used where the contact angle is zero and cosθ = 16. The
square of the mass versus time is plotted and the slope of the curve is found. The chosen region
of the slope is one that is the most linear and has the highest R2 value with the result starting at
10 seconds into the run9. Once the packing factor is determined, the contact angle can be found,
provided that the packing is identical for both6.
Some total wetting fluids used are C6-C10 alkanes, methanol, ethanol and toluene. Care must be
taken as liquids that evaporate quickly make it more difficult to find the true mass uptake and the
McCannon 15
evaporation will make the uptake seem higher than it really is. Therefore, results must be
corrected to account for evaporation. Another difficulty is that the 0 degree contact angle may
not be entirely true, even though the assumption is made. It is advisable to try multiple liquids
with low surface tension and select the one that wets the most6.
For this project, the first wetting fluid of choice was hexane but hexane was switched out with
ethanol. While testing Washburn Capillary Rise on the unmodified rubber, the hexane appeared
to travel up the tube only so far before stopping. This behavior may have been due to swelling.
The Hildebrand Solubility Parameter is used to ascertain how different solvents are miscible with
each other and how polymers and solvents are miscible. The Hildebrand Solubility Parameter
also identifies the possibility for cross-linked rubber to swell in organic fluids. The following
equation has been developed by Hildebrand and Scott10:
Equation 6: Equation for Solubility Parameters10
∆𝐻𝑚
𝑉1= 𝐾(𝛿1 − 𝛿2)2𝜑1𝜑2
ΔHm is the change in enthalpy, V1 is the average molar volume of the two solvents, K is a
constant that is close to 1, δ1 is the solubility parameter of substance 1, δ2 is the solubility
parameter of substance 2, φ1 is the volume fraction of substance 1 and φ2 is the volume fraction
of substance 2. The solubility parameter can be expanded into three different contributions: δd
which is the contribution to the solubility parameter based on the dispersion interactions, δp
which is the contribution to the solubility parameter based on the polarity and δh which is the
contribution to the solubility parameter based on the hydrogen bonding10:
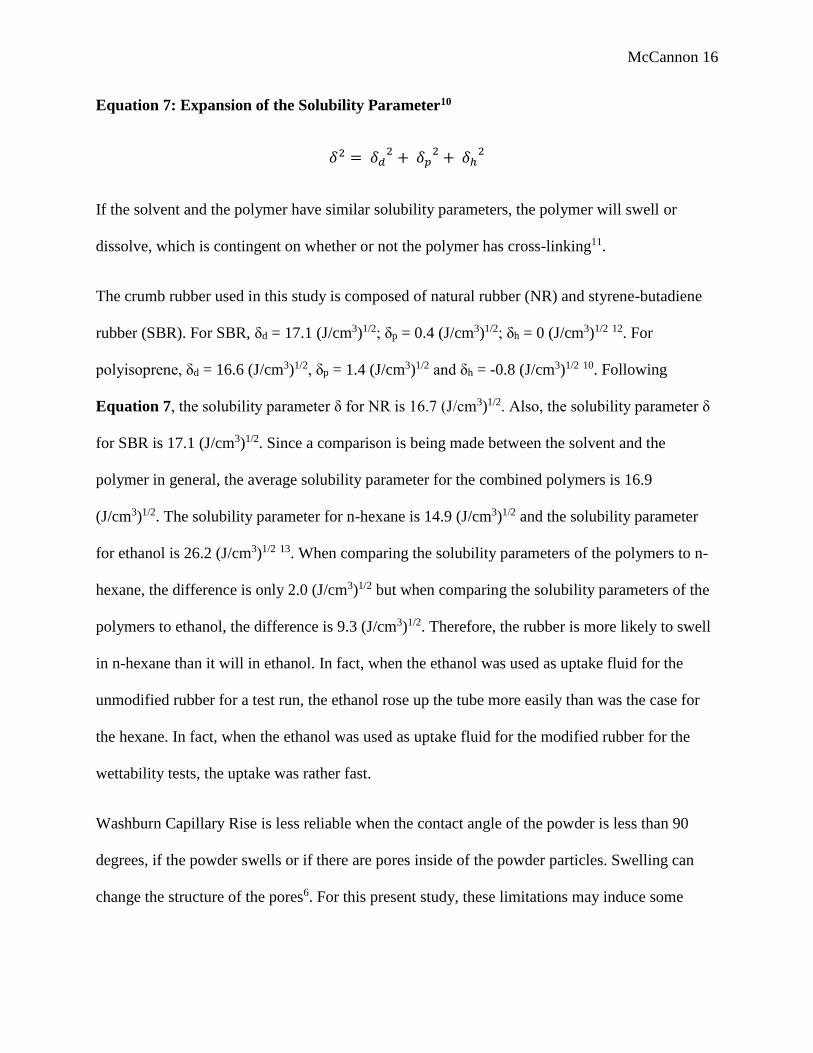
McCannon 16
Equation 7: Expansion of the Solubility Parameter10
𝛿2 = 𝛿𝑑2 + 𝛿𝑝
2 + 𝛿ℎ2
If the solvent and the polymer have similar solubility parameters, the polymer will swell or
dissolve, which is contingent on whether or not the polymer has cross-linking11.
The crumb rubber used in this study is composed of natural rubber (NR) and styrene-butadiene
rubber (SBR). For SBR, δd = 17.1 (J/cm3)1/2; δp = 0.4 (J/cm3)1/2; δh = 0 (J/cm3)1/2 12. For
polyisoprene, δd = 16.6 (J/cm3)1/2, δp = 1.4 (J/cm3)1/2 and δh = -0.8 (J/cm3)1/2 10. Following
Equation 7, the solubility parameter δ for NR is 16.7 (J/cm3)1/2. Also, the solubility parameter δ
for SBR is 17.1 (J/cm3)1/2. Since a comparison is being made between the solvent and the
polymer in general, the average solubility parameter for the combined polymers is 16.9
(J/cm3)1/2. The solubility parameter for n-hexane is 14.9 (J/cm3)1/2 and the solubility parameter
for ethanol is 26.2 (J/cm3)1/2 13. When comparing the solubility parameters of the polymers to n-
hexane, the difference is only 2.0 (J/cm3)1/2 but when comparing the solubility parameters of the
polymers to ethanol, the difference is 9.3 (J/cm3)1/2. Therefore, the rubber is more likely to swell
in n-hexane than it will in ethanol. In fact, when the ethanol was used as uptake fluid for the
unmodified rubber for a test run, the ethanol rose up the tube more easily than was the case for
the hexane. In fact, when the ethanol was used as uptake fluid for the modified rubber for the
wettability tests, the uptake was rather fast.
Washburn Capillary Rise is less reliable when the contact angle of the powder is less than 90
degrees, if the powder swells or if there are pores inside of the powder particles. Swelling can
change the structure of the pores6. For this present study, these limitations may induce some
McCannon 17
error in the measurements due to the rubber’s potential to swell and due to the fact that the
contact angle of the modified rubber was found to be around 90 degrees.
When measuring mass uptake, the mass uptake through the support and the capillary interaction
on the walls of the tube must be accounted for. It is also important that the time taken for fluid to
rise in the support is removed in the final graph6. In this study, these values were not calculated
or subtracted in the final results but the uptake time through the support was taken into account
by adjusting the slopes such that they began at a time in the run when there was no longer any
uptake through the support.
Different supports are used to hold powder in the tube6 but for this project, cotton was used.
There are different ways that the powder can be packed in the tubes, such as with tapping, either
manually or automatically, putting all of the powder in the tube at once or in increments, putting
a weight to compress it, using a rod or using a centrifuge6. For this project, the tubes were
packed by tapping them manually on a hard surface for a certain period of time at identical rates.
Unfortunately, tapping may lead to size segregation6.
Taking measurements for Washburn Capillary Rise is sometimes done by lowering the tube into
the fluid so that it just touches the fluid. A mass balance may be used where the container sits on
the balance and the balance reads negative numbers. Also, the entire uptake process should be
recorded, beginning from before the tube touches the liquid to after the tube is removed6.
One of the other testing methods used in this project is hydrophobic partitioning. Hydrocarbon
partitioning techniques have been used to determine hydrophobicity of cell-surfaces. One study,
looking to determine the hydrophobicity of different cell strains used aqueous-hydrocarbon
partitioning techniques. To test tubes containing cells suspended in PBS were added amounts of
McCannon 18
certain hydrocarbons. The tubes were agitated and the phases were allowed to separate. The
aqueous solution was removed and placed in a cuvette to measure the optical density. Results
reported the percentage of the original OD. For little to no change in the OD, the cells did not
adhere well to the hydrocarbons but if there was a significant drop in the OD, the cells did adhere
well to hydrocarbons14. The procedures for hydrophobic partitioning used in the current study
generally followed the same principles as described but instead of analyzing optical density, the
distribution of the powder was analyzed qualitatively.
McCannon 19
Experimental Methods
Crumb rubber used in this project was grade MD-400-TR obtained from Lehigh
Technologies in Tucker, Georgia. Its composition is natural rubber (NR), styrene-butadiene
rubber (SBR), carbon black, zinc oxide, sulfur, stearic acid and process oil. Potassium
permanganate powder, sodium bisulfite powder and sodium hydroxide pellets were also used.
Ethanol was 200 Proof from Decon Laboratories, Inc. Molecular sieves, used to dry the ethanol,
were type 3A, 8-12 mesh beads. Fluids also used were water and hexane. Rubber strips were
obtained from a rubber sheet left over in the lab. Each sheet sample was cut into pieces about ½”
wide and 1.5” long.
Crumb rubber (646.811 grams) was weighed and transferred to a clean Tubberware
container. A solution of 5.006 wt% of sodium hydroxide was prepared with 1000 mL of water
and 52.698 grams of sodium hydroxide pellets. The solution was added to the Tubberware
container and mixed to ensure that the rubber was sufficiently soaked in the solution. The rubber
was allowed to soak in the solution for 41.5 hours. The rubber was then filtered using a Buchner
funnel and strainer and rinsed with water. After concerns that there may not have been enough
rubber sufficient to complete the concrete formulations, an additional 129.3 grams of crumb
rubber was weighed and transferred to a plastic container. A solution of 5.021 wt% of sodium
hydroxide was prepared with 200 mL of water and 10.573 grams of sodium hydroxide pellets.
The sodium was added to the plastic container and mixed to ensure that the rubber was
sufficiently soaked in the solution. The rubber was allowed to soak in the solution for
approximately 96 hours. The rubber was filtered with a Buchner funnel. Due to scheduling and
time constraints, the soaking times of each batch of rubber were not kept identical. However,
after both batches were filtered, it was attempted to mix both batches together so that the
McCannon 20
difference could be less prominent. Additionally, due to time and resource constraints
(specifically, filtering a large mass of rubber), the rubber may not have been perfectly rinsed or
dried.
The combined rubber was put into two large flasks. A potassium permanganate solution
of 4.593 wt% was prepared with 1095 mL of water and 52.71 grams of potassium permanganate
(the target concentration was 5 wt% prescribed by the article but the actual concentration of the
solution was slightly lower because extra amounts of water were used to dissolve potassium
permanganate residue that did not dissolve). The potassium permanganate solution was added to
the flasks. A water bath was preheated to 60°C and both flasks were added to the water bath and
left in the water bath for 3 hours. The temperature of the water bath was monitored periodically.
It should be noted that some of the solution on top was not submerged underwater. The flasks
were removed from the water bath and the rubber was filtered from the solution using a Buchner
funnel. Since the rubber to solution ratios were not identical in both flasks and because during
the filtering process, rubber would still sit in the potassium permanganate solution as it was
waiting to be filtered, the rubber was mixed after the chemical treatment to try to mitigate issues
with non-uniformity. Again, the rubber at the end of the treatment was not rinsed well and still
somewhat wet but this was due to time and resource limitations.
A sodium bisulfite solution was prepared as close as possible to its saturation point by
incrementally adding sodium bisulfite to water and stirring and by incrementally adding sodium
bisulfite and letting the solution sit for long periods of time without stirring. The solution was
deemed to be saturated when, after 2 days, some of the solids were not dissolved after sitting
unstirred. The solution was stirred again to dissolve the rest of these solids. The final
concentration was 29.12 wt% and used 412.8764 grams of sodium bisulfite and 1005 mL of
McCannon 21
water. A water bath was preheated to 60°C. Rubber and sodium bisulfite solution was added to
both large flasks. The flasks were added to the water bath and left in the bath for 2 hours. Not all
of the rubber in the flasks were submerged and during the reaction, some of the rubber rose up
the neck such that the solution was almost spilling over into the bath. The rubber was filtered
with a Buchner funnel. Again, due to time constraints, the rubber was not rinsed and still moist.
After a few days, the rubber was rinsed with water once and filtered. Most of the rubber was
placed under a fume hood to air dry. Minor amounts of rubber were placed in an oven to try to
expedite the drying process (due to the large quantity of rubber) but it was feared that, in spite of
the efficiency of the oven to dry the rubber, the rubber may be altered due to the elevated
temperature, so this rubber was not used in any wettability testing. This rubber was, however,
used in the preparation of the concrete cylinders to ensure that the proper weights of rubber in
the formulation could be met. However, this amount of rubber is minor compared to the majority
that dried under the fume hood. Once the rubber under the fume hood was found to be
substantially dried, a small sample was set aside for wettability tests and the rest was used in the
concrete cylinder preparation.
The effect that soaking the crumb rubber in 5 wt% sodium hydroxide for 24 hours,
without pretreating with potassium permanganate and sodium bisulfite, had on the rubber
wettability was also analyzed. A solution of sodium hydroxide was prepared with 10 mL of
water and 0.5386 grams of sodium hydroxide pellets. To this solution was added 6.4688 grams
of crumb rubber. The solution and rubber sat in a plastic tube and allowed to sit for 24 hours.
The rubber was filtered from the solution using a Buchner funnel, rinsed with water and put
under a fume hood to air dry.
McCannon 22
Rubber was also treated with saturated sodium hydroxide. The solubility limit of sodium
hydroxide in water is 109 grams of sodium hydroxide for 100 grams of water15. Following these
proportions, a solution of saturated sodium hydroxide was prepared with 40 mL of water and
43.684 grams of sodium hydroxide. The final concentration of the solution was 52.2 wt% sodium
hydroxide. Crumb rubber (6.0546 grams) was added to the solution in a small plastic container.
A stir bar was added and the solution was stirred over a stir plate for 20 minutes. The rubber and
solution sat unstirred for an additional 20 minutes before being filtered with a Buchner funnel
and rinsed with water. The rubber was put under a fume hood to air dry.
For one rubber piece, a solution of 50.12 wt% sodium hydroxide (20 mL of water and
20.1 grams of sodium hydroxide pellets), which is close to its saturation point, was prepared in a
small plastic container. After being washed with deionized water first, the rubber sheet was
added to the container, to which also was added a stir bar. The solution was stirred on a stir plate
for 20 minutes. The rubber piece was rinsed again with deionized water.
Two pieces of rubber were set aside to determine how the potassium permanganate and
sodium bisulfite treatment affects the wettability of the rubber sheet. A solution of 5.17 wt%
sodium hydroxide was prepared with 1.635 grams of sodium hydroxide pellets and 30 mL of
water. This solution was prepared in a plastic tube. Two pieces of sheet rubber were added to the
tube. The sheets were allowed to soak in the solution for 46 hours. A 5.06 wt% solution of
potassium permanganate was prepared with 30 mL of water and 1.6002 grams of potassium
permanganate. The rubber sheets were removed from the sodium hydroxide solution and added
to the potassium permanganate solution in a glass deep dish. The dish was added to a water bath
heated to 60°C. A piece of Saran wrap with a hole was placed over the dish and the bath was
covered (to maintain temperature control). The dish was left in the water bath for 3 hours. The
McCannon 23
sheets were removed from the solution, rinsed with water and dried. One of the sheets was set
aside for testing and the other sheet was used to proceed with the sodium bisulfite treatment.
Some of the sodium bisulfite solution that was prepared for the crumb rubber treatment was
added to a glass dish, to which also was added the rubber sheet. Likewise, a piece of Saran wrap
with a hole was placed over the dish. The dish was added to the 60°C water bath and the bath
was covered with a lid. The rubber and solution was left in the bath for 2 hours. During both of
these pretreatment steps, the temperature of the water bath was monitored. After the rubber sheet
was removed from the bath and solution, it was rinsed and dried.
Four glass tubes with a diameter of 4 mm were pre-cleaned to prepare them for
Washburn Capillary Rise tests. First they were ensured to be cleared of rough residue. They were
placed in a glass deep dish, submerged in ethanol and placed in a sonicator for a total of 10
minutes. The ethanol was replaced with water and the dish was placed in the sonicator for 5
minutes. The tubes were then air dried with compressed air. One end of each tube was plugged
with equivalent amounts of cotton. Each tube was filled with equivalent masses of rubber
powder ensuring that the heights of rubber in each tube were identical. The tubes were tapped at
a steady rate for 1 minute. Approximately 300 mL of ethanol was added to a plastic bottle filled
with 50-100 (approximately 75) mL of molecular sieves. The ethanol sat in the molecular sieves
for 2 weeks to remove the water. Some of the anhydrous ethanol was placed in a glass deep dish
and was used as the reference fluid to determine the packing factor of the tubes. A second glass
deep dish was filled with water to determine the contact angle of the rubber.
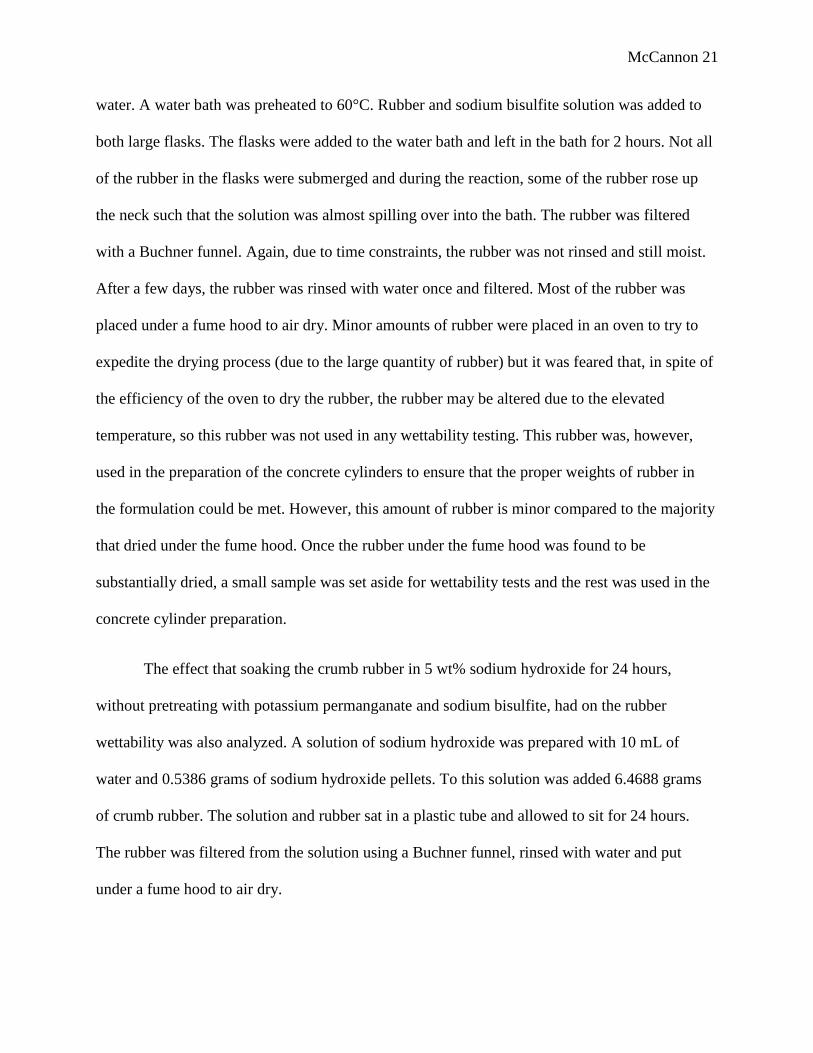
The setup of the Washburn Capillary Rise apparatus is shown below:
McCannon 24
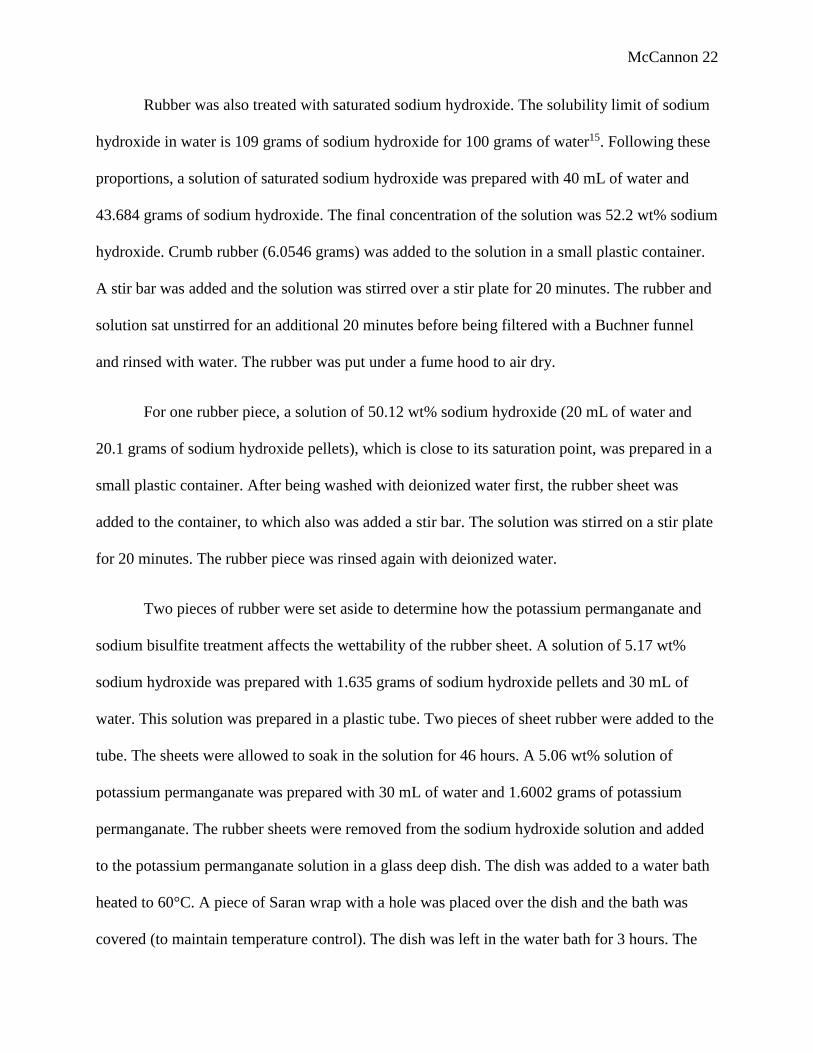
Each tube being tested is attached to a magnetic clip as shown below:
The clip is placed on a magnet which is attached to a mechanical arm that moves and suspends
the tube. The tube is suspended over a weigh scale. Each dish, which was covered with Saran
wrap (to mitigate evaporation) with a hole big enough to accommodate the tube, was placed on
the scale and the scale was set to zero. A computer records the scale reading every 1 second
while the tube was lowered in the solution just low enough to touch the surface. As the solution
rose up the tube, the mass recorded by the weigh scale decreased. Recording stopped once the
tube was no longer taking the solution and was removed from the dish. Anhydrous ethanol was
used as the uptake solution for two tubes and water was used as the uptake solution for the other
McCannon 25
two tubes. The evaporation rate of both water and anhydrous ethanol were monitored by
measuring mass loss of the fluid from the dish over time (and both rates were found to be
negligible and therefore insignificant to the results of the test). The test procedure was conducted
for crumb rubber treated with potassium permanganate and sodium bisulfite. Results are shown
as the square of the mass uptake (kg2) versus time (seconds).
Sessile drop measurements were conducted on untreated crumb rubber, crumb rubber
treated with 5 wt% sodium hydroxide for 24 hours, crumb rubber treated with saturated sodium
hydroxide for 20 minutes and crumb rubber treated with the combination of 5 wt% sodium
hydroxide, potassium permanganate and sodium bisulfite. A piece of double sided tape was
placed on a glass slide and crumb rubber was deposited on the tape. A spatula was used to press
on the rubber to help with adhesion. Compressed air was used to blow excess rubber off of the
tape and slide. This was repeated until a satisfactory amount of rubber was adhering to the tape
or until no more rubber could be adhered to the tape. It was noted that any possible handling of
rubber samples or slides with bare hands may deposit grease on the rubber, possibly affecting
results. It was also noted that because the rubber treated with potassium permanganate and
sodium bisulfite may not have been sufficiently rinsed, some chemical residue on the rubber can
possibly remain. This problem may explain why the double sided tape was not sticking to this
rubber and why there were more gaps in the tape. For each of these slides, images were taken
under a microscope with a 4X magnification for all rubber types. Images were used to determine
the area fraction on the measured surface that was crumb rubber. The area fraction was used to
correct for the true contact angle using the Cassie-Baxter Equation7. Sessile drop was used to
measure contact angle for each rubber sample by placing a drop of water on the rubber surface
McCannon 26
and taking images of the droplet. Multiple measurements of both the contact angle and
microscopic images were taken for statistical significance.
Hydrophobic partitioning was used to qualitatively and relatively characterize the
wettability of unmodified crumb rubber, crumb rubber treated with only 5 wt% sodium
hydroxide for 24 hours and crumb rubber treated with the combination of 5 wt% sodium
hydroxide, potassium permanganate and sodium bisulfite. To three vials were added 5 mL of
water and 5 mL of hexane. To each of the 3 vials were added each of the 3 types of rubber
(0.1029 grams of unmodified rubber, 0.1006 grams of rubber treated with 5 wt% of sodium
hydroxide for 24 hours and 0.0995 grams of rubber treated with a combination of 5 wt% sodium
hydroxide, potassium permanganate and sodium bisulfite). The vials were shaken and the
distribution of the rubber in each of the phases was monitored. The vials were also left to sit for a
few days before making any further observations.
Sessile drop measurements were conducted on rubber sheets that were unmodified,
treated with saturated sodium hydroxide, treated with 5 wt% sodium hydroxide and potassium
permanganate only and treated with the combination 5 wt% sodium hydroxide, potassium
permanganate and sodium bisulfite. Before measuring the contact angle of the unmodified
rubber, the rubber piece was washed with deionized water. For each rubber type, contact angle
was found by placing a drop of water on top of the sheet and taking images of the droplet.
Multiple measurements were taken for statistical significance.
To modify rubber sheets using UV and plasma, three pieces of rubber sheet were rinsed
with ethanol and then rinsed with deionized water. The pieces were then air dried with a hose.
McCannon 27
One piece was set aside as the unmodified reference and contact angle measurements were taken
for this piece using Sessile Drop.
To do the UV treatment, one of the other two pieces was placed in the UV chamber for 8
minutes. To do the plasma treatment, the other piece was placed in the plasma chamber. The
rubber underwent 5 minutes under vacuum before undergoing 5 minutes of plasma treatment.
Sessile Drop measurements were taken for both pieces immediately after treatment. Two hours
were allowed to pass before Sessile Drop measurements were taken. Finally, five days were
allowed to pass before Sessile Drop measurements were taken.
To test the crumb rubber in concrete, three sets of cylinders—some designated as control
samples without any crumb rubber added, some with unmodified rubber and some with modified
rubber—were created. It was also desired to test the cylinder sets under different atmospheric
conditions. Some samples were broken after 28 days of curing and others were broken after an
additional 28 days where some continued to cure at room temperature, some at 4 °C and some at
temperature variations between 4 °C and -18 °C following ASTM C666 16.
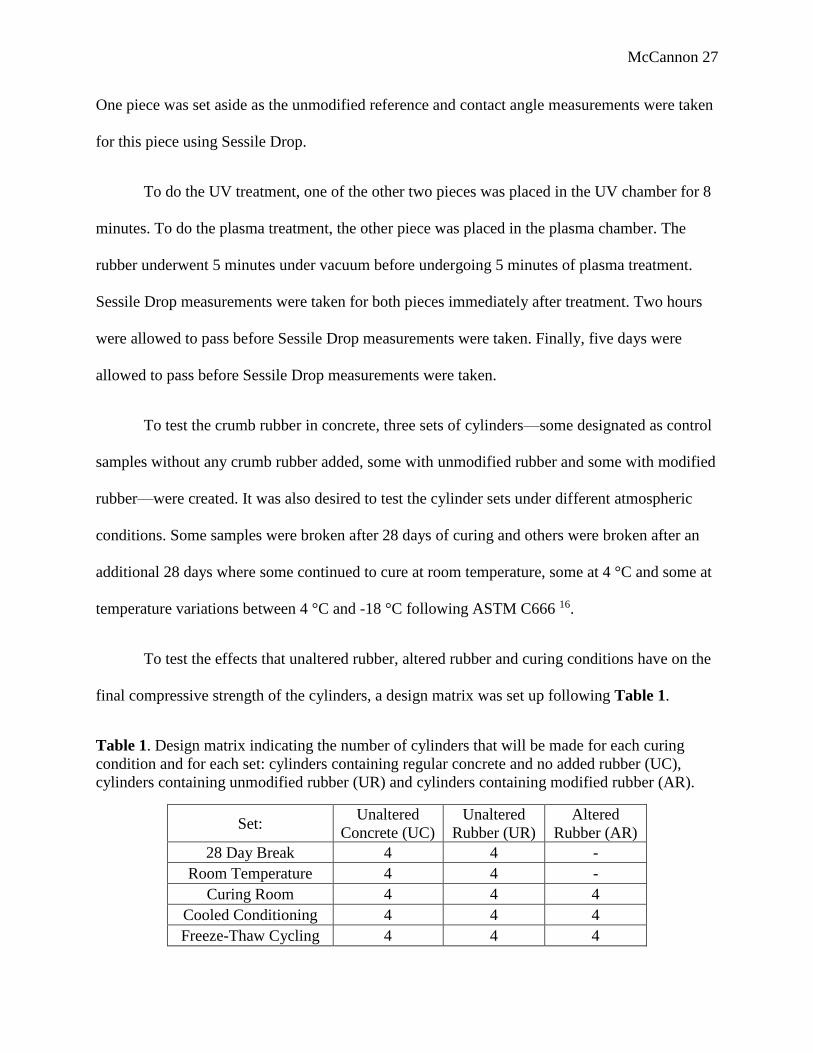
To test the effects that unaltered rubber, altered rubber and curing conditions have on the
final compressive strength of the cylinders, a design matrix was set up following Table 1.
Table 1. Design matrix indicating the number of cylinders that will be made for each curing
condition and for each set: cylinders containing regular concrete and no added rubber (UC),
cylinders containing unmodified rubber (UR) and cylinders containing modified rubber (AR).
Set: Unaltered
Concrete (UC)
Unaltered
Rubber (UR)
Altered
Rubber (AR)
28 Day Break 4 4 -
Room Temperature 4 4 -
Curing Room 4 4 4
Cooled Conditioning 4 4 4
Freeze-Thaw Cycling 4 4 4
McCannon 28
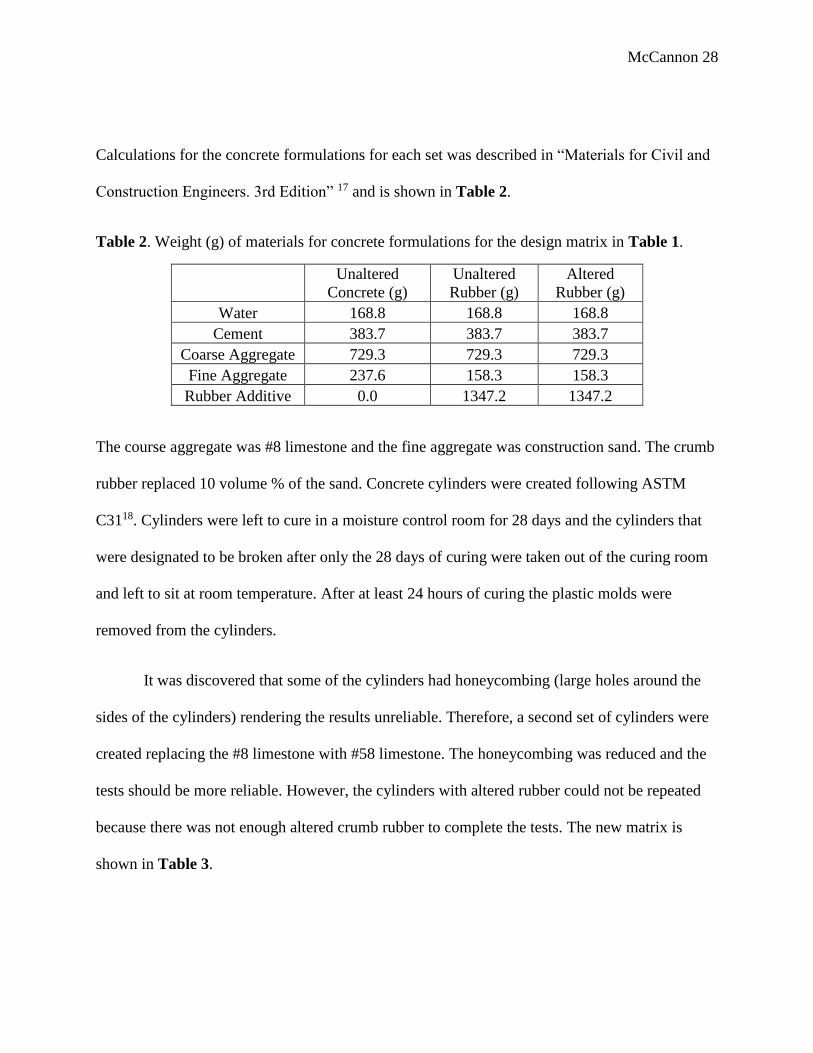
Calculations for the concrete formulations for each set was described in “Materials for Civil and
Construction Engineers. 3rd Edition” 17 and is shown in Table 2.
Table 2. Weight (g) of materials for concrete formulations for the design matrix in Table 1.
Unaltered
Concrete (g)
Unaltered
Rubber (g)
Altered
Rubber (g)
Water 168.8 168.8 168.8
Cement 383.7 383.7 383.7
Coarse Aggregate 729.3 729.3 729.3
Fine Aggregate 237.6 158.3 158.3
Rubber Additive 0.0 1347.2 1347.2
The course aggregate was #8 limestone and the fine aggregate was construction sand. The crumb
rubber replaced 10 volume % of the sand. Concrete cylinders were created following ASTM
C3118. Cylinders were left to cure in a moisture control room for 28 days and the cylinders that
were designated to be broken after only the 28 days of curing were taken out of the curing room
and left to sit at room temperature. After at least 24 hours of curing the plastic molds were
removed from the cylinders.
It was discovered that some of the cylinders had honeycombing (large holes around the
sides of the cylinders) rendering the results unreliable. Therefore, a second set of cylinders were
created replacing the #8 limestone with #58 limestone. The honeycombing was reduced and the
tests should be more reliable. However, the cylinders with altered rubber could not be repeated
because there was not enough altered crumb rubber to complete the tests. The new matrix is
shown in Table 3.
McCannon 29
Table 3. Second design matrix indicating the number of cylinders that will be made for each
curing condition and for each set: cylinders containing regular concrete and no added rubber and
cylinders containing unmodified rubber.
Set: Unaltered Concrete Unaltered Rubber
1: 28 Day Break 4 4
2: Curing Room 4 4
3:Room Temperature 4 4
4:Cooled Conditioning 4 4
5:Freeze-Thaw Cycling 4 4
The formulations for each set are given in Table 4.
Table 4. Weight (g) of materials for concrete formulations for the design matrix in Table 3.
Unaltered Concrete
(UC)
Unaltered Rubber
(UR)
Water 384.2 384.2
Cement 169.0 169.0
Coarse Aggregate 759.9 759.9
Fine Aggregate 270.1 85.5
Rubber Additive 0.0 79.2
For the samples that underwent freeze-thaw testing, the procedure was followed using
ASTM C666 16 where the samples underwent freeze-thaw testing after the 28 days of curing.
Specifically, cylinders were frozen over a 24 hour time span, thawed over the next 24 hour time
span and repeated 14 times.
Compressive strength testing was followed using ASTM C39 19. Unbounded rubber caps
were utilized following ASTM C1231 20. The loads were placed on the cylinders at a rate of
30,000 lbs/min ± 5,000 lb/min following the request of the lab technician.
McCannon 30
Data and Results
(a) (b) (c) (d)
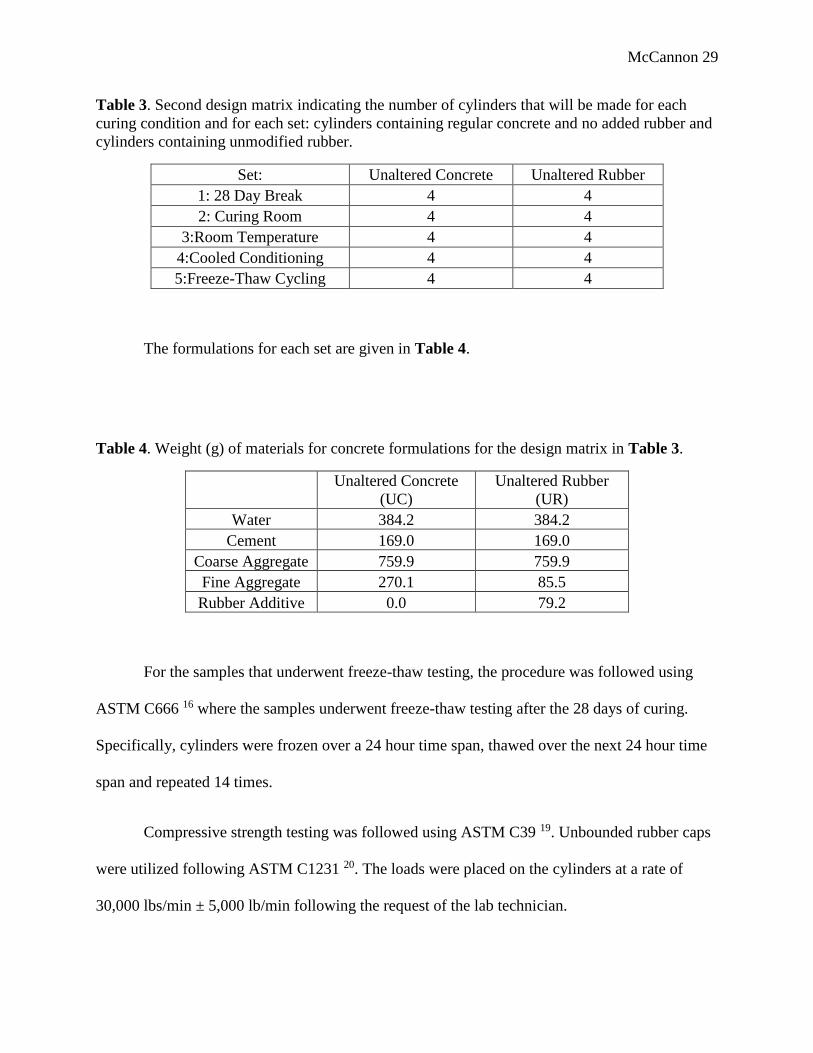
Figure 1. Images at 4X magnification of (a) unmodified crumb rubber (b) crumb rubber treated
with saturated NaOH for 20 min (c) crumb rubber treated with 5 % NaOH for 24 hours and (d)
crumb rubber treated with 5 % NaOH, 5 % KMnO4 and saturated NaHSO3 on double-sided tape
and glass slide. Each image has a size of ~ 1200 µm x 900 µm.
(a) (b) (c) (d)
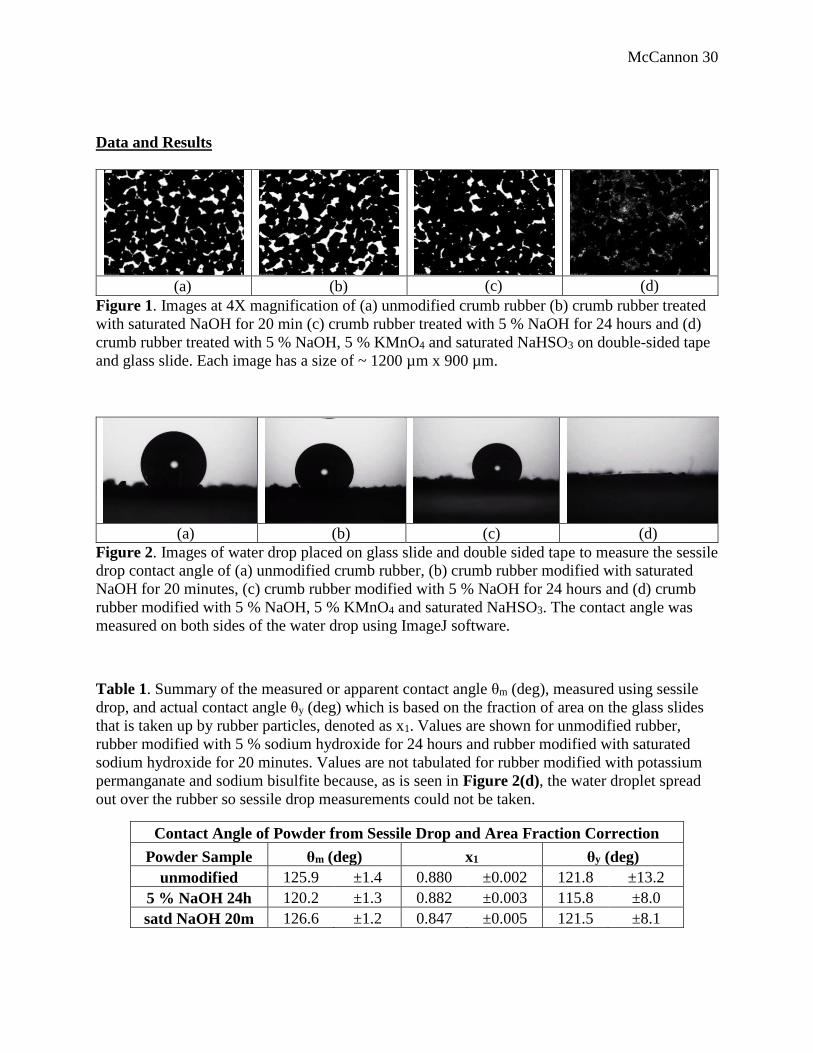
Figure 2. Images of water drop placed on glass slide and double sided tape to measure the sessile
drop contact angle of (a) unmodified crumb rubber, (b) crumb rubber modified with saturated
NaOH for 20 minutes, (c) crumb rubber modified with 5 % NaOH for 24 hours and (d) crumb
rubber modified with 5 % NaOH, 5 % KMnO4 and saturated NaHSO3. The contact angle was
measured on both sides of the water drop using ImageJ software.
Table 1. Summary of the measured or apparent contact angle θm (deg), measured using sessile
drop, and actual contact angle θy (deg) which is based on the fraction of area on the glass slides
that is taken up by rubber particles, denoted as x1. Values are shown for unmodified rubber,
rubber modified with 5 % sodium hydroxide for 24 hours and rubber modified with saturated
sodium hydroxide for 20 minutes. Values are not tabulated for rubber modified with potassium
permanganate and sodium bisulfite because, as is seen in Figure 2(d), the water droplet spread
out over the rubber so sessile drop measurements could not be taken.
Contact Angle of Powder from Sessile Drop and Area Fraction Correction
Powder Sample θm (deg) x1 θy (deg)
unmodified 125.9 ±1.4 0.880 ±0.002 121.8 ±13.2
5 % NaOH 24h 120.2 ±1.3 0.882 ±0.003 115.8 ±8.0
satd NaOH 20m 126.6 ±1.2 0.847 ±0.005 121.5 ±8.1
McCannon 31
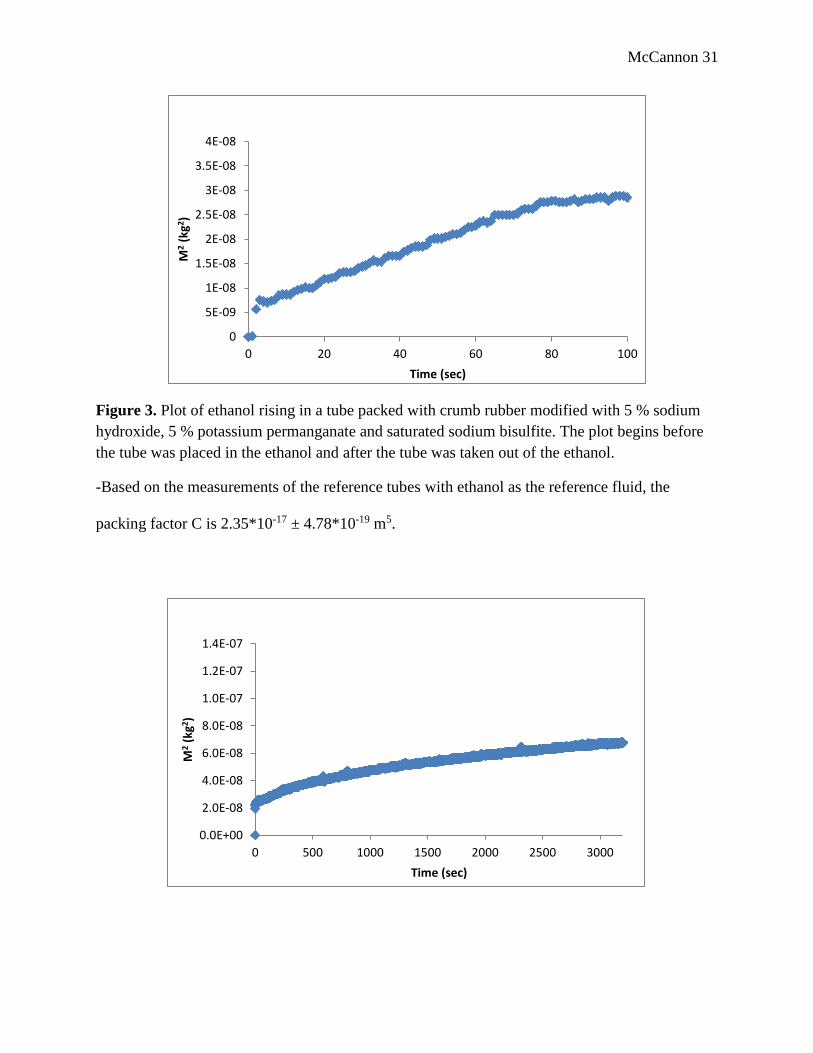
Figure 3. Plot of ethanol rising in a tube packed with crumb rubber modified with 5 % sodium
hydroxide, 5 % potassium permanganate and saturated sodium bisulfite. The plot begins before
the tube was placed in the ethanol and after the tube was taken out of the ethanol.
-Based on the measurements of the reference tubes with ethanol as the reference fluid, the
packing factor C is 2.35*10-17 ± 4.78*10-19 m5.
0
5E-09
1E-08
1.5E-08
2E-08
2.5E-08
3E-08
3.5E-08
4E-08
0 20 40 60 80 100
M2
(kg2
)
Time (sec)
0.0E+00
2.0E-08
4.0E-08
6.0E-08
8.0E-08
1.0E-07
1.2E-07
1.4E-07
0 500 1000 1500 2000 2500 3000
M2
(kg2 )
Time (sec)
McCannon 32
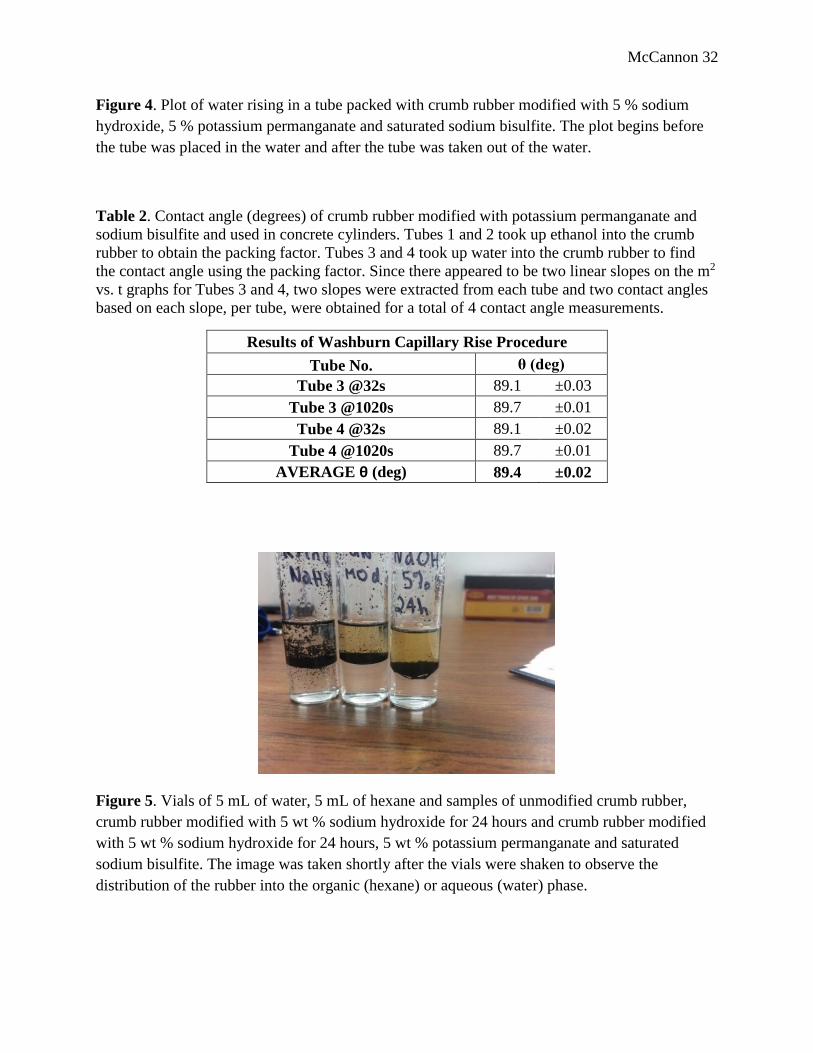
Figure 4. Plot of water rising in a tube packed with crumb rubber modified with 5 % sodium
hydroxide, 5 % potassium permanganate and saturated sodium bisulfite. The plot begins before
the tube was placed in the water and after the tube was taken out of the water.
Table 2. Contact angle (degrees) of crumb rubber modified with potassium permanganate and
sodium bisulfite and used in concrete cylinders. Tubes 1 and 2 took up ethanol into the crumb
rubber to obtain the packing factor. Tubes 3 and 4 took up water into the crumb rubber to find
the contact angle using the packing factor. Since there appeared to be two linear slopes on the m2
vs. t graphs for Tubes 3 and 4, two slopes were extracted from each tube and two contact angles
based on each slope, per tube, were obtained for a total of 4 contact angle measurements.
Results of Washburn Capillary Rise Procedure
Tube No. θ (deg)
Tube 3 @32s 89.1 ±0.03
Tube 3 @1020s 89.7 ±0.01
Tube 4 @32s 89.1 ±0.02
Tube 4 @1020s 89.7 ±0.01
AVERAGE θ (deg) 89.4 ±0.02
Figure 5. Vials of 5 mL of water, 5 mL of hexane and samples of unmodified crumb rubber,
crumb rubber modified with 5 wt % sodium hydroxide for 24 hours and crumb rubber modified
with 5 wt % sodium hydroxide for 24 hours, 5 wt % potassium permanganate and saturated
sodium bisulfite. The image was taken shortly after the vials were shaken to observe the
distribution of the rubber into the organic (hexane) or aqueous (water) phase.
McCannon 33
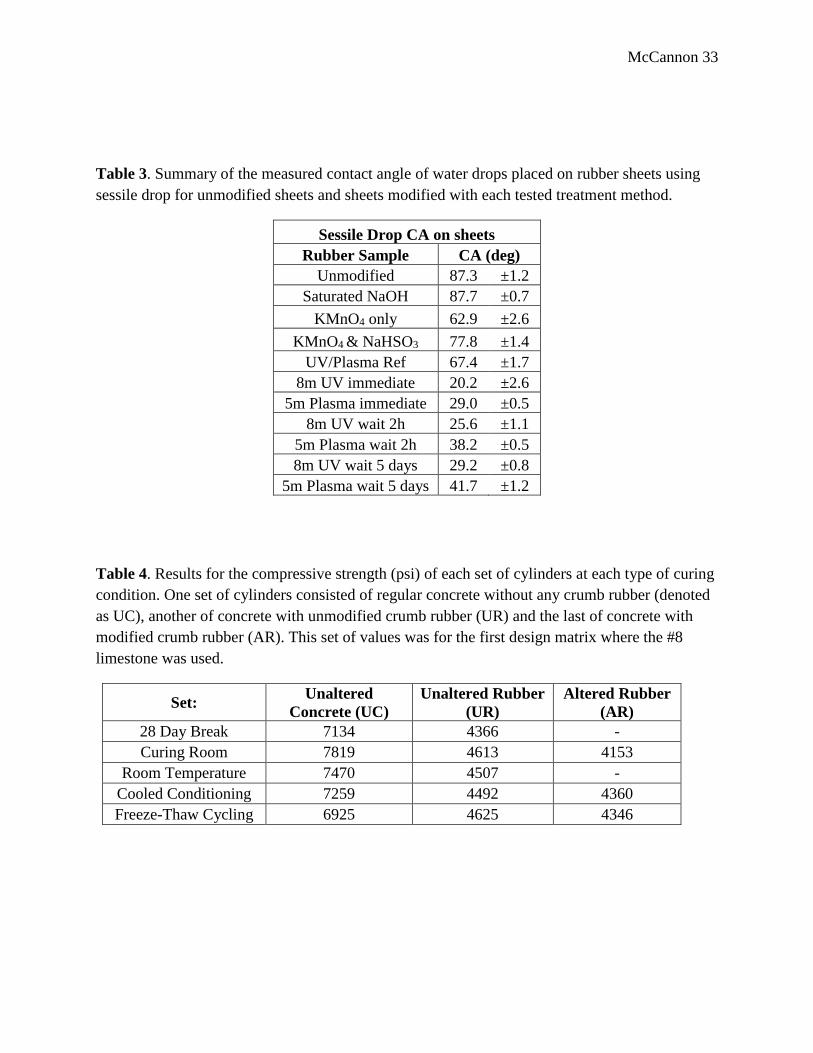
Table 3. Summary of the measured contact angle of water drops placed on rubber sheets using
sessile drop for unmodified sheets and sheets modified with each tested treatment method.
Sessile Drop CA on sheets
Rubber Sample CA (deg)
Unmodified 87.3 ±1.2
Saturated NaOH 87.7 ±0.7
KMnO4 only 62.9 ±2.6
KMnO4 & NaHSO3 77.8 ±1.4
UV/Plasma Ref 67.4 ±1.7
8m UV immediate 20.2 ±2.6
5m Plasma immediate 29.0 ±0.5
8m UV wait 2h 25.6 ±1.1
5m Plasma wait 2h 38.2 ±0.5
8m UV wait 5 days 29.2 ±0.8
5m Plasma wait 5 days 41.7 ±1.2
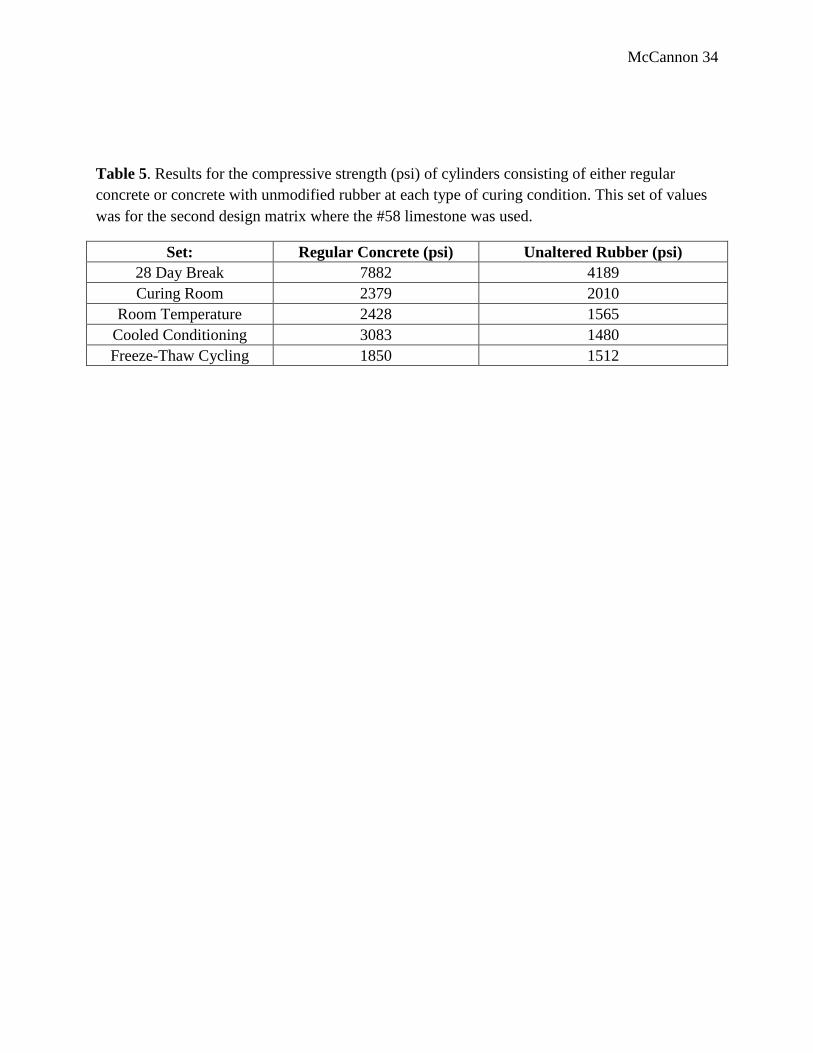
Table 4. Results for the compressive strength (psi) of each set of cylinders at each type of curing
condition. One set of cylinders consisted of regular concrete without any crumb rubber (denoted
as UC), another of concrete with unmodified crumb rubber (UR) and the last of concrete with
modified crumb rubber (AR). This set of values was for the first design matrix where the #8
limestone was used.
Set: Unaltered
Concrete (UC)
Unaltered Rubber
(UR)
Altered Rubber
(AR)
28 Day Break 7134 4366 -
Curing Room 7819 4613 4153
Room Temperature 7470 4507 -
Cooled Conditioning 7259 4492 4360
Freeze-Thaw Cycling 6925 4625 4346
McCannon 34
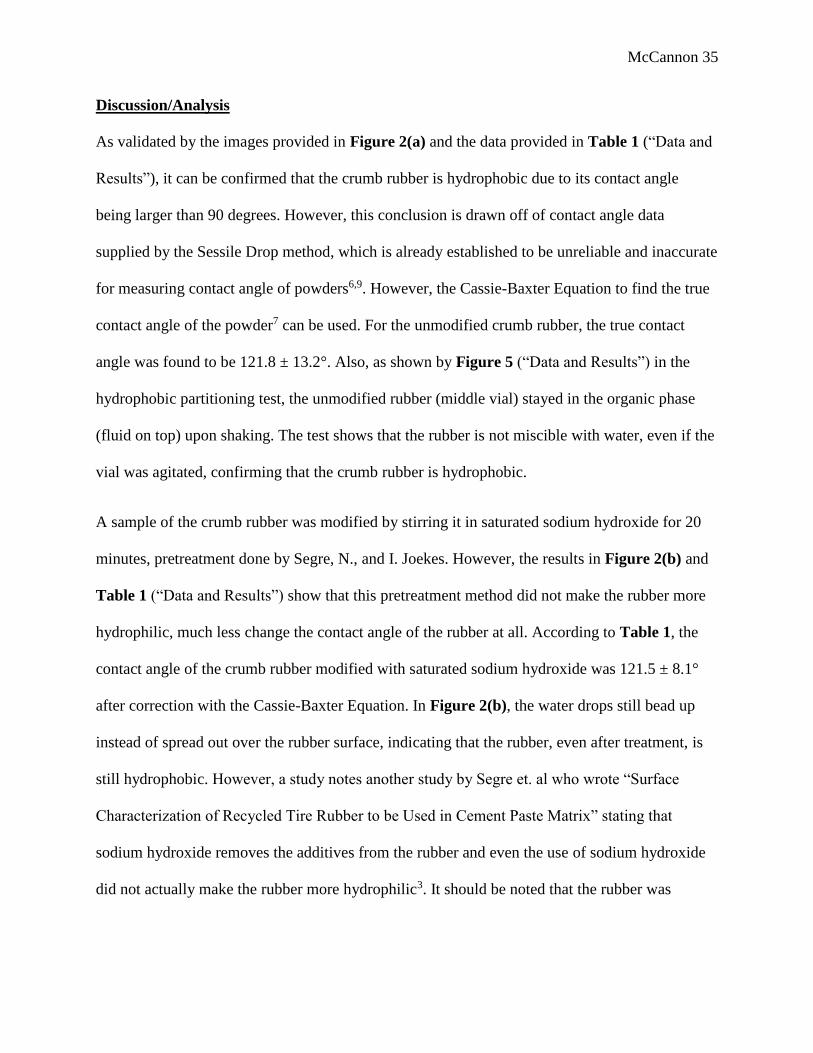
Table 5. Results for the compressive strength (psi) of cylinders consisting of either regular
concrete or concrete with unmodified rubber at each type of curing condition. This set of values
was for the second design matrix where the #58 limestone was used.
Set: Regular Concrete (psi) Unaltered Rubber (psi)
28 Day Break 7882 4189
Curing Room 2379 2010
Room Temperature 2428 1565
Cooled Conditioning 3083 1480
Freeze-Thaw Cycling 1850 1512
McCannon 35
Discussion/Analysis
As validated by the images provided in Figure 2(a) and the data provided in Table 1 (“Data and
Results”), it can be confirmed that the crumb rubber is hydrophobic due to its contact angle
being larger than 90 degrees. However, this conclusion is drawn off of contact angle data
supplied by the Sessile Drop method, which is already established to be unreliable and inaccurate
for measuring contact angle of powders6,9. However, the Cassie-Baxter Equation to find the true
contact angle of the powder7 can be used. For the unmodified crumb rubber, the true contact
angle was found to be 121.8 ± 13.2°. Also, as shown by Figure 5 (“Data and Results”) in the
hydrophobic partitioning test, the unmodified rubber (middle vial) stayed in the organic phase
(fluid on top) upon shaking. The test shows that the rubber is not miscible with water, even if the
vial was agitated, confirming that the crumb rubber is hydrophobic.
A sample of the crumb rubber was modified by stirring it in saturated sodium hydroxide for 20
minutes, pretreatment done by Segre, N., and I. Joekes. However, the results in Figure 2(b) and
Table 1 (“Data and Results”) show that this pretreatment method did not make the rubber more
hydrophilic, much less change the contact angle of the rubber at all. According to Table 1, the
contact angle of the crumb rubber modified with saturated sodium hydroxide was 121.5 ± 8.1°
after correction with the Cassie-Baxter Equation. In Figure 2(b), the water drops still bead up
instead of spread out over the rubber surface, indicating that the rubber, even after treatment, is
still hydrophobic. However, a study notes another study by Segre et. al who wrote “Surface
Characterization of Recycled Tire Rubber to be Used in Cement Paste Matrix” stating that
sodium hydroxide removes the additives from the rubber and even the use of sodium hydroxide
did not actually make the rubber more hydrophilic3. It should be noted that the rubber was
McCannon 36
soaked unstirred for an additional 20 minutes after being stirred for 20 minutes, a deviation from
the original study, but this extra 20 minutes did not yield a hydrophilic rubber anyway.
Another sample of the crumb rubber was modified by soaking it in 5 % sodium hydroxide for 24
hours, as done by He, et al for prewashing the rubber. As shown by Figure 2(c), even after
treatment, the water drops still beaded up instead of spread out over the rubber surface,
indicating that the rubber still remained hydrophobic. According to Table 1, the contact angle of
the rubber, after correction with the Cassie-Baxter Equation, decreased to 115.8 ± 8.0°.
However, this change is insignificant and generally did not make the rubber more hydrophilic.
Additionally, as indicated in Figure 5, the rubber (vial on the right) stayed in the organic (top)
phase instead of move into the aqueous (bottom) phase after agitation of the vial. This behavior
further confirms that this modification does not generally make the rubber more hydrophilic.
The crumb rubber that was added to the concrete cylinders for compression strength testing after
treatment with potassium permanganate and sodium bisulfite was tested for hydrophilicity. As
shown by Figure 2(d), when water drops were added to the rubber surface on the glass slide, the
water spread out over the rubber and disappeared into the grooves. This behavior gives some
indication of an increase in hydrophilicity. However, the image of the glass slides in Figure A39
(see “Appendix”) shows that, compared to the unmodified crumb rubber and crumb rubber
treated with 5 % sodium hydroxide, there appears to be more voids on the glass slide with crumb
rubber modified with potassium permanganate and sodium bisulfite which may have impacted
the distribution of water across the rubber. There is the possibility that the roughness made the
contact angle look smaller than it really is6. In Figure 5, some of the rubber (vial on the left)
moved into and stayed in the aqueous (bottom) phase upon agitation of the vial. This behavior
indicates that the rubber has become more hydrophilic. From the Washburn Capillary Rise
McCannon 37
results depicted in Table 2, the contact angle decreased to 89.4 ± 0.02°. There was a more
noticeable decrease of the contact angle from that of the unmodified rubber (from the sessile
drop method and after the Cassie-Baxter correction), even though the rubber did not become
dramatically more hydrophilic.
While the Washburn Capillary Rise method is typically used for testing wettability of powders6,
the method is also more tedious and time consuming. Also, while determining the best way to
run the Washburn Capillary Rise on the modified rubber, it was found that hexane was not a
reliable reference fluid due to the observation that the hexane was causing the rubber to swell
(during some runs of testing unmodified rubber with hexane, the hexane stopped rising after
some time). Therefore, the reference fluid was changed to anhydrous ethanol. This reference
fluid did not seem to swell the rubber since it rose more easily. In fact, for testing the modified
crumb rubber, the ethanol appeared to rise up the tube rather quickly. It was determined that the
evaporation rate of both water and anhydrous ethanol were negligible and the m2 vs. t graphs did
not need to contain a correction for evaporation of the fluids.
The hydrophobic partitioning method has proved to be a quick and reliable method for testing
the hydrophilicity of the rubber after treatment but for this study the results are more qualitative
than quantitative.
In order to use the sessile drop method for testing modification methods more quickly, more
simply and more reliably, the same modification methods, plus more, were tested on small pieces
of a rubber sheet. Figure A21 (“Appendix”) shows the images of how the water drop spreads on
the rubber surface before any pretreatment. The contact angle of the unmodified rubber is 87.3 ±
1.2° (see Table 3). After soaking a rubber sheet in saturated sodium hydroxide for 20 minutes,
McCannon 38
the contact angle was 87.7 ± 0.7° (see Table 3). In fact, the images in Figure A21, how the
water spreads on the unmodified rubber sheet, and in Figure A22 (both in “Appendix”), how the
water spreads on the rubber sheet soaked in saturated sodium hydroxide for 20 minutes, look
similar. Therefore, it can be concluded that pretreatment of rubber with saturated sodium
hydroxide for 20 minutes does not make the rubber more hydrophilic.
Figure A23 (“Appendix”) shows how the water drop spread over a rubber sheet modified with
sodium hydroxide and potassium permanganate only. Here, the water seems to more easily
spread out over the rubber, compared to the unmodified rubber and rubber soaked in saturated
sodium hydroxide. Additionally, according to Table 3, the contact angle of the rubber sheet is
62.9 ± 2.6°. Clearly, the rubber has become more hydrophilic, though not more dramatically so.
Figure A45 (“Appendix”) shows how the rubber sheet looks after pretreatment with potassium
permanganate. Some ridges had formed across the surface. Some surface cracks have also
seemed to appear, an indicator of the oxidation reaction that took place. Even though this
pretreatment can make the rubber more hydrophilic, there is also the possibility that the surface
roughness (formation of ridges and cracks) can affect the results of the sessile drop, as the
surface is not truly smooth.
According to Table 3, after the rubber was pretreated with both potassium permanganate and
sodium bisulfite, the contact angle was reported to increase instead of decrease, which was not
what was expected to occur. After the sodium bisulfite pretreatment, the contact angle was 77.8
± 1.4°. In fact, the images in Figure A24 (“Appendix”), which show how the water drop spread
over the rubber sheet modified with both potassium permanganate and sodium bisulfite, look
similar to those images of the unmodified rubber and rubber treated with saturated sodium
hydroxide. These results could be attributed to possible error in contact angle measurement,
McCannon 39
possible contamination of the surface, or the fact that the saturated sodium bisulfite solution used
in this test had been sitting undisturbed for an extended period of time before being used. In spite
of this, the combined pretreatment does yield a lower contact angle of the rubber compared to the
unmodified rubber.
Rubber sheets were also tested with ultraviolet (UV) light and plasma to determine whether these
methods can make the rubber more hydrophilic and to what degree. Figure A25 (“Appendix”)
shows how the water spread on the rubber surface before any of these pretreatment methods, but
after the rubber was washed with ethanol and water and air dried. Strangely, this contact angle
was similar to the contact angle of the rubber after treatment with potassium permanganate (see
Table 3). The results in Table 3 and in Figures A26-A31 (“Appendix”) show that both
pretreatment methods do make the rubber more hydrophilic, even after 5 days following the
pretreatment. According to Table 3, after immediate pretreatment with UV, the contact angle
was 20.2 ± 2.6°. Two hours after the pretreatment, the contact angle was 25.6 ± 1.1°. Five days
after the pretreatment, the contact angle was 29.2 ± 0.8°. Figure A26 shows that immediately
after pretreating the rubber with UV, the water spread easily over the rubber surface. Even after 2
hours, the water spread fairly easily over the rubber surface (see Figure A28). After 5 days, the
water still spread over the surface, though still to a lesser degree (see Figure A30).
According to Table 3, pretreatment of the rubber with plasma also made it more significantly
hydrophilic, although not to the same degree as the UV treatment. After immediate pretreatment
with plasma, the contact angle was 29.0 ± 0.5°. Two hours after the pretreatment, the contact
angle was 38.2 ± 0.5°. Five days after the pretreatment, the contact angle was 41.7 ± 1.2°. As
shown in Figure A27, the water spread fairly easily over the rubber. As shown in Figure A29, 2
hours after pretreatment with plasma, the water still spread over the surface, though to a lesser
McCannon 40
degree than immediately after pretreatment. As shown in Figure A31, five days after
pretreatment, the water still spread over the rubber, though not as much as 2 hours after
pretreatment. For both UV and plasma treatment, the rubber became more hydrophobic as time
went by after the pretreatment but even after 5 days, the rubber was still more hydrophilic
compared to before it was pretreated. The crumb rubber could not be pretreated with UV or
plasma due to the potential of the crumb rubber harming the UV and plasma machines. However,
if the UV and plasma treatment could be tested on crumb rubber, it is possible that the
pretreatments will decrease the contact angle of the crumb rubber and make crumb rubber more
hydrophilic.
One of the limitations of this study is the possibility that the crumb rubber and the rubber sheets
may not be the same chemically, let alone the fact that the chemical composition of the rubber
sheets is not known at all. Therefore, it is possible that pretreatments used on crumb would not
give exactly the same effect on rubber sheets and vice versa. However, since they are both of an
elastomeric material, which is inherently hydrophobic2, there may still be similarities.
It should also be noted that any contamination of the rubber surfaces before and after treatment
(especially with oil on the skin that can make the surface even more hydrophobic) can impact
some of the results of this study.
The crumb rubber used in this study was assumed to be homogeneous, even though in reality
there may be some variations in size, particle geometry and possibly even particle-to-particle
composition.
Based on these results, any pretreatment using sodium hydroxide yield little to no change in the
contact angle and does not make rubber hydrophilic. Pretreatment with potassium permanganate
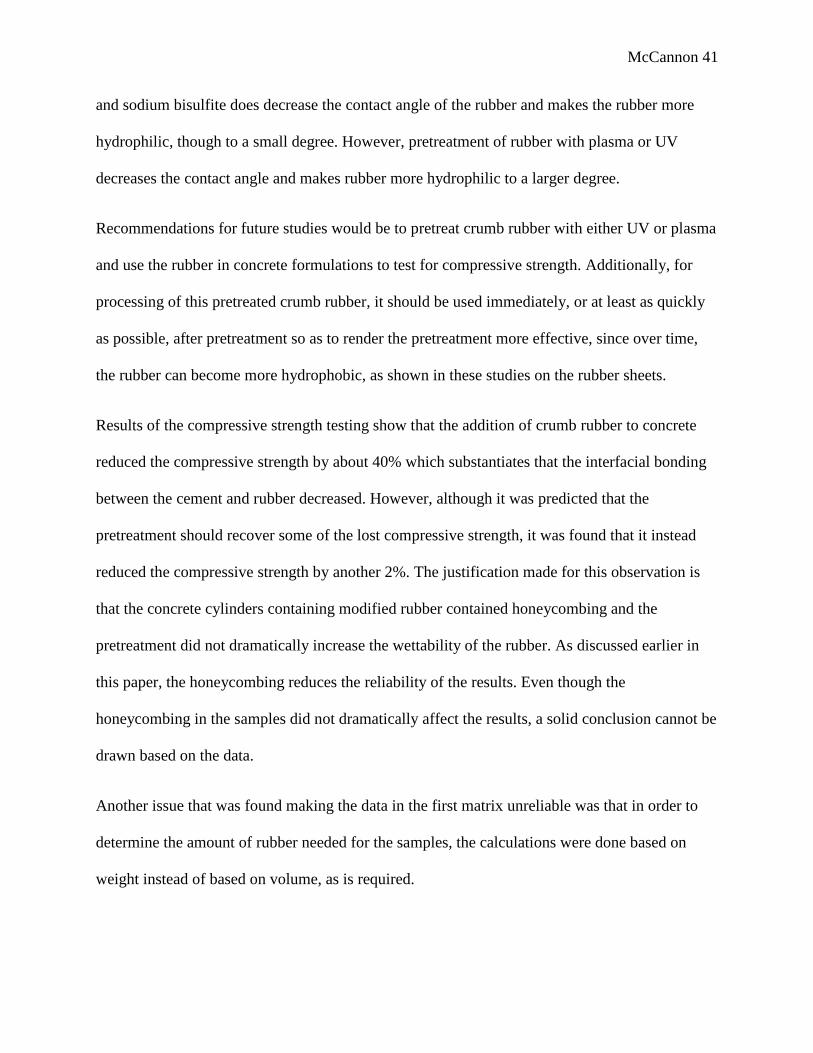
McCannon 41
and sodium bisulfite does decrease the contact angle of the rubber and makes the rubber more
hydrophilic, though to a small degree. However, pretreatment of rubber with plasma or UV
decreases the contact angle and makes rubber more hydrophilic to a larger degree.
Recommendations for future studies would be to pretreat crumb rubber with either UV or plasma
and use the rubber in concrete formulations to test for compressive strength. Additionally, for
processing of this pretreated crumb rubber, it should be used immediately, or at least as quickly
as possible, after pretreatment so as to render the pretreatment more effective, since over time,
the rubber can become more hydrophobic, as shown in these studies on the rubber sheets.
Results of the compressive strength testing show that the addition of crumb rubber to concrete
reduced the compressive strength by about 40% which substantiates that the interfacial bonding
between the cement and rubber decreased. However, although it was predicted that the
pretreatment should recover some of the lost compressive strength, it was found that it instead
reduced the compressive strength by another 2%. The justification made for this observation is
that the concrete cylinders containing modified rubber contained honeycombing and the
pretreatment did not dramatically increase the wettability of the rubber. As discussed earlier in
this paper, the honeycombing reduces the reliability of the results. Even though the
honeycombing in the samples did not dramatically affect the results, a solid conclusion cannot be
drawn based on the data.
Another issue that was found making the data in the first matrix unreliable was that in order to
determine the amount of rubber needed for the samples, the calculations were done based on
weight instead of based on volume, as is required.
McCannon 42
Based on the data, no definite confirmation of the hypothesis could be drawn based on the issues
during in the compressive strength testing, the unexpected decrease in compressive strength of
the cylinders with modified rubber and the minimal increase in wettability of the treated rubber.
McCannon 43
Literature Cited 1Kaloush, Kamil E., George B. Way, and Han Zhu. "Properties of Crumb Rubber Concrete." Journal of
the Transportation Research Board 1914 (2004): 1-22.
2Haibo, Zhang, Gou Mifeng, Liu Xiaoxing, and Guan Xuemao. "Effect of Rubber Particle Modification
on Properties of Rubberized Concrete." Journal of Wuhan University of Technology-Mater. Sci.
Ed., 18 (2014): 763-68
3He, Liang, et al. "Surface Modification of Crumb Rubber and Its Influence on The Mechanical
Properties Of Rubber-Cement Concrete." Construction and Building Materials 120 (2016): 403-
407.
4Segre, N., and I. Joekes. "Use of Tire Rubber Particles as Addition to Cement Paste." Pergamon:
Cement and Concrete Research, 30(9) (2000): 1421-25.
5Yehia, A., E. M. Abdelbary, M. Mull, M. N. Ismail, and Y. Hefny. "New Trends for Utilization of
Rubber Wastes." Macromolecular Symposia, 320(1) (2012): 5-14.
6Alghunaim, Abdullah, Suchata Kirdponpattara, and Bi-min Zhang Newby. "Techniques for
Determining Contact Angle and Wettability of Powders." Powder Technology, 287 (2016): 201-
15.
7Influence of Surface Roughness on Contact Angle and Wettability [Internet]. Biolin Scientific; [cited
2017 Mar 13]. Available from
www.biolinscientific.com/zafepress.php?url=%2Fpdf%2FAttension%2FTheory%20Notes%2FA
T_TN_7_roughness.pdf.
McCannon 44
8Chou, Liang-Hisng, Chun-Nan Lin, Chun-Ku Lu, Cheng-Haw Lee, and Maw-Tien Lee. "Improving
Rubber Concrete by Waste Organic Sulfur Compounds." Waste Management and Research,
28(1) (2010): 29-35.
9Alghunaim, Abdullah, and Bi-min Zhang Newby. "Influence of Tube Wettability on Water Contact
Angle of Powders Determined by Capillary Rise." Colloids and Surfaces A: Physicochemical
and Engineering Aspects, 492 (2016): 79-87.
10Mangaraj D. 2001. Elastomer Blends [Internet]. Columbus (OH): Battelle Memorial Institute; [cited
2017 Apr 11]. Available from wwwcourses.sens.buffalo.edu/ce435/Mangaraj2002.pdf.
11Bhowmick AK, Hall MM, Benarey HA. 1994. Rubber Products Manufacturing Technology. New
York (NY): Marcel Dekker, Inc. 46 p.
12Guo R, Talma AG, Datta RN, Dierkes WK, Noordermeer JWM. Solubility Study of Curatives in
Various Rubbers. Elastomer Technology and Engineering University of Twente.
13Burke J. 1984. Solubility Parameters: Theory and Application [Internet]. The Book and Paper Group
ANNUAL: The American Institute for Conservation; [cited 2017 Apr 11]. Available from
cool.conservation-us.org/coolaic/sg/bpg/annual/v03/bp03-04.html.
14Minagi, Shogo, Yoichiro Miyake, Yumi Fujioka, Hiromichi Tsuru, and Hidekazu Suginaka. "Cell-
surface Hydrophobicity of Candida Species as Determined by the Contact-angle and
Hydrocarbon-adherence Methods." Journal of General Microbiology, 132(4) (1986): 1111-15.
15Sodium Hydroxide Solution [Internet]. PubChem: Open Chemistry Database; [cited 2017 Apr 12].
Available from
https://pubchem.ncbi.nlm.nih.gov/compound/sodium_hydroxide#section=Solubility.
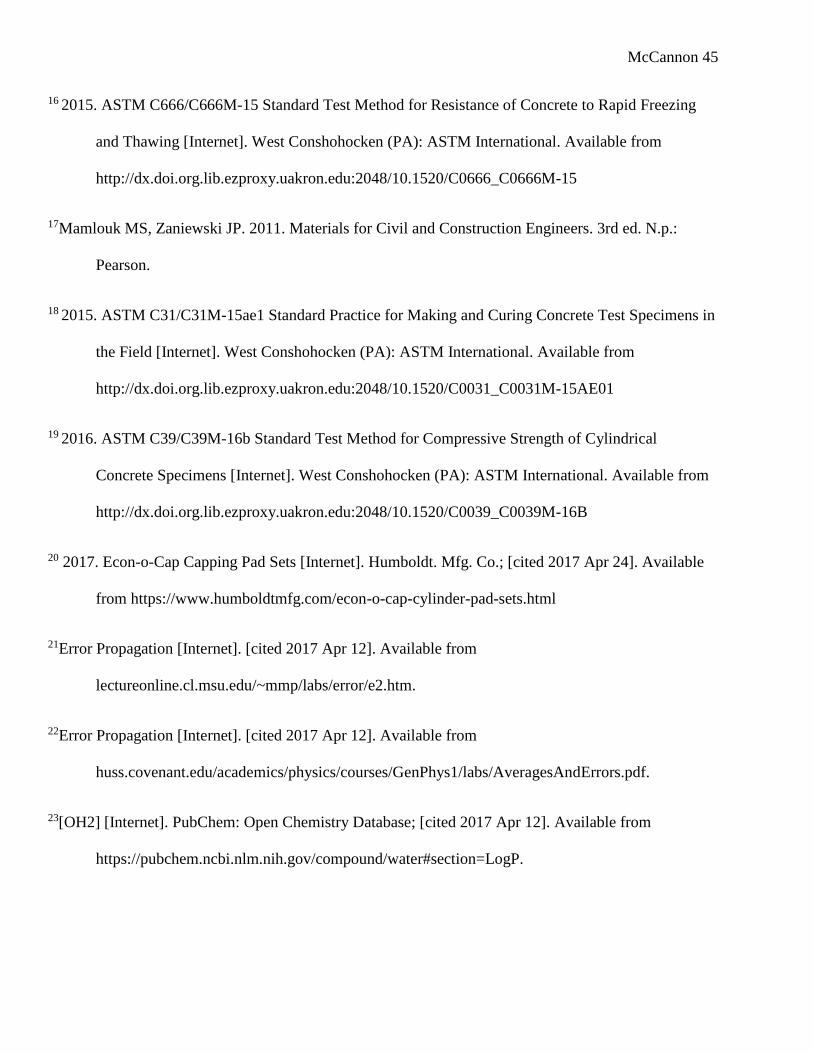
McCannon 45
16 2015. ASTM C666/C666M-15 Standard Test Method for Resistance of Concrete to Rapid Freezing
and Thawing [Internet]. West Conshohocken (PA): ASTM International. Available from
http://dx.doi.org.lib.ezproxy.uakron.edu:2048/10.1520/C0666_C0666M-15
17Mamlouk MS, Zaniewski JP. 2011. Materials for Civil and Construction Engineers. 3rd ed. N.p.:
Pearson.
18 2015. ASTM C31/C31M-15ae1 Standard Practice for Making and Curing Concrete Test Specimens in
the Field [Internet]. West Conshohocken (PA): ASTM International. Available from
http://dx.doi.org.lib.ezproxy.uakron.edu:2048/10.1520/C0031_C0031M-15AE01
19 2016. ASTM C39/C39M-16b Standard Test Method for Compressive Strength of Cylindrical
Concrete Specimens [Internet]. West Conshohocken (PA): ASTM International. Available from
http://dx.doi.org.lib.ezproxy.uakron.edu:2048/10.1520/C0039_C0039M-16B
20 2017. Econ-o-Cap Capping Pad Sets [Internet]. Humboldt. Mfg. Co.; [cited 2017 Apr 24]. Available
from https://www.humboldtmfg.com/econ-o-cap-cylinder-pad-sets.html
21Error Propagation [Internet]. [cited 2017 Apr 12]. Available from
lectureonline.cl.msu.edu/~mmp/labs/error/e2.htm.
22Error Propagation [Internet]. [cited 2017 Apr 12]. Available from
huss.covenant.edu/academics/physics/courses/GenPhys1/labs/AveragesAndErrors.pdf.
23[OH2] [Internet]. PubChem: Open Chemistry Database; [cited 2017 Apr 12]. Available from
https://pubchem.ncbi.nlm.nih.gov/compound/water#section=LogP.
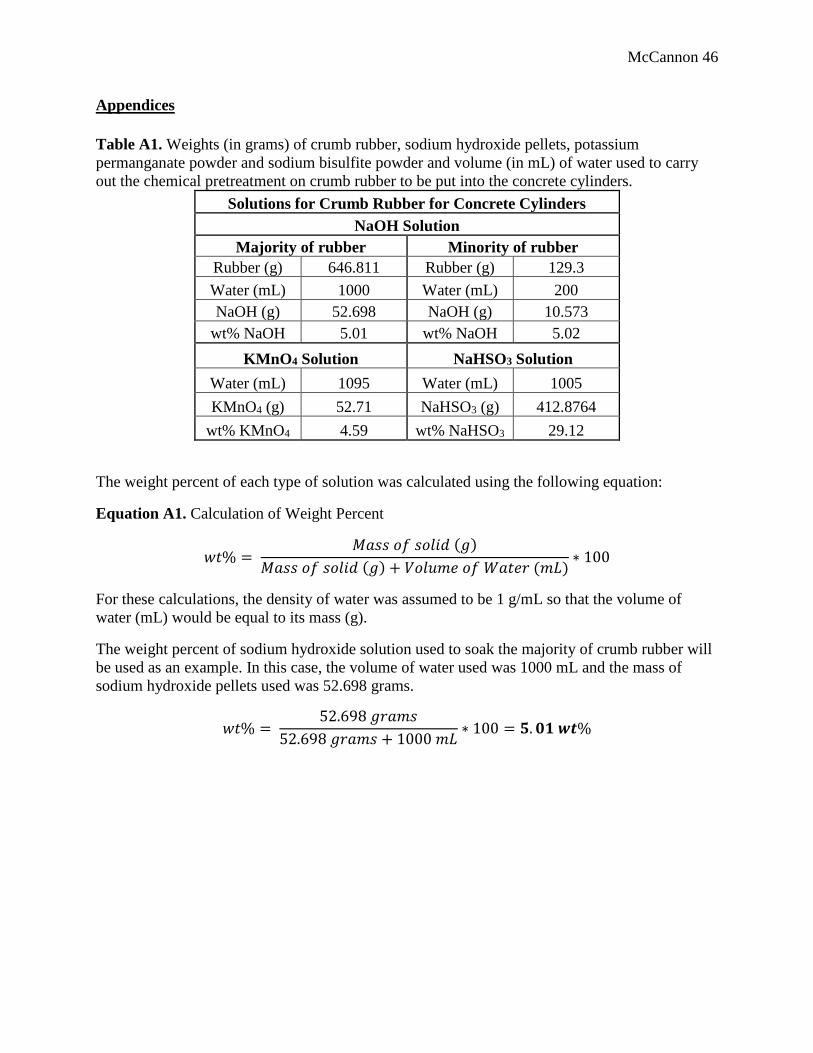
McCannon 46
Appendices
Table A1. Weights (in grams) of crumb rubber, sodium hydroxide pellets, potassium
permanganate powder and sodium bisulfite powder and volume (in mL) of water used to carry
out the chemical pretreatment on crumb rubber to be put into the concrete cylinders.
Solutions for Crumb Rubber for Concrete Cylinders
NaOH Solution
Majority of rubber Minority of rubber
Rubber (g) 646.811 Rubber (g) 129.3
Water (mL) 1000 Water (mL) 200
NaOH (g) 52.698 NaOH (g) 10.573
wt% NaOH 5.01 wt% NaOH 5.02
KMnO4 Solution NaHSO3 Solution
Water (mL) 1095 Water (mL) 1005
KMnO4 (g) 52.71 NaHSO3 (g) 412.8764
wt% KMnO4 4.59 wt% NaHSO3 29.12
The weight percent of each type of solution was calculated using the following equation:
Equation A1. Calculation of Weight Percent
𝑤𝑡% = 𝑀𝑎𝑠𝑠 𝑜𝑓 𝑠𝑜𝑙𝑖𝑑 (𝑔)
𝑀𝑎𝑠𝑠 𝑜𝑓 𝑠𝑜𝑙𝑖𝑑 (𝑔) + 𝑉𝑜𝑙𝑢𝑚𝑒 𝑜𝑓 𝑊𝑎𝑡𝑒𝑟 (𝑚𝐿)∗ 100
For these calculations, the density of water was assumed to be 1 g/mL so that the volume of
water (mL) would be equal to its mass (g).
The weight percent of sodium hydroxide solution used to soak the majority of crumb rubber will
be used as an example. In this case, the volume of water used was 1000 mL and the mass of
sodium hydroxide pellets used was 52.698 grams.
𝑤𝑡% = 52.698 𝑔𝑟𝑎𝑚𝑠
52.698 𝑔𝑟𝑎𝑚𝑠 + 1000 𝑚𝐿∗ 100 = 𝟓. 𝟎𝟏 𝒘𝒕%

McCannon 47
Table A2. Weights (in grams) of crumb rubber and sodium hydroxide pellets and volume (in
mL) of water used to carry out the chemical pretreatments on crumb rubber using 5 % and
saturated sodium hydroxide to test only the wettability of the crumb rubber after the
pretreatment.
Solutions for Crumb Rubber for Wettability Only
5 wt% NaOH for 24h Saturated NaOH for 20min
Rubber (g) 6.4688 Rubber (g) 6.0546
Water (mL) 10 Water (mL) 40
NaOH (g) 0.5386 NaOH (g) 43.684
wt% NaOH 5.11 wt% NaOH 52.20
Table A3. Weights (in grams) of sodium hydroxide pellets and potassium permanganate powder
and volume (in mL) of water used to chemically pretreat rubber sheets for purposes of only
testing the wettability of the rubber sheets after pretreatment. The sodium bisulfite solution that
was used to carry out this pretreatment was the same solution left over from pretreating the
crumb rubber going into the concrete cylinders.
Solutions for Rubber Sheets for Wettability Only
KMnO4 and NaHSO3 Treatment on Rubber Sheets
Make 5 wt% NaOH Make 5 wt% KMnO4
Water (mL) 30 Water (mL) 30
NaOH (g) 1.635 KMnO4 (g) 1.6002
wt% NaOH 5.17 wt% KMnO4 5.06
NaHSO3 solution used is what was left over from treating the
crumb rubber used in the concrete cylinders
Saturated NaOH for 20 min
Water (mL) 20
NaOH (g) 20.1
wt% NaOH 50.12
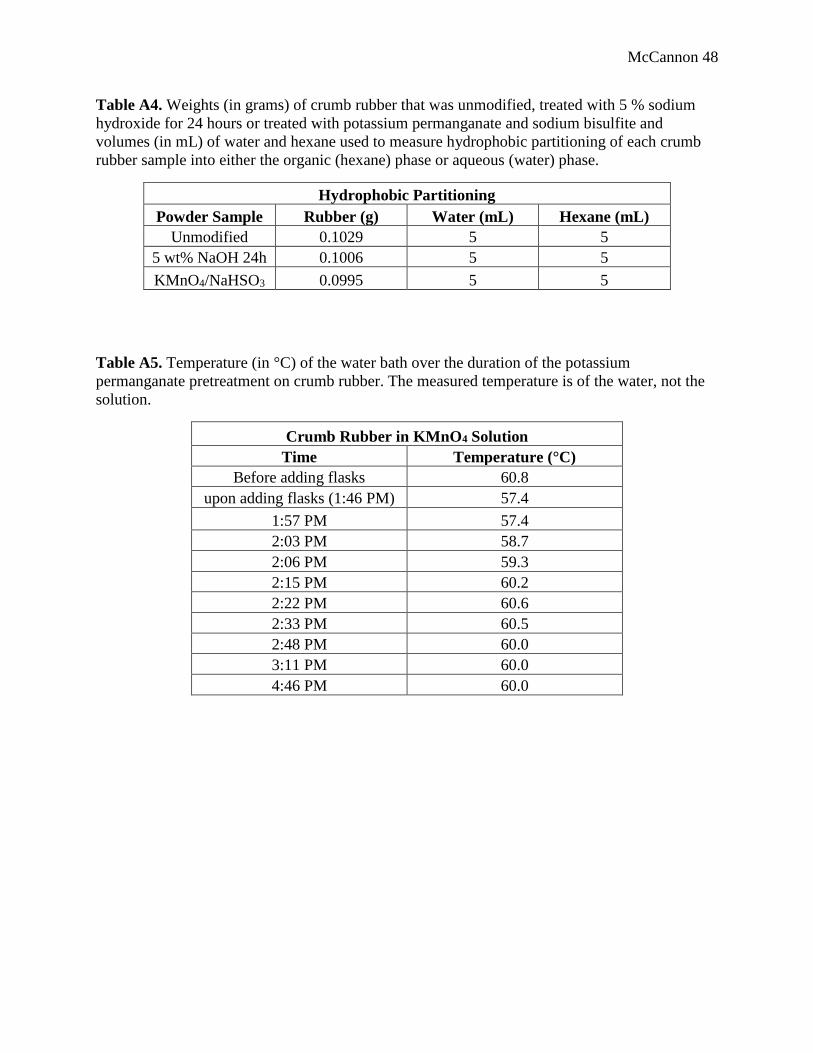
McCannon 48
Table A4. Weights (in grams) of crumb rubber that was unmodified, treated with 5 % sodium
hydroxide for 24 hours or treated with potassium permanganate and sodium bisulfite and
volumes (in mL) of water and hexane used to measure hydrophobic partitioning of each crumb
rubber sample into either the organic (hexane) phase or aqueous (water) phase.
Hydrophobic Partitioning
Powder Sample Rubber (g) Water (mL) Hexane (mL)
Unmodified 0.1029 5 5
5 wt% NaOH 24h 0.1006 5 5
KMnO4/NaHSO3 0.0995 5 5
Table A5. Temperature (in °C) of the water bath over the duration of the potassium
permanganate pretreatment on crumb rubber. The measured temperature is of the water, not the
solution.
Crumb Rubber in KMnO4 Solution
Time Temperature (°C)
Before adding flasks 60.8
upon adding flasks (1:46 PM) 57.4
1:57 PM 57.4
2:03 PM 58.7
2:06 PM 59.3
2:15 PM 60.2
2:22 PM 60.6
2:33 PM 60.5
2:48 PM 60.0
3:11 PM 60.0
4:46 PM 60.0
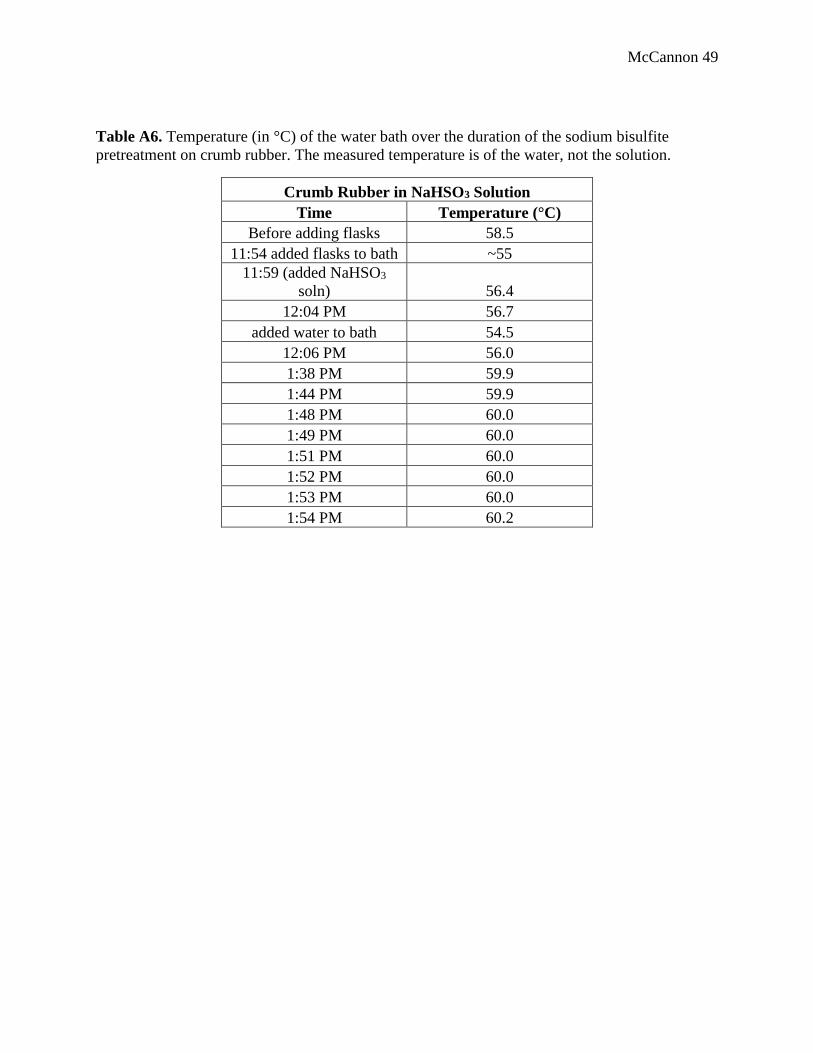
McCannon 49
Table A6. Temperature (in °C) of the water bath over the duration of the sodium bisulfite
pretreatment on crumb rubber. The measured temperature is of the water, not the solution.
Crumb Rubber in NaHSO3 Solution
Time Temperature (°C)
Before adding flasks 58.5
11:54 added flasks to bath ~55
11:59 (added NaHSO3
soln) 56.4
12:04 PM 56.7
added water to bath 54.5
12:06 PM 56.0
1:38 PM 59.9
1:44 PM 59.9
1:48 PM 60.0
1:49 PM 60.0
1:51 PM 60.0
1:52 PM 60.0
1:53 PM 60.0
1:54 PM 60.2
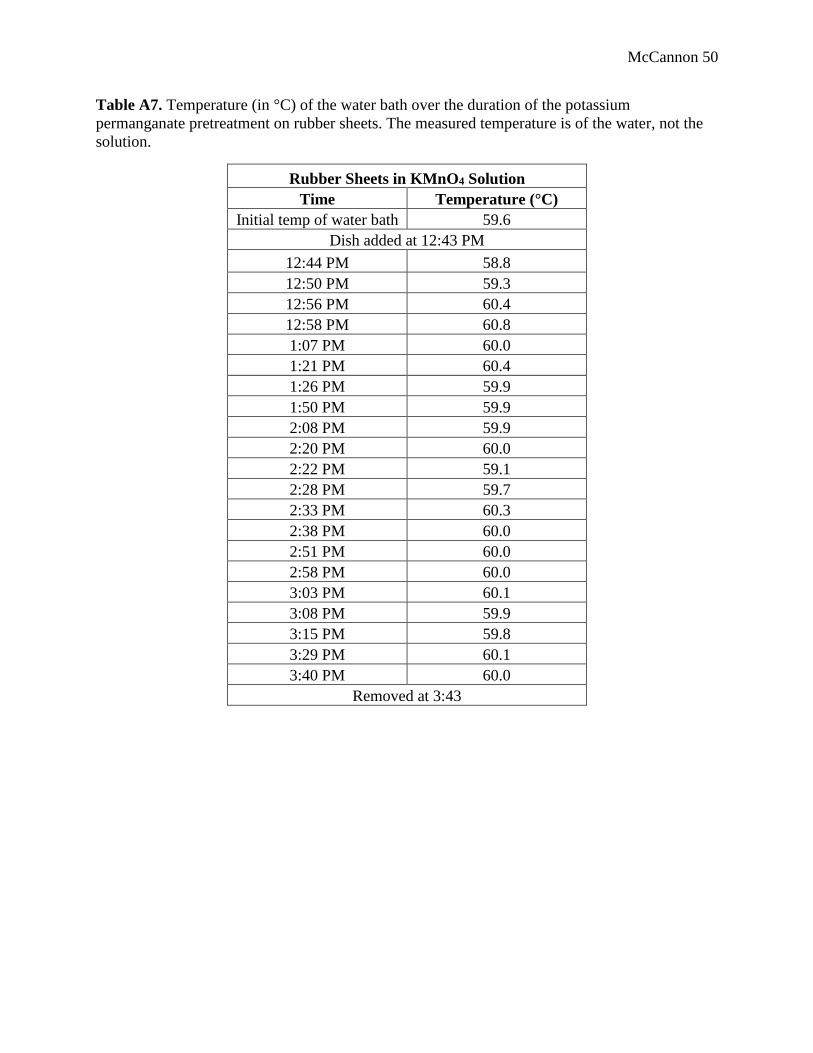
McCannon 50
Table A7. Temperature (in °C) of the water bath over the duration of the potassium
permanganate pretreatment on rubber sheets. The measured temperature is of the water, not the
solution.
Rubber Sheets in KMnO4 Solution
Time Temperature (°C)
Initial temp of water bath 59.6
Dish added at 12:43 PM
12:44 PM 58.8
12:50 PM 59.3
12:56 PM 60.4
12:58 PM 60.8
1:07 PM 60.0
1:21 PM 60.4
1:26 PM 59.9
1:50 PM 59.9
2:08 PM 59.9
2:20 PM 60.0
2:22 PM 59.1
2:28 PM 59.7
2:33 PM 60.3
2:38 PM 60.0
2:51 PM 60.0
2:58 PM 60.0
3:03 PM 60.1
3:08 PM 59.9
3:15 PM 59.8
3:29 PM 60.1
3:40 PM 60.0
Removed at 3:43
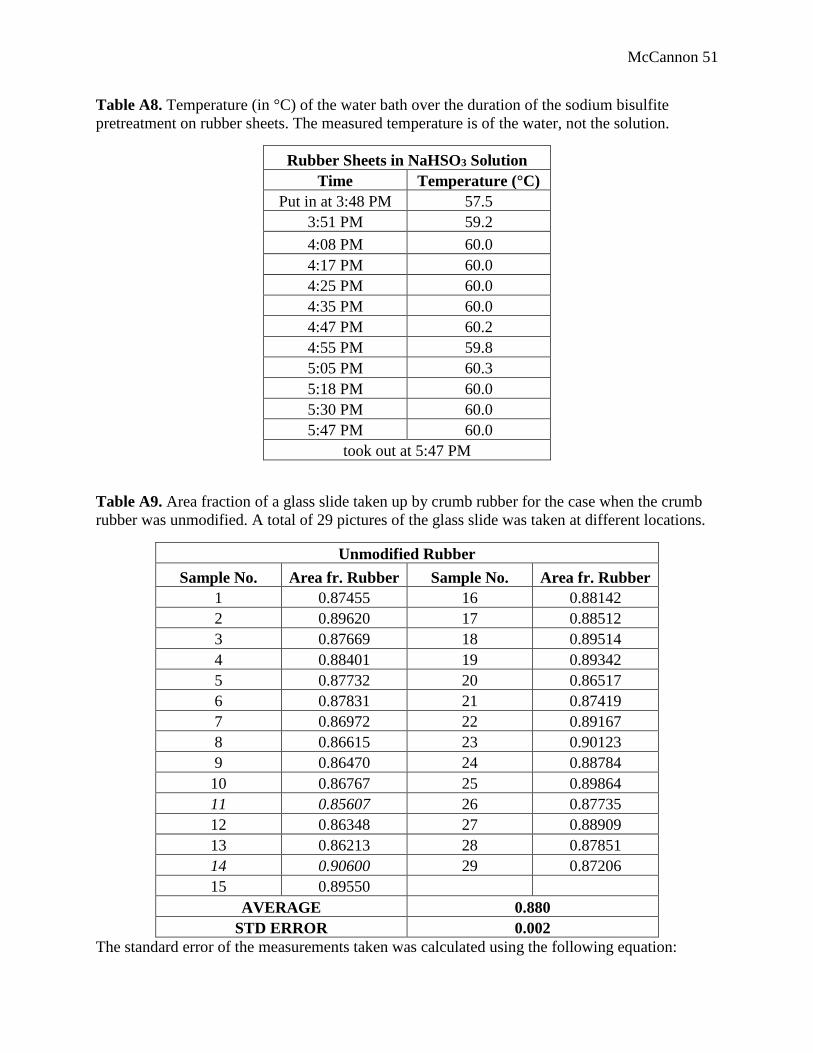
McCannon 51
Table A8. Temperature (in °C) of the water bath over the duration of the sodium bisulfite
pretreatment on rubber sheets. The measured temperature is of the water, not the solution.
Rubber Sheets in NaHSO3 Solution
Time Temperature (°C)
Put in at 3:48 PM 57.5
3:51 PM 59.2
4:08 PM 60.0
4:17 PM 60.0
4:25 PM 60.0
4:35 PM 60.0
4:47 PM 60.2
4:55 PM 59.8
5:05 PM 60.3
5:18 PM 60.0
5:30 PM 60.0
5:47 PM 60.0
took out at 5:47 PM
Table A9. Area fraction of a glass slide taken up by crumb rubber for the case when the crumb
rubber was unmodified. A total of 29 pictures of the glass slide was taken at different locations.
Unmodified Rubber
Sample No. Area fr. Rubber Sample No. Area fr. Rubber
1 0.87455 16 0.88142
2 0.89620 17 0.88512
3 0.87669 18 0.89514
4 0.88401 19 0.89342
5 0.87732 20 0.86517
6 0.87831 21 0.87419
7 0.86972 22 0.89167
8 0.86615 23 0.90123
9 0.86470 24 0.88784
10 0.86767 25 0.89864
11 0.85607 26 0.87735
12 0.86348 27 0.88909
13 0.86213 28 0.87851
14 0.90600 29 0.87206
15 0.89550
AVERAGE 0.880
STD ERROR 0.002
The standard error of the measurements taken was calculated using the following equation:
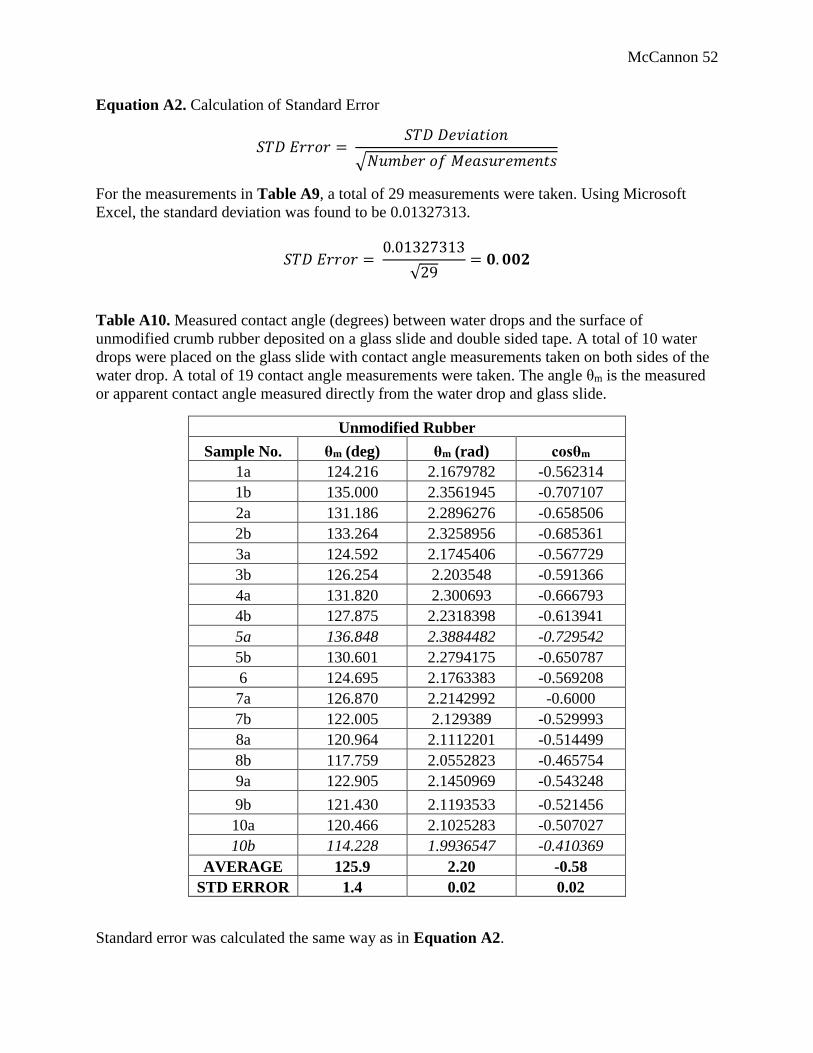
McCannon 52
Equation A2. Calculation of Standard Error
𝑆𝑇𝐷 𝐸𝑟𝑟𝑜𝑟 = 𝑆𝑇𝐷 𝐷𝑒𝑣𝑖𝑎𝑡𝑖𝑜𝑛
√𝑁𝑢𝑚𝑏𝑒𝑟 𝑜𝑓 𝑀𝑒𝑎𝑠𝑢𝑟𝑒𝑚𝑒𝑛𝑡𝑠
For the measurements in Table A9, a total of 29 measurements were taken. Using Microsoft
Excel, the standard deviation was found to be 0.01327313.
𝑆𝑇𝐷 𝐸𝑟𝑟𝑜𝑟 = 0.01327313
√29= 𝟎. 𝟎𝟎𝟐
Table A10. Measured contact angle (degrees) between water drops and the surface of
unmodified crumb rubber deposited on a glass slide and double sided tape. A total of 10 water
drops were placed on the glass slide with contact angle measurements taken on both sides of the
water drop. A total of 19 contact angle measurements were taken. The angle θm is the measured
or apparent contact angle measured directly from the water drop and glass slide.
Unmodified Rubber
Sample No. θm (deg) θm (rad) cosθm
1a 124.216 2.1679782 -0.562314
1b 135.000 2.3561945 -0.707107
2a 131.186 2.2896276 -0.658506
2b 133.264 2.3258956 -0.685361
3a 124.592 2.1745406 -0.567729
3b 126.254 2.203548 -0.591366
4a 131.820 2.300693 -0.666793
4b 127.875 2.2318398 -0.613941
5a 136.848 2.3884482 -0.729542
5b 130.601 2.2794175 -0.650787
6 124.695 2.1763383 -0.569208
7a 126.870 2.2142992 -0.6000
7b 122.005 2.129389 -0.529993
8a 120.964 2.1112201 -0.514499
8b 117.759 2.0552823 -0.465754
9a 122.905 2.1450969 -0.543248
9b 121.430 2.1193533 -0.521456
10a 120.466 2.1025283 -0.507027
10b 114.228 1.9936547 -0.410369
AVERAGE 125.9 2.20 -0.58
STD ERROR 1.4 0.02 0.02
Standard error was calculated the same way as in Equation A2.
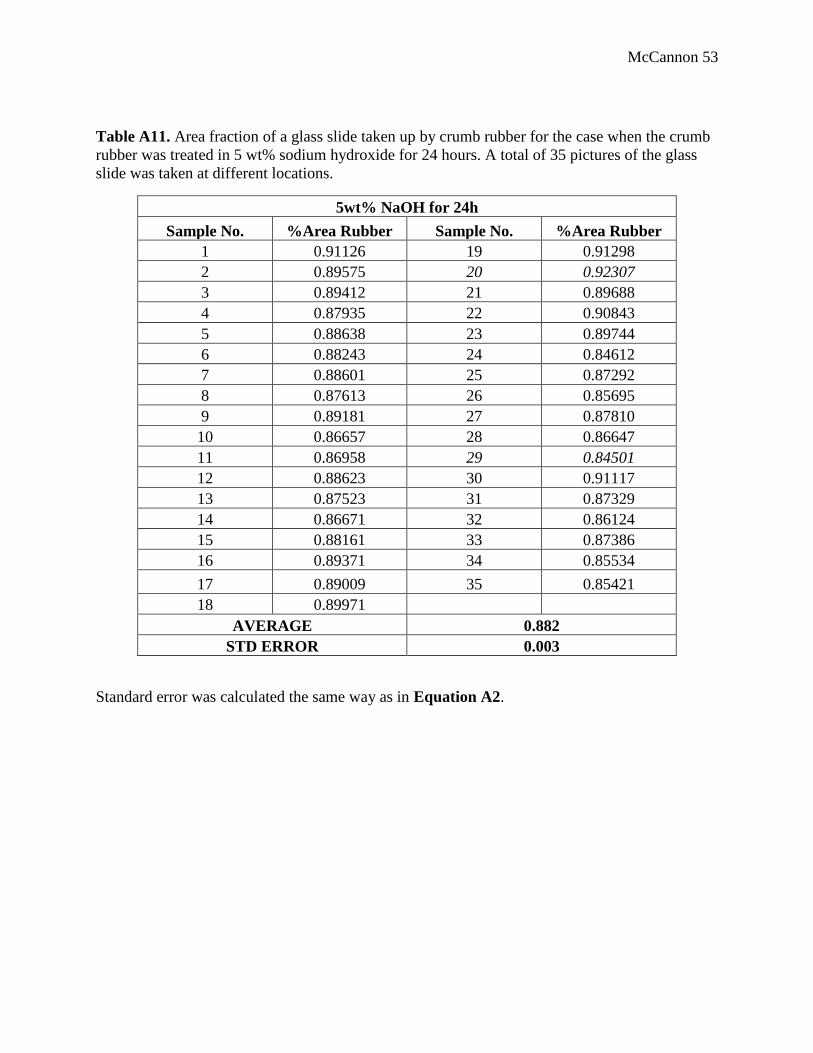
McCannon 53
Table A11. Area fraction of a glass slide taken up by crumb rubber for the case when the crumb
rubber was treated in 5 wt% sodium hydroxide for 24 hours. A total of 35 pictures of the glass
slide was taken at different locations.
5wt% NaOH for 24h
Sample No. %Area Rubber Sample No. %Area Rubber
1 0.91126 19 0.91298
2 0.89575 20 0.92307
3 0.89412 21 0.89688
4 0.87935 22 0.90843
5 0.88638 23 0.89744
6 0.88243 24 0.84612
7 0.88601 25 0.87292
8 0.87613 26 0.85695
9 0.89181 27 0.87810
10 0.86657 28 0.86647
11 0.86958 29 0.84501
12 0.88623 30 0.91117
13 0.87523 31 0.87329
14 0.86671 32 0.86124
15 0.88161 33 0.87386
16 0.89371 34 0.85534
17 0.89009 35 0.85421
18 0.89971
AVERAGE 0.882
STD ERROR 0.003
Standard error was calculated the same way as in Equation A2.

McCannon 54
Table A12. Measured contact angle (degrees) between water drops and the surface of crumb
rubber pretreated with 5 % NaOH for 24 hours and deposited on a glass slide and double sided
tape. A total of 5 water drops were placed on the glass slide with contact angle measurements
taken on both sides of the water drop. A total of 9 contact angle measurements were taken. The
angle θm is the apparent contact angle measured directly from the water drop and glass slide.
5wt NaOH 24h
Sample No. θm (deg) θm (rad) cosθm
1a 115.641 2.018316 -0.432731
1b 113.749 1.985295 -0.402731
2a 120.964 2.11122 -0.514499
2b 124.695 2.176338 -0.569208
3a 120.964 2.11122 -0.514499
3b 119.745 2.089945 -0.496141
4a 120.466 2.102528 -0.507027
4b 125.538 2.191051 -0.581243
5 119.745 2.089945 -0.496141
AVERAGE 120.2 2.10 -0.50
STD ERROR 1.3 0.02 0.02
Standard error was calculated the same way as in Equation A2.
Table A13. Area fraction of a glass slide taken up by crumb rubber for the case when the crumb
rubber was treated in saturated sodium hydroxide for 20 minutes. A total of 21 pictures of the
glass slide was taken at different locations.
Saturated NaOH, 20min
Sample No. %Area Rubber Sample No. %Area Rubber
1 0.84255 12 0.83796
2 0.85812 13 0.86403
3 0.85197 14 0.82109
4 0.82322 15 0.81063
5 0.78646 16 0.87688
6 0.85060 17 0.85668
7 0.85225 18 0.85039
8 0.88132 19 0.87554
9 0.84866 20 0.85374
10 0.82719 21 0.86705
11 0.84970
AVERAGE 0.847
STD ERROR 0.005
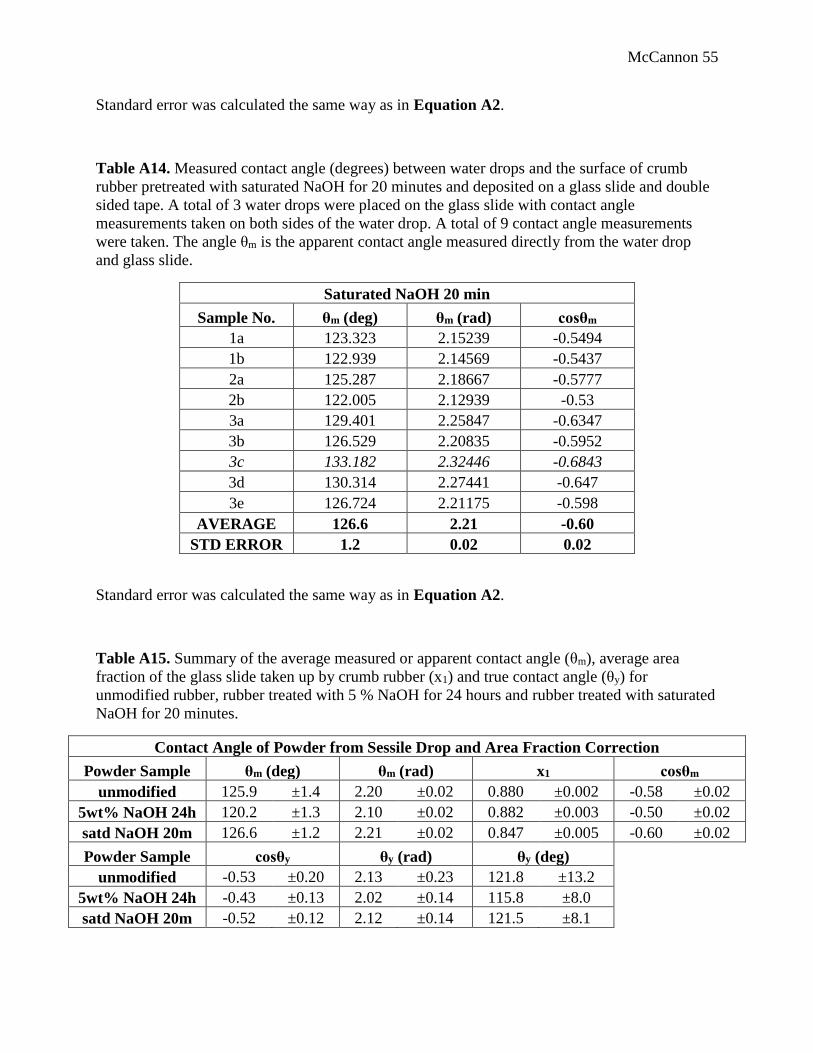
McCannon 55
Standard error was calculated the same way as in Equation A2.
Table A14. Measured contact angle (degrees) between water drops and the surface of crumb
rubber pretreated with saturated NaOH for 20 minutes and deposited on a glass slide and double
sided tape. A total of 3 water drops were placed on the glass slide with contact angle
measurements taken on both sides of the water drop. A total of 9 contact angle measurements
were taken. The angle θm is the apparent contact angle measured directly from the water drop
and glass slide.
Saturated NaOH 20 min
Sample No. θm (deg) θm (rad) cosθm
1a 123.323 2.15239 -0.5494
1b 122.939 2.14569 -0.5437
2a 125.287 2.18667 -0.5777
2b 122.005 2.12939 -0.53
3a 129.401 2.25847 -0.6347
3b 126.529 2.20835 -0.5952
3c 133.182 2.32446 -0.6843
3d 130.314 2.27441 -0.647
3e 126.724 2.21175 -0.598
AVERAGE 126.6 2.21 -0.60
STD ERROR 1.2 0.02 0.02
Standard error was calculated the same way as in Equation A2.
Table A15. Summary of the average measured or apparent contact angle (θm), average area
fraction of the glass slide taken up by crumb rubber (x1) and true contact angle (θy) for
unmodified rubber, rubber treated with 5 % NaOH for 24 hours and rubber treated with saturated
NaOH for 20 minutes.
Contact Angle of Powder from Sessile Drop and Area Fraction Correction
Powder Sample θm (deg) θm (rad) x1 cosθm
unmodified 125.9 ±1.4 2.20 ±0.02 0.880 ±0.002 -0.58 ±0.02
5wt% NaOH 24h 120.2 ±1.3 2.10 ±0.02 0.882 ±0.003 -0.50 ±0.02
satd NaOH 20m 126.6 ±1.2 2.21 ±0.02 0.847 ±0.005 -0.60 ±0.02
Powder Sample cosθy θy (rad) θy (deg) unmodified -0.53 ±0.20 2.13 ±0.23 121.8 ±13.2
5wt% NaOH 24h -0.43 ±0.13 2.02 ±0.14 115.8 ±8.0 satd NaOH 20m -0.52 ±0.12 2.12 ±0.14 121.5 ±8.1
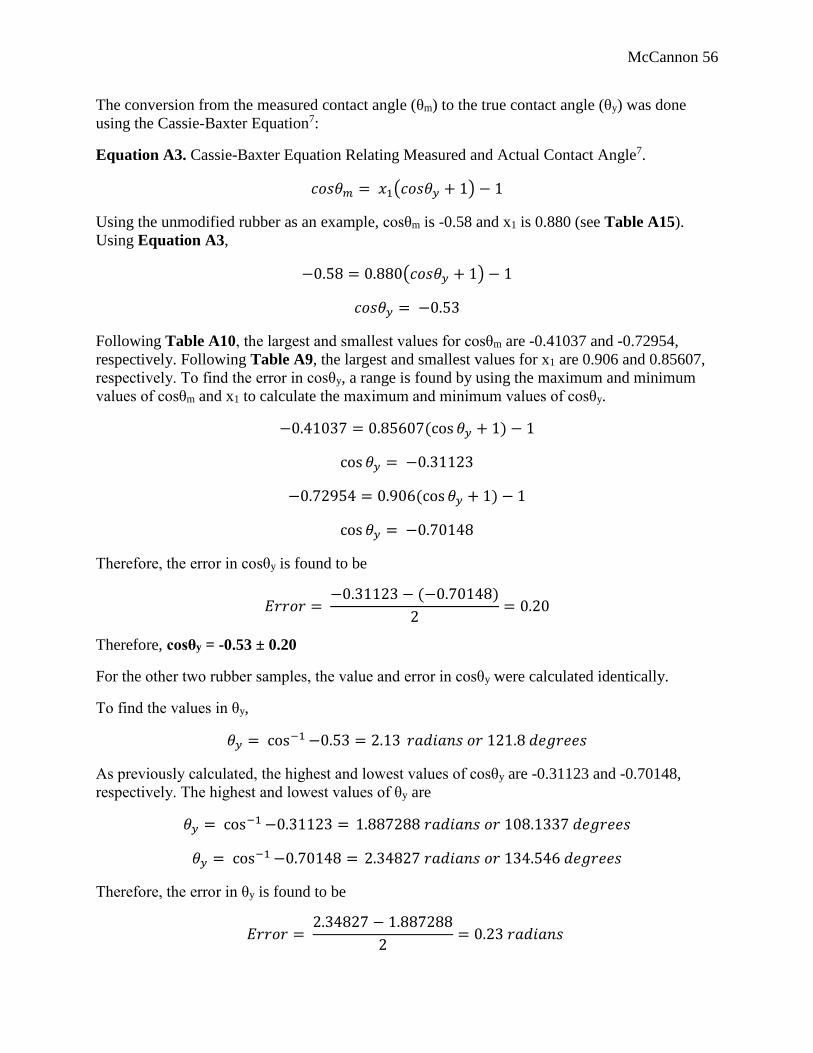
McCannon 56
The conversion from the measured contact angle (θm) to the true contact angle (θy) was done
using the Cassie-Baxter Equation7:
Equation A3. Cassie-Baxter Equation Relating Measured and Actual Contact Angle7.
𝑐𝑜𝑠𝜃𝑚 = 𝑥1(𝑐𝑜𝑠𝜃𝑦 + 1) − 1
Using the unmodified rubber as an example, cosθm is -0.58 and x1 is 0.880 (see Table A15).
Using Equation A3,
−0.58 = 0.880(𝑐𝑜𝑠𝜃𝑦 + 1) − 1
𝑐𝑜𝑠𝜃𝑦 = −0.53
Following Table A10, the largest and smallest values for cosθm are -0.41037 and -0.72954,
respectively. Following Table A9, the largest and smallest values for x1 are 0.906 and 0.85607,
respectively. To find the error in cosθy, a range is found by using the maximum and minimum
values of cosθm and x1 to calculate the maximum and minimum values of cosθy.
−0.41037 = 0.85607(cos 𝜃𝑦 + 1) − 1
cos 𝜃𝑦 = −0.31123
−0.72954 = 0.906(cos 𝜃𝑦 + 1) − 1
cos 𝜃𝑦 = −0.70148
Therefore, the error in cosθy is found to be
𝐸𝑟𝑟𝑜𝑟 = −0.31123 − (−0.70148)
2= 0.20
Therefore, cosθy = -0.53 ± 0.20
For the other two rubber samples, the value and error in cosθy were calculated identically.
To find the values in θy,
𝜃𝑦 = cos−1 −0.53 = 2.13 𝑟𝑎𝑑𝑖𝑎𝑛𝑠 𝑜𝑟 121.8 𝑑𝑒𝑔𝑟𝑒𝑒𝑠
As previously calculated, the highest and lowest values of cosθy are -0.31123 and -0.70148,
respectively. The highest and lowest values of θy are
𝜃𝑦 = cos−1 −0.31123 = 1.887288 𝑟𝑎𝑑𝑖𝑎𝑛𝑠 𝑜𝑟 108.1337 𝑑𝑒𝑔𝑟𝑒𝑒𝑠
𝜃𝑦 = cos−1 −0.70148 = 2.34827 𝑟𝑎𝑑𝑖𝑎𝑛𝑠 𝑜𝑟 134.546 𝑑𝑒𝑔𝑟𝑒𝑒𝑠
Therefore, the error in θy is found to be
𝐸𝑟𝑟𝑜𝑟 = 2.34827 − 1.887288
2= 0.23 𝑟𝑎𝑑𝑖𝑎𝑛𝑠
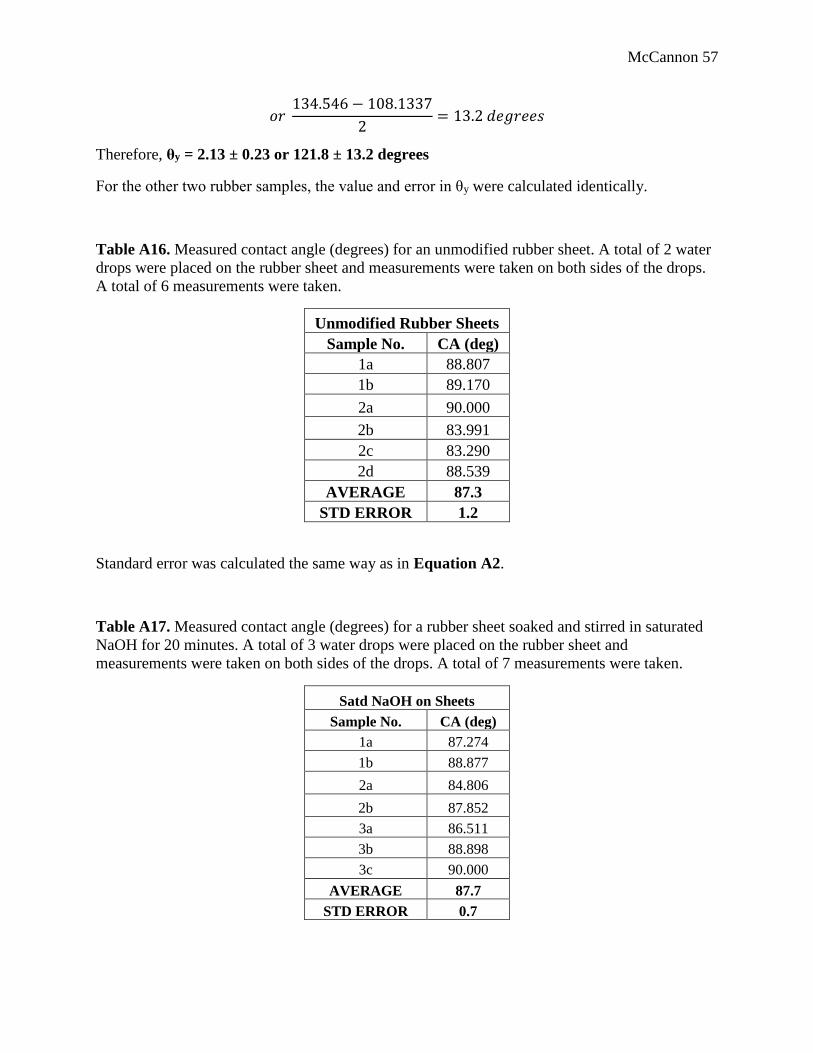
McCannon 57
𝑜𝑟 134.546 − 108.1337
2= 13.2 𝑑𝑒𝑔𝑟𝑒𝑒𝑠
Therefore, θy = 2.13 ± 0.23 or 121.8 ± 13.2 degrees
For the other two rubber samples, the value and error in θy were calculated identically.
Table A16. Measured contact angle (degrees) for an unmodified rubber sheet. A total of 2 water
drops were placed on the rubber sheet and measurements were taken on both sides of the drops.
A total of 6 measurements were taken.
Unmodified Rubber Sheets
Sample No. CA (deg)
1a 88.807
1b 89.170
2a 90.000
2b 83.991
2c 83.290
2d 88.539
AVERAGE 87.3
STD ERROR 1.2
Standard error was calculated the same way as in Equation A2.
Table A17. Measured contact angle (degrees) for a rubber sheet soaked and stirred in saturated
NaOH for 20 minutes. A total of 3 water drops were placed on the rubber sheet and
measurements were taken on both sides of the drops. A total of 7 measurements were taken.
Satd NaOH on Sheets
Sample No. CA (deg)
1a 87.274
1b 88.877
2a 84.806
2b 87.852
3a 86.511
3b 88.898
3c 90.000
AVERAGE 87.7
STD ERROR 0.7
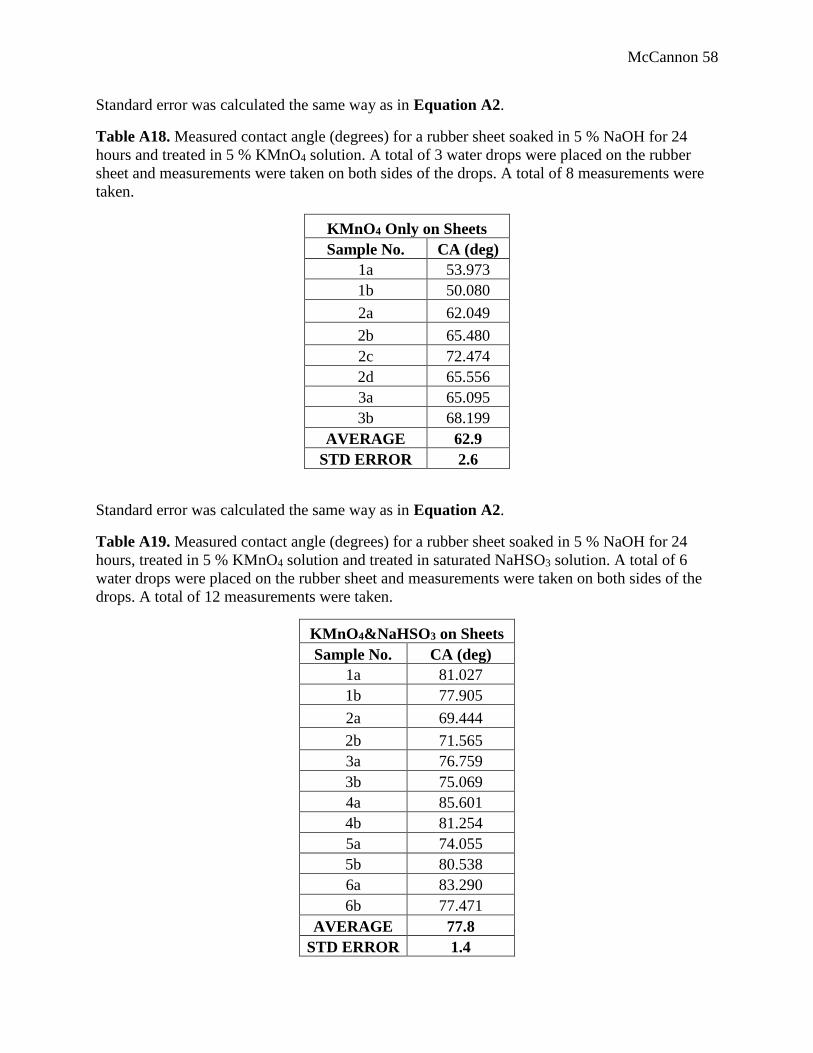
McCannon 58
Standard error was calculated the same way as in Equation A2.
Table A18. Measured contact angle (degrees) for a rubber sheet soaked in 5 % NaOH for 24
hours and treated in 5 % KMnO4 solution. A total of 3 water drops were placed on the rubber
sheet and measurements were taken on both sides of the drops. A total of 8 measurements were
taken.
KMnO4 Only on Sheets
Sample No. CA (deg)
1a 53.973
1b 50.080
2a 62.049
2b 65.480
2c 72.474
2d 65.556
3a 65.095
3b 68.199
AVERAGE 62.9
STD ERROR 2.6
Standard error was calculated the same way as in Equation A2.
Table A19. Measured contact angle (degrees) for a rubber sheet soaked in 5 % NaOH for 24
hours, treated in 5 % KMnO4 solution and treated in saturated NaHSO3 solution. A total of 6
water drops were placed on the rubber sheet and measurements were taken on both sides of the
drops. A total of 12 measurements were taken.
KMnO4&NaHSO3 on Sheets
Sample No. CA (deg)
1a 81.027
1b 77.905
2a 69.444
2b 71.565
3a 76.759
3b 75.069
4a 85.601
4b 81.254
5a 74.055
5b 80.538
6a 83.290
6b 77.471
AVERAGE 77.8
STD ERROR 1.4
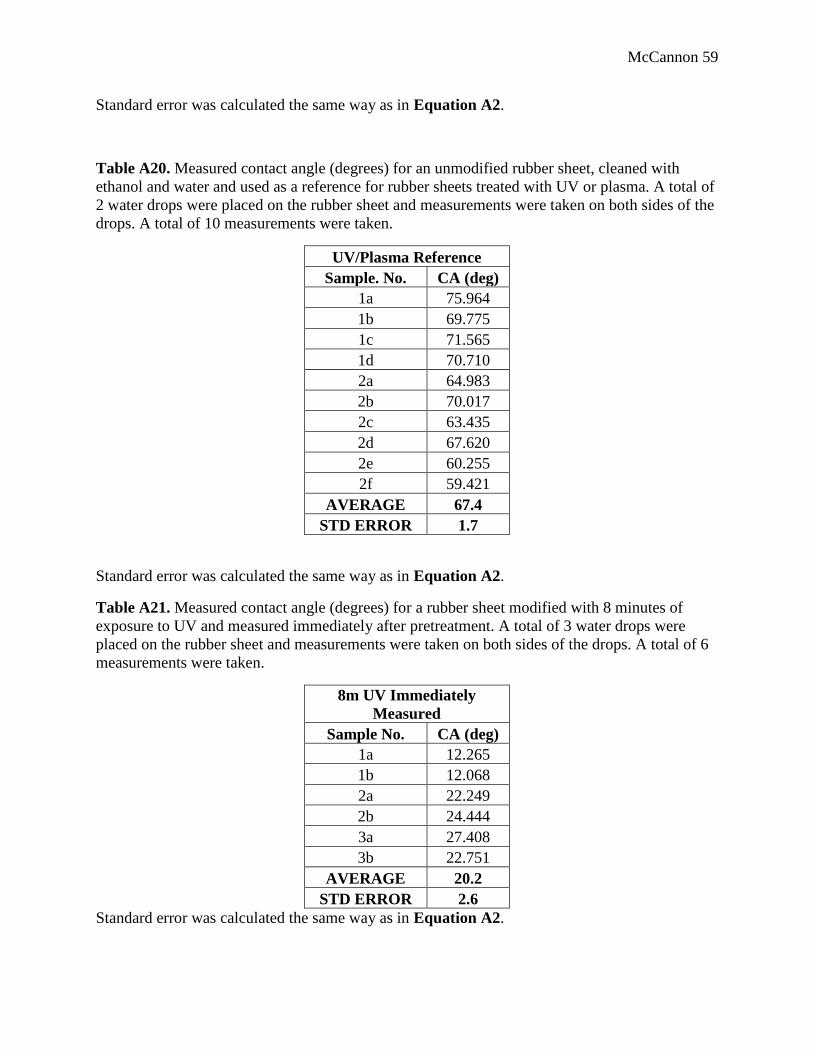
McCannon 59
Standard error was calculated the same way as in Equation A2.
Table A20. Measured contact angle (degrees) for an unmodified rubber sheet, cleaned with
ethanol and water and used as a reference for rubber sheets treated with UV or plasma. A total of
2 water drops were placed on the rubber sheet and measurements were taken on both sides of the
drops. A total of 10 measurements were taken.
UV/Plasma Reference
Sample. No. CA (deg)
1a 75.964
1b 69.775
1c 71.565
1d 70.710
2a 64.983
2b 70.017
2c 63.435
2d 67.620
2e 60.255
2f 59.421
AVERAGE 67.4
STD ERROR 1.7
Standard error was calculated the same way as in Equation A2.
Table A21. Measured contact angle (degrees) for a rubber sheet modified with 8 minutes of
exposure to UV and measured immediately after pretreatment. A total of 3 water drops were
placed on the rubber sheet and measurements were taken on both sides of the drops. A total of 6
measurements were taken.
8m UV Immediately
Measured
Sample No. CA (deg)
1a 12.265
1b 12.068
2a 22.249
2b 24.444
3a 27.408
3b 22.751
AVERAGE 20.2
STD ERROR 2.6
Standard error was calculated the same way as in Equation A2.
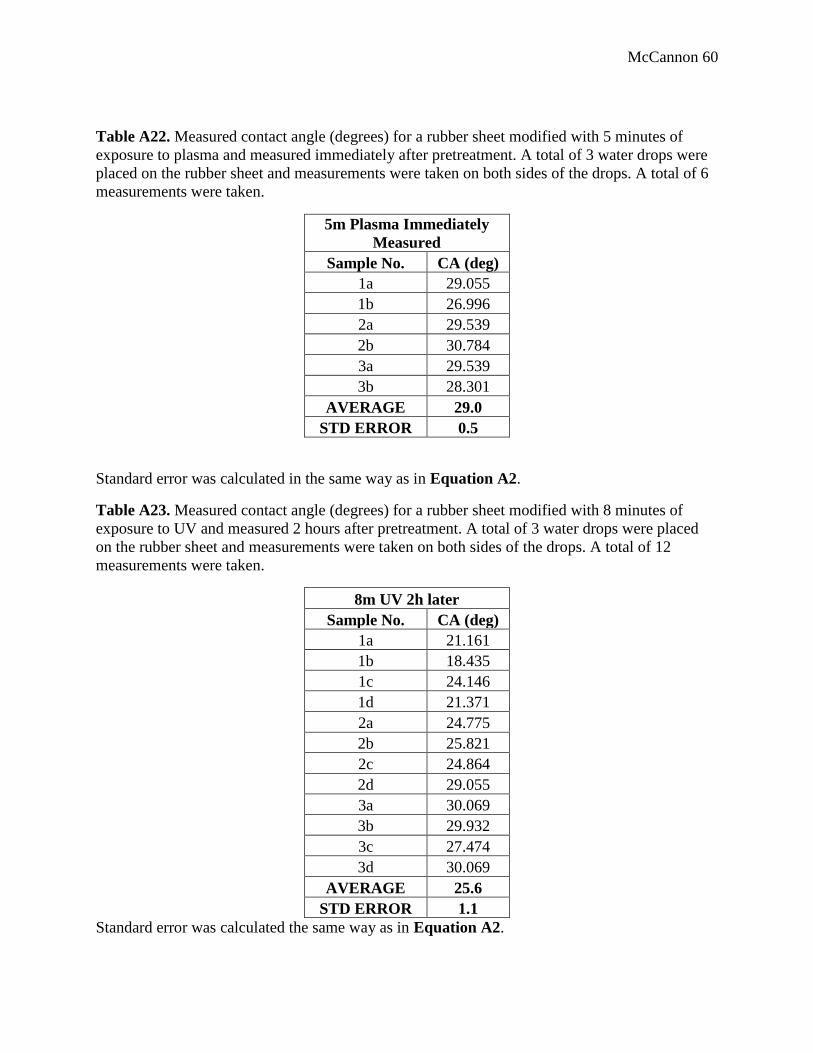
McCannon 60
Table A22. Measured contact angle (degrees) for a rubber sheet modified with 5 minutes of
exposure to plasma and measured immediately after pretreatment. A total of 3 water drops were
placed on the rubber sheet and measurements were taken on both sides of the drops. A total of 6
measurements were taken.
5m Plasma Immediately
Measured
Sample No. CA (deg)
1a 29.055
1b 26.996
2a 29.539
2b 30.784
3a 29.539
3b 28.301
AVERAGE 29.0
STD ERROR 0.5
Standard error was calculated in the same way as in Equation A2.
Table A23. Measured contact angle (degrees) for a rubber sheet modified with 8 minutes of
exposure to UV and measured 2 hours after pretreatment. A total of 3 water drops were placed
on the rubber sheet and measurements were taken on both sides of the drops. A total of 12
measurements were taken.
8m UV 2h later
Sample No. CA (deg)
1a 21.161
1b 18.435
1c 24.146
1d 21.371
2a 24.775
2b 25.821
2c 24.864
2d 29.055
3a 30.069
3b 29.932
3c 27.474
3d 30.069
AVERAGE 25.6
STD ERROR 1.1
Standard error was calculated the same way as in Equation A2.
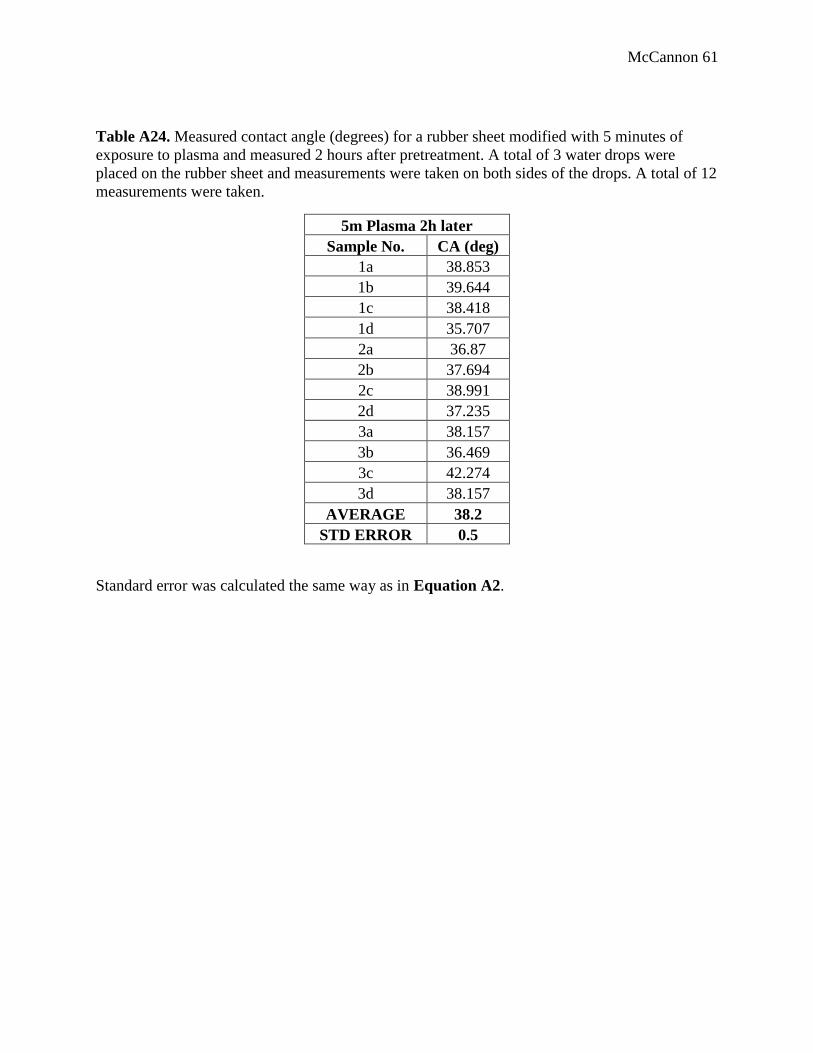
McCannon 61
Table A24. Measured contact angle (degrees) for a rubber sheet modified with 5 minutes of
exposure to plasma and measured 2 hours after pretreatment. A total of 3 water drops were
placed on the rubber sheet and measurements were taken on both sides of the drops. A total of 12
measurements were taken.
5m Plasma 2h later
Sample No. CA (deg)
1a 38.853
1b 39.644
1c 38.418
1d 35.707
2a 36.87
2b 37.694
2c 38.991
2d 37.235
3a 38.157
3b 36.469
3c 42.274
3d 38.157
AVERAGE 38.2
STD ERROR 0.5
Standard error was calculated the same way as in Equation A2.
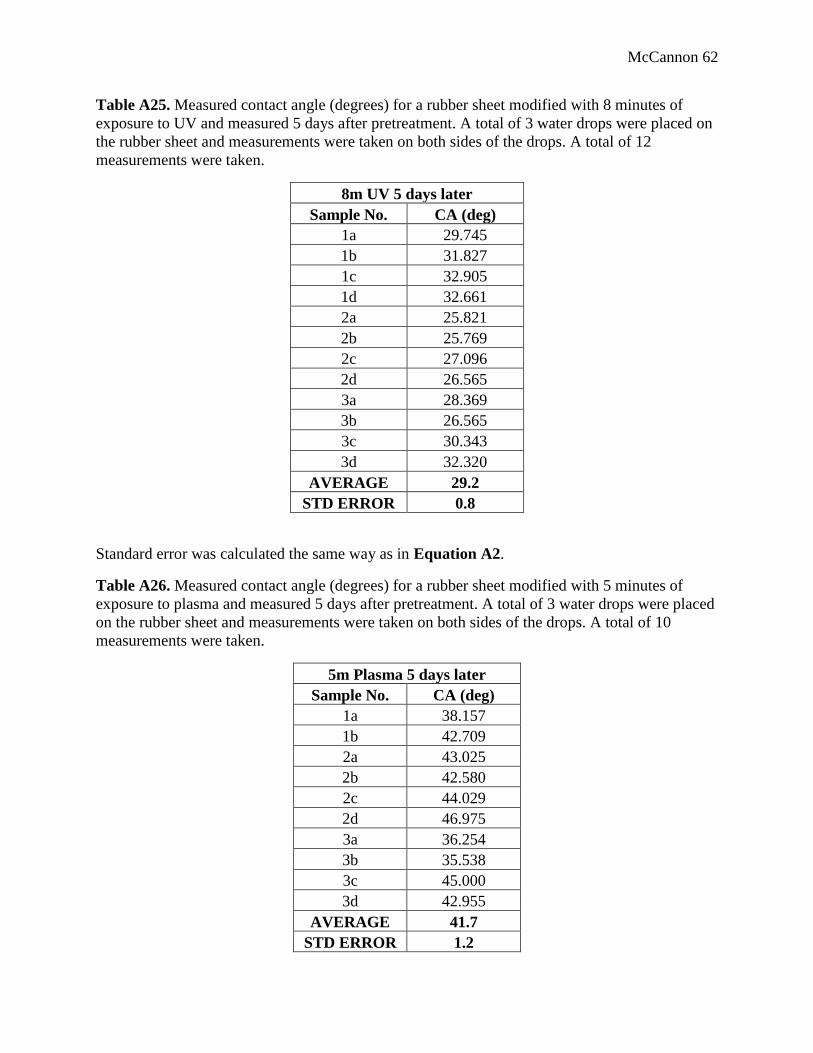
McCannon 62
Table A25. Measured contact angle (degrees) for a rubber sheet modified with 8 minutes of
exposure to UV and measured 5 days after pretreatment. A total of 3 water drops were placed on
the rubber sheet and measurements were taken on both sides of the drops. A total of 12
measurements were taken.
8m UV 5 days later
Sample No. CA (deg)
1a 29.745
1b 31.827
1c 32.905
1d 32.661
2a 25.821
2b 25.769
2c 27.096
2d 26.565
3a 28.369
3b 26.565
3c 30.343
3d 32.320
AVERAGE 29.2
STD ERROR 0.8
Standard error was calculated the same way as in Equation A2.
Table A26. Measured contact angle (degrees) for a rubber sheet modified with 5 minutes of
exposure to plasma and measured 5 days after pretreatment. A total of 3 water drops were placed
on the rubber sheet and measurements were taken on both sides of the drops. A total of 10
measurements were taken.
5m Plasma 5 days later
Sample No. CA (deg)
1a 38.157
1b 42.709
2a 43.025
2b 42.580
2c 44.029
2d 46.975
3a 36.254
3b 35.538
3c 45.000
3d 42.955
AVERAGE 41.7
STD ERROR 1.2
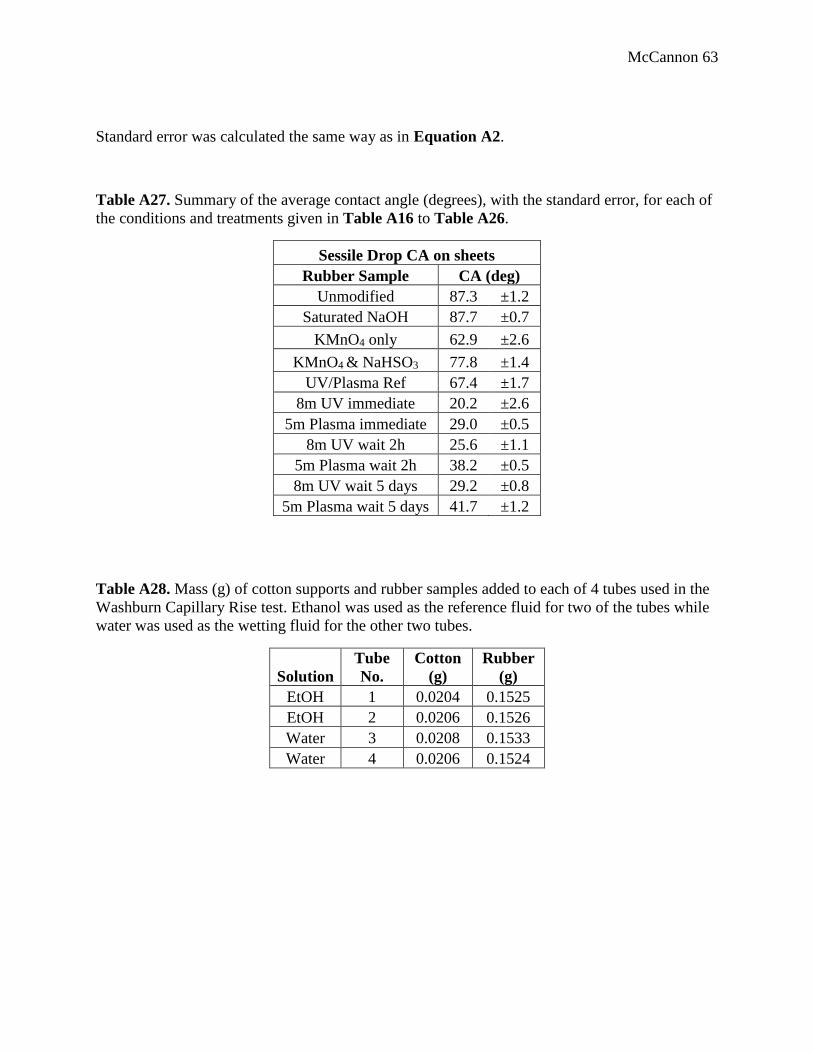
McCannon 63
Standard error was calculated the same way as in Equation A2.
Table A27. Summary of the average contact angle (degrees), with the standard error, for each of
the conditions and treatments given in Table A16 to Table A26.
Sessile Drop CA on sheets
Rubber Sample CA (deg)
Unmodified 87.3 ±1.2
Saturated NaOH 87.7 ±0.7
KMnO4 only 62.9 ±2.6
KMnO4 & NaHSO3 77.8 ±1.4
UV/Plasma Ref 67.4 ±1.7
8m UV immediate 20.2 ±2.6
5m Plasma immediate 29.0 ±0.5
8m UV wait 2h 25.6 ±1.1
5m Plasma wait 2h 38.2 ±0.5
8m UV wait 5 days 29.2 ±0.8
5m Plasma wait 5 days 41.7 ±1.2
Table A28. Mass (g) of cotton supports and rubber samples added to each of 4 tubes used in the
Washburn Capillary Rise test. Ethanol was used as the reference fluid for two of the tubes while
water was used as the wetting fluid for the other two tubes.
Solution
Tube
No.
Cotton
(g)
Rubber
(g)
EtOH 1 0.0204 0.1525
EtOH 2 0.0206 0.1526
Water 3 0.0208 0.1533
Water 4 0.0206 0.1524
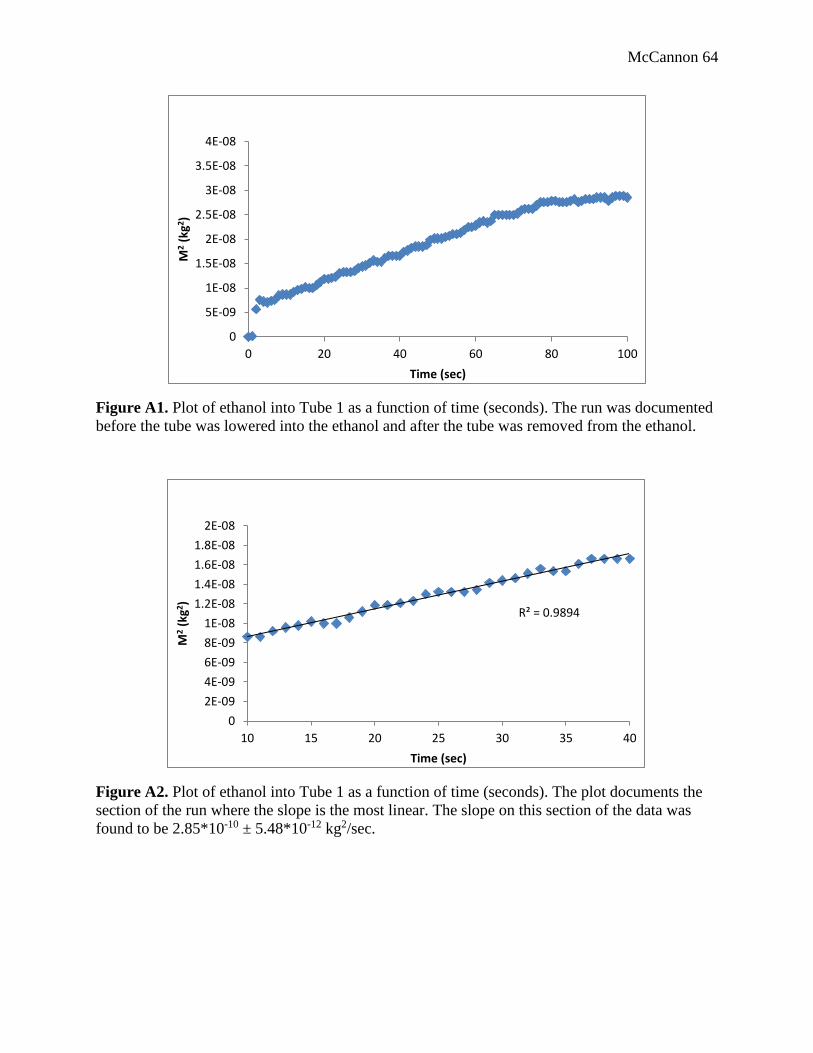
McCannon 64
Figure A1. Plot of ethanol into Tube 1 as a function of time (seconds). The run was documented
before the tube was lowered into the ethanol and after the tube was removed from the ethanol.
Figure A2. Plot of ethanol into Tube 1 as a function of time (seconds). The plot documents the
section of the run where the slope is the most linear. The slope on this section of the data was
found to be 2.85*10-10 ± 5.48*10-12 kg2/sec.
0
5E-09
1E-08
1.5E-08
2E-08
2.5E-08
3E-08
3.5E-08
4E-08
0 20 40 60 80 100
M2
(kg2
)
Time (sec)
R² = 0.9894
0
2E-09
4E-09
6E-09
8E-09
1E-08
1.2E-08
1.4E-08
1.6E-08
1.8E-08
2E-08
10 15 20 25 30 35 40
M2
(kg2 )
Time (sec)
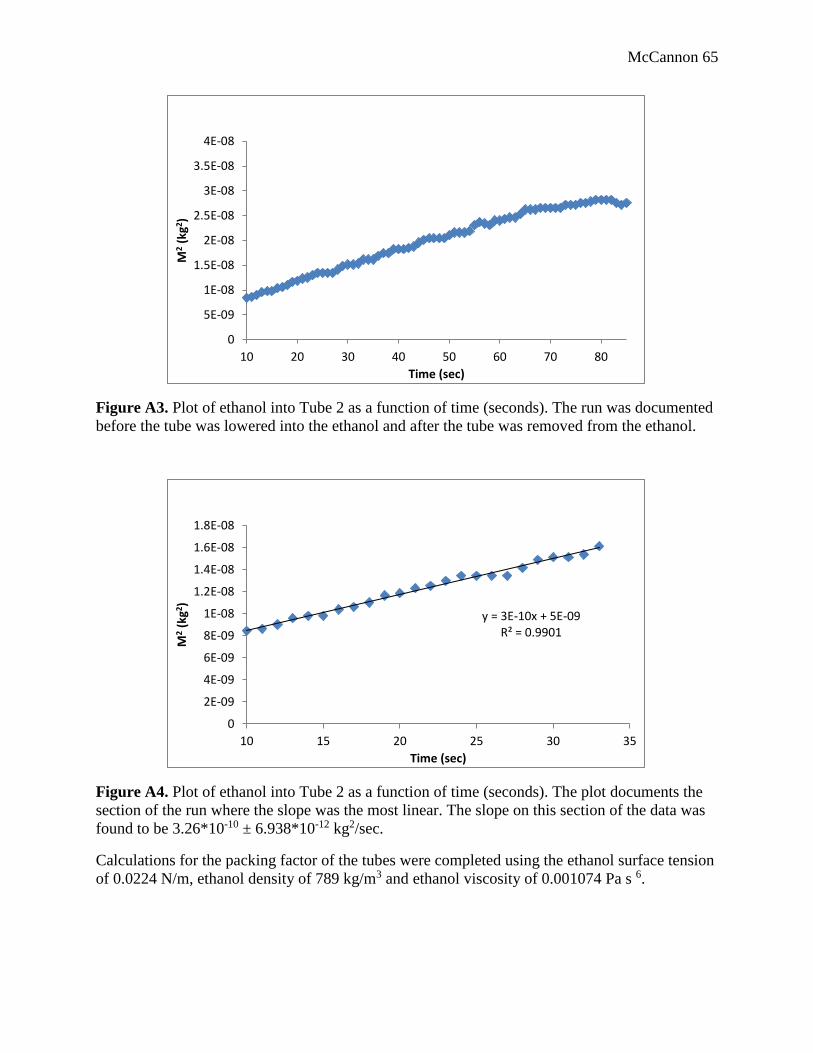
McCannon 65
Figure A3. Plot of ethanol into Tube 2 as a function of time (seconds). The run was documented
before the tube was lowered into the ethanol and after the tube was removed from the ethanol.
Figure A4. Plot of ethanol into Tube 2 as a function of time (seconds). The plot documents the
section of the run where the slope was the most linear. The slope on this section of the data was
found to be 3.26*10-10 ± 6.938*10-12 kg2/sec.
Calculations for the packing factor of the tubes were completed using the ethanol surface tension
of 0.0224 N/m, ethanol density of 789 kg/m3 and ethanol viscosity of 0.001074 Pa s 6.
0
5E-09
1E-08
1.5E-08
2E-08
2.5E-08
3E-08
3.5E-08
4E-08
10 20 30 40 50 60 70 80
M2
(kg2
)
Time (sec)
y = 3E-10x + 5E-09R² = 0.9901
0
2E-09
4E-09
6E-09
8E-09
1E-08
1.2E-08
1.4E-08
1.6E-08
1.8E-08
10 15 20 25 30 35
M2
(kg2 )
Time (sec)
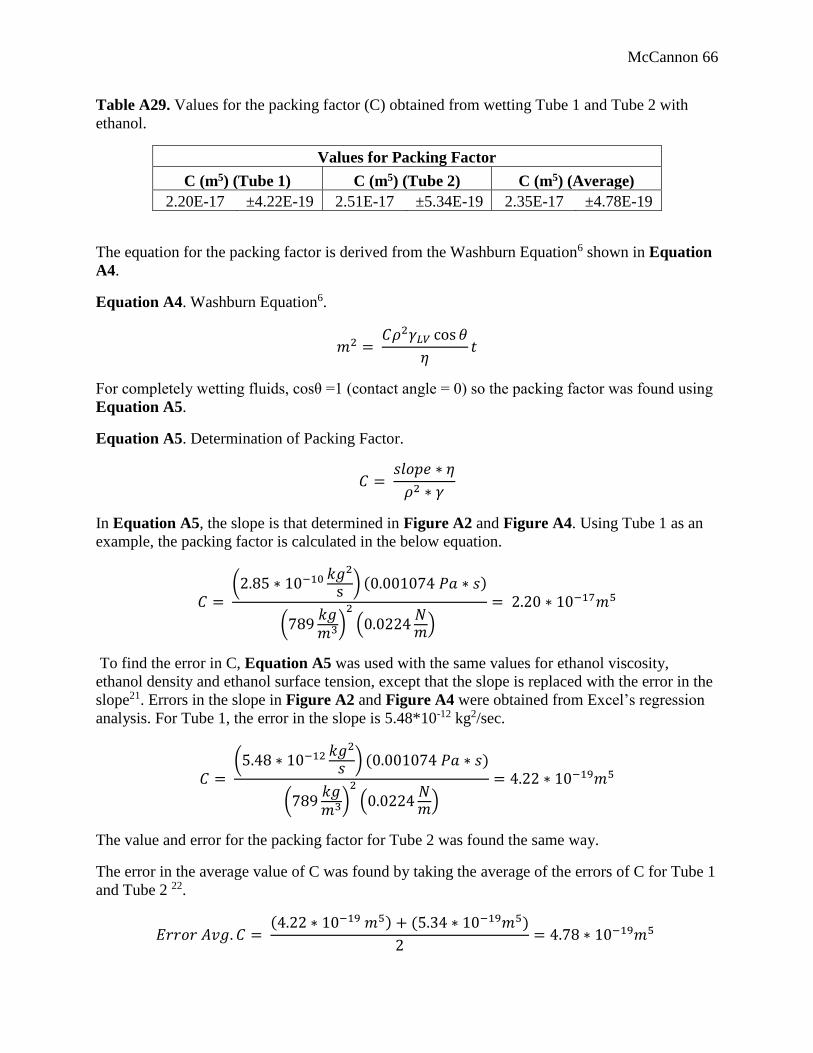
McCannon 66
Table A29. Values for the packing factor (C) obtained from wetting Tube 1 and Tube 2 with
ethanol.
Values for Packing Factor
C (m5) (Tube 1) C (m5) (Tube 2) C (m5) (Average)
2.20E-17 ±4.22E-19 2.51E-17 ±5.34E-19 2.35E-17 ±4.78E-19
The equation for the packing factor is derived from the Washburn Equation6 shown in Equation
A4.
Equation A4. Washburn Equation6.
𝑚2 = 𝐶𝜌2𝛾𝐿𝑉 cos 𝜃
𝜂𝑡
For completely wetting fluids, cosθ =1 (contact angle = 0) so the packing factor was found using
Equation A5.
Equation A5. Determination of Packing Factor.
𝐶 = 𝑠𝑙𝑜𝑝𝑒 ∗ 𝜂
𝜌2 ∗ 𝛾
In Equation A5, the slope is that determined in Figure A2 and Figure A4. Using Tube 1 as an
example, the packing factor is calculated in the below equation.
𝐶 = (2.85 ∗ 10−10 𝑘𝑔2
s ) (0.001074 𝑃𝑎 ∗ 𝑠)
(789𝑘𝑔𝑚3)
2
(0.0224𝑁𝑚)
= 2.20 ∗ 10−17𝑚5
To find the error in C, Equation A5 was used with the same values for ethanol viscosity,
ethanol density and ethanol surface tension, except that the slope is replaced with the error in the
slope21. Errors in the slope in Figure A2 and Figure A4 were obtained from Excel’s regression
analysis. For Tube 1, the error in the slope is 5.48*10-12 kg2/sec.
𝐶 = (5.48 ∗ 10−12 𝑘𝑔2
𝑠 ) (0.001074 𝑃𝑎 ∗ 𝑠)
(789𝑘𝑔𝑚3)
2
(0.0224𝑁𝑚)
= 4.22 ∗ 10−19𝑚5
The value and error for the packing factor for Tube 2 was found the same way.
The error in the average value of C was found by taking the average of the errors of C for Tube 1
and Tube 2 22.
𝐸𝑟𝑟𝑜𝑟 𝐴𝑣𝑔. 𝐶 = (4.22 ∗ 10−19 𝑚5) + (5.34 ∗ 10−19𝑚5)
2= 4.78 ∗ 10−19𝑚5
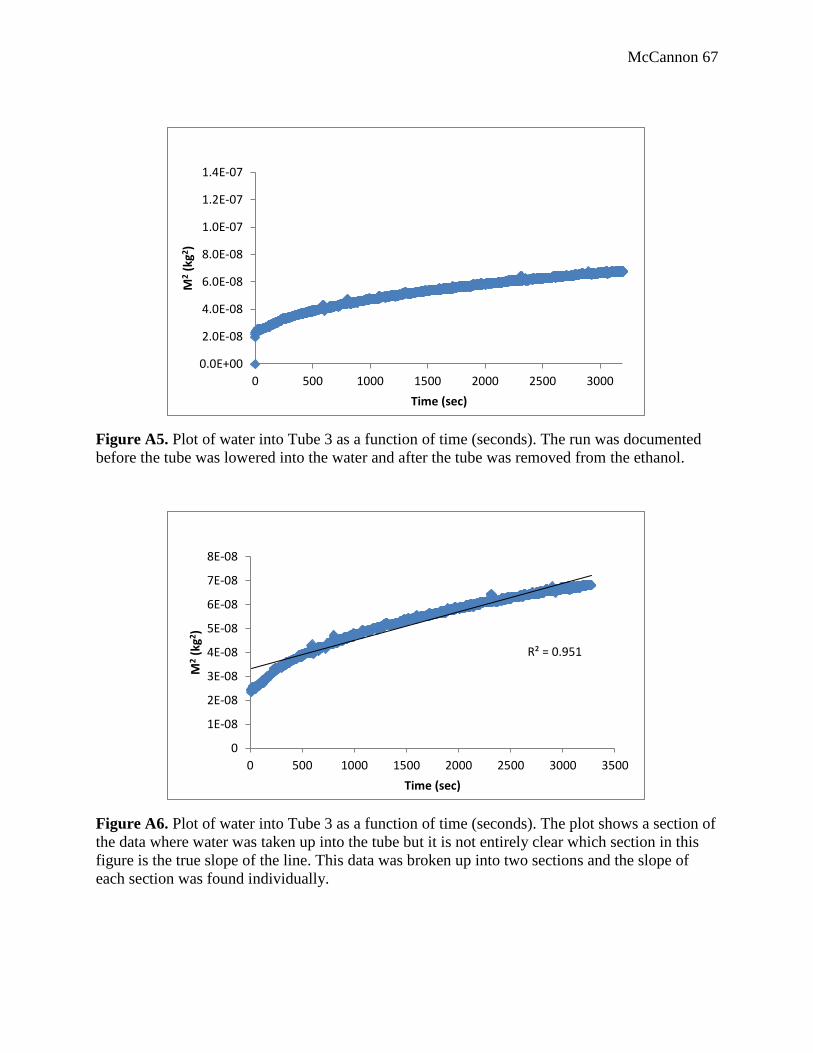
McCannon 67
Figure A5. Plot of water into Tube 3 as a function of time (seconds). The run was documented
before the tube was lowered into the water and after the tube was removed from the ethanol.
Figure A6. Plot of water into Tube 3 as a function of time (seconds). The plot shows a section of
the data where water was taken up into the tube but it is not entirely clear which section in this
figure is the true slope of the line. This data was broken up into two sections and the slope of
each section was found individually.
0.0E+00
2.0E-08
4.0E-08
6.0E-08
8.0E-08
1.0E-07
1.2E-07
1.4E-07
0 500 1000 1500 2000 2500 3000
M2
(kg2 )
Time (sec)
R² = 0.951
0
1E-08
2E-08
3E-08
4E-08
5E-08
6E-08
7E-08
8E-08
0 500 1000 1500 2000 2500 3000 3500
M2
(kg2 )
Time (sec)
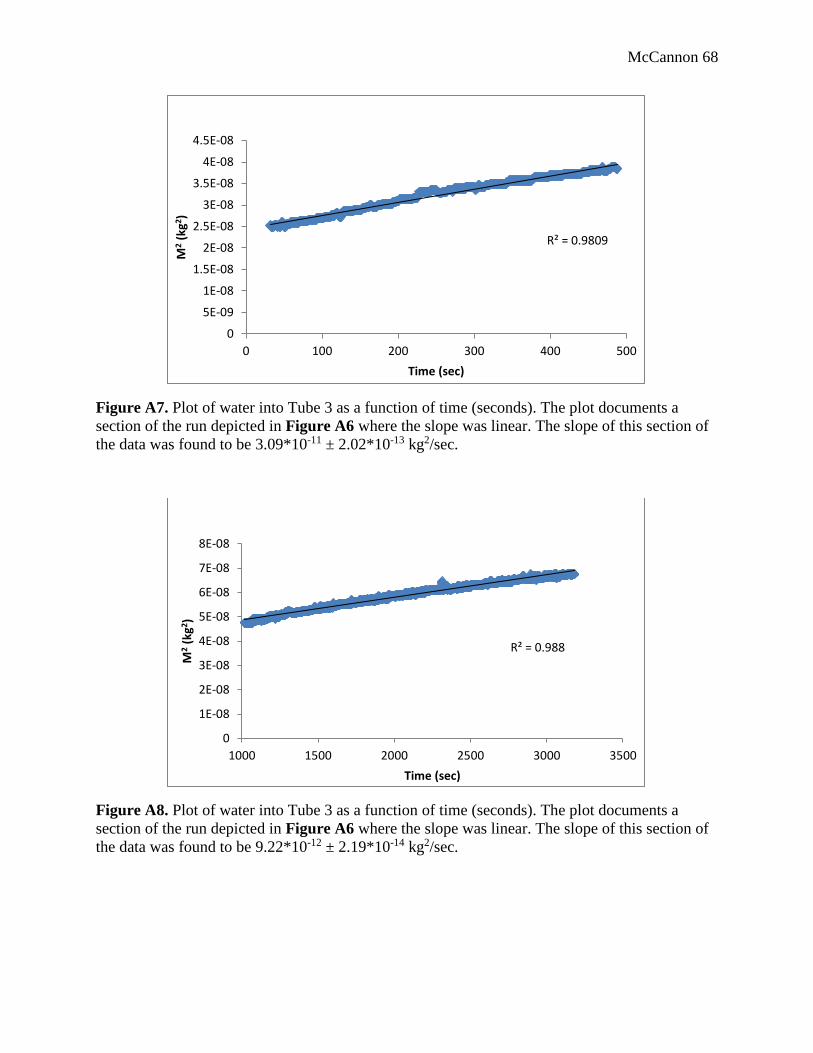
McCannon 68
Figure A7. Plot of water into Tube 3 as a function of time (seconds). The plot documents a
section of the run depicted in Figure A6 where the slope was linear. The slope of this section of
the data was found to be 3.09*10-11 ± 2.02*10-13 kg2/sec.
Figure A8. Plot of water into Tube 3 as a function of time (seconds). The plot documents a
section of the run depicted in Figure A6 where the slope was linear. The slope of this section of
the data was found to be 9.22*10-12 ± 2.19*10-14 kg2/sec.
R² = 0.9809
0
5E-09
1E-08
1.5E-08
2E-08
2.5E-08
3E-08
3.5E-08
4E-08
4.5E-08
0 100 200 300 400 500
M2
(kg2 )
Time (sec)
R² = 0.988
0
1E-08
2E-08
3E-08
4E-08
5E-08
6E-08
7E-08
8E-08
1000 1500 2000 2500 3000 3500
M2
(kg2 )
Time (sec)
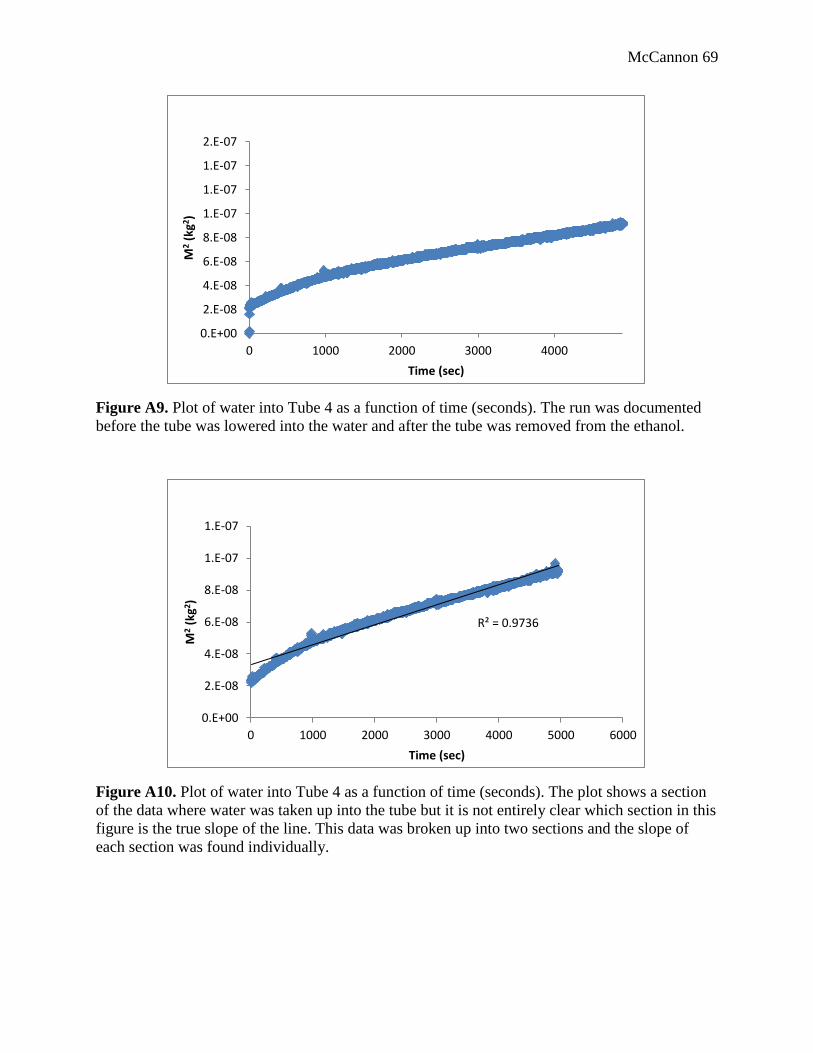
McCannon 69
Figure A9. Plot of water into Tube 4 as a function of time (seconds). The run was documented
before the tube was lowered into the water and after the tube was removed from the ethanol.
Figure A10. Plot of water into Tube 4 as a function of time (seconds). The plot shows a section
of the data where water was taken up into the tube but it is not entirely clear which section in this
figure is the true slope of the line. This data was broken up into two sections and the slope of
each section was found individually.
0.E+00
2.E-08
4.E-08
6.E-08
8.E-08
1.E-07
1.E-07
1.E-07
2.E-07
0 1000 2000 3000 4000
M2
(kg2 )
Time (sec)
R² = 0.9736
0.E+00
2.E-08
4.E-08
6.E-08
8.E-08
1.E-07
1.E-07
0 1000 2000 3000 4000 5000 6000
M2
(kg2 )
Time (sec)
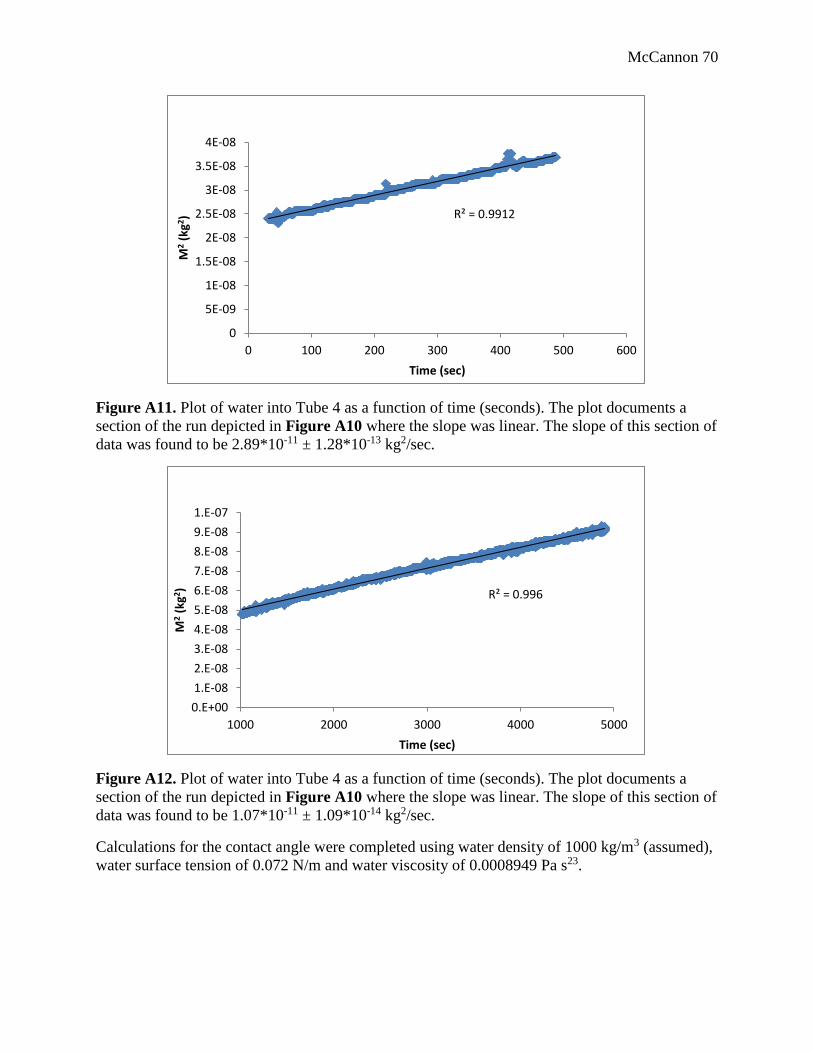
McCannon 70
Figure A11. Plot of water into Tube 4 as a function of time (seconds). The plot documents a
section of the run depicted in Figure A10 where the slope was linear. The slope of this section of
data was found to be 2.89*10-11 ± 1.28*10-13 kg2/sec.
Figure A12. Plot of water into Tube 4 as a function of time (seconds). The plot documents a
section of the run depicted in Figure A10 where the slope was linear. The slope of this section of
data was found to be 1.07*10-11 ± 1.09*10-14 kg2/sec.
Calculations for the contact angle were completed using water density of 1000 kg/m3 (assumed),
water surface tension of 0.072 N/m and water viscosity of 0.0008949 Pa s23.
R² = 0.9912
0
5E-09
1E-08
1.5E-08
2E-08
2.5E-08
3E-08
3.5E-08
4E-08
0 100 200 300 400 500 600
M2
(kg2 )
Time (sec)
R² = 0.996
0.E+00
1.E-08
2.E-08
3.E-08
4.E-08
5.E-08
6.E-08
7.E-08
8.E-08
9.E-08
1.E-07
1000 2000 3000 4000 5000
M2
(kg2 )
Time (sec)
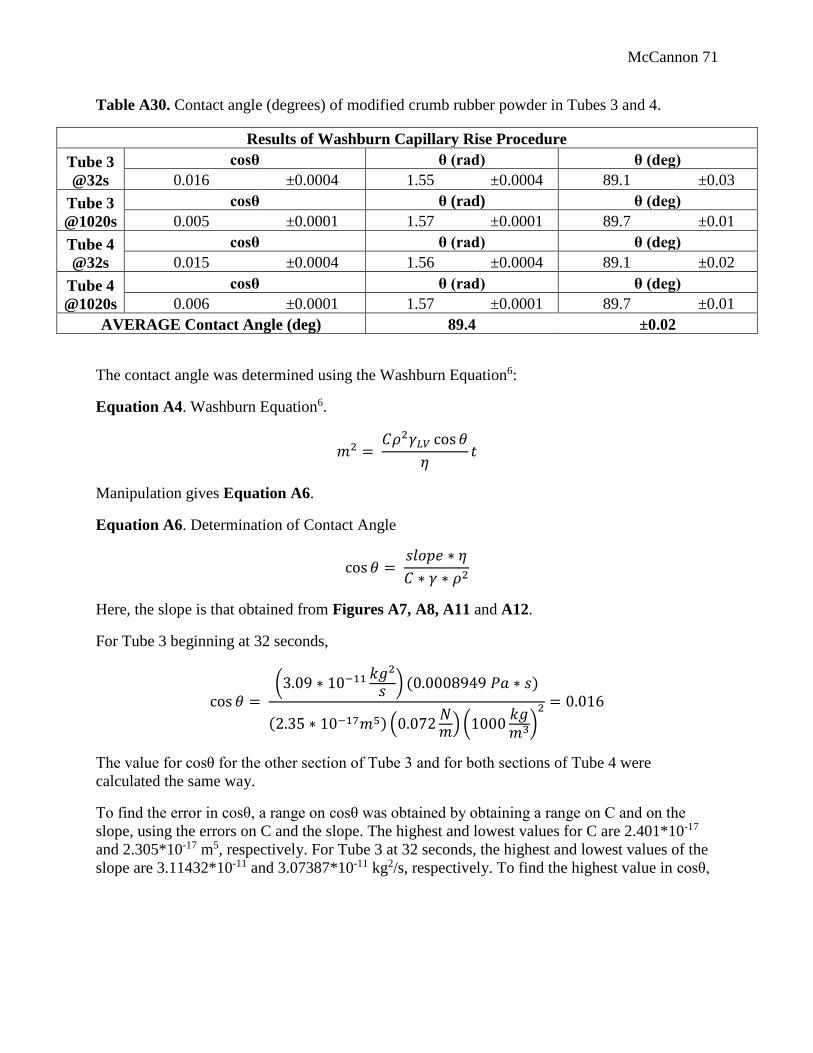
McCannon 71
Table A30. Contact angle (degrees) of modified crumb rubber powder in Tubes 3 and 4.
Results of Washburn Capillary Rise Procedure
Tube 3
@32s
cosθ θ (rad) θ (deg)
0.016 ±0.0004 1.55 ±0.0004 89.1 ±0.03
Tube 3
@1020s
cosθ θ (rad) θ (deg)
0.005 ±0.0001 1.57 ±0.0001 89.7 ±0.01
Tube 4
@32s
cosθ θ (rad) θ (deg)
0.015 ±0.0004 1.56 ±0.0004 89.1 ±0.02
Tube 4
@1020s
cosθ θ (rad) θ (deg)
0.006 ±0.0001 1.57 ±0.0001 89.7 ±0.01
AVERAGE Contact Angle (deg) 89.4 ±0.02
The contact angle was determined using the Washburn Equation6:
Equation A4. Washburn Equation6.
𝑚2 = 𝐶𝜌2𝛾𝐿𝑉 cos 𝜃
𝜂𝑡
Manipulation gives Equation A6.
Equation A6. Determination of Contact Angle
cos 𝜃 = 𝑠𝑙𝑜𝑝𝑒 ∗ 𝜂
𝐶 ∗ 𝛾 ∗ 𝜌2
Here, the slope is that obtained from Figures A7, A8, A11 and A12.
For Tube 3 beginning at 32 seconds,
cos 𝜃 = (3.09 ∗ 10−11 𝑘𝑔2
𝑠 ) (0.0008949 𝑃𝑎 ∗ 𝑠)
(2.35 ∗ 10−17𝑚5) (0.072𝑁𝑚) (1000
𝑘𝑔𝑚3)
2 = 0.016
The value for cosθ for the other section of Tube 3 and for both sections of Tube 4 were
calculated the same way.
To find the error in cosθ, a range on cosθ was obtained by obtaining a range on C and on the
slope, using the errors on C and the slope. The highest and lowest values for C are 2.401*10-17
and 2.305*10-17 m5, respectively. For Tube 3 at 32 seconds, the highest and lowest values of the
slope are 3.11432*10-11 and 3.07387*10-11 kg2/s, respectively. To find the highest value in cosθ,
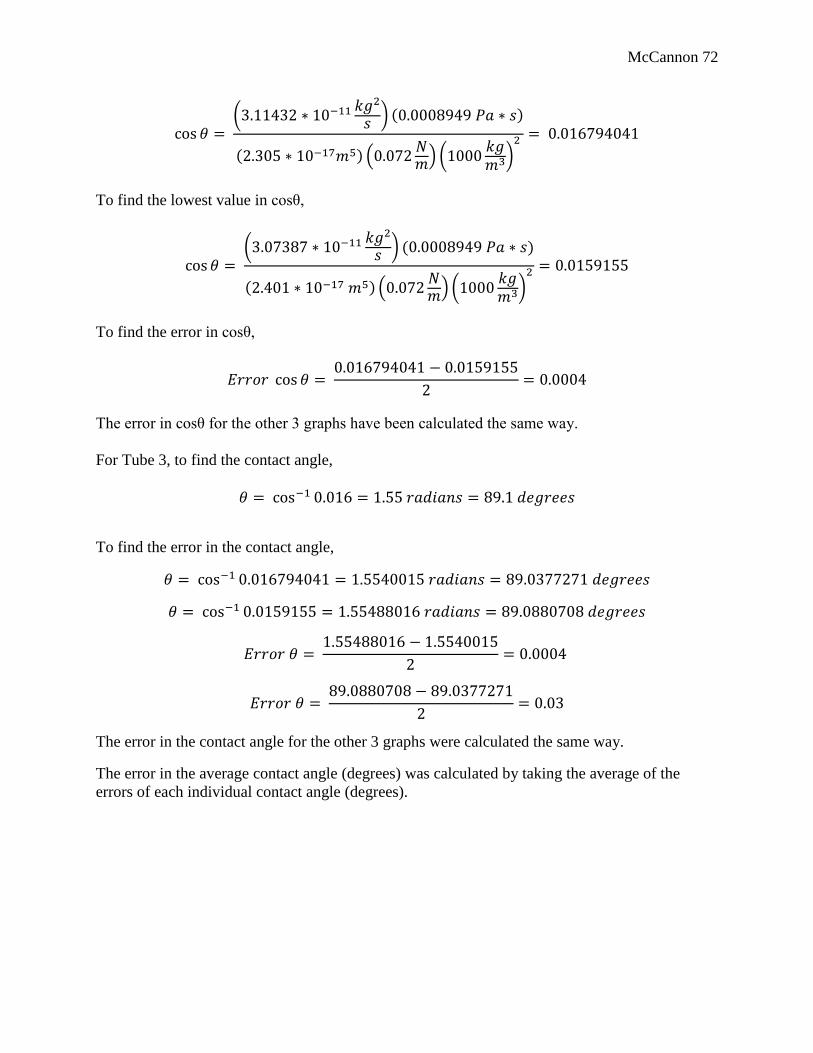
McCannon 72
cos 𝜃 = (3.11432 ∗ 10−11 𝑘𝑔2
𝑠 ) (0.0008949 𝑃𝑎 ∗ 𝑠)
(2.305 ∗ 10−17𝑚5) (0.072𝑁𝑚) (1000
𝑘𝑔𝑚3)
2 = 0.016794041
To find the lowest value in cosθ,
cos 𝜃 = (3.07387 ∗ 10−11 𝑘𝑔2
𝑠 ) (0.0008949 𝑃𝑎 ∗ 𝑠)
(2.401 ∗ 10−17 𝑚5) (0.072𝑁𝑚) (1000
𝑘𝑔𝑚3)
2 = 0.0159155
To find the error in cosθ,
𝐸𝑟𝑟𝑜𝑟 cos 𝜃 = 0.016794041 − 0.0159155
2= 0.0004
The error in cosθ for the other 3 graphs have been calculated the same way.
For Tube 3, to find the contact angle,
𝜃 = cos−1 0.016 = 1.55 𝑟𝑎𝑑𝑖𝑎𝑛𝑠 = 89.1 𝑑𝑒𝑔𝑟𝑒𝑒𝑠
To find the error in the contact angle,
𝜃 = cos−1 0.016794041 = 1.5540015 𝑟𝑎𝑑𝑖𝑎𝑛𝑠 = 89.0377271 𝑑𝑒𝑔𝑟𝑒𝑒𝑠
𝜃 = cos−1 0.0159155 = 1.55488016 𝑟𝑎𝑑𝑖𝑎𝑛𝑠 = 89.0880708 𝑑𝑒𝑔𝑟𝑒𝑒𝑠
𝐸𝑟𝑟𝑜𝑟 𝜃 = 1.55488016 − 1.5540015
2= 0.0004
𝐸𝑟𝑟𝑜𝑟 𝜃 = 89.0880708 − 89.0377271
2= 0.03
The error in the contact angle for the other 3 graphs were calculated the same way.
The error in the average contact angle (degrees) was calculated by taking the average of the
errors of each individual contact angle (degrees).
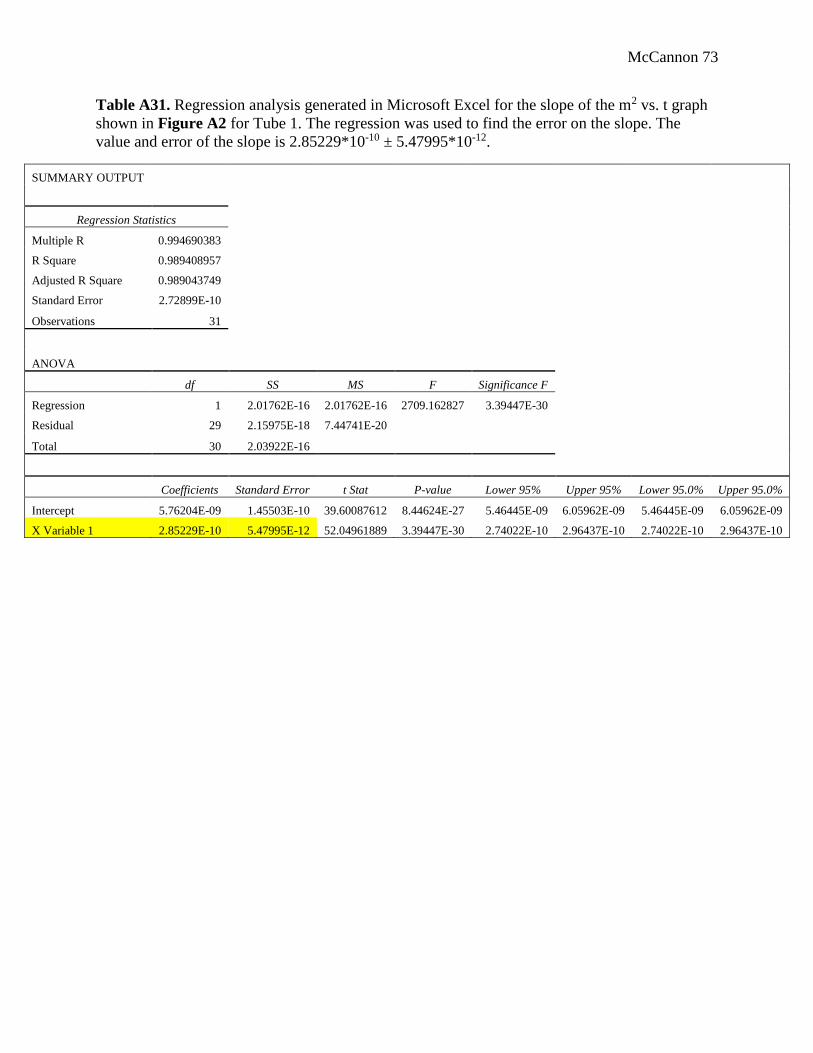
McCannon 73
Table A31. Regression analysis generated in Microsoft Excel for the slope of the m2 vs. t graph
shown in Figure A2 for Tube 1. The regression was used to find the error on the slope. The
value and error of the slope is 2.85229*10-10 ± 5.47995*10-12.
SUMMARY OUTPUT
Regression Statistics
Multiple R 0.994690383
R Square 0.989408957
Adjusted R Square 0.989043749
Standard Error 2.72899E-10
Observations 31
ANOVA
df SS MS F Significance F
Regression 1 2.01762E-16 2.01762E-16 2709.162827 3.39447E-30
Residual 29 2.15975E-18 7.44741E-20
Total 30 2.03922E-16
Coefficients Standard Error t Stat P-value Lower 95% Upper 95% Lower 95.0% Upper 95.0%
Intercept 5.76204E-09 1.45503E-10 39.60087612 8.44624E-27 5.46445E-09 6.05962E-09 5.46445E-09 6.05962E-09
X Variable 1 2.85229E-10 5.47995E-12 52.04961889 3.39447E-30 2.74022E-10 2.96437E-10 2.74022E-10 2.96437E-10
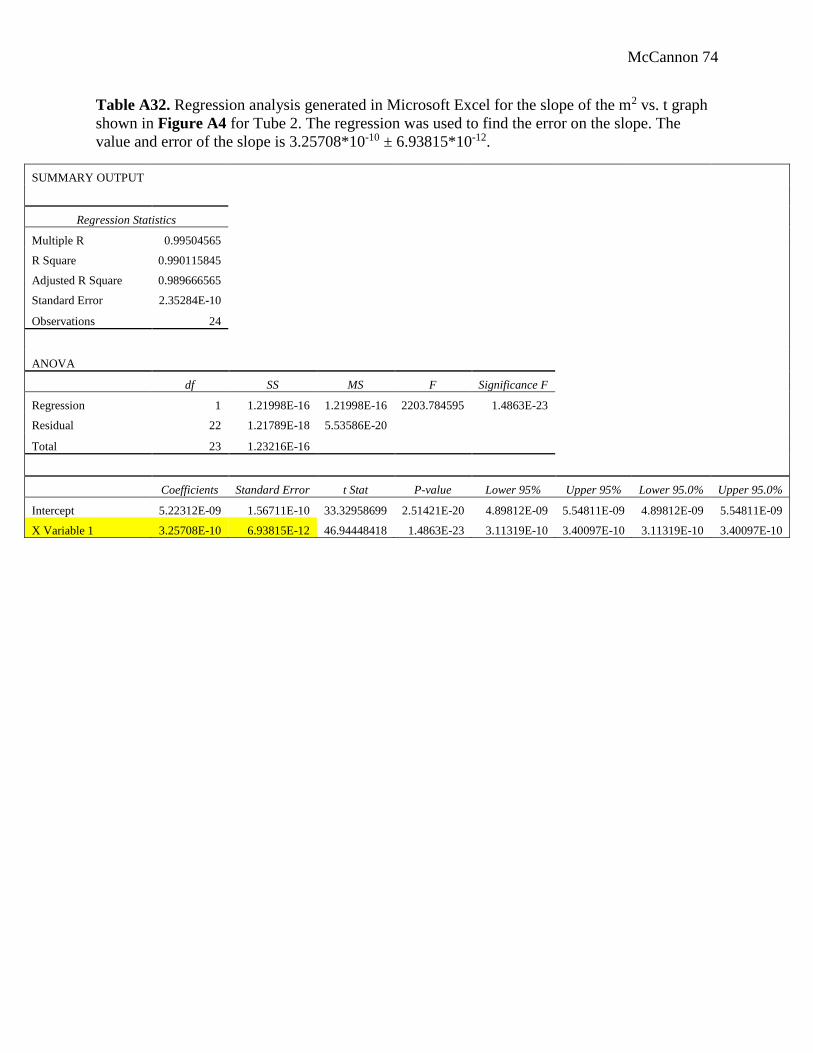
McCannon 74
Table A32. Regression analysis generated in Microsoft Excel for the slope of the m2 vs. t graph
shown in Figure A4 for Tube 2. The regression was used to find the error on the slope. The
value and error of the slope is 3.25708*10-10 ± 6.93815*10-12.
SUMMARY OUTPUT
Regression Statistics
Multiple R 0.99504565
R Square 0.990115845
Adjusted R Square 0.989666565
Standard Error 2.35284E-10
Observations 24
ANOVA
df SS MS F Significance F
Regression 1 1.21998E-16 1.21998E-16 2203.784595 1.4863E-23
Residual 22 1.21789E-18 5.53586E-20
Total 23 1.23216E-16
Coefficients Standard Error t Stat P-value Lower 95% Upper 95% Lower 95.0% Upper 95.0%
Intercept 5.22312E-09 1.56711E-10 33.32958699 2.51421E-20 4.89812E-09 5.54811E-09 4.89812E-09 5.54811E-09
X Variable 1 3.25708E-10 6.93815E-12 46.94448418 1.4863E-23 3.11319E-10 3.40097E-10 3.11319E-10 3.40097E-10
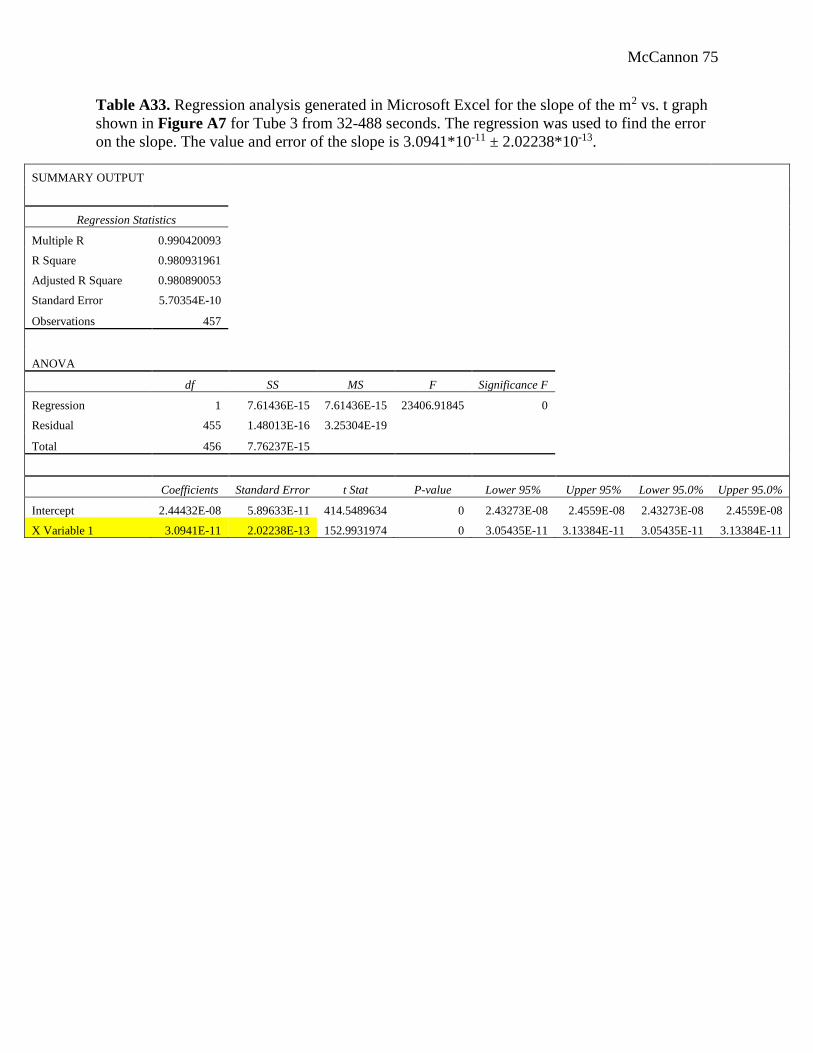
McCannon 75
Table A33. Regression analysis generated in Microsoft Excel for the slope of the m2 vs. t graph
shown in Figure A7 for Tube 3 from 32-488 seconds. The regression was used to find the error
on the slope. The value and error of the slope is 3.0941*10-11 ± 2.02238*10-13.
SUMMARY OUTPUT
Regression Statistics
Multiple R 0.990420093
R Square 0.980931961
Adjusted R Square 0.980890053
Standard Error 5.70354E-10
Observations 457
ANOVA
df SS MS F Significance F
Regression 1 7.61436E-15 7.61436E-15 23406.91845 0
Residual 455 1.48013E-16 3.25304E-19
Total 456 7.76237E-15
Coefficients Standard Error t Stat P-value Lower 95% Upper 95% Lower 95.0% Upper 95.0%
Intercept 2.44432E-08 5.89633E-11 414.5489634 0 2.43273E-08 2.4559E-08 2.43273E-08 2.4559E-08
X Variable 1 3.0941E-11 2.02238E-13 152.9931974 0 3.05435E-11 3.13384E-11 3.05435E-11 3.13384E-11
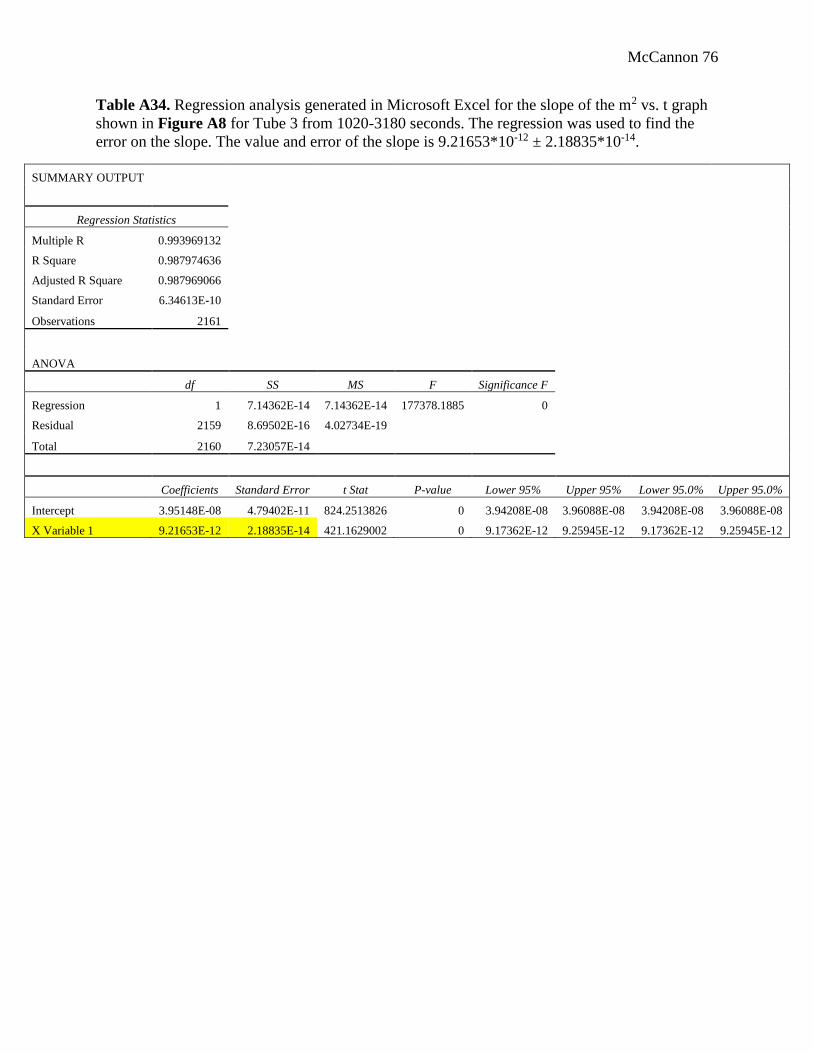
McCannon 76
Table A34. Regression analysis generated in Microsoft Excel for the slope of the m2 vs. t graph
shown in Figure A8 for Tube 3 from 1020-3180 seconds. The regression was used to find the
error on the slope. The value and error of the slope is 9.21653*10-12 ± 2.18835*10-14.
SUMMARY OUTPUT
Regression Statistics
Multiple R 0.993969132
R Square 0.987974636
Adjusted R Square 0.987969066
Standard Error 6.34613E-10
Observations 2161
ANOVA
df SS MS F Significance F
Regression 1 7.14362E-14 7.14362E-14 177378.1885 0
Residual 2159 8.69502E-16 4.02734E-19
Total 2160 7.23057E-14
Coefficients Standard Error t Stat P-value Lower 95% Upper 95% Lower 95.0% Upper 95.0%
Intercept 3.95148E-08 4.79402E-11 824.2513826 0 3.94208E-08 3.96088E-08 3.94208E-08 3.96088E-08
X Variable 1 9.21653E-12 2.18835E-14 421.1629002 0 9.17362E-12 9.25945E-12 9.17362E-12 9.25945E-12
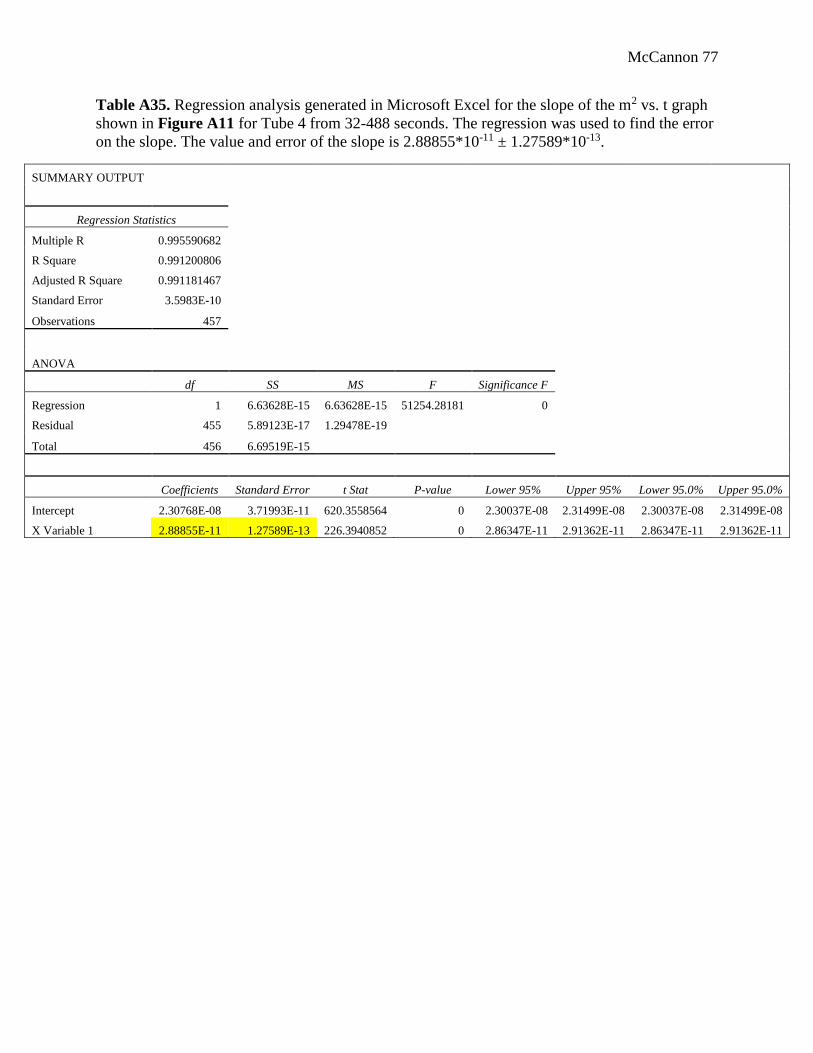
McCannon 77
Table A35. Regression analysis generated in Microsoft Excel for the slope of the m2 vs. t graph
shown in Figure A11 for Tube 4 from 32-488 seconds. The regression was used to find the error
on the slope. The value and error of the slope is 2.88855*10-11 ± 1.27589*10-13.
SUMMARY OUTPUT
Regression Statistics
Multiple R 0.995590682
R Square 0.991200806
Adjusted R Square 0.991181467
Standard Error 3.5983E-10
Observations 457
ANOVA
df SS MS F Significance F
Regression 1 6.63628E-15 6.63628E-15 51254.28181 0
Residual 455 5.89123E-17 1.29478E-19
Total 456 6.69519E-15
Coefficients Standard Error t Stat P-value Lower 95% Upper 95% Lower 95.0% Upper 95.0%
Intercept 2.30768E-08 3.71993E-11 620.3558564 0 2.30037E-08 2.31499E-08 2.30037E-08 2.31499E-08
X Variable 1 2.88855E-11 1.27589E-13 226.3940852 0 2.86347E-11 2.91362E-11 2.86347E-11 2.91362E-11
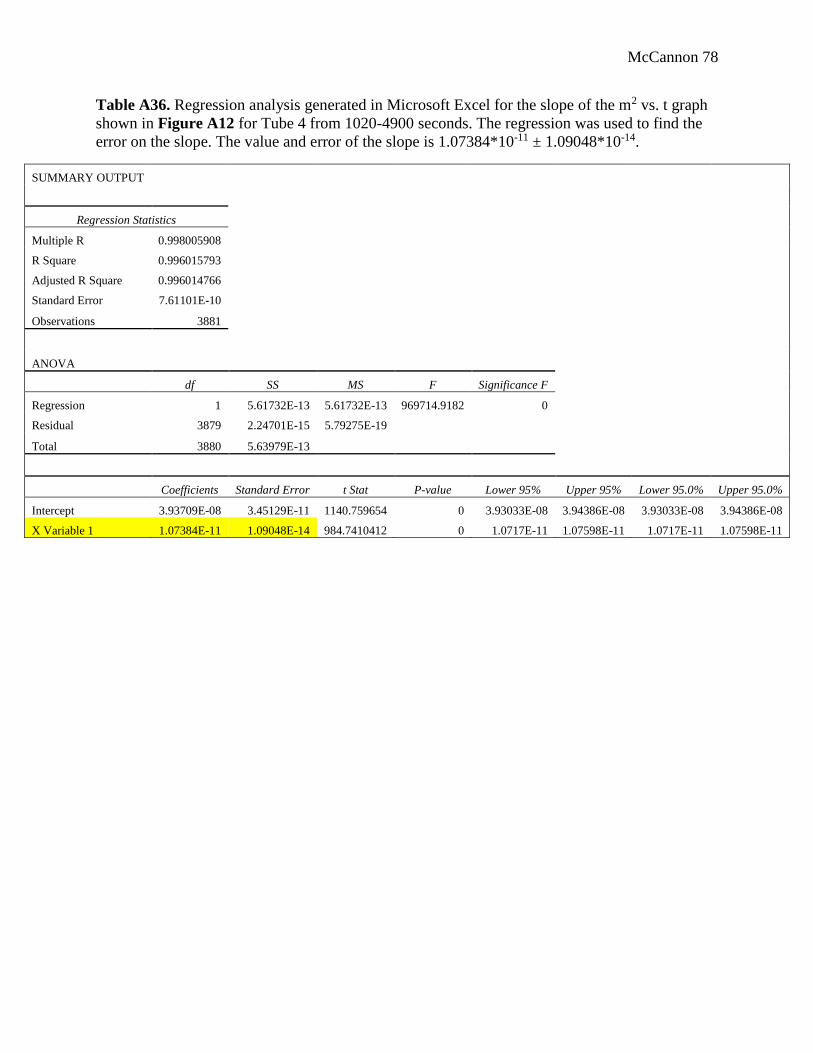
McCannon 78
Table A36. Regression analysis generated in Microsoft Excel for the slope of the m2 vs. t graph
shown in Figure A12 for Tube 4 from 1020-4900 seconds. The regression was used to find the
error on the slope. The value and error of the slope is 1.07384*10-11 ± 1.09048*10-14.
SUMMARY OUTPUT
Regression Statistics
Multiple R 0.998005908
R Square 0.996015793
Adjusted R Square 0.996014766
Standard Error 7.61101E-10
Observations 3881
ANOVA
df SS MS F Significance F
Regression 1 5.61732E-13 5.61732E-13 969714.9182 0
Residual 3879 2.24701E-15 5.79275E-19
Total 3880 5.63979E-13
Coefficients Standard Error t Stat P-value Lower 95% Upper 95% Lower 95.0% Upper 95.0%
Intercept 3.93709E-08 3.45129E-11 1140.759654 0 3.93033E-08 3.94386E-08 3.93033E-08 3.94386E-08
X Variable 1 1.07384E-11 1.09048E-14 984.7410412 0 1.0717E-11 1.07598E-11 1.0717E-11 1.07598E-11
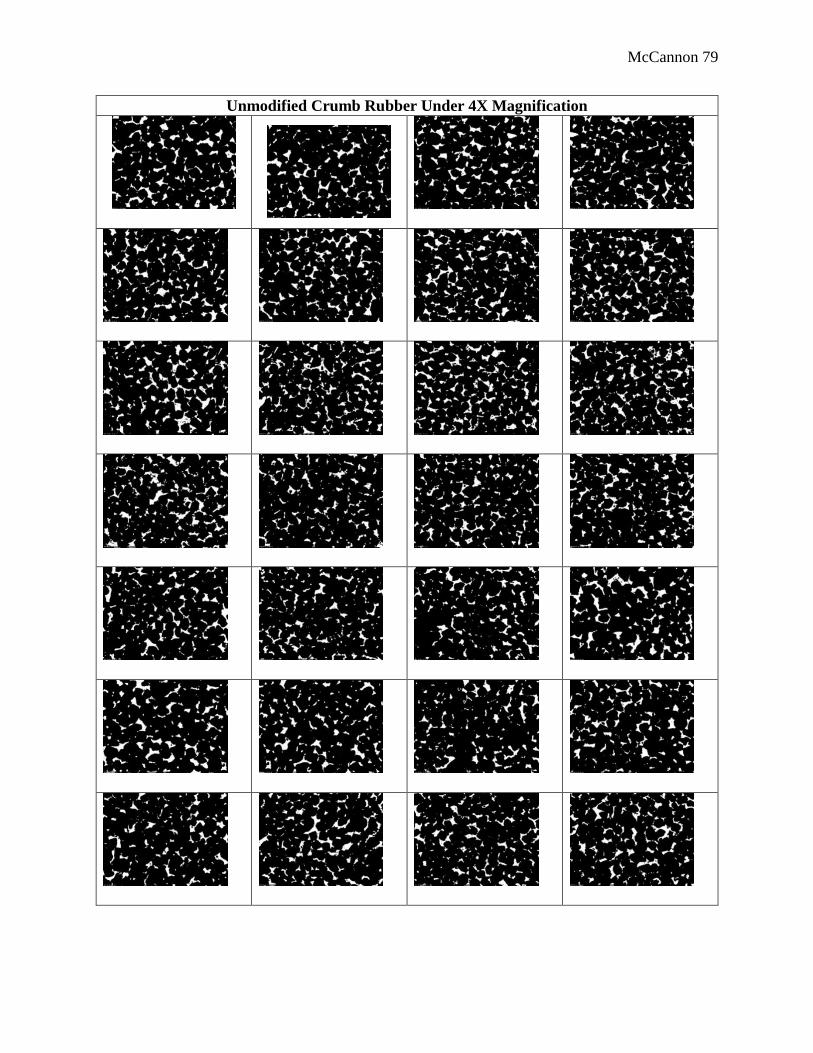
McCannon 79
Unmodified Crumb Rubber Under 4X Magnification
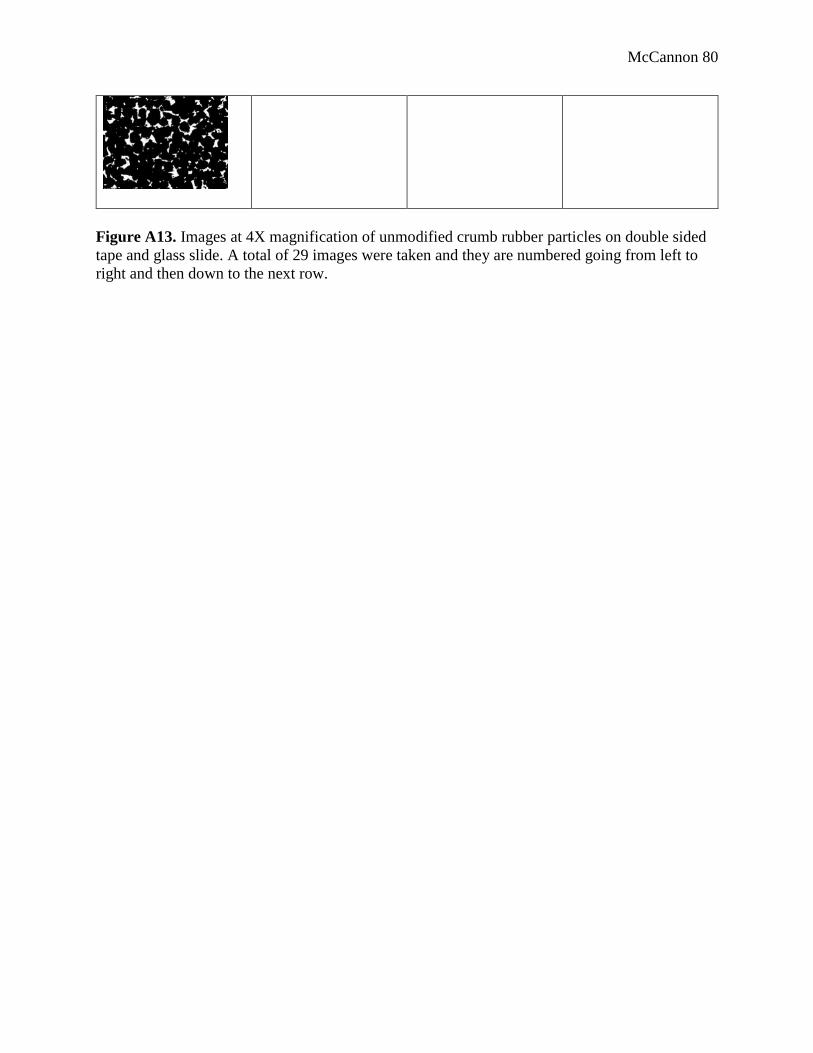
McCannon 80
Figure A13. Images at 4X magnification of unmodified crumb rubber particles on double sided
tape and glass slide. A total of 29 images were taken and they are numbered going from left to
right and then down to the next row.
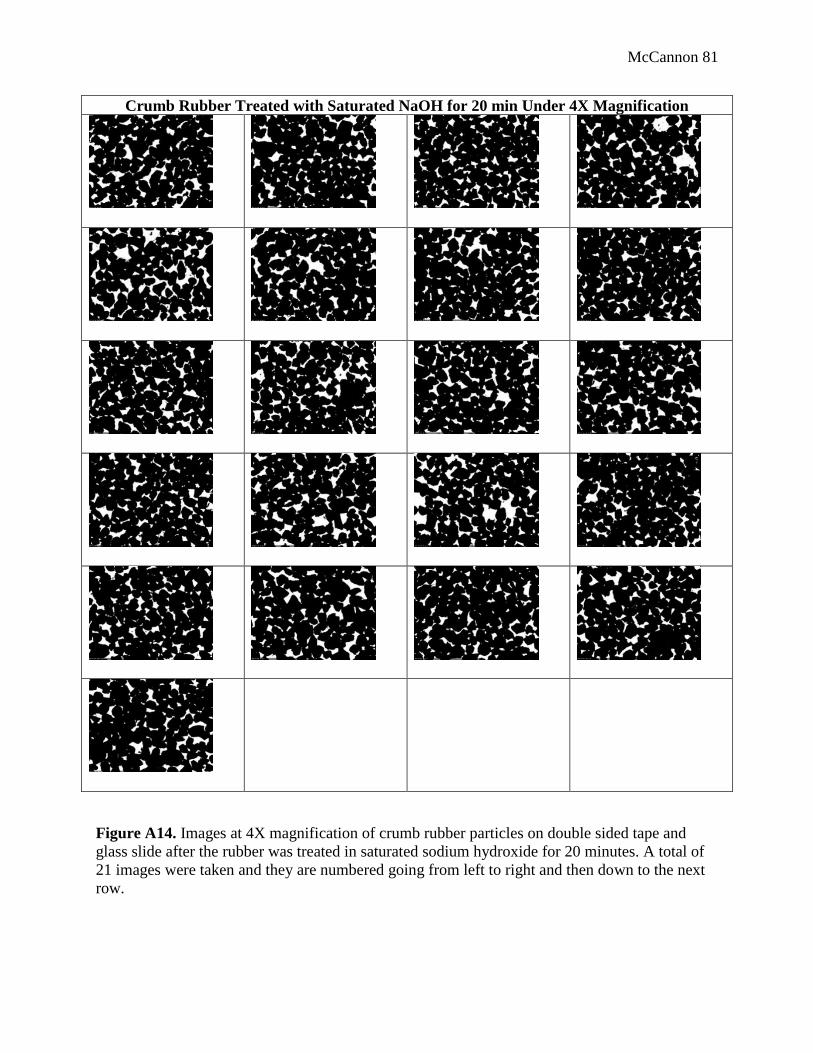
McCannon 81
Crumb Rubber Treated with Saturated NaOH for 20 min Under 4X Magnification
Figure A14. Images at 4X magnification of crumb rubber particles on double sided tape and
glass slide after the rubber was treated in saturated sodium hydroxide for 20 minutes. A total of
21 images were taken and they are numbered going from left to right and then down to the next
row.
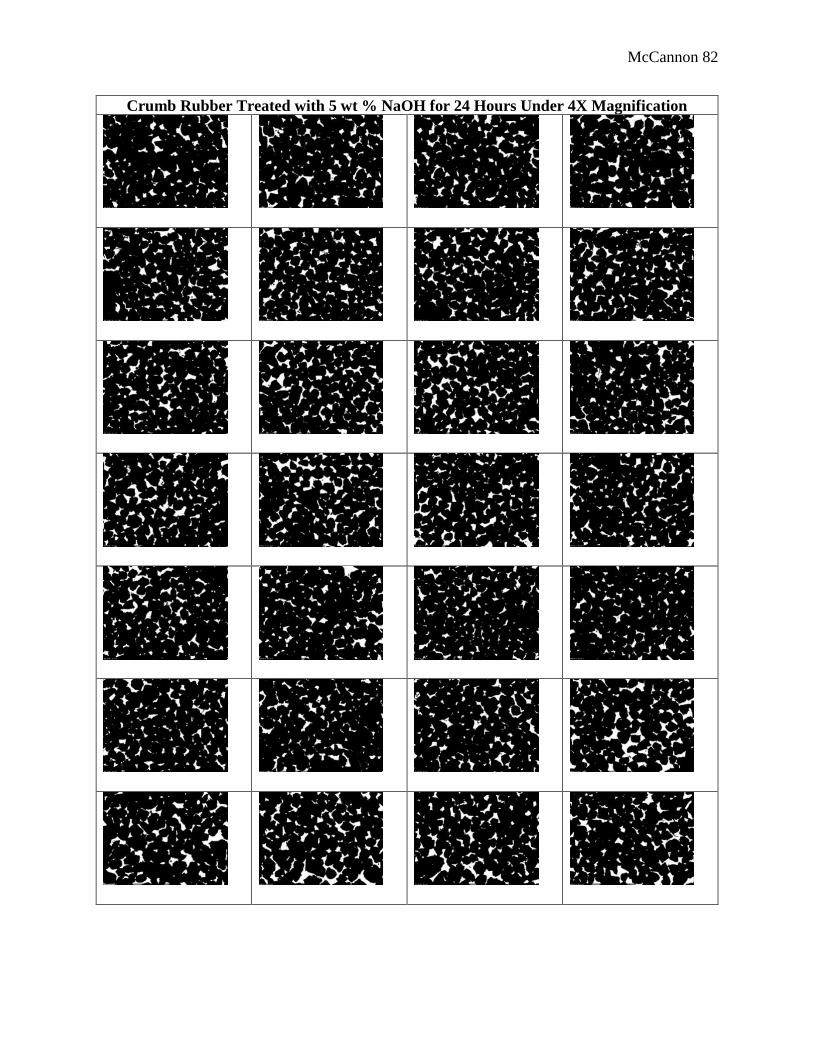
McCannon 82
Crumb Rubber Treated with 5 wt % NaOH for 24 Hours Under 4X Magnification
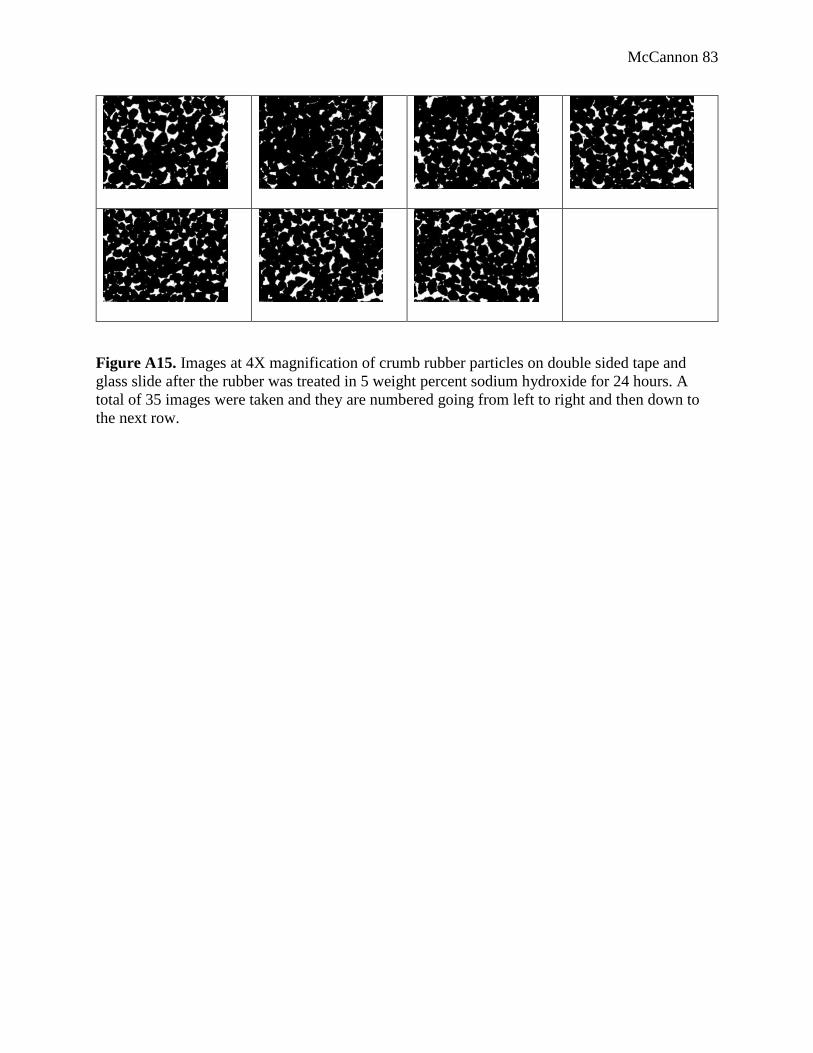
McCannon 83
Figure A15. Images at 4X magnification of crumb rubber particles on double sided tape and
glass slide after the rubber was treated in 5 weight percent sodium hydroxide for 24 hours. A
total of 35 images were taken and they are numbered going from left to right and then down to
the next row.
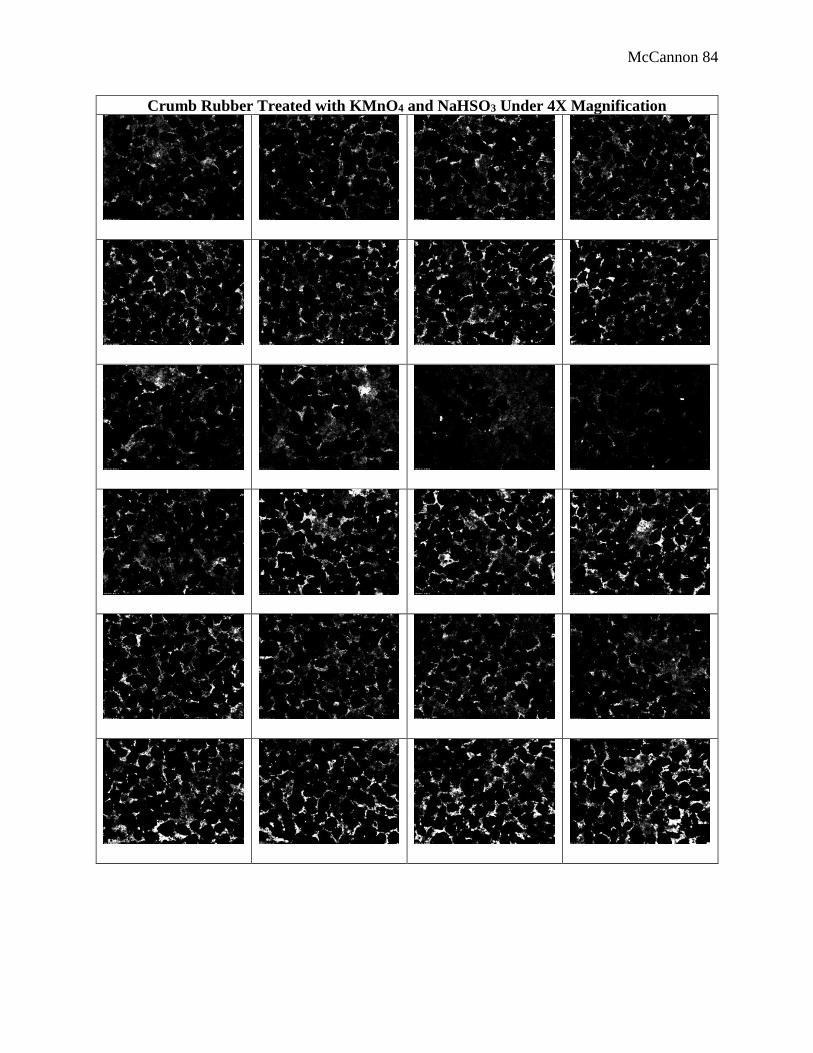
McCannon 84
Crumb Rubber Treated with KMnO4 and NaHSO3 Under 4X Magnification
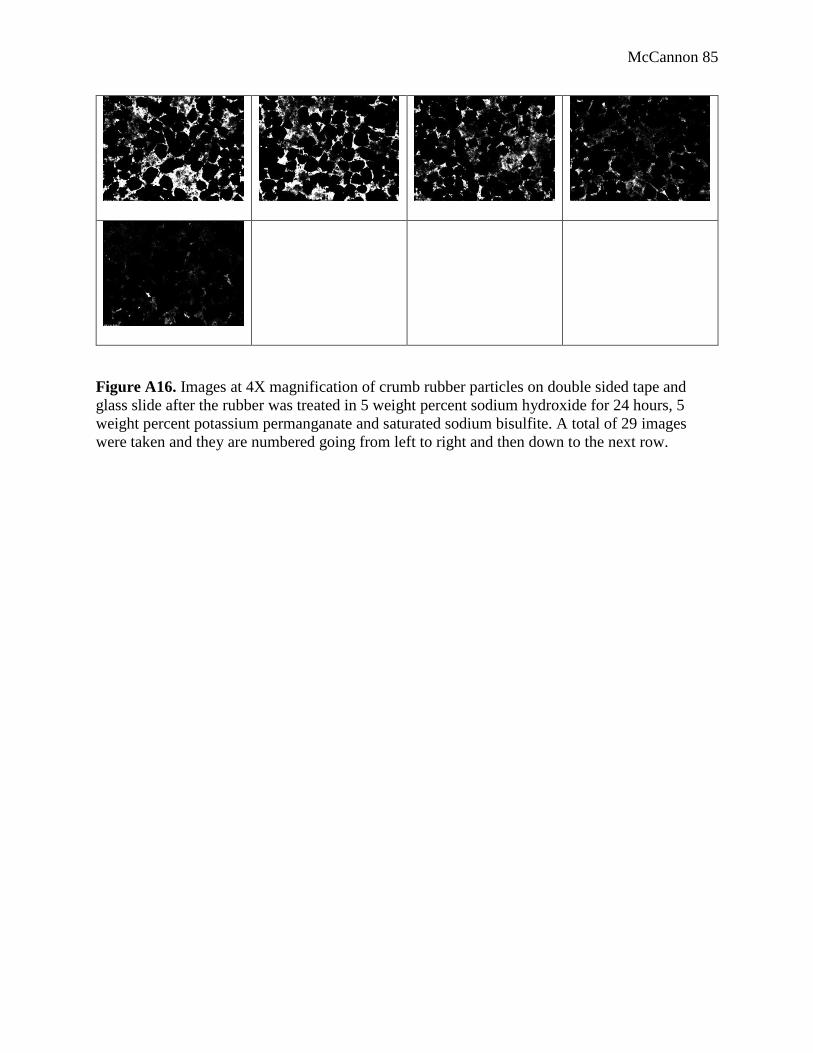
McCannon 85
Figure A16. Images at 4X magnification of crumb rubber particles on double sided tape and
glass slide after the rubber was treated in 5 weight percent sodium hydroxide for 24 hours, 5
weight percent potassium permanganate and saturated sodium bisulfite. A total of 29 images
were taken and they are numbered going from left to right and then down to the next row.
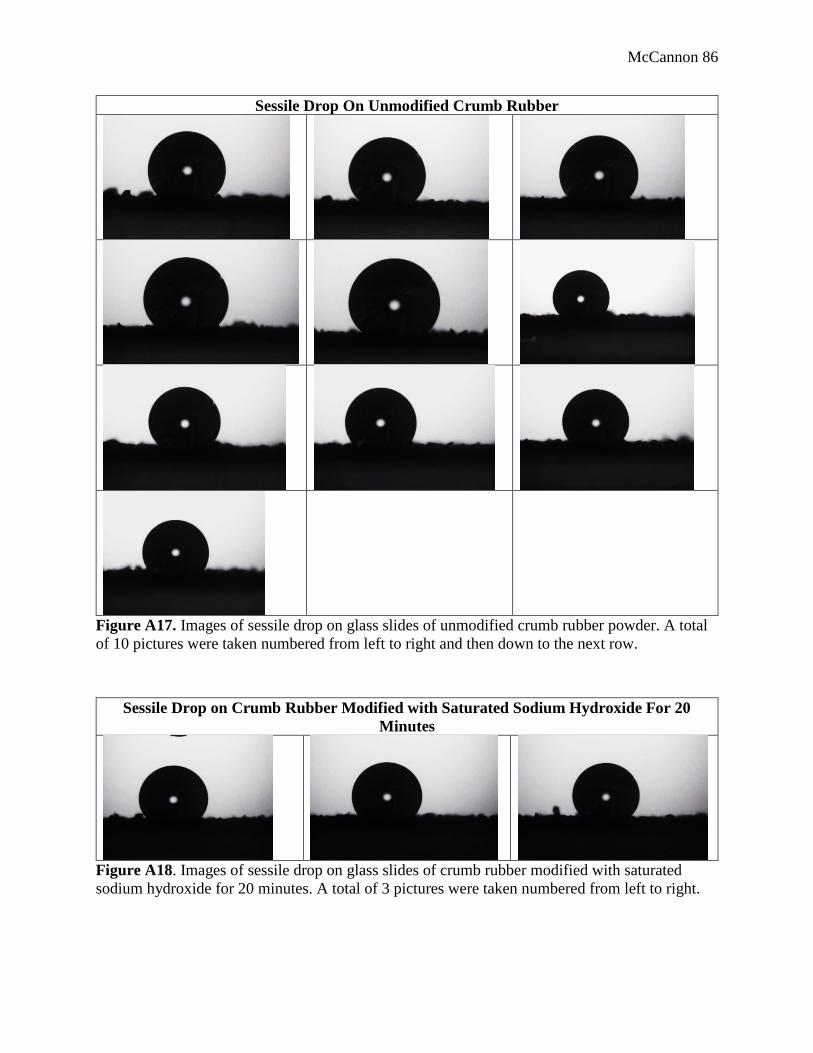
McCannon 86
Sessile Drop On Unmodified Crumb Rubber
Figure A17. Images of sessile drop on glass slides of unmodified crumb rubber powder. A total
of 10 pictures were taken numbered from left to right and then down to the next row.
Sessile Drop on Crumb Rubber Modified with Saturated Sodium Hydroxide For 20
Minutes
Figure A18. Images of sessile drop on glass slides of crumb rubber modified with saturated
sodium hydroxide for 20 minutes. A total of 3 pictures were taken numbered from left to right.
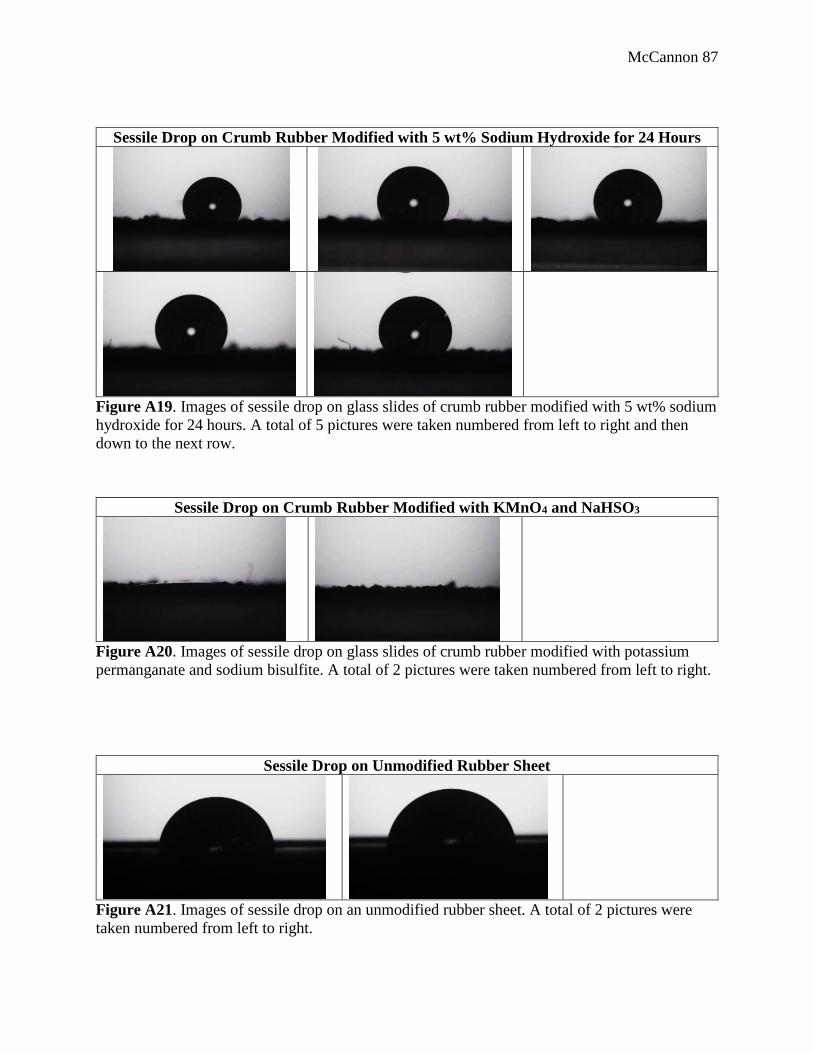
McCannon 87
Sessile Drop on Crumb Rubber Modified with 5 wt% Sodium Hydroxide for 24 Hours
Figure A19. Images of sessile drop on glass slides of crumb rubber modified with 5 wt% sodium
hydroxide for 24 hours. A total of 5 pictures were taken numbered from left to right and then
down to the next row.
Sessile Drop on Crumb Rubber Modified with KMnO4 and NaHSO3
Figure A20. Images of sessile drop on glass slides of crumb rubber modified with potassium
permanganate and sodium bisulfite. A total of 2 pictures were taken numbered from left to right.
Sessile Drop on Unmodified Rubber Sheet
Figure A21. Images of sessile drop on an unmodified rubber sheet. A total of 2 pictures were
taken numbered from left to right.
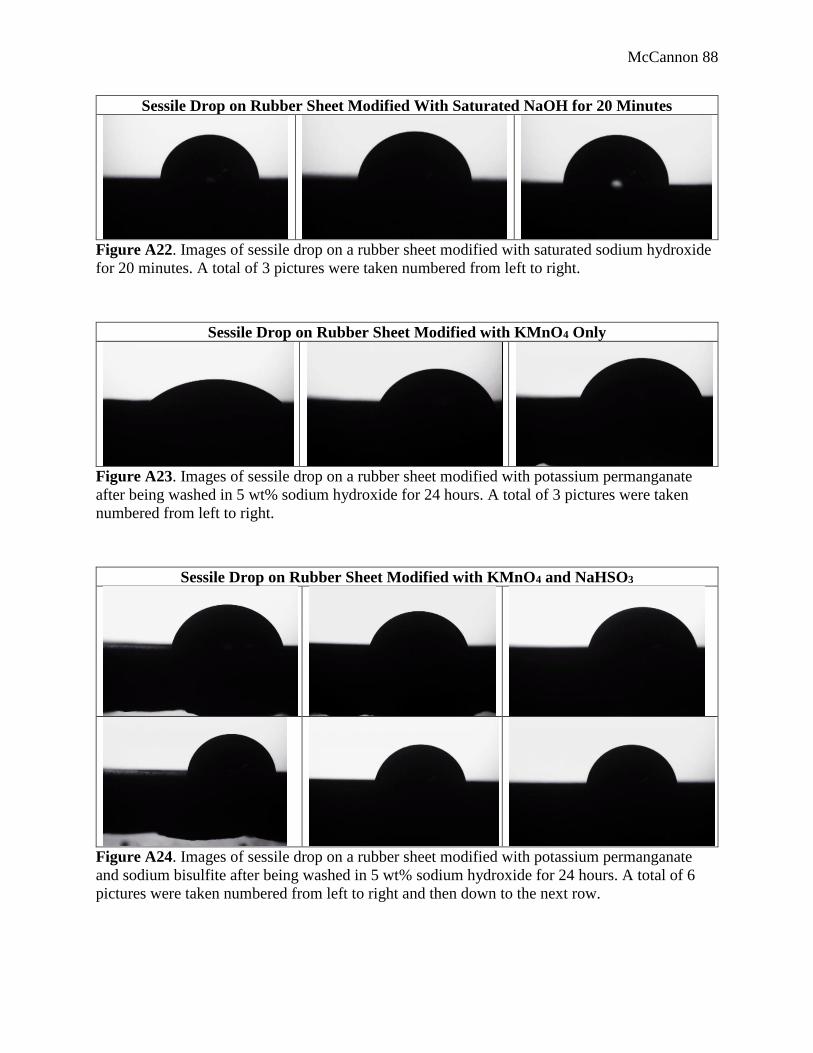
McCannon 88
Sessile Drop on Rubber Sheet Modified With Saturated NaOH for 20 Minutes
Figure A22. Images of sessile drop on a rubber sheet modified with saturated sodium hydroxide
for 20 minutes. A total of 3 pictures were taken numbered from left to right.
Sessile Drop on Rubber Sheet Modified with KMnO4 Only
Figure A23. Images of sessile drop on a rubber sheet modified with potassium permanganate
after being washed in 5 wt% sodium hydroxide for 24 hours. A total of 3 pictures were taken
numbered from left to right.
Sessile Drop on Rubber Sheet Modified with KMnO4 and NaHSO3
Figure A24. Images of sessile drop on a rubber sheet modified with potassium permanganate
and sodium bisulfite after being washed in 5 wt% sodium hydroxide for 24 hours. A total of 6
pictures were taken numbered from left to right and then down to the next row.
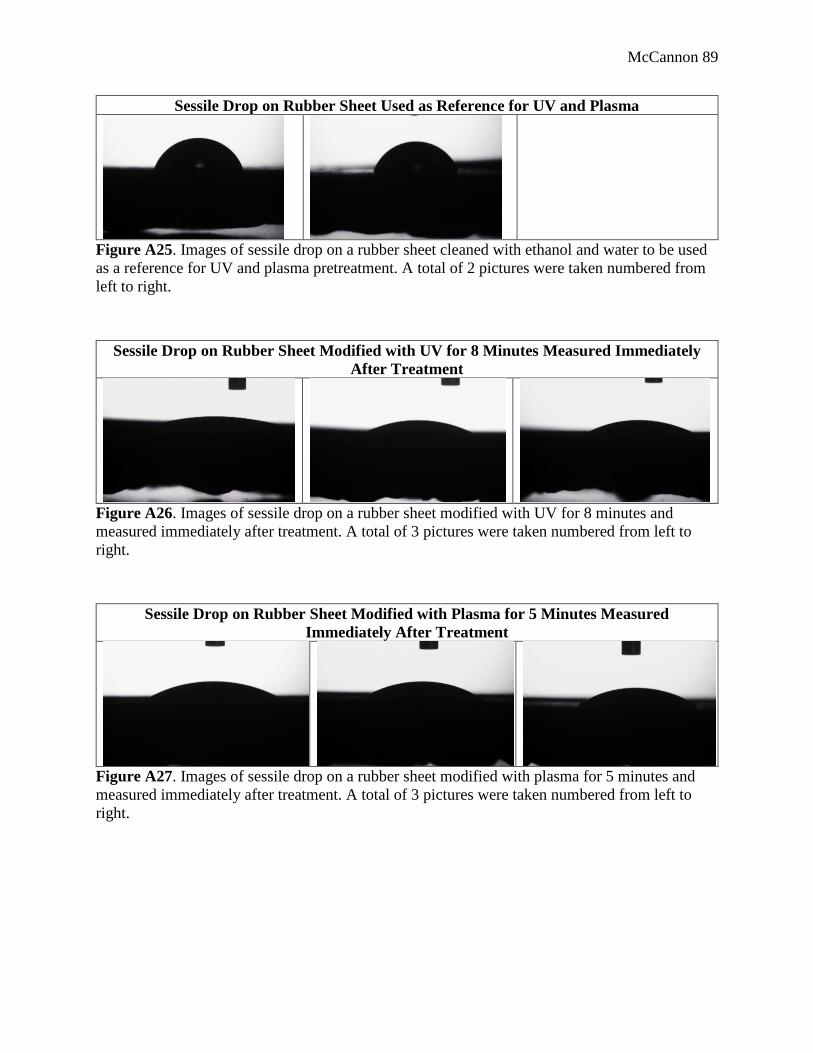
McCannon 89
Sessile Drop on Rubber Sheet Used as Reference for UV and Plasma
Figure A25. Images of sessile drop on a rubber sheet cleaned with ethanol and water to be used
as a reference for UV and plasma pretreatment. A total of 2 pictures were taken numbered from
left to right.
Sessile Drop on Rubber Sheet Modified with UV for 8 Minutes Measured Immediately
After Treatment
Figure A26. Images of sessile drop on a rubber sheet modified with UV for 8 minutes and
measured immediately after treatment. A total of 3 pictures were taken numbered from left to
right.
Sessile Drop on Rubber Sheet Modified with Plasma for 5 Minutes Measured
Immediately After Treatment
Figure A27. Images of sessile drop on a rubber sheet modified with plasma for 5 minutes and
measured immediately after treatment. A total of 3 pictures were taken numbered from left to
right.
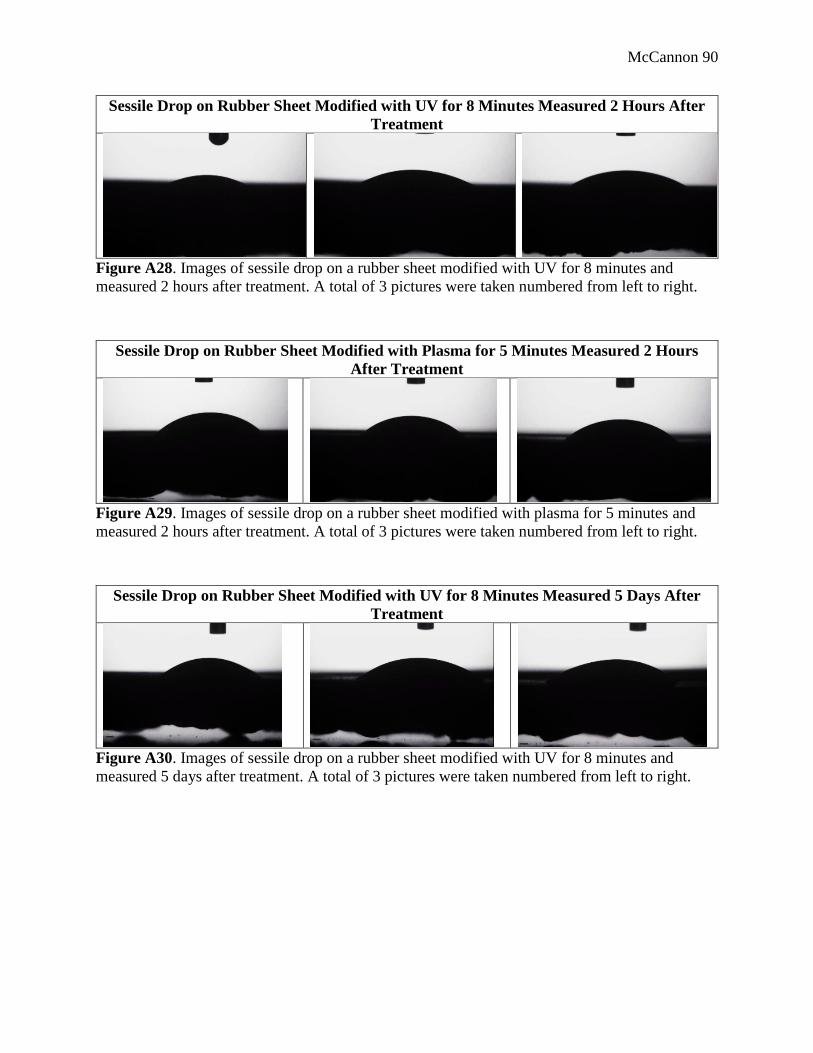
McCannon 90
Sessile Drop on Rubber Sheet Modified with UV for 8 Minutes Measured 2 Hours After
Treatment
Figure A28. Images of sessile drop on a rubber sheet modified with UV for 8 minutes and
measured 2 hours after treatment. A total of 3 pictures were taken numbered from left to right.
Sessile Drop on Rubber Sheet Modified with Plasma for 5 Minutes Measured 2 Hours
After Treatment
Figure A29. Images of sessile drop on a rubber sheet modified with plasma for 5 minutes and
measured 2 hours after treatment. A total of 3 pictures were taken numbered from left to right.
Sessile Drop on Rubber Sheet Modified with UV for 8 Minutes Measured 5 Days After
Treatment
Figure A30. Images of sessile drop on a rubber sheet modified with UV for 8 minutes and
measured 5 days after treatment. A total of 3 pictures were taken numbered from left to right.
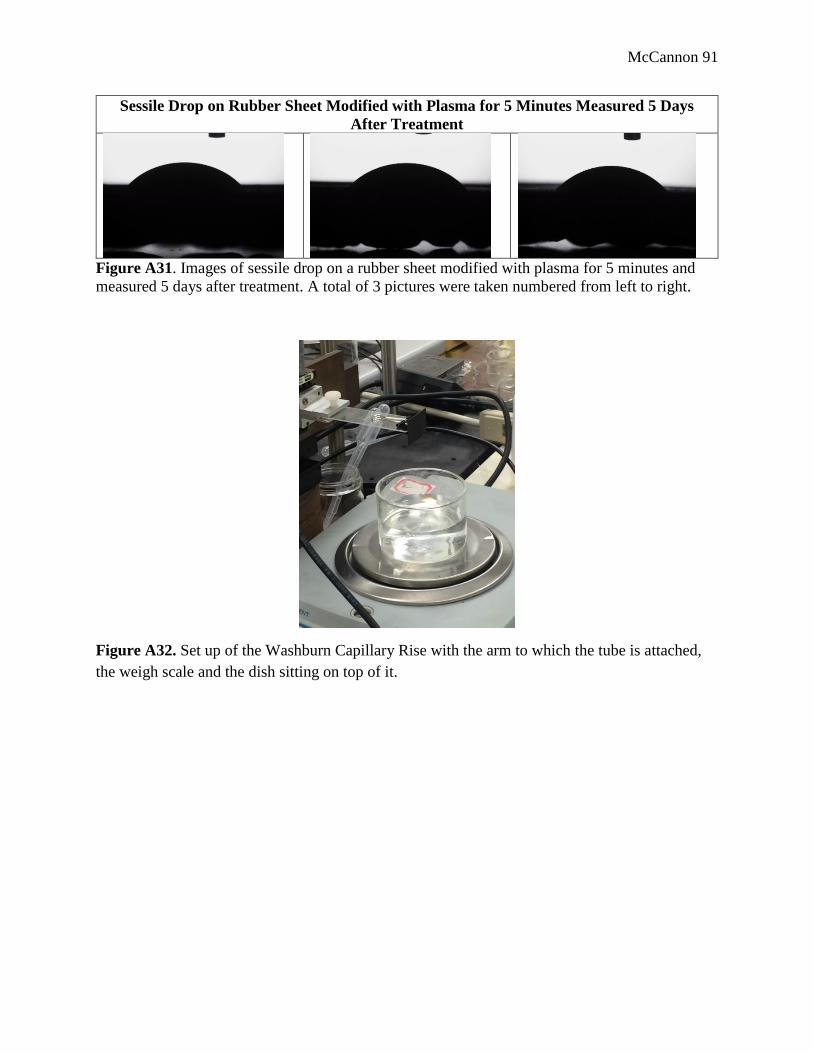
McCannon 91
Sessile Drop on Rubber Sheet Modified with Plasma for 5 Minutes Measured 5 Days
After Treatment
Figure A31. Images of sessile drop on a rubber sheet modified with plasma for 5 minutes and
measured 5 days after treatment. A total of 3 pictures were taken numbered from left to right.
Figure A32. Set up of the Washburn Capillary Rise with the arm to which the tube is attached,
the weigh scale and the dish sitting on top of it.
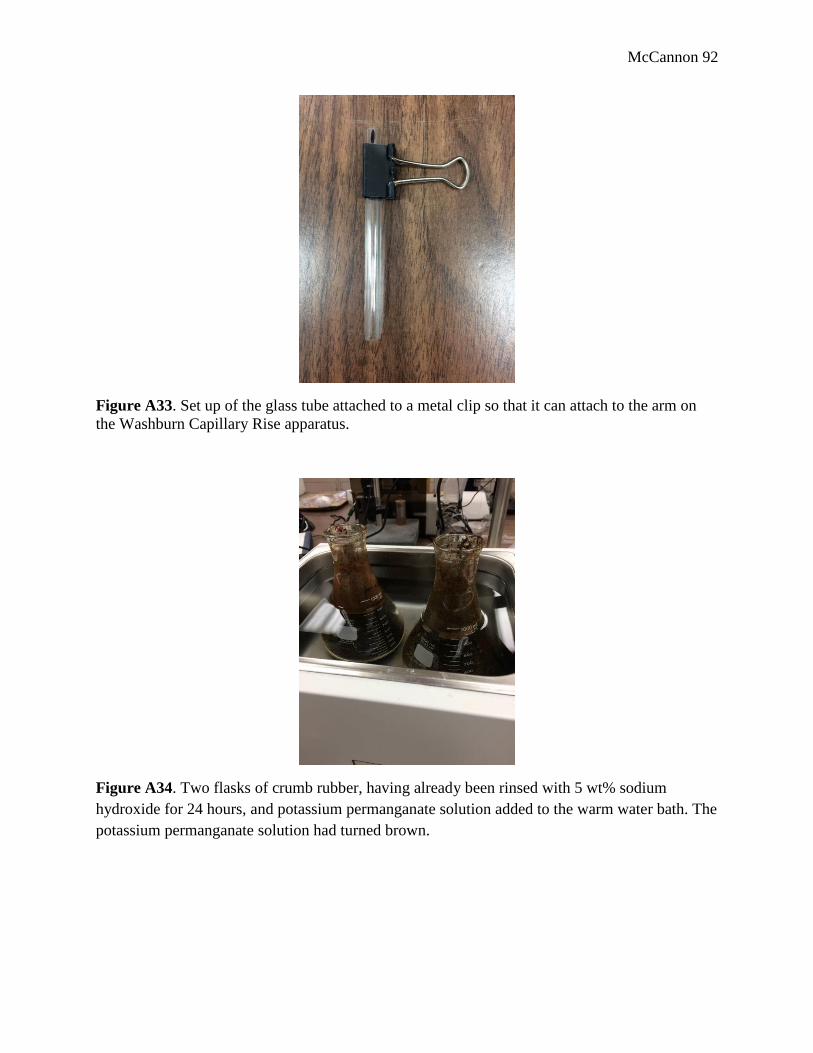
McCannon 92
Figure A33. Set up of the glass tube attached to a metal clip so that it can attach to the arm on
the Washburn Capillary Rise apparatus.
Figure A34. Two flasks of crumb rubber, having already been rinsed with 5 wt% sodium
hydroxide for 24 hours, and potassium permanganate solution added to the warm water bath. The
potassium permanganate solution had turned brown.
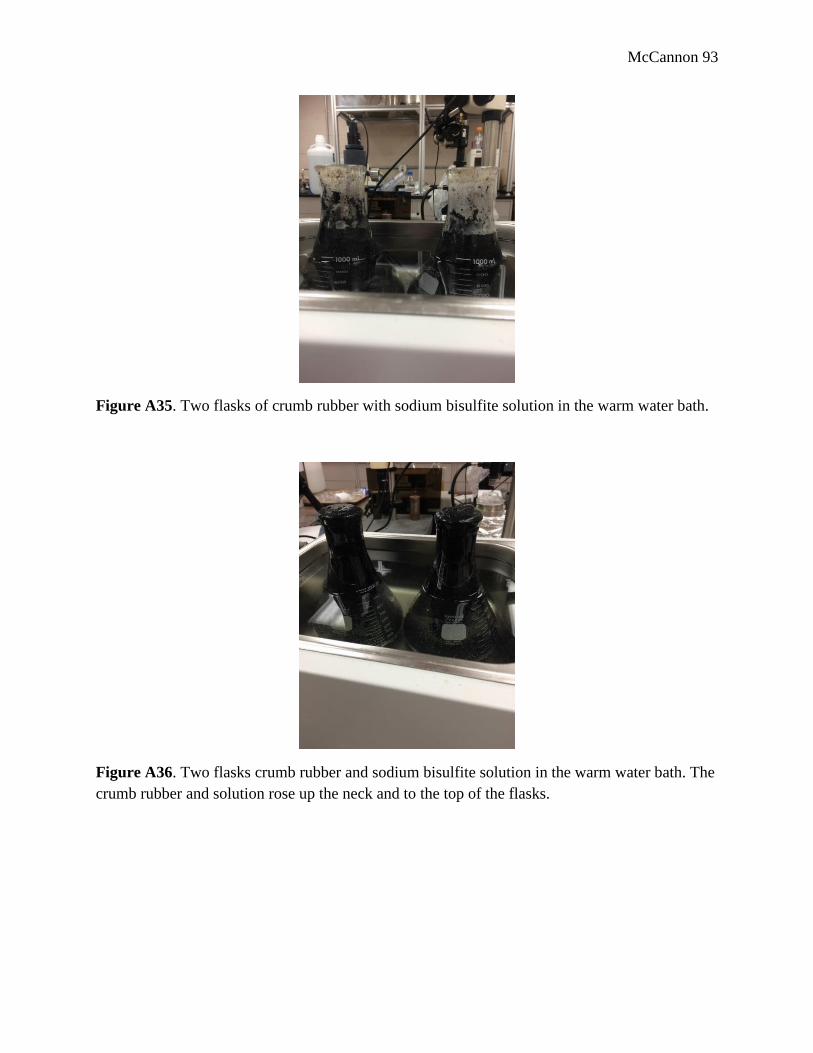
McCannon 93
Figure A35. Two flasks of crumb rubber with sodium bisulfite solution in the warm water bath.
Figure A36. Two flasks crumb rubber and sodium bisulfite solution in the warm water bath. The
crumb rubber and solution rose up the neck and to the top of the flasks.
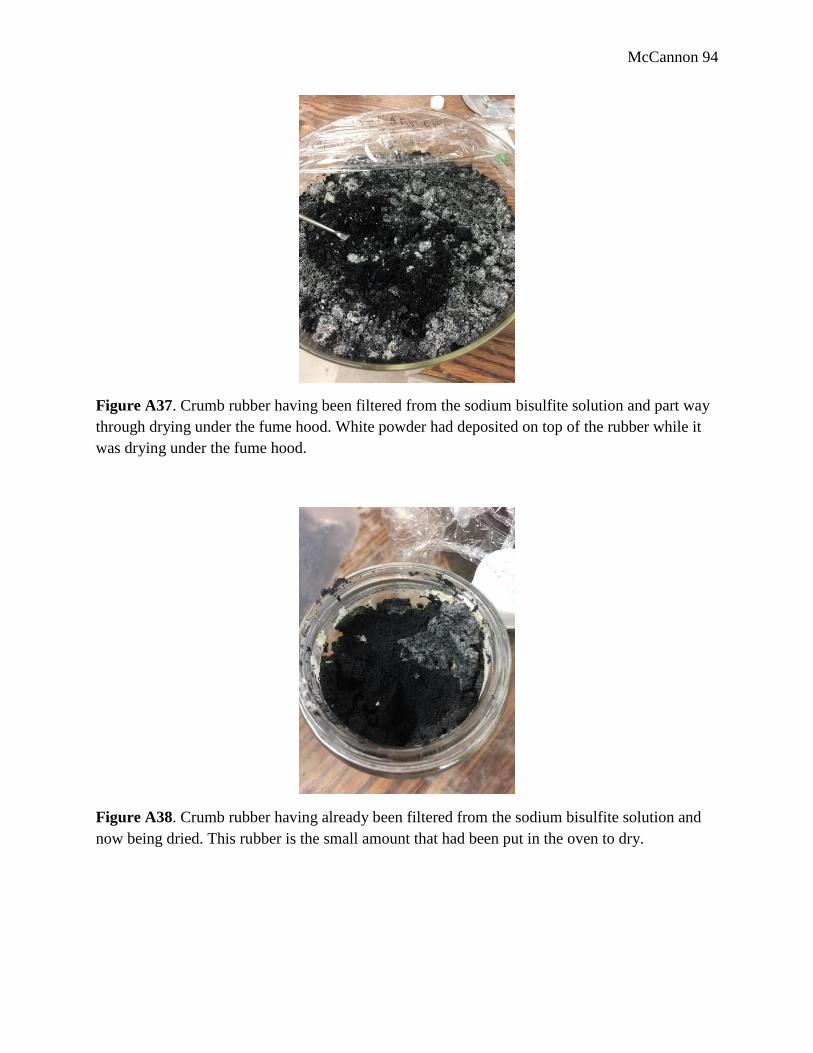
McCannon 94
Figure A37. Crumb rubber having been filtered from the sodium bisulfite solution and part way
through drying under the fume hood. White powder had deposited on top of the rubber while it
was drying under the fume hood.
Figure A38. Crumb rubber having already been filtered from the sodium bisulfite solution and
now being dried. This rubber is the small amount that had been put in the oven to dry.
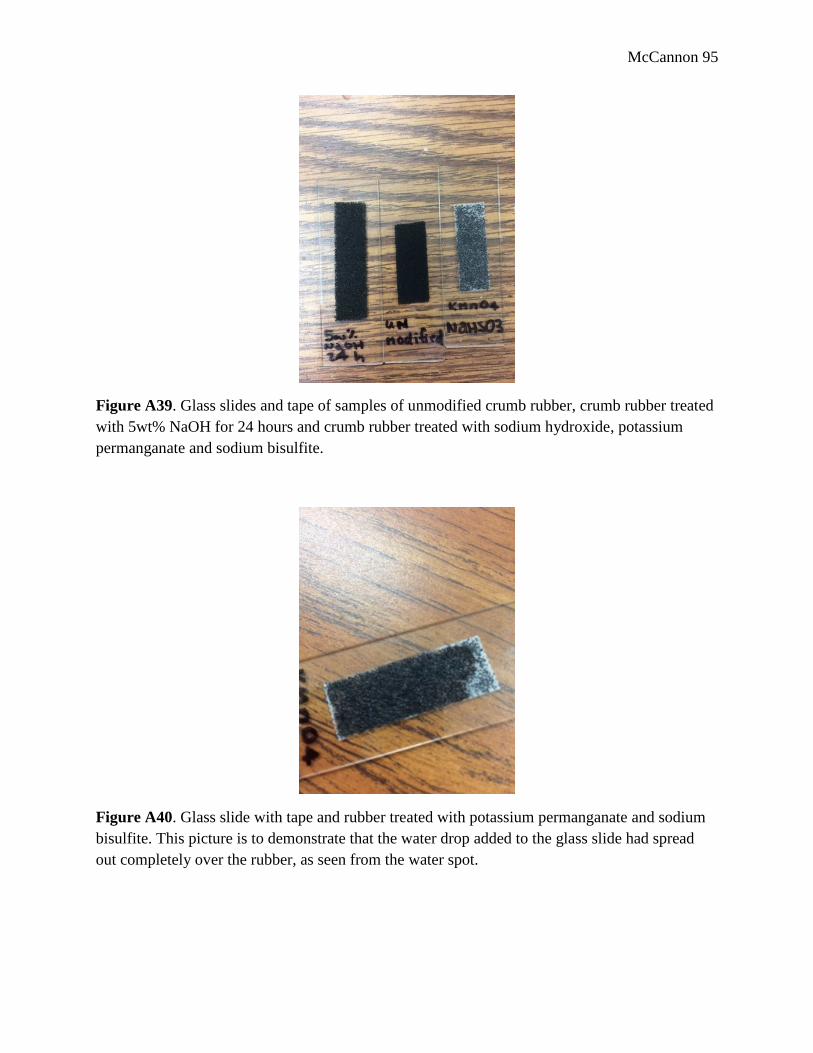
McCannon 95
Figure A39. Glass slides and tape of samples of unmodified crumb rubber, crumb rubber treated
with 5wt% NaOH for 24 hours and crumb rubber treated with sodium hydroxide, potassium
permanganate and sodium bisulfite.
Figure A40. Glass slide with tape and rubber treated with potassium permanganate and sodium
bisulfite. This picture is to demonstrate that the water drop added to the glass slide had spread
out completely over the rubber, as seen from the water spot.
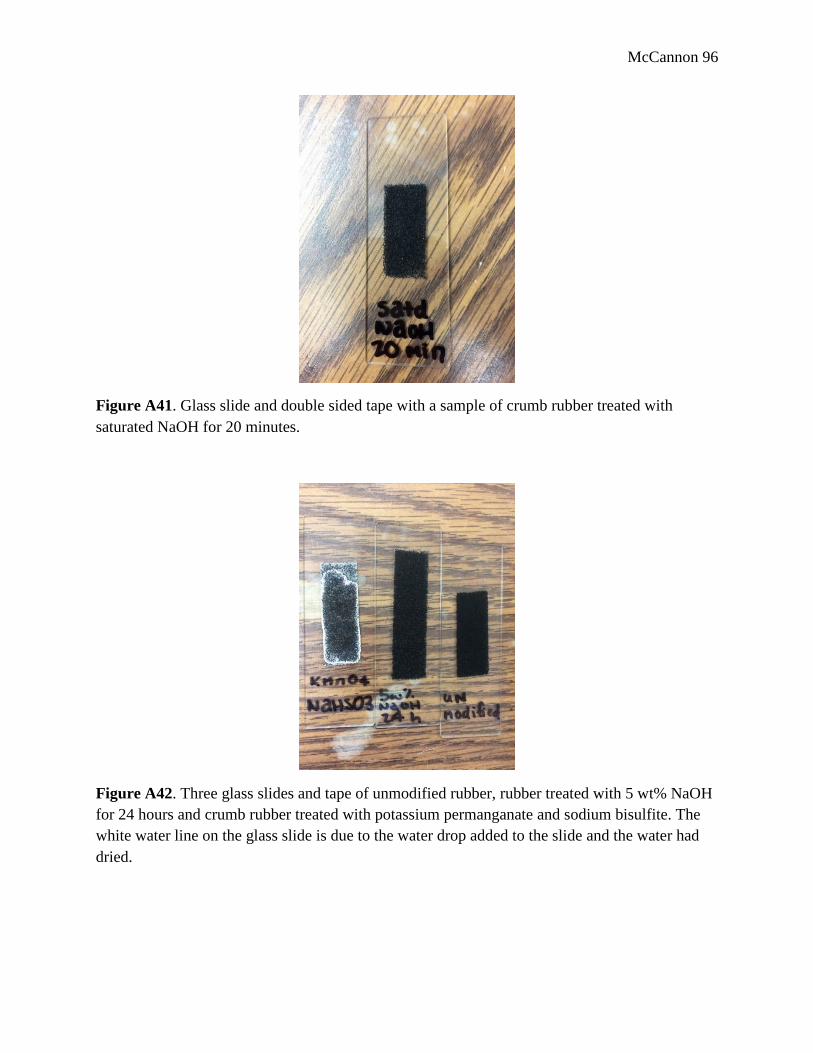
McCannon 96
Figure A41. Glass slide and double sided tape with a sample of crumb rubber treated with
saturated NaOH for 20 minutes.
Figure A42. Three glass slides and tape of unmodified rubber, rubber treated with 5 wt% NaOH
for 24 hours and crumb rubber treated with potassium permanganate and sodium bisulfite. The
white water line on the glass slide is due to the water drop added to the slide and the water had
dried.
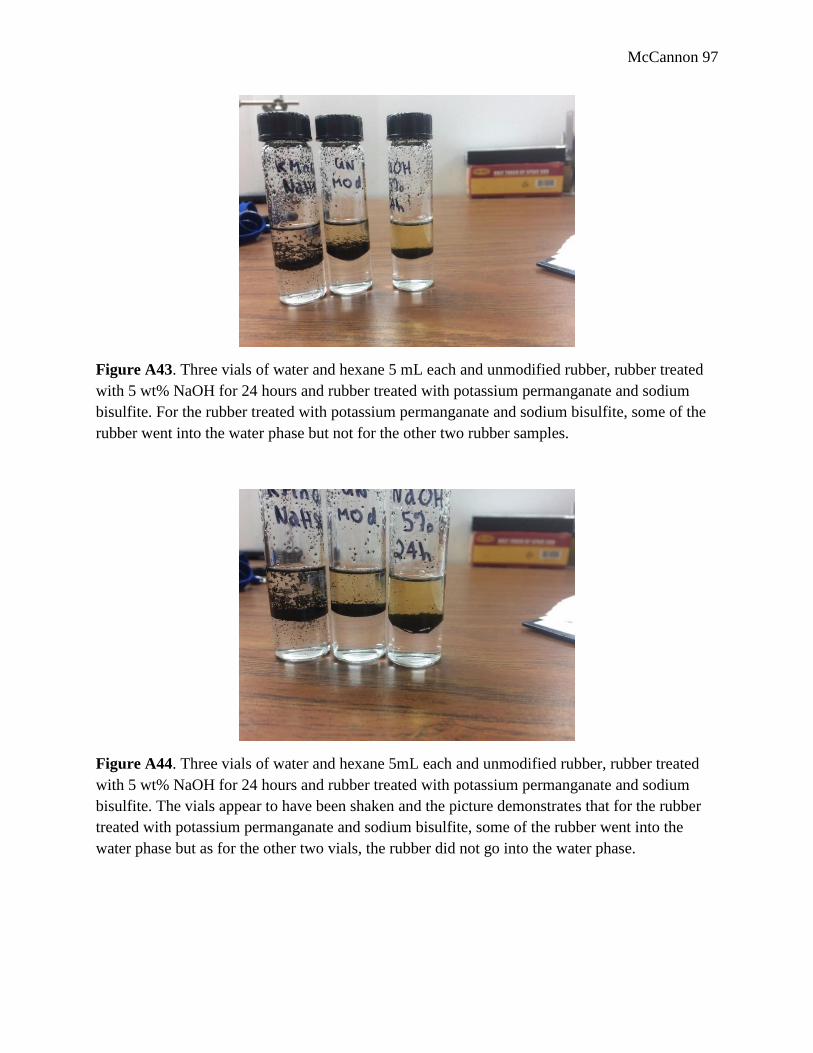
McCannon 97
Figure A43. Three vials of water and hexane 5 mL each and unmodified rubber, rubber treated
with 5 wt% NaOH for 24 hours and rubber treated with potassium permanganate and sodium
bisulfite. For the rubber treated with potassium permanganate and sodium bisulfite, some of the
rubber went into the water phase but not for the other two rubber samples.
Figure A44. Three vials of water and hexane 5mL each and unmodified rubber, rubber treated
with 5 wt% NaOH for 24 hours and rubber treated with potassium permanganate and sodium
bisulfite. The vials appear to have been shaken and the picture demonstrates that for the rubber
treated with potassium permanganate and sodium bisulfite, some of the rubber went into the
water phase but as for the other two vials, the rubber did not go into the water phase.
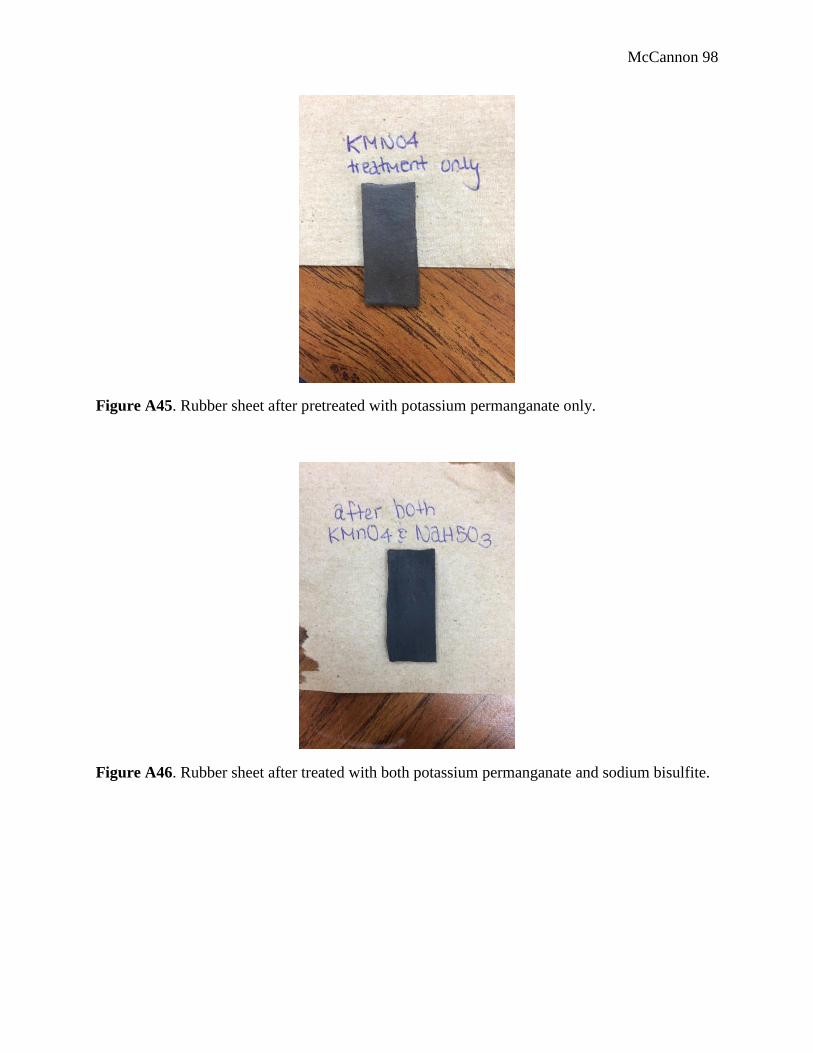
McCannon 98
Figure A45. Rubber sheet after pretreated with potassium permanganate only.
Figure A46. Rubber sheet after treated with both potassium permanganate and sodium bisulfite.
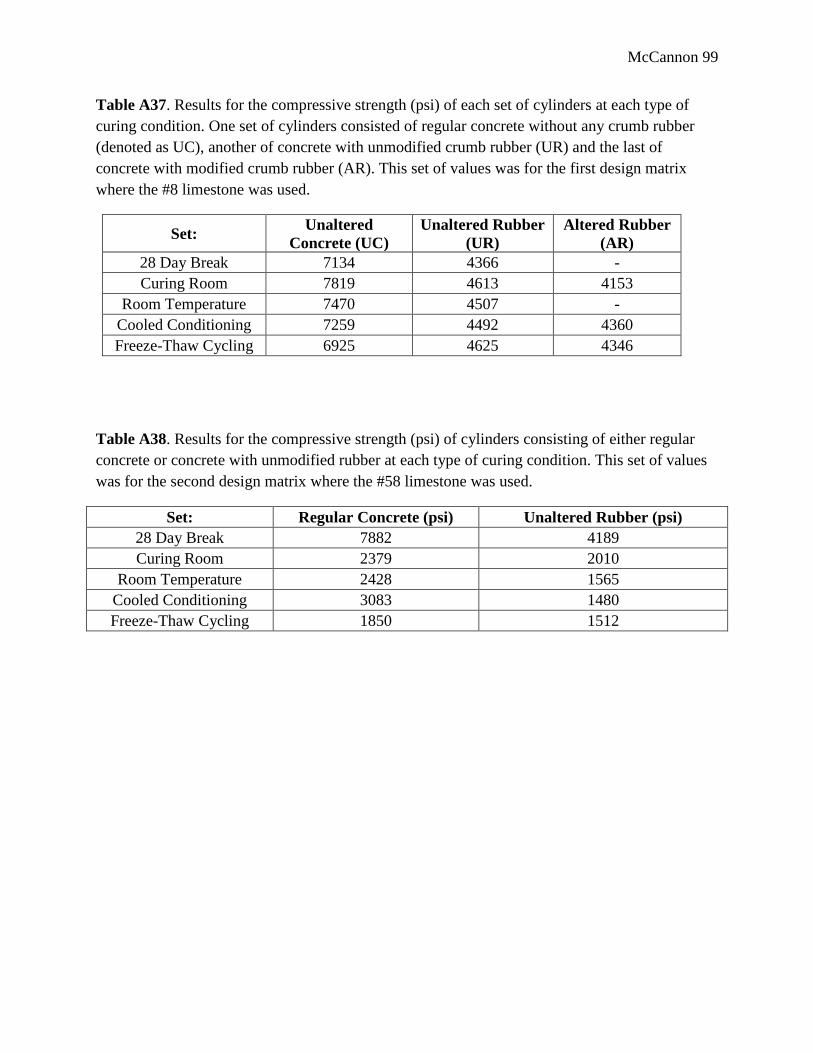
McCannon 99
Table A37. Results for the compressive strength (psi) of each set of cylinders at each type of
curing condition. One set of cylinders consisted of regular concrete without any crumb rubber
(denoted as UC), another of concrete with unmodified crumb rubber (UR) and the last of
concrete with modified crumb rubber (AR). This set of values was for the first design matrix
where the #8 limestone was used.
Set: Unaltered
Concrete (UC)
Unaltered Rubber
(UR)
Altered Rubber
(AR)
28 Day Break 7134 4366 -
Curing Room 7819 4613 4153
Room Temperature 7470 4507 -
Cooled Conditioning 7259 4492 4360
Freeze-Thaw Cycling 6925 4625 4346
Table A38. Results for the compressive strength (psi) of cylinders consisting of either regular
concrete or concrete with unmodified rubber at each type of curing condition. This set of values
was for the second design matrix where the #58 limestone was used.
Set: Regular Concrete (psi) Unaltered Rubber (psi)
28 Day Break 7882 4189
Curing Room 2379 2010
Room Temperature 2428 1565
Cooled Conditioning 3083 1480
Freeze-Thaw Cycling 1850 1512