Embed Size (px)
Citation preview
HAL Id: hal-00303108https://hal.archives-ouvertes.fr/hal-00303108
Submitted on 25 Sep 2007
HAL is a multi-disciplinary open accessarchive for the deposit and dissemination of sci-entific research documents, whether they are pub-lished or not. The documents may come fromteaching and research institutions in France orabroad, or from public or private research centers.
L’archive ouverte pluridisciplinaire HAL, estdestinée au dépôt et à la diffusion de documentsscientifiques de niveau recherche, publiés ou non,émanant des établissements d’enseignement et derecherche français ou étrangers, des laboratoirespublics ou privés.
Chemical Isolation in the Asian monsoon anticycloneobserved in Atmospheric Chemistry Experiment
(ACE-FTS) dataM. Park, W. J. Randel, L. K. Emmons, P. F. Bernath, K. A. Walker, C. D.
Boone
To cite this version:M. Park, W. J. Randel, L. K. Emmons, P. F. Bernath, K. A. Walker, et al.. Chemical Isolation inthe Asian monsoon anticyclone observed in Atmospheric Chemistry Experiment (ACE-FTS) data.Atmospheric Chemistry and Physics Discussions, European Geosciences Union, 2007, 7 (5), pp.13839-13860. �hal-00303108�
ACPD
7, 13839–13860, 2007
Chemical isolation in
the Asian monsoon
anticyclone
M. Park et al.
Title Page
Abstract Introduction
Conclusions References
Tables Figures
◭ ◮
◭ ◮
Back Close
Full Screen / Esc
Printer-friendly Version
Interactive Discussion
EGU
Atmos. Chem. Phys. Discuss., 7, 13839–13860, 2007
www.atmos-chem-phys-discuss.net/7/13839/2007/
© Author(s) 2007. This work is licensed
under a Creative Commons License.
AtmosphericChemistry
and PhysicsDiscussions
Chemical isolation in the Asian monsoon
anticyclone observed in Atmospheric
Chemistry Experiment (ACE-FTS) data
M. Park1, W. J. Randel
1, L. K. Emmons
1, P. F. Bernath
2,3, K. A. Walker
2,*, and
C. D. Boone2
1National Center for Atmospheric Research, Boulder, Colorado, USA
2Department of Chemistry, University of Waterloo, Waterloo, Ontario, Canada
3Department of Chemistry, University of York, Heslington, York, UK
*now at: Department of Physics, University of Toronto, Toronto, Ontario, Canada
Received: 2 August 2007 – Accepted: 13 September 2007 – Published: 25 September 2007
Correspondence to: M. Park ([email protected])
13839
ACPD
7, 13839–13860, 2007
Chemical isolation in
the Asian monsoon
anticyclone
M. Park et al.
Title Page
Abstract Introduction
Conclusions References
Tables Figures
◭ ◮
◭ ◮
Back Close
Full Screen / Esc
Printer-friendly Version
Interactive Discussion
EGU
Abstract
Evidence of chemical isolation in the Asian monsoon anticyclone is presented using
chemical constituents obtained from the Atmospheric Chemistry Experiment Fourier
Transform Spectrometer instrument during summer (June–August) of 2004–2006. Car-
bon monoxide (CO) shows a broad maximum over the monsoon anticyclone region in5
the upper troposphere and lower stratosphere (UTLS); these enhanced CO values are
associated with air pollution transported upward by convection, and confined by the
strong anticyclonic circulation. Profiles inside the anticyclone show enhancement of
tropospheric tracers CO, HCN, C2H6, and C2H2 between ∼12 to 20 km, with maxima
near 13–15 km. Strong correlations are observed among constituents, consistent with10
sources from near-surface pollution and biomass burning. Stratospheric tracers (O3,
HNO3 and HCl) exhibit decreased values inside the anticyclone between ∼12–20 km.
These observations are further evidence of transport of lower tropospheric air into the
UTLS region, and isolation of air within the anticyclone. The relative enhancements
of tropospheric species inside the anticyclone are closely related to the photochemical15
lifetime of the species, with strongest enhancement for shorter lived species. Vertical
profiles of the ratio of C2H2/CO (used to measure the relative age of air) suggest rela-
tively rapid transport of fresh emissions up to tropopause level inside the anticyclone.
1 Introduction
The Asian summer monsoon is the dominant circulation feature spanning Southeast20
Asia to Afghanistan during Northern Hemisphere (NH) summer. The Asian monsoon
circulation is a thermally direct circulation dominated by a low-level thermal low and
an upper-level anticyclone (Krishnamurti and Bhalme, 1976). Flanked by the equato-
rial and subtropical jets, the anticyclone acts as strong transport barrier to chemical
constituents, such as water vapor (Dethof et al., 1999) and ozone (Randel and Park,25
2006), in the upper troposphere and lower stratosphere (UTLS). Carbon monoxide
13840
ACPD
7, 13839–13860, 2007
Chemical isolation in
the Asian monsoon
anticyclone
M. Park et al.
Title Page
Abstract Introduction
Conclusions References
Tables Figures
◭ ◮
◭ ◮
Back Close
Full Screen / Esc
Printer-friendly Version
Interactive Discussion
EGU
transported upwards by the monsoon convection is trapped within the monsoon anti-
cyclone in the upper troposphere (Li et al., 2005). Recent satellite observations have
highlighted the strong isolation of carbon monoxide within the monsoon anticyclone,
extending into the lower stratosphere (Fu et al., 2006; Park et al., 2007).
The Atmospheric Chemistry Experiment (ACE) is a Canadian-led satellite mission5
launched in 2003. The ACE Fourier Transform Spectrometer (ACE-FTS) instrument
provides vertical profiles of a few dozen chemical species covering the middle tropo-
sphere to thermosphere (∼10–100 km), with data available from the polar regions to the
tropics (Bernath et al., 2005). In this study we use ACE-FTS measurements to explore
the consequences of vertical transport within the Asian monsoon anticyclone. In par-10
ticular, we focus on the ACE-FTS measurements of carbon monoxide (CO), hydrogen
cyanide (HCN), ethane (C2H6) and acetylene (C2H2), which have common sources of
biomass burning (Andreae and Merlet, 2001) and major sinks of reaction with hydroxyl
radical (Logan et al., 1981). The photochemical lifetimes of these species span the
range of 0.5–5 months, which make them useful as tracers of transport in the tropo-15
sphere and lower stratosphere. We also include analyses of CH3Cl, which is produced
by biomass burning and has a lifetime of about a year (Blake et al., 1996; Yoshida et al.,
2004), and OCS, with sources of anthropogenic and oceanic emissions (Watts, 2000)
and a lifetime of several years (Chin and Davis, 1995; Blake et al., 2004).
Numerous observational studies of tropospheric pollutants have been made based20
on aircraft observations (e.g., Smyth et al., 1996; Blake et al., 1996; Talbot et al., 1999;
Singh et al., 2003; Russo et al., 2003). However, space-based observations are limited
and relatively new. Tropospheric CO has been obtained from several satellite instru-
ments, including Measurement of Air Pollution from Satellites (Connors et al., 1999),
Interferometric Monitor for Greenhouse gases (Clerbaux et al., 2003), Measurements25
Of Pollution In The Troposphere (Deeter et al., 2004; Edwards et al., 2006), Microwave
Limb Sounder (Waters et al., 2006), and Tropospheric Emission Spectrometer (Beer,
2006), and these data have been used for studies of tropospheric pollution and long-
range transport. However, ACE–FTS has the advantage of simultaneous retrieval of
13841
ACPD
7, 13839–13860, 2007
Chemical isolation in
the Asian monsoon
anticyclone
M. Park et al.
Title Page
Abstract Introduction
Conclusions References
Tables Figures
◭ ◮
◭ ◮
Back Close
Full Screen / Esc
Printer-friendly Version
Interactive Discussion
EGU
numerous species in addition to CO. A few previous studies have used ACE-FTS mea-
surements of CO, HCN, C2H6, C2H2 and methanol (CH3OH) to study the effect of
biomass burning emissions in the UTLS region (Rinsland et al., 2005; Dufour et al.,
2006; Coheur et al., 2007), and our work extends those analyses with focus on the
Asian monsoon region.5
2 Data description
The ACE mission was launched on 12 August 2003 into a high inclination (74◦) circular
orbit at 650 km altitude. The high resolution infrared ACE-FTS measures solar absorp-
tion spectra from 750 to 4400 cm−1
using the solar occultation technique. The primary
goal of the ACE mission is focused on polar ozone chemistry and dynamics, and the10
majority of measurements are obtained over high latitudes (Bernath et al., 2005). The
vertical field of view of the instrument is 3 km, and measurements during each occul-
tation are obtained with a vertical sampling of 2–6 km (depending on the angle of the
sun with respect to the spacecraft velocity vector); the constituent profile retrievals are
available on an (oversampled) 1 km vertical grid (Boone et al., 2005). The data here15
are based on version 2.2 retrievals (including the ozone update). The C2H6 and C2H2
data are research products retrieved to higher altitudes for this study, and we focus
on observations during NH summer (June–August) of 2004–2006. Due to the orbit
geometry, most of the low latitude observations occur in August during this period.
The chemical species analyzed here include tropospheric constituents CO, HCN,20
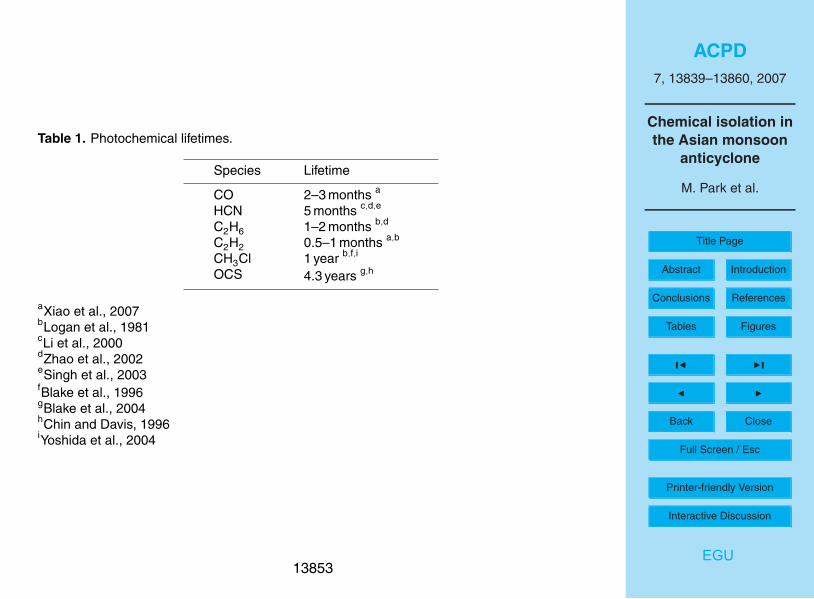
C2H6, C2H2, OCS, and CH3Cl, and stratospheric species O3, HNO3, and HCl. The
photochemical lifetimes of these constituents, which span the range from ∼1 month to
longer than 1 year, are provided in Table 1. These numbers are estimated in the tropo-
sphere but are almost constant up to the UTLS region. For data screening purposes,
we exclude profiles with values outside of three-sigma variance between 60◦S and25
60◦N. This method typically excludes less than 1% of profiles depends on the species.
The initial comparisons of version 1.0 ACE-FTS retrievals show fairly good agreement
13842
ACPD
7, 13839–13860, 2007
Chemical isolation in
the Asian monsoon
anticyclone
M. Park et al.
Title Page
Abstract Introduction
Conclusions References
Tables Figures
◭ ◮
◭ ◮
Back Close
Full Screen / Esc
Printer-friendly Version
Interactive Discussion
EGU
between 15 and 40 km for ozone (Walker et al., 2005) and 20–100 km for CO (Jin et
al. 2005). Papers detailing the validation studies for version 2.2 products (including the
ozone “update”) are in preparation (for ozone: Dupuy et al., 20071; for CO: Clerbaux et
al., 20072). The estimated fitting error of version 2.2 CO and version 2.2 ozone update
are 2–6% and 2–7% in the UTLS region, respectively.5
3 Chemical isolation in the anticyclone
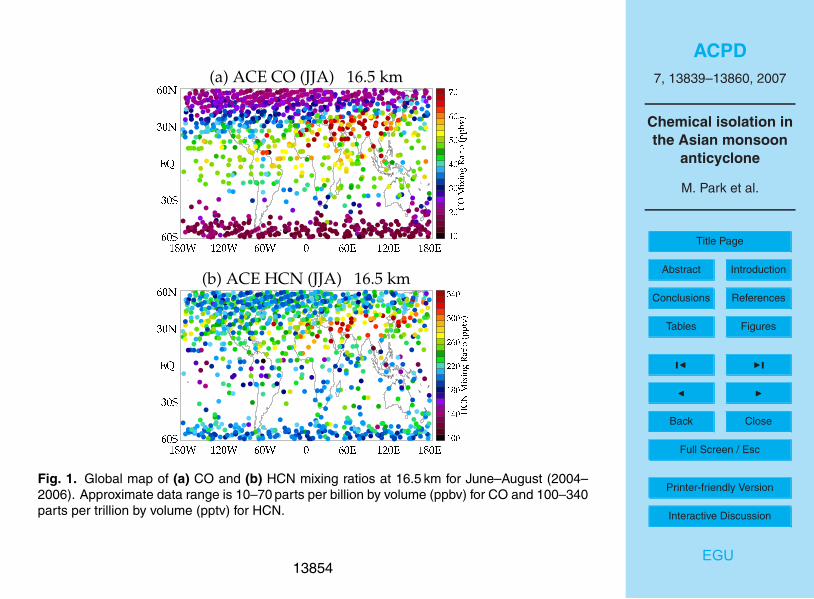
Figure 1a shows CO mixing ratio amounts at 16.5 km for all of the ACE-FTS observa-
tions during June–August 2004–2006. The majority of points at mid to high latitudes
lie in the stratosphere (where CO≤20 parts per billion by volume, ppbv) and in the up-
per troposphere (where CO ranges 40–50 ppbv, see Clerbaux et al., 2005). There is10
a broad maximum in CO over the Asian monsoon region (0◦–120
◦E and 10
◦–40
◦N),
and a similar maximum is evident for altitudes ∼12–20 km (not shown). HCN mix-
ing ratios (Fig. 1b) also exhibit a maximum in this region, roughly coincident with the
CO maximum. Daily observations of CO from MLS data have demonstrated that CO
maxima at 100 hPa (∼16 km) occur within the Asian monsoon anticyclone throughout15
summer (Park et al., 2007), and the highest CO values seen in Fig. 1a likely represent
individual ACE-FTS measurements within the anticyclone. To examine the behavior of
other atmospheric constituents in the monsoon anticyclone, we use the CO values to
identify profiles within the boundary of the anticyclone (i.e., the high values in Fig. 1a).
Profiles ‘inside’ are defined where CO is higher than 60 ppbv at 16.5 km (see Fig. 1a)20
and the rest of the profiles between 10◦–40
◦N are regarded as “outside” the anticy-
clone (representing background conditions). Based on this definition, there are ∼40
1Dupuy, E., Walker, K. A., Kar, J., et al.: Validation of ozone measurements from the Atmo-
spheric Chemistry Experiment (ACE), to be submitted, Atmos. Chem. Phys., 2007.2Clerbaux, C., George, M., Walker, K. A., et al.: CO measurements from the ACE-FTS
satellite instrument: data analysis and validation using ground-based, airborne and spaceborne
observations, submitted, Atmos. Chem. Phys. Discuss., 2007.
13843
ACPD
7, 13839–13860, 2007
Chemical isolation in
the Asian monsoon
anticyclone
M. Park et al.
Title Page
Abstract Introduction
Conclusions References
Tables Figures
◭ ◮
◭ ◮
Back Close
Full Screen / Esc
Printer-friendly Version
Interactive Discussion
EGU
profiles inside and ∼240 profiles outside the anticyclone at 16.5 km for observations
over June–August 2004–2006.
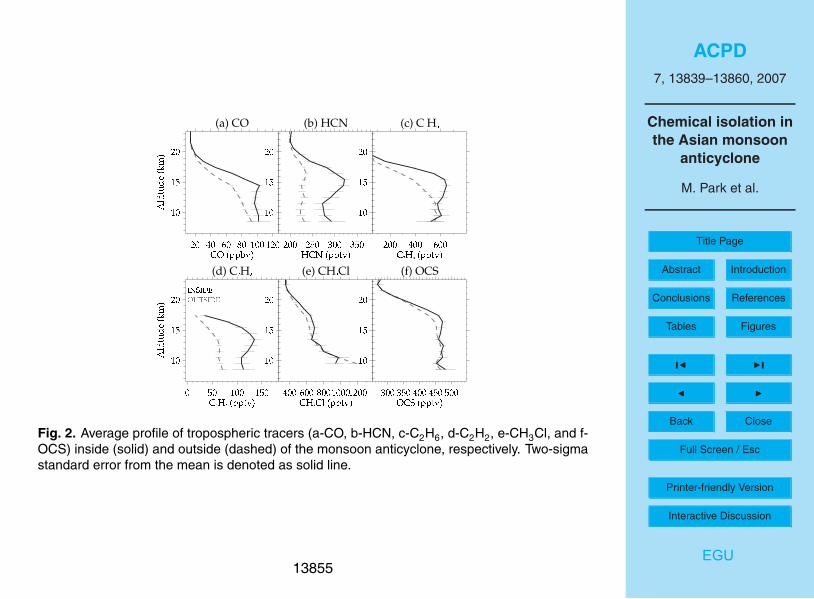
We compare in Fig. 2 the average vertical profiles of tropospheric constituents (CO,
HCN, C2H6, C2H2, CH3Cl and OCS) inside and outside of the anticyclone, respectively.
For each group of profiles we calculate the mean and the standard error of the mean5
(the sample standard deviation, divided by the square root of the number of observa-
tions, shown as error bars in Fig. 2). Substantial enhancements within the anticyclone
are observed for CO, HCN, C2H6, and C2H2 in Fig. 2, with significant differences up
to ∼20 km. While the outside or background profiles exhibit monotonic decreases with
altitude, profiles inside the anticyclone show significant maxima near 15 km for CO,10
HCN and C2H6, and near 13 km for C2H2 (which has a significantly shorter lifetime,
Table 1). The long-lived tracers (CH3Cl and OCS) show slight enhancements within
the anticyclone over ∼14–18 km (Figs. 2e and f). The higher mixing ratios within the
anticyclone probably result from a combination of rapid vertical transport and hori-
zontal confinement (Li et al., 2005; Randel and Park, 2006), and the elevated mixing15
ratios can be regarded as ‘fingerprints’ of the near-surface pollutant concentrations.
In contrast, the outside or background profiles represent photochemically aged air, so
that the inside-outside differences may be dependent on the lifetime of the individual
species (as explored below). We note that the average mixing ratios shown in Fig. 2
are within the range of those obtained in aircraft field measurements in the lower and20
middle troposphere (Smyth et al., 1999; Blake et al., 1999; Singh et al., 2003; Xiao et
al., 2007).
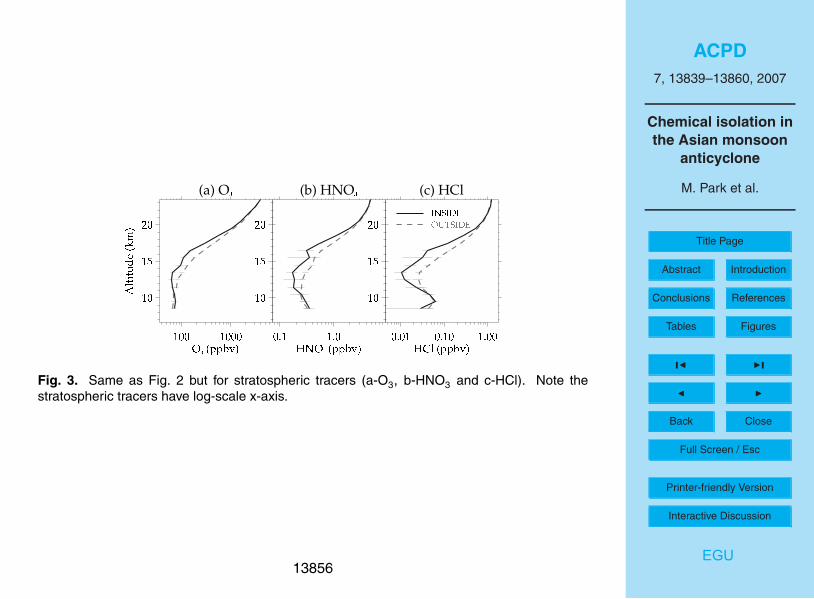
Figure 3 compares inside versus outside profiles for the stratospheric tracers - O3,
HNO3 and HCl. Each of these tracers shows reduced mixing ratios inside the anti-
cyclone over ∼12–20 km compared to outside profiles, and this behavior is consistent25
with enhanced transport of tropospheric air into the anticyclone. These observations
are consistent with the relative minimum in ozone within the anticyclone shown in Ran-
del and Park (2006) and Park et al. (2007).
Tracer-tracer correlations are useful to diagnose air mass characteristics and rela-
13844
ACPD
7, 13839–13860, 2007
Chemical isolation in
the Asian monsoon
anticyclone
M. Park et al.
Title Page
Abstract Introduction
Conclusions References
Tables Figures
◭ ◮
◭ ◮
Back Close
Full Screen / Esc
Printer-friendly Version
Interactive Discussion
EGU
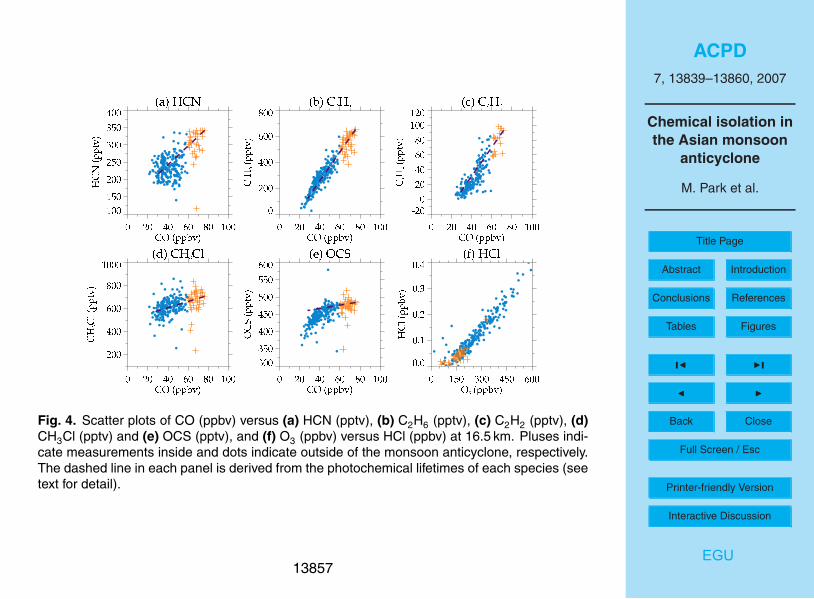
tionships among different species. Figure 4 shows scatter plots of tropospheric tracers
versus CO, for HCN, C2H6, C2H2, OCS and CH3Cl (for data at 16.5 km). Overall,
each of the tropospheric tracers show strong correlations with CO, with high CO val-
ues inside the anticyclone (orange plus signs) associated with high values of other
species. C2H6 and C2H2 exhibit relatively compact correlations with CO, suggesting5
similar sources for these species (Blake et al., 2003). There is significantly more scat-
ter in the HCN versus CO diagram than other species (Fig. 4a), which is similar to
results from the TRACE-P aircraft observations (figures are not shown, for details of
the TRACE-P mission, see Jacob et al., 2003), and this may be a signature of different
sources and sinks for HCN and CO (Singh et al., 2003). CH3Cl and OCS also exhibit10
some correlation with CO, but relatively smaller differences between inside and outside
profiles. Figure 4f shows a scatter plot for two stratospheric tracers (HCl vs. O3), show-
ing a highly compact relationship. Low ozone inside the anticyclone is also correlated
with high CO. The compact relationships between ozone and the other stratospheric
tracers (e.g., HF and HNO3) are consistently found between 15 and 18 km.15
If photochemical loss is a primary destruction mechanism for the tropospheric trac-
ers, then the slope of the scatter plots in Fig. 4 should be related to the respective pho-
tochemical ages of the species. We test this in a simple way, by including a line in the
scatter plots associated with the respective e-folding time of the two species. For ex-
ample, the line in the C2H2 vs. CO diagram has a slope of (CO lifetime / C2H2lifetime),20
or (2 months/0.5 months). These slopes are included for each of the tropospheric trac-
ers in Fig. 4. Overall there is quite reasonable agreement with the observed distribu-
tions, which is also almost overlapped with the linear regression fit (not included). For
OCS, the correlations are offset toward higher concentration due to its long lifetime.
This quantitative agreement is consistent with the differences between air inside and25
outside the anticyclone being primarily a result of relatively young air inside versus
photochemically aged air outside. The agreement in slopes is also consistent with the
approximate lifetimes of the constituents as listed in Table 1.
In order to study the vertical profiles of tracers inside the anticyclone in more detail,
13845
ACPD
7, 13839–13860, 2007
Chemical isolation in
the Asian monsoon
anticyclone
M. Park et al.
Title Page
Abstract Introduction
Conclusions References
Tables Figures
◭ ◮
◭ ◮
Back Close
Full Screen / Esc
Printer-friendly Version
Interactive Discussion
EGU
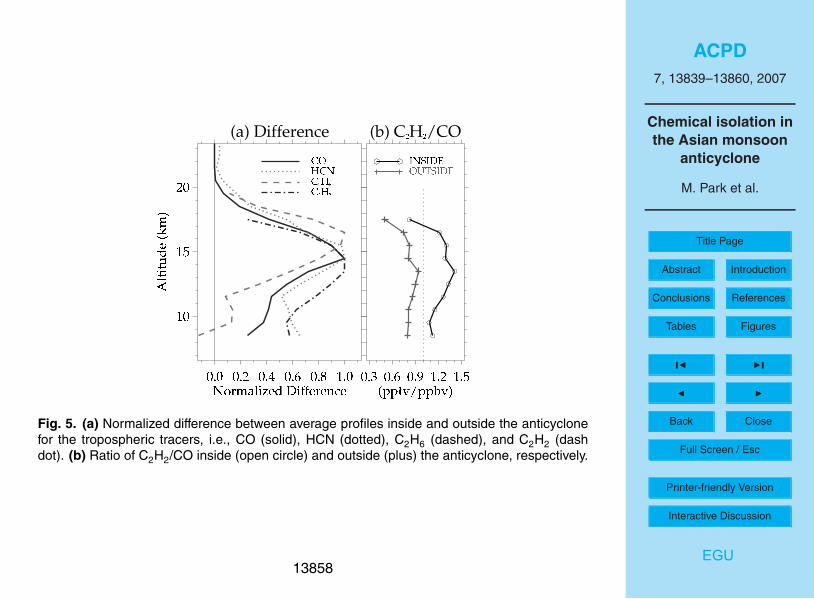
we calculate the difference between the mean profiles in Fig. 2, and then normalize the
differences for each tropospheric constituent to a maximum value of 1.0 (Fig. 5a). Here
we focus on the species CO, HCN, C2H6 and C2H2, which show the largest enhance-
ments in Fig. 2. The tracer differences in Fig. 5a have maxima near 15 km, where
the monsoon anticyclonic circulation is strong (Randel and Park, 2006). The exact5
altitudes of maximum values differ somewhat among the tracers (∼15 km for CO and
HCN, ∼17 for C2H6 and ∼13 km for C2H2), but these differences are not emphasized
given the 3 km field of view of the ACE-FTS observations. We also include in Fig. 5b
the ratio of C2H2/CO for the inside and outside profiles, as an indicator of the relative
age of an air mass (Smyth et al., 1999; Xiao et al., 2007). The typical range of the ratio10
is 0.2–2.2 (pptv/ppbv), consistent with the data in Fig. 5b, and a ratio less than one
indicates photochemically aged and well-mixed air (Talbot et al., 1999). The C2H2/CO
ratio inside the anticyclone in Fig. 5b is larger than one, indicating relatively young air
transported up to ∼16 km. The ratio is less than one outside the anticyclone, signifying
photochemically aged and well-mixed air mass as the background.15
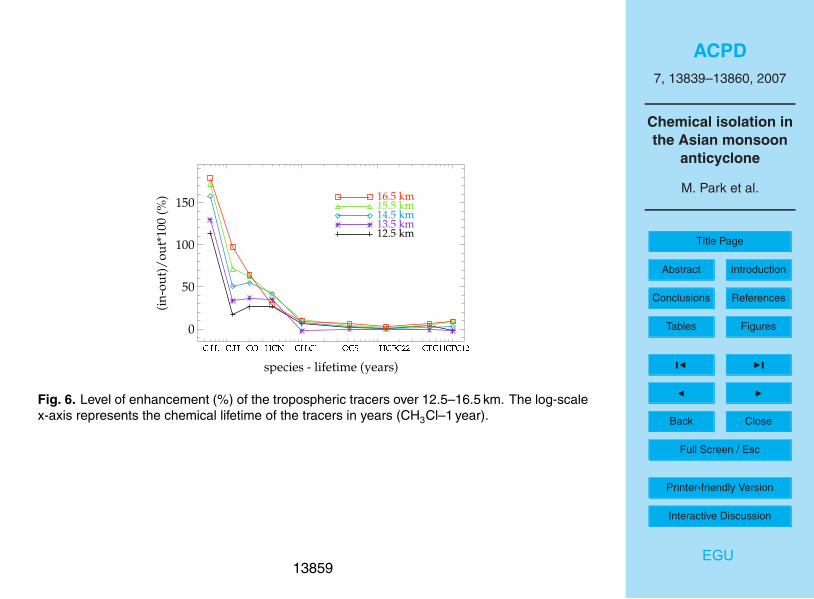
The level of enhancement inside the anticyclone with respect to the background can
be defined as ∆ [X]/[X]outside*100, where [X] represent the constituent mixing ratio and
∆ [X] is [X]inside-[X]outside (see Coheur et al., 2007). The enhancement of tropospheric
tracers inside the anticyclone is compared in Fig. 6 for different altitudes, plotted as a
function of lifetime of the respective species. The enhancement is larger for the shorter-20
lived constituents and also systematically increases with altitude for C2H2, C2H6 and
CO. The C2H2 level increases up to 190 % in Fig. 6 and it can be as large as 2200% for
a young biomass burning plume (Coheur et al., 2007). The overall increased enhance-
ment for shorter lifetimes is consistent with relatively young air inside the anticyclone,
and older air in the background (as implied for the distributions seen in Fig. 4). There is25
also a systematic increase in enhancement with altitude over 12–17 km for the shorter-
lived species; this may be a signature of systematically older air with higher altitude for
the outside or background profiles.
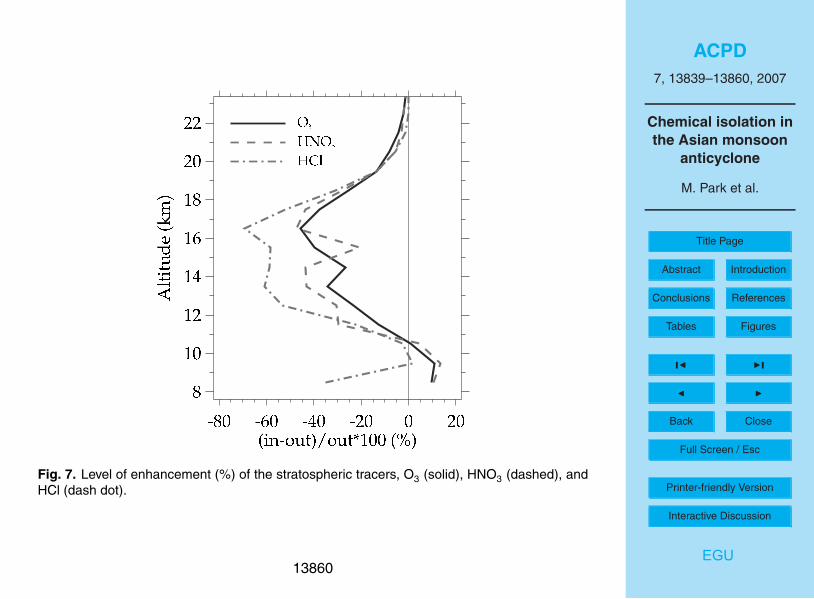
Figure 7 shows the level of enhancement for the stratospheric tracers. Here the val-
13846
ACPD
7, 13839–13860, 2007
Chemical isolation in
the Asian monsoon
anticyclone
M. Park et al.
Title Page
Abstract Introduction
Conclusions References
Tables Figures
◭ ◮
◭ ◮
Back Close
Full Screen / Esc
Printer-friendly Version
Interactive Discussion
EGU
ues are negative because these tracers are depleted within the anticyclone as shown
in Figs. 3 and 4. There are systematic decreases in the stratospheric tracers over ∼11-
20 km, with O3 and HNO3 decreases up to ∼40 % and HCl decreases near ∼60%.
The vertical profiles of these changes are consistent with the tropospheric tracer en-
hancement seen in Figure 5a, and the stratospheric tracers provide further evidence5
of transport of lower tropospheric air to altitudes near and above the tropopause.
4 Summary and discussion
The Asian summer monsoon circulation acts as a transport barrier to the chemical
species from upper troposphere to lower stratosphere during NH summer (Li et al.,
2005; Randel and Park, 2006; Park et al., 2007). Due to vertical transport from10
deep convection and strong isolation within the anticyclone, chemical constituents of-
ten show relative maxima or minima over the monsoon region. In this study, we show
further evidence of chemical isolation in the anticyclone using chemical constituents
observed by the ACE-FTS for the period covering summer (June–August) of 2004–
2006. ACE-FTS data allow study of constituents with a variety of photochemical life-15
times, and provide information on the detailed vertical structure within the anticyclone.
CO vertical profiles show enhanced values over the monsoon anticyclone from ∼12–
20 km altitude. The HCN profiles show maxima almost in the same region as CO. Using
the clear signal of high CO (Fig. 1a), we define profiles to be “inside” the anticyclone
where CO is higher than the threshold (60 ppbv at 16.5 km) and term ’outside’ the anti-20
cyclone to be the rest of the observations over the latitude band 10◦–40
◦N. The selec-
tion of ‘inside’ profiles is not too sensitive to the threshold values. Averaged profiles in-
side the anticyclone show strong enhancements for the tropospheric tracers CO, HCN,
C2H6 and C2H2 over approximately 10–20km (Figs. 2 and 5), with relative maxima
near 15 km (somewhat lower for C2H2). Relatively weak enhancements inside the an-25
ticyclone near 15 km are also observed for CH3Cl and OCS. There are corresponding
decreases in stratospheric tracers (O3, HNO3 and HCl) inside the anticyclone over the
13847
ACPD
7, 13839–13860, 2007
Chemical isolation in
the Asian monsoon
anticyclone
M. Park et al.
Title Page
Abstract Introduction
Conclusions References
Tables Figures
◭ ◮
◭ ◮
Back Close
Full Screen / Esc
Printer-friendly Version
Interactive Discussion
EGU
same altitude range (Figs. 3 and 7). The maxima (minima) in the tropospheric (strato-
spheric) constituents over 13–15 km may suggest that this is the altitude of strongest
outflow from deep convection in the monsoon region. However, this altitude is some-
what higher than the maximum outflow level (∼12 km) inferred from tropical radiative
balance (Folkins and Martin, 2005) or cloud height estimates (Gettelman et al., 2002;5
Liu and Zipser, 2005). The distribution of outflow from deep convection in the monsoon
region remains an open research topic.
There exist substantial correlations between CO and the tropospheric tracers in the
UTLS region. Compact correlations are found between CO and C2H6, and between
CO and C2H2, suggesting common sources for these species. Somewhat higher scat-10
ter is observed between CO and HCN, consistent with aircraft observations, and this
may signify different sources for the two species. The observed slopes of the corre-
lations among different tropospheric species are in excellent agreement with calcula-
tions based on published lifetimes (Fig. 4), and this demonstrates that the differences
between profiles inside and outside of the anticyclone are consistent with distinct pho-15
tochemical ages. This conclusion is consistent with the ratio of (C2H2/CO) in Fig. 5b,
which suggests relatively younger air inside the anticyclone.
The relative enhancements of tropospheric species inside the anticyclone are closely
related to the photochemical lifetime of the species (Fig. 6). The largest enhancements
are observed for species with the shortest lifetimes (namely C2H2), with relatively small20
differences found for lifetimes of 1 year or longer. The enhancements are also larger
for higher altitudes (between 12 and 17 km), and this may reflect the increase in photo-
chemical age with altitude of species in the background atmosphere. Stratospheric
tracers show a ∼40–60% decrease within the anticyclone over ∼11–20 km altitude
range.25
Acknowledgements. This work was partially supported under the NASA ACMAP and EOS
programs. We thank C. Clerbaux and K. Bowman for discussions and comments on the
manuscript. Funding for ACE is provided primarily by the Canadian Space Agency. The Na-
tional Center for Atmospheric Research is operated by the University Corporation for Atmo-
13848
ACPD
7, 13839–13860, 2007
Chemical isolation in
the Asian monsoon
anticyclone
M. Park et al.
Title Page
Abstract Introduction
Conclusions References
Tables Figures
◭ ◮
◭ ◮
Back Close
Full Screen / Esc
Printer-friendly Version
Interactive Discussion
EGU
spheric Research, under sponsorship of the National Science Foundation.
References
Andreae, M. O. and Merlet, P.: Emission of trace gases and aerosols from biomass burning,
Global Biogeochem. Cy., 15, 955–966, 2001.
Beer, R.: TES on the Aura Mission: Scientific Objectives, Measurements, and Analysis5
Overview, IEEE Trans, Geosci. Remote Sensing, 44, 1102–1105, 2006.
Bernath, P. F., McElroy, C. T., Abrams, M. C., et al.: Atmospheric Chemistry Experiment (ACE):
Mission overview, Geophys. Res. Lett., 32, L15S01, doi:10.1029/2005GL022386, 2005.
Blake, N. J., Blake, D. R., Sive, B. C., et al.: Biomass burning emissions and vertical distribution
of atmospheric methyl halides and other reduced carbon gases in the South Atlantic region,10
J. Geophys. Res., 101, 24 151–24 164, 1996.
Blake, N. J., Blake, D. R., Wingenter, O. W., et al.: Influence of southern hemispheric biomass
burning on midtropopsheric distributions of nonmethane hydrocarbons and selected halocar-
bons over the remote South Pacific, J. Geophys. Res., 104, 16 213–16 232, 1999.
Blake, N. J., Blake, D. R., Simpson, I. J., et al.: NMHCs and halocarbons in Asian con-15
tinental outflow during the Transport and Chemical Evolution over the Pacific (TRACE-
P) Field Campaign: Comparison With PEM-West B, J. Geophys. Res., 108(D20), 8806,
doi:10.1029/2002JD003367, 2003.
Blake, N. J., Streets, D. G., Woo, J.-H., et al.: Carbonyl sulfide and carbon disulfide: Large-
scale distributions over the western Pacific and emissions from Asia during TRACE-P, J.20
Geophys. Res., 109, D15S05, doi:10.1029/2003JD004259, 2004.
Boone, C. D., Nassar, R., Walker, K. A., Rochon, Y., McLeod, S. D., Rinsland, C. P., and
Bernath, P. F.: Retrievals for the Atmospheric Chemistry Experiment Fourier Transform Spec-
trometer, Appl. Opt. 44, 7218–7231, 2005.
Chin, M. and Davis, D. D.: A reanalysis of carbonyl sulfide as a source of stratospheric back-25
ground sulfur aerosol, J. Geophys. Res., 100(D5), 8993–9006, 10.1029/95JD00275, 1995.
Clerbaux, C., Hadji-Lazaro, J., Turquety, S., Megie, G., and Coheur, P.-F.: Trace gas measure-
ments from infrared satellite for chemistry and climate applications, Atmos. Chem. Phys., 3,
1495–1508, 2003, http://www.atmos-chem-phys.net/3/1495/2003/.
Clerbaux, C., Coheur, P.-F., Hurtmans, D., Barret, B., Carleer, M., Colin, R., Seme-30
13849
ACPD
7, 13839–13860, 2007
Chemical isolation in
the Asian monsoon
anticyclone
M. Park et al.
Title Page
Abstract Introduction
Conclusions References
Tables Figures
◭ ◮
◭ ◮
Back Close
Full Screen / Esc
Printer-friendly Version
Interactive Discussion
EGU
niuk, K., McConnell, J. C., Boone, C., and Bernath, P.: Carbon monoxide distribution
from the ACE-FTS solar occultation measurements, Geophys. Res. Lett., 32, L16S01,
doi:10.1029/2005GL022394, 2005.
Coheur, P.-F., Herbin, H., Clerbaux, C., Hurtmans, D., Wespes, C., Carleer, M., Turquety, S.,
Rinsland, C. P., Remedios, J., Hauglustaine, D., Boone, C. D., and Bernath, P. F.: ACE-5
FTS observation of a young biomass burning plume: first reported measurements of C2H4,
C3H6O, H2CO and PAN by infrared occultation from space, Atmos. Chem. Phys. Discuss., 7,
7907–7932, 2007, http://www.atmos-chem-phys-discuss.net/7/7907/2007/.
Connors, V. S., Gormsen, B. B., Nolf, S., and Reichle, H. G., et al.: Spaceborne observations of
the global distribution of carbon monoxide in the middle troposphere during April and October10
1994, J. Geophys. Res., 104, 21 455–21 470, 1999.
Deeter, M. N., Emmons, L. K., Edwards, D. P., Gille, J. C., and Drummond, J. R.: Vertical
resolution and information content of CO profiles retrieved by MOPITT, Geophys. Res. Lett.,
31, L15112, doi:10.1029/2004GL020235, 2004.
Dethof, A., O’Neill, A., Slingo, J. M., and H. G. J. Smit, H. G. J.: A mechanism for moistening15
the lower stratosphere involving the Asian summer monsoon, Q. J. R. Meteorol. Soc., 125,
1079–1106, 1999.
Dufour, G., Boone, C. D., Rinsland, C. P., and Bernath, P. F.: First space-borne measurements
of methanol inside aged southern tropical to mid-latitude biomass burning plumes using the
ACE-FTS instrument, Atmos. Chem. Phys., 6, 3463–3470, 2006,20
http://www.atmos-chem-phys.net/6/3463/2006/.
Edwards, D. P., Emmons, L. K., Gille, J. C., et al.: Satellite-observed pollution from Southern
Hemisphere biomass burning, J. Geophys. Res., 111, D14312, doi:10.1029/2005JD006655,
2006.
Folkins, I., and Martin, R.: The vertical structure of tropical convection and its impact on the25
budgets of water vapor and ozone. J. Atmos. Sci., 62, 1560–1573, 2005.
Fu, R., Hu, Y., Wright, J. S., Jiang, J. H., Dickinson, R. E., Chen, M., Filipiak, M., Read,
W. G., Waters, J. W., Wu, D. L.:Short circuit of water vapor and polluted air to the global
stratosphere by convective transport over the Tibetan Plateau, Proc. Nat. Acad. Sci., 103,
5664–5669, 2006.30
Gettelman, A., Salby, M. L., and Sassi, F.: Distribution and influence of convection in the tropical
tropopause region, J. Geophys. Res., 107(D10), 4080, doi:10.1029/2001JD001048, 2002.
Jacob, D. J., Crawford, J. H., Kleb, M. M., Connors, V. S., Bendura, R. J., Raper, J. L., Sachse,
13850
ACPD
7, 13839–13860, 2007
Chemical isolation in
the Asian monsoon
anticyclone
M. Park et al.
Title Page
Abstract Introduction
Conclusions References
Tables Figures
◭ ◮
◭ ◮
Back Close
Full Screen / Esc
Printer-friendly Version
Interactive Discussion
EGU
G. W., Gille, J. C., Emmons, L., and Heald, C. L.: The Transport and Chemical Evolution
over the Pacific (TRACE-P) aircraft mission: design, execution, and first results, J. Geophys.
Res., 108 (D20), 1–19, 2003.
Jin J. J., Semeniuk, K., Jonsson, A. I., et al.: Co-located ACE-FTS and Odin/SMR stratospheric-
mesospheric CO 2004 measurements and comparison with a GCM, Geophys. Res. Lett., 32,5
L15S03, doi:10.1029/2005GL022433, 2005.
Krishnamurti, T. N. and Bhalme, H. N.: Oscillations of a monsoon system. Part I. Observational
aspects, J. Atmos. Sci., 33, 1937–1954, 1976.
Li, Q., Jacob, D. J., Bey, I., Yantosca, R. M., Zhao, Y., Kondo, Y., and Notholt, J.: Atmospheric
hydrogen cyanide (HCN): Biomass burning source, ocean sink?, Geophys. Res. Lett., 27,10
357–360, 2000.
Li, Q., Jiang, J. H., Wu, D. L., Read, W. G., Livesey, N. J., Waters, J. W., Zhang, Y., Wang, B.,
Filipiak, M. J., Davis, C. P., Turquety, S., Wu, S., Park, R. J., Yantosca, R. M., and Jacob, D. J.:
Trapping of Asian pollution by the Tibetan anticyclone: A global CTM simulation compared
with EOS MLS observations, Geophys. Res. Lett., 32, L14826, doi:10.1029/2005GL022762,15
2005.
Liu, C. and Zipser, E. J.: Global distribution of convection penetrating the tropical tropopause,
J. Geophys. Res., 110, D23104, doi:10.1029/2005JD006063, 2005.
Logan, J. A., Prather, M. J., Wofsy, S. C., and McElroy, M. B.: Tropospheric chemistry – A global
perspective, J. Geophys. Res., 86, 7210–7254, 1981.20
Park, M., Randel, W. J., Gettelman, A., Massie, S. T., and Jiang, J. H.: Transport above the
Asian summer monsoon anticyclone inferred from Aura Microwave Limb Sounder tracers, J.
Geophys. Res., 112, D16309, doi:10.1029/2006JD008294, 2007.
Randel, W. J., and Park, M.: Deep convective influence on the Asian summer monsoon anticy-
clone and associated tracer variability observed with Atmospheric Infrared Sounder (AIRS),25
J. Geophys. Res., 111, D12314, doi:10.1029/2005JD006490, 2006.
Rinsland, C. P., Dufour, G., Boone, C. D., Bernath, P. F., and Chiou, L.: Atmospheric Chemistry
Experiment (ACE) measurements of elevated Southern Hemisphere upper tropospheric CO,
C2H6, HCN, and C2H2 mixing ratios from biomass burning emissions and long-range trans-
port, Geophys. Res. Lett., 32, L20803, doi:10.1029/2005GL024214, 2005.30
Singh, H. B., Salas, L., Herlth, D., Kolyer, R., Czech, E., Viezee, W., Li, Q., Jacob, D. J., Blake,
D., Sachse, G., Harward, C. N., Fuelberg, H., Kiley, C. M., Zhao, Y., and Kondo, Y.: In situ
measurements of HCN and CH3CN over the Pacific Ocean: Sources, sinks, and budgets, J.
13851
ACPD
7, 13839–13860, 2007
Chemical isolation in
the Asian monsoon
anticyclone
M. Park et al.
Title Page
Abstract Introduction
Conclusions References
Tables Figures
◭ ◮
◭ ◮
Back Close
Full Screen / Esc
Printer-friendly Version
Interactive Discussion
EGU
Geophys. Res., 108(D20), 8795, doi:10.1029/2002JD003006, 2003.
Smyth, S., Bradshaw, J., Sandholm, S., et al.: Comparison of free tropospheric western Pacific
air mass classification schemes for the PEM-West A experiment, J. Geophys. Res., 101,
1743–1762, 1996.
Smyth, S., Sandholm, S., Shumaker, B., et al.: Characterization of the chemical signatures5
of air masses observed during the PEM experiments over the western Pacific, J. Geophys.
Res., 104, 16 243–16 254, 1999.
Talbot, R. W., Dibb, J. E., Scheuer, E. M., Blake, D. R., Blake, N. J., Gregory, G. L., Sachse,
G. W., Bradshaw, J. D., Sandholm, S. T., and Singh, H. B.: Influence of biomass combustion
emissions on the distribution of acidic trace gases over the southern Pacific basin during10
Austral springtime, J. Geophys. Res., 104, 5623–5634, 1999.
Walker, K. A., Randall, C. E., Trepte, C. R., Boone, C. D., and Bernath, P. F.: Initial validation
comparisons for the Atmospheric Chemistry Experiment (ACE-FTS), Geophys. Res. Lett.,
32, L16S04, doi:10.1029/2005GL022388, 2005.
Watts, S. F.: The mass budgets of carbonyl sulfide, dimethyl sulfide, carbon disulfide and hy-15
drogen sulfide, Atmos. Environ., 34, 761–779, 2000.
Waters, J. W., Froidevaux, L., Harwood, R. S., et al.: The Earth Observing System Microwave
Limb Sounder (EOS MLS) on the Aura satellite, IEEE Trans. Geosci. Remote Sens., 44(5),
1075–1092, 2006.
Xiao Y., Jacob, D. J., and Turquety, S.: Atmospheric acetylene and its relationship with CO as20
an indicator of air mass age, J. Geophys. Res., 112, D12305, doi:10.1029/2006JD008268,
2007.
Yoshida, Y., Wang, Y., Zeng, T., and Yantosca, R.: A three-dimensional global model study
of atmospheric methylchloride budget and distributions, J. Geophys. Res., 109, D24309,
doi:10.1029/2004JD004951, 2004.25
Zhao, Y., Strong, K., Kondo, Y., Koike, M., Matsumi, Y., Irie, H., Rinsland, C. P., Jones, N.
B., Suzuki, K., Nakajima, H., Nakane, H., and Murata, I.: Spectroscopic measurements of
tropospheric CO, C2H6, C2H2, and HCN in northern Japan, J. Geophys. Res., 107(D18),
4343, doi:10.1029/2001JD000748, 2002.
13852
ACPD
7, 13839–13860, 2007
Chemical isolation in
the Asian monsoon
anticyclone
M. Park et al.
Title Page
Abstract Introduction
Conclusions References
Tables Figures
◭ ◮
◭ ◮
Back Close
Full Screen / Esc
Printer-friendly Version
Interactive Discussion
EGU
Table 1. Photochemical lifetimes.
Species Lifetime
CO
HCN
C2H6
C2H2
CH3Cl
OCS
2–3 monthsa
5 monthsc,d,e
1–2 monthsb,d
0.5–1 monthsa,b
1 yearb,f,i
4.3 yearsg,h
aXiao et al., 2007
bLogan et al., 1981
cLi et al., 2000
dZhao et al., 2002
eSingh et al., 2003
fBlake et al., 1996
gBlake et al., 2004
hChin and Davis, 1996
iYoshida et al., 2004
13853
ACPD
7, 13839–13860, 2007
Chemical isolation in
the Asian monsoon
anticyclone
M. Park et al.
Title Page
Abstract Introduction
Conclusions References
Tables Figures
◭ ◮
◭ ◮
Back Close
Full Screen / Esc
Printer-friendly Version
Interactive Discussion
EGU
Fig. 1. Global map of (a) CO and (b) HCN mixing ratios at 16.5 km for June–August (2004–
2006). Approximate data range is 10–70 parts per billion by volume (ppbv) for CO and 100–340
parts per trillion by volume (pptv) for HCN.
13854
ACPD
7, 13839–13860, 2007
Chemical isolation in
the Asian monsoon
anticyclone
M. Park et al.
Title Page
Abstract Introduction
Conclusions References
Tables Figures
◭ ◮
◭ ◮
Back Close
Full Screen / Esc
Printer-friendly Version
Interactive Discussion
EGU
Fig. 2. Average profile of tropospheric tracers (a-CO, b-HCN, c-C2H6, d-C2H2, e-CH3Cl, and f-
OCS) inside (solid) and outside (dashed) of the monsoon anticyclone, respectively. Two-sigma
standard error from the mean is denoted as solid line.
13855
ACPD
7, 13839–13860, 2007
Chemical isolation in
the Asian monsoon
anticyclone
M. Park et al.
Title Page
Abstract Introduction
Conclusions References
Tables Figures
◭ ◮
◭ ◮
Back Close
Full Screen / Esc
Printer-friendly Version
Interactive Discussion
EGU
Fig. 3. Same as Fig. 2 but for stratospheric tracers (a-O3, b-HNO3 and c-HCl). Note the
stratospheric tracers have log-scale x-axis.
13856
ACPD
7, 13839–13860, 2007
Chemical isolation in
the Asian monsoon
anticyclone
M. Park et al.
Title Page
Abstract Introduction
Conclusions References
Tables Figures
◭ ◮
◭ ◮
Back Close
Full Screen / Esc
Printer-friendly Version
Interactive Discussion
EGU
Fig. 4. Scatter plots of CO (ppbv) versus (a) HCN (pptv), (b) C2H6 (pptv), (c) C2H2 (pptv), (d)
CH3Cl (pptv) and (e) OCS (pptv), and (f) O3 (ppbv) versus HCl (ppbv) at 16.5 km. Pluses indi-
cate measurements inside and dots indicate outside of the monsoon anticyclone, respectively.
The dashed line in each panel is derived from the photochemical lifetimes of each species (see
text for detail).
13857
ACPD
7, 13839–13860, 2007
Chemical isolation in
the Asian monsoon
anticyclone
M. Park et al.
Title Page
Abstract Introduction
Conclusions References
Tables Figures
◭ ◮
◭ ◮
Back Close
Full Screen / Esc
Printer-friendly Version
Interactive Discussion
EGU
Fig. 5. (a) Normalized difference between average profiles inside and outside the anticyclone
for the tropospheric tracers, i.e., CO (solid), HCN (dotted), C2H6 (dashed), and C2H2 (dash
dot). (b) Ratio of C2H2/CO inside (open circle) and outside (plus) the anticyclone, respectively.
13858
ACPD
7, 13839–13860, 2007
Chemical isolation in
the Asian monsoon
anticyclone
M. Park et al.
Title Page
Abstract Introduction
Conclusions References
Tables Figures
◭ ◮
◭ ◮
Back Close
Full Screen / Esc
Printer-friendly Version
Interactive Discussion
EGU
Fig. 6. Level of enhancement (%) of the tropospheric tracers over 12.5–16.5 km. The log-scale
x-axis represents the chemical lifetime of the tracers in years (CH3Cl–1 year).
13859
ACPD
7, 13839–13860, 2007
Chemical isolation in
the Asian monsoon
anticyclone
M. Park et al.
Title Page
Abstract Introduction
Conclusions References
Tables Figures
◭ ◮
◭ ◮
Back Close
Full Screen / Esc
Printer-friendly Version
Interactive Discussion
EGU
Fig. 7. Level of enhancement (%) of the stratospheric tracers, O3 (solid), HNO3 (dashed), and
HCl (dash dot).
13860