Embed Size (px)
Citation preview
Radd
EJa
b
a
A
R
R
2
A
A
K
D
B
d
1
Mpfdb(e(Dff
d
h0
chemical engineering research and design 1 1 1 ( 2 0 1 6 ) 83–99
Contents lists available at ScienceDirect
Chemical Engineering Research and Design
j ourna l h omepage: www.elsev ier .com/ locate /cherd
igorous modeling, simulation and optimization of conventional and nonconventional batch reactiveistillation column: A comparative study ofynamic optimization approaches
dna Soraya Lopez-Saucedoa,∗, Ignacio E. Grossmannb,uan Gabriel Segovia-Hernandeza, Salvador Hernándeza
Departamento de Ingenieria Quimica, Universidad de Guanajuato, 36050 Guanajuato, Guanajuato, MexicoDepartment of Chemical Engineering, Carnegie Mellon University, Pittsburgh, USA
r t i c l e i n f o
rticle history:
eceived 9 February 2016
eceived in revised form 31 March
016
ccepted 5 April 2016
vailable online 26 April 2016
eywords:
ynamic optimization
a b s t r a c t
In this paper we address the optimization of two batch distillation columns: a conventional
batch distillation column (BDC) and a nonconventional dividing wall batch distillation col-
umn (DWBDC) with and without chemical reaction. The simultaneous solution of these
systems of differential and algebraic equations is performed using two different approaches:
pure equation oriented approach (EOA) based on orthogonal collocation over finite elements
implemented in GAMS (24.2.2), and control vector parameterization (CVP) as implemented
in gPROMS (3.7.1). In order to accomplish this objective, we describe and propose for the
nonconventional batch configuration, two dynamic models that involve stage-by-stage cal-
culations for the time varying column profiles. Case studies with and without reaction
atch distillation
iscretization methods
are presented in order to compare the two discretization approaches and to demonstrate
possible benefits of dividing wall columns in batch separations.
© 2016 The Institution of Chemical Engineers. Published by Elsevier B.V. All rights reserved.
with the discretization. Even though various batch distil-
. Introduction
odeling, simulation, and optimization of batch distillationrocesses rely on dynamic models described by a set of dif-erential and algebraic equations (DAEs). Over the last threeecades, a number of different solution approaches haveeen used for the solution of Batch Distillation Columns
BDC). One of these approaches is Control Vector Param-terization (CVP) approach, proposed by Vassiliadis et al.1994a,b). This approach relies on the iterative solution ofAEs in the space of the control variables in order to per-
orm the optimization. Another method that has been usedor the discretization of these dynamic systems is Orthogonal
Abbreviations: BDC, batch distillation column; BRDC, batch reactivistillation column; DWBRDC, dividing wall batch reactive distillation c∗ Corresponding author. Tel.: +52 473 732 0006x8142.
E-mail address: [email protected] (E.S. Lopez-Saucedo).ttp://dx.doi.org/10.1016/j.cherd.2016.04.005263-8762/© 2016 The Institution of Chemical Engineers. Published by
Collocation over finite elements, developed by Biegler (1984).With this method, the dynamic optimal control problem isapproximated by a finite dimensional nonlinear program (NLP)through the discretization of all variables. With the new dis-cretized set of equations, the model can then be solved asan NLP problem to simultaneously perform the optimizationwhile converging the differential-algebraic equations for thedynamic model. The use of these approximations over finiteelements, the size and number of which must be specifiedahead of time, allows some control over the error associated
e distillation column; D, distillate; DWBDC, dividing wall batcholumn.
lation models have been solved using the CVP approach,there is still a lack of information when a simultaneous
Elsevier B.V. All rights reserved.
84 chemical engineering research and
Nomenclature
1 superindex indicating the left section in thedividing wall batch distillation column
2 superindex indicating the right section in thedividing wall batch distillation column
C molarity (mol/L)Cenergy cost of energy ($)Cfeed cost of feed ($/kmol)Cproduct sales value of distillate product ($/kmol/)Dproduct amount of distillate product (kmol)H vapor enthalpy (kJ/kmol)h liquid enthalpy (kJ/kmol)i number of componentsj number of stagesk reaction rate constants (L/gmol/min)K vapor–liquid equilibrium constantM holdup (kmol)�n total produced products during the reaction
(kmol/h)P total pressure (bar)Psat vapor pressure (bar)Qcond Condenser heat duty (kJ/h)Qreb reboiler heat duty (kJ/h)r reaction rate (gmol/s)R liquid flowrate (kmol/h)RR internal reflux ratioT temperature (K)tF final batch time (h)V vapor flowrate (kmol/h)x liquid composition in mole fractiony vapor composition in mole fraction
approach like orthogonal collocation over finite elements isused.
BDC and as Continuous Distillation Columns (CDC), arecharacterized by high energy consumption. An innovativesolution to overcome this problem in CDC is the use of DividingWall Distillation Columns (DWDC), which have evolved fromthe Petlyuk configuration (two coupled distillation columns(Petlyuk et al., 1965)) by the addition of a vertical wall that splitsthe column into two separate sections. Thanks to this, DWChave been applied in the chemical process industry as it canseparate more components in a single distillation unit thusachieving cost savings by requiring single columns instead oftwo columns. In fact, the use of DWC in Continuous Distilla-tion Columns can save up to 30% in capital investment andup to 40% in operating costs (Isopescu et al., 2008). Reviewsand research papers have been published covering the design,simulation, optimization, control, and applications of DWC(Hernández and Jimenez, 1999a; Hernández and Jimenez,1999b; Rong and Turunen, 2006; Segovia-Hernández et al.,2007; Rangaiah et al., 2009; Asprion and Kaibel, 2010; Dejanovicet al., 2010; Diggelen et al., 2010; Kiss and Bildea, 2011; Kiss andRewagad, 2011; Yildirim et al., 2011). Furthermore, the DWCprocesses covering the design, simulation, optimization, con-trol and applications can be used even in reactive distillationprocesses (Mueller and Kenig, 2007; Hernández et al., 2009;Kiss et al., 2009; Kiss and Bildea, 2011; Delgado-Delgado et al.,
2012).In this study we propose the optimal design and opera-tion of a BDC with and without reaction for a given product
design 1 1 1 ( 2 0 1 6 ) 83–99
specification while comparing two different approaches: pureequation oriented approach (EOA) based on orthogonal col-location over finite elements as implemented in GAMS, andCVP approach as implemented in gPROMS. In order to studythe potential impact (observed in continuous processes) ofdividing walls in batch configurations, a rigorous model andsolution of new nonconventional dividing wall batch distilla-tion columns (DWBDC) with and without chemical reactionare also presented. The nonreactive case study is the separa-tion of methanol from a quaternary mixture of light alcohols(methanol, ethanol, n-propanol and n-butanol), and will beexplored by maximizing a profit function while the reflux ratio(RR) is used as the control variable. The reactive case will beexplored by maximizing the limiting reactant conversion forthe production of ethyl acetate via esterification of acetic acidwith ethanol. This study investigates how variables, such asvapor flowrate (V) and RR are adjusted to maximize an objec-tive function for a given product specification.
The paper is organized as follows. First, we provide theproblem statement in Section 2 followed by the proposedmathematical model in Section 3. The discretization meth-ods used to convert the optimal control problem into an NLPproblem are presented in Section 4. The column configura-tion and operational conditions are presented in Section 5. Theresults are shown in Section 6 followed by the conclusions inSection 7.
2. Problem statement
In general, the problem addressed in this paper can be statedas follows:
Given a feed consisting of a mixture of NC components, thecolumn configuration, and product purity specification for a key dis-tillate component. The goal is to maximize an objective function bymanipulating the column reflux ratio RR(t) and the vapor flowrate Vto purify a given mixture of NC components. All the alternatives fromconventional batch columns to dividing wall batch columns with andwithout reaction are considered.
The specific dynamic optimization problem can then bestated as follows:
Given: Column configuration, feed mixture,vapor flowrate, product purity andbatch time.
Determine: Optimal reflux ratio profile.
To maximize: A profit/conversion equation.
Subject to: Equality and inequality constraints.
In this study, two of the most common optimization prob-lems are considered, but the performance of batch distillationcolumns can also be studied by optimizing different objectivefunctions, such as the amount of distillate product, operationtime, energy consumption in the reboiler, etc. The selection ofthe optimization problem to be solved depends on the scopeof the separation.
2.1. Maximum profit problem
An objective function for the maximization of a profit func-tion P that combines the minimum time and the maximumdistillate problem is given by
Profit = Sales revenue − Feed cost − Operating cost
Total batch time(1)
and d
wre
P
wii(C(bp
witieco
2
Frm
w
3
DTet(roebmc
chemical engineering research
here the main operating cost is the energy cost of theeboiler. The profit function can then be stated as the profitxpression presented by Górak and Sørensen (2014):
rofit =CproductDproduct − CfeedMfeed −
∫ tF
0Qreb(t)dtCenergy
tF(2)
here Dproduct is the amount of distillate product (kmol), Cproduct
s the sales value of the distillate product ($/kmol), Mfeed is thenitial raw material charge (kmol), Cfeed is the cost of the feed$/kmol), the integral is the total energy consumption cost,
energy is the energy cost ($/kJ), and tf is the final batch timeh) when a set up time (charging and cleaning time betweenatches, h) is added to the term. In mathematical terms, therofit optimization problem (OP1) can be formulated as:
maxu(t)
Profit
s.t.dx
dt= f (x(t), u(t), q, tf )
h(x, u, q, t) = 0 (model equations
as equality constraints)
xProduct ≥ x∗Product
(inequality constraints)
t = tf
here Profit is the profit Eq. (2), x(t) are the liquid compositionn mole fraction (state variables), q constant control parame-ers, xProduct is the composition of product at final time, x∗
Product
s the desired composition of product, h are the algebraicquality constraints, and tf the fixed final time. The inequalityonstraint is the purity of the product. The control variable u(t)f the process is the reflux ratio.
.2. Maximum conversion problem
or the BRDC study cases, the maximization of the limitingeactant conversion optimization problem (OP2) can be for-
ulated mathematically as:
maxu(t)
X
opensq6pt]s.t.dx
dt= f (x(t), u(t), q, tf )
opensq9pt] h(x, u, q, t) = 0 (model equations
as equality constraints)
opensq2pt] xProduct ≥ x∗Product
(inequality constraints)
opensq6pt] t = tf
here X is the conversion of limiting reactant to product.
. Process model equations
ifferent models have been published for the solution of BDC.hese models consist of a set of differential and algebraicquations (DAEs) that can be decomposed into different equa-ions: mass balances, energy balance, equilibrium equationschemical and physical) and other equations such as reactionate, summation of mole fractions, etc. In order to solve theptimization problem shown in the previous section, it is nec-ssary to develop rigorous models to successfully predict the
ehavior of the variables with respect to time. The proposedodels for these conventional and nonconventional batchonfigurations are based on the model developed by Mujtaba
esign 1 1 1 ( 2 0 1 6 ) 83–99 85
(2004). Two basic assumptions are applied in the formulationof the models:
1. The vapor phase holdup is assumed to be negligible com-pared to the liquid phase holdup on each plate werechemical reactions take place.
2. Chemical reactions in the vapor phase are neglected.
In order to solve the reactive system, reaction terms wereadded to the mass balances in the BDC, as it is described inSection 3.1. The proposed model for a DWBRDC is presentedin Section 3.2.
3.1. Batch reactive distillation column
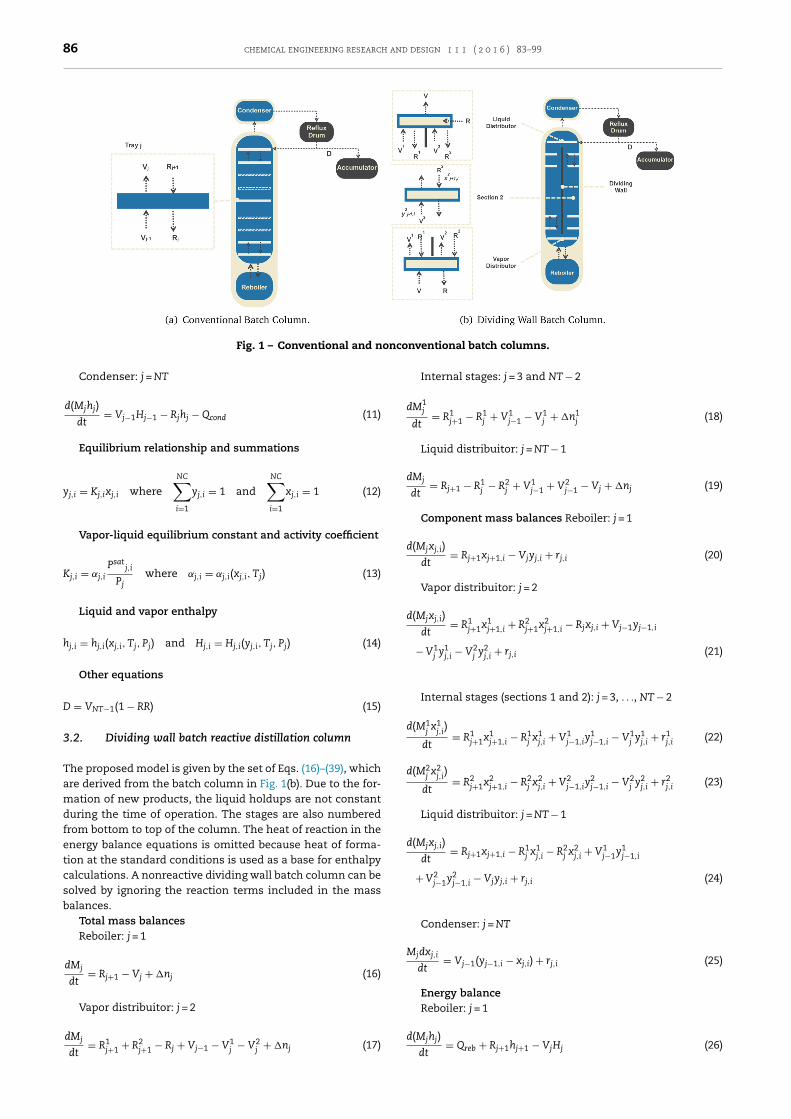
The model is presented with the set of Eqs. (3)–(15), whilethe distillation column is shown in Fig. 1(a). The stages arenumbered from bottom to top of the batch column (stage 1being the reboiler and stage NT the condenser). The heat ofreaction in the energy balance equations is omitted becauseheat of formation at the standard conditions is used as a basefor enthalpy calculations. A nonreactive batch model can beobtained by just ignoring the reaction terms included in themass balances. The notation is given at the end of the paper.
Total mass balancesReboiler: j = 1
dMj
dt= Rj+1 − Vj + nj (3)
Internal stages: j = 2, . . ., NT − 1
dMj
dt= Rj+1 − Rj + Vj−1 − Vj + �nj (4)
Condenser: j = NT
dMj
dt= Vj−1 − Rj + �nj (5)
Component mass balancesReboiler: j = 1
d(Mjxj,i)
dt= Rj+1xj+1,i − Vjyj,i + rj,i (6)
Internal stages: j = 2, . . ., NT − 1
d(Mjxj,i)
dt= Rj+1xj+1,i − Rjxj,i + Vj−1,iyj−1,i − Vjyj,i + rj,i (7)
Condenser: j = NT
d(Mjxj,i)
dt= Vj−1(yj−1,i − xj,i) + rj,i (8)
Energy balanceReboiler: j = 1
d(Mjhj)
dt= Qreb + Rj+1hj+1 − VjHj (9)
Internal stages: j = 2, . . ., NT − 1
d(Mjhj)
dt= Rj+1hj+1 − Rjhj + Vj−1Hj−1 − VjHj (10)
86 chemical engineering research and design 1 1 1 ( 2 0 1 6 ) 83–99
onco
Fig. 1 – Conventional and nCondenser: j = NT
d(Mjhj)
dt= Vj−1Hj−1 − Rjhj − Qcond (11)
Equilibrium relationship and summations
yj,i = Kj,ixj,i where
NC∑
i=1
yj,i = 1 and
NC∑
i=1
xj,i = 1 (12)
Vapor-liquid equilibrium constant and activity coefficient
Kj,i = ˛j,i
Psatj,i
Pjwhere ˛j,i = ˛j,i(xj,i, Tj) (13)
Liquid and vapor enthalpy
hj,i = hj,i(xj,i, Tj, Pj) and Hj,i = Hj,i(yj,i, Tj, Pj) (14)
Other equations
D = VNT−1(1 − RR) (15)
3.2. Dividing wall batch reactive distillation column
The proposed model is given by the set of Eqs. (16)–(39), whichare derived from the batch column in Fig. 1(b). Due to the for-mation of new products, the liquid holdups are not constantduring the time of operation. The stages are also numberedfrom bottom to top of the column. The heat of reaction in theenergy balance equations is omitted because heat of forma-tion at the standard conditions is used as a base for enthalpycalculations. A nonreactive dividing wall batch column can besolved by ignoring the reaction terms included in the massbalances.
Total mass balancesReboiler: j = 1
dMj
dt= Rj+1 − Vj + �nj (16)
Vapor distribuitor: j = 2
dMj
dt= R1
j+1 + R2j+1 − Rj + Vj−1 − V1
j − V2j + �nj (17)
nventional batch columns.
Internal stages: j = 3 and NT − 2
dM1j
dt= R1
j+1 − R1j + V1
j−1 − V1j + �n1
j (18)
Liquid distribuitor: j = NT − 1
dMj
dt= Rj+1 − R1
j − R2j + V1
j−1 + V2j−1 − Vj + �nj (19)
Component mass balances Reboiler: j = 1
d(Mjxj,i)
dt= Rj+1xj+1,i − Vjyj,i + rj,i (20)
Vapor distribuitor: j = 2
d(Mjxj,i)
dt= R1
j+1x1j+1,i + R2
j+1x2j+1,i − Rjxj,i + Vj−1yj−1,i
− V1j y1
j,i − V2j y2
j,i + rj,i (21)
Internal stages (sections 1 and 2): j = 3, . . ., NT − 2
d(M1jx1
j,i)
dt= R1
j+1x1j+1,i − R1
j x1j,i + V1
j−1,iy1j−1,i − V1
j y1j,i + r1
j,i (22)
d(M2jx2
j,i)
dt= R2
j+1x2j+1,i − R2
j x2j,i + V2
j−1,iy2j−1,i − V2
j y2j,i + r2
j,i (23)
Liquid distribuitor: j = NT − 1
d(Mjxj,i)
dt= Rj+1xj+1,i − R1
j x1j,i − R2
j x2j,i + V1
j−1y1j−1,i
+ V2j−1y2
j−1,i − Vjyj,i + rj,i (24)
Condenser: j = NT
Mjdxj,i
dt= Vj−1(yj−1,i − xj,i) + rj,i (25)
Energy balanceReboiler: j = 1
d(Mjhj)
dt= Qreb + Rj+1hj+1 − VjHj (26)
and d
y
y
y
V
K
K
K
h
h
h
D
iemc
Vj−1
chemical engineering research
Vapor distribuitor: j = 2
d(Mjhj)
dt= R1
j+1h1j+1,i + R2
j+1h2j+1,i − Rjhj,i + Vj−1Hj−1,i
− V1j H1
j,i − V2j H2
j,i (27)
Internal stages (sections 1 and 2): j = 3, . . ., NT − 2
d(M1jh1
j)
dt= R1
j+1h1j+1 − R1
j h1j + V1
j−1,iH1j−1 − V1
j H1j (28)
d(M2jh2
j)
dt= R2
j+1h2j+1 − R2
j h2j + V2
j−1,iH2j−1 − V2
j H2j (29)
Equilibrium relationship and summations
j,i = Kj,ixj,i where
NC∑
i=1
yj,i = 1 and
NC∑
i=1
xj,i = 1 (30)
1j,i = K1
j,ix1j,i where
NC∑
i=1
y1j,i = 1 and
NC∑
i=1
x1j,i = 1 (31)
2j,i = K2
j,ix2j,i where
NC∑
i=1
y2j,i = 1 and
NC∑
i=1
x2j,i = 1 (32)
apor-liquid equilibrium constant and activity coefficients
j,i = ˛j,i
Psatj,i
Pjwhere ˛j,i = ˛j,i(xj,i, Tj) (33)
1j,i = ˛1
j,i
Psat1j,i
Pjwhere ˛1
j,i = ˛1j,i(x
1j,i, T1
j ) (34)
2j,i = ˛2
j,i
Psat2j,i
Pjwhere ˛2
j,i = ˛2j,i(x
2j,i, T2
j ) (35)
Vapor and liquid enthalpy
j,i = hj,i(xj,i, Tj, Pj) and Hj,i = Hj,i(yj,i, Tj, Pj) (36)
1j,i = h1
j,i(x1j,i, T1
j , Pj) and H1j,i = H1
j,i(y1j,i, T1
j , Pj) (37)
2j,i = h2
j,i(x2j,i, T2
j , Pj) and H2j,i = H2
j,i(y2j,i, T2
j , Pj) (38)
Other equations
= VNT−1(1 − RR) (39)
It should be noted that the set of DAEs for the new divid-ng wall column are developed by modifying the mass and
NC∑
i=1
R1j+1x1
j+1,i+ R2
j+1x2j+1,i− Rjxj,i +
nergy balances on the internal stages of the column. Theseass balances are then solved simultaneously with the physi-
al, chemical and thermodynamic equilibrium models. In both
esign 1 1 1 ( 2 0 1 6 ) 83–99 87
columns the desired product is collected at the top of the col-umn as the distillate D. More details about the columns aregiven in Section 5.
Conventional and nonconventional batch distillationcolumns go through an initial startup period carried out attotal reflux, with a specified pressure, temperature, and com-position. The operation of these columns can be performedusing three different modes, namely, constant reflux andvariable product composition, variable reflux and constantproduct composition of the key component, and total refluxpolicy. Also, periodic operation (commonly known as cyclicoperation) can be performed, increasing the complexity of thedynamic models. A study presented by Lopes and Song (2010)has shown that the most profitable operational mode is atconstant overhead product composition (or variable reflux).Considering this, variable reflux policy is chosen for this study.
4. Solution approaches
In order to determine the optimal solution of the dynamicmodels presented in the previous section, we summarizebelow some of the issues that arise in the two approaches usedin this study.
4.1. Equation oriented approach
In this approach the set of DAEs is discretized into a set ofalgebraic equations (AEs) by applying orthogonal collocationover finite elements, developed by Cuthrell and Biegler (1987).These equations are then used in a large-scale NLP model.The use collocation points over finite elements providesmore flexibility in the modeling, but the error in the discreti-zation cannot be easily controlled. The proposed DAE systeminvolves a complex set of equations that leads to an index2 problem. To be solved the index should be reduced to 1 byreformulating the equations with the following steps:
1. Consider the algebraic summation of liquid compositionon the internal stages of the column:
∑NC
i=1xj,i = 1.
2. Differentiate the equation in step 1, leading to:d(∑NC
i=1xj,i)
dt=
0.3. Substitute Eqs. (21)–(24) in step 2 equation. An example is
given for the vapor distributor in Eq. (21).
yj−1,i − V1j−1y1
j−1,i− V2
j−1y2j−1,i+ rj,iMj − xj,i(dMj/dt)
Mj= 0 (40)
Now Eq. (40) replaces one equation for a NC component inEq. (21). This reformulation must be applied to the rest of theequations on the internal stages (batch reactive column) andinternal stages and distributors (dividing wall batch column).The modified equations lead to an index 1 DAE model.
For the optimization, it is necessary to calculate a consis-tent set of initial values for all variables in the stationary state.If the composition profile is too far from the desired one, theoptimization (even the simulation) leads to an infeasible solu-tion. It should be noted that in DAEs systems only some ofthe variables need to be initialized, being the same number ofdifferential variables involved in index 1 systems. The othervariables can be determined using the algebraic equations.With the proper initialization and a finite number of elements
in the model, now discretized, the problem can be solved usingorthogonal collocation over finite elements with a NLP solver.
88 chemical engineering research and design 1 1 1 ( 2 0 1 6 ) 83–99
Table 1 – Operating conditions for the nonreactive distillation column.
Number of Stages 10 Holdup, M0j, kmol
Feed, MB0 , kmol 10 Condenser 0.333Internal stages 0.083
Feed composition, x0i, mole fraction
Methanol 0.25Ethanol 0.25 Feed cost*, Cfeed, $/kmol 1n-Propanol 0.25 Product price*, Cproduct, $/kmol 35n-Butanol 0.25
Dividing wall columnVapor distributor, Liquid distributor, �
Section 1 0.7 Section 1 0.7Section 2 1 − ˇ1 Section 2 1 − �1
Column pressure, P (bar). Condenser: 1.05, internal stages: 1.12–1.08, reboiler: 1.20.
∗ Low and Sørensen (2003).4.2. Control vector parameterization approach
In contrast to the above approach, the CVP developed byPantelides (Vassiliadis et al., 1994a,b), relies on the iterativesolution of DAEs in the space of the control variables in orderto perform the optimization. To formulate the optimal controlproblem as a reduced NLP problem, the control variable RR(t)is approximated by a finite dimensionally equation. The timeinterval is divided into a finite number of subintervals, eachone involving a finite number of parameters. This new prob-lem is subjected to the constraints of the model and can besolved using a Successive Quadratic Programming (SQP) algo-rithm. The difference with the method developed by Cuthrelland Biegler (1987) is that the solution of DAEs relies in thereduced space of the control variables in order to performthe optimization. By directly integrating the equations witha DAEs solver, this ensures that the DAEs are satisfied withina given tolerance at every step of the optimization procedure.In addition to the smaller size of the nonlinear programmingproblem, this approach has the advantage of providing a directcontrol of the discretization error by adjusting the size andorder of the integration steps using integration techniques.
5. Case study
The different batch configurations and cases solved in thispaper are presented in this section: a conventional and non-conventional nonreactive and reactive BDC. The conventionalbatch configuration is a 10 stage batch column with stagesnumbered from bottom to top, stage 1 being the reboiler andstage 10 the condenser, as the one shown in Fig. 1(a). The BRDCis a 10 stage BDC with a reactive zone that extends from stage1 to 9. The nonconventional batch configuration is a 10 stageBDC divided by a wall that extends from stages 3 to 8, as it isshown in Fig. 1(b). This stage configuration corresponds to areal dividing wall batch reactive distillation column used forthe production of ethyl acetate performed by Delgado-Delgadoet al. (2012). This new nonconventional DWBDC has an upperstage that distributes the liquid into two sections in the col-umn: ˇ1 represents the fraction of liquid that feeds section 1(left side of the column) and ˇ2 the fraction of liquid that feedssection 2 (right side of the column). The bottom stage is a vapordistributor, being �1 the vapor flowrate fraction that goes up
to section 1 and �2 the vapor flowrate fraction that goes up tosection 2. The DWBRDC is a 10 stage batch column divided bya wall that extends from stage 3 to 8, with a reactive zone thatextends from stage 1 to 9. The nonreactive and reactive casesare described in Sections 5.1 and 5.2, respectively.
5.1. Nonreactive distillation: methanol, ethanol,n-propanol and n-butanol separation
The separation of a quaternary mixture (methanol, ethanol,n-propanol and n-butanol) is carried out using two differentcolumns: a 10 stage conventional BDC and a 10 stage noncon-ventional DWBDC. An amount of 10 kmol is charged into thereboiler for each case at the start of the operation. The operat-ing conditions are given in Table 1. A distillate product with amethanol purity of at least 0.90 in mole fraction is requiredfor the optimization problem. Ideal activity coefficients areassumed for modeling the phase equilibrium.
5.2. Reactive distillation: esterification of acetic acidwith ethanol
The production of ethyl acetate by esterification of acetic acidwith ethanol is accomplished by the following stoichiometricequation
AcOH + EtOH ←− AcOEt + H2O
(acetic acid) (ethanol) (ethyl acetate) (water)
(117.95◦C) (78.25
◦C) (77.15
◦C) (100
◦C)(41)
where acetic acid and ethanol react to produce ethyl acetate(as the main product) and water. Due to the similar boilingpoints of ethyl acetate and ethanol, this separation is consid-ered difficult. The overall reaction rate of this system is
r = k1CACB − k2CCCD (42)
where the rate constants values are
k1 = 4.76x10⁻⁴ and k2 = 1.63x10⁻⁴ (43)
and Ci denotes the molarity in mol/L of the different com-ponents A (acetic acid), B (ethanol), C (ethyl acetate), and D(water). The separation of ethyl acetate (as the desired prod-uct) is carried out using two different reactive columns: a 10stage conventional batch reactive column (BRC) and a 10 stage
dividing wall batch reactive column (DWBRC). The operatingconditions are given in Table 2. An amount of 10 kmol is fedinto the reboiler at the start of the operation with the next
chemical engineering research and design 1 1 1 ( 2 0 1 6 ) 83–99 89
Table 2 – Operating conditions for the reactive distillation column.
Number of Stages 10 Holdup, M0j, kmol
Feed, MB0 , kmol 10 Condenser 0.333Internal stages 0.083
Feed composition, x0i, mole fraction
Acetic acid 0.45Ethanol 0.45Ethyl acetate 0Water 0.10
Dividing wall columnVapor distributor, Liquid distributor, �
Section 1 0.7 Section 1 0.7Section 2 1 − ˇ1 Section 2 1 − �1
cata
6
IiatcAmct
6
TfSmENasBcp
6Tr
Column pressure, P (bar): 1.013.
omposition in mole fraction: 0.45 acetic acid, 0.45 ethanolnd 0.10 water. The distillate must achieve a purity higherhan 0.50 in mole fraction of ethyl acetate in the distillate. Thectivity coefficients are calculated using the NRTL method.
. Results
n this section, the solution of the dynamic models presentedn Section 3 for a conventional and nonconventional BDC withnd without reaction is presented. In order to study any poten-ial benefits of the new nonconventional dividing wall batchonfiguration, the results are compared with those of the BDC.ll examples were solved on a Dell Workstation with 8 GB RAMemory and Intel® CoreTMi7 CPU (2.20 GHz). The nonreactive
ase study is solved first to be used as a point of reference forhe reactive case which is more complex.
.1. Conventional batch distillation column
he optimization problem is solved by discretizing the dif-erential equations using the two approaches presented inection 4 with the next specifications: CVP approach imple-ented in gPROMS (3.7.1) using SQP as the NLP solver, and
OA implemented in GAMS (24.2.2) using IPOPT (3.11) as theLP solver when 10 finite elements and 3 collocation pointsre used. Four cases with different vapor flowrates were con-idered and solved first for the nonreactive and reactive case.oth set of results are taken as a reference for a furtheromparison with the DWBDC and DWBRDC. For all the casesresented in this work, a fixed batch time of 1 h is used.
.1.1. Nonreactive case studyhe nonreactive model for a BDC is obtained by removing theeaction terms in the dynamic model shown in Eqs. (3)–(15).
Table 3 – Maximum profit results in a batch distillation column
Vapor (kmol/h) QREBtotal(MJ/h)
(a) EOA approach when 10 finite elements and 3 collocation points are used6 226.73
7 264.75
8 302.85
9 341.02
(b) CVP approach6 231.78
7 269.92
8 308.03
9 345.95
The separation is carried out in a 10 stage batch columnwith a 10 kmol initial feed into the reboiler of a quaternarymixture (methanol, ethanol, n-propanol, and n-butanol) withthe following concentration in mole fraction: 0.25 methanol,0.25 ethanol, 0.25 n-propanol, and 0.25 n-butanol. The objec-tive is to maximize a profit function (given in Eq. (2)) usingthe reflux ratio RR(t) as control variable until a concentra-tion in mole fraction of 0.90 of methanol in the distillate isachieved. The prices used to solve the optimization problemwere taken from Low and Sørensen (2003): methanol priceCA = 35 $/kmol and initial feed price CB = 1 $/kmol. The energycost was CE = 2.7 $/kWh.
The EOA results in a system of 249 equations and 319variables. The optimization problem is solved in 13 s and theresults when 10 finite elements and 3 collocation points areused are shown in Table 3(a). To determine the initial valuesfor the algebraic and differential variables we considered thatthe column operates at total reflux. The CVP approach resultsin a system of 234 equations and 285 variables. The optimiza-tion problem is solved in 10 s and the results are presented inTable 3(b). The two approaches predict that profit and energyconsumption are directly proportional to changes on the vaporflowrate, reaching a maximum value when V = 9 kmol/h. Interms of produced distillate, no differences were observed.
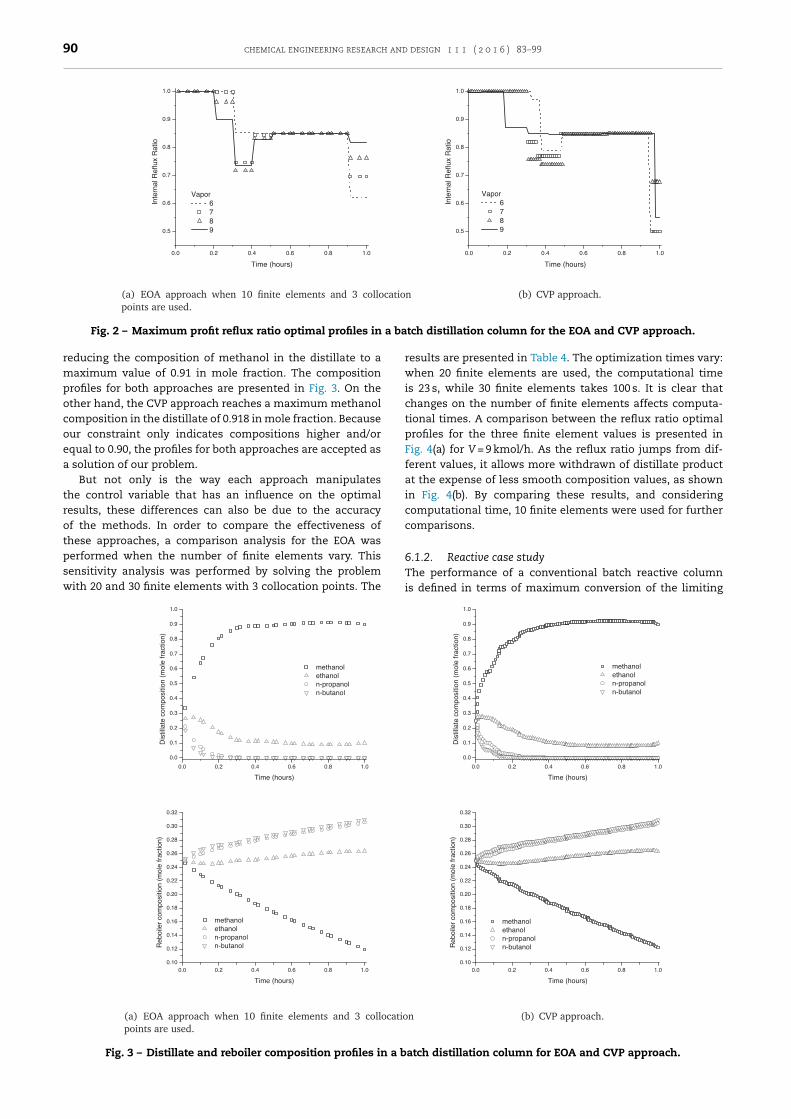
For both approaches, the duration of the startup period(total reflux) is shorter when the vapor flowrate increases,allowing the withdrawal of more distillate. This can be seenin the reflux ratio optimal profiles presented in Fig. 2. As aresult, profit (directly proportional to productivity) increaseswhen reflux ratio values are smaller. We will analyze whenV = 9 kmol/h, the highest value of profit. For the EOA, the
piecewise reflux ratio profile changes faster than CVP, leadingto less liquid sent back to the top stage of the column.This allows EOA to withdraw a higher amount of distillate,for the EOA and CVP approach.
D (kmol) Profit ($/year)
0.76 13,685.750.92 36,481.021.06 55,448.171.19 71,130.32
0.77 13,630.560.93 38,360.041.05 53,392.201.19 71,472.84
90 chemical engineering research and design 1 1 1 ( 2 0 1 6 ) 83–99
a ba
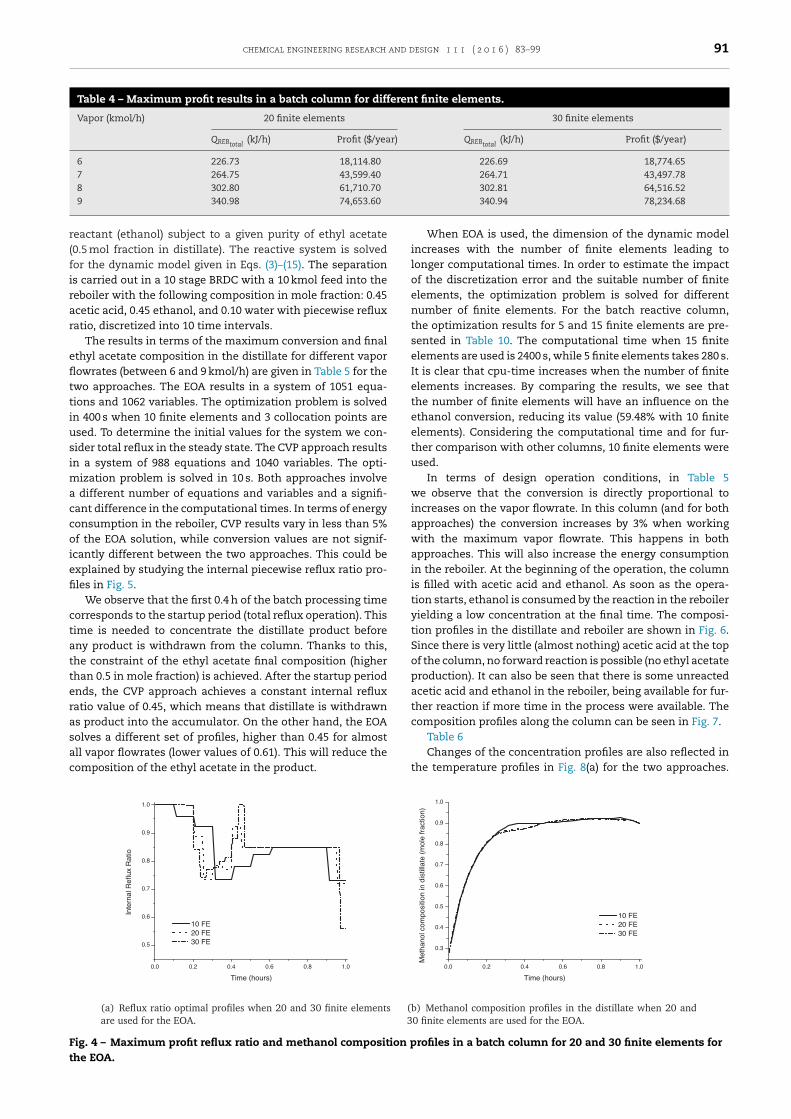
Fig. 2 – Maximum profit reflux ratio optimal profiles inreducing the composition of methanol in the distillate to amaximum value of 0.91 in mole fraction. The compositionprofiles for both approaches are presented in Fig. 3. On theother hand, the CVP approach reaches a maximum methanolcomposition in the distillate of 0.918 in mole fraction. Becauseour constraint only indicates compositions higher and/orequal to 0.90, the profiles for both approaches are accepted asa solution of our problem.
But not only is the way each approach manipulatesthe control variable that has an influence on the optimalresults, these differences can also be due to the accuracyof the methods. In order to compare the effectiveness ofthese approaches, a comparison analysis for the EOA was
performed when the number of finite elements vary. Thissensitivity analysis was performed by solving the problemwith 20 and 30 finite elements with 3 collocation points. TheFig. 3 – Distillate and reboiler composition profiles in a b
tch distillation column for the EOA and CVP approach.
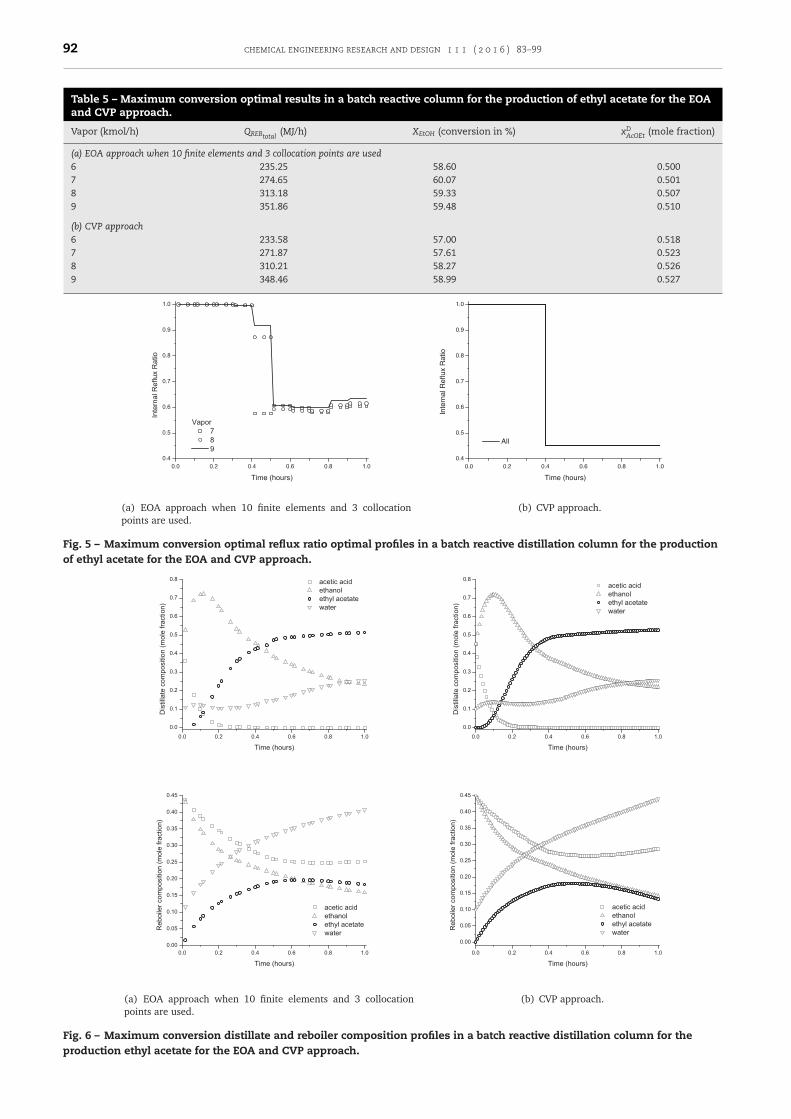
results are presented in Table 4. The optimization times vary:when 20 finite elements are used, the computational timeis 23 s, while 30 finite elements takes 100 s. It is clear thatchanges on the number of finite elements affects computa-tional times. A comparison between the reflux ratio optimalprofiles for the three finite element values is presented inFig. 4(a) for V = 9 kmol/h. As the reflux ratio jumps from dif-ferent values, it allows more withdrawn of distillate productat the expense of less smooth composition values, as shownin Fig. 4(b). By comparing these results, and consideringcomputational time, 10 finite elements were used for furthercomparisons.
6.1.2. Reactive case studyThe performance of a conventional batch reactive columnis defined in terms of maximum conversion of the limiting
atch distillation column for EOA and CVP approach.
chemical engineering research and design 1 1 1 ( 2 0 1 6 ) 83–99 91
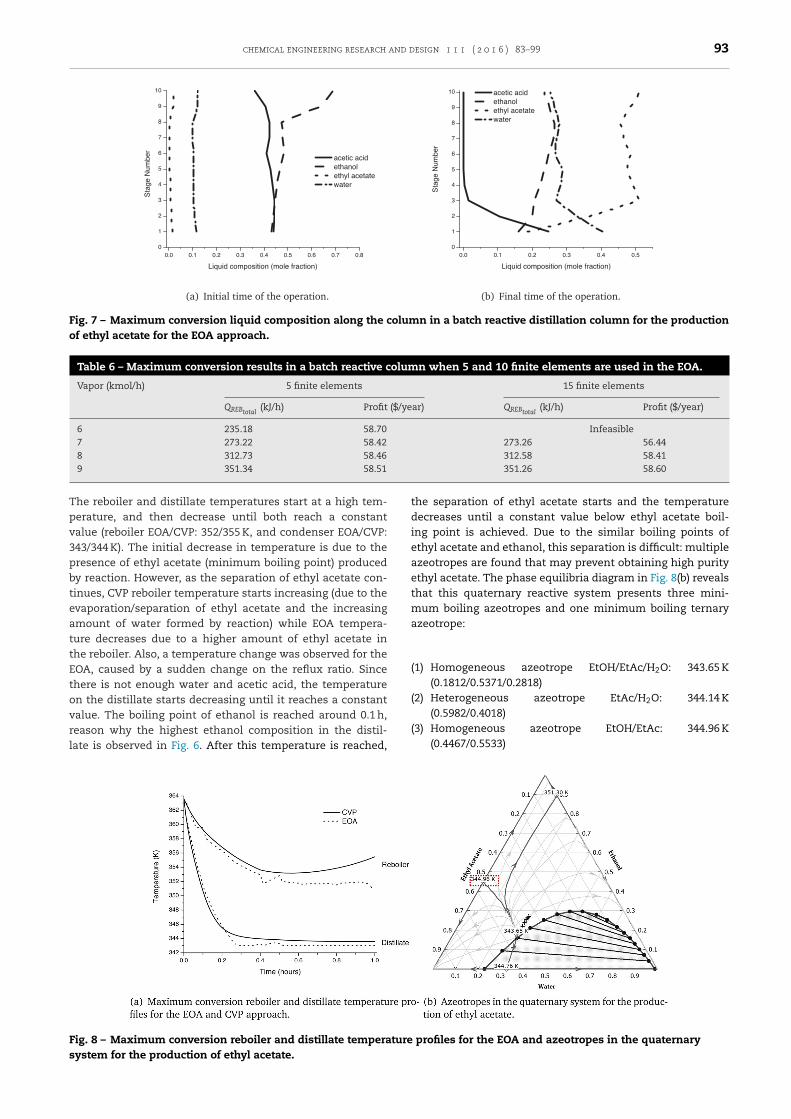
Table 4 – Maximum profit results in a batch column for different finite elements.
Vapor (kmol/h) 20 finite elements 30 finite elements
QREBtotal(kJ/h) Profit ($/year) QREBtotal
(kJ/h) Profit ($/year)
6 226.73 18,114.80 226.69 18,774.657 264.75 43,599.40 264.71 43,497.788 302.80 61,710.70 302.81 64,516.52
r(firar
eflttiusimaccoiefi
ctatterasac
Ft
9 340.98 74,653.60
eactant (ethanol) subject to a given purity of ethyl acetate0.5 mol fraction in distillate). The reactive system is solvedor the dynamic model given in Eqs. (3)–(15). The separations carried out in a 10 stage BRDC with a 10 kmol feed into theeboiler with the following composition in mole fraction: 0.45cetic acid, 0.45 ethanol, and 0.10 water with piecewise refluxatio, discretized into 10 time intervals.
The results in terms of the maximum conversion and finalthyl acetate composition in the distillate for different vaporowrates (between 6 and 9 kmol/h) are given in Table 5 for thewo approaches. The EOA results in a system of 1051 equa-ions and 1062 variables. The optimization problem is solvedn 400 s when 10 finite elements and 3 collocation points aresed. To determine the initial values for the system we con-ider total reflux in the steady state. The CVP approach resultsn a system of 988 equations and 1040 variables. The opti-
ization problem is solved in 10 s. Both approaches involve different number of equations and variables and a signifi-ant difference in the computational times. In terms of energyonsumption in the reboiler, CVP results vary in less than 5%f the EOA solution, while conversion values are not signif-
cantly different between the two approaches. This could bexplained by studying the internal piecewise reflux ratio pro-les in Fig. 5.
We observe that the first 0.4 h of the batch processing timeorresponds to the startup period (total reflux operation). Thisime is needed to concentrate the distillate product beforeny product is withdrawn from the column. Thanks to this,he constraint of the ethyl acetate final composition (higherhan 0.5 in mole fraction) is achieved. After the startup periodnds, the CVP approach achieves a constant internal refluxatio value of 0.45, which means that distillate is withdrawns product into the accumulator. On the other hand, the EOA
olves a different set of profiles, higher than 0.45 for almostll vapor flowrates (lower values of 0.61). This will reduce theomposition of the ethyl acetate in the product.ig. 4 – Maximum profit reflux ratio and methanol composition phe EOA.
340.94 78,234.68
When EOA is used, the dimension of the dynamic modelincreases with the number of finite elements leading tolonger computational times. In order to estimate the impactof the discretization error and the suitable number of finiteelements, the optimization problem is solved for differentnumber of finite elements. For the batch reactive column,the optimization results for 5 and 15 finite elements are pre-sented in Table 10. The computational time when 15 finiteelements are used is 2400 s, while 5 finite elements takes 280 s.It is clear that cpu-time increases when the number of finiteelements increases. By comparing the results, we see thatthe number of finite elements will have an influence on theethanol conversion, reducing its value (59.48% with 10 finiteelements). Considering the computational time and for fur-ther comparison with other columns, 10 finite elements wereused.
In terms of design operation conditions, in Table 5we observe that the conversion is directly proportional toincreases on the vapor flowrate. In this column (and for bothapproaches) the conversion increases by 3% when workingwith the maximum vapor flowrate. This happens in bothapproaches. This will also increase the energy consumptionin the reboiler. At the beginning of the operation, the columnis filled with acetic acid and ethanol. As soon as the opera-tion starts, ethanol is consumed by the reaction in the reboileryielding a low concentration at the final time. The composi-tion profiles in the distillate and reboiler are shown in Fig. 6.Since there is very little (almost nothing) acetic acid at the topof the column, no forward reaction is possible (no ethyl acetateproduction). It can also be seen that there is some unreactedacetic acid and ethanol in the reboiler, being available for fur-ther reaction if more time in the process were available. Thecomposition profiles along the column can be seen in Fig. 7.
Table 6Changes of the concentration profiles are also reflected in
the temperature profiles in Fig. 8(a) for the two approaches.
rofiles in a batch column for 20 and 30 finite elements for
92 chemical engineering research and design 1 1 1 ( 2 0 1 6 ) 83–99
Table 5 – Maximum conversion optimal results in a batch reactive column for the production of ethyl acetate for the EOAand CVP approach.
Vapor (kmol/h) QREBtotal(MJ/h) XEtOH (conversion in %) xD
AcOEt(mole fraction)
(a) EOA approach when 10 finite elements and 3 collocation points are used6 235.25 58.60 0.5007 274.65 60.07 0.5018 313.18 59.33 0.5079 351.86 59.48 0.510
(b) CVP approach6 233.58 57.00 0.5187 271.87 57.61 0.5238 310.21 58.27 0.5269 348.46 58.99 0.527
Fig. 5 – Maximum conversion optimal reflux ratio optimal profiles in a batch reactive distillation column for the productionof ethyl acetate for the EOA and CVP approach.
Fig. 6 – Maximum conversion distillate and reboiler composition profiles in a batch reactive distillation column for theproduction ethyl acetate for the EOA and CVP approach.
chemical engineering research and design 1 1 1 ( 2 0 1 6 ) 83–99 93
Fig. 7 – Maximum conversion liquid composition along the column in a batch reactive distillation column for the productionof ethyl acetate for the EOA approach.
Table 6 – Maximum conversion results in a batch reactive column when 5 and 10 finite elements are used in the EOA.
Vapor (kmol/h) 5 finite elements 15 finite elements
QREBtotal(kJ/h) Profit ($/year) QREBtotal
(kJ/h) Profit ($/year)
6 235.18 58.70 Infeasible7 273.22 58.42 273.26 56.448 312.73 58.46 312.58 58.41
Tpv3pbteattEtovrl
Fs
9 351.34 58.51
he reboiler and distillate temperatures start at a high tem-erature, and then decrease until both reach a constantalue (reboiler EOA/CVP: 352/355 K, and condenser EOA/CVP:43/344 K). The initial decrease in temperature is due to theresence of ethyl acetate (minimum boiling point) producedy reaction. However, as the separation of ethyl acetate con-inues, CVP reboiler temperature starts increasing (due to thevaporation/separation of ethyl acetate and the increasingmount of water formed by reaction) while EOA tempera-ure decreases due to a higher amount of ethyl acetate inhe reboiler. Also, a temperature change was observed for theOA, caused by a sudden change on the reflux ratio. Sincehere is not enough water and acetic acid, the temperaturen the distillate starts decreasing until it reaches a constant
alue. The boiling point of ethanol is reached around 0.1 h,eason why the highest ethanol composition in the distil-ate is observed in Fig. 6. After this temperature is reached,ig. 8 – Maximum conversion reboiler and distillate temperatureystem for the production of ethyl acetate.
351.26 58.60
the separation of ethyl acetate starts and the temperaturedecreases until a constant value below ethyl acetate boil-ing point is achieved. Due to the similar boiling points ofethyl acetate and ethanol, this separation is difficult: multipleazeotropes are found that may prevent obtaining high purityethyl acetate. The phase equilibria diagram in Fig. 8(b) revealsthat this quaternary reactive system presents three mini-mum boiling azeotropes and one minimum boiling ternaryazeotrope:
(1) Homogeneous azeotrope EtOH/EtAc/H2O: 343.65 K(0.1812/0.5371/0.2818)
(2) Heterogeneous azeotrope EtAc/H2O: 344.14 K
(0.5982/0.4018)(3) Homogeneous azeotrope EtOH/EtAc: 344.96 K(0.4467/0.5533)
profiles for the EOA and azeotropes in the quaternary
94 chemical engineering research and design 1 1 1 ( 2 0 1 6 ) 83–99
Table 7 – Maximum profit results in a dividing wall batch column for EOA and CVP approach.
Vapor (kmol/h) QREBtotal(MJ/h) D (kmol) Profit ($/year)
(a) EOA approach when 10 finite elements and 3 collocation points are used6 225.89 0.73 14,371.667 263.83 0.92 37,212.488 301.41 1.06 57,008.339 337.17 1.17 73,617.29
(b) CVP approach6 231.74 0.75 10,883.427 269.92 0.92 35,710.148 308.06 1.05 53,365.92
9 346.03(4) Heterogeneous azeotrope EtOH/H2O: 351.30 K(0.8952/0.1048)
From the list of azeotropes we observe that the ternaryazeotrope 1 has the lowest temperature (343.65 K). When mostof the acid is consumed in the reactive stages of the col-umn, the separation ends when the EtOH/EtAc azeotrope (3)is present at the top of the column (344.96 K). Due to this, thefinal composition in the distillate of ethyl acetate is not higherthan the azeotrope composition (0.598 of ethyl acetate in molefraction).
6.2. Nonconventional dividing wall batch distillationcolumn
In order to compare the two discretization approaches for thesolution of large systems of equations and to demonstratepossible benefits of dividing wall columns in batch separa-tions, the solution of a nonconventional dividing wall batchcolumn with and without reaction is presented in this sec-tion. The optimization problem is solved by discretizing thedifferential equations using the two approaches presented inSection 4 with the next specifications: CVP approach imple-mented in gPROMS (3.7.1) using SQP as the NLP solver, and EOAimplemented in GAMS (24.2.2) using IPOPT as the NLP solverusing 10 finite elements and 3 collocation points. To studypotential benefits on the use of dividing walls in distillationprocesses, the two conventional batch distillation columns inSection 6.1 are taken as a reference for a comparison with thisnew nonconventional batch configuration. For all the cases, afixed batch time of 1 h is used.
6.2.1. Nonreactive case studyThe nonreactive model is obtained by removing the reactionterms in the dynamic model in Eqs. (16)–(39). The separationis carried out in a 10 stage DWBDC with a feed of 10 kmol ofa quaternary mixture (methanol, ethanol, n-propanol, and n-butanol) to the reboiler with the following concentration inmole fraction: 0.25 methanol, 0.25 ethanol, 0.25 n-propanol,and 0.25 n-butanol. The objective is to maximize a profit func-tion (given in Eq. (2)) using the reflux ratio RR(t) as controlvariable until a concentration of at least 0.90 in mole frac-tion of methanol is achieved in the distillate. The prices usedto solve the optimization problem were given in Section 6.1.1.The EOA results in a system of 394 equations and 434 variables.The optimization problem is solved in 27 s and the results arepresented in Table 7(a) when 10 finite elements and 3 colloca-
tion points are used. The CVP approach results in a system of354 equations and 427 variables. The optimization problem issolved in 12 s and the results are presented in Table 7(b). As in1.19 71,429.92
the conventional BDC, both approaches show that the maxi-mum profit is achieved when V = 9 kmol/h, increasing also theenergy consumption.
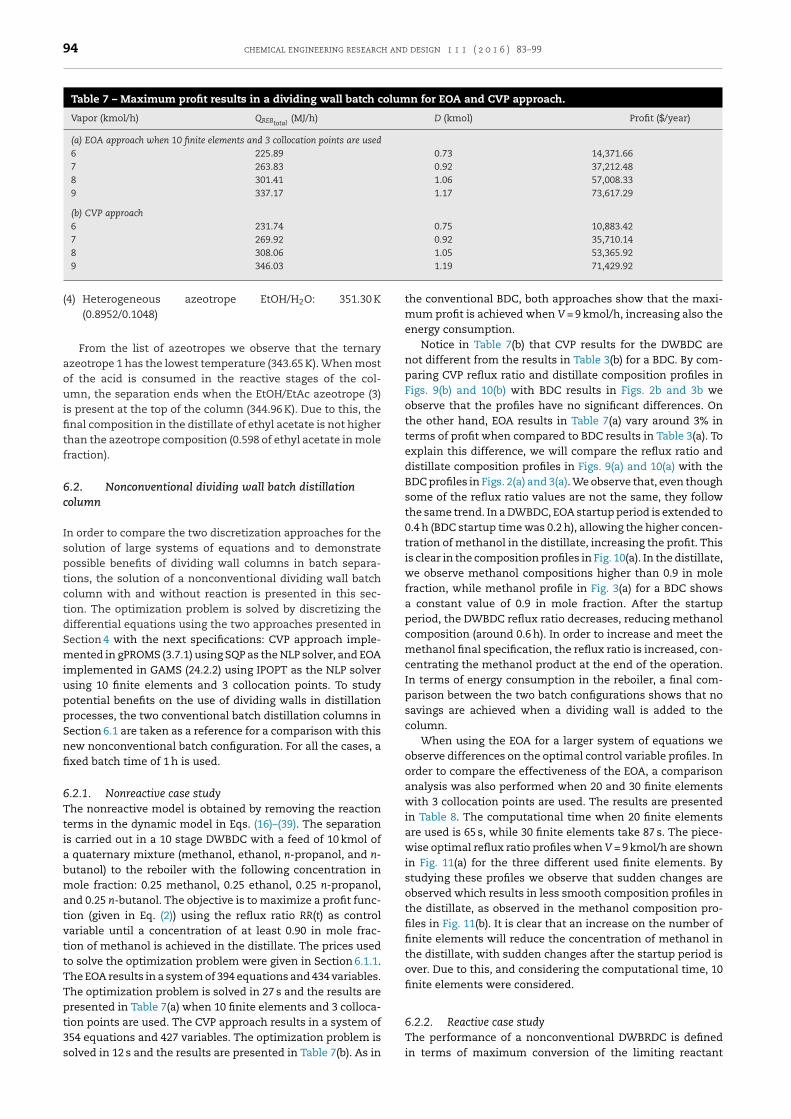
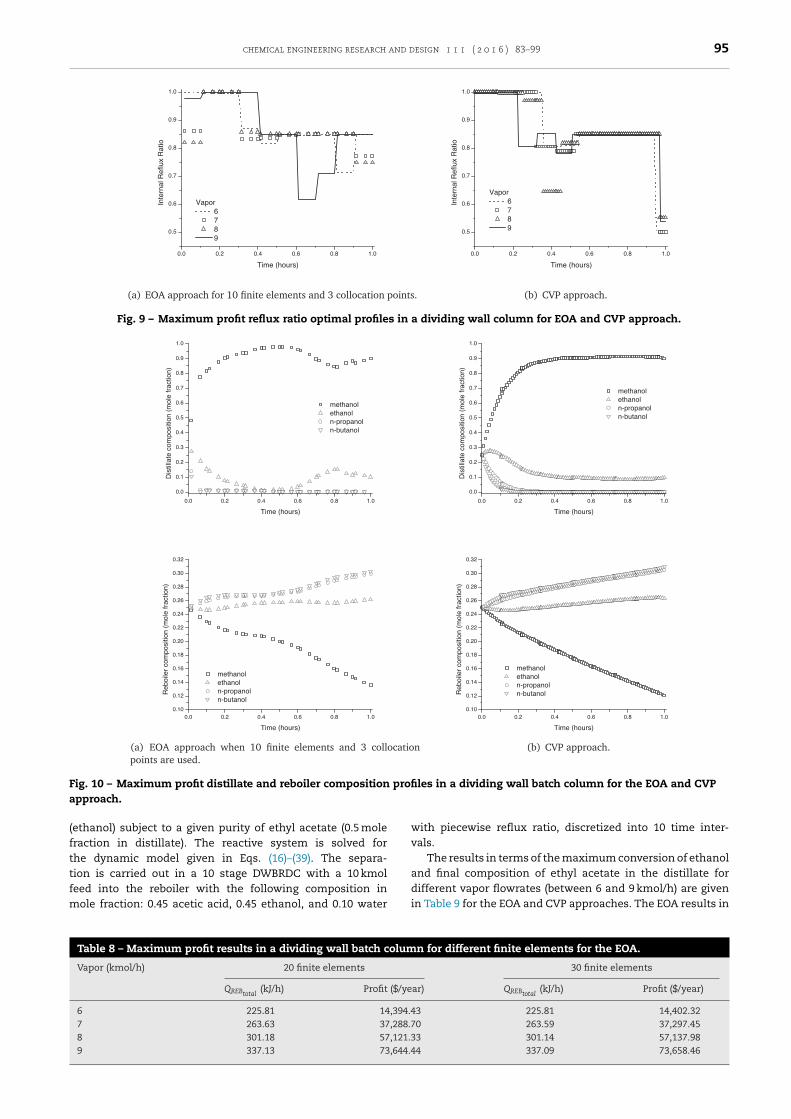
Notice in Table 7(b) that CVP results for the DWBDC arenot different from the results in Table 3(b) for a BDC. By com-paring CVP reflux ratio and distillate composition profiles inFigs. 9(b) and 10(b) with BDC results in Figs. 2b and 3b weobserve that the profiles have no significant differences. Onthe other hand, EOA results in Table 7(a) vary around 3% interms of profit when compared to BDC results in Table 3(a). Toexplain this difference, we will compare the reflux ratio anddistillate composition profiles in Figs. 9(a) and 10(a) with theBDC profiles in Figs. 2(a) and 3(a). We observe that, even thoughsome of the reflux ratio values are not the same, they followthe same trend. In a DWBDC, EOA startup period is extended to0.4 h (BDC startup time was 0.2 h), allowing the higher concen-tration of methanol in the distillate, increasing the profit. Thisis clear in the composition profiles in Fig. 10(a). In the distillate,we observe methanol compositions higher than 0.9 in molefraction, while methanol profile in Fig. 3(a) for a BDC showsa constant value of 0.9 in mole fraction. After the startupperiod, the DWBDC reflux ratio decreases, reducing methanolcomposition (around 0.6 h). In order to increase and meet themethanol final specification, the reflux ratio is increased, con-centrating the methanol product at the end of the operation.In terms of energy consumption in the reboiler, a final com-parison between the two batch configurations shows that nosavings are achieved when a dividing wall is added to thecolumn.
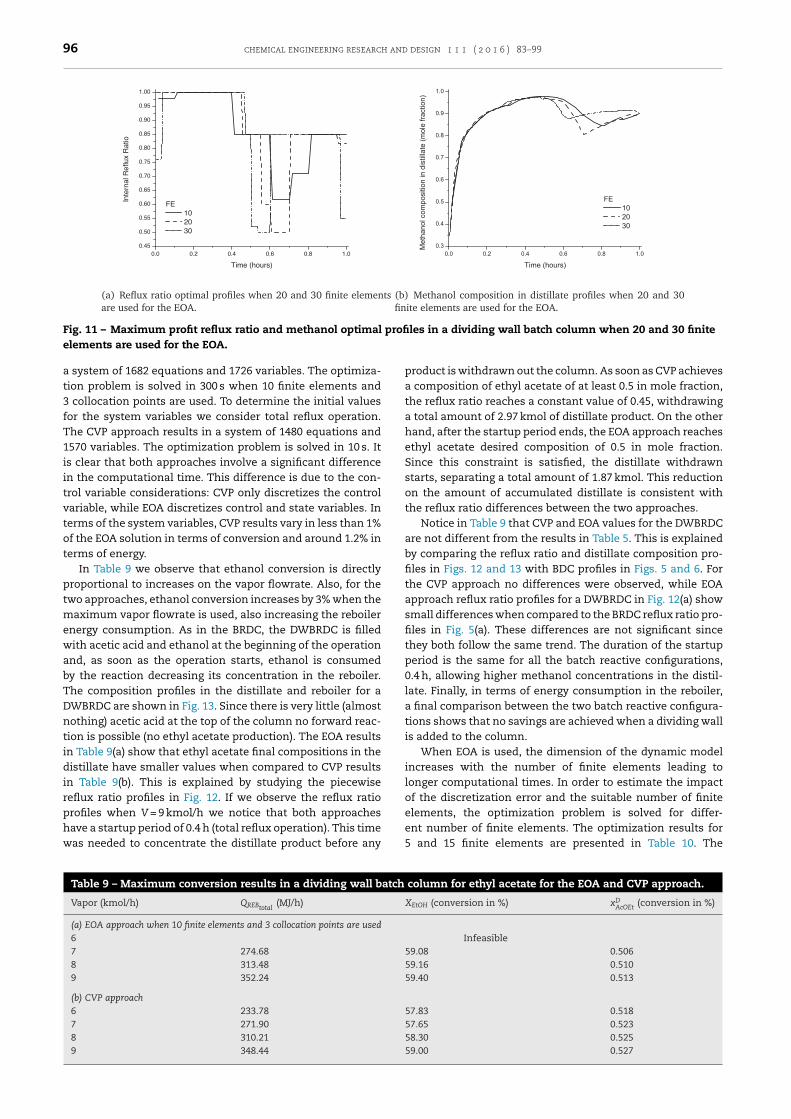
When using the EOA for a larger system of equations weobserve differences on the optimal control variable profiles. Inorder to compare the effectiveness of the EOA, a comparisonanalysis was also performed when 20 and 30 finite elementswith 3 collocation points are used. The results are presentedin Table 8. The computational time when 20 finite elementsare used is 65 s, while 30 finite elements take 87 s. The piece-wise optimal reflux ratio profiles when V = 9 kmol/h are shownin Fig. 11(a) for the three different used finite elements. Bystudying these profiles we observe that sudden changes areobserved which results in less smooth composition profiles inthe distillate, as observed in the methanol composition pro-files in Fig. 11(b). It is clear that an increase on the number offinite elements will reduce the concentration of methanol inthe distillate, with sudden changes after the startup period isover. Due to this, and considering the computational time, 10finite elements were considered.
6.2.2. Reactive case studyThe performance of a nonconventional DWBRDC is definedin terms of maximum conversion of the limiting reactant
chemical engineering research and design 1 1 1 ( 2 0 1 6 ) 83–99 95
Fig. 9 – Maximum profit reflux ratio optimal profiles in a dividing wall column for EOA and CVP approach.
F profia
(fttfm
ig. 10 – Maximum profit distillate and reboiler compositionpproach.
ethanol) subject to a given purity of ethyl acetate (0.5 moleraction in distillate). The reactive system is solved forhe dynamic model given in Eqs. (16)–(39). The separa-ion is carried out in a 10 stage DWBRDC with a 10 kmol
eed into the reboiler with the following composition inole fraction: 0.45 acetic acid, 0.45 ethanol, and 0.10 water
Table 8 – Maximum profit results in a dividing wall batch colum
Vapor (kmol/h) 20 finite elements
QREBtotal(kJ/h) Profit ($/ye
6 225.81 14,394.47 263.63 37,288.78 301.18 57,121.39 337.13 73,644.4
les in a dividing wall batch column for the EOA and CVP
with piecewise reflux ratio, discretized into 10 time inter-vals.
The results in terms of the maximum conversion of ethanoland final composition of ethyl acetate in the distillate for
different vapor flowrates (between 6 and 9 kmol/h) are givenin Table 9 for the EOA and CVP approaches. The EOA results inn for different finite elements for the EOA.
30 finite elements
ar) QREBtotal(kJ/h) Profit ($/year)
3 225.81 14,402.320 263.59 37,297.453 301.14 57,137.984 337.09 73,658.46
96 chemical engineering research and design 1 1 1 ( 2 0 1 6 ) 83–99
profi
Fig. 11 – Maximum profit reflux ratio and methanol optimalelements are used for the EOA.a system of 1682 equations and 1726 variables. The optimiza-tion problem is solved in 300 s when 10 finite elements and3 collocation points are used. To determine the initial valuesfor the system variables we consider total reflux operation.The CVP approach results in a system of 1480 equations and1570 variables. The optimization problem is solved in 10 s. Itis clear that both approaches involve a significant differencein the computational time. This difference is due to the con-trol variable considerations: CVP only discretizes the controlvariable, while EOA discretizes control and state variables. Interms of the system variables, CVP results vary in less than 1%of the EOA solution in terms of conversion and around 1.2% interms of energy.
In Table 9 we observe that ethanol conversion is directlyproportional to increases on the vapor flowrate. Also, for thetwo approaches, ethanol conversion increases by 3% when themaximum vapor flowrate is used, also increasing the reboilerenergy consumption. As in the BRDC, the DWBRDC is filledwith acetic acid and ethanol at the beginning of the operationand, as soon as the operation starts, ethanol is consumedby the reaction decreasing its concentration in the reboiler.The composition profiles in the distillate and reboiler for aDWBRDC are shown in Fig. 13. Since there is very little (almostnothing) acetic acid at the top of the column no forward reac-tion is possible (no ethyl acetate production). The EOA resultsin Table 9(a) show that ethyl acetate final compositions in thedistillate have smaller values when compared to CVP resultsin Table 9(b). This is explained by studying the piecewisereflux ratio profiles in Fig. 12. If we observe the reflux ratio
profiles when V = 9 kmol/h we notice that both approacheshave a startup period of 0.4 h (total reflux operation). This timewas needed to concentrate the distillate product before anyTable 9 – Maximum conversion results in a dividing wall batch
Vapor (kmol/h) QREBtotal(MJ/h)
(a) EOA approach when 10 finite elements and 3 collocation points are used6
7 274.68
8 313.48
9 352.24
(b) CVP approach6 233.78
7 271.90
8 310.21
9 348.44
les in a dividing wall batch column when 20 and 30 finite
product is withdrawn out the column. As soon as CVP achievesa composition of ethyl acetate of at least 0.5 in mole fraction,the reflux ratio reaches a constant value of 0.45, withdrawinga total amount of 2.97 kmol of distillate product. On the otherhand, after the startup period ends, the EOA approach reachesethyl acetate desired composition of 0.5 in mole fraction.Since this constraint is satisfied, the distillate withdrawnstarts, separating a total amount of 1.87 kmol. This reductionon the amount of accumulated distillate is consistent withthe reflux ratio differences between the two approaches.
Notice in Table 9 that CVP and EOA values for the DWBRDCare not different from the results in Table 5. This is explainedby comparing the reflux ratio and distillate composition pro-files in Figs. 12 and 13 with BDC profiles in Figs. 5 and 6. Forthe CVP approach no differences were observed, while EOAapproach reflux ratio profiles for a DWBRDC in Fig. 12(a) showsmall differences when compared to the BRDC reflux ratio pro-files in Fig. 5(a). These differences are not significant sincethey both follow the same trend. The duration of the startupperiod is the same for all the batch reactive configurations,0.4 h, allowing higher methanol concentrations in the distil-late. Finally, in terms of energy consumption in the reboiler,a final comparison between the two batch reactive configura-tions shows that no savings are achieved when a dividing wallis added to the column.
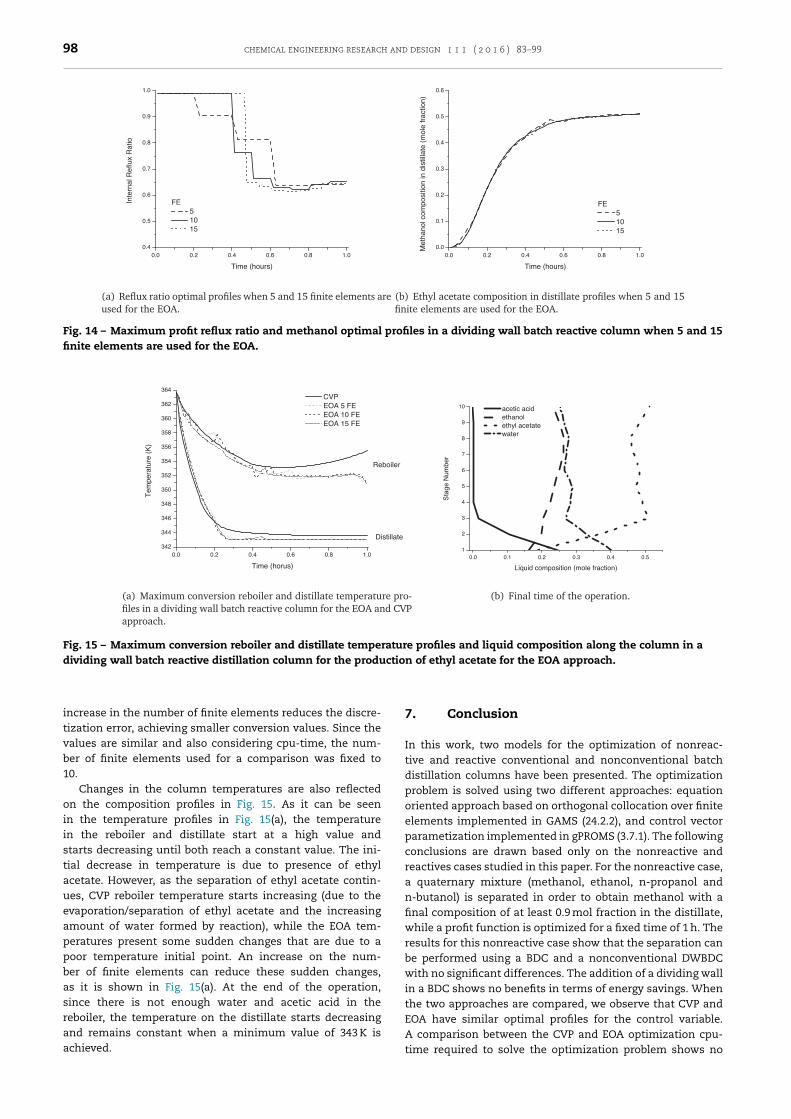
When EOA is used, the dimension of the dynamic modelincreases with the number of finite elements leading tolonger computational times. In order to estimate the impactof the discretization error and the suitable number of finite
elements, the optimization problem is solved for differ-ent number of finite elements. The optimization results for5 and 15 finite elements are presented in Table 10. Thecolumn for ethyl acetate for the EOA and CVP approach.
XEtOH (conversion in %) xDAcOEt
(conversion in %)
Infeasible59.08 0.50659.16 0.51059.40 0.513
57.83 0.51857.65 0.52358.30 0.52559.00 0.527
chemical engineering research and design 1 1 1 ( 2 0 1 6 ) 83–99 97
Fig. 12 – Maximum conversion optimal reflux ratio optimal profiles in a dividing wall batch reactive distillation column forthe production of ethyl acetate for the EOA and CVP approach.
F sitioc app
cwpc
ig. 13 – Maximum conversion distillate and reboiler compoolumn for the production ethyl acetate for the EOA and CVP
omputational time when 15 finite elements are used is 1400 s,hile 5 finite elements take 400 s. By studying the final com-
osition of ethyl acetate in the distillate in Fig. 14, it islear that an increase on the number of finite elements willTable 10 – Maximum conversion results in a dividing wall batchin the EOA.
Vapor (kmol/h) 5 finite elements
QREBtotal(kJ/h) Profit ($/ye
6 235.47 59.01
7 274.35 60.25
8 313.25 60.74
9 352.16 59.85
n profiles in a dividing wall batch reactive distillationroach.
not have a significant influence on ethyl acetate composi-tion in the distillate. This is due to the different piecewise
reflux ratio profiles for the three cases. The use of less than10 finite elements reduces ethanol conversion while andreactive column when 5 and 10 finite elements are used
15 finite elements
ar) QREBtotal(kJ/h) Profit ($/year)
235.66 57.98274.68 58.50313.44 58.73352.20 59.00
98 chemical engineering research and design 1 1 1 ( 2 0 1 6 ) 83–99
Fig. 14 – Maximum profit reflux ratio and methanol optimal profiles in a dividing wall batch reactive column when 5 and 15finite elements are used for the EOA.
Fig. 15 – Maximum conversion reboiler and distillate temperature profiles and liquid composition along the column in adividing wall batch reactive distillation column for the production of ethyl acetate for the EOA approach.
increase in the number of finite elements reduces the discre-tization error, achieving smaller conversion values. Since thevalues are similar and also considering cpu-time, the num-ber of finite elements used for a comparison was fixed to10.
Changes in the column temperatures are also reflectedon the composition profiles in Fig. 15. As it can be seenin the temperature profiles in Fig. 15(a), the temperaturein the reboiler and distillate start at a high value andstarts decreasing until both reach a constant value. The ini-tial decrease in temperature is due to presence of ethylacetate. However, as the separation of ethyl acetate contin-ues, CVP reboiler temperature starts increasing (due to theevaporation/separation of ethyl acetate and the increasingamount of water formed by reaction), while the EOA tem-peratures present some sudden changes that are due to apoor temperature initial point. An increase on the num-ber of finite elements can reduce these sudden changes,as it is shown in Fig. 15(a). At the end of the operation,since there is not enough water and acetic acid in the
reboiler, the temperature on the distillate starts decreasingand remains constant when a minimum value of 343 K isachieved.7. Conclusion
In this work, two models for the optimization of nonreac-tive and reactive conventional and nonconventional batchdistillation columns have been presented. The optimizationproblem is solved using two different approaches: equationoriented approach based on orthogonal collocation over finiteelements implemented in GAMS (24.2.2), and control vectorparametization implemented in gPROMS (3.7.1). The followingconclusions are drawn based only on the nonreactive andreactives cases studied in this paper. For the nonreactive case,a quaternary mixture (methanol, ethanol, n-propanol andn-butanol) is separated in order to obtain methanol with afinal composition of at least 0.9 mol fraction in the distillate,while a profit function is optimized for a fixed time of 1 h. Theresults for this nonreactive case show that the separation canbe performed using a BDC and a nonconventional DWBDCwith no significant differences. The addition of a dividing wallin a BDC shows no benefits in terms of energy savings. Whenthe two approaches are compared, we observe that CVP and
EOA have similar optimal profiles for the control variable.A comparison between the CVP and EOA optimization cpu-time required to solve the optimization problem shows no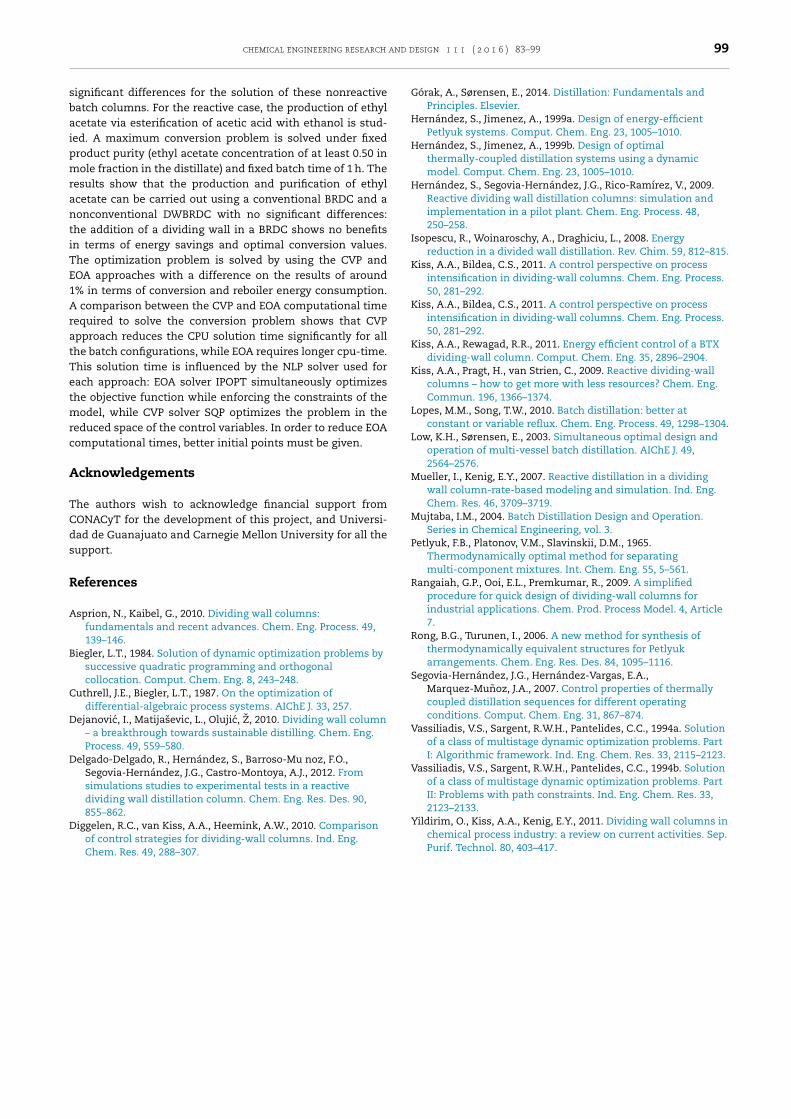
and d
sbaipmrantiTE1AratTetmrc
A
TCds
R
A
B
C
D
D
D
chemical engineering research
ignificant differences for the solution of these nonreactiveatch columns. For the reactive case, the production of ethylcetate via esterification of acetic acid with ethanol is stud-ed. A maximum conversion problem is solved under fixedroduct purity (ethyl acetate concentration of at least 0.50 inole fraction in the distillate) and fixed batch time of 1 h. The
esults show that the production and purification of ethylcetate can be carried out using a conventional BRDC and aonconventional DWBRDC with no significant differences:he addition of a dividing wall in a BRDC shows no benefitsn terms of energy savings and optimal conversion values.he optimization problem is solved by using the CVP andOA approaches with a difference on the results of around% in terms of conversion and reboiler energy consumption.
comparison between the CVP and EOA computational timeequired to solve the conversion problem shows that CVPpproach reduces the CPU solution time significantly for allhe batch configurations, while EOA requires longer cpu-time.his solution time is influenced by the NLP solver used forach approach: EOA solver IPOPT simultaneously optimizeshe objective function while enforcing the constraints of the
odel, while CVP solver SQP optimizes the problem in theeduced space of the control variables. In order to reduce EOAomputational times, better initial points must be given.
cknowledgements
he authors wish to acknowledge financial support fromONACyT for the development of this project, and Universi-ad de Guanajuato and Carnegie Mellon University for all theupport.
eferences
sprion, N., Kaibel, G., 2010. Dividing wall columns:fundamentals and recent advances. Chem. Eng. Process. 49,139–146.
iegler, L.T., 1984. Solution of dynamic optimization problems bysuccessive quadratic programming and orthogonalcollocation. Comput. Chem. Eng. 8, 243–248.
uthrell, J.E., Biegler, L.T., 1987. On the optimization ofdifferential-algebraic process systems. AIChE J. 33, 257.
ejanovic, I., Matijasevic, L., Olujic, Z, 2010. Dividing wall column– a breakthrough towards sustainable distilling. Chem. Eng.Process. 49, 559–580.
elgado-Delgado, R., Hernández, S., Barroso-Mu noz, F.O.,Segovia-Hernández, J.G., Castro-Montoya, A.J., 2012. Fromsimulations studies to experimental tests in a reactivedividing wall distillation column. Chem. Eng. Res. Des. 90,855–862.
iggelen, R.C., van Kiss, A.A., Heemink, A.W., 2010. Comparisonof control strategies for dividing-wall columns. Ind. Eng.Chem. Res. 49, 288–307.
esign 1 1 1 ( 2 0 1 6 ) 83–99 99
Górak, A., Sørensen, E., 2014. Distillation: Fundamentals andPrinciples. Elsevier.
Hernández, S., Jimenez, A., 1999a. Design of energy-efficientPetlyuk systems. Comput. Chem. Eng. 23, 1005–1010.
Hernández, S., Jimenez, A., 1999b. Design of optimalthermally-coupled distillation systems using a dynamicmodel. Comput. Chem. Eng. 23, 1005–1010.
Hernández, S., Segovia-Hernández, J.G., Rico-Ramírez, V., 2009.Reactive dividing wall distillation columns: simulation andimplementation in a pilot plant. Chem. Eng. Process. 48,250–258.
Isopescu, R., Woinaroschy, A., Draghiciu, L., 2008. Energyreduction in a divided wall distillation. Rev. Chim. 59, 812–815.
Kiss, A.A., Bildea, C.S., 2011. A control perspective on processintensification in dividing-wall columns. Chem. Eng. Process.50, 281–292.
Kiss, A.A., Bildea, C.S., 2011. A control perspective on processintensification in dividing-wall columns. Chem. Eng. Process.50, 281–292.
Kiss, A.A., Rewagad, R.R., 2011. Energy efficient control of a BTXdividing-wall column. Comput. Chem. Eng. 35, 2896–2904.
Kiss, A.A., Pragt, H., van Strien, C., 2009. Reactive dividing-wallcolumns – how to get more with less resources? Chem. Eng.Commun. 196, 1366–1374.
Lopes, M.M., Song, T.W., 2010. Batch distillation: better atconstant or variable reflux. Chem. Eng. Process. 49, 1298–1304.
Low, K.H., Sørensen, E., 2003. Simultaneous optimal design andoperation of multi-vessel batch distillation. AIChE J. 49,2564–2576.
Mueller, I., Kenig, E.Y., 2007. Reactive distillation in a dividingwall column-rate-based modeling and simulation. Ind. Eng.Chem. Res. 46, 3709–3719.
Mujtaba, I.M., 2004. Batch Distillation Design and Operation.Series in Chemical Engineering, vol. 3.
Petlyuk, F.B., Platonov, V.M., Slavinskii, D.M., 1965.Thermodynamically optimal method for separatingmulti-component mixtures. Int. Chem. Eng. 55, 5–561.
Rangaiah, G.P., Ooi, E.L., Premkumar, R., 2009. A simplifiedprocedure for quick design of dividing-wall columns forindustrial applications. Chem. Prod. Process Model. 4, Article7.
Rong, B.G., Turunen, I., 2006. A new method for synthesis ofthermodynamically equivalent structures for Petlyukarrangements. Chem. Eng. Res. Des. 84, 1095–1116.
Segovia-Hernández, J.G., Hernández-Vargas, E.A.,Marquez-Munoz, J.A., 2007. Control properties of thermallycoupled distillation sequences for different operatingconditions. Comput. Chem. Eng. 31, 867–874.
Vassiliadis, V.S., Sargent, R.W.H., Pantelides, C.C., 1994a. Solutionof a class of multistage dynamic optimization problems. PartI: Algorithmic framework. Ind. Eng. Chem. Res. 33, 2115–2123.
Vassiliadis, V.S., Sargent, R.W.H., Pantelides, C.C., 1994b. Solutionof a class of multistage dynamic optimization problems. PartII: Problems with path constraints. Ind. Eng. Chem. Res. 33,2123–2133.
Yildirim, O., Kiss, A.A., Kenig, E.Y., 2011. Dividing wall columns inchemical process industry: a review on current activities. Sep.Purif. Technol. 80, 403–417.