Embed Size (px)
Citation preview
University of Shendi
College of Graduate Studies and
Scientific Research
Chemical Characterization of Oils from
Some Sudanese Medicinal Plants and their
Biological Activity
By
Sumaia Hassan Idris Dafalla
B.Sc. (Hons) in Chemistry and Biology
Post Graduate Diploma in Chemistry
M.Sc. in Chemistry
A thesis Submitted in Fulfillment of the Requirements for the
Ph.D. Degree in Chemistry
Supervisor: Prof. Mohamed Abdel Karim Mohamed
Co-Supervisor: Dr. Hassan El-Amin Elkhidr
September, 2018

i
استهلال
لله الرحمن الرحيم بسم ا
:ال تعالىق
هَارَ فيِ الَّليلِ وَتُخْرجُ الْحيَّ ) هَارَ وتُولِجُ الن َّ تُولِجُ اْلَّليْلَ فِي الن َّ
(﴾72﴿مِنَ الْمَيِّتِ وَتُخْرِجُ اْلْمَيِتَ مِنَ اْلحَيِّ وَتَ رْزُقُ مَن تَشَآءُ بِغَيْرِ حِسَابِ
صدق الله العظيم
ل عمرانسورة ا

ii
DEDICATION
To:
The memory of my Parents, Brothers
and Sisters

iii
Acknowledgements
I would like to thank Almighty Allah for giving me health to complete this
work successfully. I am greatly indebted to Prof. Mohamed Abdel Karim,
for his keen interest, supervision, encouragement, support, and guidance
throughout this study. My sincere thanks to Dr. Hassan Alamein, for his
supervision. Thanks to my family for their continual support. Also my
thanks extended to laboratory staff of the Medicinal and Aromatic Plants
Research Institute, and to the University of Medicinal Science &
Technology lab technic for all facilities. Final my sincere thanks to my
friends and colleagues for their help and continuous encouragement.

iv
Abstract
The oils from Prosopis juliflora was analyzed by GC-MS. The GC-MS
spectrum of the studied oil revealed the presence of 24components
dominated by methyl-10-trans,12-cis-octadecadienoate (32.83%). Prosopis
juliflora oil showed significant activity against Staphylococcus aureus,
Escherichia coli and Bacillus subtilis, it also showed very good anti
candida potential. GC-MS analysis of Acacia seyal has revealed the
presence of 41 components dominated by 9,12-octadecadienoic acid (Z, Z),
methyl ester (31.18%). Acacia seyal oil showed significant activity against
all test bacteria, it also gave very good anti-candida potency. GC-MS
analysis of Solenostemma argel oil was conducted, it revealed the
presence of components dominated by 7-hexadecenal, (Z)-(18.23%).
Solenostemma argle oil which showed excellent activity against
Escherichia coli and Pseudomonas aeruginosa. The oil exhibited very good
activity against Staphylococcus aureus. It also showed good anti candida
potency. The GC-MS analysis of Coriandrumm Sativum oil revealed the
presence of 52 components dominated by 9-octadecenoic acid (Z)-, methyl
ester (61.60%).
GC-MS analysis of Medicago sativa oil was conducted. The GC-MS
analysis revealed the presence of 26 components dominated by methyl 10-
trans,12-cis-octadecadienoate (43.46%). Medicago sativa oil showed
moderate activity against Bacillus subtilis. However, it exhibited partial
activity against other test organisms. GC-MS analysis of Corchorus

v
olitorius showed the presence of 28 components dominated by 9,12-
octadecadienoic acid (z,z)-methyl ester (39.13%). GC-MS analysis of
Pimpinella ansium oil was conducted. The GC-MS analysis revealed the
presence of 49 dominated by 9-octadecenoic acid(Z)-, methyl ester
(41.47%). Pimpinella anisum oil showed excellent activity against
Staphyococcus aureus, Pseudomonas aeruginosa and Bacillus subtilis. It
was inactive against Escherichia coli and the fungus Candida albicans.
vi
مستخلص
اهمها مركب 42 حويي بينت أن زيت نبات المسكيت يف الكتلةط-الكروموتوغرافيا الغازية
,methyl 10-trans,12-cis-octadecadienoate (32.83%) قد اظهر الزيت المستخلص
وتوغرافيا الكروم. .Escherichia coli and Staphylococcus aureusكل من فاعلية ضد
مركب اهمها 24طيف الكتلة بينت ان زيت نبات الطلح يتكون من -الغازية
9,12-octadecadienoic acid (Z,Z), methyl ester (31.18%), اظهر الزيت
نبات الحرجل تحليل زيت .Candida albicansفاعلية ممتازة ضد البكتريا قيد الاختبار وفطر
,hexadecenal-7 .مركب اهمها 14وجود طيف الكتلة بين -بواسطة الكروموتوغرافيا الغازية
(Z)-(18.23%) اظهر زيت نبات الحرجل فاعلية ممتازة ضد كل منEscherichia coli
and Pseudomonas aeruginosa وفاعلية معتدلة ضدStaphylococcus aeruginosa .
مركب 24طيف الكتلة للزيت المستخلص من نبات الكسبرة بين وجود –الكروموتوغرافيا الغازية
تحليل الزيت المستخلص . octadecenoic acid(Z)-, methyl ester (61.60%)-9 اهمها
-methyl 10مكون اهمها 42بواسطة الكروموتوغرافيا الغازية اظهر وجود برسيم ال نباتمن
trans,12-cis-octadecadienoate (43.46%) اظهر المستخلص فاعلية متوسطة ضد
Bacillus subtilis التحليل بواسطة الكروموتوغرافيا .وفاعلية ضعيفة ضد المىكروبات الاخري–
-9,12مركب منها 42من نبات الملوخية اظهر طيف الكتلة للزيت المستخلص
octadecadienoic acid(Z,Z)-,methyl ester(39.13%) وقد ابدي نبات الملوخية فاعلية
تحليل الزيت المستخلص من نبات اليانسون بين وجود . Staphylococcus aureusضد
اظهر -octadecenoic acid(Z)-, methyl ester (41.48%), 9-9مركب اهمها 24
Bacillus subtilis, Staphylococcus aureus andالمستخلص فاعلية ممتازة ضد كل من
Pseudomonas ر فاعلية مع هولم يظEscherichia coli وفطرCandida albicans
vii
Table of Contents
Title Page N0
I ستهلالإ
Dedication ii
Acknowledgments iii
Abstract iv
vi مستخلص
Table of Contents vii
Table of Tables xi
Table of Figures xii
Chapter One
Introduction
1.1 General overview 1
1.2. Natural products 1
1.2.1 Tannins 2
1.2.2 Saponins 2
1.2.3 Steroids 3
1.2.4 Glycoside 4
1.2.5 Alkaloids 4
1.2.6 Flavonoids 4
1.2. Essential oil 6

viii
1.3 Chemistry of essential oils 7
1.4 Extraction of essential oils 9
1.4.1 Hydro-distillation 10
1.4.2 Vacuum distillation 10
1.4.3 Molecular distillation 10
1.4.4. Enfleurage 10
1.4.5 Solvent extraction 11
1.4.6 Gaseous extraction 12
1.5. Biological activities of essential oils 12
1.5.1 Antibacterial activity 12
1.5.2 Antioxidant activity 15
1.5.3. Cancer chemo protective activity 16
1.6. Quality control of essential oils 17
1.7 Medicinal and commercial uses of essential 18
1.7.1 Pharmaceuticals 18
1.7.2 Perfumery 18
1.7.3 Food industry 19
1.8 Storage of essential oils 19
1.9 Analysis of essential oils 20
1.9.1 Chromatography 20
1.9.2 Liquid chromatography 20
ix
1.9.3 Capillary electrophoresis- mass spectrometry 21
1.9.4 Gas chromatography-mass spectrometry 21
1.9.5 Mass spectrometry 23
1.10 The target plant species 23
1.10.1 Pimpinella anisum 23
1.10.2 Prosopis juliflora 26
1.10.3 Medicago sativa 28
1.10.4 Corchorus olitorius 30
1.10.5 Solenostemma argel 31
1.10.6 Acacia seyal 33
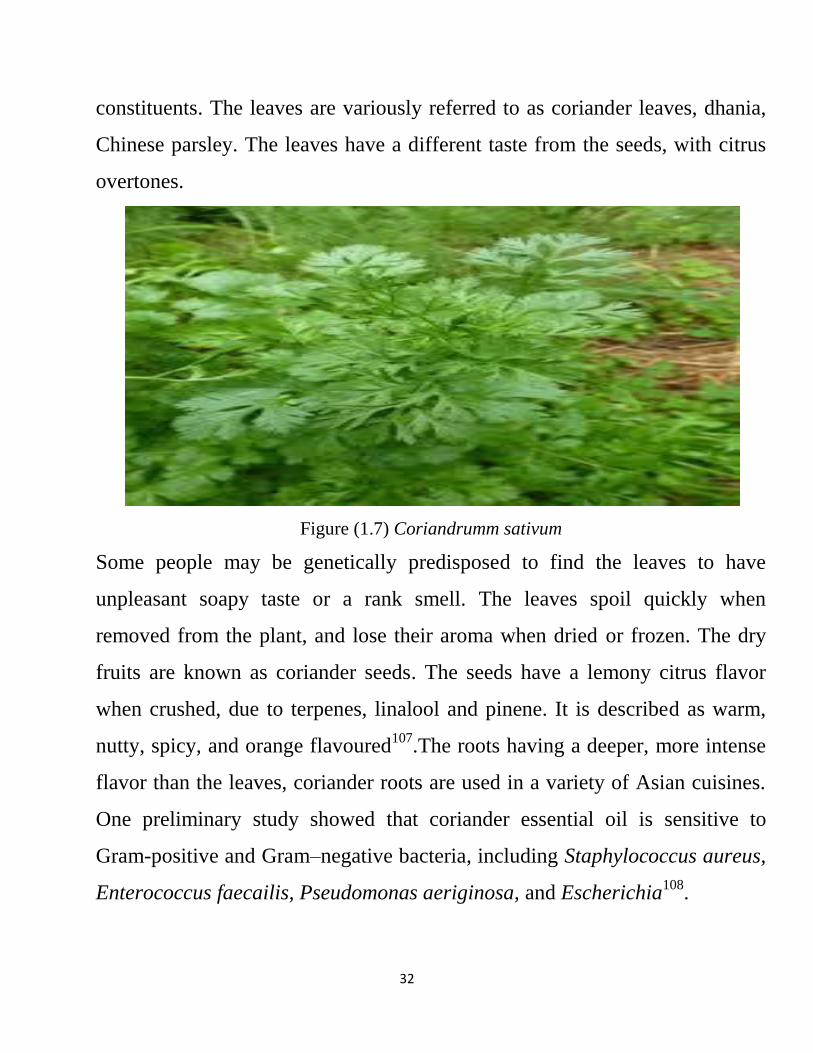
1.10.7 Coriandrum sativum 34
Chapter Two
Materials and Methods
2.1 Materials 37
2.1.1 Plant material 37
2.1.2 Instruments 37
2.1.3 Test organisms 37
2.2. Methods 38
2.2.1 Extraction of oil 38
2.2.2 GC-MS analysis 39
2.2.3 Antimicrobial test 40
2.2.3.1 Preparation of bacterial suspensions 40
x
2.2.3.2 Preparation of fungal suspensions 40
2.2.3.3 Testing for antibacterial activity 41
Chapter Three
Results and Discussion
3.1 GC-MS analysis 42
3.1.1 Prosopis juliflora 42
3.1.1.2 Constituents of oil 42
3.1.2 Acacia seyal 48
3.1.3 Solenostemma argel 49
3.1.4 Coriandrum sativum 57
3.1.5 Medicago sativa 57
3.1.6 Corchorus olitorius 64
3.1.7 Pimpinella anisum 65
3.2. Antimicrobial activity 65
3.2.1 Prosopis juliflora 70
3.2.2 Acacia seyal 75
3.2.3 Solenostemma argel 76
3.2.4 Medicago sativa 81
3.2.5 Corchorus olitorius 81
3.2.6 Pimpinella anisum 88
3.3 Conclusion, Recommendations 90
4 References 90
xi
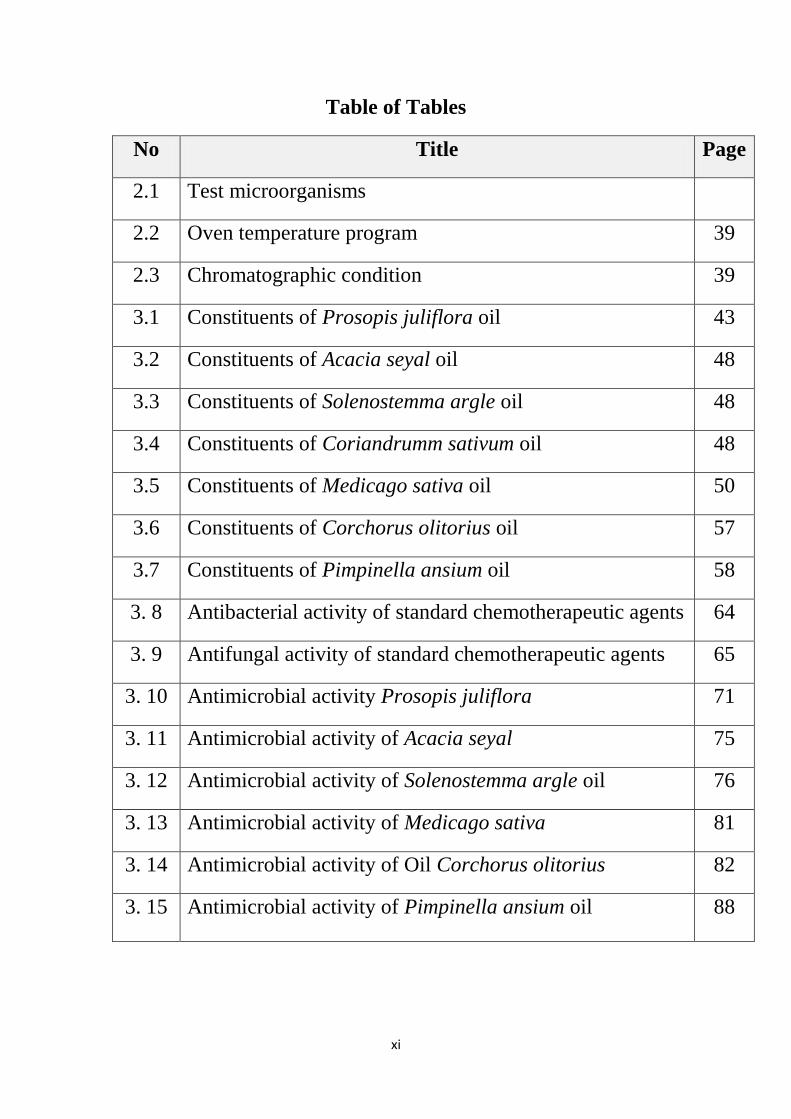
Table of Tables
No Title Page
2.1 Test microorganisms 8
2.2 Oven temperature program 39
2.3 Chromatographic condition 39
3.1 Constituents of Prosopis juliflora oil 43
3.2 Constituents of Acacia seyal oil 48
3.3 Constituents of Solenostemma argle oil 48
3.4 Constituents of Coriandrumm sativum oil 48
3.5 Constituents of Medicago sativa oil 50
3.6 Constituents of Corchorus olitorius oil 57
3.7 Constituents of Pimpinella ansium oil 58
3. 8 Antibacterial activity of standard chemotherapeutic agents 64
3. 9 Antifungal activity of standard chemotherapeutic agents 65
3. 10 Antimicrobial activity Prosopis juliflora 71
3. 11 Antimicrobial activity of Acacia seyal 75
3. 12 Antimicrobial activity of Solenostemma argle oil 76
3. 13 Antimicrobial activity of Medicago sativa 81
3. 14 Antimicrobial activity of Oil Corchorus olitorius 82
3. 15 Antimicrobial activity of Pimpinella ansium oil 88
xii
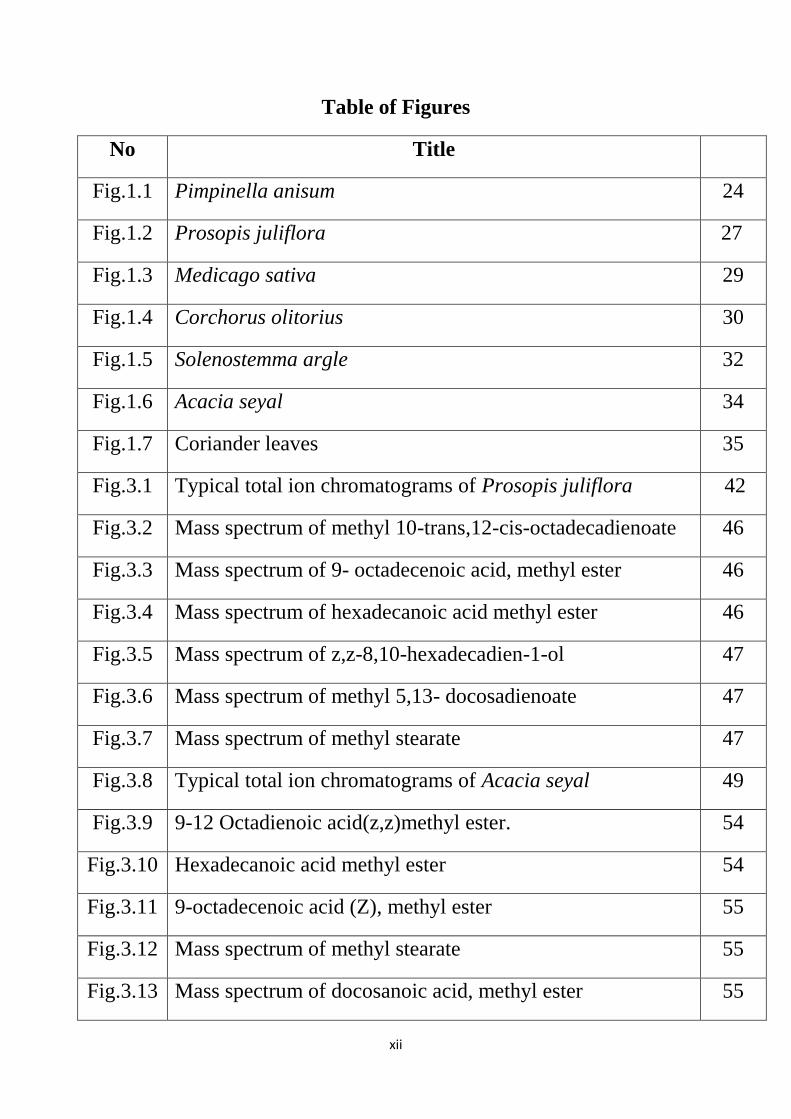
Table of Figures
No Title
Fig.1.1 Pimpinella anisum 24
Fig.1.2 Prosopis juliflora 27
Fig.1.3 Medicago sativa 29
Fig.1.4 Corchorus olitorius 30
Fig.1.5 Solenostemma argle 32
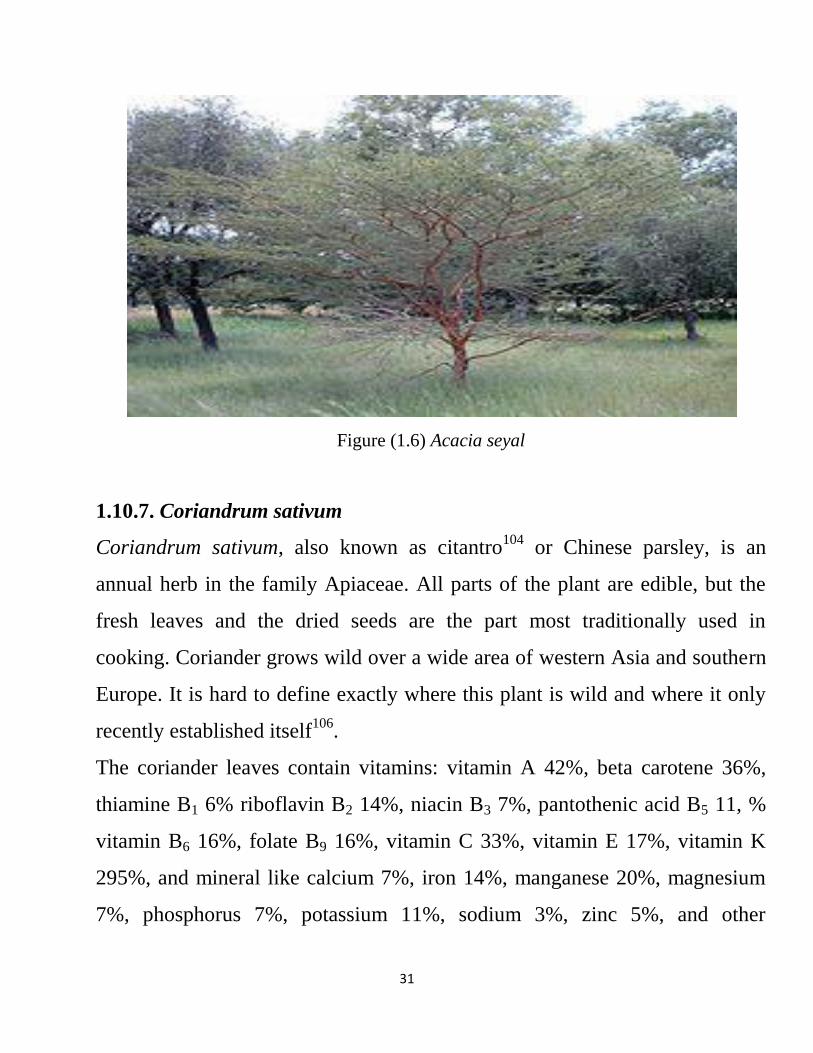
Fig.1.6 Acacia seyal 34
Fig.1.7 Coriander leaves 35
Fig.3.1 Typical total ion chromatograms of Prosopis juliflora 42
Fig.3.2 Mass spectrum of methyl 10-trans,12-cis-octadecadienoate 46
Fig.3.3 Mass spectrum of 9- octadecenoic acid, methyl ester 46
Fig.3.4 Mass spectrum of hexadecanoic acid methyl ester 46
Fig.3.5 Mass spectrum of z,z-8,10-hexadecadien-1-ol 47
Fig.3.6 Mass spectrum of methyl 5,13- docosadienoate 47
Fig.3.7 Mass spectrum of methyl stearate 47
Fig.3.8 Typical total ion chromatograms of Acacia seyal 49
Fig.3.9 9-12 Octadienoic acid(z,z)methyl ester. 54
Fig.3.10 Hexadecanoic acid methyl ester 54
Fig.3.11 9-octadecenoic acid (Z), methyl ester 55
Fig.3.12 Mass spectrum of methyl stearate 55
Fig.3.13 Mass spectrum of docosanoic acid, methyl ester 55
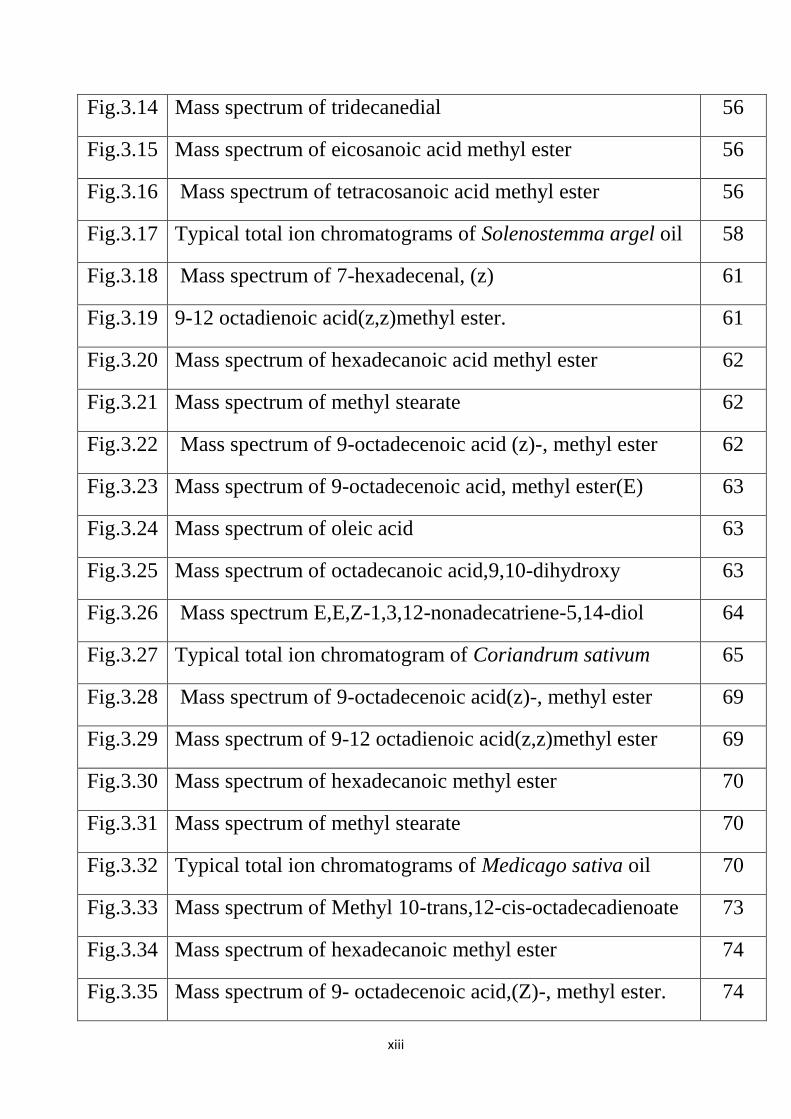
xiii
Fig.3.14 Mass spectrum of tridecanedial 56
Fig.3.15 Mass spectrum of eicosanoic acid methyl ester 56
Fig.3.16 Mass spectrum of tetracosanoic acid methyl ester 56
Fig.3.17 Typical total ion chromatograms of Solenostemma argel oil 58
Fig.3.18 Mass spectrum of 7-hexadecenal, (z) 61
Fig.3.19 9-12 octadienoic acid(z,z)methyl ester. 61
Fig.3.20 Mass spectrum of hexadecanoic acid methyl ester 62
Fig.3.21 Mass spectrum of methyl stearate 62
Fig.3.22 Mass spectrum of 9-octadecenoic acid (z)-, methyl ester 62
Fig.3.23 Mass spectrum of 9-octadecenoic acid, methyl ester(E) 63
Fig.3.24 Mass spectrum of oleic acid 63
Fig.3.25 Mass spectrum of octadecanoic acid,9,10-dihydroxy 63
Fig.3.26 Mass spectrum E,E,Z-1,3,12-nonadecatriene-5,14-diol 64
Fig.3.27 Typical total ion chromatogram of Coriandrum sativum 65
Fig.3.28 Mass spectrum of 9-octadecenoic acid(z)-, methyl ester 69
Fig.3.29 Mass spectrum of 9-12 octadienoic acid(z,z)methyl ester 69
Fig.3.30 Mass spectrum of hexadecanoic methyl ester 70
Fig.3.31 Mass spectrum of methyl stearate 70
Fig.3.32 Typical total ion chromatograms of Medicago sativa oil 70
Fig.3.33 Mass spectrum of Methyl 10-trans,12-cis-octadecadienoate 73
Fig.3.34 Mass spectrum of hexadecanoic methyl ester 74
Fig.3.35 Mass spectrum of 9- octadecenoic acid,(Z)-, methyl ester. 74

xiv
Fig.3.36 Mass spectrum of methyl stearate 74
Fig.3.37 Mass spectrum of methyl- 18- methyllnonadecanoate 75
Fig.3.38 total ion chromatograms of Corchorus olitorius 76
Fig.3.39 9.12 Octadecadienoic acid (z,z)methyl ester 79
Fig.3.40 Mass spectrum of hexadecanoic methyl ester 79
Fig.3.41 Mass spectrum 9,12,15-Octadecatrienoic acid, methyl ester 80
Fig.3.42 Mass spectrum of methyl stearate 80
Fig.3.43 Mass spectrum of 9-Octadecenoic acid, methyl ester, (E) 80
Fig.3.44 total ion chromatograms of Pimpinella anisum 82
Fig.3.45 Mass spectrum 2 9-octadecenoic acid (Z), methyl ester 86
Fig.3.46 Mass spectrum of apiol 86
Fig.3.47 9-12 Octadienoic acid(z,z)methyl ester 87
Fig.3.48 Mass spectrum of hexadecanoic acid methyl ester. 87
Fig.3.49 Mass spectrum of D-carvone 87
Fig.3.50 Mass spectrum of methyl stearate 88

1
1. Introduction
1.1-General overview
In developing countries, where modern medicine is beyond affordability,
medicinal plants play an important role in treating a wide array of human
disorders. A considerable number of modern drugs have been isolated or
derived from plant material1,3
examples include: atropine, morphin, cocain,
etc. More than 80% of the world population now depend on medicinal plants
which contribute to the primary healthcare of different communities4, 6
. This is
mainly due to the side effects of several synthetic drugs and the unaffordable
cost of modern drugs. Medicinal plants include bioactive constituents
(steroids, alkaloids, flavonoids. etc) which are very helpful in treating various
ailments7and may serve as leads for drug discovery and drug development.
1.2. Natural products
A natural product is a chemical compound or substance produced by a living
organism that is, found in nature. In the broadest sense, natural products
include any substance produced by life. Natural products can also be prepared
by chemical synthesis (both semi-synthesis and total synthesis) and have
played a central role in the development of the field of organic chemistry by
providing challenging synthetic targets. The term natural product has also
been extended for commercial purposes to refer to cosmetics, dietary
supplements, and foods produced from natural sources without added artificial
ingredients1.
2
1.2.1. Tannins
The tannin compounds are widely distributed in many species of plants, where
they play a role in protection from predation, and perhaps also as pesticides,
and in plant growth regulation. The astringency from the tannins is what
causes the dry and puckery feeling in the mouth following the consumption of
un ripened fruit or tea. Likewise, the destruction or modification of tannins
with time plays an important role in the ripening of fruits. Tannins have
molecular weights ranging from 500 to over 3,000 (garllic acid esters) and up
to 20,000 (proanthocyanidins)1.
1.2.2. Saponins
Saponins are a class of chemical compounds found in particular abundance in
various plant species. More specifically, they are amphipathic glycosides
grouped phenomenologically by the soap-like foaming they produce when
shaken in aqueous solutions, and structurally by having one or more
hydrophilic glycoside moieties combined with a lipophilic triterpene
derivative1.
The aglycone (glycoside-free) portions of the saponins are termed sapogenins.
The number of saccharide chains attached to the sapogenin/aglycone core can
vary - giving rise to another dimension of nomenclature (monodesmosidic,
bidesmosidic, etc.) - as can the length of each chain. A somewhat dated
compilation has the range of saccharide chain lengths being 1-11, with the
numbers 2-5 being the most frequent, and with both linear and branched chain
saccharides being represented. Dietary monosaccharides such as D-glucose
3
and D-galactose are among the most common components of the attached
chains1.
1.2.3. Steroids
Steroids comprise a group of cyclic organic compounds whose most common
characteristic is an arrangement of seventeen carbon atoms in a four-ring
structure, where the rings are three composed of 6-carbons (rings A, B, and C)
followed by one with 5-carbons (ring D). Further common features are an 8-
carbon side chain attached to a carbon on ring D, and two or more methyl
groups at the points where adjacent rings are "fused". Hundreds of distinct
steroids are found in animals, fungi, plants, and elsewhere, and specific
steroids underlie proper structure and function in many biological processes.
Their core tetracyclic ring structure is synthesized in each organism by
biochemical pathways that involve cyclization of a thirty-carbon chain,
squalene, into an intermediate, either lanosterol or cycloartenol. From such
intermediates, organisms then derive critical steroids such as cholesterol, the
sex hormones estradiol and testosterone and bile acids. Based on such
structures, synthetic and medicinal chemists synthesize novel steroids for use
as drugs such as the anti-inflammatory agent dexamethasone1.
1.2.4. Glycoside
In chemistry, a glycoside is a molecule in which a sugar is bound to another
functional group via a glycosidic bond. Glycosides play numerous important
roles in living organisms. Many plants store chemicals in the form of inactive
glycosides. These can be activated by enzyme hydrolysis, which causes the
4
sugar part to be broken off, making the chemical available for use. Many such
plant glycosides are used as medications. In animals and humans, poisons are
often bound to sugar molecules as part of their elimination from the body2.
1.2.5. Alkaloids
Alkaloids are a group of naturally occurring chemical compounds that contain
mostly basic nitrogen atoms. This group also includes some related
compounds with neutral and even weakly acidic properties. Some synthetic
compounds of similar structure are also termed alkaloids. In addition to
carbon, hydrogen and nitrogen, alkaloids may also contain oxygen, sulfur and,
more rarely, other elements such as chlorine, bromine, and phosphorus1.
1.2.6. Flavonoids
Flavonoids are the low molecular weight polyphenolic secondary metabolic
compounds, universally distributed in green plant kingdom, located in cell
vacuoles. Flavonoids play a variety of biological activities in plants, animals,
and bacteria. In plants, flavonoids have long been known to be synthesized in
particular sites and are responsible for color and aroma of flowers, fruit to
attract pollinators consequently fruit dispersion; help in seed germination,
growth and development of seedling. Flavonoids protect plants from different
biotic and abiotic stresses and act as unique UV-filter, Function as signal
molecules, allelopathic compounds, phytoalexins, detoxifying agents,
antimicrobial defensive compounds. Flavonoids have roles against frost
hardiness, drought resistance and may play a functional role in plant heat
acclimation and freezing tolerance 1.
5
Flavonoids form a family of known natural products present in most of the
plant families. More than 8000 different flavonoids have been isolated from
their natural source to date. The structural variations of these flavonoids are
associated with many different biological and pharmacological activities,
including anticancer activity, protection against cancer formation (chemo-
protection), antioxidant activity, cardiovascular and hepatic protection,
antibacterial, antifungal and antiviral activity. Flavonoids have also been
reported to play an important role in hormone-related female diseases, such as
breast cancer and menopausal syndrome. Natural flavonoids have therefore
been subjected to many chemical modifications in order to improve their
activity 2.
1.2.7. Essential oil
The essential oil is the product obtained from a vegetable raw material, either
by steam distillation or by mechanical processes from the epicarp of Citrus, or
‘’dry’’ distillation. The essential oil is usually separated from the aqueous
phase by physical means8. This definition encompasses products obtained
always from a vegetable raw material, but using other extraction methods,
such as using non-aqueous solvents or cold absorption, thus we can define
four type of product9.
Essential oils are soluble in alcohol, ether, and fixed oils but insoluble in
water. The volatile oils are generally liquid and color less at room
temperature. They have a characteristic odor and are usually liquid at room
6
temperature and have a density less than unity, with the exception of a few
cases (cinnamon, sassafras and vetiver)
Essential oils possess a refractive index and a very high optical activity. Those
volatile oils contained in herbs are responsible for different scents that plants
emit. They are widely used in the cosmetics industry, perfumery, and also
aromatherapy. The latter is intended as a therapeutic technique including
massage, inhalation, or baths using these volatile oils, last key will serve as a
chemical signal allowing the plant to control to regulates environment
attraction of pollinating insect, repellent to predator inhibition of seeds
germination or communications between plants moreover essential oils
possesses anti fungi or insecticide and deterrent activities. All parts of
aromatic plants may contain essential oils. They exist in flowers including:
orange, pink, lavender, and the clove buds. They also occur in leaves
including: eucalyputs, mint, thyme, bay leaf, savory, sage, pine needle, and
tree underground organs root vetiver. Plant rhizomes like ginger contain
essential oils. The seed of many plant species like carvi are known to contain
essential oils. Fruits like fruits of fenel and anise do possess essential oils.
Essential oils may also be found in wood and bark examples include
cinnamon, and sandal wood.
1.3. Chemistry of essential oils
Essential oils are produced by various differentiated structure, especially the
number and characteristics of which are highly variable. Essential oils are
localized in the cytoplasm of certain plant cells secretions which lies in one or

7
more organs of the plant, namely, the secretly hair or tri chomes, epidermal
cells, internal secretly, and the secretly pockets. These oils are complex
mixture that may contain over 300 different compounds 8.
They consist of organic volatile compounds, generally of low molecular
weight below 300.The vapor pressure of essential oils at atmospheric pressure
and at room temperature is sufficiently high so that they are found partly in
vapor state10,11
. These volatile compounds belong to various chemical classes
like alcohols, ethers, oxides, aldehydes, ketones, esters, amines, amides,
phenols, heterocycles, and mainly the terpenes. Alcohol, eldehyds and ketones
offer a wide variety of aromatic notes such as fruity (nerolidol) floral,
(linalool) citrus (limonene) herbal (selinene). Furthermore, essential oils
components belong mainly to the terpene family. Many thousands of
compound belonging to the family terpenes have so far identified in essential
oils 12
.
It is known that terpenoids and phenyl propanoids have different primary
metabolic precursors and are generated through different biosynthetic routes.
The pathways involved in terpenoids are the mevalonate and mevalonate
_independent (deoxyxylulose phosphate) pathways, where phenyl propanoids
originate through the Shikmate pathway. Some authors have reviewed the
biosynthetic pathways of terperoidss and phenylpropanoids13,14
. The essential
oils have a diverse composition, both in qualitative and quantitative terms and
various factors are responsible for this variability and can be grouped into two
categories:
8
- Intrinsic factors related to interaction with environment (soil type and
climate) and the maturity of the plant concerned.
- Extrinsic factors such as the extraction method and the environment.
The factors that determine essential oil composition are numerous. In some
case it is difficult to isolate these factors from each other as they are
interrelated and influence each other. Such parameters include the seasonal
variations, plant organ, degree of maturity of the plant, geographic origin and
genetics15,16
.
1.4. Extraction of essential oils
1.4.1. Steam distillation
Steam distillation is a special type of distillation for temperature- sensitive
material like natural aromatic compounds. Once it has been a popular
laboratory method for purification of organic compounds, but has become
obsolete after emergence of vacuum distillation. However, steam distillation
remains important in certain industrial sectors17
.
In steam distillation, water or steam is introduced into the distillation
apparatus. The water vapor carries small amounts of the vaporized compounds
to the condensation flask, where the condensed liquid phase separate, allowing
for easy collection. This process effectively allows for distillation at lower
temperature, reducing the deterioration of the desire product, if the substances
to be distilled are very sensitive to heat, steam distillation may be applied
under reducing the operating temperature further. After distillation, the vapors
are condensed. Usually the immediate product is two phase system of water

9
and organic distillate allowing for separation of the compounds by
decantation, partitioning or other suitable methods18
.
Steam distillation is also widely used in petroleum refineries and
petrochemical plant where it is commonly referred to as steam stripping19,20
.
Also steam distillation is an important process for the separating fatty acids
from a matrix and for treating crude products such as tall oils to extract and
separate soaps and other commercially important organic compounds21
.
1.4.1.1. Hydrodistillation
Hydrodistillation is the most common at it is simple and temperature in the
body is raised by direct firing often using spent residues as fuel. Here oil
quality is directly related to the skill of the operator, not only in managing the
still but in selecting or preparing the raw material.
1.4.1.2. Vacuum distillation
The technique of vacuum distillation allows very accurate control of distillate
since it can be adjusted according to the boiling points of various oil
constituents.
1.4.1.3. Molecular distillation
This technique processes material under a high vacuum and can be used on
raw material or to reprocess crude or other oils. Products obtained by this
technique are of vary high quality and odor.
1.4.1.4. Enfleurage
This method of extraction is suitable for extracting flower oils by absorption
on a matrix of wax or fat and then recovering the oil by solvent extraction,
10
Layers of flowers are laid on trays of specially prepared fat and the flower
layers removed and renewed until fat is saturated. However, this process is
highly labor intensive, but products are of extremely high quality.
1.4.2. Solvent extraction
Extraction via this technique involves passing a solvent through the raw
material and then evaporating the solvent. It can take place under normal
atmospheric condition, in a partial vacuum or in the presence of gas.
Commercial plants used batch, battery or continuous flow system, single or
multi-solvent techniques, and include solvent recovery and oil refining
equipment. These plants are generally expensive to construct and operate and
are frequently located in developed countries using dried material. Since
solvent extraction removes volatile and non-volatile constituents, composition
of the oil obtained can differ significantly from distilled oil, and may contain
undesirable components requiring removal. The solvent used frequently
influences the oil obtained as a residue or odor moderate, but solvent extracted
oils are generally considered to reflect a plants natural odor more accurately
than distilled oils. Commonly used is petroleum ether, hexane, toluene or
other binary solvents.
1.4.3. Gaseous extraction
Liquid carbon dioxide, which is under pressure and regulated temperature, is
passed through the material, then via a separator to recover oil and gas.
However, gaseous extraction is considered superior to liquid solvent, since it
preserves important heat -sensitive components and requires less energy.
11
Beside that, carbon dioxide is safe, non-combustible, odorless, tasteless,
inexpensive and readily available which are ideal properties for an extraction
solvent, while its low viscosity anable to penetrate the material being
extracted and its latent heat of evaporation allows it to be removed without
residue 22
.
1.5. Biological activities of essential oils
1.5.1. Antibacterial activity
The antimicrobial properties of many essential oils have been reviewed and
the mechanism of action has been studied25.
An important feature of essential
oils are their hydrophobicity, which allows them to partition into lipids of the
cell membrane of bacteria, disrupting the structure, and making it more
permeable26,27
.This can then cause leakage of ions and other cellular
molecules28,29
.Although a certain amount of leakage of bacterial cells can be
tolerated without loss of viability, greater loss of cell contents or critical
output of molecules and ions can lead to cell death30
.
Essential oils can have a single target or multiple targets of their activity for
instance, trans-cinnamaldehyde can inhibit the growth of Escherichia coli and
Salmonella typhimirium without isintegrating the OM or depleting
intracellular ATP (Adinoizine triple phosphate). Thymol and Carvacrol oils
gain access to the periplasm and deeper portions of the cell31
. Carvone oil can
also be inter affective against the OM and does not affect the cellular ATP
pool32
.

12
Also it has been shown that essential oils containing mainly aldehydes or
phenols, such as citral, carvacrol, eugenol, or thymol do possess the highest
antibacterial activity, followed by essential oils containing terpene alcohol.
Other essential oils containing ketones or esters such as geranyl acetate show
much weaker activity, while volatile oil containing terpenes hydrocarbons are
usually inactive33,34
. Essential oils characterized by a high level of phenolic
compound, such as carvacrol, eugenol, and thymol, have important
antibacterial activities35,36
. Such compounds are responsible for the disruption
of the cytoplasm membrane 26,36,40
. It has been shown that the chemical
structure of essential oils effects their mode of action concerning their
antibacterial activity 35
. The crucial presence of hydroxyl group in the
phenolic compounds, such as carvarol and thymol, was confirmed28,34
.
However the relative position of the phenolic hydroxyl group on the ring does
not appear influence the antibacterial activity.
The action of thymol against Bacillus cereus, Staphylococcus aureus, and
Pesudomons aeruginosa appears to be comparable to that of carvarol for
example24,29
. It has been reported that carvarol and thymol act differently
against Gram positive and Gram negative species29
. Thymol, carvarol have an
antimicrobial effect against a broad spectrum of bacterial strains including:
Escherichia coli, Bacillus cereus, Liserimano cytogenes, Samonella enteric,
Clostridium jejuni, Lactobacillus sake, Staphylococcus and Helicobacter
pyroli 39,40
.
13
Other essential oils also have valuable antibacterial properties like those
containing certain alcohols, aldehydes, ketones and monoterpenes. Among
these compounds, carvarol is the most active. Carvarol is used as a presevative
and food flavoring in drink, sweats, and other preparation. It has been shown
that essentials are more active against Gram positive than Gram negative
bacteria 40,45
. The latter are less susceptible to the action of essential oils with
the outer membrane surrounding the cell wall that restricts the diffusion of
hydrophobic compounds through the lipopolysaccharids film 42
. Furthermore,
the antibacterial activity of essential oils is related to their chemical
composition, the properties of volatile molecules, and their interactions 35,40,44
.
An additive effect is observed when the combination is equal to the sum of the
individual effects. Antagonism is observed when the effect of one or both
compounds is less important when they are tasted together than when used
individually 40.
A synergistic effect is observed when the combination of substance is greater
than the sum of the individual effects 41
. Some studies have shown that the use
of the whole essential oils provides an effect which is greater than that of the
major components used together 42.
This suggests that minor components are
essential for activity and may have synergistic effect. The additive and
synergistic effects of the combination of 1,8-cineole and aromadendrene
against methicillin - resistant Staphylococcus aureus (MRSA) and
thancomycin - resistant enterococci (VRE) has been demonstrated 43.
In
addition, essential oils have also revealed to be effective on the inhibition of

14
growth and reduction in numbers of the more serious food borne pathogens,
such as Salmonella spp. and E. coli 44
.
1.5.2. Antioxidant activity
Some studies have demonstrated that the antioxidant potential of an essential
oil depends on its composition. It is well established that phenolic and
secondary metabolites with conjugated double bonds usually show substantial
antioxidative properties47
. Regarding the antioxidant properties, thymol and
carvacrol are potentially active phytochemicals. The activity of this natural
products is directly related to their phenolic compounds having redox
properties and thus play an important role in neutralizing harmful free
radicals42
.
The antioxidant activity of essential oils is also due to certain alcohol, esters,
ketones, aldehyde, and monoterpenes45
. Essential oils with important
scavenging capacity of free radicals may play an important role in some
diseases prevention, such as, brain dysfunction, cancer, heart disease, and
immune system decline. In facts the disease may result from cellular damage
caused by free radicals41,46
. Essential oils have shown their action as
hepatoproective as well as against ageing. Also it has been proved that they
possess a beneficial impact upon the poly unsaturated fatty acids (PUFAs), in
particular the long chain C20 and C22 acids48
.
1.5.3 Cancer chemoprotective activity
The varied therapeutic potential of essential oils attracted, in recent years, the
attention of researcher for their potential activity against cancer. Essential oils

15
and their constituents target the discovery of new anticancer natural
products42
.
Essential oils would act in the prevention of cancer as well as, at its removal.
It is well known that certain food, such as garlic and turmeric, are good
sources of anticancer agents49
.
Garlic essential oil is source of sulfur
compounds recongnized for their preventive effect against cancer. Daily
sulfide, disulfide, and tri sulfide are examples32
.
These compounds activity in rates, the enzymes involved in the detoxification
process of hepatic phase1(disintegraction of chemical bonds that link
carcinorganictoxins to each other) and phase 2 (bonds to toxins released
detoxifying enzymes, such as glutathione s- transferase). Metabolism happens
mainly in the liver - the body largest internal organ. The portal vein carries
blood from the small intestine directly to the liver. Sixty percent of liver tissue
is made up of hepatic cells. More chemical processes happen in these than in
any other group of cells in the body. Phase 1 metabolism involves chemical
reactions, such as oxidation (most common) reduction and hydrolysis.
There are three possible results of phase 1 metabolism:
- The drug becomes completely inactive i.e. the metabolites are
pharmacologically in active.
- The metabolites are pharmacologically active, but less so than the
original drug.
- The original substance is not pharmacologically active, but one of its
metabolites.
16
Phase 2 metabolism involves reaction that chemically changes the drug or
phase1 metabolites into compounds that are soluble enough to be excreted via
urine. In the reaction, the metabolites which are attached to an ion is capable
of grouping. This is called conjugation and the products called a conjugate53
.
It has been demonstrated that many essential oils have a cytotoxin activity
namely Melissa fficinalis54
. Melaleuca alternifolia. Artemisia annua and
comptonia peregrine55
.
1.6. Quality control of essential oils
For quality control of any volatile oils pharmacopoeias require different tests
physical measurements (refractive index etc), determination of various
indexes (esters, fatty acids and carbonyl) and analysis the essential oils by
chromatographic techniques.
1.7. Medicinal and commercial uses of essential oils
Many plants containing essential oils have been long used either medicinally
or industrially.
1.7.1. Pharmaceuticals
In this respect, the drugs containing essential oils are used in their crude form
for their therapeutic effect particularly as external antiseptics, but the major
uses of the essential oils are the aromatization of other pharmaceutical, and as
carminatives as well.
1.7.2- Perfumery:
Perfumery materials such as volatile oils are used directly. Also they are used
in cosmetology and the products are of higher cost. The other route for
17
volatile oils in this category is the usage in manufacturing of soaps, toiletries,
deodorants, household cleaners, polishers and insecticides. In perfume
industry, volatile oils are classified into three categories(i) those with high
volatility leaving the skin rapidly like lemon, lavender, odorant (ii) with
intermediate volatility as thyme, neroli and the last categories include (iii)
those constituents of low volatility which are also described as fixatives like
vanillin and musk.
1.7.3 Food industry
A large number essential oils are used widely as flavor for foods, confections
and in spice. As spice drugs are used raw (herb and spices) others are used as
essential oils, resinoids, oleoresins, dispersed, encapsulated, or complexed.
Different sectors of food technology are using volatile oils including non
coholic beverages, dairy products, meat products.
1.8- Storage of essential oils
Essential oils are relatively un stable, this makes their storage difficult.
Examples are oxidative cleavage of phenyl propanoids, peroxidation of
hydrocarbons, and decomposition to Ketones and alcohols (limonene) thermo
isomerization (citrals) and many others.
One way to overcome this problem is by using small vials made of amber
glass, aluminum or stainless steel, completely filled, and tightly closed. Low
temperature storage, storage under an inert nitrogen atmosphere or by addition
of antioxidants are possible choices56
.

18
1.9- Analysis of essential oils
Chromatography is a very specific and selective separation technique,
utilizing the small differences in the distribution of each component between
two phases: the stationary and the mobile phase. It is thus used for the
separation of closely related compounds in mixture and also to separate
widely different compounds57
.
Separation techniques combined with mass spectrometry are important
enhancement to the mass resolving and mass determining capabilities of mass
spectrometry where it is used in tandem with chromatographic, and other
separation techniques 58
.
1.9.1.1- Liquid chromatography
Liquid chromatography- mass spectrometry (LC/MS) separates compounds
chromatically before they are introduced to the ion source and mass
spectrometer. It differs from (GC/MS) in that the mobile phase is liquid
usually which is a mixture of water and an organic solvent instead of gas.
Most commonly electrospray ionization source is used in (LC/MS). Other
popular and commercially available (LC/MS) ion sources are atmospheric
pressure chemical ionization and atmospheric pressure photoionization. There
are also some newly developed ionization techniques like laser spray60
.
1.9.1.2. Gas chromatography-mass spectrometry
In the technique of gas chromatography-mass spectrometry the feature of gas
chromatography and mass spectrometry are combined to identify different
substances within a sample. Applications of (GC/MS) include:

19
- Drug detection
- Fire investigation
- Environment analysis
- Explosive investigation
-Identification of unknown samples
- Airport security
This powerful analytical tool can identify trace elements in materials that were
previously thought to have disintegrated beyond identification. This technique
allows analysis and detection even of tiny amount of substance. Since
(GC/MS) is used to perform 100% specific test which positively identifies the
presence of particular substance, then it is used as a gold standard for forensic
substance identification63
.
The need to un equivocally identify the constituents of complex matrix was
the motivation for the development of different instrumental coupling
techniques (tandem), including the widely and successfully used gas
chromatography (GC) coupled with mass- spectrometery (MS) This technique
is an extremely favorable, synergistic union, as the compounds susceptible to
be analyized by GC (low –molecular weight, medium or low polarity in ppm
concentration) are also compatible with the MS requirements. Besides both
analyses proceed in the same aggregation state (vapor phase).
However, the only conflict (short term and already resolved) between GC and
MS were the different working pressure, for example atmospheric at the GC
column exit and low in the ionization chamber, respectively. This drawback
20
was overcome by technically introducing an efficient vacuum pump (turbo
molecular and gas-jet pumps) and above all due to the introduction of gas
chromatography capillary columns (internal diameter 0.18 to 0.32 mm )63,62
.
1.9.2. Capillary electrophoresis – mass spectrometry
The technique of capillary electrophoresis-mass spectrometry (CE\MS)
combines the liquid separation process of capillary electrophoresis with mass
spectrometry59
. (CE\MS) is typically copied to electrospray ionization 60
.
1.9.3. Mass spectrometry
Mass spectrometry (MS) is an analytical technique that ionizes chemical
species and sorts the ions on the of basis of their mass to charge ratio in
simpler terms, a mass spectrum is a measure masses within sample. The
technique is used in many different fields and is applied to pure samples as
well as complex mixtures. Mass spectrum can be defined as a plot of the ion
signals as a function of the mass –to-charge-ratio. These spectra are used to
determine the elemental or isotopic signature of a sample as well as the
masses of particles and of molecules, and to elucidate the chemical structure
of molecules, such as peptides and other chemical compounds.
In a typical MS procedure, a sample, which may be solid, liquid or gas, is
ionized, for example by bombarding it with electrons. This may cause some
samples molecules to break into charged fragments. The fragmented ions are
then separated according to their mass-to-change ratio, typically by
accelerating them and subjecting them to an electric or magnetic field63
.
21
1.10. The target plant species
1.10.1. Pimpinella anisum
Anise (Pimpinella anisum) is a plant in the family Umbelliferae. It is
indigenous to the Mediterranean region64.
The major production area in Sudan
is north Sudan, while there is a very limit production in Khartoum state [59]
.
Anise seeds contain 1.5-5 % essential oils and is used as flavor, digestive,
carminative and for the relief of gastrointestinal spasms. Consumption of
anise by lactating women increase milk and also reliefs their infants from
gastrointestinal problems66
. In food industry, anise is used as flavoring and
aromatic agent for fish products, ice cream, sweats, and gums67,68
. Essential
oils of the genus Pimpinella are a complex mixture of various components
that contain sesqueterpenes, phenolic compound (C6-C3) and alkanes. The
essential oil is located in the oil ducts of fruits, shoots and roots69
. Anise seeds
as well as anise essential oil has medicinal values. The anise tea is used for
children, s flatulence upper respiratory tract problems and bronchial asthmatic
attacks70
. It can also be used for scabies, where it may be applied externally in
an ointment base 71
.
22
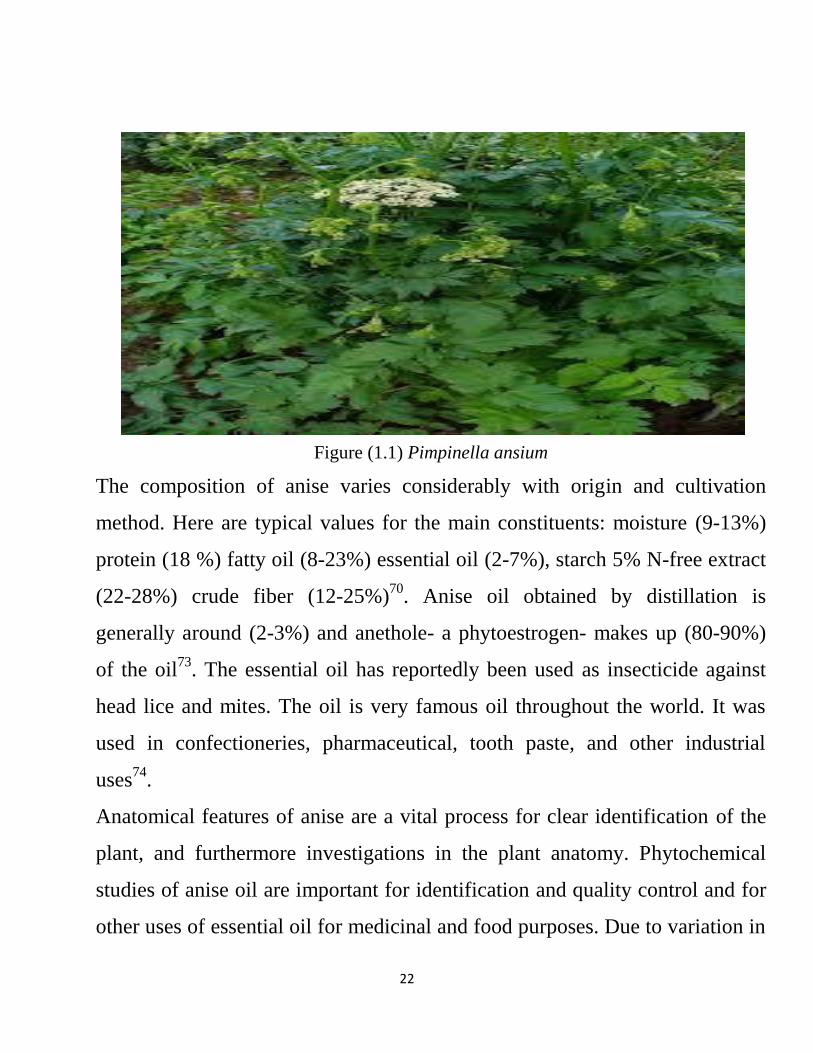
Figure (1.1) Pimpinella ansium
The composition of anise varies considerably with origin and cultivation
method. Here are typical values for the main constituents: moisture (9-13%)
protein (18 %) fatty oil (8-23%) essential oil (2-7%), starch 5% N-free extract
(22-28%) crude fiber (12-25%)70
. Anise oil obtained by distillation is
generally around (2-3%) and anethole- a phytoestrogen- makes up (80-90%)
of the oil73
. The essential oil has reportedly been used as insecticide against
head lice and mites. The oil is very famous oil throughout the world. It was
used in confectioneries, pharmaceutical, tooth paste, and other industrial
uses74
.
Anatomical features of anise are a vital process for clear identification of the
plant, and furthermore investigations in the plant anatomy. Phytochemical
studies of anise oil are important for identification and quality control and for
other uses of essential oil for medicinal and food purposes. Due to variation in
23
climate, topography, soil and cultural practices, anise essential oil can be
different, there for more investigation are important to clarify this changes.
Some spices like anise are reported to have bactericidal or bacteriostatic
activities. The inhibitory effects of spices are mostly due to the volatile oils
present in their composition. The main factors that determine the
antimicrobial activity are the type and composition of the spice as well as the
type of microorganism.75.
1.10.2. Prosopis juliflora
Prosopis juliflora is a perennial deciduous thorny shrub or small tree up to12
m tall, trunk up to 1.5m diameter, bark thick, brown or blackish, shallowly
fissured, leaves compound, commonly many more than 9 pairs, the leaf lets
mostly 5-10 mm long- linear-oblong, glabrous, often hairy, commonly
rounded at the apex, spike like, corolla deeply l0 bate. Pods several seeded,
strongly compressed when young, think at maturity, more or less constricted
between the seeds 10-25 cm long brown or yellowish, 10-30 seeds. Seed
compressed and oval or elliptic, 2.5-7 long brown77
. Per 100g the flower is
reported to contain 21g protein, 3.2g fat, 65.8g total carbohydrates, 15.5g
fiber, 10g ash, 1.31mg Ca and 400mg P. Leaves contain 19g protein, 2.9g fat,
69.6g total carbohydrate, 21.6g fiber.8.5g ash, 2.08mg Ca and 220g P. Fruits
13.9g protein, 3g fat, 78.3g total carbohydrates, 27.7g fiber and 4.8g ash.
Seeds contain 65.2g proteins, 7.8g fat, 21.8g carbohydrates, 2.8g fiber, and
5.2g ash.

24
Another analysis of the fruit shows 14.35% water (hygroscopic), 1.64% oil,
16.36% starch, 30.25% glucose, 0.85% nitrogenous material, 5.81%tannin-
like material, 3.5% mineral salts, and 27.24% cellulose. Mesquite gum readily
hydrolyses with dilute sulfuric acid to yield L-arabinose: D-galactose: 4-O-
methyl -D-glucuronic acid at 4:2:1. Owing to the high content arabinose, the
gum is an excellent source of sugar. Roots contain 6.7% tannin, bark 3-8.4%
and dry wood o.9%. The alkaloids hydroxytryptamine and tyranine are
reported from this species78
.
Figure (1.2) Prosopi juliflora
Mesquite pods are among the earliest known foods of prehistoric man in the
new world. Today flour products made from the pods are still popular,
although only sporadically prepared, mostly by Amerindians. Pods are made
into gruels, sometimes fermented to make a mesquite wine. The leave can be
used for forage, providing good bee pasturage. Also nectar from mesquite
yield a superior honey. The wood is used for parquet floor, furniture, and
25
turnery items, fencepost, pilings, as a substrate for producing single-cell-
protein, but most of all for fuel. Toasted seeds added to coffee. Bark which is
rich in tannin, is used for roofing in some countries. The gums forms are used
as adhesive mucilage and as an emulsifying agent. Gum is also used in
confectionary and mending pottery. Roots contain 6-7% tannins79
.
Mesquite is also used as folk medicine. The juice is used in folk remedies for
cancerous condition. Reported to be cathartic, emetic, stomachic, mesquite is
a folk remedy for catarrh, colds, diarrhea, dysentery, inflammation, itch,
stomachache, sore throat, and wounds. Pima Indians drink the hot tea for sore
throat. Aqueous and alcoholic extracts are markedly antibacterial80
.
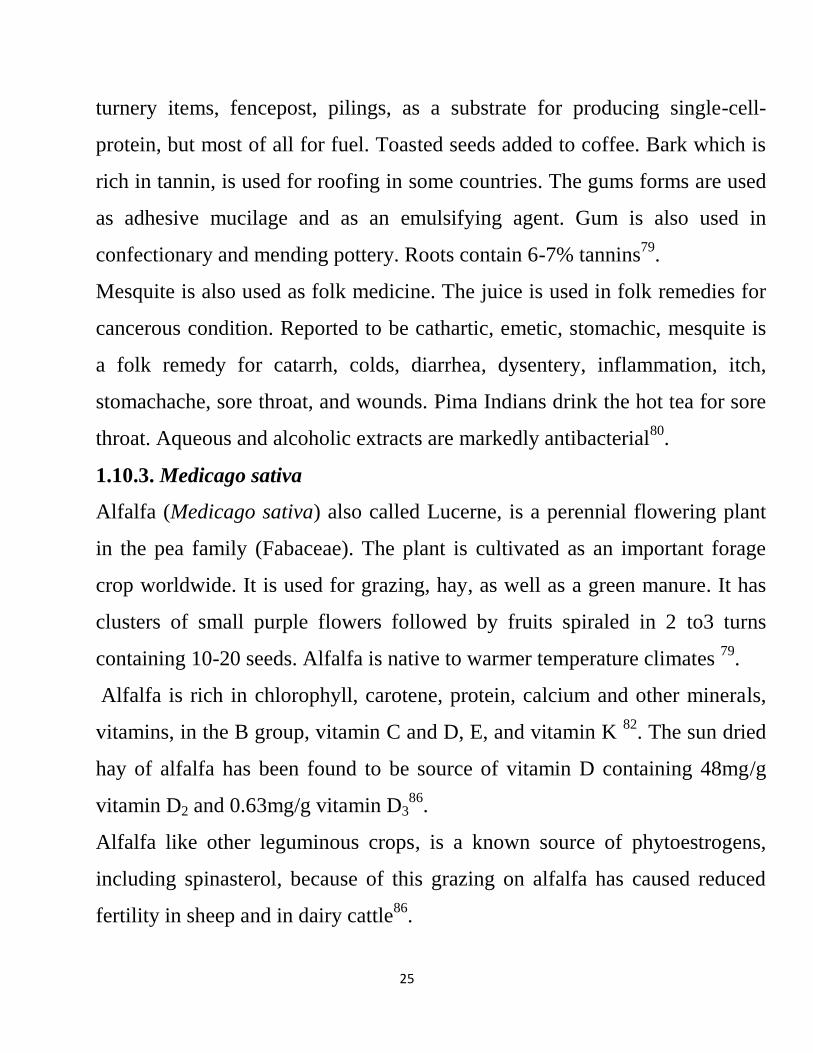
1.10.3. Medicago sativa
Alfalfa (Medicago sativa) also called Lucerne, is a perennial flowering plant
in the pea family (Fabaceae). The plant is cultivated as an important forage
crop worldwide. It is used for grazing, hay, as well as a green manure. It has
clusters of small purple flowers followed by fruits spiraled in 2 to3 turns
containing 10-20 seeds. Alfalfa is native to warmer temperature climates 79
.
Alfalfa is rich in chlorophyll, carotene, protein, calcium and other minerals,
vitamins, in the B group, vitamin C and D, E, and vitamin K 82
. The sun dried
hay of alfalfa has been found to be source of vitamin D containing 48mg/g
vitamin D2 and 0.63mg/g vitamin D386
.
Alfalfa like other leguminous crops, is a known source of phytoestrogens,
including spinasterol, because of this grazing on alfalfa has caused reduced
fertility in sheep and in dairy cattle86
.
26
Figure (1.3) Medicago sativa
Raw alfalfa seeds and sprouts are a source of the amino acid canavanine.
Much of the canavanine is converted into other amino acids during
germination so sprouts contain much less caravanine than unsprouts seeds.
The United State National institutes of health (US-NiH) reports that there is
insufficient evidence to rate effectiveness of alfalfa for high cholesterol87
.
Taking alfalfa seeds seems to lower total low density lipoproteins (LDL) in
people with high cholesterol level. Also alfalfa is traditionally used in kidney
problems, bladder problems, prostate problems, asthma, arthritis, diabetes,
upset stomach as well as other condition88
.
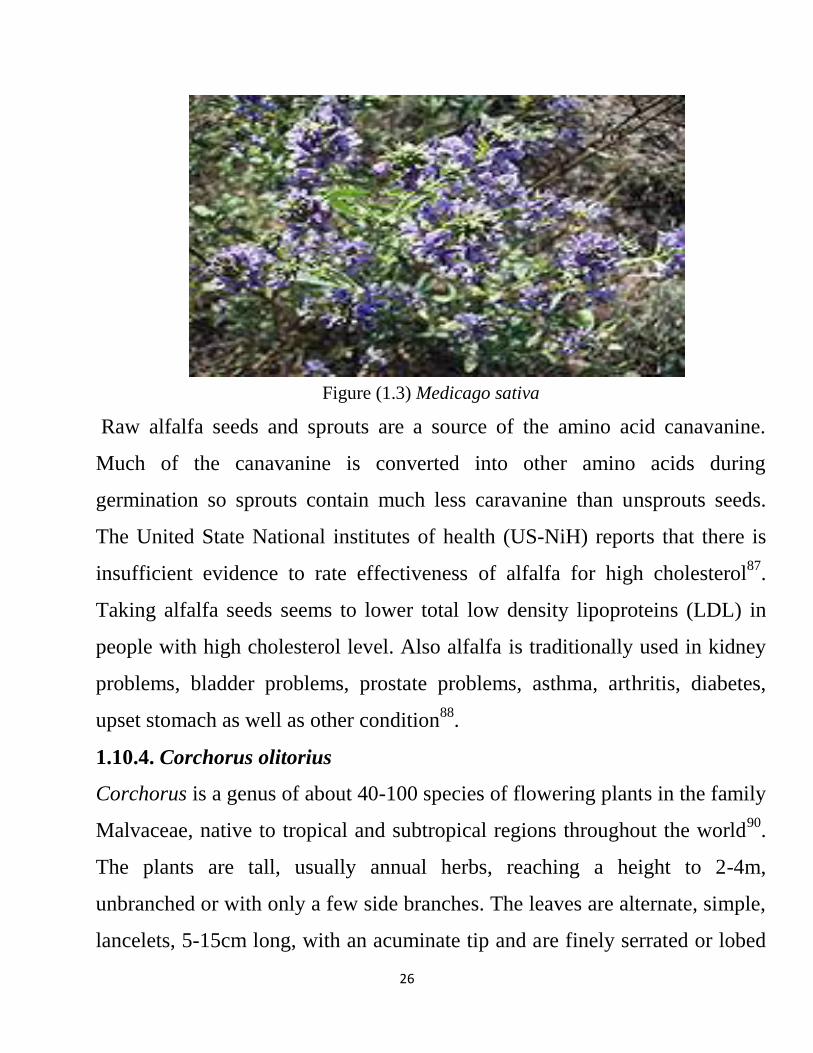
1.10.4. Corchorus olitorius
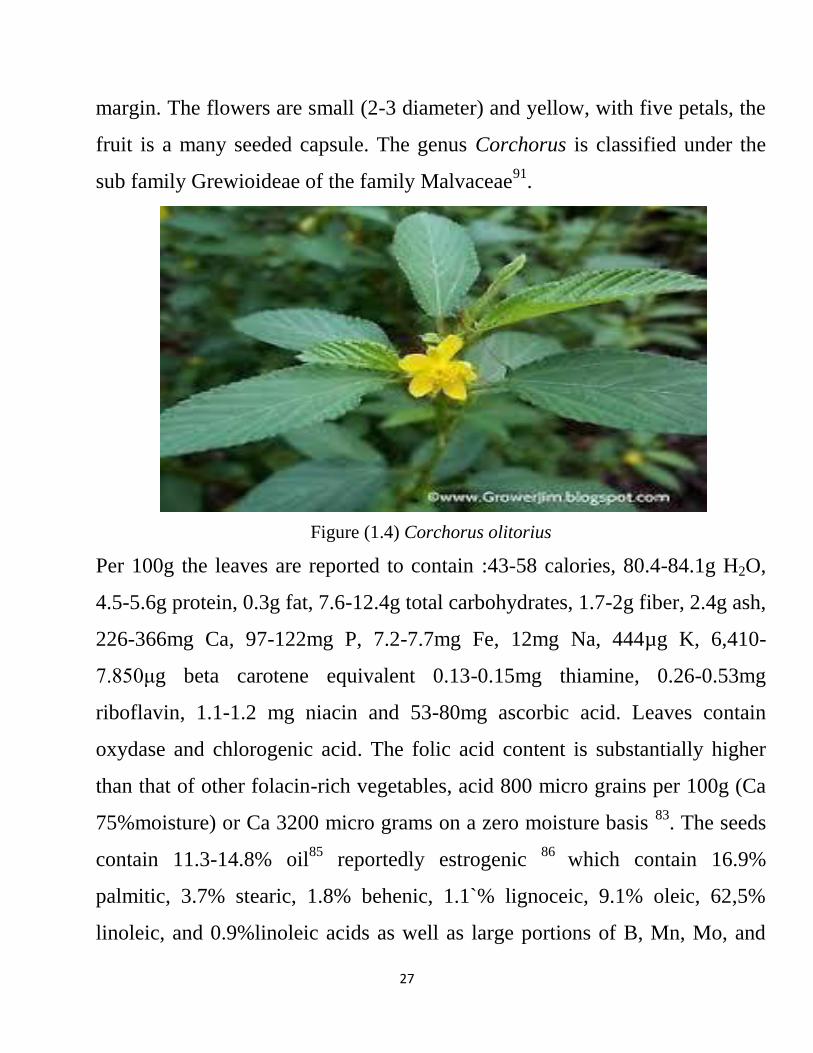
Corchorus is a genus of about 40-100 species of flowering plants in the family
Malvaceae, native to tropical and subtropical regions throughout the world90
.
The plants are tall, usually annual herbs, reaching a height to 2-4m,
unbranched or with only a few side branches. The leaves are alternate, simple,
lancelets, 5-15cm long, with an acuminate tip and are finely serrated or lobed
27
margin. The flowers are small (2-3 diameter) and yellow, with five petals, the
fruit is a many seeded capsule. The genus Corchorus is classified under the
sub family Grewioideae of the family Malvaceae91
.
Figure (1.4) Corchorus olitorius
Per 100g the leaves are reported to contain :43-58 calories, 80.4-84.1g H2O,
4.5-5.6g protein, 0.3g fat, 7.6-12.4g total carbohydrates, 1.7-2g fiber, 2.4g ash,
226-366mg Ca, 97-122mg P, 7.2-7.7mg Fe, 12mg Na, 444µg K, 6,410-
7.850μg beta carotene equivalent 0.13-0.15mg thiamine, 0.26-0.53mg
riboflavin, 1.1-1.2 mg niacin and 53-80mg ascorbic acid. Leaves contain
oxydase and chlorogenic acid. The folic acid content is substantially higher
than that of other folacin-rich vegetables, acid 800 micro grains per 100g (Ca
75%moisture) or Ca 3200 micro grams on a zero moisture basis 83
. The seeds
contain 11.3-14.8% oil85
reportedly estrogenic 86
which contain 16.9%
palmitic, 3.7% stearic, 1.8% behenic, 1.1`% lignoceic, 9.1% oleic, 62,5%
linoleic, and 0.9%linoleic acids as well as large portions of B, Mn, Mo, and
28
Zn. Reported to be demulcent, lactagogue, purgative, and tonic. This plant is a
folk remedy for aches and pain, dysentery, fever, pectoral pains, and tumors
89,93,94.
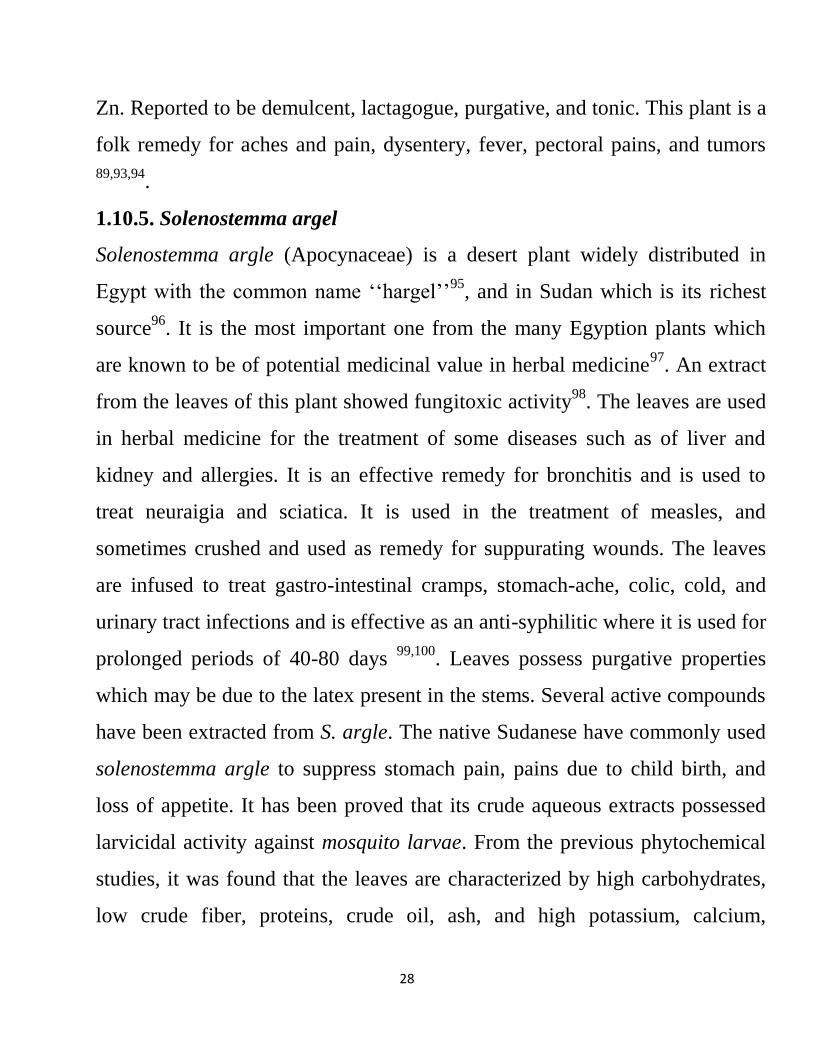
1.10.5. Solenostemma argel
Solenostemma argle (Apocynaceae) is a desert plant widely distributed in
Egypt with the common name ‘‘hargel’’95
, and in Sudan which is its richest
source96
. It is the most important one from the many Egyption plants which
are known to be of potential medicinal value in herbal medicine97
. An extract
from the leaves of this plant showed fungitoxic activity98
. The leaves are used
in herbal medicine for the treatment of some diseases such as of liver and
kidney and allergies. It is an effective remedy for bronchitis and is used to
treat neuraigia and sciatica. It is used in the treatment of measles, and
sometimes crushed and used as remedy for suppurating wounds. The leaves
are infused to treat gastro-intestinal cramps, stomach-ache, colic, cold, and
urinary tract infections and is effective as an anti-syphilitic where it is used for
prolonged periods of 40-80 days 99,100
. Leaves possess purgative properties
which may be due to the latex present in the stems. Several active compounds
have been extracted from S. argle. The native Sudanese have commonly used
solenostemma argle to suppress stomach pain, pains due to child birth, and
loss of appetite. It has been proved that its crude aqueous extracts possessed
larvicidal activity against mosquito larvae. From the previous phytochemical
studies, it was found that the leaves are characterized by high carbohydrates,
low crude fiber, proteins, crude oil, ash, and high potassium, calcium,
29
magnesium, sodium, and low copper, ferrous, manganese, lead, and contained
phytic acid and tannins101
.
Figure (1.5) Solenostemma argle
Also S. argel contains acylated phenolic, glycosides, pregnene glycosides
(solenoside A) kaempferol-3-o-glucoside and 3-o-rutinoside(R). Also it was
found that its aerial parts contained two monoterpene glucosides, a pregnane
glucoside, benzyl alcohol β-apiofuranosyl (1-6), β-glucopyranoside (1-6), β-
glucopyranoside, astragalin and kaempferol-3-O-neohesperidose101
.
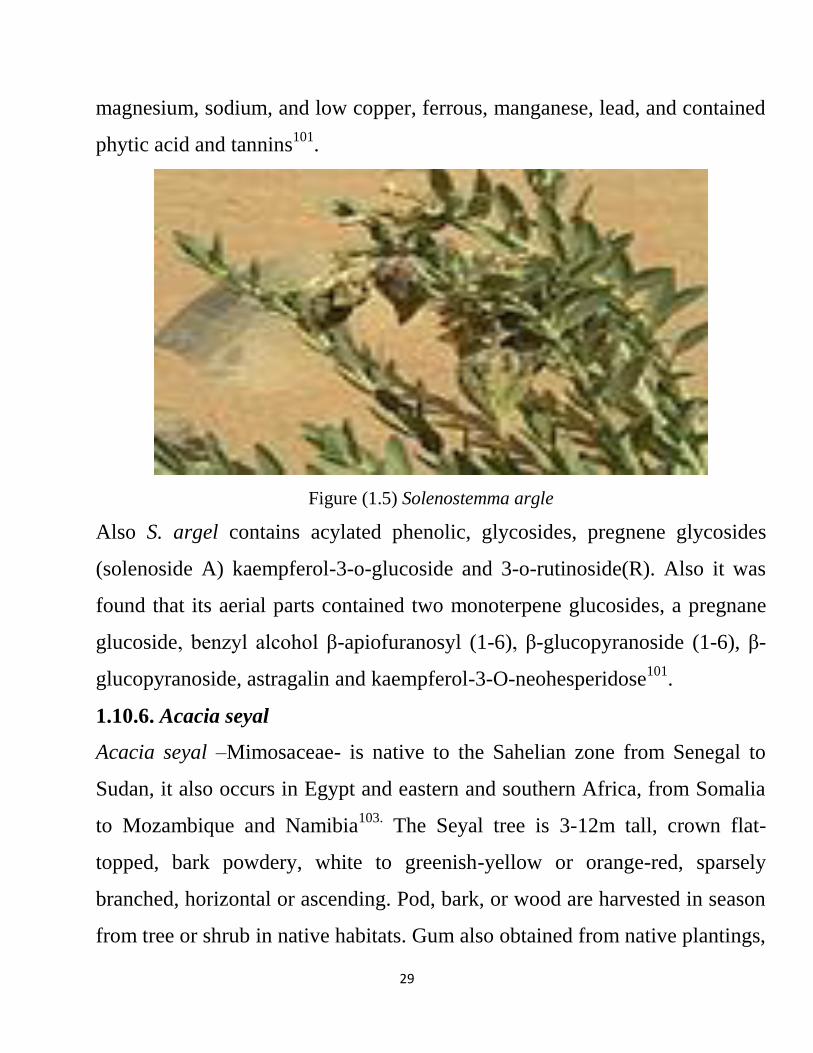
1.10.6. Acacia seyal
Acacia seyal –Mimosaceae- is native to the Sahelian zone from Senegal to
Sudan, it also occurs in Egypt and eastern and southern Africa, from Somalia
to Mozambique and Namibia103.
The Seyal tree is 3-12m tall, crown flat-
topped, bark powdery, white to greenish-yellow or orange-red, sparsely
branched, horizontal or ascending. Pod, bark, or wood are harvested in season
from tree or shrub in native habitats. Gum also obtained from native plantings,
30
in manner similar to that for other gum Arabic plants. This species has been
reported to contain 18-20% tannin.
Wood is white to yellow-brown, finely striated with dark lines coarse-grained,
soft, easy to work, polishes well, but discolors easily, with mold and is
susceptible to insect attack. Trees also yield a gum of good quality. Bark
contains tannins and yield red liquid extract. The leaves are important for
forage and the wood is a fuel where the trees are abundant. Both, leaves and
young pod are eaten.
The plant is reportedly resistant to insect attacks felled logs may be severely
damaged by wood borers. The gum is believed to be aphrodisiac. The bark
decoction is used for dysentery and leprosy. Tang any Ikans African tribes use
the bark as a stimulant in tropical Africa. The gum is used as emollient and
astringent for colds, diarrhea, hemorrhage and ophthalima. Mixed with Acacia
sieberana DC it is used for intestinal ailments. Wood is used as fumigant for
rheumatic pains, and to protect puerperal mothers from colds and fever.
Eating the gum is supposed to afford some protection against bronchitis and
rheumatism103-104
.
31
Figure (1.6) Acacia seyal
1.10.7. Coriandrum sativum
Coriandrum sativum, also known as citantro104
or Chinese parsley, is an
annual herb in the family Apiaceae. All parts of the plant are edible, but the
fresh leaves and the dried seeds are the part most traditionally used in
cooking. Coriander grows wild over a wide area of western Asia and southern
Europe. It is hard to define exactly where this plant is wild and where it only
recently established itself106
.
The coriander leaves contain vitamins: vitamin A 42%, beta carotene 36%,
thiamine B1 6% riboflavin B2 14%, niacin B3 7%, pantothenic acid B5 11, %
vitamin B6 16%, folate B9 16%, vitamin C 33%, vitamin E 17%, vitamin K
295%, and mineral like calcium 7%, iron 14%, manganese 20%, magnesium
7%, phosphorus 7%, potassium 11%, sodium 3%, zinc 5%, and other
32
constituents. The leaves are variously referred to as coriander leaves, dhania,
Chinese parsley. The leaves have a different taste from the seeds, with citrus
overtones.
Figure (1.7) Coriandrumm sativum
Some people may be genetically predisposed to find the leaves to have
unpleasant soapy taste or a rank smell. The leaves spoil quickly when
removed from the plant, and lose their aroma when dried or frozen. The dry
fruits are known as coriander seeds. The seeds have a lemony citrus flavor
when crushed, due to terpenes, linalool and pinene. It is described as warm,
nutty, spicy, and orange flavoured107
.The roots having a deeper, more intense
flavor than the leaves, coriander roots are used in a variety of Asian cuisines.
One preliminary study showed that coriander essential oil is sensitive to
Gram-positive and Gram–negative bacteria, including Staphylococcus aureus,
Enterococcus faecailis, Pseudomonas aeriginosa, and Escherichia108
.
33
Aim of this study
This study was aimed to:
- Extract the oils from some key species in Sudanese ethanomedicine.
- Investigate the oil constituents via GC-MS.
- Detect the antimicrobial activity of target oils.

34
73
Materials and Methods
2-1-Materials
2-1-1-Plant materials
Prosopis juliflora seeds were collected from Shendi-Sudan.
Seeds of Pimpinella anisum, Corchorus olitorius, Medicago
sativa, Coriandrum sativum, Solenostemma argel and Acacia
seyal were purchased from the local market-Shendi.
Prosopis juliflora seeds were collected and authenticated by the
Department of Phytochemistry and Taxonomy, Institute of
Medicinal and Aromatic Plants, Khartoum-Sudan.
2-1-2-Instruments
GC-MS analysis was conducted on a Shimadzo GC-MS-
QP2010 Ultra instrument with a RTX-5MS columm (30m,
length;0.25mm diameter; 0.25µm, thickness).
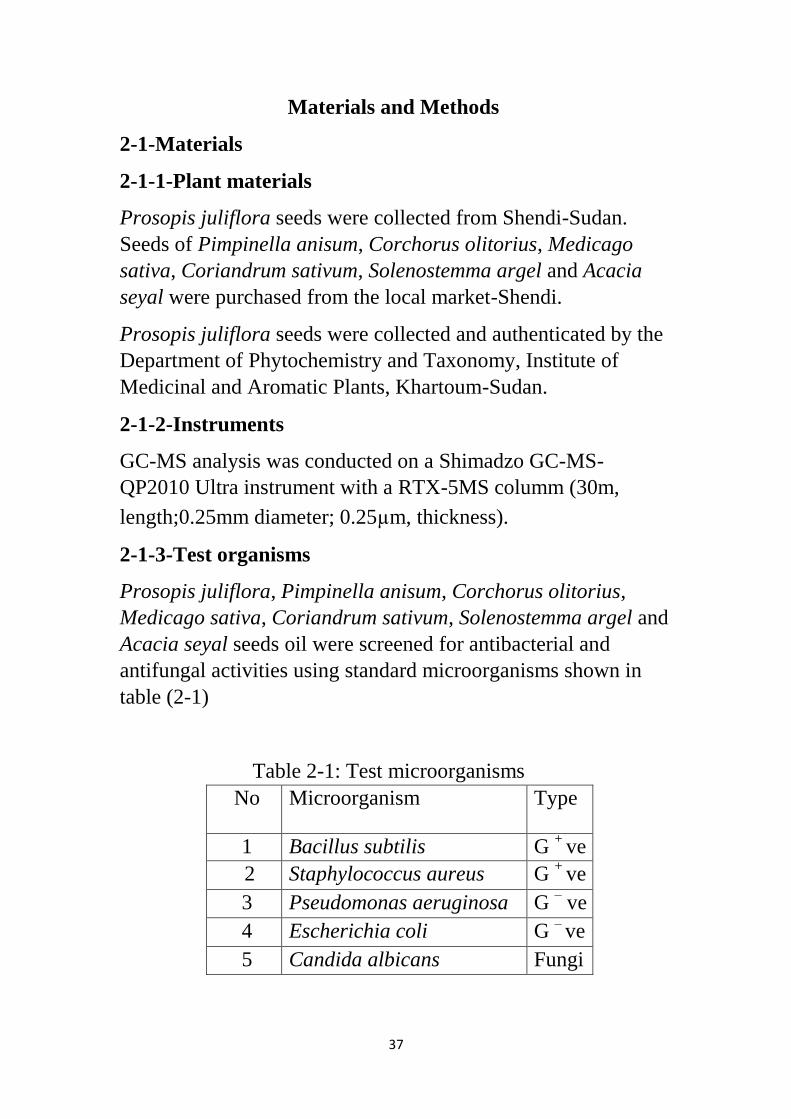
2-1-3-Test organisms
Prosopis juliflora, Pimpinella anisum, Corchorus olitorius,
Medicago sativa, Coriandrum sativum, Solenostemma argel and
Acacia seyal seeds oil were screened for antibacterial and
antifungal activities using standard microorganisms shown in
table (2-1)
Table 2-1: Test microorganisms
No Microorganism Type
1 Bacillus subtilis G +
ve
2 Staphylococcus aureus G +
ve
3 Pseudomonas aeruginosa G – ve
4 Escherichia coli G – ve
5 Candida albicans Fungi

73
2-2-Methods
2-2-1-Extraction of oil
Dry powdered plant material (300g) was exhaustively extracted
with n-hexane at room temperature for 72h. The solvent was
removed under reduced pressure and the oil was kept in the
fridge at 4ºC for further manipulation.
The oil (2ml) was placed in a test tube and 7ml of alcoholic
sodium hydroxide were added followed by 7ml of sulphuric
acid. The tube was stoppered and shaken vigorously for five
minutes and then left overnight. (2ml) of supersaturated sodium
chloride were added, then (2ml) n-hexane were added and the
tube was vigorously shaken for five minutes. The hexane layer
was then separated. (5µl) of the hexane extract were mixed with
5ml diethyl ether. The solution was filtered and the filtrate (1µl)
was injected in the GC-MS vial.
2-2-2-GC-MS analysis
The target oils of were analyzed by gas chromatography-mass
spectrometry. A Shimadzo GC-MS-QP2010 Ultra instrument
with a RTX-5MS column (30m, length;0.25mm diameter;
0.25µm, thickness) was used. Helium (purity; 99.99%) was used
as carrier gas. Oven temperature program is given in Table (2.2),
while other chromatographic condition was depicted in Table
(2.3)
Table 2.2: Oven temperature program
Rate
---
4.00
Temperature ©
150.0
300.0
Hold time
1.00
0.00
73
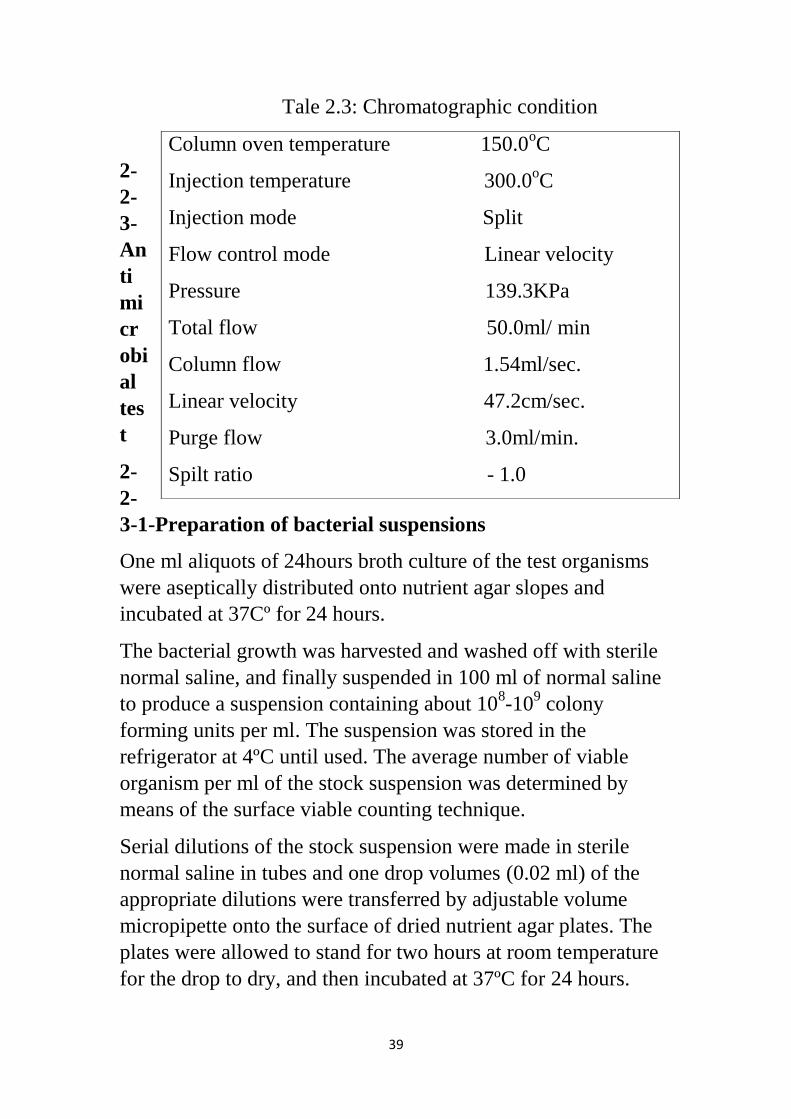
Tale 2.3: Chromatographic condition
2-
2-
3-
An
ti
mi
cr
obi
al
tes
t
2-
2-
3-1-Preparation of bacterial suspensions
One ml aliquots of 24hours broth culture of the test organisms
were aseptically distributed onto nutrient agar slopes and
incubated at 37Cº for 24 hours.
The bacterial growth was harvested and washed off with sterile
normal saline, and finally suspended in 100 ml of normal saline
to produce a suspension containing about 108-10
9 colony
forming units per ml. The suspension was stored in the
refrigerator at 4ºC until used. The average number of viable
organism per ml of the stock suspension was determined by
means of the surface viable counting technique.
Serial dilutions of the stock suspension were made in sterile
normal saline in tubes and one drop volumes (0.02 ml) of the
appropriate dilutions were transferred by adjustable volume
micropipette onto the surface of dried nutrient agar plates. The
plates were allowed to stand for two hours at room temperature
for the drop to dry, and then incubated at 37ºC for 24 hours.
Column oven temperature 150.0oC
Injection temperature 300.0oC
Injection mode Split
Flow control mode Linear velocity
Pressure 139.3KPa
Total flow 50.0ml/ min
Column flow 1.54ml/sec.
Linear velocity 47.2cm/sec.
Purge flow 3.0ml/min.
Spilt ratio - 1.0
04
2-2-3-2-Preparation of fungal suspensions
Fungal cultures were maintained on sabouraud dextrose agar
incubated at 25ºC for four days. The fungal growth was
harvested and washed with sterile normal saline, and the
suspension was stored in the refrigerator until used.
2-2-3-3-Testing for antibacterial activity
The cup-plate agar diffusion method was adopted with some
minor modifications, to assess the antibacterial activity of the
oil. (2ml) of the standardized bacterial stock suspension were
mixed with 200ml of sterile molten nutrient agar which was
maintained at 45ºC in a water bath. (20ml) Aliquots of the
incubated nutrient agar were distributed into sterile Peter dishes,
the agar was left to settle and in each of these plates which were
divided into two halves, two cups in each half (10mm in
diameters) were cut using sterile cork borer (No 4), each one of
the halves was designed for one of the compounds. Separate
Petri dishes were designed for standard antibacterial
chemotherapeutic, (ampicillin and gentamycin).
The agar discs were removed, alternate cup were filled with
0.1ml samples of each compound using adjustable volume
micrometer pipette and allowed to diffuse at room temperature
for two hours. The plates were then incubated in the upright
position at 37ºC for 24 hours.
The above procedure was repeated for different concentrations
of the test compounds and the standard antibacterial
chemotherapeutics. After incubation, the diameters of the
resultant growth inhibition zones were measured in triplicates
and averaged.
24
Results and Discussion
Seven plants which are key species in Sudanese ethnomedicine have been
investigated. The fixed oils of these species were extracted and studied
by GC-MS. Furthermore, the oils have been assessed for antimicrobial
activity via the cup plate agar diffusion bioassay against five standard
human pathogens.
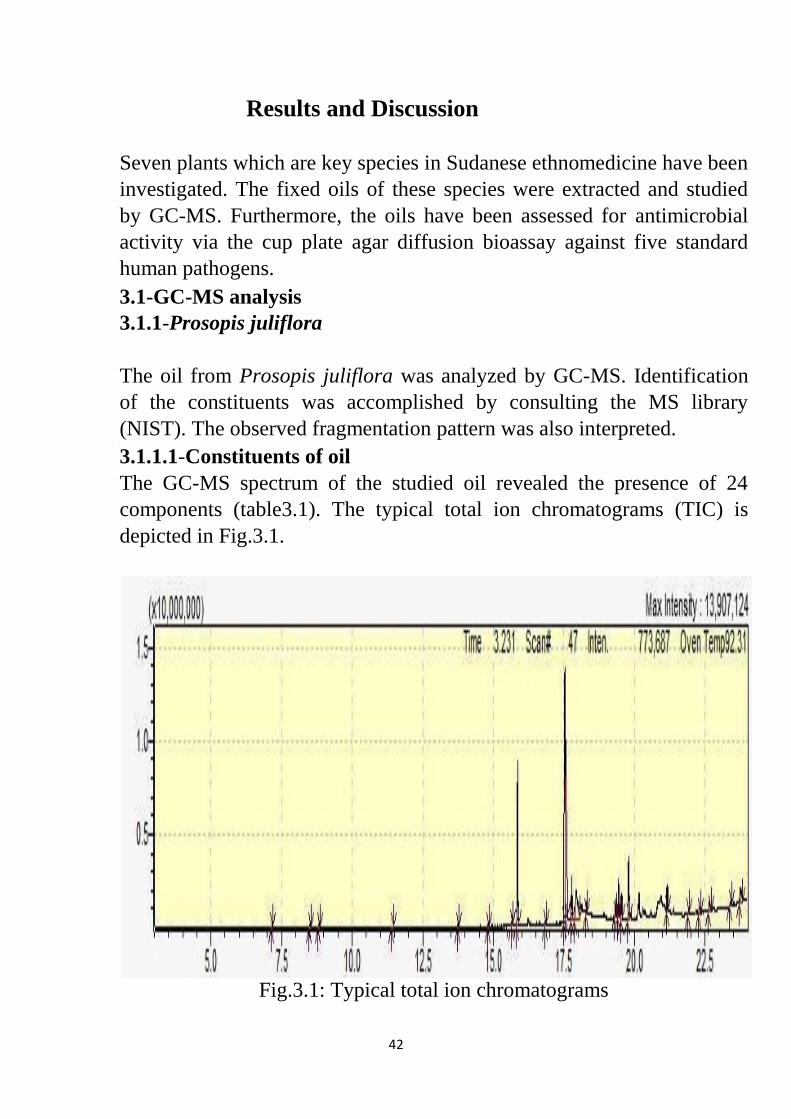
3.1-GC-MS analysis
3.1.1-Prosopis juliflora
The oil from Prosopis juliflora was analyzed by GC-MS. Identification
of the constituents was accomplished by consulting the MS library
(NIST). The observed fragmentation pattern was also interpreted. [ 3.1.1.1-Constituents of oil
The GC-MS spectrum of the studied oil revealed the presence of 24
components (table3.1). The typical total ion chromatograms (TIC) is
depicted in Fig.3.1.
Fig.3.1: Typical total ion chromatograms
24
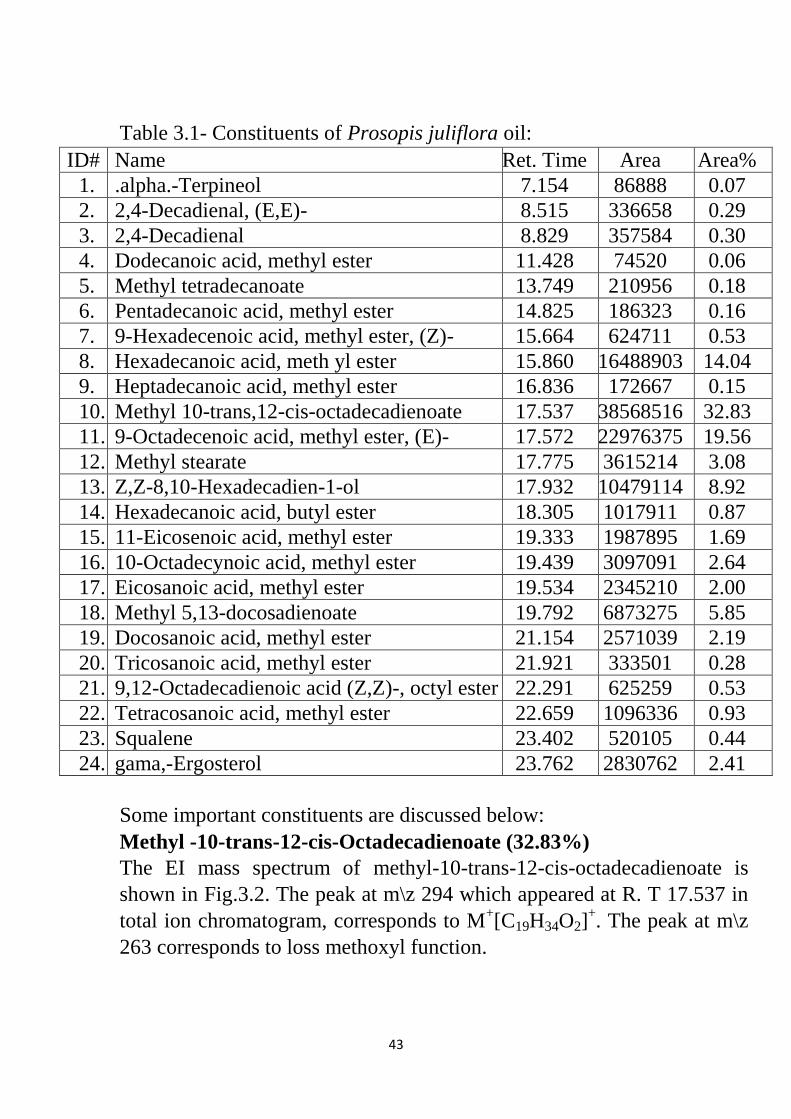
Table 3.1- Constituents of Prosopis juliflora oil:
ID# Name Ret. Time Area Area%
1. .alpha.-Terpineol 7.154 86888 0.07
2. 2,4-Decadienal, (E,E)- 8.515 336658 0.29
3. 2,4-Decadienal 8.829 357584 0.30
4. Dodecanoic acid, methyl ester 11.428 74520 0.06
5. Methyl tetradecanoate 13.749 210956 0.18
6. Pentadecanoic acid, methyl ester 14.825 186323 0.16
7. 9-Hexadecenoic acid, methyl ester, (Z)- 15.664 624711 0.53
8. Hexadecanoic acid, meth yl ester 15.860 16488903 14.04
9. Heptadecanoic acid, methyl ester 16.836 172667 0.15
10. Methyl 10-trans,12-cis-octadecadienoate 17.537 38568516 32.83
11. 9-Octadecenoic acid, methyl ester, (E)- 17.572 22976375 19.56
12. Methyl stearate 17.775 3615214 3.08
13. Z,Z-8,10-Hexadecadien-1-ol 17.932 10479114 8.92
14. Hexadecanoic acid, butyl ester 18.305 1017911 0.87
15. 11-Eicosenoic acid, methyl ester 19.333 1987895 1.69
16. 10-Octadecynoic acid, methyl ester 19.439 3097091 2.64
17. Eicosanoic acid, methyl ester 19.534 2345210 2.00
18. Methyl 5,13-docosadienoate 19.792 6873275 5.85
19. Docosanoic acid, methyl ester 21.154 2571039 2.19
20. Tricosanoic acid, methyl ester 21.921 333501 0.28
21. 9,12-Octadecadienoic acid (Z,Z)-, octyl ester 22.291 625259 0.53
22. Tetracosanoic acid, methyl ester 22.659 1096336 0.93
23. Squalene 23.402 520105 0.44
24. gama,-Ergosterol 23.762 2830762 2.41
Some important constituents are discussed below:
Methyl -10-trans-12-cis-Octadecadienoate (32.83%)
The EI mass spectrum of methyl-10-trans-12-cis-octadecadienoate is
shown in Fig.3.2. The peak at m\z 294 which appeared at R. T 17.537 in
total ion chromatogram, corresponds to M+[C19H34O2]
+. The peak at m\z
263 corresponds to loss methoxyl function.

22
9-Octadecadienoic acid methyl ester (E) (19.56%)
The mass spectrum of 9. octadecadienoic acid methyl esters is shown
in Fig.3.3. The peak at m\z 296 which appeared at R. T 17.572 in total
ion chromatogram, corresponds to M+[C19H36O2]
The peak at m\z 264
corresponds to loss of methoxyl function.
Hexadecanoic acid methyl ester (14.04%)
The mass spectrum of hexadecanoic acid methyl esters is depicted in
Fig.3.4. The peak at m\z 270, which appeared at R.T.15.860 corresponds
to M+[C17H34O2]
+ while the peak at m\z 239 is attributed to loss of
methoxyl function.
Hexadecanoic acid (Palmitic acid) is saturated fatty acid. It is wide
spread in plants and human. The acid is produced first during the
synthesis of fatty acid and is considered as precursor of long chain fatty
acid. Palmitic acid is a major lipid components of human breast milk.
The acid finds applications in soap and Cosmetics industries, it is also
used in food industry.
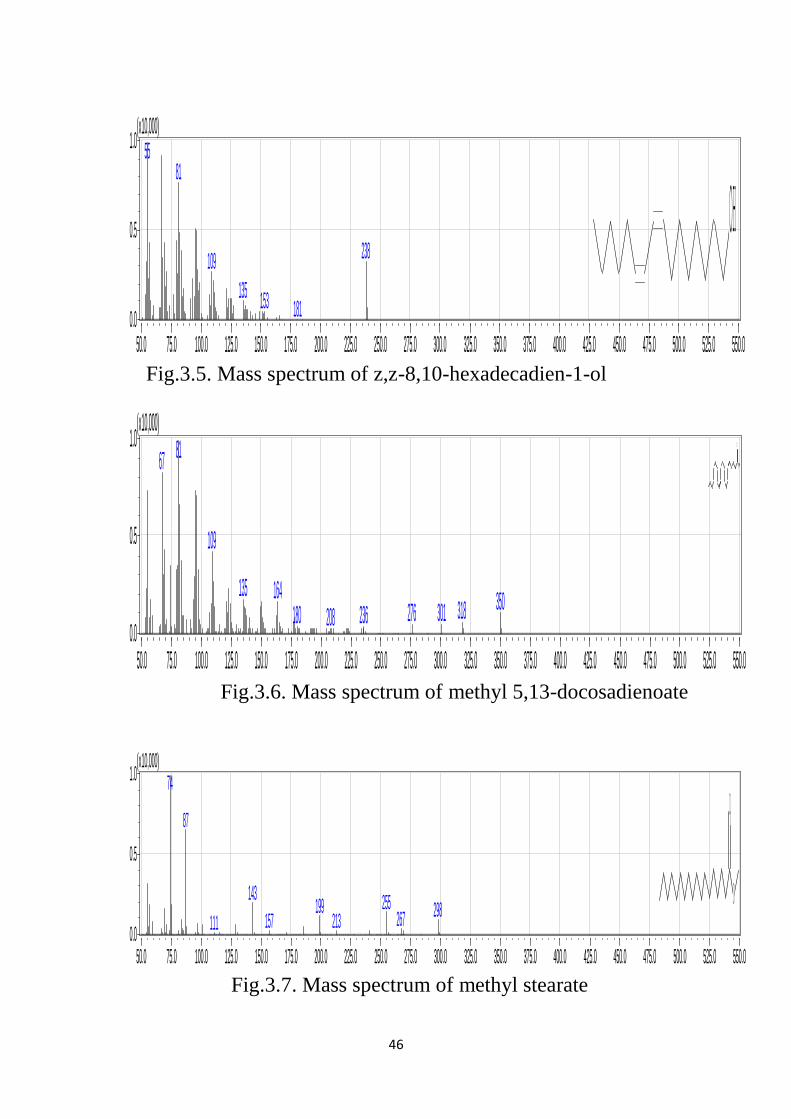
Z, Z-8,10-Hexadecadien-1-ol (8.92%)
Fig.3.5 shows the mass spectrum of z, z-8,10-hexadecadien-1-ol. The
signal at m\z 238, which appeared at R.T.17.932 corresponds to
M+[C16H30O]
+ while the peak at m\z 185 is attributed to loss of methoxyl
function.
Methyl 5,13- Docosadienoate (5.85 %)
The mass spectrum of methyl 5,13- docosadienoate is shown in Fig.3.6.
The peak at m\z 350, which appeared at RT 19.792 correspond
M+[C23H42O2]
+.The peak at m\z 318 corresponds to loss of methoxyl
function.
Methyl stearate (3.08%)
The EI mass spectrum of methyl stearate is shown in Fig.3.7. The peak at
m\z 298which appeared at R.T. 17.775 corresponds to M+[C19H38O2].
The peak at m\z 267 corresponds to loss of methoxyl function.
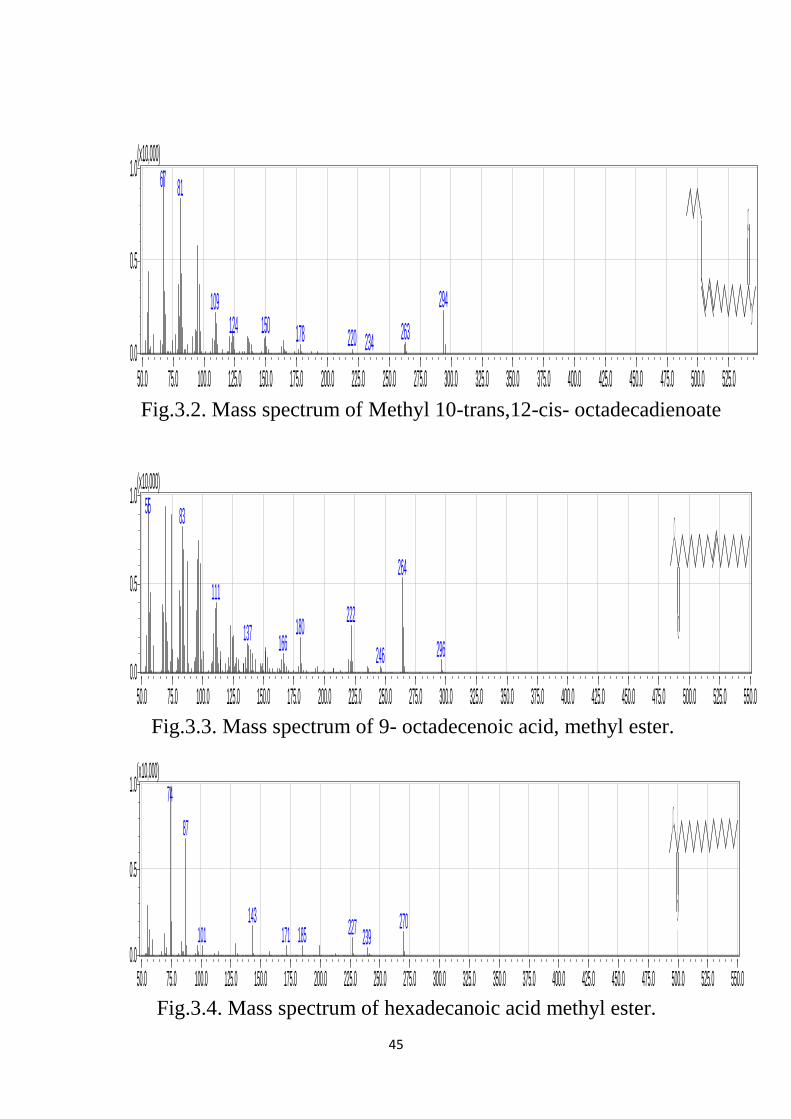
24
Fig.3.2. Mass spectrum of Methyl 10-trans,12-cis- octadecadienoate
Fig.3.3. Mass spectrum of 9- octadecenoic acid, methyl ester.
Fig.3.4. Mass spectrum of hexadecanoic acid methyl ester.
50.0 75.0 100.0 125.0 150.0 175.0 200.0 225.0 250.0 275.0 300.0 325.0 350.0 375.0 400.0 425.0 450.0 475.0 500.0 525.00.0
0.5
1.0(x10,000)
67 81
294109150124 263178 220 234
O
O
50.0 75.0 100.0 125.0 150.0 175.0 200.0 225.0 250.0 275.0 300.0 325.0 350.0 375.0 400.0 425.0 450.0 475.0 500.0 525.0 550.00.0
0.5
1.0(x10,000)
55 83
264111
222180137 166 296246
O
O
50.0 75.0 100.0 125.0 150.0 175.0 200.0 225.0 250.0 275.0 300.0 325.0 350.0 375.0 400.0 425.0 450.0 475.0 500.0 525.0 550.00.0
0.5
1.0(x10,000)
74
87
143 270227185171101 239
O
O
24
Fig.3.5. Mass spectrum of z,z-8,10-hexadecadien-1-ol
Fig.3.6. Mass spectrum of methyl 5,13-docosadienoate
Fig.3.7. Mass spectrum of methyl stearate
50.0 75.0 100.0 125.0 150.0 175.0 200.0 225.0 250.0 275.0 300.0 325.0 350.0 375.0 400.0 425.0 450.0 475.0 500.0 525.0 550.00.0
0.5
1.0(x10,000)
5581
238109
135 153 181
OH
50.0 75.0 100.0 125.0 150.0 175.0 200.0 225.0 250.0 275.0 300.0 325.0 350.0 375.0 400.0 425.0 450.0 475.0 500.0 525.0 550.00.0
0.5
1.0(x10,000)
8167
109
135 164 350318276 301236180 208
O
O
50.0 75.0 100.0 125.0 150.0 175.0 200.0 225.0 250.0 275.0 300.0 325.0 350.0 375.0 400.0 425.0 450.0 475.0 500.0 525.0 550.00.0
0.5
1.0(x10,000)
74
87
143 255199 298267157 213111
O
O
24
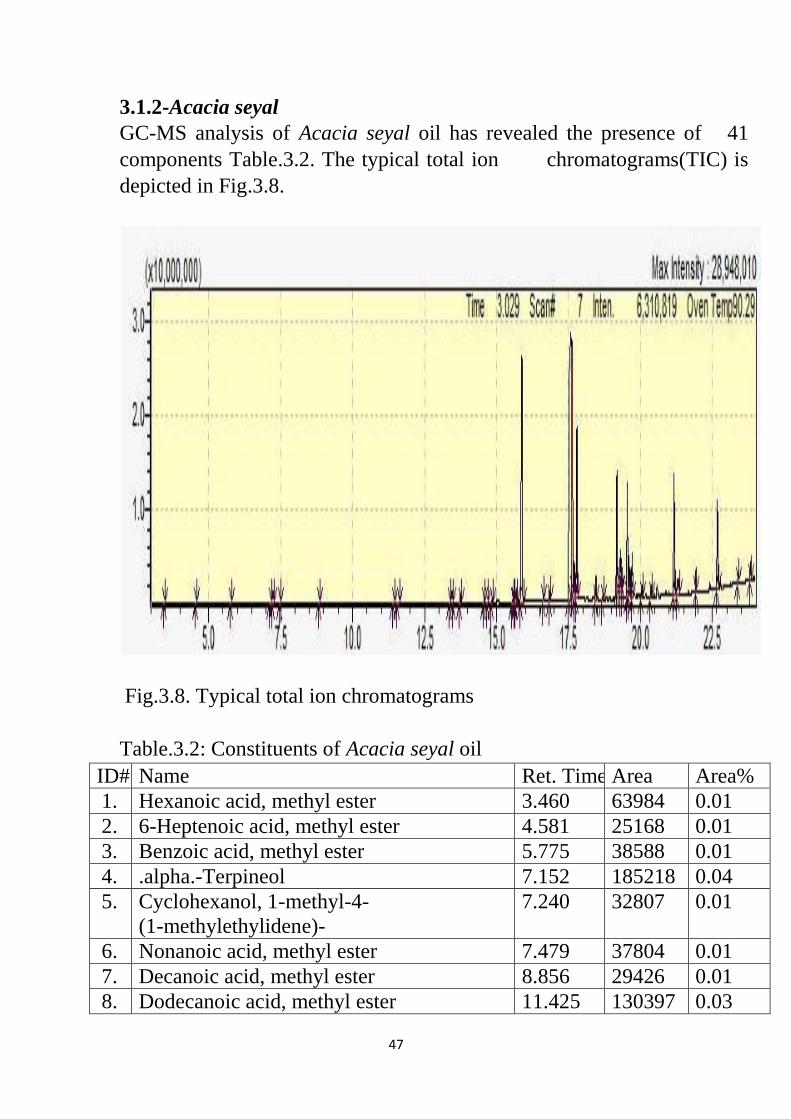
3.1.2-Acacia seyal
GC-MS analysis of Acacia seyal oil has revealed the presence of 41
components Table.3.2. The typical total ion chromatograms(TIC) is
depicted in Fig.3.8.
Fig.3.8. Typical total ion chromatograms
Table.3.2: Constituents of Acacia seyal oil
ID# Name Ret. Time Area Area%
1. Hexanoic acid, methyl ester 3.460 63984 0.01
2. 6-Heptenoic acid, methyl ester 4.581 25168 0.01
3. Benzoic acid, methyl ester 5.775 38588 0.01
4. .alpha.-Terpineol 7.152 185218 0.04
5. Cyclohexanol, 1-methyl-4-
(1-methylethylidene)-
7.240 32807 0.01
6. u Nonanoic acid, methyl ester 7.479 37804 0.01
7. Decanoic acid, methyl ester 8.856 29426 0.01
8. Dodecanoic acid, methyl ester 11.425 130397 0.03
24
9. 1-Naphthalenol 11.578 134504 0.03
10. Methyl 5,11,14-eicosatrienoate 13.396 61876 0.01
11. cis-5-Dodecenoic acid, methyl ester 13.475 43982 0.01
12. Methyl tetradecanoate 13.750 1429960 0.30
13. 5-Octadecenoic acid, methyl ester 14.563 259361 0.05
14. 6-Octadecenoic acid, methyl ester, (Z)- 14.667 107683 0.02
15. Pentadecanoic acid, methyl ester 14.829 601481 0.13
16. 7,10-Hexadecadienoic acid, methyl ester 15.561 342474 0.07
17. 9-Hexadecenoic acid, methyl ester, (Z)- 15.623 925120 0.20
18. cis-10-Nonadecenoic acid, methyl ester 15.666 2147248 0.45
19. Hexadecanoic acid, methyl ester 15.882 67988479 14.38
20. cis-10-Heptadecenoic acid, methyl ester 16.629 1209289 0.26
21. Heptadecanoic acid, methyl ester 16.840 1510407 0.32
22. 9,12-Octadecadienoic acid (Z,Z)-,
methyl ester
17.583 147472329 31.18
23. 9-Octadecenoic acid (Z)-, methyl ester 17.619 63093725 13.34
24. Phytol 17.706 5494922 1.16
25. Methyl stearate 17.793 36421222 7.70
26. Hexadeca-2,6,10,14-tetraen-1-ol,3,7,11,
16-tetramethyl-
18.447 4281397 0.91
27. Nonadecanoic acid, methyl ester 18.677 440187 0.09
28. Tridecanedial 19.186 23753434 5.02
29. Oxiraneoctanoic acid, 3-octyl-, methyl
ester
19.306 8406739 1.78
30. 11-Eicosenoic acid, methyl ester 19.343 4005619 0.85
31. Eicosanoic acid, methyl ester 19.543 23104505 4.89
32. PGH1, methyl ester 19.603 7111848 1.50
33. 9,12,15-Octadecatrienoic acid, 2,3-
dihydroxypropyl ester, (Z,Z,Z)-
19.713 8292833 1.75
34. Methyl 15-hydroxy-9,12-octadecadienoate 20.051 2982991 0.63
35. Heneicosanoic acid, methyl ester 20.366 2118192 0.45
36. Docosanoic acid, methyl ester 21.168 25770152 5.45
37. Tetrapentacontane 21.316 6276421 1.33
38. Tricosanoic acid, methyl ester 21.929 4078163 0.86
39. Tetracosanoic acid, methyl ester 22.671 18039742 3.81
40. Methyl 22-methyl-tetracosanoate 23.385 1530849 0.32
41. Dotriacontane 23.818 2937863 0.62

24
Some major constituents are discussed below:
9,12-Octadecadienoic acid (z,z)methyl esters (31.18%)
Mass spectrum of 9.12 octadecadienoic acid (z,z) methyl esters is
depicted in Fig.3.9.The peak at m\z 294 which appeared at R.T 17.583
corresponds to M+[C19H34O2]
+ .The at m\z 263 corresponds of loss
methoxyl function.
Hexadecanoic acid methyl ester (14.38%)
Mass spectrum of hexadecanoic acid methyl ester is depicted in Fig.3.10.
The peak at m\z 270, which appeared at R.T.15.882 corresponds to
M+[C17H34O2]
+ while the peak at m\z 239 is attributed to loss of
methoxyl function.
9-Octadecenoic acid(Z)methyl ester (13.34%)
The mass spectrum of 9-octadecenoic acid(z)methyl ester is shown in
Fig.3.11. The peak at m\z 296 which appeared at R.T.17.619 corresponds
to M+[C19H36O2]. The peak at m\z 264 is corresponds to loss of methoxyl
function.
Methyl stearate (7.70%)
Mass spectrum of methyl stearate is shown in Fig.3.12. The peak at m\z
298 which appeared at R.T. 17.793 corresponds to M+[C19H38O2]. The
peak at m\z 267 corresponds to loss of a methoxyl function.
Docosanoic acid, methyl ester (5.45%)
Fig.3.13 displays the mass spectrum of docosanoic acid, methyl. The
peak at m\z 354 which appeared at R.T.21.168 corresponds to
M+[C23H46O2]
+. The peak at m\z 323 corresponds loss of methoxyl
function.
Tridecanedial (5.02%)
Mass spectrum of tridecanedial shown in Fig.3.14. The peak at m\z 213
which appeared at R.T.19.186 corresponds to M+[C13H24O2]. The peak at
m\z 194.
Eicosanoic acid, methyl ester (4.89%)
Fig.3.15 shows the mass spectrum of eicosanoic acid, methyl ester. The
peak at m\z 326 which appeared at R.T.19.543 corresponds to
M+[C21H42O2]
+. The peak at m\z 263.
45
Tetracosanoic acid, methyl ester (3.81%)
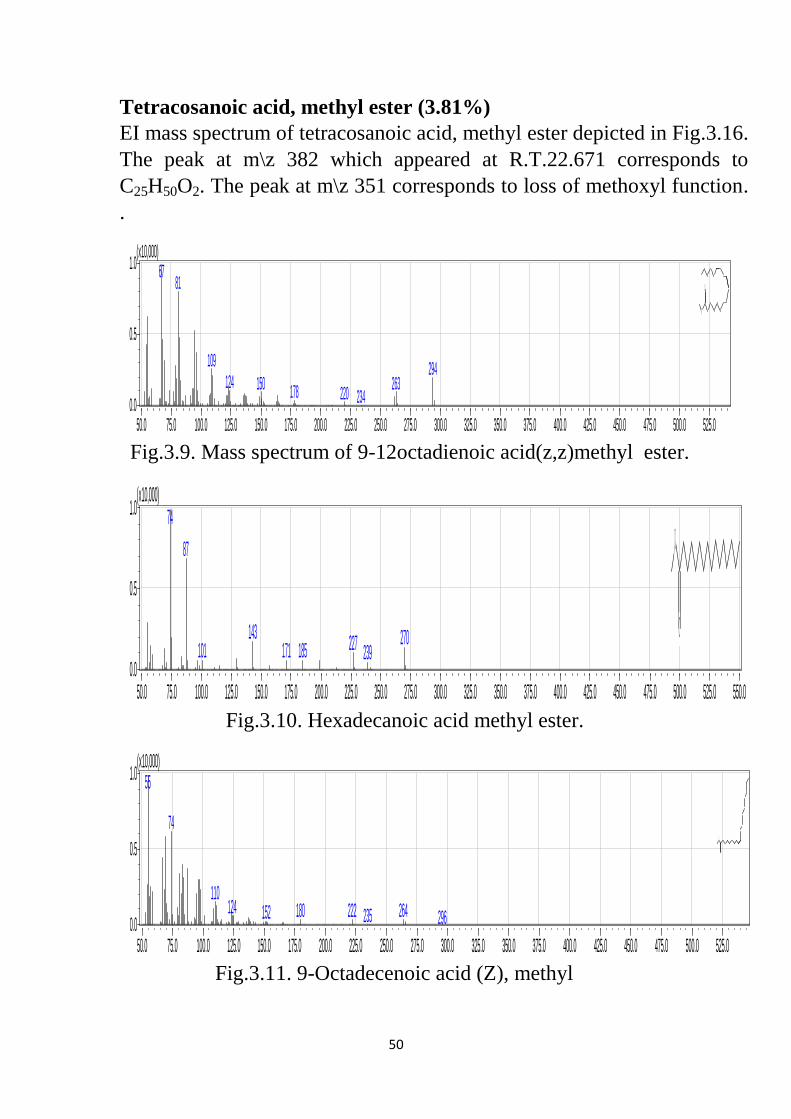
EI mass spectrum of tetracosanoic acid, methyl ester depicted in Fig.3.16.
The peak at m\z 382 which appeared at R.T.22.671 corresponds to
C25H50O2. The peak at m\z 351 corresponds to loss of methoxyl function.
.
Fig.3.9. Mass spectrum of 9-12octadienoic acid(z,z)methyl ester.
Fig.3.10. Hexadecanoic acid methyl ester.
Fig.3.11. 9-Octadecenoic acid (Z), methyl
50.0 75.0 100.0 125.0 150.0 175.0 200.0 225.0 250.0 275.0 300.0 325.0 350.0 375.0 400.0 425.0 450.0 475.0 500.0 525.00.0
0.5
1.0(x10,000)
6781
109 294124 263150 178 220 234
O
O
50.0 75.0 100.0 125.0 150.0 175.0 200.0 225.0 250.0 275.0 300.0 325.0 350.0 375.0 400.0 425.0 450.0 475.0 500.0 525.0 550.00.0
0.5
1.0(x10,000)
74
87
143 270227185171101 239
O
O
50.0 75.0 100.0 125.0 150.0 175.0 200.0 225.0 250.0 275.0 300.0 325.0 350.0 375.0 400.0 425.0 450.0 475.0 500.0 525.00.0
0.5
1.0(x10,000)
55
74
110124 264180 222152 235 296
O
O
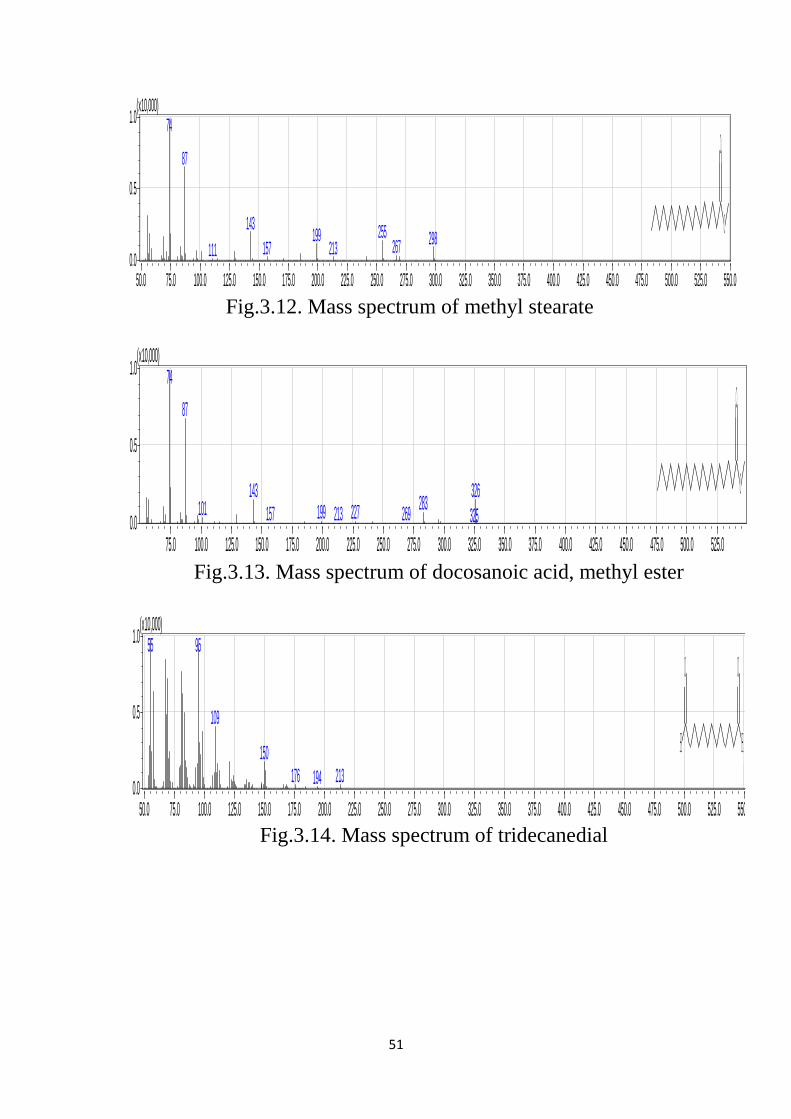
45
Fig.3.12. Mass spectrum of methyl stearate
Fig.3.13. Mass spectrum of docosanoic acid, methyl ester
Fig.3.14. Mass spectrum of tridecanedial
50.0 75.0 100.0 125.0 150.0 175.0 200.0 225.0 250.0 275.0 300.0 325.0 350.0 375.0 400.0 425.0 450.0 475.0 500.0 525.0 550.00.0
0.5
1.0(x10,000)
74
87
143 255199 298267157 213111
O
O
75.0 100.0 125.0 150.0 175.0 200.0 225.0 250.0 275.0 300.0 325.0 350.0 375.0 400.0 425.0 450.0 475.0 500.0 525.00.0
0.5
1.0(x10,000)
74
87
326143283101 199 227157 269213 325
O
O
50.0 75.0 100.0 125.0 150.0 175.0 200.0 225.0 250.0 275.0 300.0 325.0 350.0 375.0 400.0 425.0 450.0 475.0 500.0 525.0 550.00.0
0.5
1.0(x10,000)
55 95
109
150
213176 194
H
O
H
O
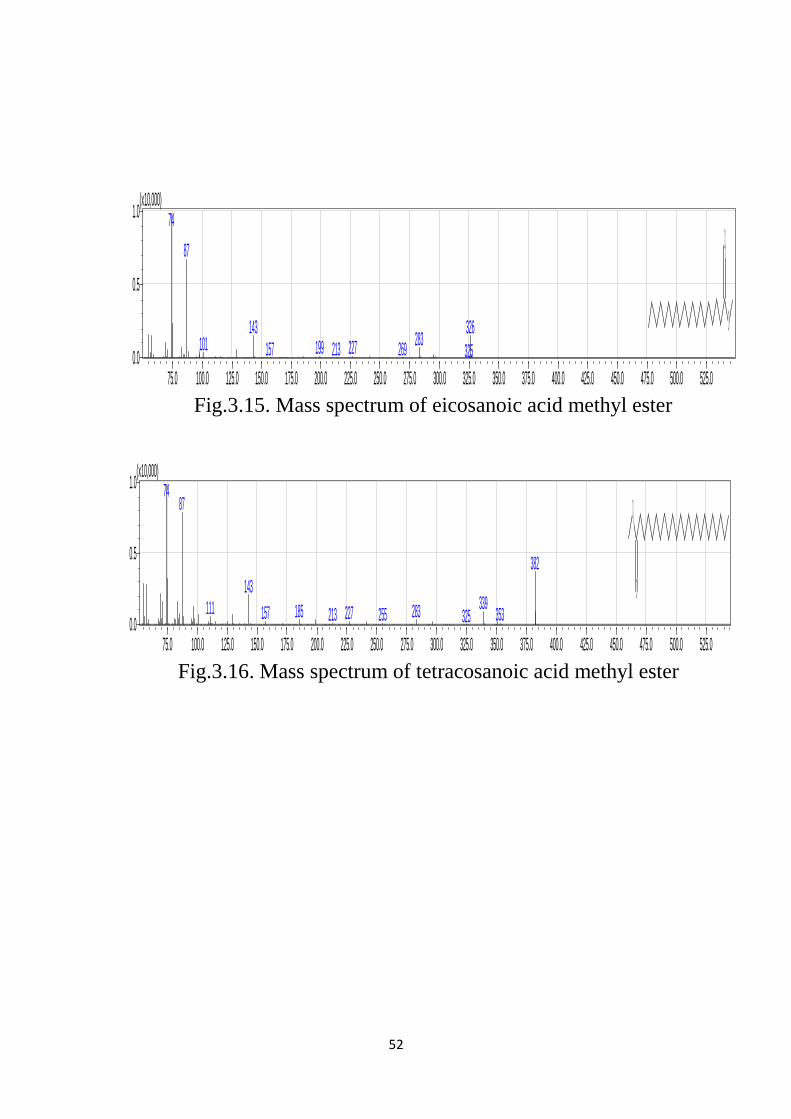
44
Fig.3.15. Mass spectrum of eicosanoic acid methyl ester
Fig.3.16. Mass spectrum of tetracosanoic acid methyl ester
75.0 100.0 125.0 150.0 175.0 200.0 225.0 250.0 275.0 300.0 325.0 350.0 375.0 400.0 425.0 450.0 475.0 500.0 525.00.0
0.5
1.0(x10,000)
74
87
326143283101 199 227157 269213 325
O
O
75.0 100.0 125.0 150.0 175.0 200.0 225.0 250.0 275.0 300.0 325.0 350.0 375.0 400.0 425.0 450.0 475.0 500.0 525.00.0
0.5
1.0(x10,000)
7487
382
143339111 283185 227157 255 353213 325
O
O
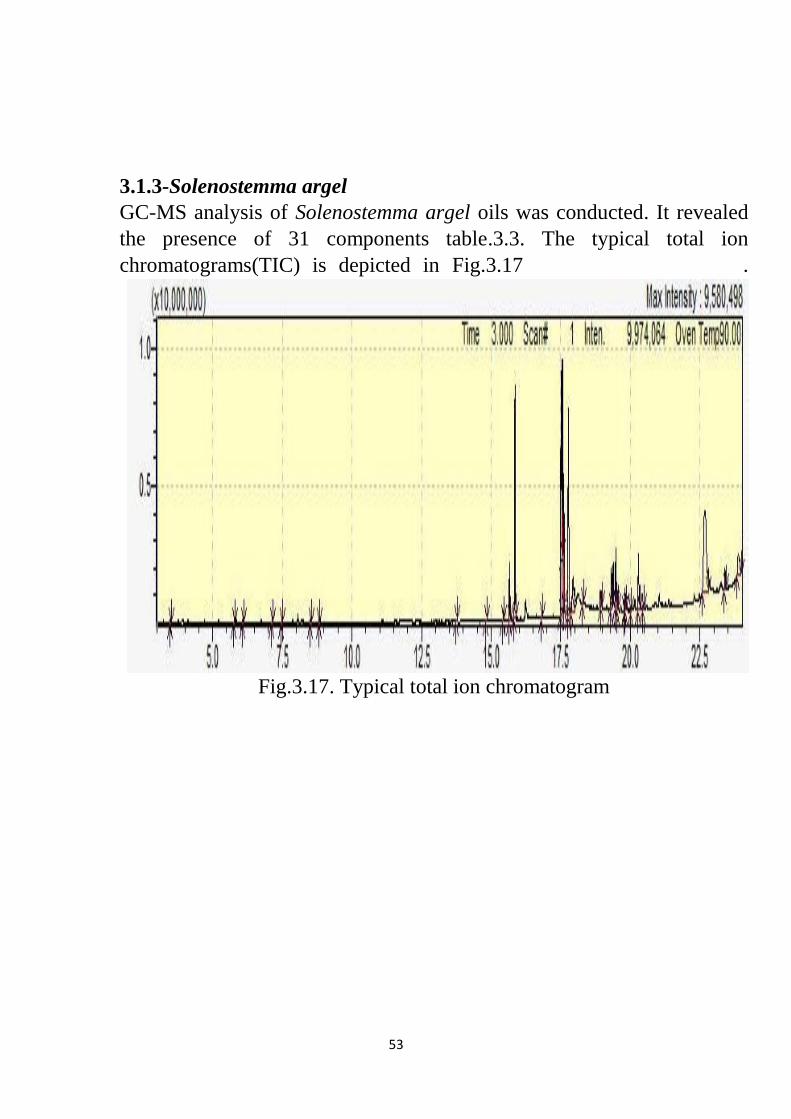
44
3.1.3-Solenostemma argel
GC-MS analysis of Solenostemma argel oils was conducted. It revealed
the presence of 31 components table.3.3. The typical total ion
chromatograms(TIC) is depicted in Fig.3.17 .
Fig.3.17. Typical total ion chromatogram
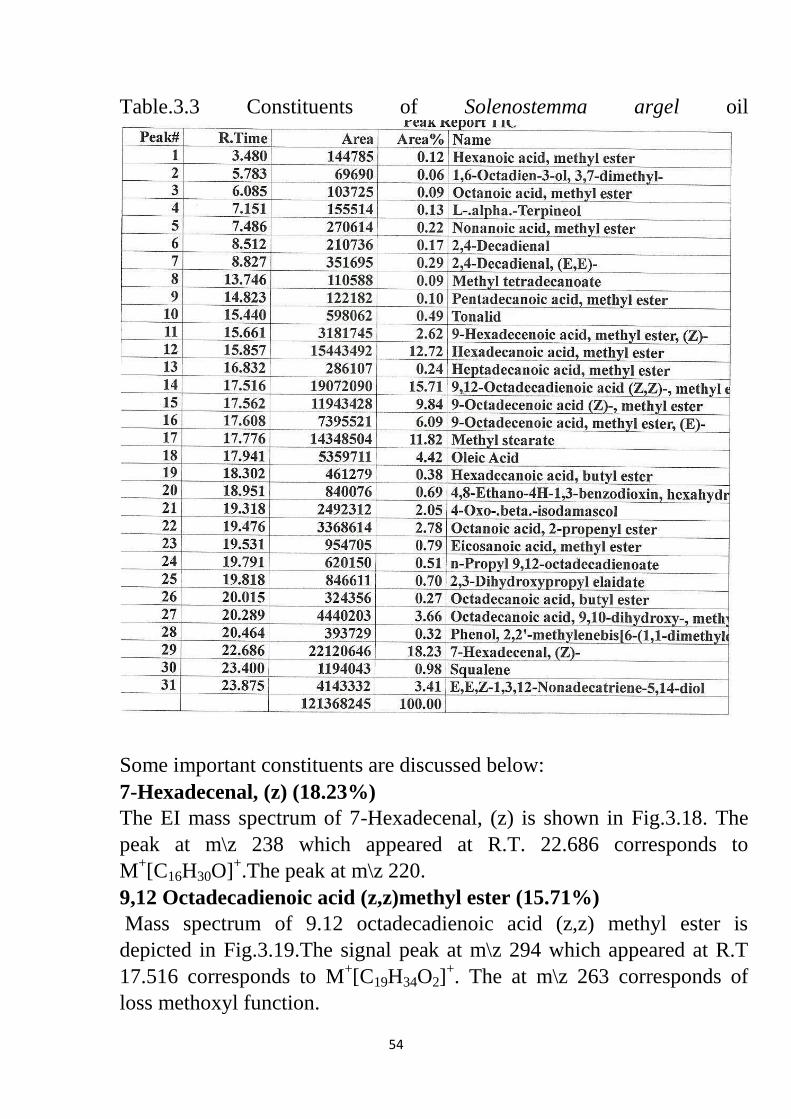
42
Table.3.3 Constituents of Solenostemma argel oil
Some important constituents are discussed below:
7-Hexadecenal, (z) (18.23%)
The EI mass spectrum of 7-Hexadecenal, (z) is shown in Fig.3.18. The
peak at m\z 238 which appeared at R.T. 22.686 corresponds to
M+[C16H30O]
+.The peak at m\z 220.
9,12 Octadecadienoic acid (z,z)methyl ester (15.71%)
Mass spectrum of 9.12 octadecadienoic acid (z,z) methyl ester is
depicted in Fig.3.19.The signal peak at m\z 294 which appeared at R.T
17.516 corresponds to M+[C19H34O2]
+. The at m\z 263 corresponds of
loss methoxyl function.

44
Hexadecanoic acid methyl ester (12.72 %)
Mass spectrum of hexadecanoic acid methyl ester is depicted in Fig.3.20.
The peak at m\z 270, which appeared at R.T.15.857 corresponds to
M+[C17H34O2]
+ while the peak at m\z 239 is attributed to loss of methoxyl
function.
Methyl stearate (11.82%)
Mass spectrum of methyl stearate is shown in Fig.3.21. The peak at m\z
298which appeared at R.T. 17.775 corresponds to M+[C19H38O2]. The
peak at m\z 267 corresponds to loss of methoxyl function.
9-Octadecenoic acid (Z), methyl ester (9.84%)
Fig.3.22 displays the mass spectrum of 9-octadecenoic acid (z)-, methyl
ester. The peak at m\z 296which appeared at R.T.
17. 562 corresponds to M+[C19H36O2]
+. The signal at m/z 264 is
attributed to loss of methoxyl function.
9-Octadecenoic acid, methyl ester, (E) (6.09%)
Fig.3.23 shows the mass spectrum of 9-octadecenoic acid, methyl ester.
The peak at m\z 296which appeared at R.T.17. 608 corresponds
toM+[C19H36O2]
+. The peak at m\z 264 accounts to loss of methoxyl
function.
Oleic Acid (4.42%)
Mass spectrum of Oleic acid) is shown in Fig.3.24. The peak at m\z 282
which appeared at R.T 17.941 corresponds toC18H34O2. The peak at m\z
264.
Octadecanoic acid,9,10-dihydroxy-, methyl ester (3.66%)
Mass spectrum of octadecanoic acid,9,1.0-dihydroxy-, methyl is shown
in Fig.3.25. The peak at m\z 330 which appeared at R.T 20.289
corresponds to C19H38O4. The peak at m\z 281.
E,E,Z-1,3,12-Nonadecatriene-5,14-diol (3.41% )
Mass spectrum E, E, Z-1,3,12-Nonadecatriene-5,14-diol is shown in
Fig.3.26. The peak at m\z 294 which appeared at R.T 23.875
corresponds to C19H38O4. The peak at m\z 262 corresponds to loss of
methoxyl function.
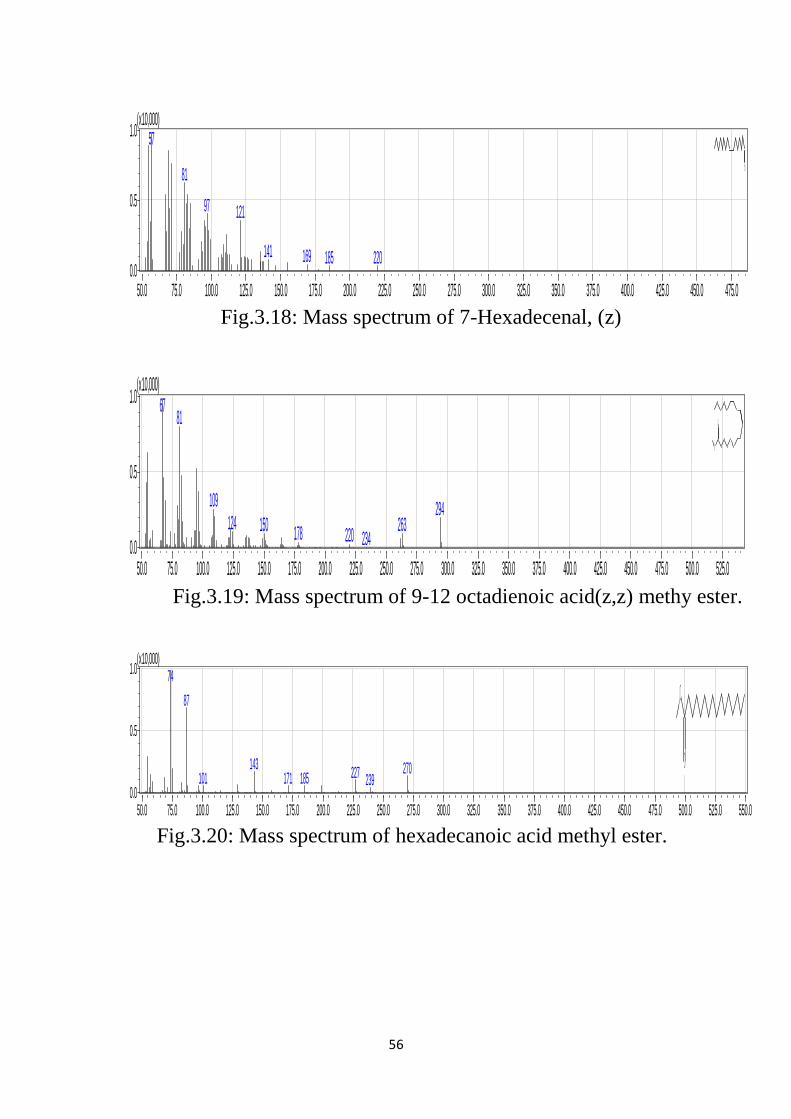
44
Fig.3.18: Mass spectrum of 7-Hexadecenal, (z)
Fig.3.19: Mass spectrum of 9-12 octadienoic acid(z,z) methy ester.
Fig.3.20: Mass spectrum of hexadecanoic acid methyl ester.
50.0 75.0 100.0 125.0 150.0 175.0 200.0 225.0 250.0 275.0 300.0 325.0 350.0 375.0 400.0 425.0 450.0 475.00.0
0.5
1.0(x10,000)
57
81
97 121
141 169 220185
O
50.0 75.0 100.0 125.0 150.0 175.0 200.0 225.0 250.0 275.0 300.0 325.0 350.0 375.0 400.0 425.0 450.0 475.0 500.0 525.00.0
0.5
1.0(x10,000)
6781
109 294124 263150 178 220 234
O
O
50.0 75.0 100.0 125.0 150.0 175.0 200.0 225.0 250.0 275.0 300.0 325.0 350.0 375.0 400.0 425.0 450.0 475.0 500.0 525.0 550.00.0
0.5
1.0(x10,000)
74
87
143 270227185171101 239
O
O

44
Fig.3.21: Mass spectrum of methyl stearate
Fig.3.22: Mass spectrum of 9-octadecenoic acid (z)-, methyl ester
Fig.3.23: Mass spectrum of 9-octadecenoic acid, methyl ester(E)
50.0 75.0 100.0 125.0 150.0 175.0 200.0 225.0 250.0 275.0 300.0 325.0 350.0 375.0 400.0 425.0 450.0 475.0 500.0 525.0 550.00.0
0.5
1.0(x10,000)
74
87
143 255199 298267157 213111
O
O
50.0 75.0 100.0 125.0 150.0 175.0 200.0 225.0 250.0 275.0 300.0 325.0 350.0 375.0 400.0 425.0 450.0 475.0 500.0 525.00.0
0.5
1.0(x10,000)
55
74
110124 264180 222152 235 296
O
O
50.0 75.0 100.0 125.0 150.0 175.0 200.0 225.0 250.0 275.0 300.0 325.0 350.0 375.0 400.0 425.0 450.0 475.0 500.0 525.0 550.00.0
0.5
1.0(x10,000)
55 83
264111
222180137 166 296246
O
O
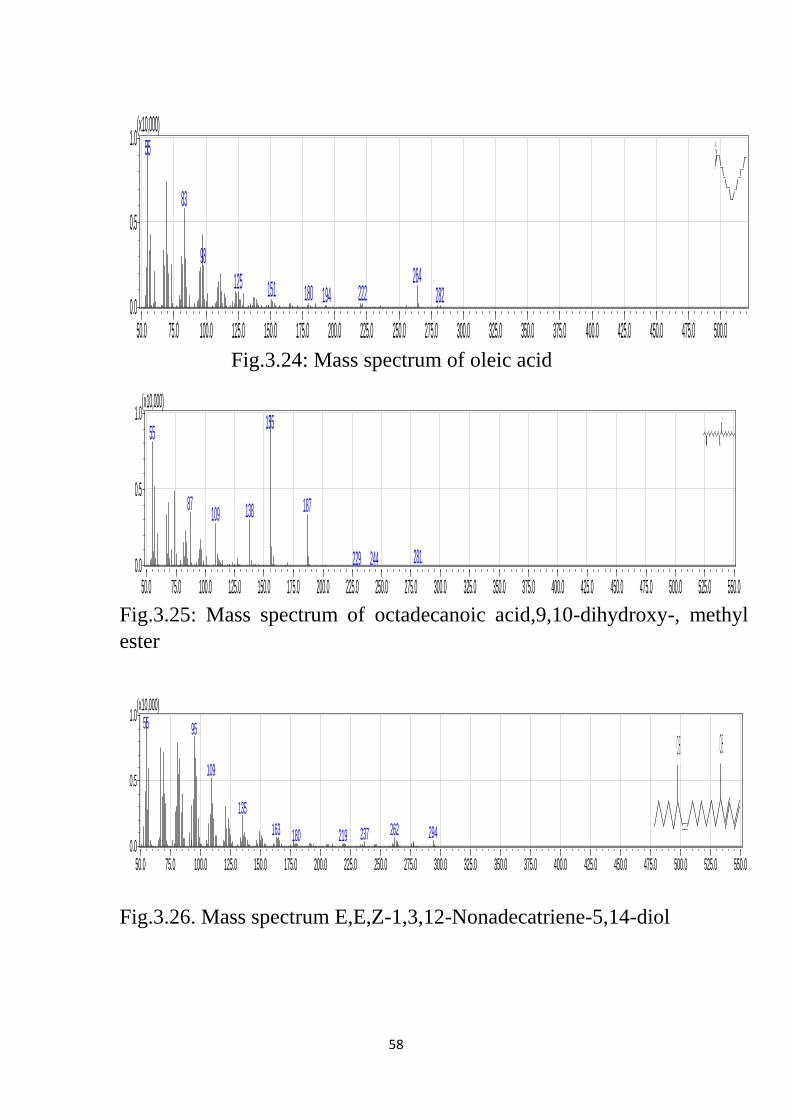
44
Fig.3.24: Mass spectrum of oleic acid
Fig.3.25: Mass spectrum of octadecanoic acid,9,10-dihydroxy-, methyl
ester
Fig.3.26. Mass spectrum E,E,Z-1,3,12-Nonadecatriene-5,14-diol
50.0 75.0 100.0 125.0 150.0 175.0 200.0 225.0 250.0 275.0 300.0 325.0 350.0 375.0 400.0 425.0 450.0 475.0 500.00.0
0.5
1.0(x10,000)
55
83
98264125 151 222180 282194
HO
O
50.0 75.0 100.0 125.0 150.0 175.0 200.0 225.0 250.0 275.0 300.0 325.0 350.0 375.0 400.0 425.0 450.0 475.0 500.0 525.0 550.00.0
0.5
1.0(x10,000)
15555
87 187138109
281229 244
OH
OH
O
O
50.0 75.0 100.0 125.0 150.0 175.0 200.0 225.0 250.0 275.0 300.0 325.0 350.0 375.0 400.0 425.0 450.0 475.0 500.0 525.0 550.00.0
0.5
1.0(x10,000)
55 95
109
135
262163 294237219180
OH OH

44
3.1.4-Coriandrumm sativum
GC-MS analysis of Coriandrumm sativum oil revealed the presence of 52
components table 3.4. The typical total ion chromatograms(TIC) is
depicted in Fig.3.27
Fig.3.27. Typical total ion chromatograms
Table 3.4: Constituents of Coriandrumm sativum oil
ID# Name Ret.Time Area Area%
1. .alpha.-Pinene 4.186 3414165 0.41
2. Camphene 4.402 415376 0.05
3. Bicyclo[3.1.0]hexane,4-methylene-
1-(1-methylethyl)-
4.720 95322 0.01
4. .beta.-Pinene 4.788 327293 0.04
5. .beta.-Myrcene 4.910 624749 0.07
6. Octanal 5.092 103650 0.01
7. Heptanoic acid, methyl ester 5.377 66410 0.01
8. p-Cymene 5.442 123215 0.01
9. D-Limonene 5.503 1401622 0.17
10. .gamma.-Terpinene 5.936 470879 0.06
45
11. 1-Octanol 6.076 62489 0.01
12. .alpha.-Methyl-.alpha.-[4-methyl-3-
pentenyl]oxiranemethanol
6.146 33725 0.00
13. Undecane 6.460 268865 0.03
14. 1,6-Octadien-3-ol, 3,7-dimethyl- 6.516 22273211 2.67
15. Octanoic acid, methyl ester 6.839 120323 0.01
16. Methyl 1-cyclohexene-1-carboxylate 7.129 104561 0.01
17. Bicyclo[2.2.1]heptan-2-one, 1,7,7-
trimethyl-, (1S)-
7.277 2442106 0.29
18. L-.alpha.-Terpineol 7.919 454710 0.05
19. Decanal 8.042 520174 0.06
20. Nonanoic acid, methyl ester 8.283 125492 0.02
21. Geraniol 8.756 1326269 0.16
22. Undecanal 9.466 187747 0.02
23. Decanoic acid, methyl ester 9.674 423212 0.05
24. Dodecanal 10.821 415488 0.05
25. Undecanoic acid, methyl ester 10.994 102231 0.01
26. 1,E-11,Z-13-Octadecatriene 11.747 88424 0.01
27. Dodecanoic acid, methyl ester 12.250 484844 0.06
28. Methyl tetradecanoate 14.567 1670774 0.20
29. 5-Octadecenoic acid, methyl ester 15.376 65185 0.01
30. 4-Octadecenoic acid, methyl ester 15.483 110150 0.01
31. Pentadecanoic acid, methyl ester 15.642 1088860 0.13
32. 7,10-Hexadecadienoic acid, methyl
Ester
16.371 226122 0.03
33. 7-Hexadecenoic acid, methyl ester,
(Z)-
16.450 6455686 0.77
34. 9-Hexadecenoic acid, methyl ester,
(Z)-
16.474 7444450 0.89
35. Hexadecanoic acid, methyl ester 16.679 66947485 8.04
36. 14,17-Octadecadienoic acid, methyl
Ester
17.437 3778590 0.45
37. Heptadecanoic acid, methyl ester 17.649 1553399 0.19
38. 6,9-Octadecadienoic acid, methyl
Ester
18.203 6179904 0.74
39. 5,8-Octadecadienoic acid, methyl
Ester
18.252 1760109 0.21

45
40. 9,12-Octadecadienoic acid (Z,Z)-, methyl
ester
18.370 117870779 14.15
41. 9-Octadecenoic acid (Z)-, methyl
Ester
18.498 513146985 61.62
42. Methyl stearate 18.608 25988268 3.12
43. 6-Octadecenoic acid, (Z)- 18.783 16807311 2.02
44. cis-10-Nonadecenoic acid, methyl
ester
19.280 2514817 0.30
45. cis-11-Eicosenoic acid, methyl ester 20.117 11137876 1.34
46. Eicosanoic acid, methyl ester 20.340 3446015 0.41
47. Ethyl stearate, 9,12-diepoxy 21.323 2176449 0.26
48. 9,12-Octadecadienoyl chloride,
(Z,Z)-
21.572 2054112 0.25
49. Docosanoic acid, methyl ester 21.957 1496863 0.18
50. Tricosanoic acid, methyl ester 22.724 298620 0.04
51. Heneicosane 23.201 640730 0.08
52. Tetracosanoic acid, methyl ester 23.459 1720021 0.21
Some important Constituents are discussed below:
9-Octadecenoic acid(z)-, methyl ester (61.62%)
The EI mass spectrum of 9-octadecenoic acid(z)-, methyl ester is shown
in Fig.3.28. The peak at m\z 296 which appeared at R.T. 18.498
corresponds to M+[C19 H36 O2]
+.The peak at m\z 264 corresponds to loss
methoxyl function.
9,12-Octadecadienoic acid (z,z)methyl ester (14.15%)
Mass spectrum of 9.12 octadecadienoic acid (z,z) methyl ester is
depicted in Fig.3.29.The peak at m\z 294 which appeared at R.T 18.370
corresponds to M+[C19H34O2]
+ .The at m\z 263 corresponds of loss
methoxyal function.
Hexadecanoic acid methyl ester (8.04%)
Mass spectrum of hexadecanoic acid methyl ester is depicted in Fig.3.30.
The peak at m\z 270, which appeared at R.T.16.679 corresponds to
M+[C17H34O2]
+ while the peak at m\z 239 is attributed to loss of methoxyl
function.
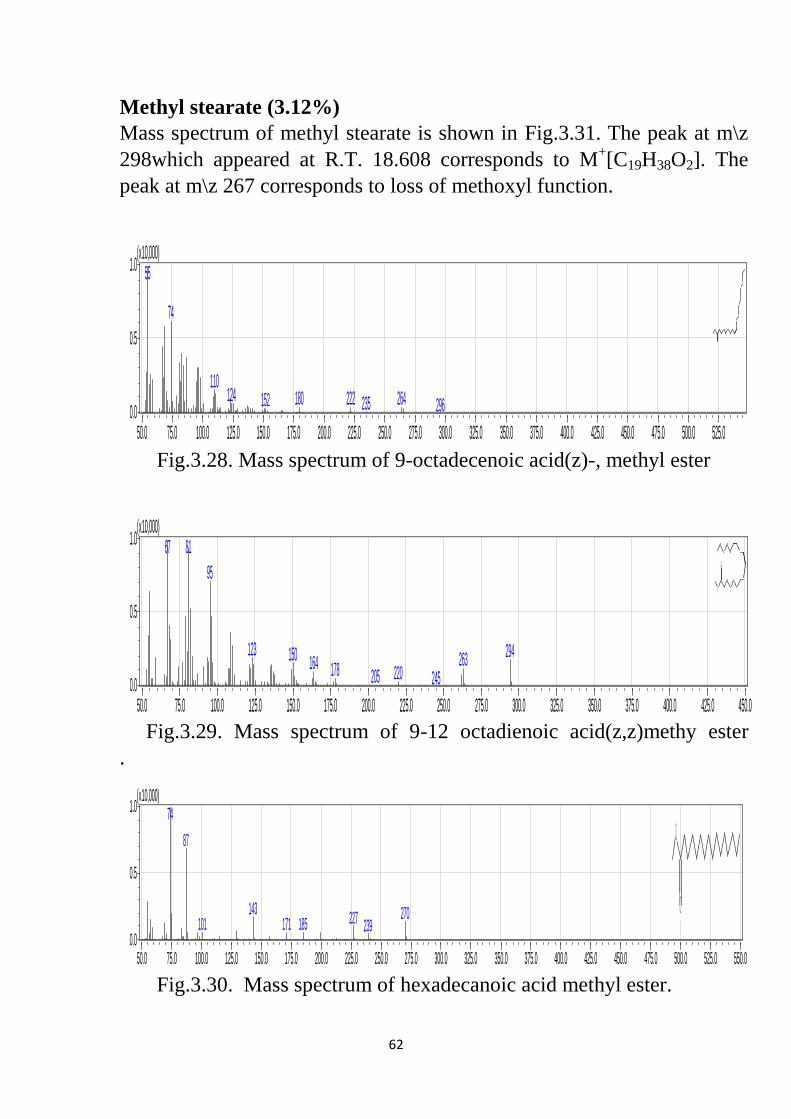
44
Methyl stearate (3.12%)
Mass spectrum of methyl stearate is shown in Fig.3.31. The peak at m\z
298which appeared at R.T. 18.608 corresponds to M+[C19H38O2]. The
peak at m\z 267 corresponds to loss of methoxyl function.
Fig.3.28. Mass spectrum of 9-octadecenoic acid(z)-, methyl ester
Fig.3.29. Mass spectrum of 9-12 octadienoic acid(z,z)methy ester
.
Fig.3.30. Mass spectrum of hexadecanoic acid methyl ester.
50.0 75.0 100.0 125.0 150.0 175.0 200.0 225.0 250.0 275.0 300.0 325.0 350.0 375.0 400.0 425.0 450.0 475.0 500.0 525.00.0
0.5
1.0(x10,000)
55
74
110124 264180 222152 235 296
O
O
50.0 75.0 100.0 125.0 150.0 175.0 200.0 225.0 250.0 275.0 300.0 325.0 350.0 375.0 400.0 425.0 450.00.0
0.5
1.0(x10,000)
67 81
95
123 294150 263164 178 220205 245
O
O
50.0 75.0 100.0 125.0 150.0 175.0 200.0 225.0 250.0 275.0 300.0 325.0 350.0 375.0 400.0 425.0 450.0 475.0 500.0 525.0 550.00.0
0.5
1.0(x10,000)
74
87
143 270227185171101 239
O
O

44
Fig.3.31. Mass spectrum of methyl stearate
3.1.5-Medicago-sativa
GC-MS analysis of Medicago-sativa oils was conducted.GC-MS
analysis revealed the presence of 26 components, see Table 3.5. The
typical total ion chromatograms(TIC) is depicted in Fig.3.32.
Fig.3.32. Typical total ion chromatograms
Table3.5 constituents of Medicago-sativa oil
ID# Name Ret.Time Area Area%
1. Butylated Hydroxytoluene 11.392 174713 0.13
50.0 75.0 100.0 125.0 150.0 175.0 200.0 225.0 250.0 275.0 300.0 325.0 350.0 375.0 400.0 425.0 450.0 475.0 500.0 525.0 550.00.0
0.5
1.0(x10,000)
74
87
143 255199 298267157 213111
O
O
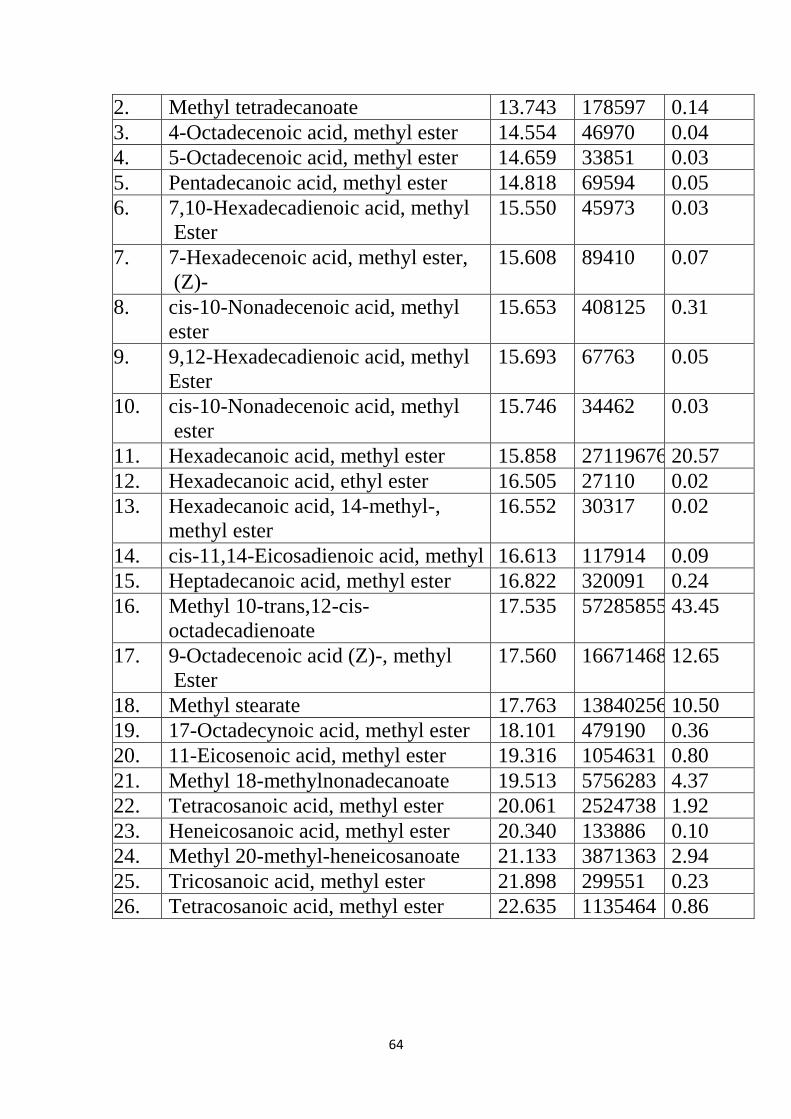
42
2. Methyl tetradecanoate 13.743 178597 0.14
3. 4-Octadecenoic acid, methyl ester 14.554 46970 0.04
4. 5-Octadecenoic acid, methyl ester 14.659 33851 0.03
5. Pentadecanoic acid, methyl ester 14.818 69594 0.05
6. 7,10-Hexadecadienoic acid, methyl
Ester
15.550 45973 0.03
7. 7-Hexadecenoic acid, methyl ester,
(Z)-
15.608 89410 0.07
8. cis-10-Nonadecenoic acid, methyl
ester
15.653 408125 0.31
9. 9,12-Hexadecadienoic acid, methyl
Ester
15.693 67763 0.05
10. cis-10-Nonadecenoic acid, methyl
ester
15.746 34462 0.03
11. Hexadecanoic acid, methyl ester 15.858 27119676 20.57
12. Hexadecanoic acid, ethyl ester 16.505 27110 0.02
13. Hexadecanoic acid, 14-methyl-,
methyl ester
16.552 30317 0.02
14. cis-11,14-Eicosadienoic acid, methyl ester 16.613 117914 0.09
15. Heptadecanoic acid, methyl ester 16.822 320091 0.24
16. Methyl 10-trans,12-cis-
octadecadienoate
17.535 57285855 43.45
17. 9-Octadecenoic acid (Z)-, methyl
Ester
17.560 16671468 12.65
18. Methyl stearate 17.763 13840256 10.50
19. 17-Octadecynoic acid, methyl ester 18.101 479190 0.36
20. 11-Eicosenoic acid, methyl ester 19.316 1054631 0.80
21. Methyl 18-methylnonadecanoate 19.513 5756283 4.37
22. Tetracosanoic acid, methyl ester 20.061 2524738 1.92
23. Heneicosanoic acid, methyl ester 20.340 133886 0.10
24. Methyl 20-methyl-heneicosanoate 21.133 3871363 2.94
25. Tricosanoic acid, methyl ester 21.898 299551 0.23
26. Tetracosanoic acid, methyl ester 22.635 1135464 0.86
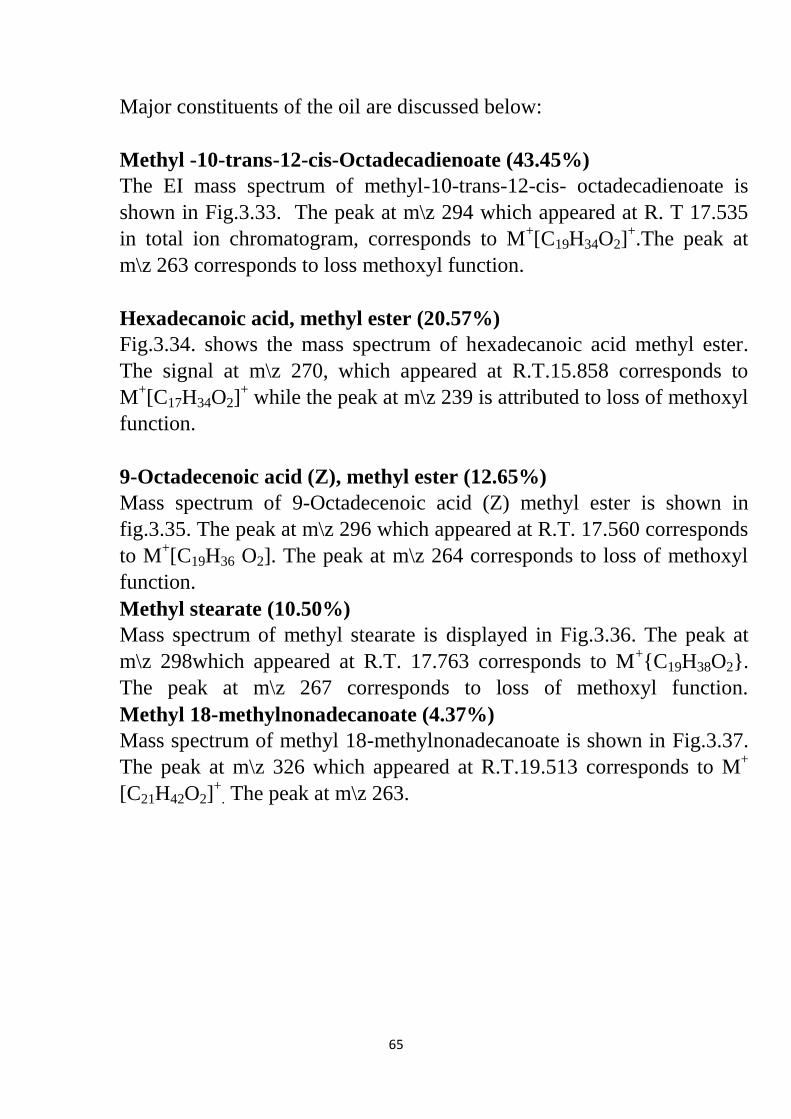
44
Major constituents of the oil are discussed below:
Methyl -10-trans-12-cis-Octadecadienoate (43.45%)
The EI mass spectrum of methyl-10-trans-12-cis- octadecadienoate is
shown in Fig.3.33. The peak at m\z 294 which appeared at R. T 17.535
in total ion chromatogram, corresponds to M+[C19H34O2]
+.The peak at
m\z 263 corresponds to loss methoxyl function.
Hexadecanoic acid, methyl ester (20.57%)
Fig.3.34. shows the mass spectrum of hexadecanoic acid methyl ester.
The signal at m\z 270, which appeared at R.T.15.858 corresponds to
M+[C17H34O2]
+ while the peak at m\z 239 is attributed to loss of methoxyl
function.
9-Octadecenoic acid (Z), methyl ester (12.65%)
Mass spectrum of 9-Octadecenoic acid (Z) methyl ester is shown in
fig.3.35. The peak at m\z 296 which appeared at R.T. 17.560 corresponds
to M+[C19H36 O2]. The peak at m\z 264 corresponds to loss of methoxyl
function.
Methyl stearate (10.50%)
Mass spectrum of methyl stearate is displayed in Fig.3.36. The peak at
m\z 298which appeared at R.T. 17.763 corresponds to M+{C19H38O2}.
The peak at m\z 267 corresponds to loss of methoxyl function.
Methyl 18-methylnonadecanoate (4.37%)
Mass spectrum of methyl 18-methylnonadecanoate is shown in Fig.3.37.
The peak at m\z 326 which appeared at R.T.19.513 corresponds to M+
[C21H42O2]+
. The peak at m\z 263.
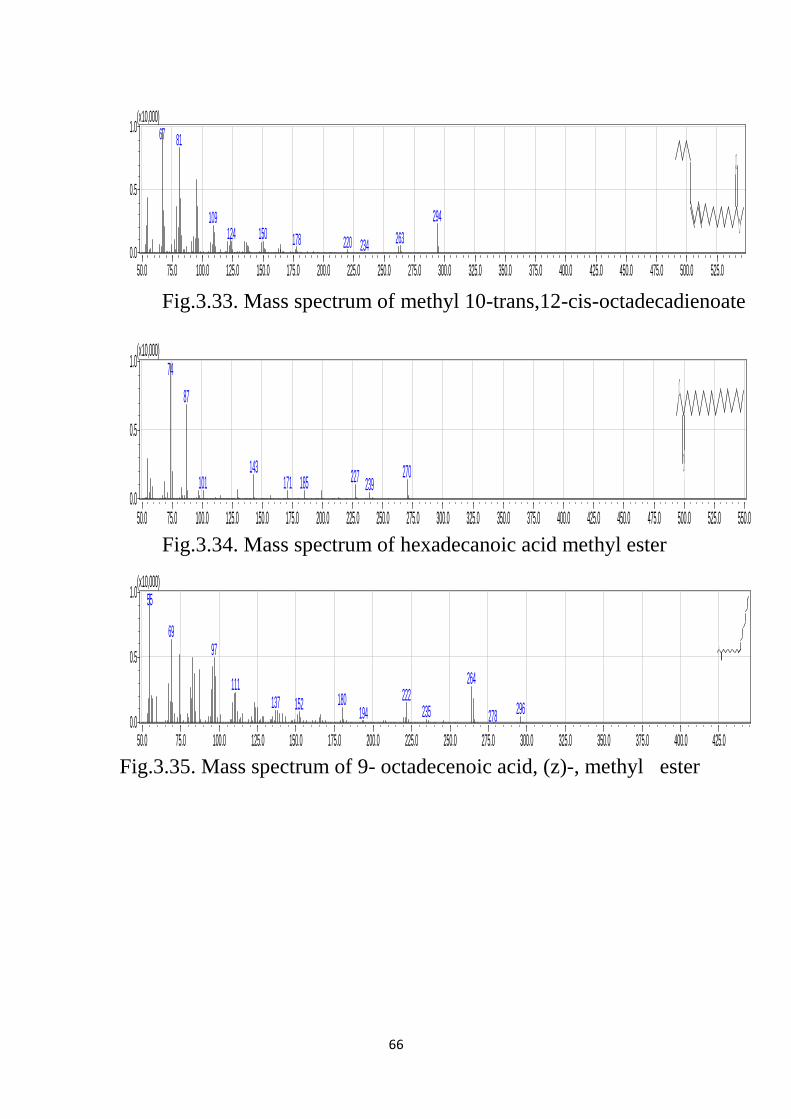
44
Fig.3.33. Mass spectrum of methyl 10-trans,12-cis-octadecadienoate
Fig.3.34. Mass spectrum of hexadecanoic acid methyl ester
Fig.3.35. Mass spectrum of 9- octadecenoic acid, (z)-, methyl ester
50.0 75.0 100.0 125.0 150.0 175.0 200.0 225.0 250.0 275.0 300.0 325.0 350.0 375.0 400.0 425.0 450.0 475.0 500.0 525.00.0
0.5
1.0(x10,000)
67 81
294109150124 263178 220 234
O
O
50.0 75.0 100.0 125.0 150.0 175.0 200.0 225.0 250.0 275.0 300.0 325.0 350.0 375.0 400.0 425.0 450.0 475.0 500.0 525.0 550.00.0
0.5
1.0(x10,000)
74
87
143 270227185171101 239
O
O
50.0 75.0 100.0 125.0 150.0 175.0 200.0 225.0 250.0 275.0 300.0 325.0 350.0 375.0 400.0 425.00.0
0.5
1.0(x10,000)
55
6997
264111222180137 152 296235194 278
O
O
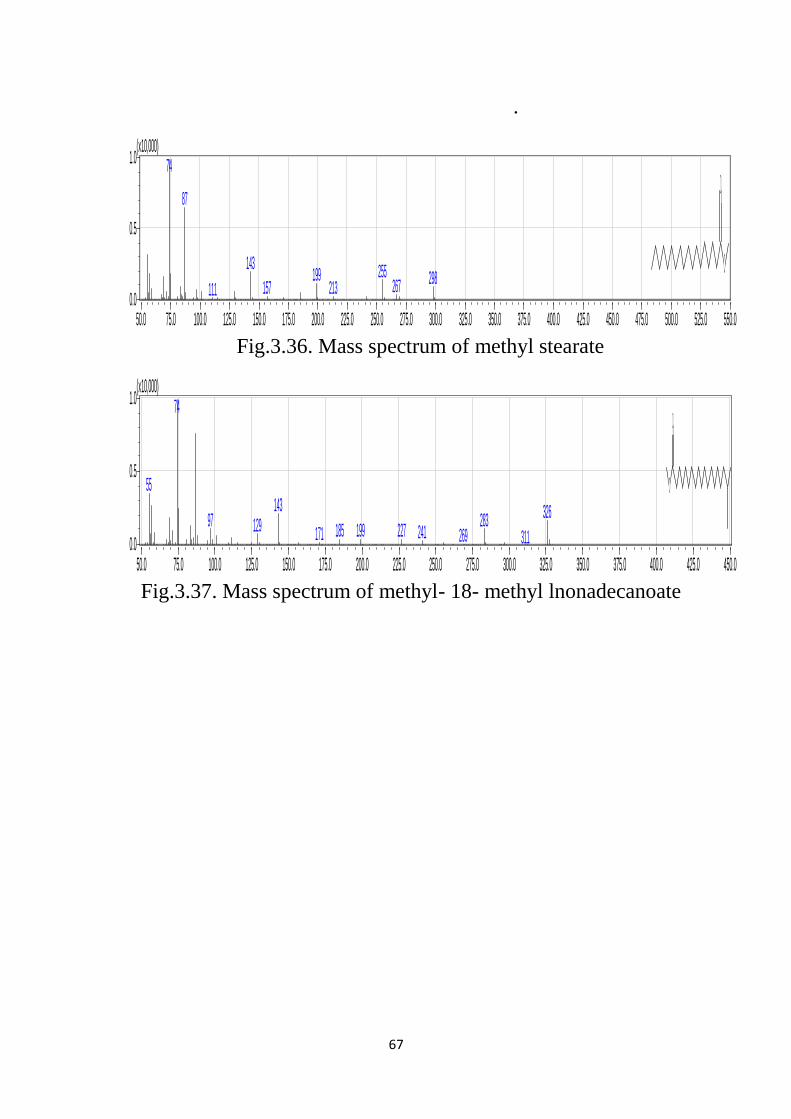
44
.
Fig.3.36. Mass spectrum of methyl stearate
Fig.3.37. Mass spectrum of methyl- 18- methyl lnonadecanoate
50.0 75.0 100.0 125.0 150.0 175.0 200.0 225.0 250.0 275.0 300.0 325.0 350.0 375.0 400.0 425.0 450.0 475.0 500.0 525.0 550.00.0
0.5
1.0(x10,000)
74
87
143 255199 298267157 213111
O
O
50.0 75.0 100.0 125.0 150.0 175.0 200.0 225.0 250.0 275.0 300.0 325.0 350.0 375.0 400.0 425.0 450.00.0
0.5
1.0(x10,000)
74
55143 32697 283129 199 227185 241171 269 311
O
O
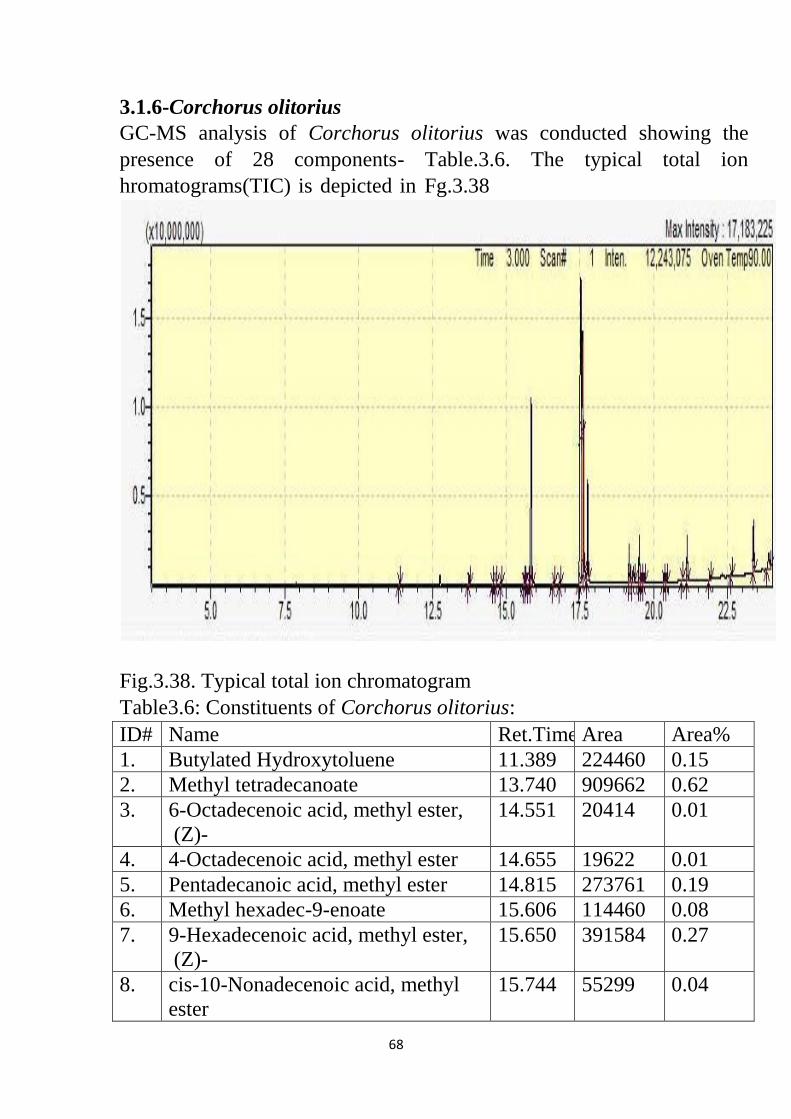
44
3.1.6-Corchorus olitorius
GC-MS analysis of Corchorus olitorius was conducted showing the
presence of 28 components- Table.3.6. The typical total ion
hromatograms(TIC) is depicted in Fg.3.38
Fig.3.38. Typical total ion chromatogram
Table3.6: Constituents of Corchorus olitorius:
ID# Name Ret.Time Area Area%
1. Butylated Hydroxytoluene 11.389 224460 0.15
2. Methyl tetradecanoate 13.740 909662 0.62
3. 6-Octadecenoic acid, methyl ester,
(Z)-
14.551 20414 0.01
4. 4-Octadecenoic acid, methyl ester 14.655 19622 0.01
5. Pentadecanoic acid, methyl ester 14.815 273761 0.19
6. Methyl hexadec-9-enoate 15.606 114460 0.08
7. 9-Hexadecenoic acid, methyl ester,
(Z)-
15.650 391584 0.27
8. cis-10-Nonadecenoic acid, methyl
ester
15.744 55299 0.04
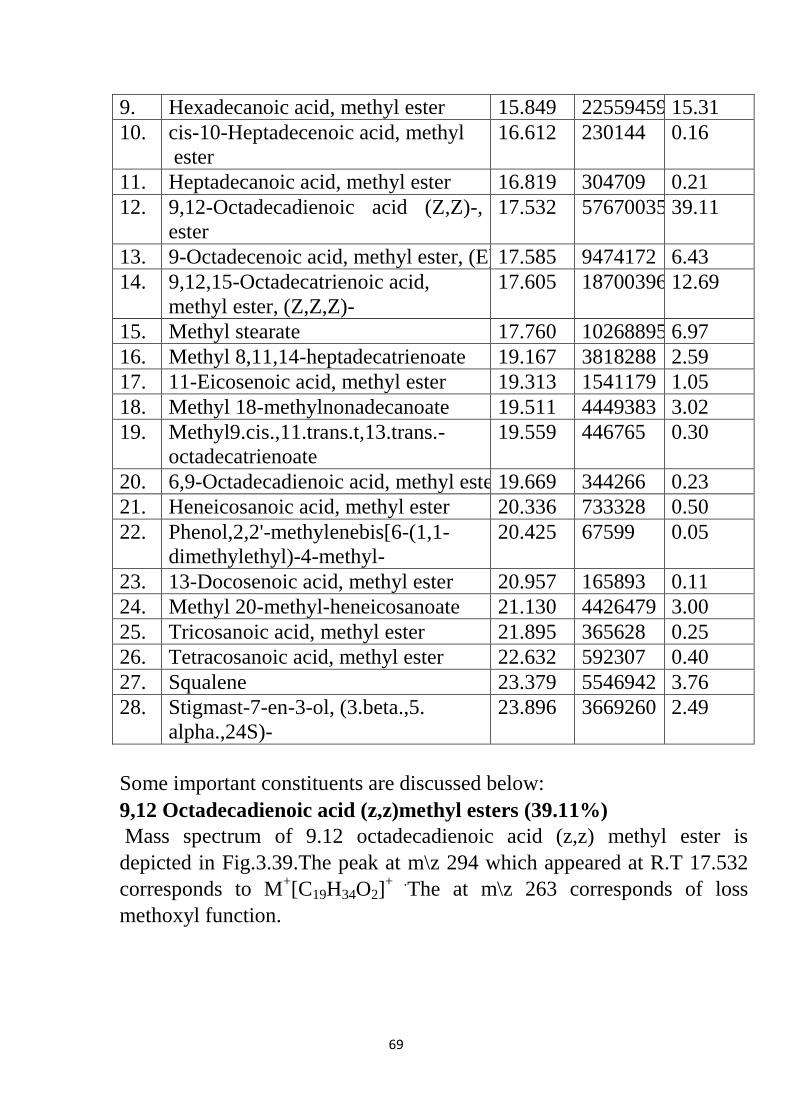
44
9. Hexadecanoic acid, methyl ester 15.849 22559459 15.31
10. cis-10-Heptadecenoic acid, methyl
ester
16.612 230144 0.16
11. Heptadecanoic acid, methyl ester 16.819 304709 0.21
12. 9,12-Octadecadienoic acid (Z,Z)-, methyl
ester
17.532 57670035 39.11
13. 9-Octadecenoic acid, methyl ester, (E)- 17.585 9474172 6.43
14. 9,12,15-Octadecatrienoic acid,
methyl ester, (Z,Z,Z)-
17.605 18700396 12.69
15. Methyl stearate 17.760 10268895 6.97
16. Methyl 8,11,14-heptadecatrienoate 19.167 3818288 2.59
17. 11-Eicosenoic acid, methyl ester 19.313 1541179 1.05
18. Methyl 18-methylnonadecanoate 19.511 4449383 3.02
19. Methyl9.cis.,11.trans.t,13.trans.-
octadecatrienoate
19.559 446765 0.30
20. 6,9-Octadecadienoic acid, methyl ester 19.669 344266 0.23
21. Heneicosanoic acid, methyl ester 20.336 733328 0.50
22. Phenol,2,2'-methylenebis[6-(1,1-
dimethylethyl)-4-methyl-
20.425 67599 0.05
23. 13-Docosenoic acid, methyl ester 20.957 165893 0.11
24. Methyl 20-methyl-heneicosanoate 21.130 4426479 3.00
25. Tricosanoic acid, methyl ester 21.895 365628 0.25
26. Tetracosanoic acid, methyl ester 22.632 592307 0.40
27. Squalene 23.379 5546942 3.76
28. Stigmast-7-en-3-ol, (3.beta.,5.
alpha.,24S)-
23.896 3669260 2.49
Some important constituents are discussed below:
9,12 Octadecadienoic acid (z,z)methyl esters (39.11%)
Mass spectrum of 9.12 octadecadienoic acid (z,z) methyl ester is
depicted in Fig.3.39.The peak at m\z 294 which appeared at R.T 17.532
corresponds to M+[C19H34O2]
+ .The at m\z 263 corresponds of loss
methoxyl function.
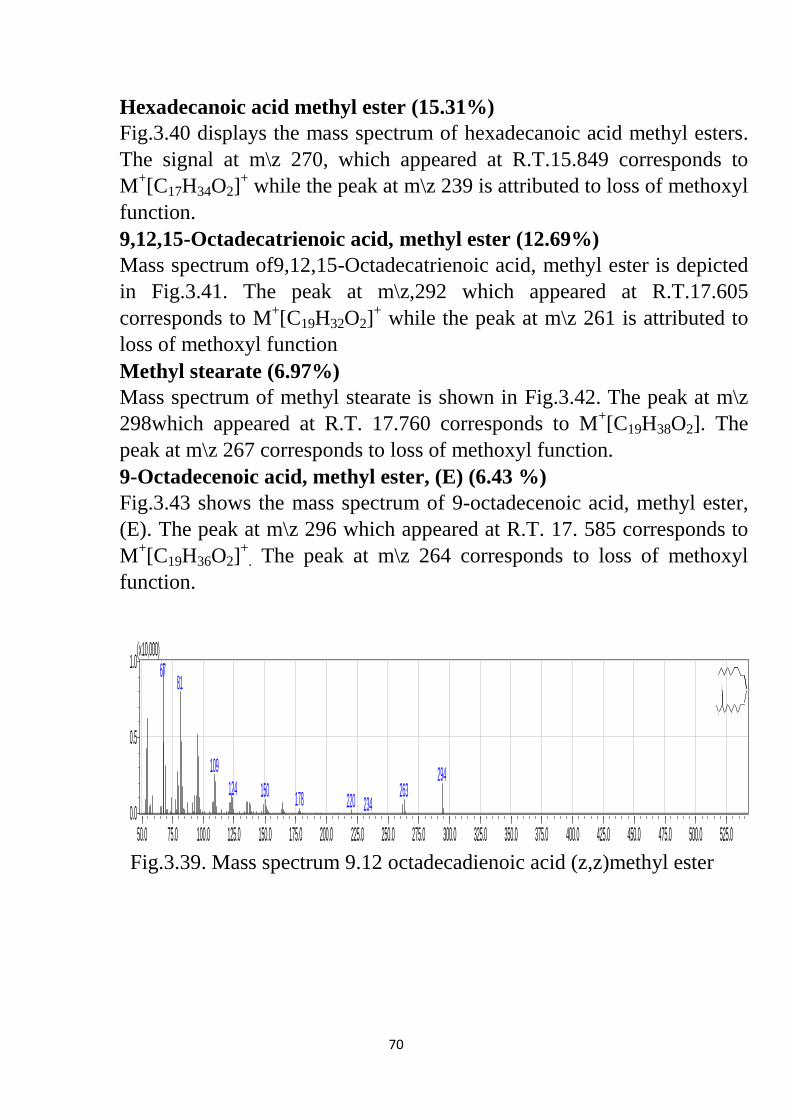
45
Hexadecanoic acid methyl ester (15.31%)
Fig.3.40 displays the mass spectrum of hexadecanoic acid methyl esters.
The signal at m\z 270, which appeared at R.T.15.849 corresponds to
M+[C17H34O2]
+ while the peak at m\z 239 is attributed to loss of methoxyl
function.
9,12,15-Octadecatrienoic acid, methyl ester (12.69%)
Mass spectrum of9,12,15-Octadecatrienoic acid, methyl ester is depicted
in Fig.3.41. The peak at m\z,292 which appeared at R.T.17.605
corresponds to M+[C19H32O2]
+ while the peak at m\z 261 is attributed to
loss of methoxyl function
Methyl stearate (6.97%)
Mass spectrum of methyl stearate is shown in Fig.3.42. The peak at m\z
298which appeared at R.T. 17.760 corresponds to M+[C19H38O2]. The
peak at m\z 267 corresponds to loss of methoxyl function.
9-Octadecenoic acid, methyl ester, (E) (6.43 %)
Fig.3.43 shows the mass spectrum of 9-octadecenoic acid, methyl ester,
(E). The peak at m\z 296 which appeared at R.T. 17. 585 corresponds to
M+[C19H36O2]
+. The peak at m\z 264 corresponds to loss of methoxyl
function.
Fig.3.39. Mass spectrum 9.12 octadecadienoic acid (z,z)methyl ester
50.0 75.0 100.0 125.0 150.0 175.0 200.0 225.0 250.0 275.0 300.0 325.0 350.0 375.0 400.0 425.0 450.0 475.0 500.0 525.00.0
0.5
1.0(x10,000)
6781
109 294124 263150 178 220 234
O
O

45
Fig.3.40. Mass spectrum hexadecanoic acid methyl ester.
Fig.3.41. Mass spectrum 9,12,15-octadecatrienoic acid, methyl ester
Fig.3.42. Mass spectrum of methyl stearate
50.0 75.0 100.0 125.0 150.0 175.0 200.0 225.0 250.0 275.0 300.0 325.0 350.0 375.0 400.0 425.0 450.0 475.0 500.0 525.0 550.00.0
0.5
1.0(x10,000)
74
87
143 270227185171101 239
O
O
50.0 75.0 100.0 125.0 150.0 175.0 200.0 225.0 250.0 275.0 300.0 325.0 350.0 375.0 400.0 425.0 450.00.0
0.5
1.0(x10,000)
79
67 95
121 135292236163 261191 249203
O
O
50.0 75.0 100.0 125.0 150.0 175.0 200.0 225.0 250.0 275.0 300.0 325.0 350.0 375.0 400.0 425.0 450.0 475.0 500.0 525.0 550.00.0
0.5
1.0(x10,000)
74
87
143 255199 298267157 213111
O
O
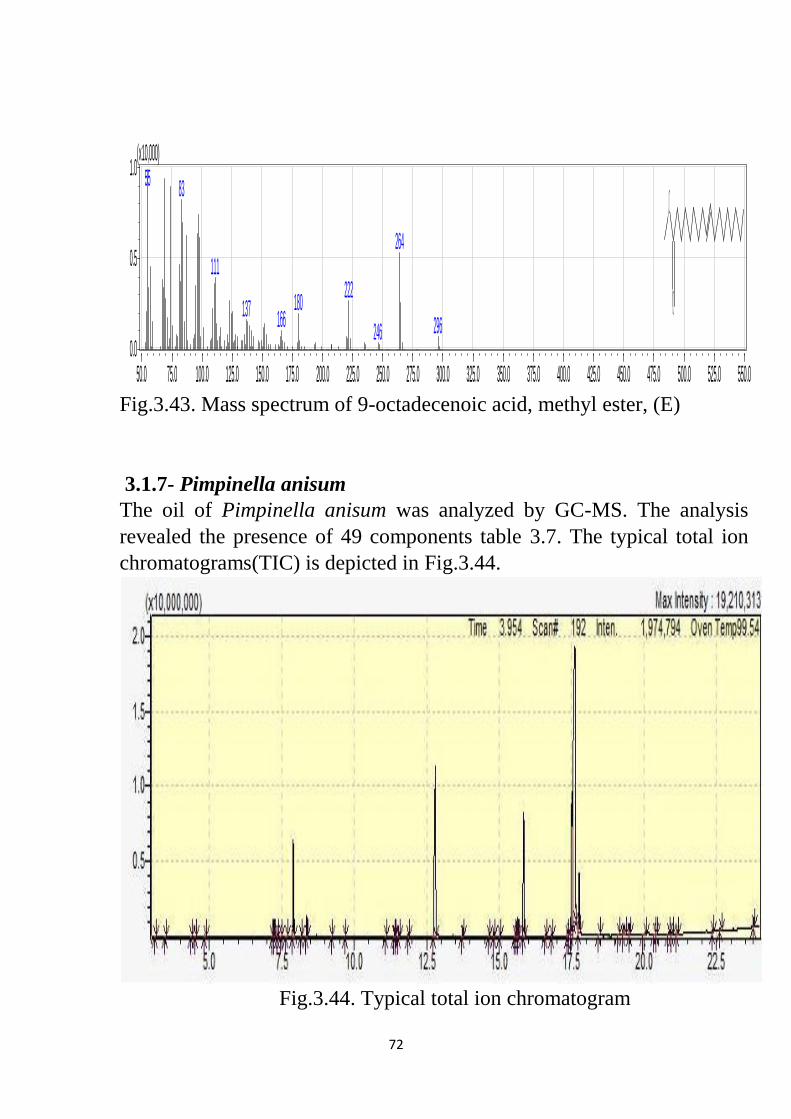
44
Fig.3.43. Mass spectrum of 9-octadecenoic acid, methyl ester, (E)
3.1.7- Pimpinella anisum The oil of Pimpinella anisum was analyzed by GC-MS. The analysis
revealed the presence of 49 components table 3.7. The typical total ion
chromatograms(TIC) is depicted in Fig.3.44.
Fig.3.44. Typical total ion chromatogram
50.0 75.0 100.0 125.0 150.0 175.0 200.0 225.0 250.0 275.0 300.0 325.0 350.0 375.0 400.0 425.0 450.0 475.0 500.0 525.0 550.00.0
0.5
1.0(x10,000)
55 83
264111
222180137 166 296246
O
O

44
Table.3.7: Constituents of Pimpinella anisum
ID# Name Ret.Time Area Area%
1. Pentanoic acid, 4-methyl-, methyl
ester
3.137 8877 0.00
2. Hexanoic acid, methyl ester 3.488 24592 0.01
3. Octanoic acid, 4,6-dimethyl-,
methyl ester, (4S,6S)-(+)-
4.378 17752 0.01
4. .alpha.-Phellandrene 4.540 17255 0.01
5. D-Limonene 4.858 108091 0.05
6. Cyclohexanol,2-methyl-5-(1-
methylethenyl)-
7.186 21496 0.01
7. Cyclohexanone,2-methyl-5-(1-
methylethenyl)-, trans-
7.238 1664375 0.85
8. Cyclodecene, 1-methyl- 7.358 299693 0.15
9. Cyclohexanol,2-methyl-5-(1-methylethenyl)-
, (1.alpha.,2.beta.,5.alpha.)-
7.474 71976 0.04
10. Bicyclo[4.1.0]heptan-3-ol, 4,7,7-
trimethyl-,
(1.alpha.,3.alpha.,4.beta.,6.alpha.)-
7.665 111909 0.06
11. D-Carvone 7.900 11762147 5.98
12. 1,1-Dimethyl-4-methylene
Cyclohexane
8.175 174486 0.09
13. Cyclopentanol, 1-(1-methylene-2-
propenyl)-
8.362 2086823 1.06
14. 4-(1-Ethyl-piperidin-3-ylamino)-1-oxa-
spiro[4.5]dec-3-en-2-one
9.235 77580 0.04
15. 11-Oxa-tricyclo[4.4.1.0(1,6)]
undecan-2-ol
9.696 45189 0.02
16. 1,6-Cyclodecadiene, 1-methyl-5-methylene-
8-(1-methylethyl)-, [S-(E,E)]-
11.100 52605 0.03
17. Butylated Hydroxytoluene 11.390 102533 0.05
18. Dodecanoic acid, methyl ester 11.423 143621 0.07
19. 1,3-Benzodioxole,4-methoxy-6-
(2-propenyl)-
11.535 405837 0.21
20. Benzene, 1,2,3-trimethoxy-5-
(2-propenyl)-
11.869 233069 0.12
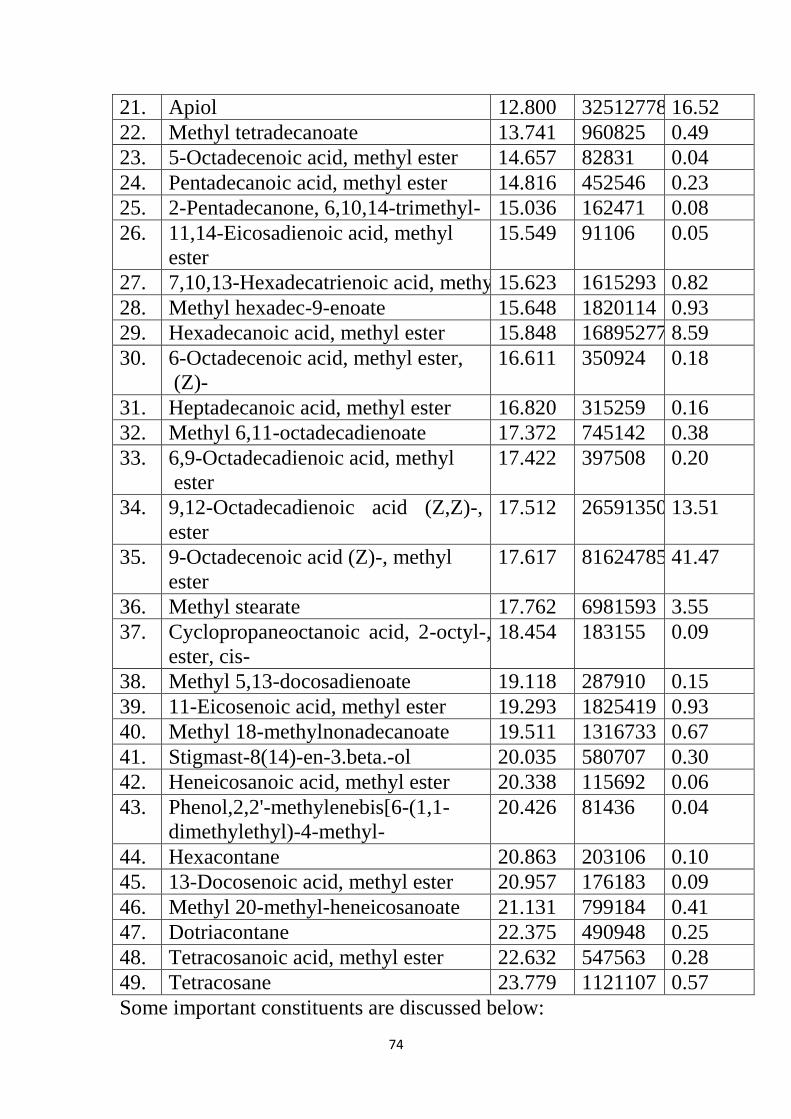
42
21. Apiol 12.800 32512778 16.52
22. Methyl tetradecanoate 13.741 960825 0.49
23. 5-Octadecenoic acid, methyl ester 14.657 82831 0.04
24. Pentadecanoic acid, methyl ester 14.816 452546 0.23
25. 2-Pentadecanone, 6,10,14-trimethyl- 15.036 162471 0.08
26. 11,14-Eicosadienoic acid, methyl
ester
15.549 91106 0.05
27. 7,10,13-Hexadecatrienoic acid, methyl ester 15.623 1615293 0.82
28. Methyl hexadec-9-enoate 15.648 1820114 0.93
29. Hexadecanoic acid, methyl ester 15.848 16895277 8.59
30. 6-Octadecenoic acid, methyl ester,
(Z)-
16.611 350924 0.18
31. Heptadecanoic acid, methyl ester 16.820 315259 0.16
32. Methyl 6,11-octadecadienoate 17.372 745142 0.38
33. 6,9-Octadecadienoic acid, methyl
ester
17.422 397508 0.20
34. 9,12-Octadecadienoic acid (Z,Z)-, methyl
ester
17.512 26591350 13.51
35. 9-Octadecenoic acid (Z)-, methyl
ester
17.617 81624785 41.47
36. Methyl stearate 17.762 6981593 3.55
37. Cyclopropaneoctanoic acid, 2-octyl-, methyl
ester, cis-
18.454 183155 0.09
38. Methyl 5,13-docosadienoate 19.118 287910 0.15
39. 11-Eicosenoic acid, methyl ester 19.293 1825419 0.93
40. Methyl 18-methylnonadecanoate 19.511 1316733 0.67
41. Stigmast-8(14)-en-3.beta.-ol 20.035 580707 0.30
42. Heneicosanoic acid, methyl ester 20.338 115692 0.06
43. Phenol,2,2'-methylenebis[6-(1,1-
dimethylethyl)-4-methyl-
20.426 81436 0.04
44. Hexacontane 20.863 203106 0.10
45. 13-Docosenoic acid, methyl ester 20.957 176183 0.09
46. Methyl 20-methyl-heneicosanoate 21.131 799184 0.41
47. Dotriacontane 22.375 490948 0.25
48. Tetracosanoic acid, methyl ester 22.632 547563 0.28
49. Tetracosane 23.779 1121107 0.57
Some important constituents are discussed below:
44
9-Octadecenoic acid(Z)methyl ester (41.47%)
Mass EI spectrum of 9-Octadecenoic acid(Z)methyl ester is shown in
Fig.3.45. The peak at m\z 296 which appeared at R.T.17.617 corresponds
to M+[C19H36O2]. The peak at m\z 264 is corresponds to loss of methoxyl
function.
Apiol (16.52%)
Fig.3.46 displays the mass spectrum of apiol. The signal at m\z 222
which appeared at R.T.12.800 corresponds to C12H14O4, whilst the peak
at m\z 207 is due to loss of methoxyl function.
9,12 Octadecadienoic acid (z,z)methyl esters (13.51 %)
Mass EI spectrum of 9.12 octadecadienoic acid (z,z) methyl esters is
depicted in Fig.3.47.The peak at m\z 294 which appeared at R.T 17.512
corresponds to M+[C19H34O2]
+ .The at m\z 262 corresponds of loss
methoxyl function.
Hexadecanoic acid methyl ester (8.59%)
Mass EI spectrum of hexadecanoic acid methyl ester is depicted in
Fig.3.48. The peak at m\z 270, which appeared at R.T.15.848
corresponds to M+[C17H34O2]
+ while the peak at m\z 239 is attributed to
loss of methoxyl function.
D-Carvone (5.98%)
Mass EI spectrum of D-Carvone shown in Fig.3.49. The peak at m\z 150
which appeared at R.T.7.900 corresponds to C10H14O. The peak at
m\z122 corresponds to loss of a methoxyl function
Methyl stearate (3.55%)
Mass EI spectrum of methyl stearate is shown in Fig.3.50. The peak at
m\z 298 which appeared at R.T. 17.762 corresponds to M+[C19H38O2]
+.
The peak at m\z 267 corresponds to loss of a methoxyl function.
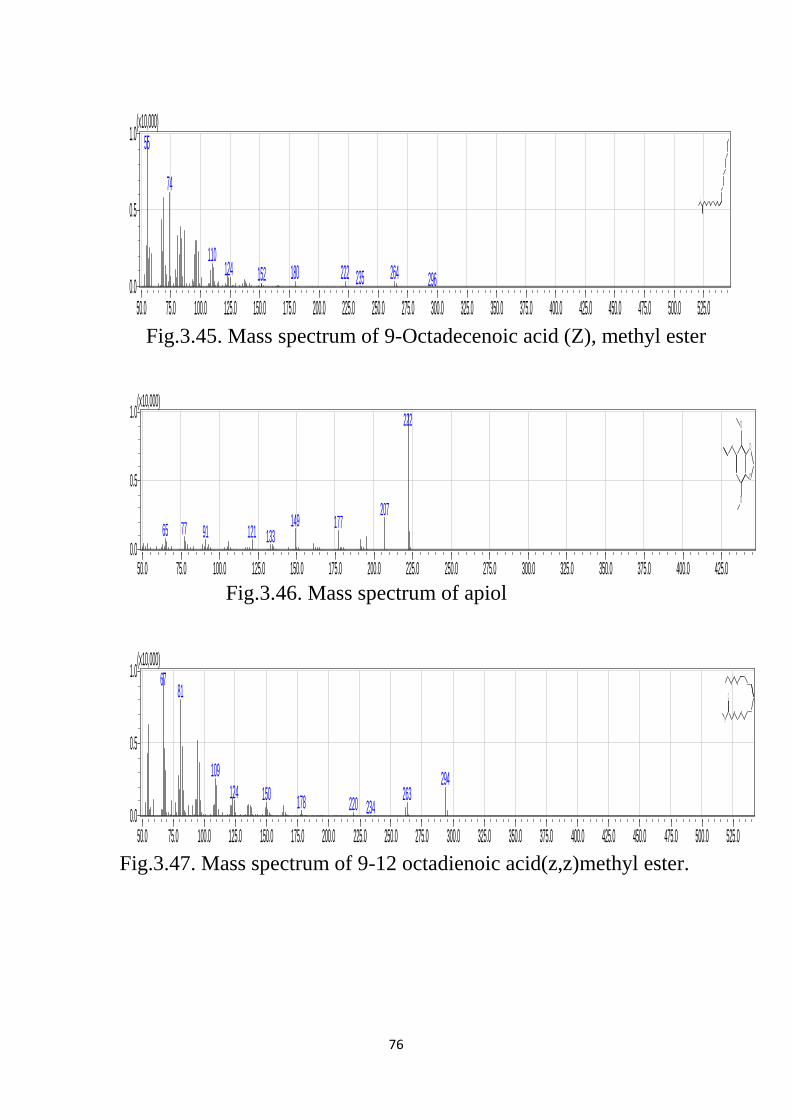
44
Fig.3.45. Mass spectrum of 9-Octadecenoic acid (Z), methyl ester
Fig.3.46. Mass spectrum of apiol
Fig.3.47. Mass spectrum of 9-12 octadienoic acid(z,z)methyl ester.
50.0 75.0 100.0 125.0 150.0 175.0 200.0 225.0 250.0 275.0 300.0 325.0 350.0 375.0 400.0 425.0 450.0 475.0 500.0 525.00.0
0.5
1.0(x10,000)
55
74
110124 264180 222152 235 296
O
O
50.0 75.0 100.0 125.0 150.0 175.0 200.0 225.0 250.0 275.0 300.0 325.0 350.0 375.0 400.0 425.00.0
0.5
1.0(x10,000)
222
207149 1777765 91 121 133
O
O
O
O
50.0 75.0 100.0 125.0 150.0 175.0 200.0 225.0 250.0 275.0 300.0 325.0 350.0 375.0 400.0 425.0 450.0 475.0 500.0 525.00.0
0.5
1.0(x10,000)
6781
109 294124 263150 178 220 234
O
O
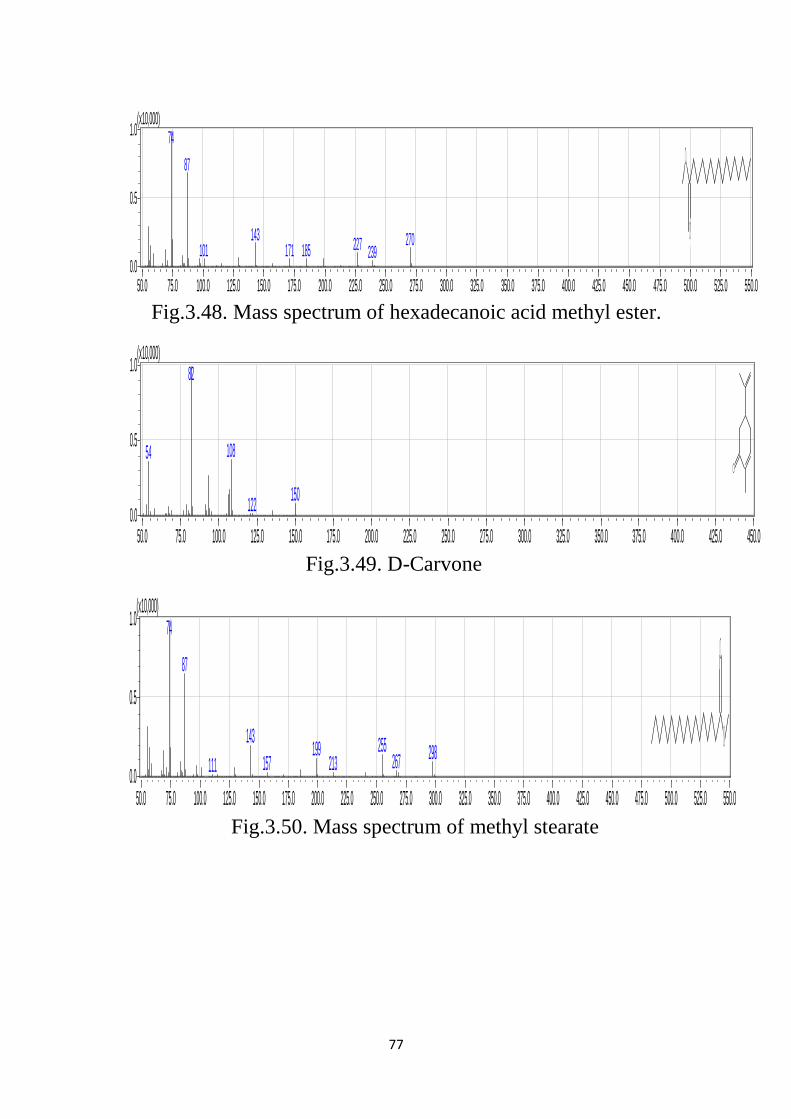
44
Fig.3.48. Mass spectrum of hexadecanoic acid methyl ester.
Fig.3.49. D-Carvone
Fig.3.50. Mass spectrum of methyl stearate
50.0 75.0 100.0 125.0 150.0 175.0 200.0 225.0 250.0 275.0 300.0 325.0 350.0 375.0 400.0 425.0 450.0 475.0 500.0 525.0 550.00.0
0.5
1.0(x10,000)
74
87
143 270227185171101 239
O
O
50.0 75.0 100.0 125.0 150.0 175.0 200.0 225.0 250.0 275.0 300.0 325.0 350.0 375.0 400.0 425.0 450.00.0
0.5
1.0(x10,000)
82
10854
150122
O
50.0 75.0 100.0 125.0 150.0 175.0 200.0 225.0 250.0 275.0 300.0 325.0 350.0 375.0 400.0 425.0 450.0 475.0 500.0 525.0 550.00.0
0.5
1.0(x10,000)
74
87
143 255199 298267157 213111
O
O
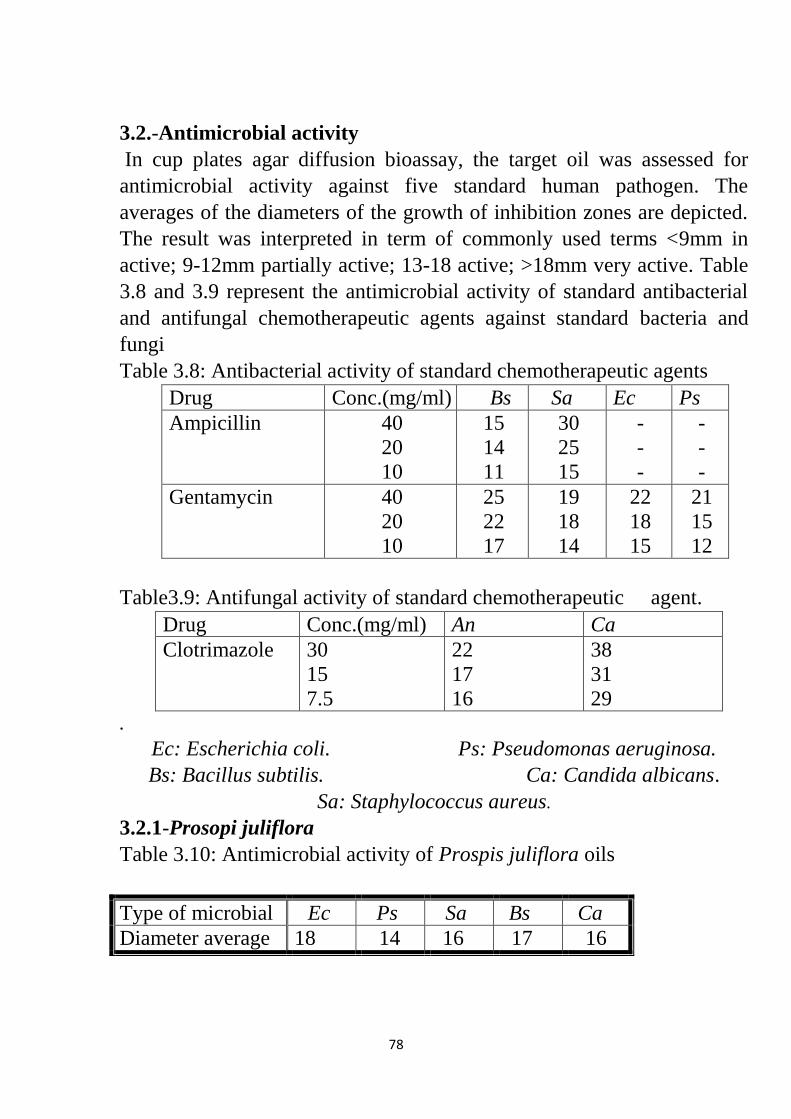
44
3.2.-Antimicrobial activity
In cup plates agar diffusion bioassay, the target oil was assessed for
antimicrobial activity against five standard human pathogen. The
averages of the diameters of the growth of inhibition zones are depicted.
The result was interpreted in term of commonly used terms <9mm in
active; 9-12mm partially active; 13-18 active; >18mm very active. Table
3.8 and 3.9 represent the antimicrobial activity of standard antibacterial
and antifungal chemotherapeutic agents against standard bacteria and
fungi
Table 3.8: Antibacterial activity of standard chemotherapeutic agents
Drug Conc.(mg/ml) Bs Sa Ec Ps
Ampicillin 40
20
10
15
14
11
30
25
15
-
-
-
-
-
-
Gentamycin 40
20
10
25
22
17
19
18
14
22
18
15
21
15
12
Table3.9: Antifungal activity of standard chemotherapeutic agent.
Drug Conc.(mg/ml) An Ca
Clotrimazole 30
15
7.5
22
17
16
38
31
29
.
Ec: Escherichia coli. Ps: Pseudomonas aeruginosa.
Bs: Bacillus subtilis. Ca: Candida albicans.
Sa: Staphylococcus aureus.
3.2.1-Prosopi juliflora
Table 3.10: Antimicrobial activity of Prospis juliflora oils
Type of microbial Ec Ps Sa Bs Ca
Diameter average 18 14 16 17 16
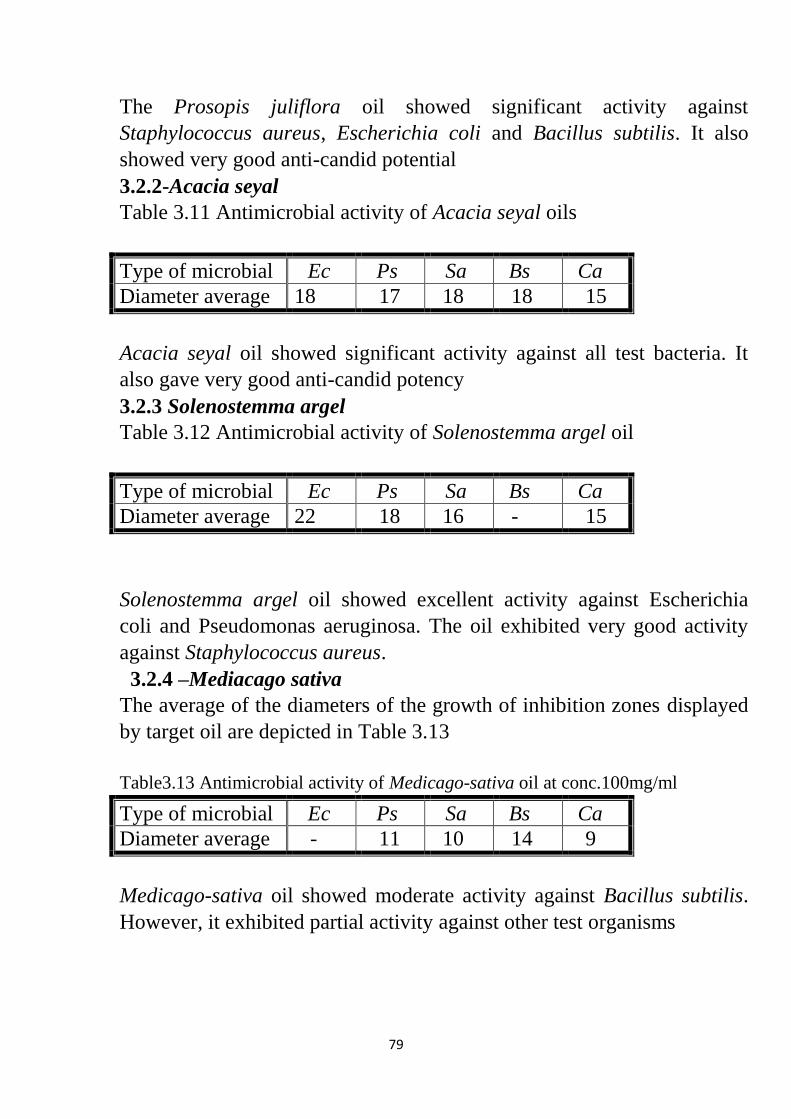
44
The Prosopis juliflora oil showed significant activity against
Staphylococcus aureus, Escherichia coli and Bacillus subtilis. It also
showed very good anti-candid potential 3.2.2-Acacia seyal
Table 3.11 Antimicrobial activity of Acacia seyal oils
Type of microbial Ec Ps Sa Bs Ca
Diameter average 18 17 18 18 15
Acacia seyal oil showed significant activity against all test bacteria. It
also gave very good anti-candid potency
3.2.3 Solenostemma argel
Table 3.12 Antimicrobial activity of Solenostemma argel oil
Type of microbial Ec Ps Sa Bs Ca
Diameter average 22 18 16 - 15
Solenostemma argel oil showed excellent activity against Escherichia
coli and Pseudomonas aeruginosa. The oil exhibited very good activity
against Staphylococcus aureus.
3.2.4 –Mediacago sativa
The average of the diameters of the growth of inhibition zones displayed
by target oil are depicted in Table 3.13
Table3.13 Antimicrobial activity of Medicago-sativa oil at conc.100mg/ml
Type of microbial Ec Ps Sa Bs Ca
Diameter average - 11 10 14 9
Medicago-sativa oil showed moderate activity against Bacillus subtilis.
However, it exhibited partial activity against other test organisms
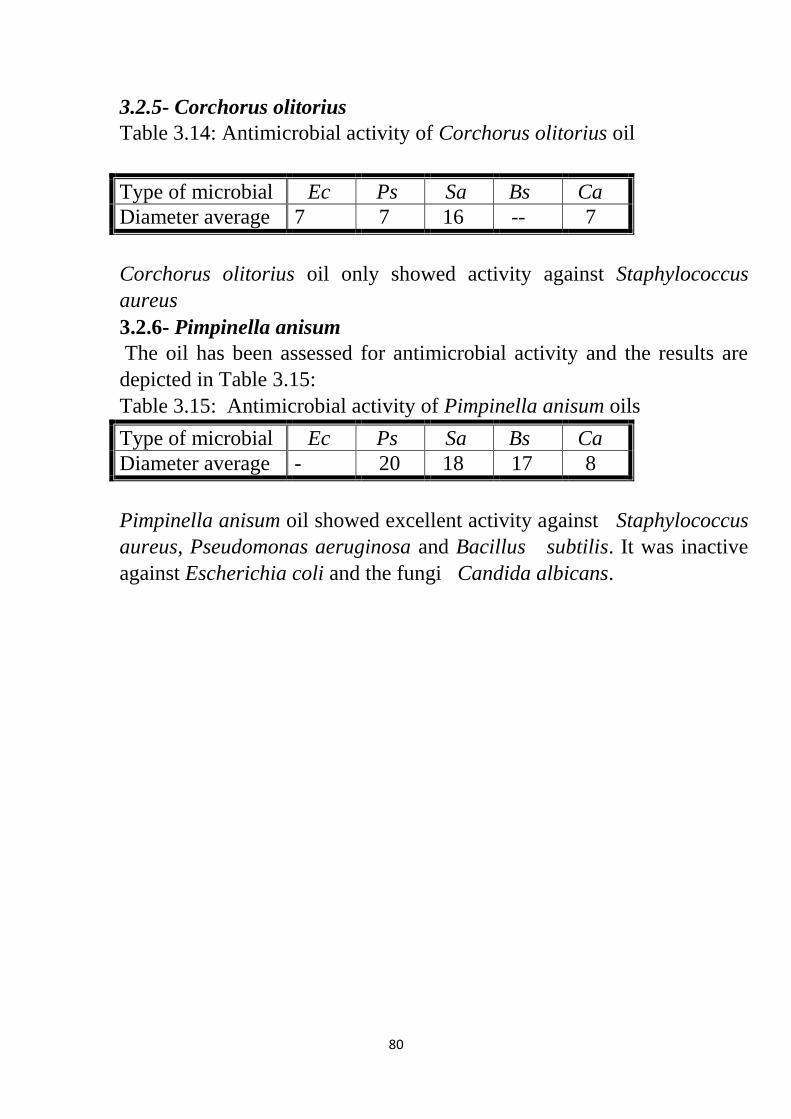
45
3.2.5- Corchorus olitorius
Table 3.14: Antimicrobial activity of Corchorus olitorius oil
Type of microbial Ec Ps Sa Bs Ca
Diameter average 7 7 16 -- 7
Corchorus olitorius oil only showed activity against Staphylococcus
aureus
3.2.6- Pimpinella anisum
The oil has been assessed for antimicrobial activity and the results are
depicted in Table 3.15:
Table 3.15: Antimicrobial activity of Pimpinella anisum oils
Type of microbial Ec Ps Sa Bs Ca
Diameter average - 20 18 17 8
Pimpinella anisum oil showed excellent activity against Staphylococcus
aureus, Pseudomonas aeruginosa and Bacillus subtilis. It was inactive
against Escherichia coli and the fungi Candida albicans.
45
Conclusion
Seven plants which are key species in Sudanese ethnomedicine have been
investigated. The fixed oils of these species were extracted and studied
by GC-MS and the major constituents of these oils have been discussed.
Furthermore, the oils have been assessed for antimicrobial activity via the
cup plate agar diffusion bioassay against five standard human pathogens
and significant antimicrobial activity has been reported for some of the
target oils.

44
Recommendations
Other biological activity (anti-inflammatory, antileishmenial …ect)
of the target oils may be investigated.
Other phytochemicals of the target plants may be extracted and
isolated in a chromatographically pure form and then their structure
could be elucidated and their biological activities may be screened.

44
83
References
1- (AFNOR) " Huiles Essentials ", 6th
Ed; AFNOR, Paris, France
(2000).
2- Carette Delacour, A.S., The Lavader Essentials. Ph.D. Thesis
University of Lille, France (2000).
3- Sell, C. S. "The Chemistry of Fragrance from Perfume to Consumer",
2nd
Ed.; The Royal Society of Chemistry, Cambridge, UK., 329,
(2006).
4- Vainstein, a; Lewinssohn, E; Weiss, D. "Floral Fragrance", John Welly
and Sons, New York, pp 27, 1383, (2001).
5- Pophof, B; Stang, G; Abrell, L., "Volatile Organic Compounds as
Signals in a Plant-Herbivore System: Electrophysiological Responses
in factory Sensilla of the Moth cactablastic cactotum", 30, 51 (2005).
6- Modzelewska, A., Sur,S., Kumar, K.S., Khan, S. R. Sesquiterpenes:
Natural product that decrease cancer growth, Curr. Med. Chem,
Anticancer Agents, 54, 477, (2005).
7- Marotti, M; Piccaglia, R; Giovanelli, E; Effect of variety and on
togenic stage on the essential oil compound composition and
biological activity of fennel. J.Essent.oil Res. 6, 157, (1994).
84
8- Hussain, A.I., Anwar, F., Sherazi, S.T.H., Bhanger, M.I., J. Herbs
spices Med. Plants 1, 15, (2004).
9- Falhbusch, K., Georg, H., chmidt, F., Jose, P., Johannes, P., Whelm, S.,
Dietmar, B., kurt, G., Dorothea; Surburg, Horst. ‘’Flavor and
Fragrances.’’Umans Encyclopedia of Industrial Chemistry, (2003).
10- Martins, S; "Physical Pharmacy and Pharmaceutical Science", 5th
Ed.
Lippincot William and Wilkins, New York (2002).
11- Beychok, M. R., The Design of Sour Water Strippers, Individual Paper
61, Proceedings of Seventh World Petroleum Congress, Mexico City,
April (1967).
12- Kister, H., "Distillation Design". Ist Ed., McGraw Hall, New York,
(1992).
13- Mchak, M., Chemistry and Technology of Oil and Fats, Allied
Pulblishers (2003).
14- Weiss, A.E., "Eessential Oils Crops" Cabinter National, YewYork, P
570, (2002).
15- Shelef, L.A; J. food 6, 29(1983).
16- Nychas, G.J.E., Natural antimicrobials from plants. In New Methods of
food Preservation, (Ist Ed.). Gould, G.W., Ed; Blackie Academic and
Professional, London, UK, P:58 (1995).
17- Lambert, R.J., Skandamis, P.N., Coote, P., Nychas, G.J., J. Appl.
Microbiol, 91 (2001).
18- Sikkema, J., De Bont, A. M., Poolman, B., J. Biol. chem., 269, 8022
(1994).
19- Gustafson, J. E., Liew, Y.C., Chew, s., Markham, J. L., Bell, H.C.,
Wyllie, S.G., Warmington, J.R., Lett.Appl Microbiol., 26, 194(1998).
85
20- Ultee, A., Bennink, M. J., Moezeloar, R., Appl. Environ., Microbiol 68,
156, (2002).
21- Denyer, S. P., Hugo. W., The society for Applied Bacteriology,
Technical series ,27, 171, (1991).
22- Farag, R.S., Daw, Z.Y., Hewedi, F.M., EI Baroty. G.S., J. Food prot,
52, 665, (1989).
23- Cose ntino, S., Tuberoso, C.I., Pisane , B., Sa tta , M., Mascia, v.,
Arzedi. E., Palmas,F., Lett. App Microbial., 29, 130(2002).
24- Dorman, H. J. D., Deans. S. G., J. Appl. Microbial.,88, 308 (2000).
25- Davidson, P.M., "Food Microbiology: Fundamentals and Frontier";
Doyle, M.P, Beuchat, L.R., Montville, T.J., Eds; ASM Press:
Washington, DC, USA., 520, (1997).
26- Knobloch, k., Weigand, H., Weis, N., Schwarm, H.M., Vigenschow,
H., Action of terpenoids on energy metabolism. In Progress in
essential oils Research, 16th
international symposium on essential oil;
Brunke, E.J. Ed; De walter de Gruyter. Berlin, Germany., 429, (1986).
27- Pauli, A., Int.J. Aromather.,133 (2001).
28- Fabian, D; Sabol, M; Domaracke, k. Toxicol in Vitro., 20, 1435, (2006).
29- Marino, M., Bersani, C., Comi, G., J. Food Proft Thymus vulgari.,62,
1017 (1999).
30- Senatore, F., Napolitano, F., Ozcan, M., maritimum Flav. Frag. J.,
15,186 (2000).
31- Canillac, N., Nourey, A., Food Microbial 18, 261 (2001).
32- Cimanga, K., Kambu, K., Tona, L., Apers, S., de Brayne, T., Hermans,
N, Totte, J., Pieters, L., Vlietinck, A. J., J. Ethnopharmacd.,79, 213,
(2002)
86
33- Gill, A. O., Delaquis, P., Russo, P., Holley, R., Int Food Microbiol.,73,
83 (2002).
34- Reichling, J., Schnitzler, P., Suschke, U., Saller, R., Forsch-
Komplement., 16, 79 (2009).
35- Burt, S., Int. Food Microbial., 94, 223 (2004).
36- Edris, A.E., Phytother. Res.,21, 308-323(2007).
37- Braga, P.C., dal Sasso, M., Cukici, M., Gasastri, L., Marceca, M.X.,
Guffanti, E.E., J. Pharmacology.,76, 61(2006).
38- Aruoma, O.I., J. Am.oil chem,. 75, 199(2012)
39- Kamatou, G.P.P., Viljoen, A.M.A., J. Am oil chem.Soc., 87, 1 (2010).
40- Koh, K. J., Pearce, A. L., Marshman, G., Finlay-Jones, J. J., Hart,
P.H., J.Dermatol., 147 (2002).
41- Hart, P. H., Brand, C., Carson, C.F., Riley, T. V; Prager, R. H.,
Inflamm.Res., 626 (2002).
42- Pyan, M.S., Shin, S., Phytomedicine., 13, 394 (2006).
43- Milner, J.A., J. Nutr.,131 (2001).
44- Milner, J.A., J. Nutr., 831 (2006).
45- Wu, C.C., Sheen, L. Y., Chen. H.W., Kuo, W.W., Tsai. S. J., Lii, C.K.,
J. Agric. Food. Chem., 50, 381 (2002).
46- Cavalieri, E., Mariotto, S., Fabrizi, C., Carcereri de, Prati, A.,
Gottardo, R., Leone, B., Berra, L.V., Lauro, G.M., Ciampa, A.R., Suzuki,
H., Biochem-Biophys. Res. Commun., 315,589 (2004).
47- Desousa, A., Alviano, A., Blank, A., Alves, P., Alviano, C., Gattass,
C., J. Pharm.pharmmacol., 56, 677 (2004).
87
48- Calcabrini, A., Stringaro, A., Toccacieli, L., Mechini, S., Marra, M.,
Colone, M., Salvatore, G., Mondello, F., Arancia, G., Molinari, A., J.
Investig. Dermatol., 122, 349 (2004).
49- Li, Y., Li, M., Wang, L., Jiang, Z., Li, W., Li, H.,.Sichuan Daxue Xue
Bao YiXue Ban., 35, 337(2004).
50- Hazem, K., Makboul, A., Nidhal, A., ‘’Chemistry of Natural
products’’. vol (2) Dar AL-Hamed-Imman (1998).
51- Hazem, K., Makboul, A., Nidha, A., "Chemistry of Natural Products’’
vol (1) , Dar AL-Hamed-Imman (1998).
52- James, A.T., J. Bio Chem.,50(5),679 (1952).
53- Loo, A. J., Udseth, H.R., Simth, R.D., Anal. Bio. Chem.,179, (2),404
(1989).
54- Maxwell, E.J., Chen, O.D., mass spectrometry. Anal Bio. Chem., 627
(2008).
55- Hubschmann, H.J., Hand book of GC-MS: Fundamentals and
Applications (2nd
.Ed). Weinhein Wiley-VCH (2009).
56- McMaster, M., GC\MS: A Practical Users Gudie. New York: John
Wiley and Sons (2011).
57- Sparkman, O. David. Mass-spectrometery desk reference. Pitts
Suburgh (2000).
58- Abu zeid, EN." A romatic Plant and Their Agricultural and
Pharmaceutical Products" (Ist- Ed), AL Dar AL Arabia for printing and
Distribution, Cairo Egypt. ,473 (1992).
59- EL Hussien, SA., Essential oil crops of Sudan (Technical
communication of ISH). International society of Horticultural crops. Act
Horticulture (1983).
60- Zargari, A., "Medicinal Plants" University Press, Tehran, Iran (1996).
88
61- Salehi, S., ABAH Bio flux 6 ,1, 117(2010).
62- Ozcan, MM., Chalchat, JC., Annals of Microbiology., 56(4), 358
(2006).
63-Terapelli, CR., Andrad, CR., De Cassano, AO., de Souza, FA.,
Ambrosio, SR., Costa, FB., da Oliveria, AM., J Enthopharmacol., 110(1),
23 (2007).
64- Buchman, D.D., "Herbal medicine: the natural way to get well and
stay well", century Hutchinson, London (1987).
65- Hoffmann, D., "Thorsons Guide to Medicinal herbalism: a
comprehensive and practical introduction. Thorsons London (1991).
66- Pruthi, JS., "Spices and Condiments", National Book Trust, New
Delhi. India.,19 (1976).
67- Albert Puleo, M., J. Ethnopharmacol ., 2(4),337(1980).
68- Guenther, E., "The essential oils" Van Nostard company Inc, New
Jersy. USA Vol (1). 50. Vol (3), 676(1975).
69- Arora, DS., Int. J. Antimicrobial Agent., 12(3), 257(1999).
70- Sagdic, O., "Sensitivity of Four Pathogenic Bacteria to Turkish thyme
and Wild marjeram Hydrosols" Lebensmittal Wissenschaft und-
Technology., 36 (2003).
71- Reed, C.F., "Selected Weeds of the United State Hand book", USDA-
Washington, DC.,366 (1970).
72- Simpson, B.B., Mesquite, its biology in two desert scrub ecosystems,
Dowden. Hutchinson and Ross. Inc strouds burg, AP (1977).
73- Hartwell, J.K.," Plants Used against Cancer". Asurvey. Lioydia 30
(1967).
89
74- Lewis, W. H., Elvin-Lewis, M.P.," Medical Botany", John Wiley and
sons. New York (1977).
75- Dasnnaa, Amit., ‘’How to Make Alfalfa Sprouts’’ Vegetarina recipesaf
India Dasanna Retrieved (2016).
76-Nutrition Research centre, Alfalfa Nutritional value. Nutrition research
center.org (2013).
77- The facts about Alfalfa, Melissa kapians Herb care Arapsid. Org.,
(2011).
78- Diamond, M., "The American Vegetarian Cook Book Form the Fit For
life kitchen", New York Wamer book,379 (1990).
79- Hort, R.L., Reni, H., Russell, J.R., Napoli, J.L., ‘’The Isolation and
Identification of Vitamin D2 and Vitamin D3 form Medicago sativa’’
(1984).
80- John, T.S., Ecol of food and Nut.,420 (1981).
87-Jwhhy, K., Firolerapia.,4, 301 (1996).
88- Alfalfa Medline plus Bethesda MD. US National library of medicine.
Retrieved (2016).
89- Chen, T.S., Saad, S., Ecol of food and Nut.,255 (1981).
90- Corchorus germ plasm resources information. Net work. United State
Department of Agriculture. Retrieved (2009).
91- Watt, J.M., Brandwijk, M. G., "The Medicinal and Poisonous Plants of
Southern and Eastern Africa (2ed
- Ed). Livingstone, Ltd Edinburgh and
London (1962).
92- Sharaf, A., Kamel, S.H., Salama, A., Arbid, M. S., Egyption.J. vet
Med., 14(2),93 (1979).
93- Duke, J. A.," Medicinal plants of the Bible" 17(4) ,91 (1979).

90
94- List, P.H., Horhammer, L., "Hagers Hand Buch Der Pharmazeutichen
Prax" Vol 2-6 Springer Verlag, Berlin (1979).
95 - EI Hadidi, M.N., Fayed, A.," Material For Excoriation Flora of Egypt,
Cairo University Herbarium, Taeck holmia (1995).
96- El Ghazali, GE.B., Promising Sudanse Medical plants. National
center of research, Khartoum (1997).
97- El Kalali, H.H., Khalid, S. A., The Most Common Herbl remedies in
central Sudan Firolerapia.,4, 301 (1996).
98- Abd El-Hady, E., Hegazi, A.G., Atta.N., Ebay, M.L., Qatar Uni. Sci.
J., 14, 138 (1994).
99- Boulos, L., Medical Plants of North Africa. Reference Publications",
Inc Algonac Michigan USA (1983).
100- Hammiche, V., Maiza, k., JE thnopharmacol., 358 (2006).
101- Murwan, k., Sanah, E.K., Murwa, A. M,. Eur. J. Res., 43, 430
(2010).
102- Kamel, M.S., 'Acylated phenolic glycoside from Solenostemma argle.
Phytochemistry", 1247 (2003).
103- N.A.S. Free wood crops, Shrub and tree species for energy
production. National academy of science. Washington, DC (1980).
104- Duke, J.A., "Medicinal plants of the Bible. Trado. Medic book
owerri"., NY (1983).
105- ‘’American Coriander coilins Dictionary’’. n. d. Retrieved (2014).
106 - Daniel, Z.; Maria, H.," Domestication of Plants in the Old World,
(3rd
Ed), Oxford Press., 206 (2000).
107- Bruce, S., Coriander—Coriandum sativum (2004).
108- Silva, F; Ferreira, S., Journal of medical Microbiology (2011).