Embed Size (px)
Citation preview

CHEMICAL APPROACHES TO PROBE ENVIRONMENTAL
STRESS IN ARCHAEA
by
Pavel Victorovich Tarlykov
A thesis submitted in partial fulfillment of the requirements for the degree
of
Master of Science
in
Biochemistry
MONTANA STATE UNIVERSITY Bozeman, Montana
April 2009

©COPYRIGHT
by
Pavel Victorovich Tarlykov
2009
All Rights Reserved

ii
APPROVAL
of a thesis submitted by
Pavel Victorovich Tarlykov
This thesis has been read by each member of the thesis committee and has been found to be satisfactory regarding content, English usage, format, citation, bibliographic style, and consistency, and is ready for submission to the Division of Graduate Education.
Dr. Brian Bothner
Approved for the Department of Chemistry and Biochemistry
Dr. David Singel
Approved for the Division of Graduate Education
Dr. Carl A. Fox

iii
STATEMENT OF PERMISSION TO USE
In presenting this thesis in partial fulfillment of the requirements for a
master’s degree at Montana State University, I agree that the Library shall make it
available to borrowers under rules of the Library.
If I have indicated my intention to copyright this thesis by including a
copyright notice page, copying is allowable only for scholarly purposes, consistent with
“fair use” as prescribed in the U.S. Copyright Law. Requests for permission for extended
quotation from or reproduction of this thesis in whole or in parts may be granted
only by the copyright holder.
Pavel Victorovich Tarlykov April 2009

iv
ACKNOWLEDGEMENTS
I would especially like to thank my mentor, Dr. Brian Bothner, for his continual
assistance and guidance throughout my study. Also I would like to thank Dr. Edward
Dratz and Dr. Martin Teintze for serving on my committee. I would like to acknowledge
all faculty members of the Chemistry and Biochemistry Department at Montana State
University. I am thankful to professors who gave “thousands” of amazing lectures here,
at MSU.
Invaluable assistance was provided by Walid Maaty, Jonathan Hilmer,
Vamseedhar Rayaprolu, Navid Movahed and other members of Dr. Bothner’s group. I
would like to thank all members of Dr. Dratz’s lab for sharing the secrets of how to run
2D gels.
I would like to express thanks to all my family members for their support over the
last two years. I would especially like to thank my mother for her patience.
Special thanks to my friends here, in USA, and back home, in Kazakhstan.
Finally, I am grateful to Nathan Schaff who was going out for a smoke with me during
my thesis writing.

v
TABLE OF CONTENTS
1. LITERATURE REVIEW ............................................................................................... 1
Introduction..................................................................................................................... 1 Archaea, the Third Domain of Life ................................................................................ 2
Sulfolobus Solfataricus ............................................................................................... 4 Environmental Stress ...................................................................................................... 6
2. PROTEOMIC RESPONSE OF SULFOLOBUS SOLFATARICUS P2 TO
HYDROGEN PEROXIDE INDUCED OXIDATIVE STRESS.................................... 9
Introduction.................................................................................................................... 9 Introduction to 2DE and 2D-DIGE............................................................................ 9 Introduction to Cysteine Reactivity Profiling.......................................................... 10 Introduction to Phosphoproteome............................................................................ 12 Introduction to Activity-Based Protein Profiling..................................................... 14
Sample Preparation ...................................................................................................... 15 Cell Culture and Harvesting..................................................................................... 15 Extraction of Proteins .............................................................................................. 16
2D DIGE Analysis ....................................................................................................... 17 Gel Imaging and Analysis........................................................................................ 18
In-gel Digestion and Protein Identification.................................................................. 18 Cysteine Reactivity Profiling....................................................................................... 20
Experimentation....................................................................................................... 20 1D HEPES SDS-PAGE ....................................................................................... 20 2DE ...................................................................................................................... 21
Activity-Based Protein Profiling.................................................................................. 22 Experementation ...................................................................................................... 22
Results.......................................................................................................................... 22 2D DIGE Analysis ................................................................................................... 22 Cysteine Reactivity Profiling................................................................................... 28 Activity-Based Protein Profiling.............................................................................. 31
Discussion.................................................................................................................... 33 3. PROTEOMIC RESPONSE OF SULFOLOBUS SOLFATARICUS P2 TO ARSENIC
INDUCED STRESS.................................................................................................... 41
Introduction.................................................................................................................. 41 Materials and Methods................................................................................................. 43 Results.......................................................................................................................... 45 Discussion.................................................................................................................... 53

vi
TABLE OF CONTENTS – CONTINUED 4. CONCLUSIONS .......................................................................................................... 59 BIBLIOGRAPHY............................................................................................................. 63

vii
LIST OF TABLES
Table Page 1. List of regulated proteins in 2D DIGE experiment..................................................... 25
2. Proteins identified from phospho-stained spots.......................................................... 28
3. List of proteins with altered cysteine availability after exposure to H2O2.................. 31
4. List of proteins regulated in response to arsenite exposure ........................................ 48
5. Changes in protein regulation in S. solfataricus exposed to pentavalent arsenic ....... 51
6. Proteins with regulation in cysteine reactivity upon exposure to As (III) .................. 51
7. Proteins identified from phospho-stained spots (As V).............................................. 51

viii
LIST OF FIGURES Figure Page 1. Simplified phylogenetic tree of three domains of life .................................................. 3
2. Transmission electron microscopy image of S. solfataricus P2 ................................... 5
3. Reduction of molecular oxygen that leads to formation of various ROS..................... 7
4. Thiol modifications of proteins................................................................................... 11
5. Chemical structures of thiol-reactive probes used in this study ................................. 12
6. Modification of a protein by phosphorylation ............................................................ 13
7. Schematic representation of binding of FLISP to serine hydrolases .......................... 15
8. Proteins of the S. solfataricus proteome regulated in response to oxidative stress.... 24
9. Post translational modifications of proteins in S. solfataricus.................................... 26
10. S. solfataricus phosphoproteome................................................................................ 27
11. Protein thiol reactivity profile..................................................................................... 29
12. S. solfataricus proteome labeled with thiol-specific dye ............................................ 30
13. Fluorescent scanned 1D gel of FLISP labeled proteins of S. solfataricus.................. 32
14. Fluorescent scanned 2D gels of FLISP labeled proteins of S. solfataricus ................ 33
15. Functional annotation of proteins regulated in response to oxidative stress .............. 36
16. Schematic of the oxidative stress response in S. solfataricus ..................................... 40
17. Growth of cells in the absence and presence of different concentrations of As(III) .. 46
18. 2D gels of S. solfataricus proteome exposed to different concentrations of arsenite. 47
19. Growth of cells in the absence and presence of different concentrations of As(III) .. 49
20. Growth of cells in the absence and presence of different concentrations of As(V) ... 50

ix
LIST OF FIGURES – CONTINUED Figure Page 21. Redox-sensitive profile of S. solfataricus upon treatment with As(III)...................... 52
22. S.solfataricus phosphoproteome upon exposure to arsenate ...................................... 53
23. General scheme of arsenite methylation ..................................................................... 56
24. Network of regulated S. solfataricus proteins............................................................. 60
25. S. solfataricus proteins found to be regulated in response to both As(V) and As(III) 61
26. S. solfataricus proteins that are most likely involved in universal stress response .... 61

x
GLOSSARY OF ABREVIATIONS ABPP – Activity-Based Protein Profiling
PAGE – Polyacrylamide Gel Electrophoresis
FLISP – Fluorescently Labeled Inhibitor of Serine Proteases
DMSO – Dimethyl Sulfoxide
IAA – Iodoacetamide
2D-DIGE – Two-dimensional Differential Gel Electrophoresis
DTT – Dithiothreitol
SDS – Sodium Dodecyl Sulfate
ROS – Reactive Oxygen Species
P – Inorganic Phosphate
LC-MS/MS – Liquid Chromatography- Mass Spectrometry/Mass Spectrometry
MW – Molecular Weight
PB – Phosphate Buffer
CHAPS – 3-[(3-Cholamidopropyl)dimethylammonio]-1-propanesulfonate
ASB-14 – Amidosulfobetaine-14, 3-[N,N-Dimethyl(3-
myristoylaminopropyl)ammonio]propanesulfonate
IPG – Immobilized pH Gradient
TRIS-HCl - 2-Amino-2-(hydroxymethyl)-1,3-propanediol, Hydrochloride
ROI – Region of Interest

xi
ABSTRACT
Little is known about strategies and mechanisms employed by thermophilic organisms to adapt to environmental stress. Sulfolobus solfataricus is a thermophile that belongs to Archaea, the third domain of life, and can be found in unusual habitats, such as the hot springs of Yellowstone National Park. This archaeon can tolerate high temperature, extreme acidity and high concentrations of heavy metals and other toxic substances. Thus, S. solfataricus has been chosen by many researchers as a model system for biochemical, structural, and genetic studies. In this work S. solfataricus has been exposed to hydrogen peroxide as a natural mild oxidant and arsenic as a common toxic metalloid. One of the aims was to quantitatively define the regulation of proteins upon treatment with hydrogen peroxide or arsenic species in different time periods and concentrations. In this sense, two-dimensional gel electrophoresis approach in conjunction with novel chemical tagging probes has been applied to detect changes on the level of regulation and chemical modification of individual proteins within the whole proteome in response to the stressors. Proteins expression levels have been monitored, redox-sensitive and phosphoproteomic profiles of the S. solfataricus proteome have been identified. Synthesis of the results has allowed a general scheme for how S. solfataricus fights H2O2- and As-induced stress. Lists of mapped proteins have been created and potential biomarkers for oxidative stress have been identified, which can guide further research to better understand mechanisms of proteomic response to the environmental stress in Archaea on the example of thermophilic archaeon S. solfataricus.

1
CHAPTER 1
LITERATURE REVIEW
Introduction
We live in the era of technological progress when science is blooming and new
branches of knowledge are emerging. Tremendous amounts of information and cutting-
edge technologies present us with a unique chance to decipher some of the biggest
mysteries of life and evolution. Nowadays, it is well established that biological events
arise from complex networks of molecular interactions. The desire to understand
biological processes and realization of their complexity have lead to the development of
global approaches to studying organelles, cells, and organisms. Genomics and proteomics
are two approaches that allow cellular events to be studied from a global perspective. The
knowledge of full genomes and comparative studies based on this knowledge has created
the possibility to tell us about evolutionary relationship among different species and the
components that are coded in the genes to carry out cellular processes such as
transcription or DNA replication. In turn, proteomic analysis studies the “workhorses” of
the cell. The later is a more challenging task due to the functional and structural diversity
of proteins and the dynamic nature of the proteome. In this study, a proteomic approach
has been used to investigate and characterize global changes in Sulfolobus solfataricus P2
upon exposure to a heavy metal and an oxidative stress. Standard proteomic techniques,
such as two-dimensional differential gel electrophoresis (2D-DIGE), in conjunction with
more novel activity-based chemical tagging were used.

2
Archaea, the Third Domain of Life Until late 1980’s, all organisms were classified into one of the two domains of
life: prokaryotes or eukaryotes. The situation began to change in 1977, when it was first
proposed using phylogenetic analyses based on sequences from small-subunit ribosomal
RNAs that a certain group of organisms did not belong to either of the existing domains
(Woese and Fox 1977). Further analysis revealed distinct features such as the unusual
chemical composition of cell walls (Kandler and Konig 1998) and unique DNA
dependant RNA polymerases (Zillig, Klenk et al. 1989). Eventually, this lead to a major
reclassification that placed many of the prokaryotic organisms that are found in extreme
environments into a new domain, the Archaea. In general, distinctions among the
domains of Bacteria, Eukarya, and Archaea are based on differences in genetic and
molecular characteristics. Archaea are prokaryotes but on the molecular level they are
neither Bacteria nor Eukarya (Woese 1990). Typical environments in which they can be
found include hot springs, salt lakes, hydrothermal vents, sewage, acid mine drainage soil
and many other habitats (Chaban 2006). It has been shown that in general the
mechanisms of transcription, DNA repair and replication in Archaea are very similar to
that of Eukarya, but with their own unique features (Qureshi 1997; Bell 1998; Bell 1998;
van der Oost 1998). At the same time, the translation machinery of Archaea tends to be
homologous to that of bacteria (Bell 1998; van der Oost 1998). Archaea appeared to
possess a bacterial-like compact chromosomal organization with clustering of genes as
polycistronic units (operons), and only a few interrupted genes (e.g. introns). The

3
Archaeal domain is currently divided into four phyla: Crenarchaeota, Euryarchaeota,
Korarchaeota and Nanoarchaeota (Figure 1).
KorarchaeotaKorarchaeotaKorarchaeotaKorarchaeota
Figure 1. Simplified phylogenetic tree of three domains of life based on small-subunit ribosomal RNA sequence. Eukaryotes are colored red, Archaea green and bacteria blue. Adapted from Ciccarelli (Ciccarelli, Doerks et al. 2006).
To date, most of the species to be investigated are members of the crenarchaea
and euryarchaea. The Crenarchaeota members are mostly thermophilic or
hyperthermophilic organisms while the Euryarchaeota are generally methanogens. The
Korarchaeota represent a distinct group based primarily on 16S rRNA sequences. Finally,
the Nanoarchaeota are symbiotic hyperthermophilic organisms that have minimal
genomes (Huber 2002). The Crenarchaeota, although not obligate extremophiles, thrive
in environments characterized by temperatures above 75°C and pHs below 4.0. Within
the Crenarchaeota, the Sulfolobus genus has immerged as a model organism because it

4
can grow aerobically and heterotrophically to high cell densities and its genome was one
of the first complete archaeal genomes to be sequenced and published (She 2001).
Sulfolobus solfataricus
Sulfolobus solfataricus is an extremophile member of the Archaea, has been used
by many researchers in biochemical, structural, and genetic studies to investigate how
Archaea tolerate high temperatures, extreme acidity, toxic substances, and high
concentrations of heavy metals (Edgcomb, Molyneaux et al. 2004; Golyshina and
Timmis 2005; Remonsellez, Orell et al. 2006; Auernik, Cooper et al. 2008). Due to these
efforts, S. solfataricus is now one of better understood archaea and is emerging as a
model system for archaeal and extremophile research. Investigations into mechanisms
employed by Archaea in response to extreme environmental factors promise to provide
information about molecular “guardians” that are required for this adaptation.
S. solfataricus (Figure 2) usually grows at temperatures of 60°C to 85°C within a
pH range from 1 to 4 and inhabits environments like solfataric hot springs where
elemental sulfur is abundant. The Sulfolobus cell envelope is composed of a cytoplasmic
membrane combined with a firmly attached S-layer of arrayed proteins on its surface
(Kandler and Konig 1998). This type of membrane was found to be a good insulator
(Hanford and Peeples 2002) and is probably responsible for the observed low
permeability to ions. A large pH gradient between the inside and the outside of the cell
can be established and this is exploited to generate energy via ATP synthase (She 2001).

5
Figure 2. Transmission electron microscopy image of S. solfataricus P2.
S. solfataricus is an aerobic organism with a heterotrophic life style (Ciaramella
2002; Snyder 2003). The genome was sequenced in 2001 and contains 2,992,245 base
pairs on a single chromosome and encodes approximately 3000 proteins and many RNAs
(She 2001). Based on amino acid homology, 40% of the predicted proteins were
homologous to other Archaea, 12% were exclusive to bacterial proteins and 2.3% to
eukaryotic proteins. The total G+C content of the genome is 36% and with respect to the
open reading frames (orfs), the usage of alternate start codons is significant (DeVendittis
and Bocchini 1996). Presence of unique class of introns in the preRNA is another
important characteristic of this crenarchaeon and several other thermophilic species

6
(Watanabe, Yokobori et al. 2002). In addition to the circular genome, other genetic
elements may exist in Sulfolobus, including plasmids and viruses (Snyder 2003).
Environmental Stress
Specific environmental factors such as elevated temperatures, UV radiation and
high concentrations of heavy metals are common agents of cellular stress (Dowling,
O'Driscoll et al. 2006). The analysis of an organism’s proteome allows the detection of
changes on the level of individual or groups of proteins and modified proteins in response
to environmental stressors. This potentially leads to the discovery of biomarkers
indicative of exposure and helps to gain insights into mechanisms of toxicity and
resistance to stress. Bacteria, yeast and mammalian cells have evolved strategies combat
such insults and S. Solfataricus is not an exception. However, only a few studies have
been conducted to investigate stress response pathway mechanisms in Archaea.
Oxygen, as a terminal electron acceptor, is a major player in the process of
aerobic respiration. Nevertheless, along with its beneficial properties, oxygen is able to
form reactive oxygen species (ROS), including superoxide (O2-), hydrogen peroxide
(H2O2), hydroxyl radical (.OH), among others. Many characterized antioxidant proteins
target the degradation of either superoxide or hydrogen peroxide. ROS can damage cells
by inactivating proteins, damaging nucleic acids, and altering fatty acids of the lipids that
compose cell membranes (Halliwell and Gutteridge 1990; Farr and Kogoma 1991). For
example, in the presence of oxygen, ferrous ion (Fe2+) readily generates aforementioned
ROS that damage biomolecules, and are toxic to cells (Figure 3). The damaging effects of

7
oxygen are not unique to aerobic organisms and all organisms must deal with deleterious
properties of ROS. For example, the contents of anaerobic cells are highly reduced, and
by oxidizing such essential biomolecules as thiols and iron-sulfur proteins, oxygen can
halt metabolism.
O2 O2- H2O2
.OH
molecular oxygen
hydroxyl radicalhydrogen peroxide
superoxide
H2O
water
e- e-e-e-
Figure 3. Reduction of molecular oxygen that leads to formation of various ROS.
What are the defense mechanisms against oxidative damage? Cellular defense
mechanisms to fight oxidative damage include antioxidative enzymes and small
molecules (e.g. superoxide dismutases, catalases, peroxidases, thioredoxins,
peroxiredoxins and glutathione). Extensive research has been done to investigate the role
of these enzymes in the detoxification of ROS within eukaryotes and bacteria (Storz and
Imlay 1999; Touati 2000). In addition to this, recent work has suggested that early
responses to oxidative stress involve reversible and irreversible modifications of selected
protein thiols, which play important role in redox signaling (Stamler and Hausladen
1998; Stamler, Lamas et al. 2001; Missall, Lodge et al. 2004; Camerini, Polci et al. 2005;
Sun, Steenbergen et al. 2006). Two common generators of ROS are H2O2 and heavy
metals.
Hydrogen peroxide is an oxidant, stabilized by the oxygen-oxygen bond.
Fluctuations in H2O2 levels affect the intracellular activity of key signaling components

8
including protein kinases and phosphatases (Rhee 2003). H2O2 can also be generated in
the cellular response to ultraviolet radiation (Finkel 1998).
Arsenic is one of the most common toxic substances in the environment and
geothermal environments are not an exception (Gihring and Banfield 2001; Langner,
Jackson et al. 2001; Macur, Jackson et al. 2004). Bacterial and eukaryotic resistance to
toxic substances has been well studied. Generally, in bacteria resistance is accomplished
by enzymatic reduction and energy-dependent efflux of toxins through membrane protein
pumps (Silver 1996). Eukaryotic cells have a tendency to resist metal toxicity by
inducing the expression of heat-shock proteins (HSP), with arsenite being the biggest
inducer of HSPs in several organs and systems (Del Razo, Quintanilla-Vega et al. 2001).
Arsenic is not a metal, it is rather a metalloid. Nevertheless, there is significant evidence
from mammalian studies that exposure to inorganic arsenic results in the generation of
ROS through the conversion of arsenate to arsenite (Lynn, Shiung et al. 1998; Flora
1999; Hartley-Whitaker, Ainsworth et al. 2001). Arsenic resistance systems of Archaea
on the level of proteome have not received much attention yet.
The goal of this research project was to identify key players of the S. solfataricus
P2 proteome that are part of cellular response pathways activated by common
environmental stress conditions. Hydrogen peroxide has been used as a natural mild
oxidant. Another set of experiments was conducted using two different arsenic species
(As (III) and As (V)) that are commonly present in the natural habitats of S. solfataricus
at concentrations that are toxic to many other organisms.

9
CHAPTER 2 PROTEOMIC RESPONSE OF SULFOLOBUS SOLFATARICUS P2 TO HYDROGEN
PEROXIDE INDUCED OXIDATIVE STRESS
Introduction In order to understand proteomic response of S. solfataricus to oxidative stress,
classical proteomics and mass spectrometric methods were applied to separate and
resolve large number of S. solfataricus proteins and detect changes in protein expression
patterns.
Introduction to Two-Dimensional Electrophoresis and 2D-DIGE
Conventional two-dimensional electrophoresis (2DE) enabled separation of
complex protein samples in two dimensions, where proteins are separated by their
isoelectric point in first dimension and by molecular weight in the second dimension. The
proteins are distributed over a gel strip that contains a preformed pH gradient. An electric
current is passed through the gel, creating a positive and negative end. The proteins move
along the gel and accumulate at their isoelectric point where the overall charge on the
protein is zero. Before the second dimension, that is a separation by mass, the proteins are
treated with sodium dodecyl sulfate (SDS) along with urea and other reagents. This
treatment denatures proteins and coats them with uniform negative charge due to binding
of SDS. SDS forms negatively charged SDS-protein complexes, where the amount of
negative charge bound is directly proportional to the mass of the protein. In second
dimension, an applied electric potential causes the proteins to migrate toward the positive

10
side of the polyacrylamide gel, proportionally to their mass-to-charge ratio.
Polyacrylamide gel represents molecular sieve and is composed of crosslinked
polyacrylamide chains that have absorbed a lot of solvent. As a result of this sieving
process, the proteins can then be detected on the gel by a variety of stains.
Introduction of highly sensitive fluorescent cyanine dyes adapted to 2D, the well-
known techniques of polyacrylamide gel electrophoresis, followed by isoelectric
focusing, have been greatly improved. This approach, called 2D-DIGE, relies on pre-
electrophoretic labeling of samples with one of three spectrally distinct fluorescent dyes
(Unlu, Morgan et al. 1997; Tonge, Shaw et al. 2001). Up to three samples prelabeled with
these dyes can be simultaneously run on the same gel, eliminating the gel-to-gel
experimental variation issue. The inclusion of an internal standard pooled from all
samples allows normalization across all gels. The samples can be visualized individually
by scanning the gel at different wavelengths. Image analysis software packages can then
be used to generate volume ratios for each spot between each channel, which allows
quantification of expression differences.
Introduction to Cysteine Reactivity Profiling
The redox status of cells can be studied from global proteomic perspective by
comparing the level of chemical labeling before and after exposure to the stressors. It is
well-established that, because of the nucleophilicity, sulfhydryl groups on cysteine
residues are very sensitive to changes in the redox level of the cell. It means that
reactivity of individual protein thiols to oxidation can be part of signal transduction
pathways (Leichert and Jakob 2004). Hydrogen peroxide itself is a mild oxidant and is

11
relatively inert to most biomolecules. However, hydrogen peroxide is able to oxidize
cysteine residues in proteins to cysteine sulfenic acid or disulfide, both of which are
readily reduced back to cysteine by various cellular reductants (Figure 4).
H2O2
S-SG
SO2H or SO3H
S – S
SH
SOH GSH
ROS
Free thiol
Sulfenic (cysteic) acid
GlutathionylationDisulfide bond
formation
Further oxidation
H2O
Figure 4. Thiol modifications of proteins. Formation of sulfenic acid from the reaction of H2O2 with protein free thiols leads to different protein modifications. In proteins without second sulfhydryl group, sulfenic acid may react with ROS to generate further oxidized sulfinic (-SO2H) and sulfonic (-SO3H) derivatives. Alternatively, a disulfide bond can form between the two sulfur atoms. In addition, sulfenic acid may react with glutathione or glutathione-like molecule, leading to a mixed disulfide.
There are several novel chemical probes that can specifically label free,
unmodified protein thiols which can be used to attach a fluorescent tag (Figure 5). Some
of them are very hydrophobic, like BODIPY 577/618 maleimide. There is likely to be
considerable aggregation of bulky hydrophobic dye molecules that interferes with

12
isoelectric focusing of proteins making this particular dye unsuitable for 2D
electrophoresis. In turn, BODIPY Fl-maleimide seems to be compatible with 2DE
experiments.
BODIPY® FL N-(2-aminoethyl)maleimide
4,4-difluoro-3,5-bis(4-methoxyphenyl)-8-(4-maleimidylphenyl)-4-bora-3a,4a-diaza-s-indacene
BODIPY 577/618 maleimide
Figure 5. Chemical structures of two thiol-reactive probes used in this study. Introduction to Phosphoproteome
Although originally believed to be a eukaryotic phenomenon, protein
phosphorylation is now known to occur in all three domains of life and it is considered as
a most common post-translational modification. The phosphorylation status of a cell’s
phosphoprotein population is controlled by the regulated activities of protein kinases and
phosphatases that catalyze phosphorylation and dephosphorylation, respectively (Figure
6). Knowledge of properties of the protein phosphorylation-dephosphorylation events
present in the members of the Archaea is scarce.
13
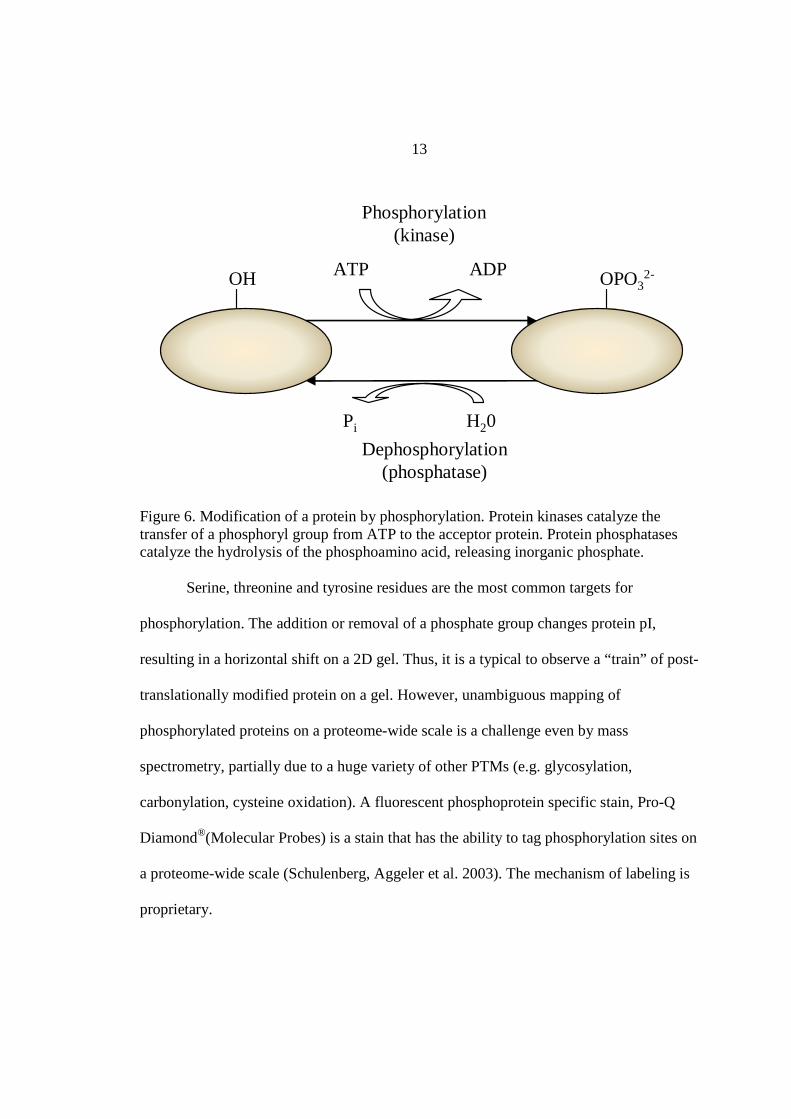
Phosphorylation(kinase)
Dephosphorylation(phosphatase)
OPO32-ATP ADP
Pi H20
OH
Figure 6. Modification of a protein by phosphorylation. Protein kinases catalyze the transfer of a phosphoryl group from ATP to the acceptor protein. Protein phosphatases catalyze the hydrolysis of the phosphoamino acid, releasing inorganic phosphate.
Serine, threonine and tyrosine residues are the most common targets for
phosphorylation. The addition or removal of a phosphate group changes protein pI,
resulting in a horizontal shift on a 2D gel. Thus, it is a typical to observe a “train” of post-
translationally modified protein on a gel. However, unambiguous mapping of
phosphorylated proteins on a proteome-wide scale is a challenge even by mass
spectrometry, partially due to a huge variety of other PTMs (e.g. glycosylation,
carbonylation, cysteine oxidation). A fluorescent phosphoprotein specific stain, Pro-Q
Diamond®(Molecular Probes) is a stain that has the ability to tag phosphorylation sites on
a proteome-wide scale (Schulenberg, Aggeler et al. 2003). The mechanism of labeling is
proprietary.

14
Introduction to Activity-Based Protein Profiling
As a result of creation of new therapeutic drugs researchers has been designing
many small molecules that bind tightly within the active site of a protein. The ability of
these molecules to react only with active forms of enzyme has led to invention of new
family of chemical probes, called activity-based probes. ABPs have been designed for
many families of enzymes and with different properties. Currently, probes exist for serine
hydrolases (Liu, Patricelli et al. 1999; Kidd, Liu et al. 2001), cysteine hydrolases
(Greenbaum, Arnold et al. 2002; Schmidinger, Hermetter et al. 2006), cysteine proteases
(van Swieten, Maehr et al. 2004; Kato, Boatright et al. 2005; Gredmark, Schlieker et al.
2007), metalloproteases (Freije and Bischoff 2003; Chan, Chattopadhaya et al. 2004;
Saghatelian, Jessani et al. 2004), tyrosine phosphatases (Kumar, Zhou et al. 2004; Liang,
Kumar et al. 2007; Zhang, Chen et al. 2007), serine phosphatases (Schmidinger,
Hermetter et al. 2006), serine proteases (Sieber, Mondala et al. 2004; Fonovic, Verhelst et
al. 2007), and many other families. They have been used to label active enzymes in cell
lysates, whole cells, tissues, and organisms. Probes can be obtained with fluorescent or
biotin tag.
In this study, one of the novel fluorescently labeled chemical probes, FAM-Phe-
DAP (5(6)-carboxyfluorescein-L-phenylalanyl diphenyl alkane phosphonate ester), has
been used to map serine hydrolases. A common feature of serine hydrolases, which
comprise proteases, lipases and esterases, is the active site consisting of the catalytic triad
Ser-His-Asp/Glu (Figure 7), that participates in the formation of a transient acyl-enzyme
complex between substrate and protease (Rawlings and Barrett 1994; Wong and Schotz

15
2002). Hydrolases are critical to the maintenance of cellular function. They hydrolyze
both external and internal nutrient sources and recognize and break down unneeded or
abnormal polypeptides, that are produced as a result of environmental stress (Tomoyasu,
Mogk et al. 2001). Global profiling of serine hydrolase activity in hyperthermophiles has
not been undertaken yet.
SerHisAsp
SerHisAsp
Active site Catalytic triad FluorophoreLinkerInhibitor
Figure 7. Schematic representation of binding of fluorescent inhibitor of serine hydrolases (FLISP) to the respective enzyme. Serine, histidine and aspartic/glutamic acid are present in the active site of serine hydrolase family. The specific fluorescent inhibitor binds covalently to the active site of respective enzyme.
Sample Preparation Cell Culture and Harvesting
Liquid cultures of S. solfataricus (P2), were grown aerobically in DSMZ media
182 (22.78 mM KH2PO4 + 18.90 mM (NH4)2 SO4 + 0.81 mM MgSO4 + 1.7 mM CaCl2 +
0.2% Yeast Extract) pH adjusted to 2.8 with 6N H2SO4. All cultures were grown in long
neck Erlenmeyer flasks at 80ºC. Hydrogen peroxide was added to stress cultures, to a

16
final concentration of 30µM. Hydrogen peroxide concentrations were determined using
the molar extinction coefficient (43.6M-1cm-1) at 240nm.
Three liters of DSMZ media 182 (pH~2.8) was inoculated with 15 ml of a late-log
phase (OD650 0.52) S. solfataricus culture and then divided evenly between three, 2-liter
long neck culturing flasks. At 62.5 hrs after the start of culturing (OD650 ~0.3), 20 ml of
each 1 liter culture was removed and placed in a separate 50 ml flask as non- H2O2
stressed growth controls. The three separate cultures (~930 ml) were then treated with
hydrogen peroxide (final concentration of 30µM). At 1, 2, 4, 8, 15, 30, 45, 60, 75, 90,
105, 120, 150 and 195 minutes post H2O2 addition, 50 ml aliquots were removed for
protein isolation.
Extraction of Proteins
The cells were harvested by centrifugation at 5000 x g at 4oC for 15 minutes and
washed with ice-cold PB. Cells were broken by freeze and thaw followed by sonication
in urea lysis buffer (30 mM Tris-HCl pH 8.5, 7 M urea, 2 M thiourea, 4% CHAPS, 1%
ASB-14, 50 mM DTT, 0.5% IPG carrier ampholytes and protease inhibitor cocktail).
After the supernatant was clarified by centrifugation, soluble proteins were purified and
concentrated by precipitation with 5 volumes ice-cold acetone, and resolubilized for 1h in
urea lysis buffer. Protein concentration was measured with the RC/DC Protein Assay Kit
(Bio-Rad). Samples were kept frozen until use.

17
2D-DIGE Analysis
S. solfataricus protein samples (30 min, 105 min post-H2O2 treated and non-
treated control sample) were labeled with CyDyes according to the manufacturer’s
protocol. 2D-DIGE experiment was performed in triplicate. Briefly, 50 µg of each protein
extract was labeled separately at 0oC in the dark for 30 min with 400 pmoles of the N-
hydroxysuccinimide esters of cyanine dyes (Cy3 and Cy5 CyDyes; GE Healthcare). The
internal standard, an equimolecular mixture of all the protein extracts, was labeled with
Cy2. Total protein labeled with Cy2, Cy3 and Cy5 for matched control and H2O2 stressed
samples were combined and mixed with the urea lysis buffer. 2-DE was performed as
described elsewhere (Gorg, Weiss et al. 2004; Maaty, Ortmann et al. 2006), using
precasted IPG strips (pH 3–11 NL, non-linear, 24 cm length; GE Healthcare) for the first
dimension (IEF). 150 µg of protein (50 for each dye) was loaded on each IPG strip and
IEF was carried out with the IPGPhor II (GE Healthcare). Focusing was carried out at
20oC, with a maximum of 50 µA per strip. Active rehydration was achieved by applying
50 V for 12 h. This was followed by a stepwise progression of 500 V up to 8000 V for a
total of 44,000 Vhr. After IEF separation, the strips were equilibrated twice for 15 min
with 50 mM Tris-HCl, pH 8.8, 6 M Urea, 30% glycerol, 2% SDS and a trace of
bromophenol blue. The first equilibration solution contained 25 mM DTT, and 50 mM
iodoacetamide was added in the second equilibration step instead of DTT. Second-
dimension SDS-PAGE was performed in Dalt II (GE Healthcare) using 1 mm-thick, 24-
cm, 13% polyacrylamide gels, and electrophoresis was carried out at a constant current
(15 mA/gel for ~16h at 20oC). Electrophoresis was completed once the bromophenol blue

18
dye front reached the bottom of the gel. ProQ™ Diamond Phosphoprotein Gel Stain
(Invitrogen), SYPRO® Ruby (Bio-Rad), and Coomassie® Brilliant Blue (Thermo
Scientific) stains were used according to the manufacturer's instructions.
Gel Imaging and Analysis
After electrophoresis, gels were scanned using the Typhoon Trio Imager
according to the manufacturer’s protocol (GE Healthcare). Scans were acquired at 100
µm resolution. Images were subjected to automated difference in gel analysis using
Progenesis SameSpots software version 3.1 (Nonlinear Dynamics Ltd.). The Cy3 gel
images were scanned at an excitation wavelength of 532 nm with an emission wavelength
of 580 nm, Cy5 gel images were scanned at an excitation wavelength of 633 with an
emission wavelength of 670 nm, while the Cy2 gel images were scanned at an excitation
wavelength of 488 nm with an emission wavelength of 520 nm. Gel spots were co-
detected as DIGE image pairs, which were linked to the corresponding in-gel Cy2
standard. After scanning, the gels were stored in 1% acetic acid at 4oC until spot excision.
Spots were identified and volumes were quantified using Progenesis SameSpots software.
In-gel Digestion and Protein Identification
Selected spots were manually excised from corresponding gels. The gel slices
were destained using 50% acetonitrile in 50 mM ammonium bicarbonate and vacuum
dried. Samples were rehydrated with 1.5 mg/ml DTT in 25 mM ammonium bicarbonate
at 56°C for 1 hour, subsequently alkylated with 10 mg/ml IAA in 25 mM ammonium
bicarbonate (pH 8.5), and stored in the dark at room temperature for 1 hour. The pieces

19
were subsequently washed with 100 mM ammonium bicarbonate for 15 min, washed
twice with 50% acetonitrile in 50 mM ammonium bicarbonate for 15 min each, vacuum
dried, and rehydrated with 4 µl of proteomics grade modified trypsin in 25 mM
ammonium bicarbonate. The pieces were covered in a solution of 10 mM ammonium
bicarbonate with 10% acetonitrile and incubated at 37°C for 18 hours. The solution
containing peptides released during in-gel digestion were transferred to sample analysis
tube prior to mass analysis. LC/MS/MS used an Agilent XCT-Ultra 6330 ion trap mass
spectrometer which is fitted with an Agilent 1100 CapLC and ChipCube (Agilent, Inc.).
Samples were trapped and desalted on the Zorbax 300SB-C18 Agilent HPLC-Chip
enrichment column (40 nl volume) in 5% acetonitrile 0.1% formic acid delivered by an
auxiliary CapLC pump at 4 µl/min. The peptides were then reverse eluted and loaded
onto the analytical capillary column (43 mm x 75 µm ID, also packed with 5 µm Zorbax
300SB-C18 particles) connected in-line to the mass spectrometer with a flow of 600
nl/min. Peptides were eluted with a 5 to 90% acetonitrile gradient over 16 min. Data-
dependent acquisition of collision induced dissociation tandem mass spectrometry
(MS/MS) was utilized. Parent ion scans were run over the m/z range of 200 to 2 200 at
24,300 m/z-s. MGF compound list files were used to query an in-house database using
with MS and MS/MS ion mass tolerances of 1.2 and 0.5 amu respectively. Protein
identification from peptide MS and MS/MS data was based on MASCOT (Matrix
science, London, UK) searches of an in-house database. The in-house database contained
the complete genome of S. solfataricus P2 translated in all reading frames with user-
defined modifications. For example, a pyrrolysine codon was included in place of the

20
amber stop codon. MS score is a probability based implementation of the MOWSE
scoring algorithm that is used by Mascot search engine (Pappin, Hojrup et al. 1993).
Positive identification required two significant peptides (score >50), however most
protein scores were significantly above the minimum criteria.
Cysteine Reactivity Profiling
Experimentation S. solfataricus cells H2O2-treated for 0, 30 or 105 min were resuspended in
phosphate buffer (PB, pH 7.4). Fluorescent sulfhydryl-modifying reagent 4,4-difluoro-
3,5-bis(4-methoxyphenyl)-8-(4-maleimidylphenyl)-4-bora-3a,4a-diaza-s-indacene
(BODIPY® 577/618 maleimide; Figure 5) was added to the cells prior to the lysis
procedure.
The reagent was added to a final concentration of 100 uM. Cells were lysed by sonication
(three 30 sec cycles; 50% duty cycle; power output control at 2 (Branson Sonifier). After
this step, the reaction was handled differently for 1D and 2D analysis as described below.
1D HEPES SDS-PAGE: The reaction with BODIPY® 577/618 maleimide was
carried out for two hours in the dark in the presence of denaturing agent (1% SDS). The
protein supernatants were clarified by centrifugation at 20,000 × g for 60 min at 4oC and
collected. Samples were mixed with 4x SDS sample buffer (non-reducing conditions)
before separation over mini 4-20% HEPES SDS-PAGE gel. Labeled mixtures were run
on SDS gel in triplicate. Fronts were run off the gels to remove unreacted dye and obtain
cleaner fluorescence images. Fluorescence image was obtained on Typhoon Trio Imager

21
(GE Healthcare) using green laser (532 nm) with 610 nm filter at 400 V. Then the gel
was stained with Coomassie® Brilliant Blue (CBB) and scanned in 48 bit color mode at
600 dpi resolution without color correction. Scans were stored as TIF images with no
compression. Background subtraction was done using ImageJ (National Institutes of
Health; version 1.39m). Lanes from triplicate experiment were averaged using Image
Calculator and Region of Interest (ROI) manager. Graph of fluorescent intensity versus
pixel width was plotted using Microsoft Excel 2003 (Microsoft) software.
2DE: After sonication, the reaction with 100 uM BODIPY® FL maleimide
(Figure 5) was carried out for two hours in the dark. The protein supernatants were
clarified by centrifugation at 20,000 × g for 60 min at 4oC and collected. Protein samples
were purified and concentrated with ice-cold acetone precipitation. Afterwards, protein
samples were resolubilized for 1h in urea lysis buffer. Protein concentration was
measured with the RC/DC Protein Assay Kit (Bio-Rad). Samples were kept frozen until
use. 400 ug of protein sample were loaded into precasted IPG strips (pH 3–11 NL, non-
linear, 24 cm length; GE Healthcare). 2DE procedure was performed as described earlier.
Experiment was done in three technical replicas with nine gels in total. Detection of
fluorescent proteins by laser scanning was performed on Typhoon Trio Imager using
green laser (532 nm) with 610 nm filter at 450 V. The whole protein pattern was
subsequently visualized by staining with Coomassie® Brilliant Blue following the
manufacturer’s instructions and scanned in 48 bit color mode at 600 dpi resolution
without color correction.

22
Activity-Based Protein Profiling Experimentation S. solfataricus cells H2O2-treated for 0, 30 or 105 min were resuspended in PB
(pH 7.4). The FLISP reagent, FAM-Phe-DAP, which specifically labels active forms of
serine hydrolases, was reconstituted in DMSO and mixed thoroughly. Afterwards, stock
solution was diluted with PB, pH 7.4. The diluted reagent was added to test samples to a
final concentration of 20 uM. Cells were lysed by sonication as described earlier. The
whole cell lysates and FLISP reagent were incubated for 2 hours at 370C and periodically
vortexed during the incubation time. The protein supernatants were clarified by
centrifugation at 20,000 × g for 60 min at 4oC and collected. Samples were split for 1D
SDS PAGE and 2DE experiments. The gels were scanned on Typhoon Trio Imager with
488 nm excitation and 610 nm emission optics pairing. The whole protein pattern was
subsequently visualized by staining with Coomassie® Brilliant Blue.
Results
2D-DIGE Analysis
In order to map differentially regulated proteins after H2O2 exposure, 3 gels were
analyzed with Progenesis SameSpots software. The number of detected spots exceeded
1000. However, only 818 spots were confirmed after exclusion of the gels’ artifacts.
These spots were used in the analysis across all gels. Representative 2D image is
displayed in Figure 8 and list of regulated proteins can be found in Table 1. There was
one regulated protein spot after 30 minutes and 29 at 105 minutes (19 of which were

23
more abundant and 10 less abundant). Protein fold changes were ranging from -4 to +8
fold.
The largest fold change in the proteomic analysis was for the DPS-Like protein
(DNA–binding Protein from nutrient Starved E. coli cells). The DPSL protein was found
in three different gel spots that all increased in abundance at 105 min after H2O2
exposure. The three forms of the protein differed in pI and fold difference (Figure 8 and
9). Ferritin-like nonheme iron binding protein rubrerythrin (SSO2642) represents another
example of up-regulation. Moreover, it is present in three spots on both the 30 and 105-
minute 2D gels. These spots (Figures 8 and 9) had different pIs and expression levels. For
example, the isoform in spot 6 increased significantly in abundance in stressed cells,
whereas spots 2 and 8 decreased in abundance by 3.8-fold. Peroxiredoxin (SSO2121),
also known as Bcp2, is also up regulated at the 30 and 105-minute time points in the
proteome (Figures 8 and 9).
A number of proteins, including superoxide dismutase, small heat shock protein,
peroxiredoxin, elongation factor-1 alpha, MarR-Like transcriptional regulator (SSO1082)
and hypothetical protein SSO2588 are up-regulated.
Of the 19 regulated proteins found in this study, 5 were identified in more than
one spot; DPSL (SSO2079), superoxide dismutase (SSO0316), probable peroxiredoxin
(SSO2121), rubrerythrin (SSO2642), elongation factor 1-alpha (SSO0216) and
thermosome alpha subunit (SSO0862).

24
3 11
pI
200
116
97
66
45
31
21
14
Mol
ecul
ar W
eigh
t (k
Da)
22
394 5
13 3 1 26 5231
122 6 8
25
711
35
Figure 8. Regulated proteins of the S. solfataricus proteome after 105 minutes treatment with 30 mM H2O2. 818 spots were used in the CyDye 2D-DIGE analysis. 18 protein spots changed significantly in abundance after 105 minutes exposure. Gel was stained with SYPRO Ruby.

25
Table 1. List of regulated proteins in 2D-DIGE experiment. 2D spot
#Gene ID Regulated protein
Mass (Da)
pIFold
DifferenceMS
SCORE
1 SSO2079 DPS-Like 21927 5.38 8.12 219
13 SSO2079 DPS-Like 21927 5.38 5.20 233
3 SSO2427 Small heat shock protein hsp20 20084 5.31 4.92 260
3 SSO2079 DPS-Like 21927 5.38 4.92 86
5 SSO0862 Thermosome alpha subunit 59695 5.35 2.86 491
5 SSO0282 Thermosome beta subunit 60387 5.56 2.86 501
4 SSO0862 Thermosome alpha subunit 59690 5.35 2.52 283
25 SSO2588 Oxidoreductase 15686 7.74 2.35 172
25 SSO1082 Transcriptional regulator, marR family 18313 9.12 2.35 104
25 SSO0276 Small nuclear ribonucleoprotein 16504 7.82 2.35 163
22 SSO0216 Translation elongation factor EF-1alpha 48573 8.93 2.03 540
26 SSO2121 Peroxiredoxin 24786 6.85 1.93 119
26 SSO0316 Superoxide dismutase [Fe] (sod) 24228 6.71 1.93 144
12 SSO3216 gamma-glutamyltranspeptidase 53136 5.67 1.89 75
31 SSO2121 Peroxiredoxin 24786 6.85 1.87 98
6 SSO2642 Rubrerythrin (rr) 16081 5.44 1.79 134
52 SSO0316 Superoxide dismutase [Fe] (sod) 24228 6.71 1.70 163
35 SSO0936 Glutamyl-tRNA(Gln) amidotransferase 71661 5.91 -1.61 161
39 SSO2044 NAD specific glutamate dehydrogenase 46091 6.5 -2.13 436
11 SSO0348 Signal recognition particle receptor protein 40390 5.29 -2.84 237
11 SSO0010 X-Pro aminopeptidase 40594 5.35 -2.84 141
8 SSO2642 Rubrerythrin (rr) 16081 5.44 -3.06 118
2 SSO2642 Rubrerythrin (rr) 16081 5.44 -3.83 277
7 SSO1045 Ribose phosphate pyrophosphokinase 32517 6.13 -4.07 161

26
+ - + -
Rubrerythrin
SsDPSL
Peroxiredoxin
0µM H2O2 30µM H2O2
11 3313 13
2 6 8 2 6 8
2626
31 31
Figure 9. Post translational modification is a common feature in S. solfataricus. Three of the proteins that are regulated after H2O2 treatment are known to be important in oxidative stress and were found in multiple gel spots. Modifications can alter the pI and MW position on 2D gels. The paired panels show close ups of Sypro Ruby stained 2D gels, 105 minutes after addition of 30 µM H2O2. White circles indicate DPSL (SSO2079; 21639 Da; pI 5.25) spot 1,3 &13, Rubrerythrin (SSO2642; 16081 Da; pI 5.44) spot 2,6 & 8 and Peroxiredoxin (SSO2121; 24786Da; pI 6.85) spot 26 &31.
Staining of control and H2O2 treated SDS PAGE gels with Pro-Q Diamond®
showed clear changes in the pattern of phosphorylation. Spots containing high levels of
phosphorylation were selected for in-gel digestion. Fourteen spots were excised. Ten of
the 14 spots contained more than one protein; therefore, the specific phosphorylated
protein could not always be unambiguously determined. Twenty different proteins were
identified from the 14 spots, 7 of which were found in more than one horizontally
separated position (SSO1355, 1952, 242 and 2044 in spots P5, P6 and P7; SSO199, 1389

27
and 2044 in spots P9 and P10; SSO530 and 755 in spots P11 and P12; SSO in spots P13
and P14), as would be expected for differential phosphorylation (Figure 10, Table 2).
3 11200
116
97
66
*45
31
21
14
Mol
ecul
ar W
eigh
t (k
Da)
P14
P13
P9 P10
P12
P6
P4
P3
P1
P2
P8P11
P5 P7
pI
Figure 10. 2D gel of the S. solfataricus phosphoproteome 105 minutes after H2O2 treatment. Gel was stained with phosphoprotein specific stain ProQ Diamond. Each of the numbered spots was picked and the proteins were identified using in-gel proteolysis followed LC-MS/MS. Ovalbumin (* on left) is a 45 kDa phosphoprotein standard.

28
Table 2. Proteins identified from phospho-stained spots.
2D spot # Gene ID NAME Mass (Da) pI MS Score
P1 SSO0342 ribosomal protein L12 11284 4.84 178
P1 SSO0353 SSU ribosomal protein S19E 18107 10.03 155
P1 SSO0696 ribosomal protein L15 16187 10.45 135
P2 SSO0073 ribosomal protein S4 20735 9.89 258
P2 SSO1195 Phosphohistidine phosphatase 18169 5.52 100
P3 SSO0192 Disulfide oxidoreductase 25902 4.7 394
P3 SSO0746 30S ribosomal protein S3AE 23585 9.71 138
P4 SSO2483 Succinyl-CoA synthetase, beta subunit 37388 5.57 512
P5 SSO0286 hypothetical protein 42681 5.78 298
P5,P6,P7 SSO1355 Thermostable Carboxypeptidase 43326 5.93 218,419,183
P5,P6,P7 SSO1952 Thermostable carboxypeptidase 43250 5.93 143,301,150
P6, P7 SSO0242 Adenylosuccinate synthase 37417 5.83 206, 94
P7, P10 SSO2044 Glutamate dehydrogenase 46091 6.5 157,278
P8 SSO0369 Long-chain-fatty-acid-CoA ligase 51587 6.11 163
P8 SSO2635 Hypothetical protein 52481 5.6 741
P9 SSO0199 S-adenosylmethionine synthetase 45382 5.86 680
P9 SSO1389 Conserved hypothetical protein 43073 6.13 55
P11, P12 SSO0530 serine hydroxymethyltransferase 485356.22 261,463
P11, P12 SSO0755 S-adenosylhomocysteine hydrolase 45936 6.3 146, 189
P13, P14 SSO0216 Elongation factor 1-alpha 48573 8.93 573,104
Cysteine Reactivity Profiling
Comparison of whole proteome labeling patterns before and after treatment with
H2O2 revealed a limited number of proteins that were highly sensitive to the redox
potential (Figure 11). The curves show the average fluorescence intensity after
normalization for protein concentration from three separate experiments. The percentage
of reduced-thiols across the proteome decreased 30 minutes after H2O2 exposure (black
line). By the second time point (105 minutes, red line) there was a general recovery and
some protein bands were more reactive than before treatment.

29
0
1000
2000
3000
4000
5000
6000
0100200300400500
Flu
ores
cenc
e (a
rbitr
ary
units
)
105 min
30 min
0 min
15 20 25 37 50 75 100 150
kDa
*
Figure 11. Protein thiol reactivity changes in H2O2 stressed S. solfataricus. Proteome-wide labeling of free cysteine thiols, with BODIPY 577/618 maleimide, shows that there is a population of redox sensitive proteins. Plot on the top shows the average fluorescent signal with respect to molecular weight. The fluorescent signal from three experiments was combined and normalized for total protein. The gel lanes at the bottom show the actual data for the 0 (blue line), 30 (black line) and 105 minute (red line) samples. * indicates protein band that were highly sensitive to changes in redox potential.
To further investigate thiol reactivity to the external stimulus, 2DE experiment
was performed with the same set of samples (Figure 12). Less hydrophobic BODIPY FL
maleimide was used instead BODIPY 577/618 to avoid protein precipitation during IEF.
29 regulated protein spots were detected. The biggest fold difference in the expression
analysis was found for the DPSL protein, which is consistent with the results from 2D-
DIGE experiment. In fact, the DPSL protein was present in three different gel spots that
all increased in abundance at 105 min after H2O2 exposure. Interestingly, some

30
fluorescently detected spots that correspond to proteins with labeled sulfhydryl groups do
not match in intensity with non-specifically labeled ones (Figure 12). Specific and
nonspecific labeling is shown on the example of DPSL protein (Figure 12; Table 3).
Three isoforms of DPSL show different levels of cysteine reactivity in response to
oxidative stress.
1 2 3 1 2 3
A
DC
B
1 2 3 1 2 3FE
3 11pI
3 11pI
Figure 12. Proteins of the S. solfataricus labeled with thiol-specific BODIPY-FL dye. 2D gels on the upper panel represent changes in thiol reactivity at two time points: 30 minutes (A) and 105 (B) minutes after exposure to H2O2. The paired panels (C&D, E&F) show close-ups of the same set of gels. Black circles indicate spots where different isoforms of DPSL (SSO2079; 21639 Da; pI 5.25) were found. Detection of fluorescently tagged proteins was performed using green laser (532 nm) with 610 nm filter (A, B, C, D). Coomassie Brilliant Blue was used as a non-specific protein stain (E, F).

31
Table 3. List of proteins with altered cysteine reactivity after 105 min of exposure to 30 uM H2O2.
Gene ID Regulated protein # of Cys Score MW PIRegulationSSO1817 Thiosulfate sulfurtransferase 1 95 33691 6.41 2.022SSO0564 ATP synthase subunit B 1 161 51114 5.3 2.161SSO2121 Peroxiredoxin (bcp2) 1 170 24786 6.85 2.49SSO0576 Ketol-acid reductoisomerase 1 217 36845 6.56 2.393SSO0530 Serine hydroxymethyltransferase 1 255 48535 6.221.671SSO2586 hypothetical protein 1 123 48698 6.18 1.671SSO2079 DNA protection protein DPS 3 111 21927 5.38 9.6SSO0738 proteasome alpha subunit 1 258 26629 5.69 -1.799SSO0232 Glutamyl-tRNA -Gln amidotransferase 7 85 52703 6.93 -1.756SSO0561 ATP synthase subunit E (atpE) 1 114 22676 6.69 -1.807 Activity-Based Protein Profiling
Activity-based profiling of serine hydrolases in the whole cell extract of S.
solfataricus (Figure 13) was analyzed on 4-20% gradient 1D SDS PAGE gels and 13%
non-gradient 2DE gels (Figure 14). The results from the 1D gels showed several
intensified protein bands. Fluorescent signal from a low molecular weight protein (~30-
35 kDa) is absent at 30 min time point; however, it is present at 0 and 105 min.
Fluorescent intensities from other distinct bands (~25 kDa and ~55 kDa) have not
changed significantly over time. Bands of interest were excised from the gel and
identified by LC-MS/MS. Upper band and lower bands correspond to thermostable
carboxypeptidase (SSO3105; 54807 Da) and proteasome alpha subunit (SSO0738; 26629
Da) respectively. MASCOT search for digested peptides could not provide trustworthy
identification with two significant peptides for 30-35 kDa protein, but it was suggested
that the protein of interest is lipase (SSO2493, 33583 Da).
32
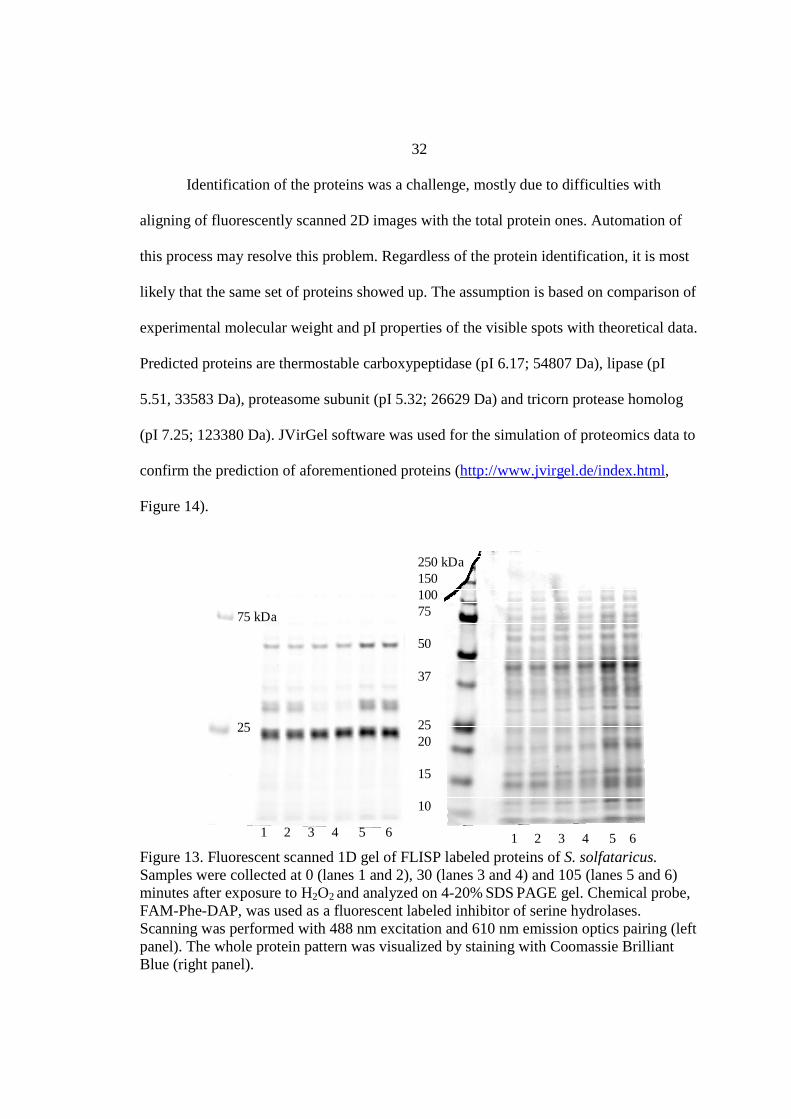
Identification of the proteins was a challenge, mostly due to difficulties with
aligning of fluorescently scanned 2D images with the total protein ones. Automation of
this process may resolve this problem. Regardless of the protein identification, it is most
likely that the same set of proteins showed up. The assumption is based on comparison of
experimental molecular weight and pI properties of the visible spots with theoretical data.
Predicted proteins are thermostable carboxypeptidase (pI 6.17; 54807 Da), lipase (pI
5.51, 33583 Da), proteasome subunit (pI 5.32; 26629 Da) and tricorn protease homolog
(pI 7.25; 123380 Da). JVirGel software was used for the simulation of proteomics data to
confirm the prediction of aforementioned proteins (http://www.jvirgel.de/index.html,
Figure 14).
25
75 kDa
250 kDa15010075
50
37
2520
15
10
1 2 3 4 5 6 1 2 3 4 5 6 Figure 13. Fluorescent scanned 1D gel of FLISP labeled proteins of S. solfataricus. Samples were collected at 0 (lanes 1 and 2), 30 (lanes 3 and 4) and 105 (lanes 5 and 6) minutes after exposure to H2O2 and analyzed on 4-20% SDS PAGE gel. Chemical probe, FAM-Phe-DAP, was used as a fluorescent labeled inhibitor of serine hydrolases. Scanning was performed with 488 nm excitation and 610 nm emission optics pairing (left panel). The whole protein pattern was visualized by staining with Coomassie Brilliant Blue (right panel).

33
A B
1
2
3
4
1
2
3
4
1
2
3
4
1
2
3
4DC
Figure 14. Fluorescent scanned 2D gels of FLISP labeled proteins of S. solfataricus after 0 (A), 30 (B) and 105 (C) min after treatment with H2O2. Four groups of proteins were predicted to be thermostable carboxypeptidase (number 2; pI 6.17; 54807 Da), lipase (number 3; pI 5.51, 33583 Da), proteasome subunit (number 4; pI 5.32; 26629 Da) and tricorn protease homolog (number 1; pI 7.25; 123380 Da). JVirGel software (D) determined the theoretical pI and the calculated molecular weights MW of the proteins and visualizes these as a virtual 2D protein map. The lone group of proteins having a mismatch is indicated by the arrow.
Discussion
The results from H2O2 2D-DIGE experiment revealed 24 regulated proteins from
29 protein spots. The identified proteins are listed in Table 1 according to their fold

34
difference along with Sulfolobus gene number, molecular weight, pI, and Mascot score
(MS). In this experiment, MOWSE scores ranged from 75 to 540 using only peptide
scores > 32, which indicates identity (p<0.05). Several proteins were identified from
multiple spots, which can occur if the protein is post-translationally modified. This
observation indicates that the existence of PTMs is a common feature of S. solfataricus
proteome. The largest increase in abundance (8.5-fold) was found for DPSL protein
(SSO2079). This finding was consistent with the microarray data and the increased
abundance observed by northern and western analysis (Maaty et al., unpublished data).
Moreover, the three isoforms of DPSL show different levels of cysteine reactivity in
response to oxidative stress. Together, these results suggest that DPSL is important
component in the regulation of cellular redox potential and oxidative stress. The role of
DPSL is also supported by in vitro data showing that DPSL is able to use hydrogen
peroxide in the oxidation of Fe (II). One hydrogen peroxide molecule oxidizes two Fe
(2+) ions, which prevents hydroxyl radical production, removing two types of reactive
molecules at once. The oxidized iron, in the presence of hydrogen peroxide, becomes
mineralized and is stored as a mineral core on the interior surface of the protein cage
(Wiedenheft, Mosolf et al. 2005).
Regulated proteins were mostly cytosolic. However, the relationship and
biological significance of the 19 up and 10 down regulated proteins and the pathways that
may connect them were not immediately obvious. Functional annotation was required to
solve this problem. DAVID (The Database for Annotation, Visualization and Integrated
Discovery) is web-based software that provides a comprehensive set of functional

35
annotation (http://david.abcc.ncifcrf.gov/home.jsp). DAVID uses an algorithm to
measure relationships among the annotation terms based on the degrees of their co-
association genes to group the similar, redundant, and heterogeneous annotation contents
from the same or different resources into annotation groups. The results of this analysis
are shown in Figure 15. Functional groups include: ion and metal binding (3 proteins out
of 24), nucleotide binding (4), metabolic processes (12) and oxidoreductase activities (7).
In DAVID, P-Value equal or smaller than 0.05 is considered strongly enriched in the
annotation categories. Based on this, the only strongly enriched cluster belongs to
“oxidoreductase activity”. Oxidoreductase activities include a variety of different
functions starting with protein folding, denaturation, degradation, electron transport, and
oxidative stress response (Niimura, Nishiyama et al. 2000; Nishiyama, Massey et al.
2001). Seven proteins involved in oxidoreductase activities are of particular interest. This
group includes DPSL protein (SSO2079), superoxide dismutase (SSO0316), rubrerythrin
(SSO2642), peroxiredoxin (SSO2121), acyl-CoA dehydrogenase (SSO2877), NAD
specific glutamate dehydrogenase (2044) and malate oxidoreductase (SSO2869).
Together with DAVID analysis, earlier investigations have also demonstrated that
superoxide dismutase, peroxiredoxin and rubrerythrin are involved in oxidoreductase
activities in various species; moreover, these proteins are known to target the degradation
of either superoxide or hydrogen peroxide.

36
Figure 15. Functional annotation of proteins regulated in response to oxidative stress. “Count” column and blue bars show how many genes involved in individual term. “P-value” column is the modified Fisher Exact P-value. Usually P-Value is equal or smaller than 0.05 to be considered strongly enriched in the annotation categories. Overall “enrichment score” is based on the P-value scores of each term members.
In this study, superoxide dismutase (SOD; SSO0316) is up-regulated. It is not
surprising, because the importance of SOD as an antioxidant is evident in SOD-deficient
strains of Escherichia coli, which exhibited big growth defects when exposed to air
(Carlioz and Touati 1986). In general, superoxide species are managed by either
superoxide dismutases or superoxide reductases (Mccord and Fridovic.I 1969; Adams,
Jenney et al. 2002). Hydrogen peroxide is a product of such superoxide detoxification.

37
Thus, other proteins are required to minimize intracellular H2O2 concentration and
mitigate oxidative damage. It is most likely that identified up-regulated members of
oxidoreductase cluster are key players in the “game”.
DAVID results lead to another protein with oxidoreductase activity, rubrerythrin.
Role of rubrerythrin in cellular redox potential is well established (Weinberg, Jenney et
al. 2004). In the referenced study, the peroxidase activities of the recombinant forms of
rubrerythrin were proportional to the iron content. It was proposed that protein functions
in an NADH-dependent, hydrogen peroxide: rubredoxin oxidoreductase system.
Therefore, it is most likely that S. solfataricus uses rubrerythrin in its oxidative stress
protection mechanism. Rubrerythrin was present on both the 30 and 105-minute 2D gels
in multiple isoforms. These three isoforms (spots 2, 6 and 8; Figure 9) had different pIs
and different levels of expression. For example, the intensity in spot 6 increased
significantly in abundance in stressed cells, whereas spots 2 and 8 decreased in
abundance by 3.8-fold. Identification of PTMs is always a challenge; thus, the nature of
these modifications remains to be unveiled.
Peroxiredoxin (SSO2121) is up-regulated in the proteome at the 30 and 105-
minute time points; in addition it is present in two isoforms (Figure 9). It plays an
important role in the peroxide-detoxifying system in S. solfataricus (Limauro, Pedone et
al. 2006). Moreover, the protein reveals high sequence identity with peroxiredoxins from
other organisms, such as aerobic hyperthermophilic archaeon Aeropyrum pernix (61%)
(Jeon and Ishikawa 2003), hyperthermophilic bacterium Thermotoga maritima (61%),
and anaerobic hyperthermophilic archaeon Pyrococcus horikoshii (57%) (Kashima and

38
Ishikawa 2003). Peroxiredoxin along with DPSL and several other proteins shows
different level of cysteine reactivity in response to oxidative stress (Table 3). As it was
mentioned earlier, one of the possible modifications is oxidation of active site cysteine
residues to cysteic acid (Rabilloud, Heller et al. 2002). This hypothesis is supported by
mutagenesis studies that have shown that the only cysteine, Cys49, in the peroxiredoxin
sequence, is involved in the catalysis (Limauro, Pedone et al. 2006).
Another important protein involved in general oxidative stress response is
translation elongation factor (SSO0216), which was found to be up-regulated and also
phosphorylated. Recent studies indicate that expression of this protein in rat embryonic
cell line significantly increases during apoptotic events caused by H2O2 (Chen, Proestou
et al. 2000). Intriguing connection between elongation factor and peroxiredoxin has been
revealed when mouse cells transfected with both proteins have increased resistance to
peroxide-induced apoptosis compared to single transfectants (Chang and Wang 2007). It
will not be surprising if S. solfataricus possess a similar defense mechanism.
The connection of other regulated proteins to oxidative stress is not well defined
yet. Although, glutaredoxin related protein (SSO0192), which appears to be
phosphorylated (Table 2), was reported to be regulated in S. solfataricus after H2O2
exposure (Pedone, Limauro et al. 2006). S-adenosylmethionine synthetase and glutamate
dehydrogenase showed clear changes in regulation in addition to phosphorylation (Table
1 and 2). NAD specific glutamate dehydrogenase (SSO2044) represents a down-
regulated protein (Table 1). It is classified as oxidoreducatase and most likely involved in
oxidative stress response.

39
The percentage of reduced thiols across the proteome decreased 30 minutes after
H2O2 exposure and then recovered at 105 minutes time point (Figure 7). The antioxidant
machinery is not ready to counteract to high concentration of H2O2 at early time points;
hence, sensitive cysteinyl residues are oxidized to sulfenic acid adducts that can either
form disulfides with other free cysteines or be further oxidized to sulfinic or sulfenic
acids (Figure 4). Once the stressor is inside the cell, it triggers the transcription and
translation of the proteins, capable of detoxifying the ROS and repairing the damage
(Figure 7). This is consistent with from 2D-DIGE experiments, where the overall
expression profiles of the genes involved in stress response, were significantly higher,
when exposure to stress reaches second time point (105 min).
There are 67 known and putative peptidases and 9 non-peptidase homologues in
S. solfataricus. 16 of them are serine hydrolases, including serine proteases, lipases and
esterases (http://merops.sanger.ac.uk/). FLISP reagent, FAM-Phe-DAP, labels only active
catalytic sites of serine hydrolases (Figure 13, left panel) Based on that, three distinct
bands were selected for further analysis and identification. Three proteins are
thermostable carboxypeptidase (SSO3105; 54807 Da), proteasome alpha subunit
(SSO0738; 26629 Da) and lipase (SSO2493, 33583 Da); with lipase having low
probability MOWSE score. One of three identified hydrolases, thermostable
carboxypeptidase, has an overlap with the phosphoproteome study. Results from the gel
electrophoresis indicate that thermostable carboxypeptidase and proteasome subunit are
in active conformation throughout the time course of exposure to stress and are likely
used to degrade abnormally folded peptides and also proteins damaged by ROS. This gel

40
also reveals that the protein with approximate MW 30-35 kDa (most probably lipase) is
not active at 30 min after treatment with H2O2. The meaning of such behavior and the
possible role of lipase in the stress response is not very clear.
The results suggest that S. Solfataricus operates complex ROS-scavenging system
in response to oxidative stress. Individual players revealed in this study and hypothesized
chemical reactions that they catalyze are depicted in Figure 16. However, there are still
missing pieces in the mechanism of detoxification against oxidative challenge in S.
Solfataricus. Further analysis in combination with genomics and metabolomics is needed
to better understand detoxification mechanisms in Archaea.
30 µM exogenous H2O2
Disulfide bond
formation
2-CysR-SH
1-Cys Prx-SO xH
1-CysPrx-SH
+ H2O2
2H2O +
+ H2O2H2O + Peroxiredoxin
SOD
O2-
H2O2 + O2
Disulfide oxidoreductase
SSO0192
Rubrerythrin
2H+ + 2Fe2+ + H2O2
2Fe3+ + 2H2O
2Fe2+ + 2H2O2 + 2H2O
Oxidoreductase(putative)SSO2588
2Fe(O)OH(s)+4H +
SsDPSL
Figure 16. Schematic of the oxidative stress response in S. solfataricus. Black arrows indicate direction of protein regulation.

41
CHAPTER 3
PROTEOMIC RESPONSE OF SULFOLOBUS SOLFATARICUS P2 TO ARSENIC INDUCED STRESS
Introduction Metals that are essential to enzyme activity, such as zinc and iron, are toxic at
higher concentrations (Stohs and Bagchi 1995; Rosenzweig 2002). The toxicity of metal
ions varies greatly and specific differences may be related to differences in solubility,
transport, chemical reactivity, and the formation of biomolecular complexes within the
cell or organism.
Arsenic is a metalloid that threatens most biological organisms. In the
environment, arsenic is primarily present in its inorganic forms and mostly under two
oxidation states: arsenite, As (III) and arsenate, As (V) (Connon, Koski et al. 2008).
Arsenate, a phosphate analogue, can enter cells via the phosphate transport system and is
toxic because it inhibits a large number of reactions, and in particular the production of
ATP, by replacing phosphate (Dopson, Baker-Austin et al. 2003). Arsenate uptake would
occur when phosphate levels become depleted due to cellular phosphate consumption or
when arsenate is at high concentration. Noteworthy, inorganic phosphate concentration in
geothermal environment is low (Langner, Jackson et al. 2001). The toxicity of arsenite is
attributed to its strong affinity for sulfhydryl groups in proteins and is considerably more
toxic than arsenate (Saha, Dikshit et al. 1999). Although arsenic is not a redox metal, it
may cycle between oxidative states, producing radicals (Lynn, Shiung et al. 1998; Flora
42
1999). As a consequence, it leads to depletion of intracellular levels of antioxidants.
Recently it has been demonstrated that expression of catalase, superoxide dismutase and
glutathione-S-transferase in Zea mays were regulated upon treatment with arsenate or
arsenite (Mylona, Polidoros et al. 1998).
Arsenate tolerance in a number of plant species occurs through suppression of the
phosphate/arsenate uptake system (Meharg and Macnair 1992). The suppression reduces
arsenate influx to a level where the plant can detoxify it. The metabolism of arsenic in
many mammalian species includes the reduction of arsenate to arsenite, with subsequent
methylation yielding mono-, di- and trimethylated derivatives (Aposhian 1997).
Methylation is catalyzed by a specific methyltransferase, which uses S-
adenosylmethionine as the methyl group donor and is considered to be major
detoxification pathway in mammals (Zakharyan, Wu et al. 1995; Styblo, Del Razo et al.
2000). In bacteria, the ars operon constitutes the most ubiquitous and important scheme
of arsenic tolerance (Paez-Espino, Tamames et al. 2009). The Ars system mediates the
extrusion of arsenite out of the cells. There are also other microbial activities that alter the
chemical characteristics of arsenic: some strains are able to oxidize arsenite or reduce
arsenate as part of their respiratory processes. The biochemical mechanisms responsible
for metal resistance in thermophilic Archaea remain largely uncharacterized.
Sulfolobus species can live in arsenic-rich geothermal hot springs, which have
some of the highest arsenic concentrations known (Langner, Jackson et al. 2001; Hetzer,
Morgan et al. 2007; Hetzer, Morgan et al. 2007). However, comparatively little attention
has been devoted to these species in order to investigate the mechanism of arsenic

43
tolerance. In the only published study, arsenite oxidation by Sulfolobus acidocaldarius
was 8-fold higher for cells grown in the presence of arsenite when compared with cells
grown without (Sehlin and Lindstrom 1992). In this study, the toxicities of trivalent and
pentavalent arsenic species at the proteome level were examined in S. solfataricus. Our
investigation included 2DE, changes in cysteine reactivity and phosphorylation patterns
under arsenic stress.
Materials and Methods
All materials and methods applied to hydrogen peroxide induced oxidative stress
study were followed as previously described, with following exceptions:
For protein expression analyses, S. solfataricus cells were grown to late log phase
(OD650 0.52) in DSMZ media and then divided evenly between four, 1-liter long neck
culturing flasks. At 56 hrs after the start of culturing (OD650 ~0.2) four separate cultures
(~450 ml) were treated with 0, 60, 120 or 240 uM arsenite (NaAsO2). At 8, 16, 24, 32,
and 64 hours after addition, 50 ml aliquots were taken for protein isolation.
2DE procedure was performed on 13% SDS-PAGE gels as described earlier. All
experiments were performed in triplicate, unless noted otherwise. The 2DE gels were
stained with Krypton (Pierce). Detection of fluorescent proteins by laser scanning was
performed on the Typhoon Trio Imager using green laser (532 nm) with 580 nm filter at
500 V. The whole protein pattern was subsequently visualized by staining with
Coomassie® Brilliant Blue following the manufacturer’s instructions and scanned in 48
bit color mode at 600 dpi resolution without color correction. Krypton-stained gels were

44
selected for the image and data analyses. Spots were detected and quantified with the
Progenesis SameSpots software, on the basis of their relative volume.
Protein spots of interest were excised from the gels, washed, in-gel reduced and
S-alkylated, followed by digestion with porcine trypsin overnight at 37oC (Maaty,
Ortmann et al. 2006). Peptides eluted from the in-gel digests were analyzed on an
integrated Agilent 1100 liquid chromatograph (XCT-plus) mass-selective detector. The
peptides were reverse eluted and loaded onto an analytical C18 capillary column (15-cm
by 75-µm inside diameter, packed with 3.5-µm Zorbax 300, SB C18 particles; Agilent)
connected in-line to the mass spectrometer with a flow of 300 nl/min. Data-dependent
acquisition of collision induced dissociation tandem mass spectrometry was utilized.
Parent ion scans were run over the m/z range of 200 to 2 200 at 24 300 m/z-s. MGF
compound list files were used to query an in-house database using with MS and MS/MS
ion mass tolerances of 1.2 and 0.5 amu respectively. Protein identification from peptide
MS and MS/MS data was based on MASCOT searches from in-house database. In all
experiments, positive identification required two significant peptides (0.05<P), unless
indicated otherwise.
In order to identify redox-sensitive proteins in S. solfataricus another set of
cultures was prepared. As (III) was administered to three separate cultures (OD650 ~0.25)
in a form of sodium arsenite (NaAsO2) to final concentrations of 0, 120 and 1000 uM.
Aliquots for protein isolation were taken from the cell cultures at 8, 16, 32 and 64 hours
after arsenite treatment and spun 10 min, 5 000 x g to pellet the cells. The cells, taken at
16 h time point, were resuspended in PB (pH 7.4). Fluorescent sulfhydryl-modifying

45
reagent BODIPY FL maleimide (Figure 5) was added to the cells prior lysis procedure.
The reagent was added to a final concentration of 100 uM. Cells were lysed by
sonication, followed by freeze-thaw procedure in liquid nitrogen. Proteins were extracted,
separated on 13% SDS-PAGE gels and analyzed as described earlier.
In the next experiment, As (V) was added to three separate cultures (OD650 ~0.25)
in a form of sodium arsenate (Na2HAsO4) to final concentrations of 0, 100 and 1000 uM.
Aliquots for protein isolation were taken from the cell culture at different time points of
As (V) exposure, which are 8, 16, 32 and 64 hours. The cells were pelleted by
centrifugation and kept in freezer until further use. Samples from 16h time point were run
on 2DE gels in triplicate, stained with ProQ Diamond phosphoprotein stain and
visualized as described previously.
Results
The toxicity of different concentrations of trivalent and pentavalent arsenic
species was examined in cultures of S. solfataricus P2 (Figure 17, 19 and 20). Cells,
exposed to trivalent arsenic at 60 and 240 uM concentrations had higher OD650 readings
than non-treated culture at 16 hours (Figure 17). At the next time point, 24 hours after
innoculation, cell growth was inhibited by 60 uM and 240 uM concentrations of As (III).
In another experiment, exposure to moderate (120uM) concentration of trivalent arsenic
inhibited cell growth at ~16 hours, while the non-treated control and 1000 uM As (III)-
treated culture displayed similar growth patterns (Figure 19).

46
Exposure to moderate (100 uM) and high (1000uM) concentrations of pentavalent
arsenicals caused a transient increase in growth by 8 hours in both cell cultures
comparing to control (Figure 20). On the other hand, standard deviation in OD650
measurements for this particular time point was larger than the others. 16 hour time point
showed decrease in turbidity in arsenic-stressed cultures, similar to that in Figure 17, but
with ~ 10 hour time-shift.
0.1
0.15
0.2
0.25
0.3
0.35
0 10 20 30 40 50 60 70
Time (h)
OD
650
nm
Figure 17. Growth of cells in the absence and presence of different concentrations of As (III). OD650 for cultures are presented without standard deviations. The blue diamonds represent the untreated control culture, while the purple circles and green squares represent the 60 and 240 uM As (III)-treated cultures respectively.
Changes in the proteome of S. solfataricus were monitored using 2DE on proteins
isolated from the cells during As (III) treatment. Approximately 800 protein spots were
reproducibly detected in each gel, stained with total protein stain (KryptonTM, Pierce).

47
Quantitative analysis of Krypton-stained gels revealed 24 protein spots with differences
in fluorescent intensity (>1.5-fold) (Figure 18). These spots were picked and 29 proteins
were identified using in-gel proteolysis followed by LC-MS/MS (Table 4). Among them
17 were up-regulated and 12 were down-regulated in response to As (III) treatment.
Control (16h) 60 uM As III (16h)
240 uM As III (16h)120 uM As III (16h)
3 11pI
3 11pI
MW
MW
Figure 18. Representative gels of S. solfataricus proteome 16 h post-As (III) treatment visualized with total protein stain (Krypton). Three different concentrations of arsenite were used (60 uM, 120 uM and 240 uM). Regulated spots were picked and the proteins were identified using in-gel proteolysis followed LC-MS/MS. Red spots indicate down-regulated proteins, green spots – up-regulated.

48
Table 4. Concentration-dependent changes to protein regulation in cultures of S. solfataricus exposed to different trivalent arsenic concentrations. Fold difference were determined for 60 uM, 120 uM and 240 uM As (III)-treated samples by Progenesis SameSpots software and differences in expression values were calculated. Gene ID Regulated protein 60 uM As III 120 uM As III 240 uM As IIISSO1907 NAD specific glutamate dehydrogenase A2 1.5< 1.453 1.489SSO2044 NAD specific glutamate dehydrogenase A4 1.5< 1.453 1.489SSO0078 Tyrosyl-tRNA synthetase (tyrS) 1.5< 1.453 1.489SSO0913 Enolase 1.532 1.5< 1.5<SSO2182 Isocitrate dehydrogenase, probable (idh) 1.5< 1.554 1.5<SSO3226 Conserved hypothetical protein 1.5< 1.571 1.5<SSO0067 SSU ribosomal protein S2AB (rps2AB) 1.5< 1.571 1.5<SSO0728 Elongation factor 2 (EF-2) 1.495 1.492 1.811SSO3107 Dihydroxy-acid dehydratase (ilvD) 1.578 1.726 1.528SSO2486 Threonyl-tRNA synthetase (thrS) 1.578 1.726 1.528SSO2639 Carbon monoxide dehydrogenase 1.5< 1.492 1.811SSO2863 Acetyl-CoA synthetase 1.5< 1.641 1.667SSO0282 Thermosome beta subunit 1.611 1.577 1.977SSO2098 Tricorn protease homolog 2.391 1.659 1.642SSO2497 Acyl-CoA dehydrogenase related protein 1.927 1.5< 1.5<SSO2450 TATA binding protein (TBP)-interacting protein 1.952 1.5< 1.5<SSO0026 Phosphoribosylglycinamide formyltransferase 2 4.066 1.672 1.5<SSO2241 BPS2 protein homolog (bps2) 1.5< -2.105 1.5<SSO0282 Thermosome beta subunit 1.5< -2.135 -1.982SSO1663 N-methylhydantoinase A (huyA-1) 1.5< -2.014 -1.964SSO1907 NAD specific glutamate dehydrogenase A2 -1.911 1.5< 1.5<SSO0530 Serine hydroxymethyltransferase 1.5< -2.059 -1.626SSO0862 TF55-alpha protein -1.45 -1.855 -1.802SSO0755 S-adenosyl-L-homocysteine hydrolase -1.697 -1.485 -1.698SSO2356 Succinate dehydrogenase subunit A -1.697 -1.485 -1.698SSO0939 Pre mRNA splicing protein 1.5< -1.662 -1.523SSO2632 Hypothetical protein SSO2632 -1.515 -1.574 1.5<SSO2815 2-oxoacid--ferredoxin oxidoreductase 1.5< -1.535 1.5<SSO1811 Prolidase (Xaa-Pro dipeptidase) 1.5< -1.508 1.5<

49
0.2
0.25
0.3
0.35
0.4
0.45
0.5
0 10 20 30 40 50 60
Time (h)
OD
650
nm
Figure 19. Growth of cells in the absence and presence of different concentrations of As (III). The average OD650 for cultures are presented with standard deviations. The blue diamonds represent the untreated control culture, while the purple circles and green squares represent the 120 and 1000 uM As (III)-treated cultures respectively.
High affinity of arsenite for sulfhydryl groups in proteins and is well known.
Thus, free thiol reactivity on the level of proteome was studied on S. solfataricus cells,
As (III)-treated for 16 hours (Figure 21). BODIPY FL maleimide was used in 2DE
experiment as a thiol-specific chemical probe. Approximately 500 protein spots were
reproducibly detected in each gel. Quantitative analysis revealed a total of 45 protein
spots showed more than 1.5 fold differences in expression (Figure 21). Gels selected for
further analysis were stained with CBB. Only 9 proteins were identified (Table 6), mostly
due to low sensitivity of the total stain, which results in difficulties with aligning and
manual picking of corresponding spots from CBB-stained gel. Positive identification
required two significant peptides. The biggest fold differences in thiol reactivity were
found on peroxiredoxin (SSO2112) and lipase (SSO2493).

50
Exposure to different concentrations of arsenate resulted in 9 proteins being
identified as differentially expressed (Table 5). Among them, 2 proteins were up-
regulated and 7 were down-regulated in response to As (V) treatment. Pro-Q Diamond
was used on the same set of gels to map and identify changes in phosphoproteome of S.
solfataricus in response to a phosphate antagonist – arsenate (Figure 22). Most of the
proteins identified from phospho-stained spots were found to be down-regulated in 1000
uM As (V)-treated cell culture (Table 5 and 7), while changes in the pattern of
phosphorylation between As (V)-treated and non-treated protein samples were not
significant.
0.23
0.25
0.27
0.29
0.31
0.33
0.35
0.37
0.39
0.41
0.43
0 5 10 15 20 25 30 35 40 45
Time (h)
OD
650
nm
Figure 20. Growth of cells in the absence and presence of different concentrations of As (V). The average OD650 for 3 cultures are presented with standard deviations. The blue diamonds represent the untreated control culture, while the purple circles and green squares represent the 100 and 1000 uM As (V)-treated cultures respectively.

51
Table 5. Concentration-dependent changes in protein regulation in cultures of S. solfataricus exposed to pentavalent arsenic. Fold difference were determined for 100 uM and 1 mM As (V)-treated samples versus non-treated control by Progenesis SameSpots software and changes in expression were calculated (two right columns)
Gene ID name Mass PI MS score 100uM AsV 1 mM AsVSSO0862 Thermosome alpha subunit 59695 5.35 428 1.5< -2.601SSO0282 Thermosome beta subunit 60387 5.56 340 1.5< -2.601SSO2356 Succinate dehydrogenase 62550 6.18 229 1.5< 1.864SSO2241 BPS2 protein homolog 68510 5.56 157 1.5< 1.522SSO0079 Bacterial-like DNA primase 45382 5.18 148 1.5< -1.782SSO1119 Hypothetical protein 46431 4.89 127 1.5< -1.782SSO0939 Pre mRNA splicing protein 46664 9.5 201 -2.307 -3.277SSO0939 Pre mRNA splicing protein 46664 9.5 480 -2.168 -2.708SSO0939 Pre mRNA splicing protein 46664 9.5 253 -1.988 -1.914SSO0758 Peptidyl-prolyl isomerase 26700 6.66 99 -1.904 -2.241SSO2493 Lipase (lipP-1) 33584 5.51 110 1.5< -1.98
Table 6. Proteins with regulation in cysteine reactivity upon exposure to As (III). 2D gels of 120 uM and 1 mM As (III)-treated protein samples were compared with non-treated control by Progenesis SameSpots software and fold differences were calculated (two right columns)
2D spot # Gene ID Regulated protein # of Cysscore Mass PI 120uM AsIII 1mM AsIII1 SSO0530 Serine hydroxymethyltransferase 1 168 48535 6.22 1.587 1.6461 SSO0755 S-adenosyl-L-homocysteine hydrolase 1 163 45936 6.3 1.587 1.6462 SSO1907 glutamate dehydrogenase 1 90 46059 6.51 1.587 1.6463 SSO1817 Thiosulfate sulfurtransferase 1 92 33691 6.41 1.977 1.8654 SSO0738 Proteasome subunit alpha 1 179 26629 5.69 1.535 1.692
B SSO2121 Peroxiredoxin (bcp-2) 1 144 24786 6.85 4.146 2.2475 SSO2061 Acetyl-CoA C-acetyltransferase 1 228 41628 5.4 1.701 1.6896 SSO3194 Glyceraldehyde-3-phosphate dehydrogenase 1 175 56948 6.06 1.978 1.617
C SSO2493 Lipase (lipP-1) 3 160 33583 5.51 3.645 1.757
Table 7. Proteins identified from phospho-stained spots
2D spot# Gene ID Protein name Mass PI MS score1 SSO0862 Thermosome alpha subunit 59695 5.35 4281 SSO0282 Thermosome beta subunit 60387 5.56 340
2, 3 SSO2356 Succinate dehydrogenase subunit A (sdhA) 62550 6.18 229, 101 7, 8 SSO0079 Bacterial-like DNA primase (dnaG) 45382 5.18 153, 410
10 SSO1119 Hypothetical protein SSO1119 46431 4.89 127 14, 15 SSO0939 Pre mRNA splicing protein 46664 9.5 201, 480
17 SSO0758 Peptidyl-prolyl cis-trans isomerase, FKBP-type rotamase 26700 6.66 9921 SSO0342 LSU ribosomal protein L12AB (rpl12AB) 11284 4.84 150
22, 23 SSO0216 Translation elongation factor EF-1alpha 48573 8.93 198, 22328 SSO2493 Lipase (lipP-1) 33584 5.51 110

52
CB
A
1
4
CB
25
3
6
Control
1000 uMA
s III
100 uMA
s III
Control
1000 uMA
s III
100 uMA
s III
Figure 21. Redox-sensitive profile of S. solfataricus upon treatment with As (III). 2D gel represents 1000 uM As (III)-treated sample (A). Numbers on the gel correspond to “2D spot number” column in Table 6. Green circles indicate up-regulated and red circles down-regulated proteins. Comparison of protein thiol reactivity is shown on the example of peroxiredoxin (SSO2112; B) and lipase (SSO2493; C).

53
2 31
7 8
10
14 15
17
21
28
2322
Figure 22. 2D gel of the S. solfataricus phosphoproteome 16 h after 1mM As (V) treatment. Gel was stained with phosphoprotein specific stain ProQ Diamond. Each of the numbered spots was picked and the proteins were identified using in-gel proteolysis followed LC-MS/MS. Squares show gel artifacts.
Discussion
The aim of this study was to investigate molecular responses in S. solfataricus
during arsenic stress in order to understand arsenic metabolism and mechanisms of
arsenic detoxification. To this end, proteins that changed in abundance in response to
arsenite and arsenate exposure were determined. The list of proteins includes

54
dehydrogenases (NAD specific glutamate dehydrogenase, succinate dehydrogenase,
isocitrate dehydrogenase, etc.), ROS scavenging systems (peroxiredoxin), protein
turnover (HSPs, proteases, ribosomal proteins, translation factors, etc.) and others (see
tables 4 and 5). A number of the up-regulated proteins like thermosome, peroxiredoxin
and elongation factor-1 alpha found in this study are consistent with a general oxidative
stress response. A similar set of proteins was found in H2O2 induced oxidative stress
experiment.
Among the proteins related to arsenic stress management are α and β sub-units of
the thermosome, the only representative of HSP60 class of molecular chaperones in S.
solfataricus. This protein play intrinsic role in protein refolding. Thus, repair of arsenic
induced damage and resistance may be enhanced by up-regulation of the chaperonin
activity. Eukaryotic cells have a similar response in which the expression of various
HSPs is induced by arsenite, the most potent inducer of these chaperonins in cells and
organs (Del Razo, Quintanilla-Vega et al. 2001). Another protein involved in repair of
arsenic damage is peroxiredoxin (SSO2121), which was discussed earlier. Briefly, it
scavenges for H2O2 in E. coli (Seaver and Imlay 2001) and, most importantly, in S.
solfataricus (Limauro, Pedone et al. 2008). In addition, peroxiredoxin interacts with
translation elongation factor in mice to protect cells against apoptotic death induced by
oxidative stress (Chang and Wang 2007). An increase in population of H2O2 may happen
because of the arsenite oxidation to its pentavalent form (Masullo, Raimo et al. 1996). In
fact, recent studies indicate that the expression of peroxiredoxin is induced by the
presence of As (III) in humans (Lynne et al. 2000). Moreover, in the present work

55
peroxiredoxin (SSO2121) showed the biggest fold change in cysteine reactivity in
response to As (III).
Another regulated protein is S-adenosyl-L-homocysteine hydrolase. It was found
to be down-regulated upon As (III) treatment. S-adenosyl-L-homocysteine hydrolase
catalyzes the hydrolysis of S-adenosyl-L-homocysteine to form adenosine and
homocysteine. Since S-adenosyl-L-homocysteine is a potent inhibitor of S-adenosyl-L-
methionine dependent methyltransferases, S-adenosyl-L-homocysteine hydrolase plays a
critical role in the modulation of the activity of specific methyltransferases (Figure 23). It
is known that the methylation of As (III) in mammalian species is catalyzed by specific
S-adenosyl-L-methionine methyltransferases, where S-adenosyl-L-methionine is used as
a methyl group donor (Zakharyan, Wu et al. 1995). As discussed above, methylation is
considered as a major detoxification pathway in mammals; however, S. Solfataricus may
employ different mechanisms. In support of this theory, down-regulation of S-adenosyl-
L-homocysteine hydrolase results in less methylation of As (III) species. Interestingly, S-
Adenosylmethionine synthetase (SSO0199), which catalyzes formation of the primary
biological alkylating agent, was not found to be regulated in response to either arsenate or
arsenite. This observation indirectly supports the hypothesis that methylation is not the
only source of detoxification in S. Solfataricus. In human cells, trivalent monomethylated
species were found to be the most toxic and dimethylated ones at least as toxic as arsenite
(Styblo, Del Razo et al. 2000). However, pentavalent mono- and dimethylated arsenicals
are less acutely toxic in human cells than arsenite. In current study, further research is

56
needed to figure out what organic forms of arsenic are less or more toxic for S.
solfataricus.
S-adenosyl-L-homocysteine hydrolase
S-adenosyl-L-homocysteine Adenosine Homocysteine+
S-adenosyl-L-methioninedependent
methyltransferases
Inhibition
iAsIII Methylarsonic acid (MAsv)
Methylarsenous acid (MAsIII )
Further methylation
Detoxification
Figure 23. General scheme of arsenite methylation.
NAD specific glutamate dehydrogenase (SSO2044) which is a member of the
oxidoreducatase superfamily was also regulated. It participates in the glutamate
metabolism pathway. Glutamate metabolism is integrated with other pathways such as
glutathione metabolism, a major contributor to antioxidant protection in many cell types.
However, there are no evidences of existence of glutathione synthase in S. solfataricus.
Glyceraldehyde-3-phosphate dehydrogenase (GAPDH) is a glycolytic enzyme which
obviously has a role outside of glycolysis, particularly acting as an arsenate reductase in
mammalian systems (Gregus and Nemeti 2005). In the current study, GAPDH expression
was increased by the treatment of As (III) suggesting that it is somehow involved in the
As detoxification mechanism in Sulfolobus.

57
Lipase (SSO2493) showed significant changes in cysteine reactivity in response
to As (III) exposure. As it was mentioned, the reactivity of individual protein thiols to
oxidation can be part of signal transduction pathways (Leichert and Jakob 2004). What
type of signal pathway lipase is involved in is not clear yet. Interestingly, expression of
other proteases, such as tricorn protease homolog (SSO2098), proteasome (SSO0738),
enolase (SSO0913), was induced in response to arsenic stress. Some of them are
employed by the cell to break down abnormally folded proteins, damaged by deleterious
effects of environmental stress. Thus, the regulation of these proteases in S. solfataricus
during the stress is very important.
The effect of As (V) treatment on protein phosphorylation is also intriguing. The
map of phosphorylated proteins does not significantly overlap with the one, obtained in
H2O2 study. It suggests that phosphorylation/dephosphorylation events are governed
differently when the cells are exposed to phosphate-mimicking As (V). Elongation factor-
1 alpha (SSO0216) and ribosomal protein L12 (SSO0342) were among the phospho-
stained proteins present on both lists. The detailed characterization of specific protein
phosphorylation has only been described for a few Sulfolobus proteins (Kim and Lee
2005; Ray, Keith et al. 2005). Thus, additional studies are required to understand the
importance of protein phosphorylation in Sulfolobus during As (V) stress. Most likely, a
mixed regulatory mechanism combining phosphorylation and the oxidation/reduction of
sulfhydryl groups exists.
In the present study, comparative proteomic analyses led to identification of 40
differentially expressed proteins that include predicted and novel ones, which are

58
functionally involved in stress and detoxification, cell signaling, defense and
development and protein biosynthesis mechanisms. Results of the findings suggest that
As stress in Sulfolobus operates two different mechanisms: 1) generation of ROS, which
could ultimately affect several pathways; 2) inhibition of methyltransferase activity,
which most likely affects detoxification efficiency. Based on the proteomic
investigations, As-stress responsive mechanism partially overlaps with hydrogen
peroxide-induced stress response. Among the proteins identified in this study lipase,
thiosulfate sulfurtransferase, DNA-primase and others (Figure 24) were regulated by both
As (III) and As (V), but not by H2O2 treatment, suggesting that they might play very
important roles in As-induced stress response.
59
CHAPTER 4
CONCLUSIONS
This study is the first to provide system-based evidence that complex response
networks are activated in S. solfataricus in response to environmental stress. Components
of these networks that participate in anti-oxidant and detoxifying activities were
identified. In addition, changes to the phosphoproteome, and proteome redox state upon
exposure to environmental stress were documented. Synthesis of the results has allowed a
general scheme for how S. solfataricus fights H2O2-and As-induced stress was proposed.
The stress regulated proteins are from a range of functional classes, including
oxidoreductases, hydrolases, dehydrogenases, proteins involved in primary metabolic
processes and many others. Among the proteins, which are known to be involved in
general stress response, are peroxiredoxin, superoxide dismutase, HSPs, elongation factor
1 and oxidoreductase. Interestingly, some of them were exclusively regulated by one
stressor (H2O2) but not others (As III, As V). For example, DPSL protein was up-
regulated only upon H2O2 stress and was not induced by metal (As). In order to visualize
proteins that are universally regulated in response to different stressful conditions,
network analysis was made, using the data from proteomics experiments described here
(Figure 23). 8 out of 51 proteins were found to be regulated in response to both arsenate
(As V) and arsenite (As III) stress (Figure 24), while six of them are likely to be universal
stress proteins, because their expression was induced in response to both hydrogen

60
peroxide and arsenic (Figure 25). This suggests the existence of the common
detoxification mechanisms against different toxic substances.
Figure 23. Network of S. solfataricus proteins, found to be regulated in response to hydrogen peroxide (H2O2), arsenate (As V) and arsenite (As III) stress.

61
Figure 24. S. solfataricus proteins found to be regulated in response to both arsenate (As V) and arsenite (As III) stress. Close-up image from Figure 23.
Figure 25. S. solfataricus proteins that are most likely involved in universal stress response. Close-up image from Figure 23.
The two-dimensional gel electrophoresis approach in conjunction with novel
chemical tagging probes has been applied to investigate changes on the level of
regulation and chemical modification of individual proteins within the scope of the whole
proteome, in response to multiple types of environmental stress. Detection of changes in
thiol reactivity, phosphorylation and enzymatic activity of proteins, separated by gel

62
electrophoresis, has been successfully accomplished. This “cutting-edge” methods used
here can be easily adapted to any organism to elucidate a response to external stimuli,
which makes this an extremely powerful technique.
The studies reported here have elucidated specific proteins and interacting
pathways activated in response to stress in an archaeal organism. Future studies should
continue characterizing stress responses in S. solfataricus. Potential stressors to be
investigated are metalloids such as antimony and selenium, which are priority pollutants.
The role of membrane proteins is clearly important in cellular response to environmental
agents and because they are hydrophobic, the methods may not have adequately
addressed this issue. Straight-forward modifications to the methods used here can be
made to better investigate this important class of proteins. Studies aimed at covering the
entire proteome using a wider range of stress agents will undoubtedly lead to a better
understanding of the precise mechanisms and networks active in S. solfataricus and
extremophiles in general.

63
BIBLIOGRAPHY Adams, M. W. W., F. E. Jenney, et al. (2002). "Superoxide reductase: fact or fiction?"
Journal of Biological Inorganic Chemistry 7(6): 647-652. Aposhian, H. V. (1997). "Enzymatic methylation of arsenic species and other new
approaches to arsenic toxicity." Annual Review of Pharmacology and Toxicology 37: 397-419.
Auernik, K. S., C. R. Cooper, et al. (2008). "Life in hot acid: Pathway analyses in
extremely thermoacidophilic archaea." Current Opinion in Biotechnology 19(5): 445-453.
Bell, S. D., and S. P. Jackson. (1998). "Transcription and translation in Archaea: a mosaic
of eukaryal and bacterial features." Trends Microbiol 6: 222-8. Bell, S. D., C. Jaxel, M. Nadal, P. F. Kosa, and S. P. Jackson. (1998). "Temperature,
template topology, and factor requirements of archaeal transcription." Proc Natl Acad Sci U S A 95: 15218-22.
Camerini, S., M. L. Polci, et al. (2005). "Proteomics approaches to study the redox state
of cysteine-containing proteins." Ann Ist Super Sanita 41(4): 451-7. Carlioz, A. and D. Touati (1986). "Isolation of Superoxide-Dismutase Mutants in
Escherichia-Coli - Is Superoxide-Dismutase Necessary for Aerobic Life." Embo Journal 5(3): 623-630.
Chaban, B., S. Y. Ng, and K. F. Jarrell. (2006). "Archaeal habitats--from the extreme to
the ordinary." Can J Microbiol 52: 73-116. Chan, E. W., S. Chattopadhaya, et al. (2004). "Developing photoactive affinity probes for
proteomic profiling: hydroxamate-based probes for metalloproteases." J Am Chem Soc 126(44): 14435-46.
Chang, R. Y. and E. Wang (2007). "Mouse translation elongation factor eEF1A-2
interacts with Prdx-I to protect cells against apoptotic death induced by oxidative stress." Journal of Cellular Biochemistry 100(2): 267-278.
Chen, E., G. Proestou, et al. (2000). "Rapid up-regulation of peptide elongation factor
EF-1 alpha protein levels is an immediate early event during oxidative stress-induced apoptosis." Experimental Cell Research 259(1): 140-148.

64
Ciaramella, M., F. M. Pisani, and M. Rossi. (2002). "Molecular biology of extremophiles: recent progress on the hyperthermophilic archaeon Sulfolobus." Antonie Van Leeuwenhoek 81: 85-97.
Ciccarelli, F. D., T. Doerks, et al. (2006). "Toward automatic reconstruction of a highly
resolved tree of life." Science 311(5765): 1283-1287. Connon, S. A., A. K. Koski, et al. (2008). "Ecophysiology and geochemistry of microbial
arsenic oxidation within a high arsenic, circumneutral hot spring system of the Alvord Desert." Fems Microbiology Ecology 64(1): 117-128.
Del Razo, L. M., B. Quintanilla-Vega, et al. (2001). "Stress proteins induced by arsenic."
Toxicology and Applied Pharmacology 177(2): 132-148. DeVendittis, E. and V. Bocchini (1996). "Protein-encoding genes in the
sulfothermophilic archaea Sulfolobus and Pyrococcus." Gene 176(1-2): 27-33. Dopson, M., C. Baker-Austin, et al. (2003). "Growth in sulfidic mineral environments:
metal resistance mechanisms in acidophilic micro-organisms." Microbiology-Sgm 149: 1959-1970.
Dowling, P., L. O'Driscoll, et al. (2006). "Proteomic screening of glucose-responsive and
glucose non-responsive MIN-6 beta cells reveals differential expression of proteins involved in protein folding, secretion and oxidative stress." Proteomics 6(24): 6578-87.
Edgcomb, V. P., S. J. Molyneaux, et al. (2004). "Sulfide ameliorates metal toxicity for
deep-sea hydrothermal vent archaea." Applied and Environmental Microbiology 70(4): 2551-2555.
Farr, S. B. and T. Kogoma (1991). "Oxidative Stress Responses in Escherichia-Coli and
Salmonella-Typhimurium." Microbiological Reviews 55(4): 561-585. Finkel, T. (1998). "Oxygen radicals and signaling." Current Opinion in Cell Biology
10(2): 248-253. Flora, S. J. S. (1999). "Arsenic-induced oxidative stress and its reversibility following
combined administration of N-acetylcysteine and meso 2,3-dimercaptosuccinic acid in rats." Clinical and Experimental Pharmacology and Physiology 26(11): 865-869.
Fonovic, M., S. H. Verhelst, et al. (2007). "Proteomics evaluation of chemically
cleavable activity-based probes." Mol Cell Proteomics 6(10): 1761-70.
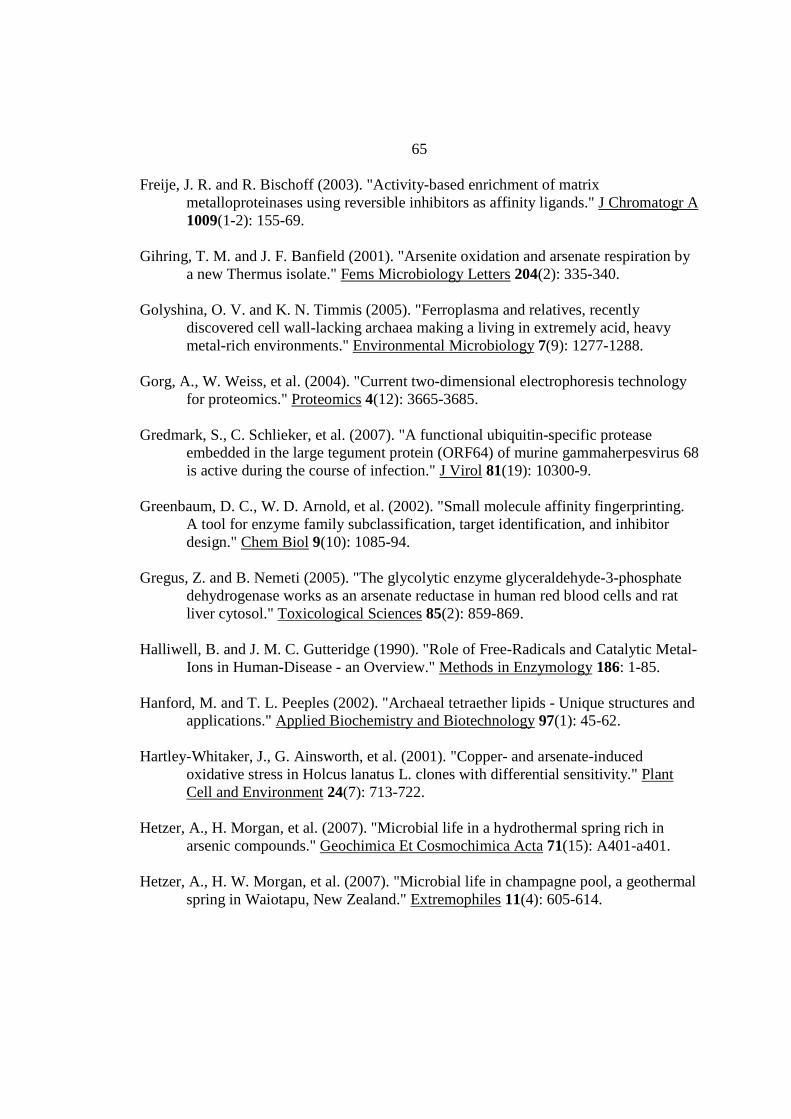
65
Freije, J. R. and R. Bischoff (2003). "Activity-based enrichment of matrix metalloproteinases using reversible inhibitors as affinity ligands." J Chromatogr A 1009(1-2): 155-69.
Gihring, T. M. and J. F. Banfield (2001). "Arsenite oxidation and arsenate respiration by
a new Thermus isolate." Fems Microbiology Letters 204(2): 335-340. Golyshina, O. V. and K. N. Timmis (2005). "Ferroplasma and relatives, recently
discovered cell wall-lacking archaea making a living in extremely acid, heavy metal-rich environments." Environmental Microbiology 7(9): 1277-1288.
Gorg, A., W. Weiss, et al. (2004). "Current two-dimensional electrophoresis technology
for proteomics." Proteomics 4(12): 3665-3685. Gredmark, S., C. Schlieker, et al. (2007). "A functional ubiquitin-specific protease
embedded in the large tegument protein (ORF64) of murine gammaherpesvirus 68 is active during the course of infection." J Virol 81(19): 10300-9.
Greenbaum, D. C., W. D. Arnold, et al. (2002). "Small molecule affinity fingerprinting.
A tool for enzyme family subclassification, target identification, and inhibitor design." Chem Biol 9(10): 1085-94.
Gregus, Z. and B. Nemeti (2005). "The glycolytic enzyme glyceraldehyde-3-phosphate
dehydrogenase works as an arsenate reductase in human red blood cells and rat liver cytosol." Toxicological Sciences 85(2): 859-869.
Halliwell, B. and J. M. C. Gutteridge (1990). "Role of Free-Radicals and Catalytic Metal-
Ions in Human-Disease - an Overview." Methods in Enzymology 186: 1-85. Hanford, M. and T. L. Peeples (2002). "Archaeal tetraether lipids - Unique structures and
applications." Applied Biochemistry and Biotechnology 97(1): 45-62. Hartley-Whitaker, J., G. Ainsworth, et al. (2001). "Copper- and arsenate-induced
oxidative stress in Holcus lanatus L. clones with differential sensitivity." Plant Cell and Environment 24(7): 713-722.
Hetzer, A., H. Morgan, et al. (2007). "Microbial life in a hydrothermal spring rich in
arsenic compounds." Geochimica Et Cosmochimica Acta 71(15): A401-a401. Hetzer, A., H. W. Morgan, et al. (2007). "Microbial life in champagne pool, a geothermal
spring in Waiotapu, New Zealand." Extremophiles 11(4): 605-614.
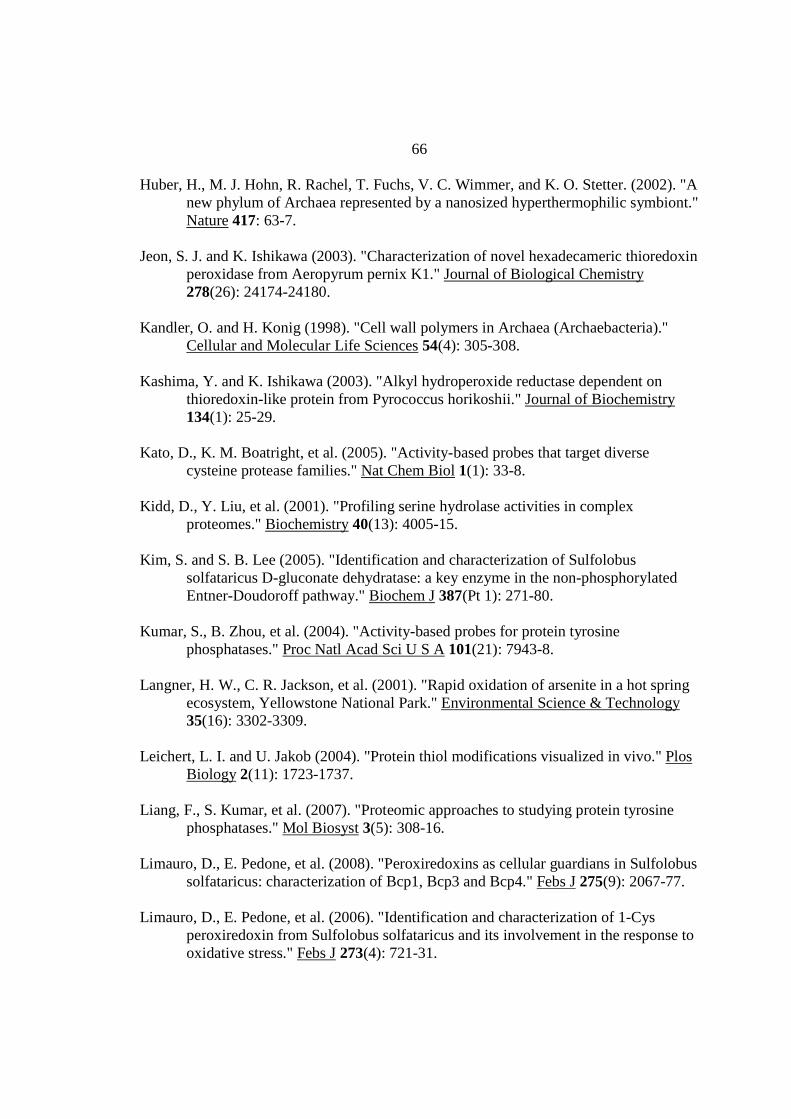
66
Huber, H., M. J. Hohn, R. Rachel, T. Fuchs, V. C. Wimmer, and K. O. Stetter. (2002). "A new phylum of Archaea represented by a nanosized hyperthermophilic symbiont." Nature 417: 63-7.
Jeon, S. J. and K. Ishikawa (2003). "Characterization of novel hexadecameric thioredoxin
peroxidase from Aeropyrum pernix K1." Journal of Biological Chemistry 278(26): 24174-24180.
Kandler, O. and H. Konig (1998). "Cell wall polymers in Archaea (Archaebacteria)."
Cellular and Molecular Life Sciences 54(4): 305-308. Kashima, Y. and K. Ishikawa (2003). "Alkyl hydroperoxide reductase dependent on
thioredoxin-like protein from Pyrococcus horikoshii." Journal of Biochemistry 134(1): 25-29.
Kato, D., K. M. Boatright, et al. (2005). "Activity-based probes that target diverse
cysteine protease families." Nat Chem Biol 1(1): 33-8. Kidd, D., Y. Liu, et al. (2001). "Profiling serine hydrolase activities in complex
proteomes." Biochemistry 40(13): 4005-15. Kim, S. and S. B. Lee (2005). "Identification and characterization of Sulfolobus
solfataricus D-gluconate dehydratase: a key enzyme in the non-phosphorylated Entner-Doudoroff pathway." Biochem J 387(Pt 1): 271-80.
Kumar, S., B. Zhou, et al. (2004). "Activity-based probes for protein tyrosine
phosphatases." Proc Natl Acad Sci U S A 101(21): 7943-8. Langner, H. W., C. R. Jackson, et al. (2001). "Rapid oxidation of arsenite in a hot spring
ecosystem, Yellowstone National Park." Environmental Science & Technology 35(16): 3302-3309.
Leichert, L. I. and U. Jakob (2004). "Protein thiol modifications visualized in vivo." Plos
Biology 2(11): 1723-1737. Liang, F., S. Kumar, et al. (2007). "Proteomic approaches to studying protein tyrosine
phosphatases." Mol Biosyst 3(5): 308-16. Limauro, D., E. Pedone, et al. (2008). "Peroxiredoxins as cellular guardians in Sulfolobus
solfataricus: characterization of Bcp1, Bcp3 and Bcp4." Febs J 275(9): 2067-77. Limauro, D., E. Pedone, et al. (2006). "Identification and characterization of 1-Cys
peroxiredoxin from Sulfolobus solfataricus and its involvement in the response to oxidative stress." Febs J 273(4): 721-31.

67
Liu, Y., M. P. Patricelli, et al. (1999). "Activity-based protein profiling: the serine
hydrolases." Proc Natl Acad Sci U S A 96(26): 14694-9. Lynn, S., J. N. Shiung, et al. (1998). "Arsenite stimulates poly(ADP-ribosylation) by
generation of nitric oxide." Free Radical Biology and Medicine 24(3): 442-449. Maaty, W. S. A., A. C. Ortmann, et al. (2006). "Characterization of the archaeal
thermophile Sulfolobus turreted icosahedral virus validates an evolutionary link among double-stranded DNA viruses from all domains of life." Journal of Virology 80(15): 7625-7635.
Macur, R. E., C. R. Jackson, et al. (2004). "Bacterial populations associated with the
oxidation and reduction of arsenic in an unsaturated soil." Environmental Science & Technology 38(1): 104-111.
Masullo, M., G. Raimo, et al. (1996). "Purification and characterization of NADH
oxidase from the archaea Sulfolobus acidocaldarius and Sulfolobus solfataricus." Biotechnology and Applied Biochemistry 23: 47-54.
Mccord, J. M. and Fridovic.I (1969). "Superoxide Dismutase-an Enzymic Function for
Erythrocuprein." Federation Proceedings 28(2): 346-&. Meharg, A. A. and M. R. Macnair (1992). "Suppression of the High-Affinity Phosphate-
Uptake System - a Mechanism of Arsenate Tolerance in Holcus-Lanatus L." Journal of Experimental Botany 43(249): 519-524.
Missall, T. A., J. K. Lodge, et al. (2004). "Mechanisms of resistance to oxidative and
nitrosative stress: implications for fungal survival in mammalian hosts." Eukaryot Cell 3(4): 835-46.
Mylona, P. V., A. N. Polidoros, et al. (1998). "Modulation of antioxidant responses by
arsenic in maize." Free Radical Biology and Medicine 25(4-5): 576-585. Niimura, Y., Y. Nishiyama, et al. (2000). "A hydrogen peroxide-forming NADH oxidase
that functions as an alkyl hydroperoxide reductase in Amphibacillus xylanus." Journal of Bacteriology 182(18): 5046-5051.
Nishiyama, Y., V. Massey, et al. (2001). "Hydrogen peroxide-forming NADH oxidase
belonging to the peroxiredoxin oxidoreductase family: Existence and physiological role in bacteria." Journal of Bacteriology 183(8): 2431-2438.
Paez-Espino, D., J. Tamames, et al. (2009). "Microbial responses to environmental
arsenic." Biometals 22(1): 117-130.

68
Pappin, D. J. C., P. Hojrup, et al. (1993). "Rapid Identification of Proteins by Peptide-
Mass Fingerprinting." Current Biology 3(6): 327-332. Pedone, E., D. Limauro, et al. (2006). "Characterization of a multifunctional protein
disulfide oxidoreductase from Sulfolobus solfataricus." Febs Journal 273(23): 5407-5420.
Qureshi, S. A., S. D. Bell, and S. P. Jackson. (1997). "Factor requirements for
transcription in the Archaeon Sulfolobus shibatae." Embo J 16: 2927-36. Rabilloud, T., M. Heller, et al. (2002). "Proteomics analysis of cellular response to
oxidative stress - Evidence for in vivo overoxidation of peroxiredoxins at their active site." Journal of Biological Chemistry 277(22): 19396-19401.
Rawlings, N. D. and A. J. Barrett (1994). "Families of Serine Peptidases." Proteolytic
Enzymes: Serine and Cysteine Peptidases 244: 19-61. Ray, W. K., S. M. Keith, et al. (2005). "A phosphohexomutase from the archaeon
Sulfolobus solfataricus is covalently modified by phosphorylation on serine." J Bacteriol 187(12): 4270-5.
Remonsellez, F., A. Orell, et al. (2006). "Copper tolerance of the thermoacidophilic
archaeon Sulfolobus metallicus: possible role of polyphosphate metabolism." Microbiology-Sgm 152: 59-66.
Rhee, S. G. (2003). "Intracellular messenger function of hydrogen peroxide." Free
Radical Biology and Medicine 35: S7-S7. Rosenzweig, A. C. (2002). "Metallochaperones: Bind and deliver." Chemistry & Biology
9(6): 673-677. Saghatelian, A., N. Jessani, et al. (2004). "Activity-based probes for the proteomic
profiling of metalloproteases." Proc Natl Acad Sci U S A 101(27): 10000-5. Saha, J. C., A. K. Dikshit, et al. (1999). "A review of arsenic poisoning and its effects on
human health." Critical Reviews in Environmental Science and Technology 29(3): 281-313.
Schmidinger, H., A. Hermetter, et al. (2006). "Activity-based proteomics: enzymatic
activity profiling in complex proteomes." Amino Acids 30(4): 333-50.

69
Schulenberg, B., R. Aggeler, et al. (2003). "Analysis of steady-state protein phosphorylation in mitochondria using a novel fluorescent phosphosensor dye." Journal of Biological Chemistry 278(29): 27251-27255.
Seaver, L. C. and J. A. Imlay (2001). "Hydrogen peroxide fluxes and
compartmentalization inside growing Escherichia coli." Journal of Bacteriology 183(24): 7182-7189.
Sehlin, H. M. and E. B. Lindstrom (1992). "Oxidation and Reduction of Arsenic by
Sulfolobus-Acidocaldarius Strain Bc." Fems Microbiology Letters 93(1): 87-92. She, Q., R. K. Singh, F. Confalonieri, Y. Zivanovic, G. Allard, M. J. Awayez, C. C.
Chan-Weiher, I. G. Clausen, B. A. Curtis, A. De Moors, G. Erauso, C. Fletcher, P. M. Gordon, I. Heikamp-de Jong, A. C. Jeffries, C. J. Kozera, N. Medina, X. Peng, H. P. Thi-Ngoc, P. Redder, M. E. Schenk, C. Theriault, N. Tolstrup, R. L. Charlebois, W. F. Doolittle, M. Duguet, T. Gaasterland, R. A. Garrett, M. A. Ragan, C. W. Sensen, and J. Van der Oost. (2001). "The complete genome of the crenarchaeon Sulfolobus solfataricus P2." Proc Natl Acad Sci U S A 98: 7835-40.
Sieber, S. A., T. S. Mondala, et al. (2004). "Microarray platform for profiling enzyme
activities in complex proteomes." J Am Chem Soc 126(48): 15640-1. Silver, S. (1996). "Bacterial resistances to toxic metal ions - A review." Gene 179(1): 9-
19. Snyder, J. C., K. Stedman, G. Rice, B. Wiedenheft, J. Spuhler, and M. J. Young. (2003).
"Viruses of hyperthermophilic Archaea." Res Microbiol 154: 474-82. Stamler, J. S. and A. Hausladen (1998). "Oxidative modifications in nitrosative stress."
Nat Struct Biol 5(4): 247-9. Stamler, J. S., S. Lamas, et al. (2001). "Nitrosylation. the prototypic redox-based
signaling mechanism." Cell 106(6): 675-83. Stohs, S. J. and D. Bagchi (1995). "Oxidative Mechanisms in the Toxicity of Metal-
Ions." Free Radical Biology and Medicine 18(2): 321-336. Storz, G. and J. A. Imlay (1999). "Oxidative stress." Current Opinion in Microbiology
2(2): 188-194. Styblo, M., L. M. Del Razo, et al. (2000). "Comparative toxicity of trivalent and
pentavalent inorganic and methylated arsenicals in rat and human cells." Archives of Toxicology 74(6): 289-299.

70
Sun, J., C. Steenbergen, et al. (2006). "S-nitrosylation: NO-related redox signaling to protect against oxidative stress." Antioxid Redox Signal 8(9-10): 1693-705.
Tomoyasu, T., A. Mogk, et al. (2001). "Genetic dissection of the roles of chaperones and
proteases in protein folding and degradation in the Escherichia coli cytosol." Molecular Microbiology 40(2): 397-413.
Tonge, R., J. Shaw, et al. (2001). "Validation and development of fluorescence two-
dimensional differential gel electrophoresis proteomics technology." Proteomics 1(3): 377-396.
Touati, D. (2000). "Iron and oxidative stress in bacteria." Archives of Biochemistry and
Biophysics 373(1): 1-6. Unlu, M., M. E. Morgan, et al. (1997). "Difference gel electrophoresis: A single gel
method for detecting changes in protein extracts." Electrophoresis 18(11): 2071-2077.
van der Oost, J., M. Ciaramella, M. Moracci, F. M. Pisani, M. Rossi, and W. M. de Vos.
(1998). "Molecular biology of hyperthermophilic Archaea." Adv Biochem Eng Biotechnol 61: 87-115.
van Swieten, P. F., R. Maehr, et al. (2004). "Development of an isotope-coded activity-
based probe for the quantitative profiling of cysteine proteases." Bioorg Med Chem Lett 14(12): 3131-4.
Watanabe, Y., S. Yokobori, et al. (2002). "Introns in protein-coding genes in Archaea."
Febs Letters 510(1-2): 27-30. Weinberg, M. V., F. E. Jenney, et al. (2004). "Rubrerythrin from the hyperthermophilic
archaeon Pyrococcus furiosus is a rubredoxin-dependent, iron-containing peroxidase." Journal of Bacteriology 186(23): 7888-7895.
Wiedenheft, B., J. Mosolf, et al. (2005). "An archaeal antioxidant: characterization of a
Dps-like protein from Sulfolobus solfataricus." Proc Natl Acad Sci U S A 102(30): 10551-6.
Woese, C. R. and G. E. Fox (1977). "Phylogenetic Structure of Prokaryotic Domain -
Primary Kingdoms." Proceedings of the National Academy of Sciences of the United States of America 74(11): 5088-5090.
Woese, C. R., O. Kandler, and M. L. Wheelis. (1990). "Towards a natural system of
organisms: proposal for the domains Archaea, Bacteria, and Eucarya." Proc Natl Acad Sci U S A 87: 4576-9.

71
Wong, H. and M. C. Schotz (2002). "The lipase gene family." Journal of Lipid Research
43(7): 993-999. Zakharyan, R., Y. Wu, et al. (1995). "Enzymatic Methylation of Arsenic Compounds -
Assay, Partial-Purification, and Properties of Arsenite Methyltransferase and Monomethylarsonic Acid Methyltransferase of Rabbit Liver." Chemical Research in Toxicology 8(8): 1029-1038.
Zhang, S., L. Chen, et al. (2007). "An affinity-based fluorescence polarization assay for
protein tyrosine phosphatases." Methods 42(3): 261-7. Zillig, W., H. P. Klenk, et al. (1989). "The Phylogenetic Relations of DNA-Dependent
Rna-Polymerases of Archaebacteria, Eukaryotes, and Eubacteria." Canadian Journal of Microbiology 35(1): 73-80.