Embed Size (px)
Citation preview
1.00
Page 1 of 32
4101 FILBERT AVENUE
01-0110-050
ATLANTICOVERVIEW
ATLANTIC CITY, NJ 08401-1023ATLANTIC CITY
CHELSEA HEIGHTS SCHOOL
State of New Jersey
PK-08GRADE SPAN
2014-15
The New Jersey Department of Education (NJDOE) is pleased to present these annual reports of School Performance. These reports are designed to inform parents, educators and communities about how well a school is performing and preparing its students for college and careers.
In particular, the School Performance Reports seek to:
Focus attention on metrics that are indicative of college and career readiness. Benchmark a school's performance against other peer schools that are educating similar students, against statewide outcomes, and
against state targets to illuminate and build upon a school's strengths and identify areas for improvement. Improve educational outcomes for students by providing both longitudinal and growth data so that progress can be measured as part of
an individual school's efforts to engage in continuous improvement.
While the New Jersey School Performance Reports seek to bring more information to educators and stakeholders about the performance of schools, they do not seek to distill the performance of schools into a single metric, a single score, or a simplified conclusion. Instead, the intention is that educators and stakeholders will engage in deep, lengthy conversations about the full range of the data presented As educators know well, measuring school performance is both an art and a science. While the School Performance Report brings attention to important student outcomes, NJDOE does not collect data about other essential elements of a school, such as the provision of opportunities to participate and excel in extracurricular activities; the development of non-cognitive skills like time management and perseverance; the pervasiveness of a positive school culture or climate; or the attainment of other employability and technical skills, as many of these data are beyond both the capacity and resources of schools to measure and collect well.
To learn more about New Jersey’s school accountability system, please visit: http://www.nj.gov/education/educators/.

2.001.00
Page 2 of 32
4101 FILBERT AVENUE
01-0110-050
ATLANTICDEMOGRAPHIC INFORMATION
ATLANTIC CITY, NJ 08401-1023ATLANTIC CITY
CHELSEA HEIGHTS SCHOOL
State of New Jersey
PK-08GRADE SPAN
2014-15
Spanish 30.4%
Bengali 11.9%
Urdu 2.9%
Vietnamese 1.7%
Chinese 0.6%
Other 1.5%
2014-15
Language Diversity
This table presents the percentage of students who primarily speak each language in their home.
Percent
English 51.0%
2012-13 2013-14 2014-15
Total School Enrollment Trends
En
roll
men
t C
oun
t
0
50
100
150
200
250
300
350
400
450
35 39
37
40
9
35
29
45
24
4027
33
41
37
32
3632
34
3439
8229
37
63
37
38
40
29
27
UG
PK
08
07
06
05
04
03
02
01
KG
Enrollment by Grade
This graph presents the count of students who were 'on roll'by grade in October of each school year.
Note: "UG" represents the count of students who are 'on roll' in this school but who are educated in ungraded classrooms, meaning that the classrooms may contain students from multiple grade levels.
Total School Enrollment407296357
2012-132013-142014-15
2012-13 2013-14 2014-150
40
80
120
160
200
240
Male
Female
Enrollment by Gender
This graph presents the count of students by gender who were 'on roll' inOctober of each school year.
1442013-141722014-15
2062012-13152185
Male Female201
Two or MoreRaces0.6%
PacificIslander
0.3%
White5.0%
Asian23.2%
Black22.7%
Hispanic48.2%
White Black Hispanic
Asian American Indian Pacific Islander
Two or More Races
This graph presents the percentages of enrollment for eachsubgroup defined by the No Child Left Behind Act of 2001.
Enrollment by Ethnic/Racial Subgroup
DISABILITY ECONDIS LEP
Per
cent
of
Enr
ollm
ent
0
20
40
60
80
100
74
9
8990
111047 10
2012-13 2013-14 2014-15
Enrollment Trends by Program Participation
This graph presents the percentages of students by program participation who were ‘on roll’ in October of each school year.
35 10%
264 74.0%
10.9%
2014-15
Current Year Enrollment by Program Participation% of Enrollment
Students with Disability
39
Count of Students
Economically Disadvantaged Students
English Language Learners
Page 3 of 32
4101 FILBERT AVENUE
01-0110-050
ATLANTICATLANTIC CITY, NJ 08401-1023ATLANTIC CITY
CHELSEA HEIGHTS SCHOOLACADEMIC ACHIEVEMENT
State of New Jersey
PK-08GRADE SPAN
2014-15
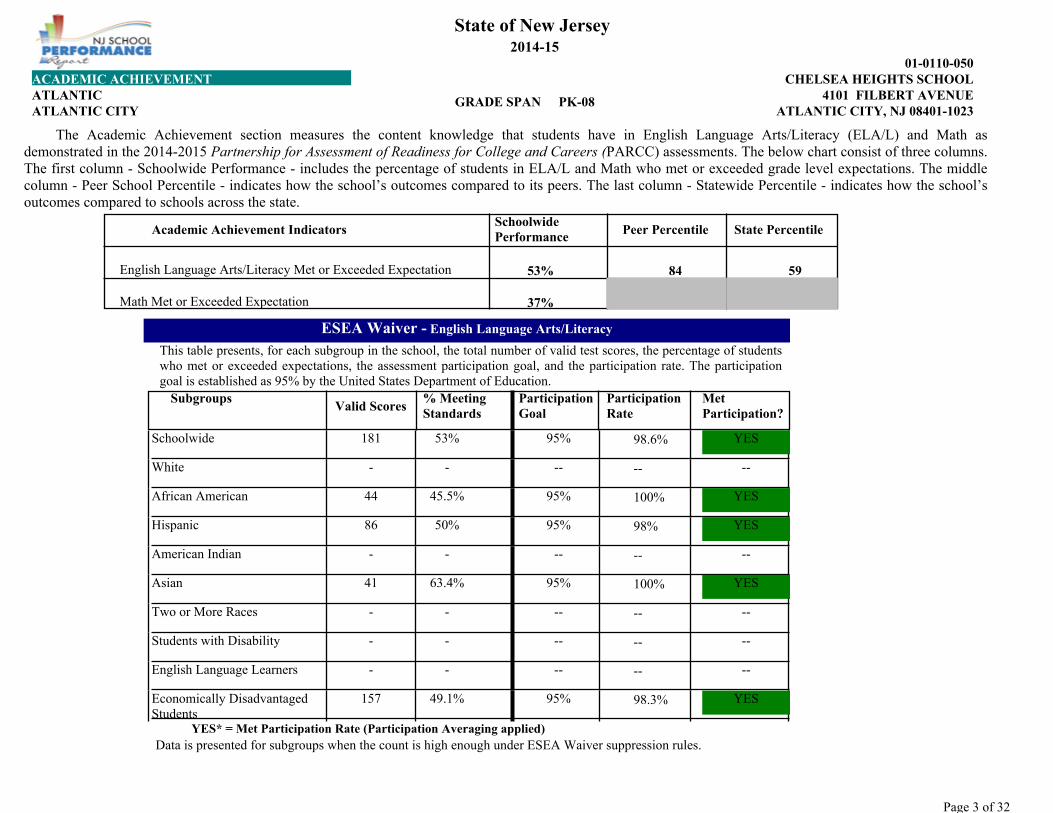
The Academic Achievement section measures the content knowledge that students have in English Language Arts/Literacy (ELA/L) and Math as demonstrated in the 2014-2015 Partnership for Assessment of Readiness for College and Careers (PARCC) assessments. The below chart consist of three columns. The first column - Schoolwide Performance - includes the percentage of students in ELA/L and Math who met or exceeded grade level expectations. The middle column - Peer School Percentile - indicates how the school’s outcomes compared to its peers. The last column - Statewide Percentile - indicates how the school’s outcomes compared to schools across the state.
37%
53% 84 59
Academic Achievement IndicatorsSchoolwide Performance State PercentilePeer Percentile
Math Met or Exceeded Expectation
English Language Arts/Literacy Met or Exceeded Expectation
This table presents, for each subgroup in the school, the total number of valid test scores, the percentage of students who met or exceeded expectations, the assessment participation goal, and the participation rate. The participation goal is established as 95% by the United States Department of Education.
98.6%
--
100%
98%
--
100%
--
--
--
98.3%
ESEA Waiver - English Language Arts/Literacy
Schoolwide 95%181 53%
White --- -
African American 95%44 45.5%
Hispanic 95%86 50%
American Indian --- -
Asian 95%41 63.4%
Two or More Races --- -
Students with Disability --- -
English Language Learners --- -
95%157 49.1%
Data is presented for subgroups when the count is high enough under ESEA Waiver suppression rules.YES* = Met Participation Rate (Participation Averaging applied)
Met Participation?Valid Scores
Subgroups Participation Rate
YES
--
YES
YES
--
YES
--
--
--
YES
Participation Goal
% Meeting Standards
Economically Disadvantaged Students

Page 4 of 32
4101 FILBERT AVENUE
01-0110-050
ATLANTICATLANTIC CITY, NJ 08401-1023ATLANTIC CITY
CHELSEA HEIGHTS SCHOOLACADEMIC ACHIEVEMENT
State of New Jersey
PK-08GRADE SPAN
2014-15
This table presents, for each subgroup in the school, the total number of valid test scores, the percentage of students who met or exceeded expectations, the assessment participation goal, and the participation rate. The participation goal is established as 95% by the United States Department of Education.
98.6%
--
100%
98%
--
100%
--
--
--
98.9%
ESEA Waiver - Math
Schoolwide 95%181 37.1%
White --- -
African American 95%44 27.3%
Hispanic 95%86 34.9%
American Indian --- -
Asian 95%41 58.6%
Two or More Races --- -
Students with Disability --- -
English Learner Students --- -
95%157 37.6%
Data is presented for subgroups when the count is high enough under ESEA Waiver suppression rules.YES* = Met Participation Rate (Participation Averaging applied)
Met Participation?
Subgroups Participation Rate
YES
--
YES
YES
--
YES
--
--
--
YES
Participation GoalValid Scores
% Meeting Standards
Economically Disadvantaged Students

Page 5 of 32
4101 FILBERT AVENUE
01-0110-050
ATLANTICATLANTIC CITY, NJ 08401-1023ATLANTIC CITY
CHELSEA HEIGHTS SCHOOLACADEMIC ACHIEVEMENT
State of New Jersey
PK-08GRADE SPAN
2014-15
The PARCC assesses how well students have learned grade-level material in English Language Arts/Literacy (ELA/L) and Math. The tests include questions that measure students’ fundamental skills and knowledge, and require them to think critically, solve problems and support or explain their answers.
The PARCC reports students’ overall scale scores that range from 650 to 850. To determine whether students have met academic expectations for their grade level/course in ELA/L and Math, students’ overall scale scores are categorized into five Performance Levels. Students performing at levels 4 and 5 (met or exceeded expectations) have demonstrated readiness for the next grade level/course, and are on track for college and careers.
PARCC Performance Level
Level 5:Exceeded Expectations(Max. 850)
Level 4:Met Expectations
Level 3: Approached Expectations
Level 2: Partially Met Expectations
Level 1: Did Not Yet Meet Expectations(Min. 650)
Five Performance Levels

Page 6 of 32
4101 FILBERT AVENUE
01-0110-050
ATLANTICATLANTIC CITY, NJ 08401-1023ATLANTIC CITY
CHELSEA HEIGHTS SCHOOLACADEMIC ACHIEVEMENT
State of New Jersey
PK-08GRADE SPAN
2014-15
This table presents the grade level outcomes, as measured by PARCC, in all five performance levels for all subgroups. PARCC consists of five performance levels: Level 1 - Did not yet meet grade-level expectations, Level 2 -Partially met expectations, Level 3 - Approached expectations, Level 4 - Met expectations, and Level 5 - Exceeded expectations.
Schoolwide 35 51%749 44%744
White 55%753
African American 26%725
Hispanic 15 53%749 26%727
American Indian 40%738
Asian 12 50%754 70%769
Two or More Races 53%751
Students with Disability 24%718
English Language Learners 11%709
Economically Disadvantaged Students 30 47%749 24%724
PARCC ELA Performance Distribution - Grade - 03
- - - - - - - -
- - - - - - - -
- - - - - - - -
- - - - - - - -
- - - - - - - -
- - - - - - - -
3% 17% 29% 49% 3%
0% 20% 27% 47% 7%
8% 8% 33% 50% 0%
3% 20% 30% 43% 3%
SubgroupState % Met/Exceeded Expectation
State Mean Scale Score
Valid Scores
% Level_1
% Level_5
% Met/ Exceeded Expectation
Mean Scale Score
% Level_2
% Level_4
% Level_3

Page 7 of 32
4101 FILBERT AVENUE
01-0110-050
ATLANTICATLANTIC CITY, NJ 08401-1023ATLANTIC CITY
CHELSEA HEIGHTS SCHOOLACADEMIC ACHIEVEMENT
State of New Jersey
PK-08GRADE SPAN
2014-15
This table presents the grade level outcomes, as measured by PARCC, in all five performance levels for all subgroups. PARCC consists of five performance levels: Level 1 - Did not yet meet grade-level expectations, Level 2 -Partially met expectations, Level 3 - Approached expectations, Level 4 - Met expectations, and Level 5 - Exceeded expectations.
Schoolwide 25 40%740 52%751
White 63%758
African American 30%733
Hispanic 15 53%747 35%737
American Indian 52%746
Asian 78%773
Two or More Races 62%760
Students with Disability 25%725
English Language Learners 15%717
Economically Disadvantaged Students 24 38%738 31%734
PARCC ELA Performance Distribution - Grade - 04
- - - - - - - -
- - - - - - - -
- - - - - - - -
- - - - - - - -
- - - - - - - -
- - - - - - - -
- - - - - - - -
12% 12% 36% 36% 4%
7% 13% 27% 47% 7%
13% 13% 38% 33% 4%
SubgroupState % Met/Exceeded Expectation
State Mean Scale Score
Valid Scores
% Level_1
% Level_5
% Met/ Exceeded Expectation
Mean Scale Score
% Level_2
% Level_4
% Level_3
Page 8 of 32
4101 FILBERT AVENUE
01-0110-050
ATLANTICATLANTIC CITY, NJ 08401-1023ATLANTIC CITY
CHELSEA HEIGHTS SCHOOLACADEMIC ACHIEVEMENT
State of New Jersey
PK-08GRADE SPAN
2014-15
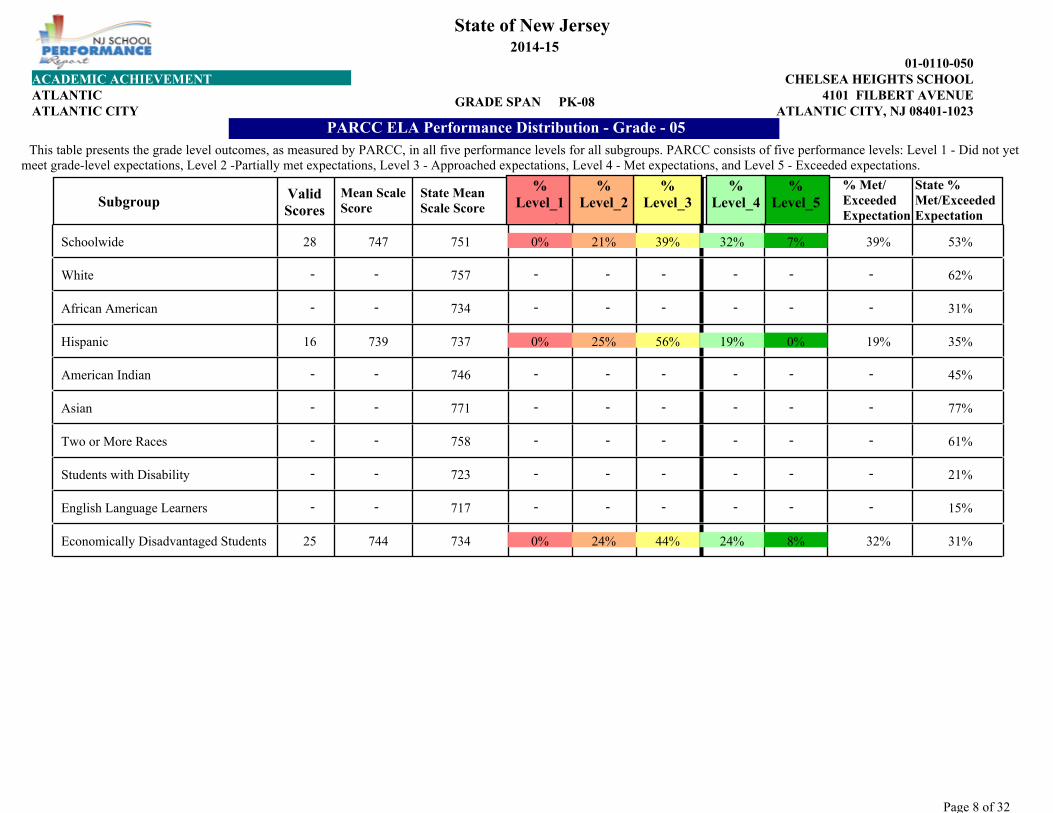
This table presents the grade level outcomes, as measured by PARCC, in all five performance levels for all subgroups. PARCC consists of five performance levels: Level 1 - Did not yet meet grade-level expectations, Level 2 -Partially met expectations, Level 3 - Approached expectations, Level 4 - Met expectations, and Level 5 - Exceeded expectations.
Schoolwide 28 39%747 53%751
White 62%757
African American 31%734
Hispanic 16 19%739 35%737
American Indian 45%746
Asian 77%771
Two or More Races 61%758
Students with Disability 21%723
English Language Learners 15%717
Economically Disadvantaged Students 25 32%744 31%734
PARCC ELA Performance Distribution - Grade - 05
- - - - - - - -
- - - - - - - -
- - - - - - - -
- - - - - - - -
- - - - - - - -
- - - - - - - -
- - - - - - - -
0% 21% 39% 32% 7%
0% 25% 56% 19% 0%
0% 24% 44% 24% 8%
SubgroupState % Met/Exceeded Expectation
State Mean Scale Score
Valid Scores
% Level_1
% Level_5
% Met/ Exceeded Expectation
Mean Scale Score
% Level_2
% Level_4
% Level_3

Page 9 of 32
4101 FILBERT AVENUE
01-0110-050
ATLANTICATLANTIC CITY, NJ 08401-1023ATLANTIC CITY
CHELSEA HEIGHTS SCHOOLACADEMIC ACHIEVEMENT
State of New Jersey
PK-08GRADE SPAN
2014-15
This table presents the grade level outcomes, as measured by PARCC, in all five performance levels for all subgroups. PARCC consists of five performance levels: Level 1 - Did not yet meet grade-level expectations, Level 2 -Partially met expectations, Level 3 - Approached expectations, Level 4 - Met expectations, and Level 5 - Exceeded expectations.
Schoolwide 31 26%736 50%749
White 59%755
African American 29%732
Hispanic 14 14%730 34%736
American Indian 39%743
Asian 77%770
Two or More Races 57%753
Students with Disability 17%718
English Language Learners 11%711
Economically Disadvantaged Students 29 24%735 30%733
PARCC ELA Performance Distribution - Grade - 06
- - - - - - - -
- - - - - - - -
- - - - - - - -
- - - - - - - -
- - - - - - - -
- - - - - - - -
- - - - - - - -
3% 29% 42% 23% 3%
7% 21% 57% 14% 0%
3% 31% 41% 21% 3%
SubgroupState % Met/Exceeded Expectation
State Mean Scale Score
Valid Scores
% Level_1
% Level_5
% Met/ Exceeded Expectation
Mean Scale Score
% Level_2
% Level_4
% Level_3
Page 10 of 32
4101 FILBERT AVENUE
01-0110-050
ATLANTICATLANTIC CITY, NJ 08401-1023ATLANTIC CITY
CHELSEA HEIGHTS SCHOOLACADEMIC ACHIEVEMENT
State of New Jersey
PK-08GRADE SPAN
2014-15
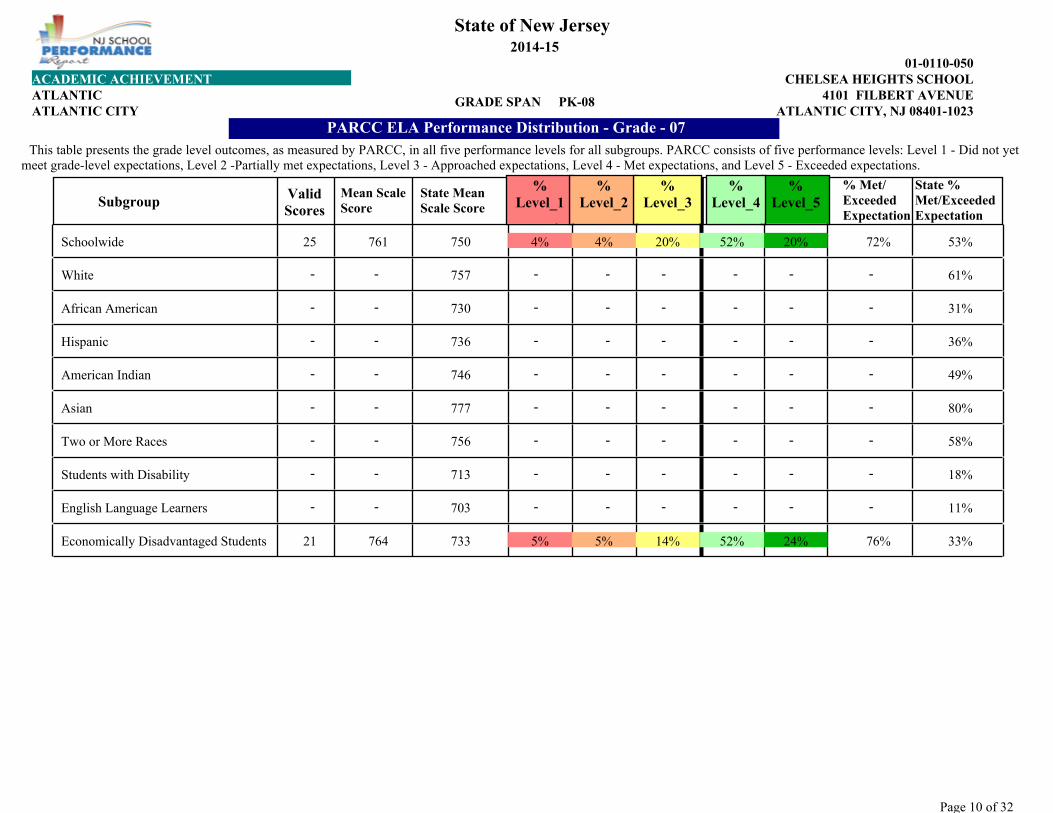
This table presents the grade level outcomes, as measured by PARCC, in all five performance levels for all subgroups. PARCC consists of five performance levels: Level 1 - Did not yet meet grade-level expectations, Level 2 -Partially met expectations, Level 3 - Approached expectations, Level 4 - Met expectations, and Level 5 - Exceeded expectations.
Schoolwide 25 72%761 53%750
White 61%757
African American 31%730
Hispanic 36%736
American Indian 49%746
Asian 80%777
Two or More Races 58%756
Students with Disability 18%713
English Language Learners 11%703
Economically Disadvantaged Students 21 76%764 33%733
PARCC ELA Performance Distribution - Grade - 07
- - - - - - - -
- - - - - - - -
- - - - - - - -
- - - - - - - -
- - - - - - - -
- - - - - - - -
- - - - - - - -
- - - - - - - -
4% 4% 20% 52% 20%
5% 5% 14% 52% 24%
SubgroupState % Met/Exceeded Expectation
State Mean Scale Score
Valid Scores
% Level_1
% Level_5
% Met/ Exceeded Expectation
Mean Scale Score
% Level_2
% Level_4
% Level_3
Page 11 of 32
4101 FILBERT AVENUE
01-0110-050
ATLANTICATLANTIC CITY, NJ 08401-1023ATLANTIC CITY
CHELSEA HEIGHTS SCHOOLACADEMIC ACHIEVEMENT
State of New Jersey
PK-08GRADE SPAN
2014-15
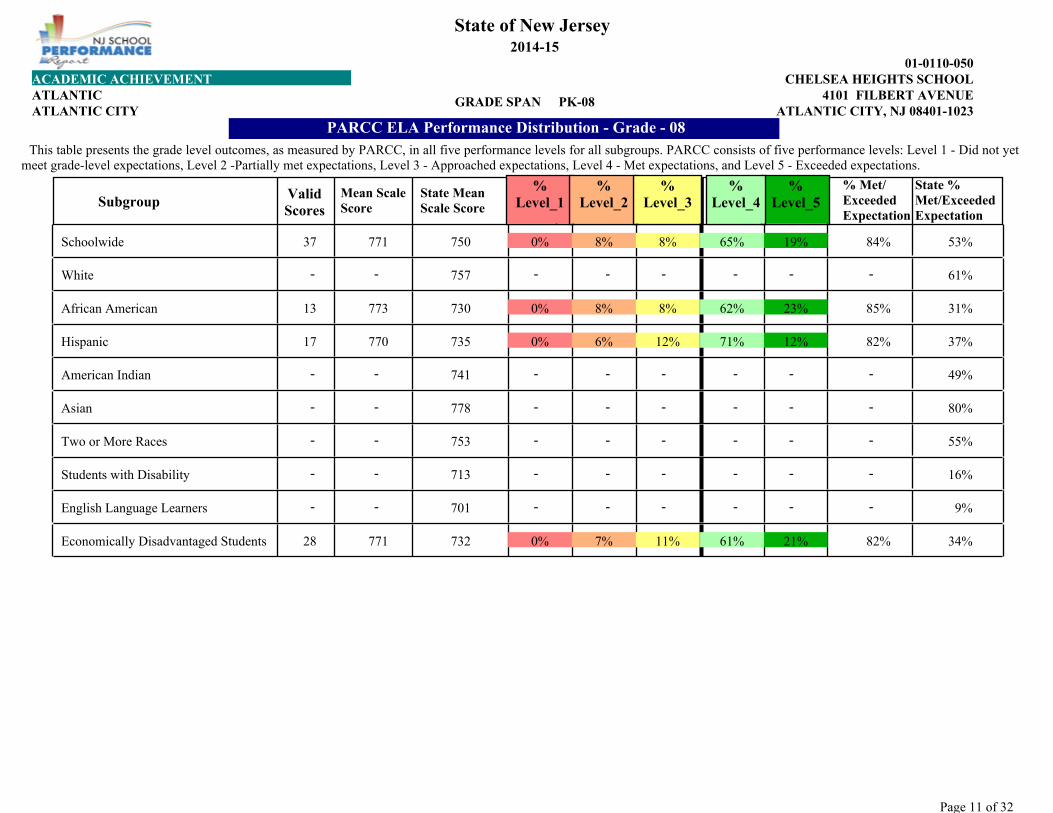
This table presents the grade level outcomes, as measured by PARCC, in all five performance levels for all subgroups. PARCC consists of five performance levels: Level 1 - Did not yet meet grade-level expectations, Level 2 -Partially met expectations, Level 3 - Approached expectations, Level 4 - Met expectations, and Level 5 - Exceeded expectations.
Schoolwide 37 84%771 53%750
White 61%757
African American 13 85%773 31%730
Hispanic 17 82%770 37%735
American Indian 49%741
Asian 80%778
Two or More Races 55%753
Students with Disability 16%713
English Language Learners 9%701
Economically Disadvantaged Students 28 82%771 34%732
PARCC ELA Performance Distribution - Grade - 08
- - - - - - - -
- - - - - - - -
- - - - - - - -
- - - - - - - -
- - - - - - - -
- - - - - - - -
0% 8% 8% 65% 19%
0% 8% 8% 62% 23%
0% 6% 12% 71% 12%
0% 7% 11% 61% 21%
SubgroupState % Met/Exceeded Expectation
State Mean Scale Score
Valid Scores
% Level_1
% Level_5
% Met/ Exceeded Expectation
Mean Scale Score
% Level_2
% Level_4
% Level_3

Page 12 of 32
4101 FILBERT AVENUE
01-0110-050
ATLANTICATLANTIC CITY, NJ 08401-1023ATLANTIC CITY
CHELSEA HEIGHTS SCHOOLACADEMIC ACHIEVEMENT
State of New Jersey
PK-08GRADE SPAN
2014-15
This table presents the grade level outcomes, as measured by PARCC, in all five performance levels for all subgroups. PARCC consists of five performance levels: Level 1 - Did not yet meet grade-level expectations, Level 2 -Partially met expectations, Level 3 - Approached expectations, Level 4 - Met expectations, and Level 5 - Exceeded expectations.
Schoolwide 35 37%740 46%746
White 56%752
African American 25%728
Hispanic 15 47%746 28%733
American Indian 41%742
Asian 12 50%743 77%772
Two or More Races 54%751
Students with Disability 27%727
English Language Learners 17%724
Economically Disadvantaged Students 30 40%740 26%730
PARCC MATH - Performance Distribution - Grade - 03
- - - - - - - -
- - - - - - - -
- - - - - - - -
- - - - - - - -
- - - - - - - -
- - - - - - - -
3% 26% 34% 34% 3%
7% 13% 33% 40% 7%
0% 25% 25% 50% 0%
3% 27% 30% 37% 3%
SubgroupState % Met/Exceeded Expectation
State Mean Scale Score
Valid Scores
% Level_1
% Level_5
% Met/ Exceeded Expectation
Mean Scale Score
% Level_2
% Level_4
% Level_3

Page 13 of 32
4101 FILBERT AVENUE
01-0110-050
ATLANTICATLANTIC CITY, NJ 08401-1023ATLANTIC CITY
CHELSEA HEIGHTS SCHOOLACADEMIC ACHIEVEMENT
State of New Jersey
PK-08GRADE SPAN
2014-15
This table presents the grade level outcomes, as measured by PARCC, in all five performance levels for all subgroups. PARCC consists of five performance levels: Level 1 - Did not yet meet grade-level expectations, Level 2 -Partially met expectations, Level 3 - Approached expectations, Level 4 - Met expectations, and Level 5 - Exceeded expectations.
Schoolwide 25 44%736 42%744
White 50%749
African American 20%727
Hispanic 15 47%739 26%732
American Indian 40%740
Asian 75%769
Two or More Races 52%750
Students with Disability 21%724
English Language Learners 15%722
Economically Disadvantaged Students 24 42%735 23%730
PARCC MATH - Performance Distribution - Grade - 04
- - - - - - - -
- - - - - - - -
- - - - - - - -
- - - - - - - -
- - - - - - - -
- - - - - - - -
- - - - - - - -
8% 36% 12% 44% 0%
7% 33% 13% 47% 0%
8% 38% 13% 42% 0%
SubgroupState % Met/Exceeded Expectation
State Mean Scale Score
Valid Scores
% Level_1
% Level_5
% Met/ Exceeded Expectation
Mean Scale Score
% Level_2
% Level_4
% Level_3
Page 14 of 32
4101 FILBERT AVENUE
01-0110-050
ATLANTICATLANTIC CITY, NJ 08401-1023ATLANTIC CITY
CHELSEA HEIGHTS SCHOOLACADEMIC ACHIEVEMENT
State of New Jersey
PK-08GRADE SPAN
2014-15
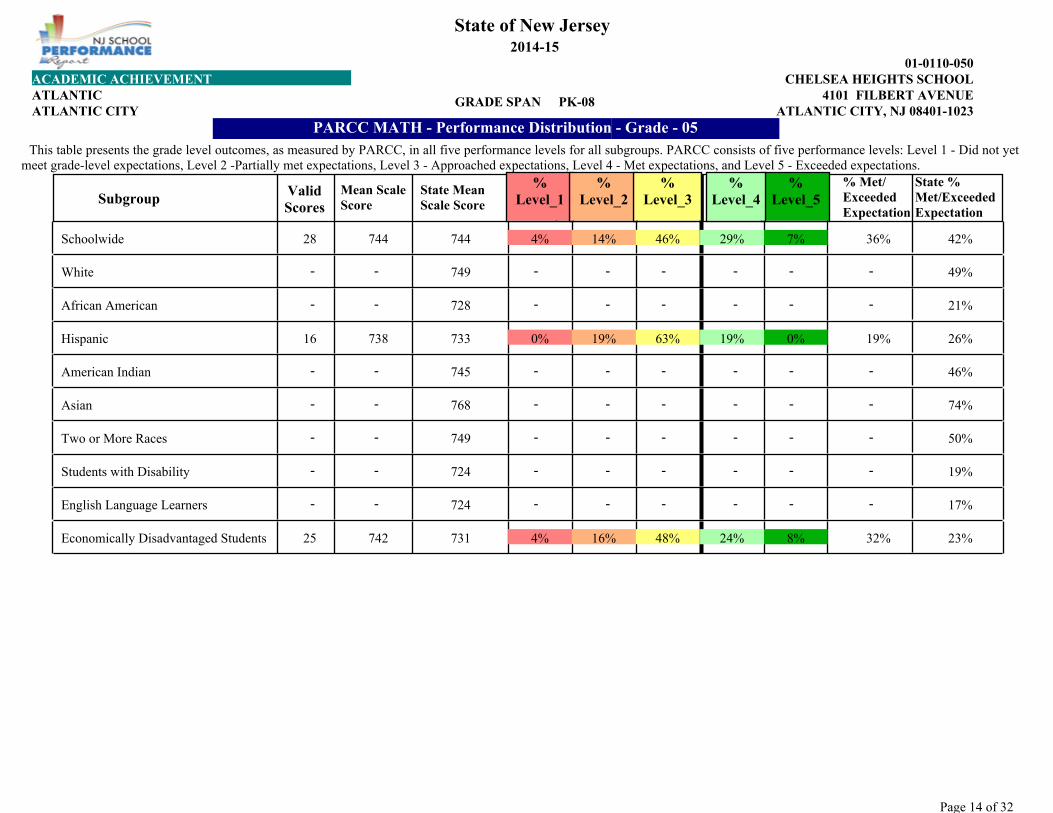
This table presents the grade level outcomes, as measured by PARCC, in all five performance levels for all subgroups. PARCC consists of five performance levels: Level 1 - Did not yet meet grade-level expectations, Level 2 -Partially met expectations, Level 3 - Approached expectations, Level 4 - Met expectations, and Level 5 - Exceeded expectations.
Schoolwide 28 36%744 42%744
White 49%749
African American 21%728
Hispanic 16 19%738 26%733
American Indian 46%745
Asian 74%768
Two or More Races 50%749
Students with Disability 19%724
English Language Learners 17%724
Economically Disadvantaged Students 25 32%742 23%731
PARCC MATH - Performance Distribution - Grade - 05
- - - - - - - -
- - - - - - - -
- - - - - - - -
- - - - - - - -
- - - - - - - -
- - - - - - - -
- - - - - - - -
4% 14% 46% 29% 7%
0% 19% 63% 19% 0%
4% 16% 48% 24% 8%
SubgroupState % Met/Exceeded Expectation
State Mean Scale Score
Valid Scores
% Level_1
% Level_5
% Met/ Exceeded Expectation
Mean Scale Score
% Level_2
% Level_4
% Level_3

Page 15 of 32
4101 FILBERT AVENUE
01-0110-050
ATLANTICATLANTIC CITY, NJ 08401-1023ATLANTIC CITY
CHELSEA HEIGHTS SCHOOLACADEMIC ACHIEVEMENT
State of New Jersey
PK-08GRADE SPAN
2014-15
This table presents the grade level outcomes, as measured by PARCC, in all five performance levels for all subgroups. PARCC consists of five performance levels: Level 1 - Did not yet meet grade-level expectations, Level 2 -Partially met expectations, Level 3 - Approached expectations, Level 4 - Met expectations, and Level 5 - Exceeded expectations.
Schoolwide 31 16%726 42%743
White 50%749
African American 19%726
Hispanic 25%731
American Indian 35%740
Asian 75%768
Two or More Races 44%745
Students with Disability 15%718
English Language Learners 14%718
Economically Disadvantaged Students 29 17%727 23%729
PARCC MATH - Performance Distribution - Grade - 06
- - - - - - - -
- - - - - - - -
- - - - - - - -
- - - - - - - -
- - - - - - - -
- - - - - - - -
- - - - - - - -
- - - - - - - -
10% 35% 39% 16% 0%
10% 34% 38% 17% 0%
SubgroupState % Met/Exceeded Expectation
State Mean Scale Score
Valid Scores
% Level_1
% Level_5
% Met/ Exceeded Expectation
Mean Scale Score
% Level_2
% Level_4
% Level_3

Page 16 of 32
4101 FILBERT AVENUE
01-0110-050
ATLANTICATLANTIC CITY, NJ 08401-1023ATLANTIC CITY
CHELSEA HEIGHTS SCHOOLACADEMIC ACHIEVEMENT
State of New Jersey
PK-08GRADE SPAN
2014-15
This table presents the grade level outcomes, as measured by PARCC, in all five performance levels for all subgroups. PARCC consists of five performance levels: Level 1 - Did not yet meet grade-level expectations, Level 2 -Partially met expectations, Level 3 - Approached expectations, Level 4 - Met expectations, and Level 5 - Exceeded expectations.
Schoolwide 25 44%743 38%740
White 46%745
African American 17%725
Hispanic 23%730
American Indian 32%734
Asian 68%760
Two or More Races 43%742
Students with Disability 11%715
English Language Learners 11%717
Economically Disadvantaged Students 21 48%746 21%728
PARCC MATH - Performance Distribution - Grade - 07
- - - - - - - -
- - - - - - - -
- - - - - - - -
- - - - - - - -
- - - - - - - -
- - - - - - - -
- - - - - - - -
- - - - - - - -
0% 32% 24% 44% 0%
0% 29% 24% 48% 0%
SubgroupState % Met/Exceeded Expectation
State Mean Scale Score
Valid Scores
% Level_1
% Level_5
% Met/ Exceeded Expectation
Mean Scale Score
% Level_2
% Level_4
% Level_3

Page 17 of 32
4101 FILBERT AVENUE
01-0110-050
ATLANTICATLANTIC CITY, NJ 08401-1023ATLANTIC CITY
CHELSEA HEIGHTS SCHOOLACADEMIC ACHIEVEMENT
State of New Jersey
PK-08GRADE SPAN
2014-15
This table presents the grade level outcomes, as measured by PARCC, in all five performance levels for all subgroups. PARCC consists of five performance levels: Level 1 - Did not yet meet grade-level expectations, Level 2 -Partially met expectations, Level 3 - Approached expectations, Level 4 - Met expectations, and Level 5 - Exceeded expectations.
Schoolwide 34 41%746 24%726
White 29%732
African American 13 38%752 14%715
Hispanic 15 47%741 19%721
American Indian 15%722
Asian 46%744
Two or More Races 24%724
Students with Disability 9%705
English Language Learners 10%706
Economically Disadvantaged Students 26 46%746 17%719
PARCC MATH - Performance Distribution - Grade - 08
- - - - - - - -
- - - - - - - -
- - - - - - - -
- - - - - - - -
- - - - - - - -
- - - - - - - -
3% 24% 32% 41% 0%
0% 15% 46% 38% 0%
7% 27% 20% 47% 0%
4% 23% 27% 46% 0%
SubgroupState % Met/Exceeded Expectation
State Mean Scale Score
Valid Scores
% Level_1
% Level_5
% Met/ Exceeded Expectation
Mean Scale Score
% Level_2
% Level_4
% Level_3
Page 18 of 32
4101 FILBERT AVENUE
01-0110-050
ATLANTICATLANTIC CITY, NJ 08401-1023ATLANTIC CITY
CHELSEA HEIGHTS SCHOOLACADEMIC ACHIEVEMENT
State of New Jersey
PK-08GRADE SPAN
2014-15
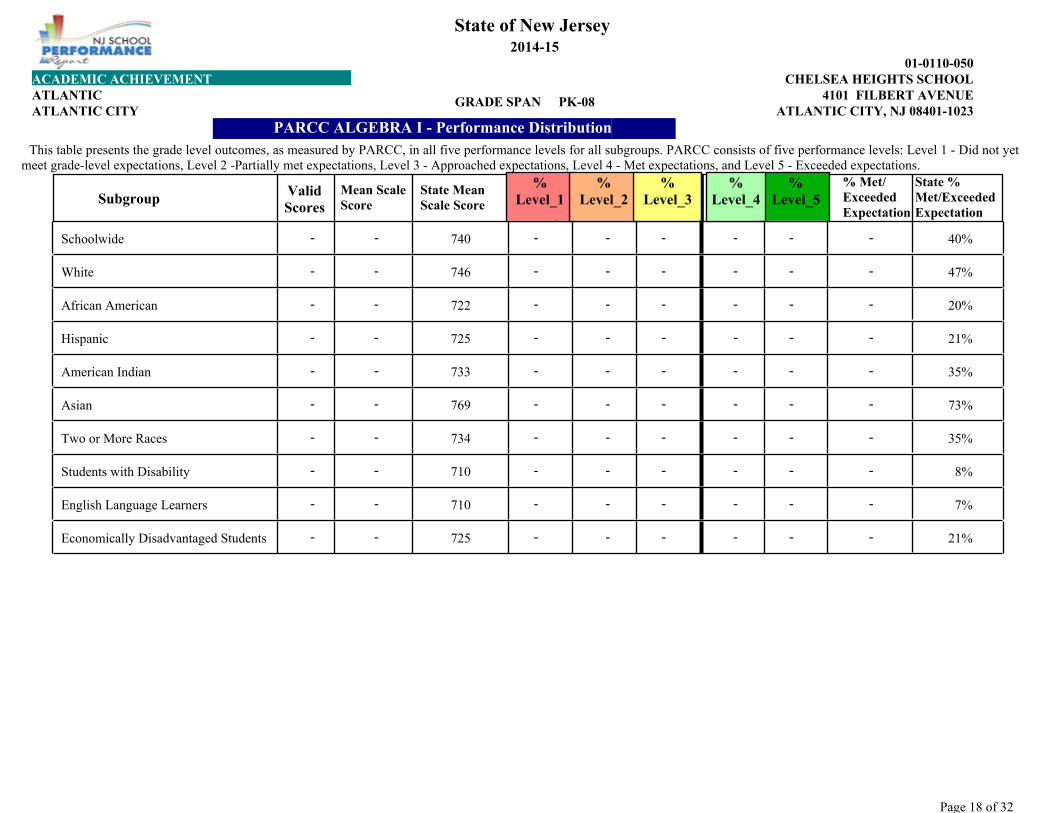
This table presents the grade level outcomes, as measured by PARCC, in all five performance levels for all subgroups. PARCC consists of five performance levels: Level 1 - Did not yet meet grade-level expectations, Level 2 -Partially met expectations, Level 3 - Approached expectations, Level 4 - Met expectations, and Level 5 - Exceeded expectations.
Schoolwide 40%740
White 47%746
African American 20%722
Hispanic 21%725
American Indian 35%733
Asian 73%769
Two or More Races 35%734
Students with Disability 8%710
English Language Learners 7%710
Economically Disadvantaged Students 21%725
PARCC ALGEBRA I - Performance Distribution
- - - - - - - -
- - - - - - - -
- - - - - - - -
- - - - - - - -
- - - - - - - -
- - - - - - - -
- - - - - - - -
- - - - - - - -
- - - - - - - -
- - - - - - - -
SubgroupState % Met/Exceeded Expectation
State Mean Scale Score
Valid Scores
% Level_1
% Level_5
% Met/ Exceeded Expectation
Mean Scale Score
% Level_2
% Level_4
% Level_3
Page 19 of 32
4101 FILBERT AVENUE
01-0110-050
ATLANTICATLANTIC CITY, NJ 08401-1023ATLANTIC CITY
CHELSEA HEIGHTS SCHOOLACADEMIC ACHIEVEMENT
State of New Jersey
PK-08GRADE SPAN
2014-15
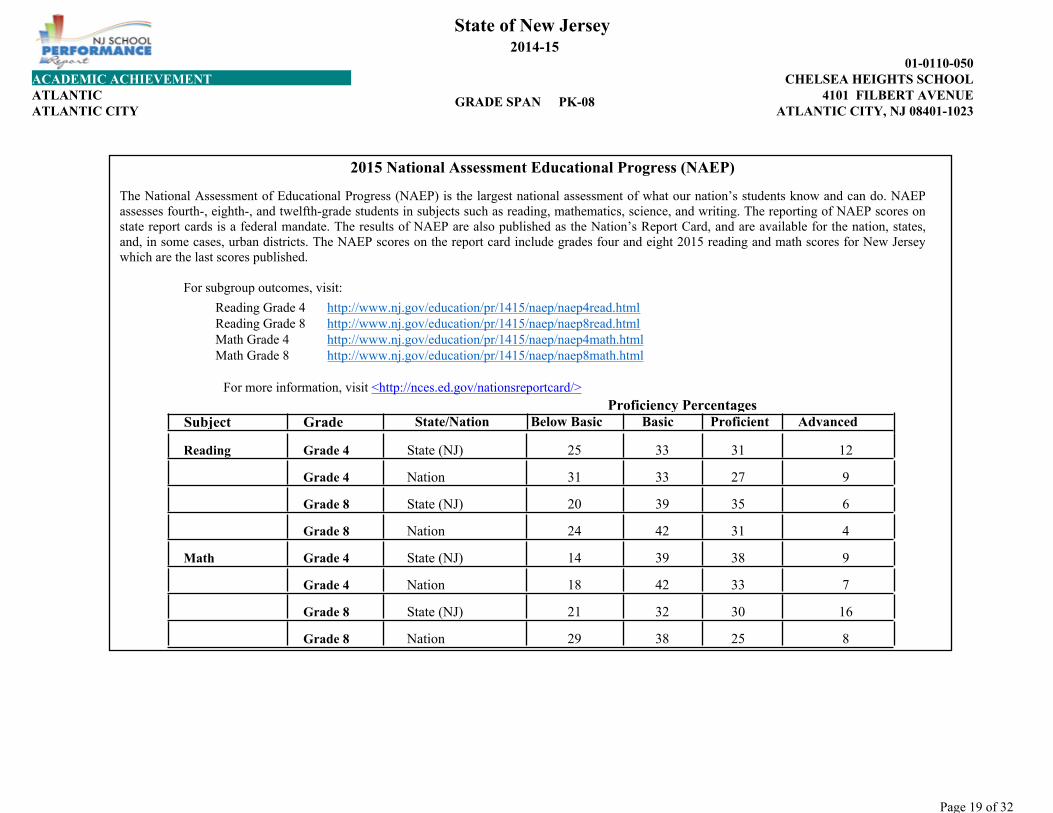
The National Assessment of Educational Progress (NAEP) is the largest national assessment of what our nation’s students know and can do. NAEP assesses fourth-, eighth-, and twelfth-grade students in subjects such as reading, mathematics, science, and writing. The reporting of NAEP scores on state report cards is a federal mandate. The results of NAEP are also published as the Nation’s Report Card, and are available for the nation, states, and, in some cases, urban districts. The NAEP scores on the report card include grades four and eight 2015 reading and math scores for New Jersey which are the last scores published.
For subgroup outcomes, visit:
Proficiency Percentages
Grade 4
Grade 4
Grade 8
Grade 8
Grade 4
Grade 4
Grade 8
Grade 8
State (NJ) 25 33 12
Nation 31 33 9
State (NJ) 20 39 6
Nation 24 42 4
State (NJ) 14 39 9
Nation 18 42 7
State (NJ) 21 32 16
Nation 29 38 8
2015 National Assessment Educational Progress (NAEP)
Reading Grade 4 http://www.nj.gov/education/pr/1415/naep/naep4read.html
http://www.nj.gov/education/pr/1415/naep/naep4math.htmlhttp://www.nj.gov/education/pr/1415/naep/naep8read.html
http://www.nj.gov/education/pr/1415/naep/naep8math.html
Reading Grade 8 Math Grade 4 Math Grade 8
For more information, visit <http://nces.ed.gov/nationsreportcard/>
Reading
Math
31
27
35
31
38
33
30
25
Below Basic Proficient AdvancedState/Nation BasicGradeSubject
Page 20 of 32
4101 FILBERT AVENUE
01-0110-050
ATLANTICATLANTIC CITY, NJ 08401-1023ATLANTIC CITY
CHELSEA HEIGHTS SCHOOLACADEMIC ACHIEVEMENT
State of New Jersey
PK-08GRADE SPAN
2014-15
Data is presented for subgroups when the count is high enough under ESEA Waiver suppression rules.
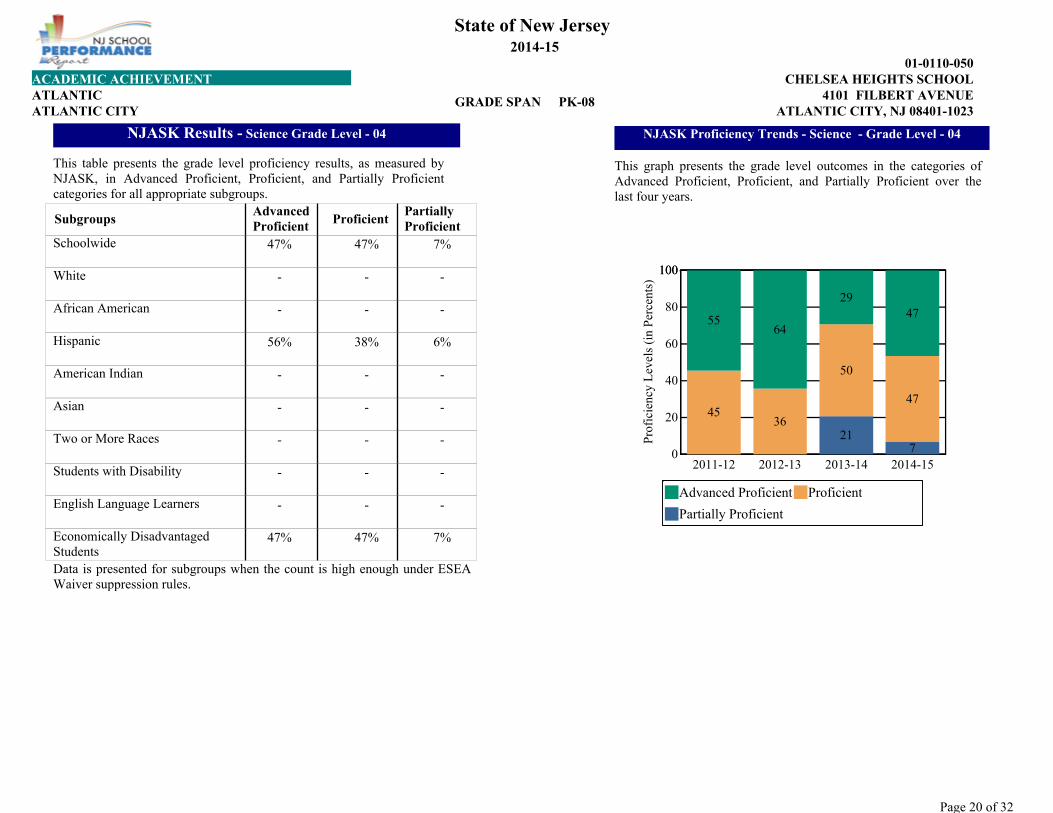
This table presents the grade level proficiency results, as measured by NJASK, in Advanced Proficient, Proficient, and Partially Proficient categories for all appropriate subgroups.
NJASK Results - Science Grade Level - 04
7%47%47%
---
---
6%38%56%
---
---
---
---
---
7%47%47%
Partially ProficientSubgroups
Schoolwide
White
African American
Hispanic
American Indian
Asian
Two or More Races
Students with Disability
English Language Learners
Economically Disadvantaged Students
ProficientAdvanced Proficient
2011-12 2012-13 2013-14 2014-15
Pro
fici
ency
Lev
els
(in
Per
cent
s)
0
20
40
60
80
100100
4764
45
7
36
29
55
21
47
50
Advanced Proficient Proficient
Partially Proficient
This graph presents the grade level outcomes in the categories of Advanced Proficient, Proficient, and Partially Proficient over the last four years.
NJASK Proficiency Trends - Science - Grade Level - 04

3.00
Page 21 of 32
4101 FILBERT AVENUE
01-0110-050
ATLANTICATLANTIC CITY, NJ 08401-1023ATLANTIC CITY
CHELSEA HEIGHTS SCHOOLACADEMIC ACHIEVEMENT
State of New Jersey
PK-08GRADE SPAN
2014-15
Data is presented for subgroups when the count is high enough under ESEA Waiver suppression rules.
This table presents the grade level proficiency results, as measured by NJASK, in Advanced Proficient, Proficient, and Partially Proficient categories for all appropriate subgroups.
NJASK Results - Science Grade Level - 08
7%70%23%
---
7%71%21%
0%83%17%
---
---
---
---
---
6%69%26%
Partially ProficientSubgroups
Schoolwide
White
African American
Hispanic
American Indian
Asian
Two or More Races
Students with Disability
English Language Learners
Economically Disadvantaged Students
ProficientAdvanced Proficient
2011-12 2012-13 2013-14 2014-15
Pro
fici
ency
Lev
els
(in
Per
cent
s)
0
20
40
60
80
100100
2318
65
7
50
32
3229
126
7056
Advanced Proficient Proficient
Partially Proficient
This graph presents the grade level outcomes in the categories of Advanced Proficient, Proficient, and Partially Proficient over the last four years.
NJASK Proficiency Trends - Science - Grade Level - 08
Page 22 of 32
4101 FILBERT AVENUE
01-0110-050
ATLANTICCOLLEGE AND CAREER READINESS
ATLANTIC CITY, NJ 08401-1023ATLANTIC CITY
CHELSEA HEIGHTS SCHOOL
State of New Jersey
PK-08GRADE SPAN
2014-15
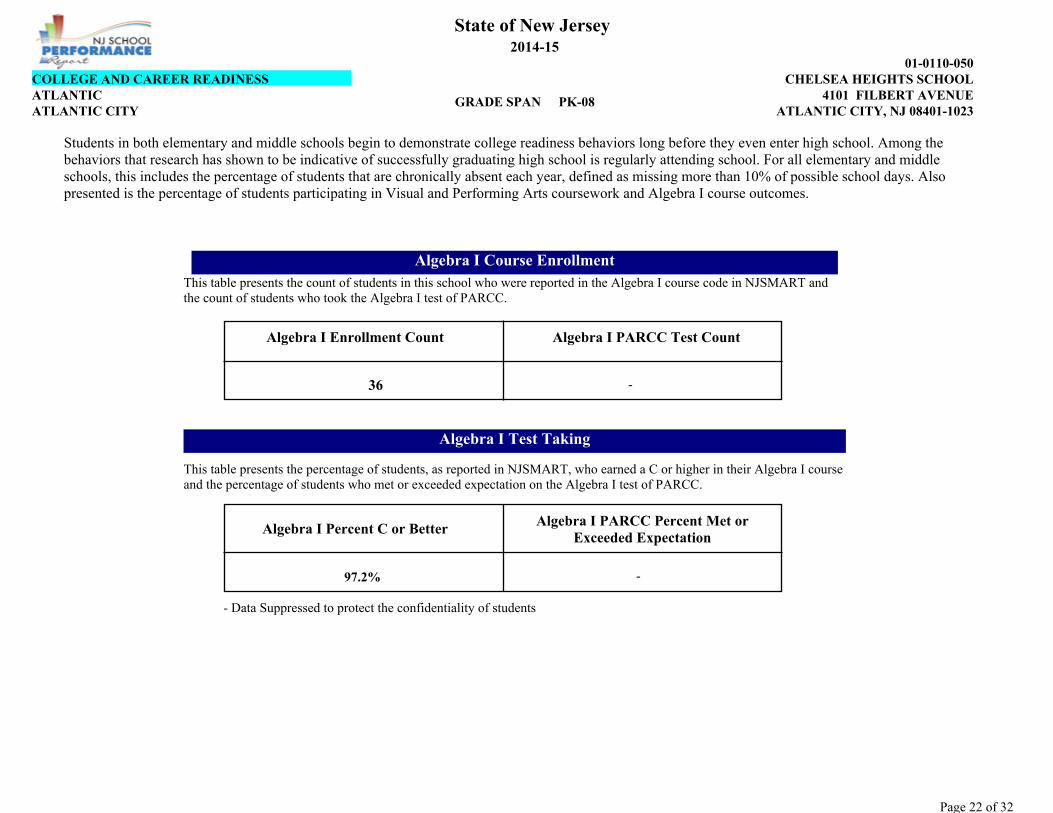
Students in both elementary and middle schools begin to demonstrate college readiness behaviors long before they even enter high school. Among the behaviors that research has shown to be indicative of successfully graduating high school is regularly attending school. For all elementary and middle schools, this includes the percentage of students that are chronically absent each year, defined as missing more than 10% of possible school days. Also presented is the percentage of students participating in Visual and Performing Arts coursework and Algebra I course outcomes.
This table presents the count of students in this school who were reported in the Algebra I course code in NJSMART and the count of students who took the Algebra I test of PARCC.
Algebra I Course Enrollment
Algebra I Test Taking
This table presents the percentage of students, as reported in NJSMART, who earned a C or higher in their Algebra I course and the percentage of students who met or exceeded expectation on the Algebra I test of PARCC.
- Data Suppressed to protect the confidentiality of students
36
97.2%
Algebra I Enrollment Count Algebra I PARCC Test Count
-
Algebra I Percent C or Better Algebra I PARCC Percent Met or Exceeded Expectation
-
Page 23 of 32
4101 FILBERT AVENUE
01-0110-050
ATLANTICCOLLEGE AND CAREER READINESS
ATLANTIC CITY, NJ 08401-1023ATLANTIC CITY
CHELSEA HEIGHTS SCHOOL
State of New Jersey
PK-08GRADE SPAN
2014-15
2012-13 2013-14 2014-15
DATA_YEAR
Per
cent
Stu
dent
s C
hron
ical
ly A
bsen
t (%
)
0
1
2
3
4
5
6
7
8
5.0
7.36.3
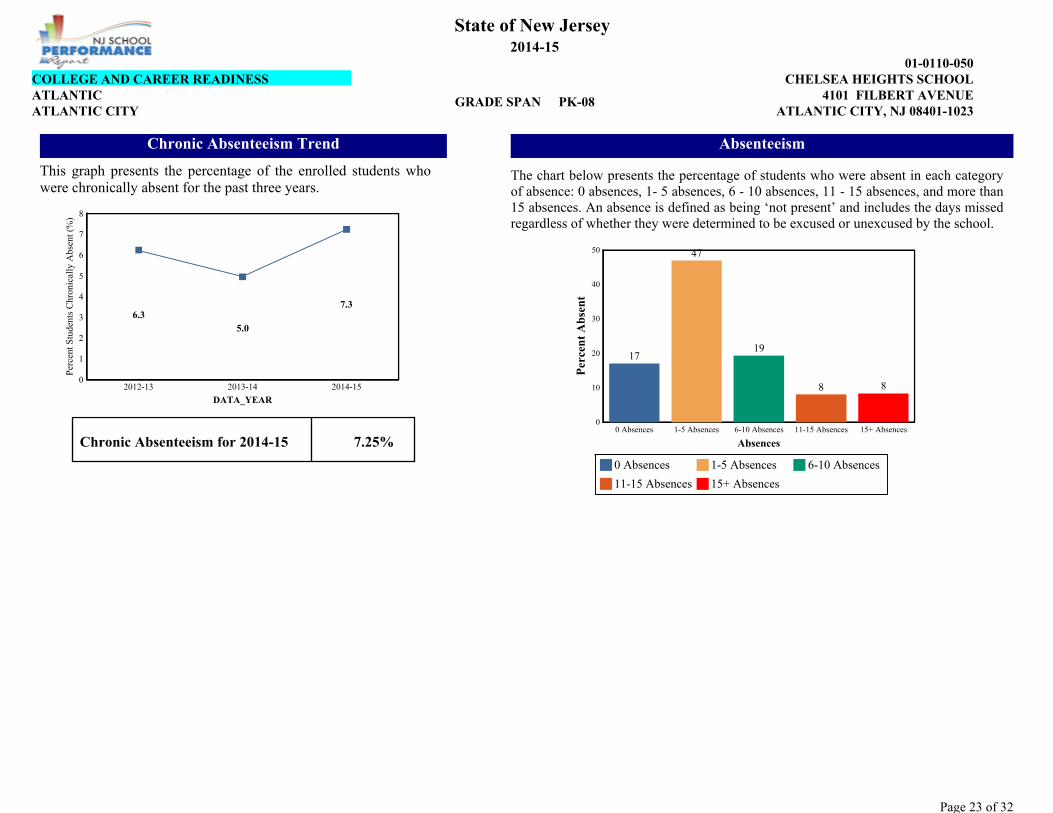
Chronic Absenteeism Trend
This graph presents the percentage of the enrolled students who were chronically absent for the past three years.
7.25%Chronic Absenteeism for 2014-15 0 Absences 1-5 Absences 6-10 Absences 11-15 Absences 15+ Absences
Absences
Per
cen
t A
bse
nt
0
10
20
30
40
50
8
47
1917
8
0 Absences 1-5 Absences 6-10 Absences
11-15 Absences 15+ Absences
Absenteeism
The chart below presents the percentage of students who were absent in each category of absence: 0 absences, 1- 5 absences, 6 - 10 absences, 11 - 15 absences, and more than 15 absences. An absence is defined as being ‘not present’ and includes the days missed regardless of whether they were determined to be excused or unexcused by the school.
Page 24 of 32
4101 FILBERT AVENUE
01-0110-050
ATLANTICCOLLEGE AND CAREER READINESS
ATLANTIC CITY, NJ 08401-1023ATLANTIC CITY
CHELSEA HEIGHTS SCHOOL
State of New Jersey
PK-08GRADE SPAN
2014-15
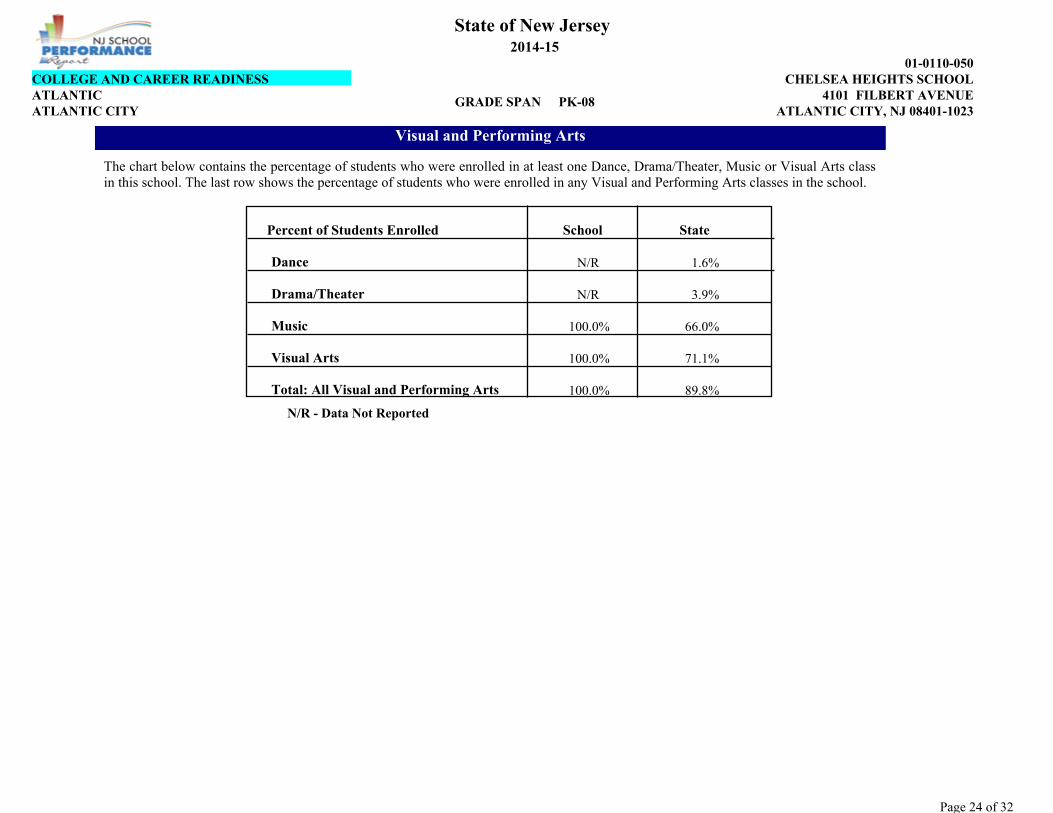
The chart below contains the percentage of students who were enrolled in at least one Dance, Drama/Theater, Music or Visual Arts class in this school. The last row shows the percentage of students who were enrolled in any Visual and Performing Arts classes in the school.
Visual and Performing Arts
N/R - Data Not Reported
Percent of Students Enrolled
Dance
Drama/Theater
Music
Visual Arts
School State
1.6%
3.9%
66.0%
71.1%
89.8%
N/R
N/R
100.0%
100.0%
100.0%Total: All Visual and Performing Arts
4.00
5.00
Page 25 of 32
4101 FILBERT AVENUE
01-0110-050
ATLANTICATLANTIC CITY, NJ 08401-1023ATLANTIC CITY
CHELSEA HEIGHTS SCHOOLSTUDENT GROWTH
State of New Jersey
PK-08GRADE SPAN
2014-15
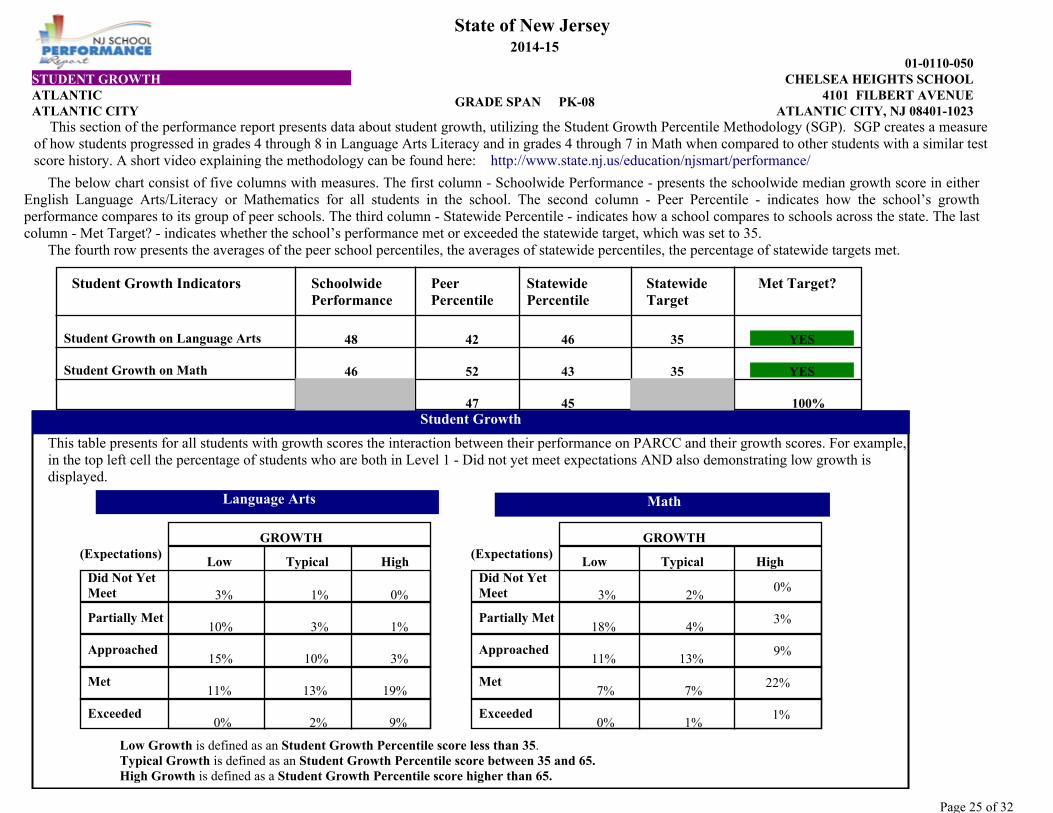
The below chart consist of five columns with measures. The first column - Schoolwide Performance - presents the schoolwide median growth score in either English Language Arts/Literacy or Mathematics for all students in the school. The second column - Peer Percentile - indicates how the school’s growth performance compares to its group of peer schools. The third column - Statewide Percentile - indicates how a school compares to schools across the state. The last column - Met Target? - indicates whether the school’s performance met or exceeded the statewide target, which was set to 35.
The fourth row presents the averages of the peer school percentiles, the averages of statewide percentiles, the percentage of statewide targets met.
This section of the performance report presents data about student growth, utilizing the Student Growth Percentile Methodology (SGP). SGP creates a measure of how students progressed in grades 4 through 8 in Language Arts Literacy and in grades 4 through 7 in Math when compared to other students with a similar test score history. A short video explaining the methodology can be found here: http://www.state.nj.us/education/njsmart/performance/
This table presents for all students with growth scores the interaction between their performance on PARCC and their growth scores. For example, in the top left cell the percentage of students who are both in Level 1 - Did not yet meet expectations AND also demonstrating low growth is displayed.
Low Growth is defined as an Student Growth Percentile score less than 35.Typical Growth is defined as an Student Growth Percentile score between 35 and 65.High Growth is defined as a Student Growth Percentile score higher than 65.
4547
48
46
42
52
46
43
YES
YES
100%
35
35
Met Target?Statewide Target
Peer Percentile
Statewide Percentile
Schoolwide Performance
Student Growth on Math
Student Growth on Language Arts
Student Growth Indicators
Student Growth
Math Language Arts
GROWTH GROWTH
15% 10% 3%
0%1%3%
9%13%11%
4%3%
18%
0%2%3%
HighTypicalLowDid Not Yet Meet
Approached
Low Typical(Expectations)
Approached
Partially Met10% 3% 1%
11% 13% 7% 7%22%
19%
Partially Met
Met
(Expectations)
Met
Did Not Yet Meet
0% 2% 9% 0% 1%1%Exceeded Exceeded
High
Page 26 of 32
4101 FILBERT AVENUE
01-0110-050
ATLANTICWITHIN SCHOOL ACHIEVEMENT GAP
ATLANTIC CITY, NJ 08401-1023ATLANTIC CITY
CHELSEA HEIGHTS SCHOOL
State of New Jersey
PK-08GRADE SPAN
2014-15
Grade Level - 03 Grade Level - 03
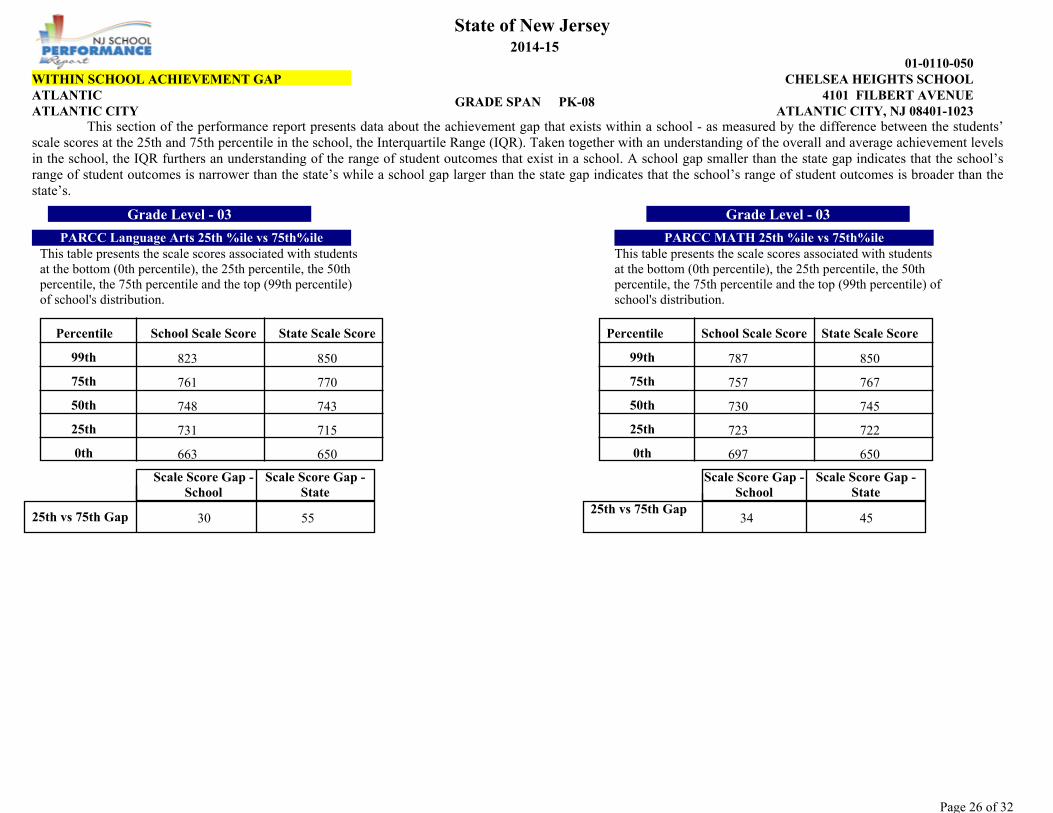
This section of the performance report presents data about the achievement gap that exists within a school - as measured by the difference between the students’ scale scores at the 25th and 75th percentile in the school, the Interquartile Range (IQR). Taken together with an understanding of the overall and average achievement levels in the school, the IQR furthers an understanding of the range of student outcomes that exist in a school. A school gap smaller than the state gap indicates that the school’s range of student outcomes is narrower than the state’s while a school gap larger than the state gap indicates that the school’s range of student outcomes is broader than the state’s.
PARCC Language Arts 25th %ile vs 75th%ile PARCC MATH 25th %ile vs 75th%ileThis table presents the scale scores associated with students at the bottom (0th percentile), the 25th percentile, the 50th percentile, the 75th percentile and the top (99th percentile) of school's distribution.
This table presents the scale scores associated with students at the bottom (0th percentile), the 25th percentile, the 50th percentile, the 75th percentile and the top (99th percentile) of school's distribution.
30 3455 45
663
731
748
761
823 787
757
730
723
697650
715
743
770
850
650
722
745
767
850
0th
25th
50th
75th
99th
Percentile
0th
25th
50th
75th
99th
Scale Score Gap - State
25th vs 75th Gap
Scale Score Gap - State
State Scale Score
Scale Score Gap - School
25th vs 75th Gap
Scale Score Gap - School
Percentile School Scale Score School Scale Score State Scale Score

Page 27 of 32
4101 FILBERT AVENUE
01-0110-050
ATLANTICWITHIN SCHOOL ACHIEVEMENT GAP
ATLANTIC CITY, NJ 08401-1023ATLANTIC CITY
CHELSEA HEIGHTS SCHOOL
State of New Jersey
PK-08GRADE SPAN
2014-15
Grade Level - 04 Grade Level - 04
Grade Level - 05 Grade Level - 05
PARCC Language Arts 25th %ile vs 75th%ile PARCC MATH 25th %ile vs 75th%ileThis table presents the scale scores associated with students at the bottom (0th percentile), the 25th percentile, the 50th percentile, the 75th percentile and the top (99th percentile) of school's distribution.
This table presents the scale scores associated with students at the bottom (0th percentile), the 25th percentile, the 50th percentile, the 75th percentile and the top (99th percentile) of school's distribution.
41 3445 43
671
726
736
767
819 784
754
741
720
674650
728
750
773
850
650
721
742
764
850
42 3045 40
703
725
741
767
801 797
759
739
729
696650
728
751
773
850
650
723
743
763
850
0th
25th
50th
75th
99th
Percentile
0th
25th
50th
75th
99th
Scale Score Gap - State
25th vs 75th Gap
Scale Score Gap - State
State Scale Score
0th
25th
50th
75th
99th
Percentile
0th
25th
50th
75th
99th
Scale Score Gap - State
25th vs 75th Gap
Scale Score Gap - State
State Scale Score
Scale Score Gap - School
25th vs 75th Gap
Scale Score Gap - School
Scale Score Gap - School
25th vs 75th Gap
Scale Score Gap - School
Percentile School Scale Score School Scale Score State Scale Score
Percentile School Scale Score School Scale Score State Scale Score
Page 28 of 32
4101 FILBERT AVENUE
01-0110-050
ATLANTICWITHIN SCHOOL ACHIEVEMENT GAP
ATLANTIC CITY, NJ 08401-1023ATLANTIC CITY
CHELSEA HEIGHTS SCHOOL
State of New Jersey
PK-08GRADE SPAN
2014-15
Grade Level - 06 Grade Level - 06
Grade Level - 07 Grade Level - 07
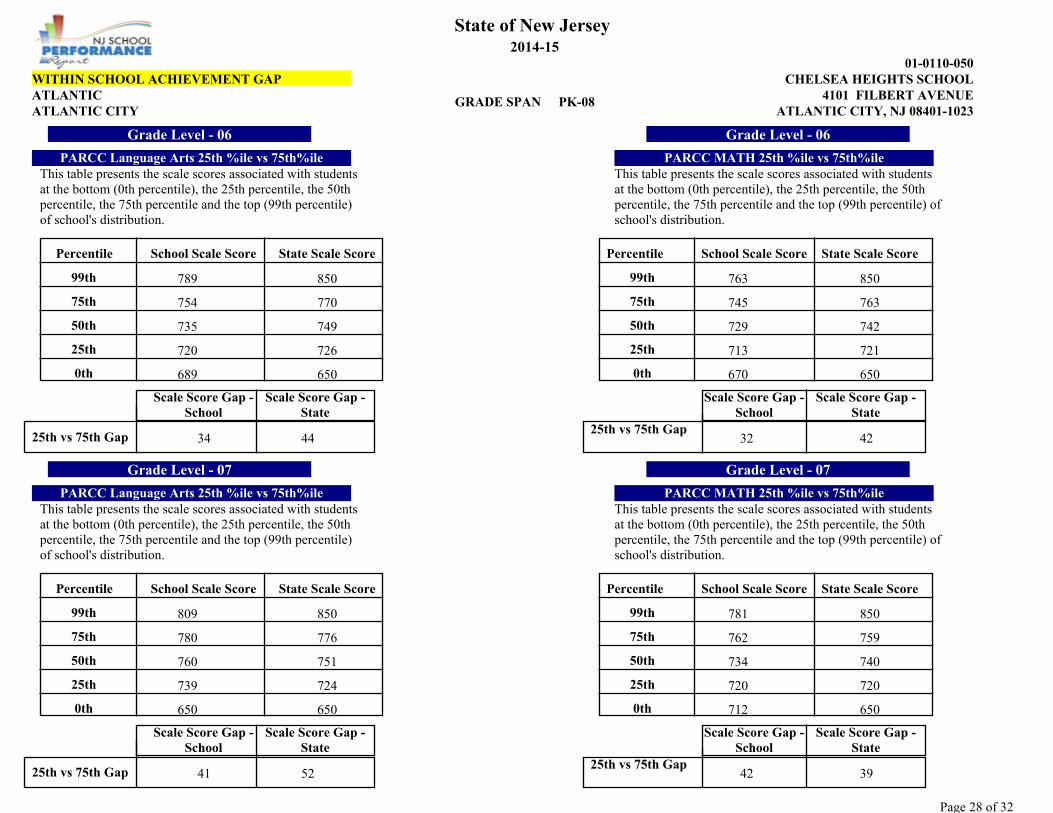
PARCC Language Arts 25th %ile vs 75th%ile PARCC MATH 25th %ile vs 75th%ileThis table presents the scale scores associated with students at the bottom (0th percentile), the 25th percentile, the 50th percentile, the 75th percentile and the top (99th percentile) of school's distribution.
This table presents the scale scores associated with students at the bottom (0th percentile), the 25th percentile, the 50th percentile, the 75th percentile and the top (99th percentile) of school's distribution.
34 3244 42
689
720
735
754
789 763
745
729
713
670650
726
749
770
850
650
721
742
763
850
41 4252 39
650
739
760
780
809 781
762
734
720
712650
724
751
776
850
650
720
740
759
850
0th
25th
50th
75th
99th
Percentile
0th
25th
50th
75th
99th
Scale Score Gap - State
25th vs 75th Gap
Scale Score Gap - State
State Scale Score
0th
25th
50th
75th
99th
Percentile
0th
25th
50th
75th
99th
Scale Score Gap - State
25th vs 75th Gap
Scale Score Gap - State
State Scale Score
Scale Score Gap - School
25th vs 75th Gap
Scale Score Gap - School
Scale Score Gap - School
25th vs 75th Gap
Scale Score Gap - School
Percentile School Scale Score School Scale Score State Scale Score
Percentile School Scale Score School Scale Score State Scale Score
6.00
Page 29 of 32
4101 FILBERT AVENUE
01-0110-050
ATLANTICWITHIN SCHOOL ACHIEVEMENT GAP
ATLANTIC CITY, NJ 08401-1023ATLANTIC CITY
CHELSEA HEIGHTS SCHOOL
State of New Jersey
PK-08GRADE SPAN
2014-15
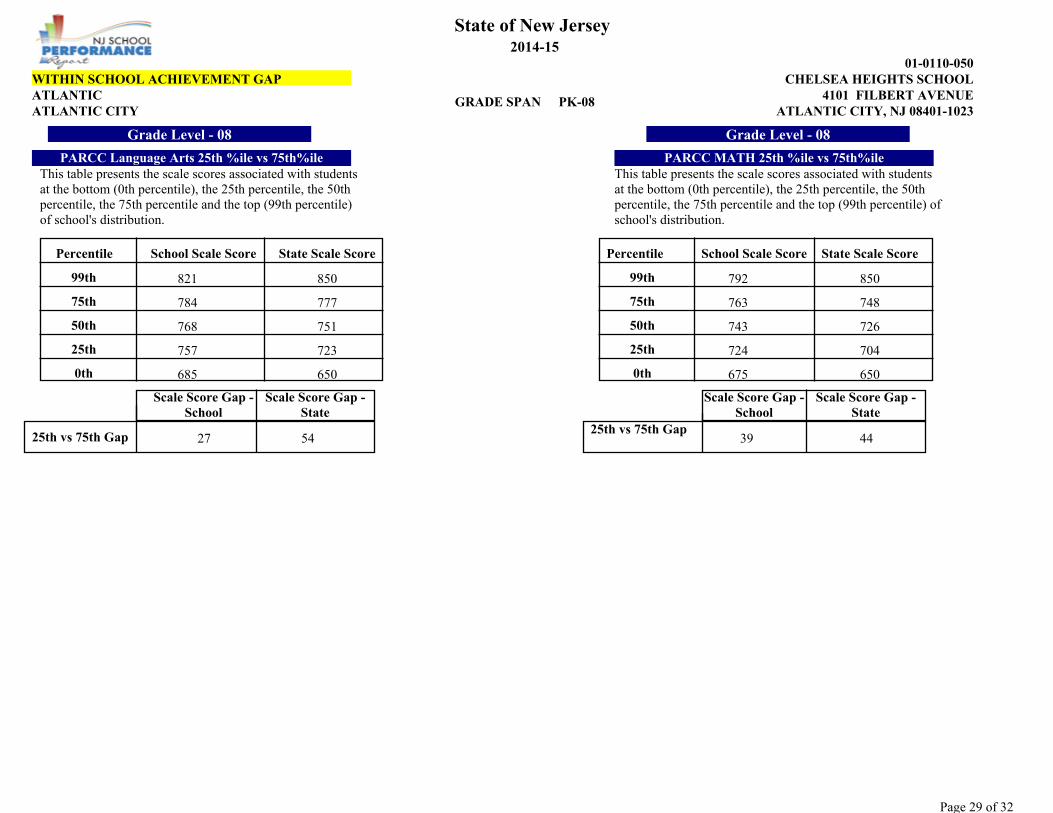
Grade Level - 08 Grade Level - 08
PARCC Language Arts 25th %ile vs 75th%ile PARCC MATH 25th %ile vs 75th%ileThis table presents the scale scores associated with students at the bottom (0th percentile), the 25th percentile, the 50th percentile, the 75th percentile and the top (99th percentile) of school's distribution.
This table presents the scale scores associated with students at the bottom (0th percentile), the 25th percentile, the 50th percentile, the 75th percentile and the top (99th percentile) of school's distribution.
27 3954 44
685
757
768
784
821 792
763
743
724
675650
723
751
777
850
650
704
726
748
850
0th
25th
50th
75th
99th
Percentile
0th
25th
50th
75th
99th
Scale Score Gap - State
25th vs 75th Gap
Scale Score Gap - State
State Scale Score
Scale Score Gap - School
25th vs 75th Gap
Scale Score Gap - School
Percentile School Scale Score School Scale Score State Scale Score
7.00
Page 30 of 32
4101 FILBERT AVENUE
01-0110-050
ATLANTICSCHOOL CLIMATE
ATLANTIC CITY, NJ 08401-1023ATLANTIC CITY
CHELSEA HEIGHTS SCHOOL
State of New Jersey
PK-08GRADE SPAN
2014-15
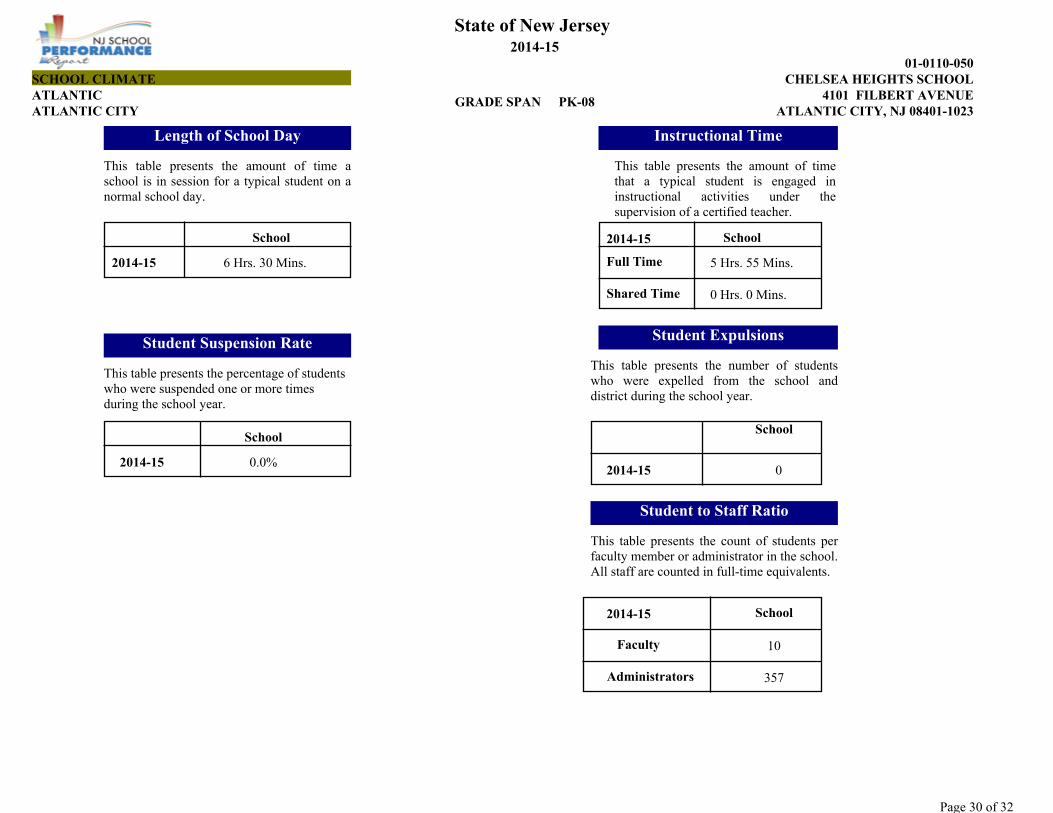
This table presents the amount of time that a typical student is engaged in instructional activities under the supervision of a certified teacher.
Length of School Day Instructional Time
Student Suspension Rate Student Expulsions
Student to Staff Ratio
This table presents the amount of time a school is in session for a typical student on a normal school day.
This table presents the percentage of students who were suspended one or more times during the school year.
This table presents the number of students who were expelled from the school and district during the school year.
This table presents the count of students per faculty member or administrator in the school. All staff are counted in full-time equivalents.
School
School
School
Faculty
Administrators
0.0%
10
357
0
5 Hrs. 55 Mins.
0 Hrs. 0 Mins.
6 Hrs. 30 Mins.2014-15
2014-15
2014-15
2014-15
2014-15
School
Full Time
Shared Time
School

Page 31 of 32
4101 FILBERT AVENUE
01-0110-050
ATLANTICATLANTIC CITY, NJ 08401-1023ATLANTIC CITY
CHELSEA HEIGHTS SCHOOLSCHOOL PEER GROUP
State of New Jersey
PK-08GRADE SPAN
2014-15
SCHOOL NAMEDISTRICT NAMECOUNTY NAME
PK-08ATLANTIC 74% 10.9% 10.4%01-0110-050
PK-08ATLANTIC 78.2% 31% 12.7%01-0110-120
KG-08ATLANTIC 70% 7.3% 16.6%01-4800-055
05-08BERGEN 71.9% 5% 19.5%03-1860-300
KG-08CHARTERS 72.2% 28.6% 15.8%80-6635-930
KG-08CHARTERS 71.5% 1.3% 5.1%80-7730-970
06-08ESSEX 72.7% 5.6% 17.9%13-1210-070
PK-08ESSEX 77.4% 24.4% 11.9%13-3570-200
PK-08ESSEX 77.6% 21.7% 6.4%13-3570-570
PK-08ESSEX 81.2% 34% 10.9%13-3570-590
KG-08ESSEX 75.9% 12.9% 11.8%13-3570-610
KG-08ESSEX 77.1% 22.5% 10.4%13-3570-750
06-08HUDSON 72.5% 1.5% 8.8%17-2390-095
PK-08HUDSON 74.9% 7.2% 8.8%17-2390-350
01-08HUDSON 71% 5.1% 16.3%17-3610-060
KG-08HUDSON 72.1% 19.7% 8.7%17-3610-110
PK-08HUDSON 71.4% 1.9% 1.9%17-5240-140
06-08MIDDLESEX 72.1% 3.2% 9.4%23-0750-055
05-08MIDDLESEX 73.9% 10.2% 11.3%23-4090-150
05-08MIDDLESEX 73.9% 19.5% 8.5%23-4090-140
06-08PASSAIC 70.6% 6.8% 11.5%31-0900-035
KG-08PASSAIC 74% 10% 13.2%31-4010-240
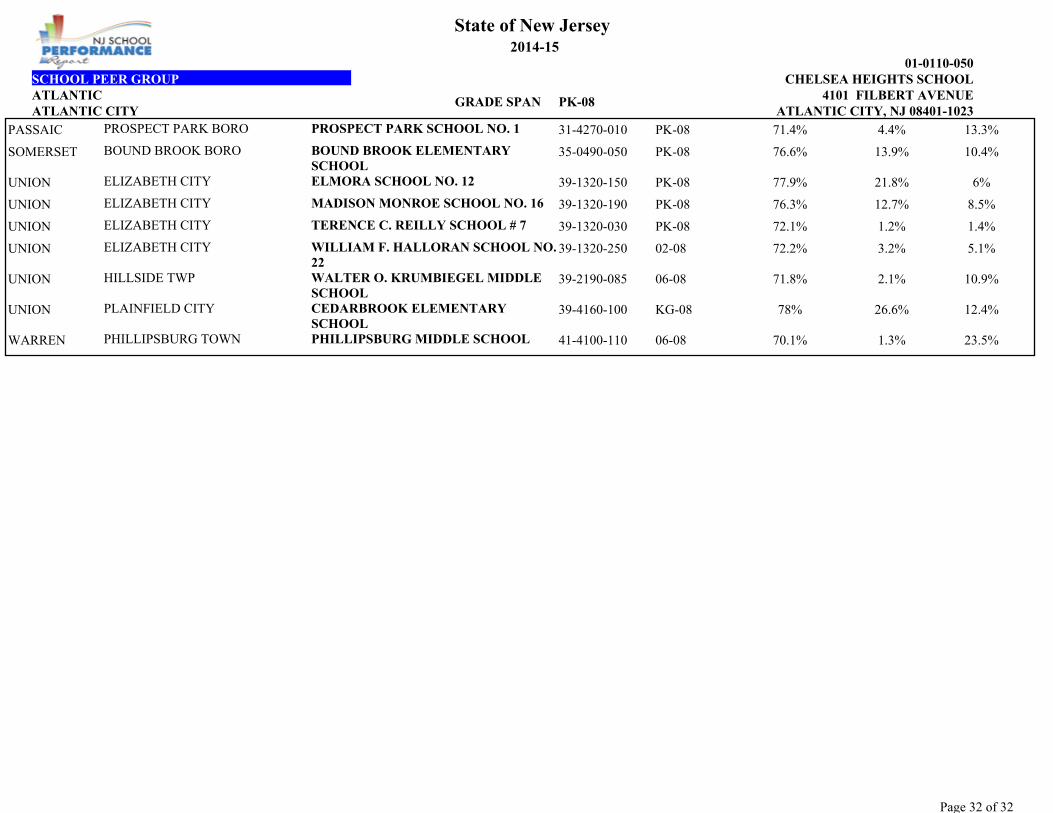
This table presents the list of peer schools in alphabetical order by county name that was created specifically for this school (highlighted in yellow). Peer schools are drawn from across the state and represent schools that have similar grade configurations and that are educating students of similar demographic characteristics, as measured by enrollment in Free/Reduced Lunch Programs, Limited English Proficiency or Special Education Programs.
GRADESPANECONOMICALLY DISADVANTAGED
SPECIAL EDUCATION
CHELSEA HEIGHTS SCHOOLATLANTIC CITY
RICHMOND AVENUE SCHOOLATLANTIC CITY
JORDAN ROAD ELEMENTARY SCHOOL
SOMERS POINT CITY
HACKENSACK MIDDLE SCHOOLHACKENSACK CITY
GREATER BRUNSWICK CHARTER SCHOOL
GREATER BRUNSWICK CS
ROBERT TREAT ACADEMY CHARTER SCHOOL
ROBERT TREAT ACADEMY CS
JOHN L. COSTLEY MIDDLE SCHOOLEAST ORANGE
ANN STREET SCHOOLNEWARK CITY
MT VERNON PLACE SCHOOLNEWARK CITY
OLIVER STREET SCHOOLNEWARK CITY
RIDGE STREET SCHOOLNEWARK CITY
WILSON AVENUE SCHOOLNEWARK CITY
ACADEMY IJERSEY CITY
JAMES F. MURRAY SCHOOLJERSEY CITY
FRANKLIN ELEMENTARY SCHOOLNORTH BERGEN TWP
ROBERT FULTON ELEMENTARY SCHOOL
NORTH BERGEN TWP
WOODROW WILSON ELEMENTARY SCHOOL
UNION CITY
CARTERET MIDDLE SCHOOLCARTERET BORO
SAMUEL E. SHULL MIDDLE SCHOOLPERTH AMBOY CITY
WILLIAM C. MCGINNIS MIDDLE SCHOOL
PERTH AMBOY CITY
CHRISTOPHER COLUMBUS MIDDLE SCHOOL
CLIFTON CITY
SCHOOL 20PATERSON CITY
ENGLISH LANGUAGE LEARNERS
CDS CODE
Page 32 of 32
4101 FILBERT AVENUE
01-0110-050
ATLANTICATLANTIC CITY, NJ 08401-1023ATLANTIC CITY
CHELSEA HEIGHTS SCHOOLSCHOOL PEER GROUP
State of New Jersey
PK-08GRADE SPAN
2014-15
PK-08PASSAIC 71.4% 4.4% 13.3%31-4270-010
PK-08SOMERSET 76.6% 13.9% 10.4%35-0490-050
PK-08UNION 77.9% 21.8% 6%39-1320-150
PK-08UNION 76.3% 12.7% 8.5%39-1320-190
PK-08UNION 72.1% 1.2% 1.4%39-1320-030
02-08UNION 72.2% 3.2% 5.1%39-1320-250
06-08UNION 71.8% 2.1% 10.9%39-2190-085
KG-08UNION 78% 26.6% 12.4%39-4160-100
06-08WARREN 70.1% 1.3% 23.5%41-4100-110
PROSPECT PARK SCHOOL NO. 1PROSPECT PARK BORO
BOUND BROOK ELEMENTARY SCHOOL
BOUND BROOK BORO
ELMORA SCHOOL NO. 12ELIZABETH CITY
MADISON MONROE SCHOOL NO. 16ELIZABETH CITY
TERENCE C. REILLY SCHOOL # 7ELIZABETH CITY
WILLIAM F. HALLORAN SCHOOL NO.22
ELIZABETH CITY
WALTER O. KRUMBIEGEL MIDDLE SCHOOL
HILLSIDE TWP
CEDARBROOK ELEMENTARY SCHOOL
PLAINFIELD CITY
PHILLIPSBURG MIDDLE SCHOOLPHILLIPSBURG TOWN