Embed Size (px)
Citation preview
MANAGEMENTCONSULTING
THROUGHSCIENCE
EIU CANBACKBoston, Massachusetts
42.365869, -71.093471www.canback.com
+1-617-399-1300
CHEESE IN CHINA: UNCOVERING UNTAPPED MARKET POTENTIAL
Case Example
June 2016
2
EIU Canback is an elite management consulting firm
anchored in science, predictive analytics, and consumer
market knowledge.
We serve clients through five practices: Strategy, M&A Due
Diligence, Growth, Operations, and Organizational
Performance.
We operate globally with the world’s largest companies as
clients. This has taken us to 77 countries since our
founding in 2004.
We also offer analytic services with the Canback Global
Income Distribution Database (C-GIDD) as our cardinal
product.
EIU Canback is a subsidiary of The Economist Group since
2015.
BOSTON CHICAGO LONDON DUBAI JOHANNESBURG BEIJING SHANGHAI SINGAPORE
MEXICO CITY SAO PAULO JAKARTA TOKYO
3
Agenda
Introduction and project background
Approach and analysis
Recommendations and outcomes
4
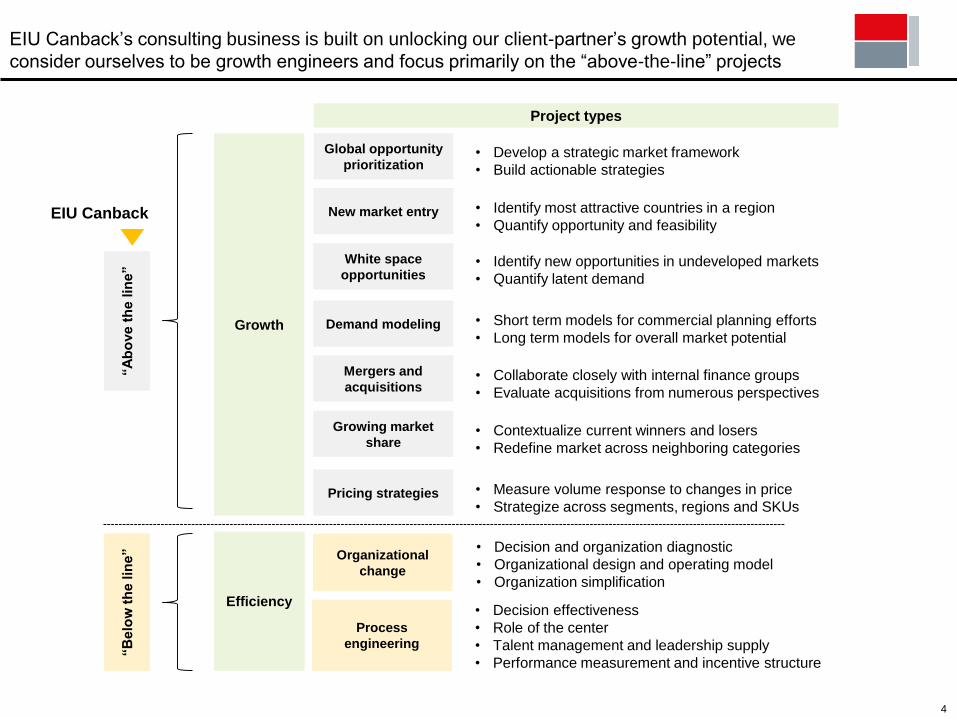
EIU Canback’s consulting business is built on unlocking our client-partner’s growth potential, we
consider ourselves to be growth engineers and focus primarily on the “above-the-line” projects
Growth
Efficiency
• Identify most attractive countries in a region
• Quantify opportunity and feasibility
• Identify new opportunities in undeveloped markets
• Quantify latent demand
• Short term models for commercial planning efforts
• Long term models for overall market potential
• Collaborate closely with internal finance groups
• Evaluate acquisitions from numerous perspectives
• Contextualize current winners and losers
• Redefine market across neighboring categories
• Measure volume response to changes in price
• Strategize across segments, regions and SKUs
• Develop a strategic market framework
• Build actionable strategies
Global opportunity
prioritization
New market entry
White space
opportunities
Demand modeling
Mergers and
acquisitions
Growing market
share
Pricing strategies
Project types
• Decision and organization diagnostic
• Organizational design and operating model
• Organization simplification
Organizational
change
“A
bo
ve
th
e lin
e”
“B
elo
w t
he
lin
e”
EIU Canback
Process
engineering
• Decision effectiveness
• Role of the center
• Talent management and leadership supply
• Performance measurement and incentive structure
Efficiency
Process
engineering
“B
elo
w t
he
lin
e”
Efficiency
Process
engineering
5
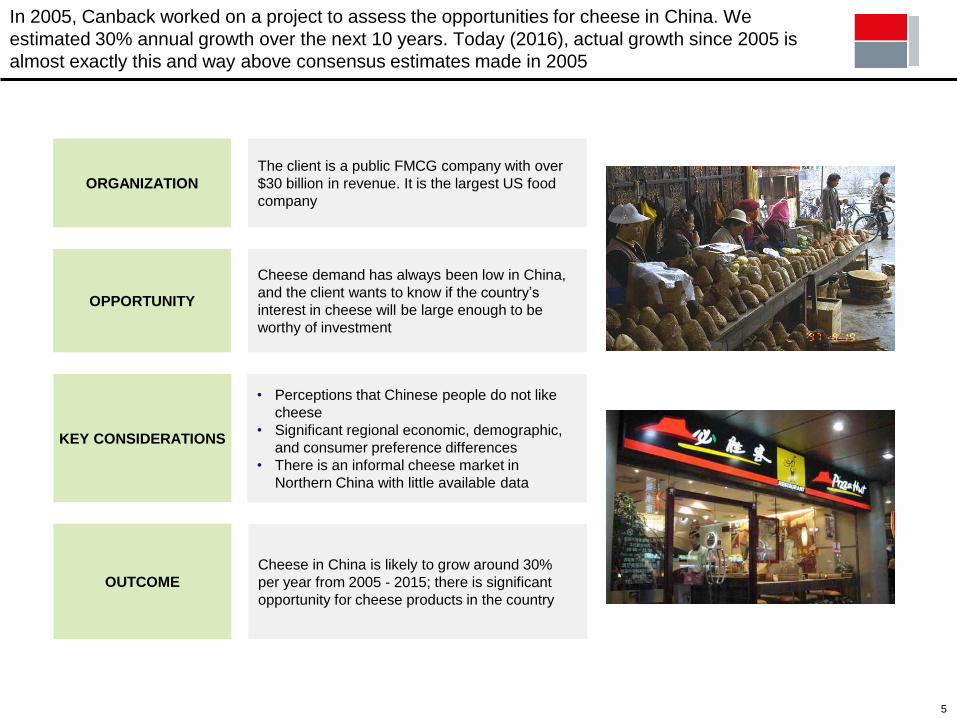
OPPORTUNITY
In 2005, Canback worked on a project to assess the opportunities for cheese in China. We
estimated 30% annual growth over the next 10 years. Today (2016), actual growth since 2005 is
almost exactly this and way above consensus estimates made in 2005
Cheese demand has always been low in China,
and the client wants to know if the country’s
interest in cheese will be large enough to be
worthy of investment
KEY CONSIDERATIONS
• Perceptions that Chinese people do not like
cheese
• Significant regional economic, demographic,
and consumer preference differences
• There is an informal cheese market in
Northern China with little available data
OUTCOME
Cheese in China is likely to grow around 30%
per year from 2005 - 2015; there is significant
opportunity for cheese products in the country
ORGANIZATION
The client is a public FMCG company with over
$30 billion in revenue. It is the largest US food
company
6
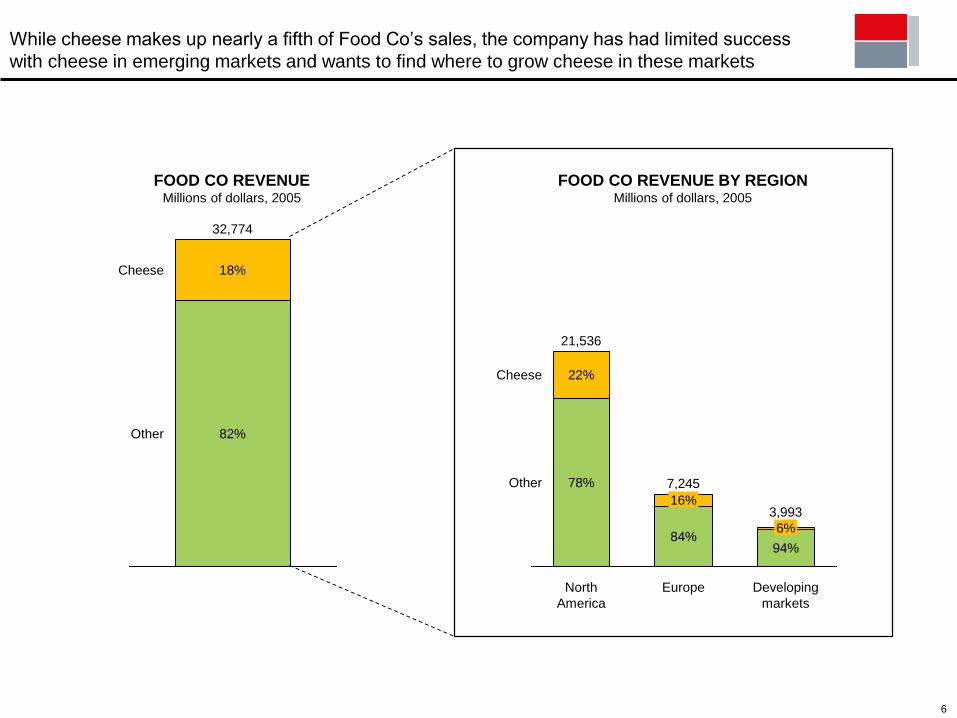
While cheese makes up nearly a fifth of Food Co’s sales, the company has had limited success
with cheese in emerging markets and wants to find where to grow cheese in these markets
Developing
markets
16%
Europe
3,993
84%
North
America
7,245
6%
94%
22%
Other
21,536
78%
Cheese
FOOD CO REVENUEMillions of dollars, 2005
Cheese
Other
32,774
18%
82%
FOOD CO REVENUE BY REGIONMillions of dollars, 2005
7
Agenda
Introduction and project background
Approach and analysis
Recommendations and outcomes
8
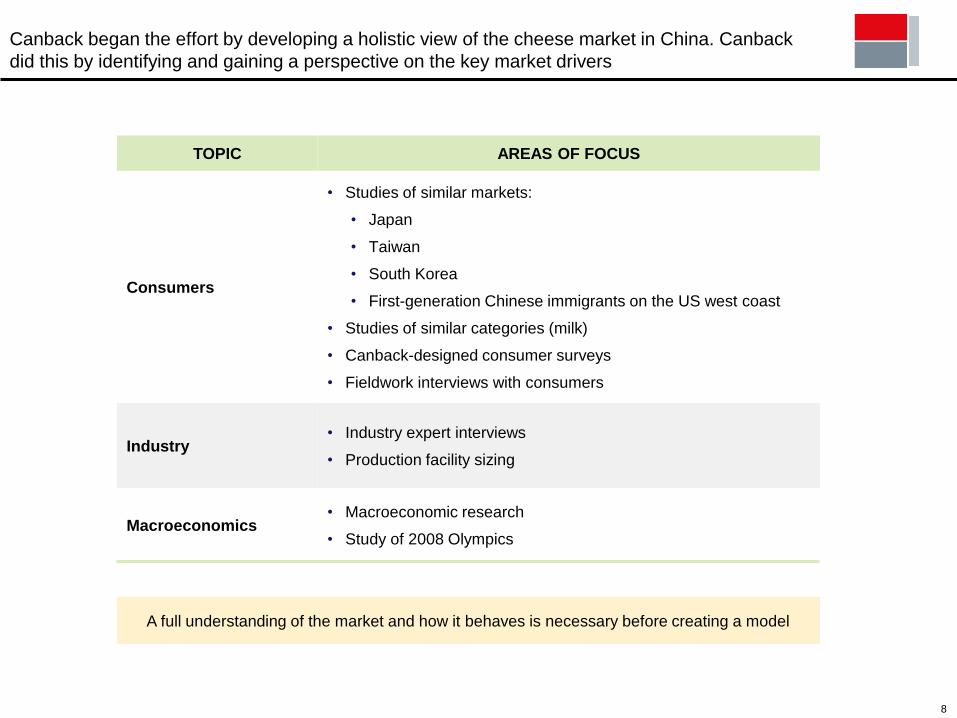
Canback began the effort by developing a holistic view of the cheese market in China. Canback
did this by identifying and gaining a perspective on the key market drivers
TOPIC AREAS OF FOCUS
Consumers
• Studies of similar markets:
• Japan
• Taiwan
• South Korea
• First-generation Chinese immigrants on the US west coast
• Studies of similar categories (milk)
• Canback-designed consumer surveys
• Fieldwork interviews with consumers
Industry• Industry expert interviews
• Production facility sizing
Macroeconomics• Macroeconomic research
• Study of 2008 Olympics
A full understanding of the market and how it behaves is necessary before creating a model
9
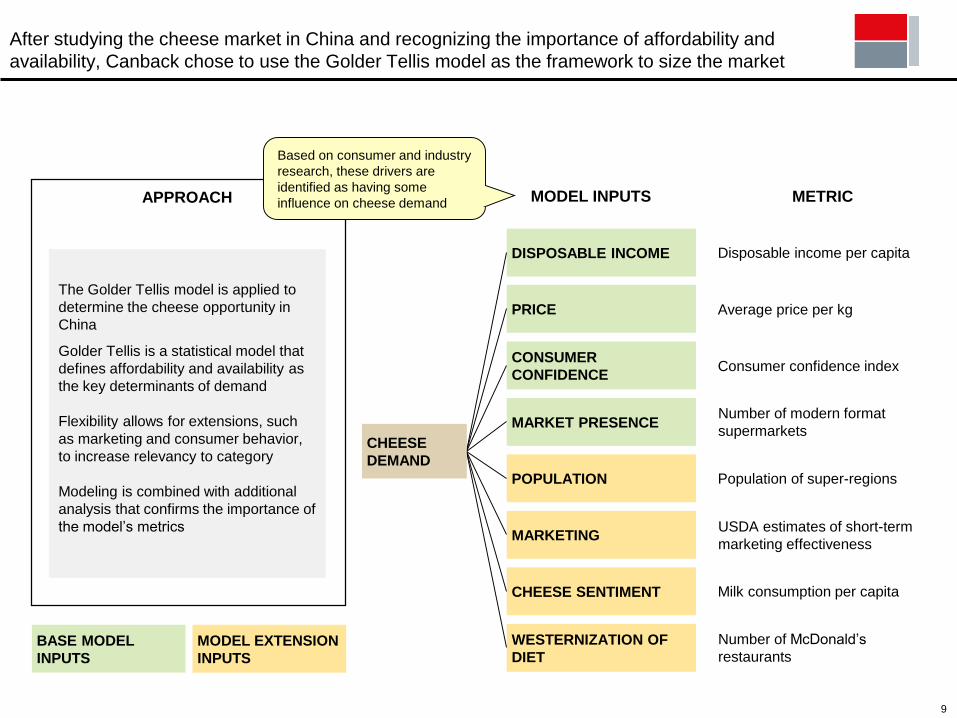
After studying the cheese market in China and recognizing the importance of affordability and
availability, Canback chose to use the Golder Tellis model as the framework to size the market
MARKET PRESENCE
CONSUMER
CONFIDENCE
PRICE
DISPOSABLE INCOME
MODEL INPUTS
WESTERNIZATION OF
DIET
CHEESE SENTIMENT
MARKETING
POPULATION
CHEESE
DEMAND
The Golder Tellis model is applied to
determine the cheese opportunity in
China
Golder Tellis is a statistical model that
defines affordability and availability as
the key determinants of demand
Flexibility allows for extensions, such
as marketing and consumer behavior,
to increase relevancy to category
Modeling is combined with additional
analysis that confirms the importance of
the model’s metrics
Consumer confidence index
Average price per kg
Disposable income per capita
Number of modern format
supermarkets
USDA estimates of short-term
marketing effectiveness
Population of super-regions
Number of McDonald’s
restaurants
Milk consumption per capita
METRIC
BASE MODEL
INPUTS
MODEL EXTENSION
INPUTS
APPROACH
Based on consumer and industry
research, these drivers are
identified as having some
influence on cheese demand
10
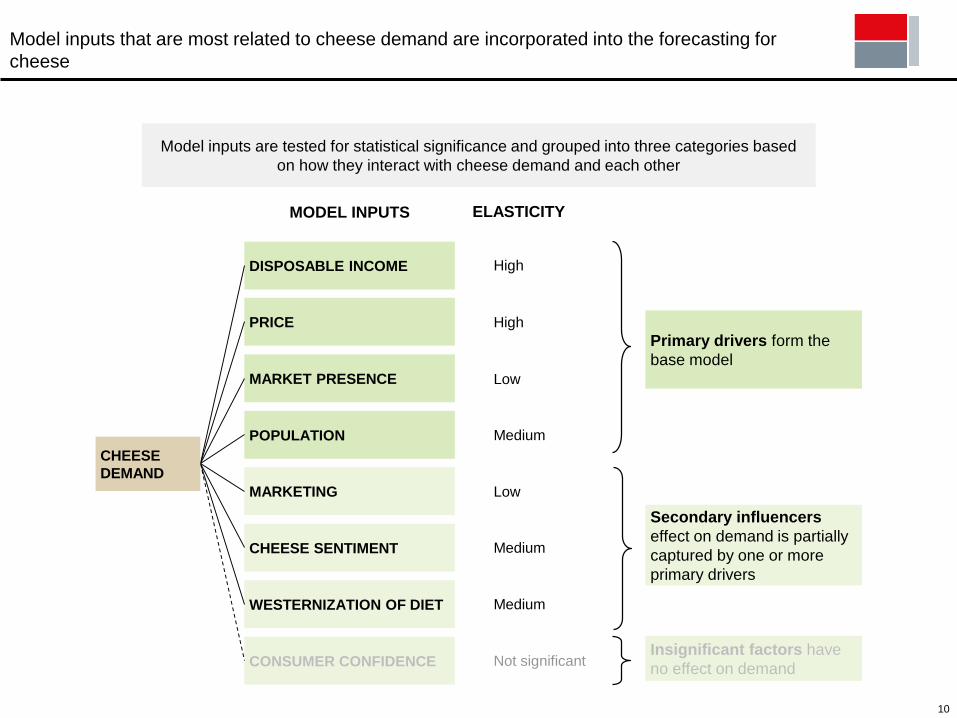
Model inputs that are most related to cheese demand are incorporated into the forecasting for
cheese
ELASTICITY
Low
Not significant
High
High
Medium
Medium
Low
Medium
Primary drivers form the
base model
Secondary influencers
effect on demand is partially
captured by one or more
primary drivers
Insignificant factors have
no effect on demand
POPULATION
MARKET PRESENCE
PRICE
DISPOSABLE INCOME
CONSUMER CONFIDENCE
WESTERNIZATION OF DIET
CHEESE SENTIMENT
MARKETING
CHEESE
DEMAND
Model inputs are tested for statistical significance and grouped into three categories based
on how they interact with cheese demand and each other
MODEL INPUTS
11
100
150
200
250
300
350
400
450
500
550
600
1980 1985 1990 1995 2000 2005
100
105
110
115
120
125
130
1980 1985 1990 1995 2000 2005
100
120
140
160
180
200
220
240
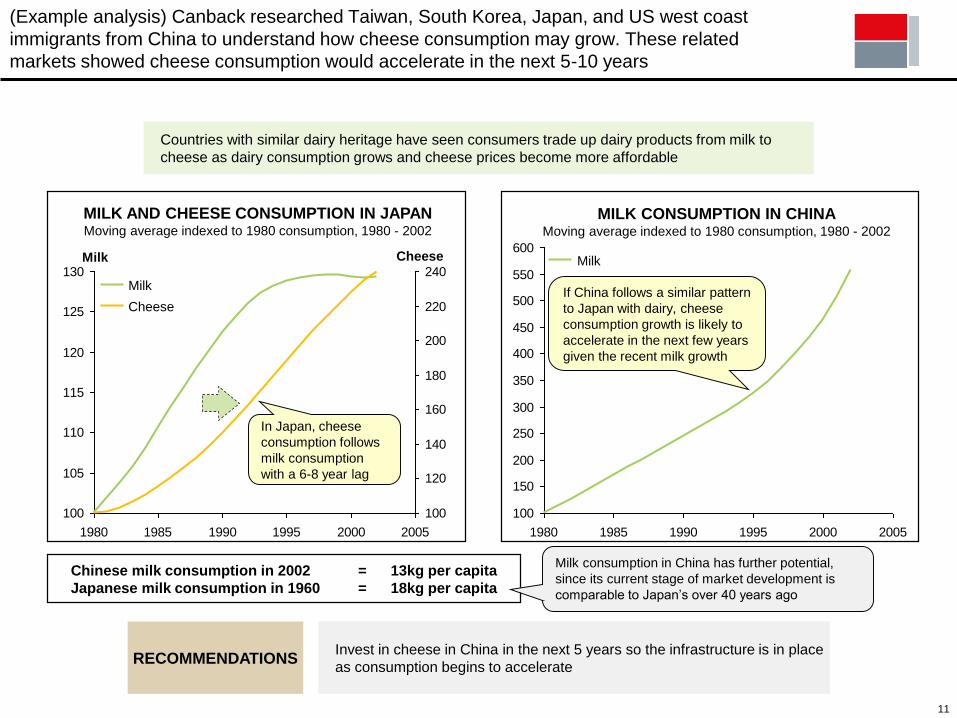
(Example analysis) Canback researched Taiwan, South Korea, Japan, and US west coast
immigrants from China to understand how cheese consumption may grow. These related
markets showed cheese consumption would accelerate in the next 5-10 years
Cheese
Milk
Milk
MILK AND CHEESE CONSUMPTION IN JAPANMoving average indexed to 1980 consumption, 1980 - 2002
MILK CONSUMPTION IN CHINAMoving average indexed to 1980 consumption, 1980 - 2002
Chinese milk consumption in 2002 = 13kg per capita
Japanese milk consumption in 1960 = 18kg per capita
Milk consumption in China has further potential,
since its current stage of market development is
comparable to Japan’s over 40 years ago
Countries with similar dairy heritage have seen consumers trade up dairy products from milk to
cheese as dairy consumption grows and cheese prices become more affordable
If China follows a similar pattern
to Japan with dairy, cheese
consumption growth is likely to
accelerate in the next few years
given the recent milk growth
RECOMMENDATIONSInvest in cheese in China in the next 5 years so the infrastructure is in place
as consumption begins to accelerate
Milk Cheese
In Japan, cheese
consumption follows
milk consumption
with a 6-8 year lag
12
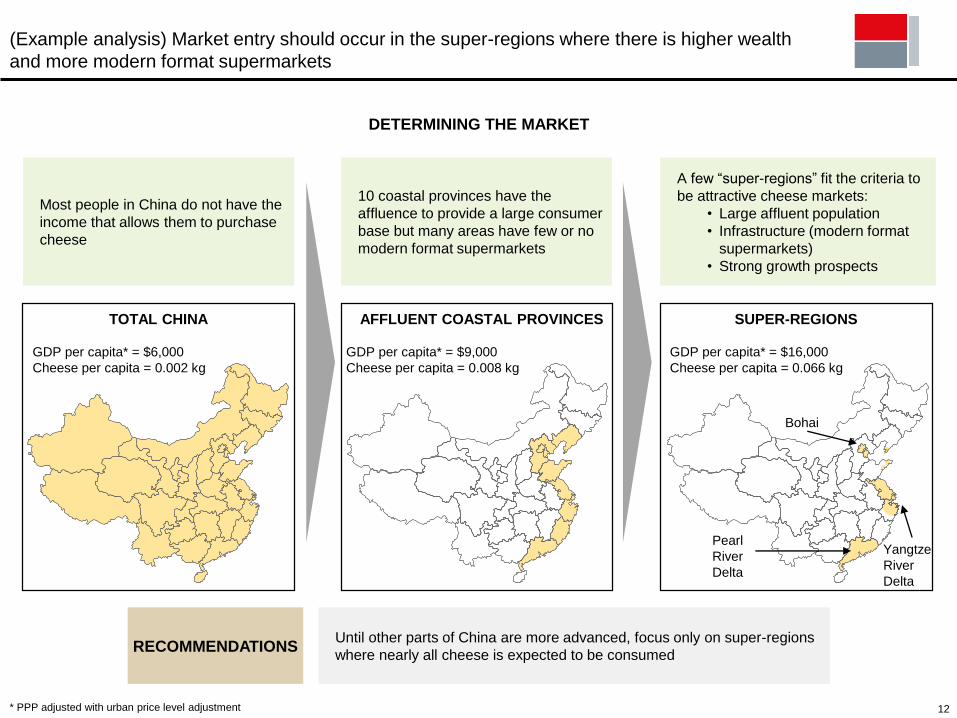
(Example analysis) Market entry should occur in the super-regions where there is higher wealth
and more modern format supermarkets
Most people in China do not have the
income that allows them to purchase
cheese
TOTAL CHINA
GDP per capita* = $6,000
Cheese per capita = 0.002 kg
AFFLUENT COASTAL PROVINCES
GDP per capita* = $9,000
Cheese per capita = 0.008 kg
SUPER-REGIONS
GDP per capita* = $16,000
Cheese per capita = 0.066 kg
Pearl
River
Delta
Yangtze
River
Delta
Bohai
* PPP adjusted with urban price level adjustment
10 coastal provinces have the
affluence to provide a large consumer
base but many areas have few or no
modern format supermarkets
A few “super-regions” fit the criteria to
be attractive cheese markets:
• Large affluent population
• Infrastructure (modern format
supermarkets)
• Strong growth prospects
DETERMINING THE MARKET
RECOMMENDATIONSUntil other parts of China are more advanced, focus only on super-regions
where nearly all cheese is expected to be consumed
13
Agenda
Introduction and project background
Approach and analysis
Recommendations and outcomes
14
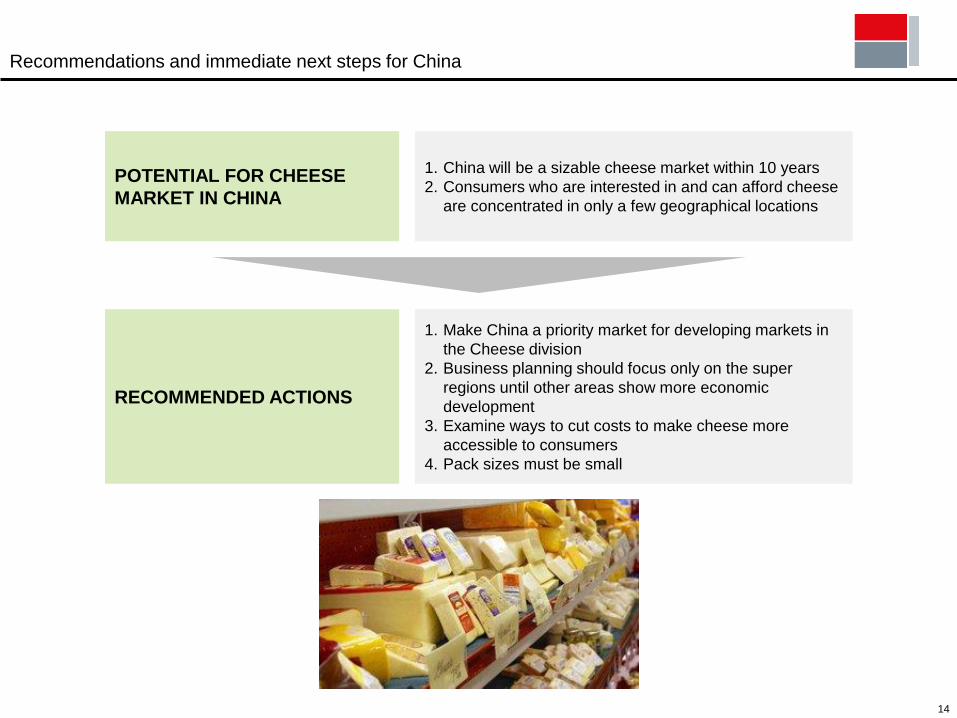
Recommendations and immediate next steps for China
POTENTIAL FOR CHEESE
MARKET IN CHINA
1. China will be a sizable cheese market within 10 years
2. Consumers who are interested in and can afford cheese
are concentrated in only a few geographical locations
RECOMMENDED ACTIONS
1. Make China a priority market for developing markets in
the Cheese division
2. Business planning should focus only on the super
regions until other areas show more economic
development
3. Examine ways to cut costs to make cheese more
accessible to consumers
4. Pack sizes must be small
15
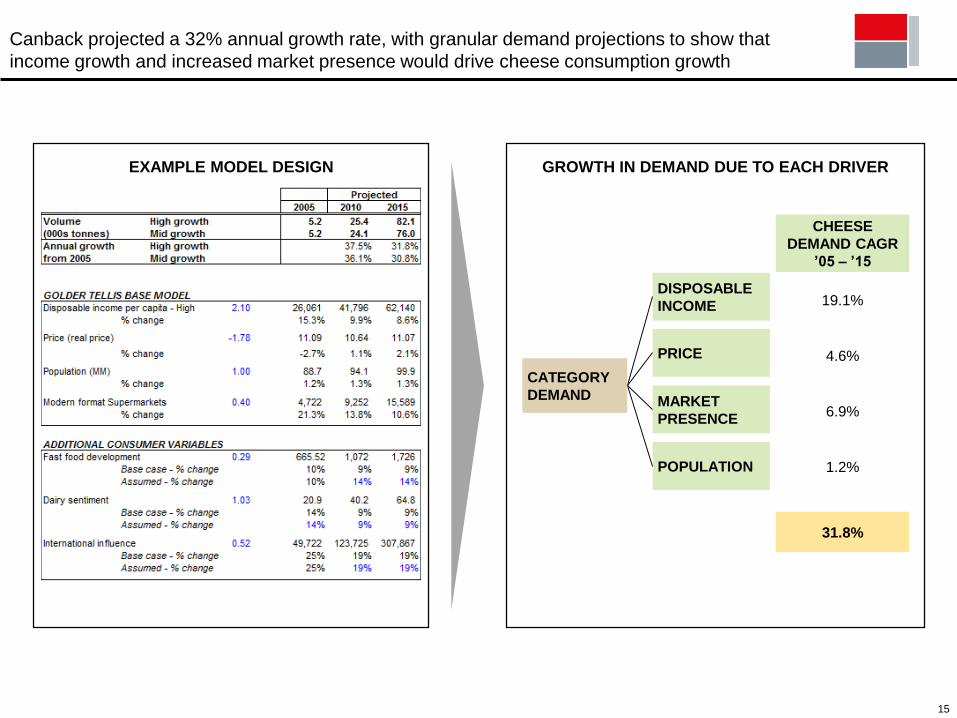
Canback projected a 32% annual growth rate, with granular demand projections to show that
income growth and increased market presence would drive cheese consumption growth
CHEESE
DEMAND CAGR
’05 – ’15
19.1%
4.6%
6.9%
1.2%
31.8%
GROWTH IN DEMAND DUE TO EACH DRIVER
POPULATION
MARKET
PRESENCE
PRICE
DISPOSABLE
INCOME
CATEGORY
DEMAND
EXAMPLE MODEL DESIGN
16
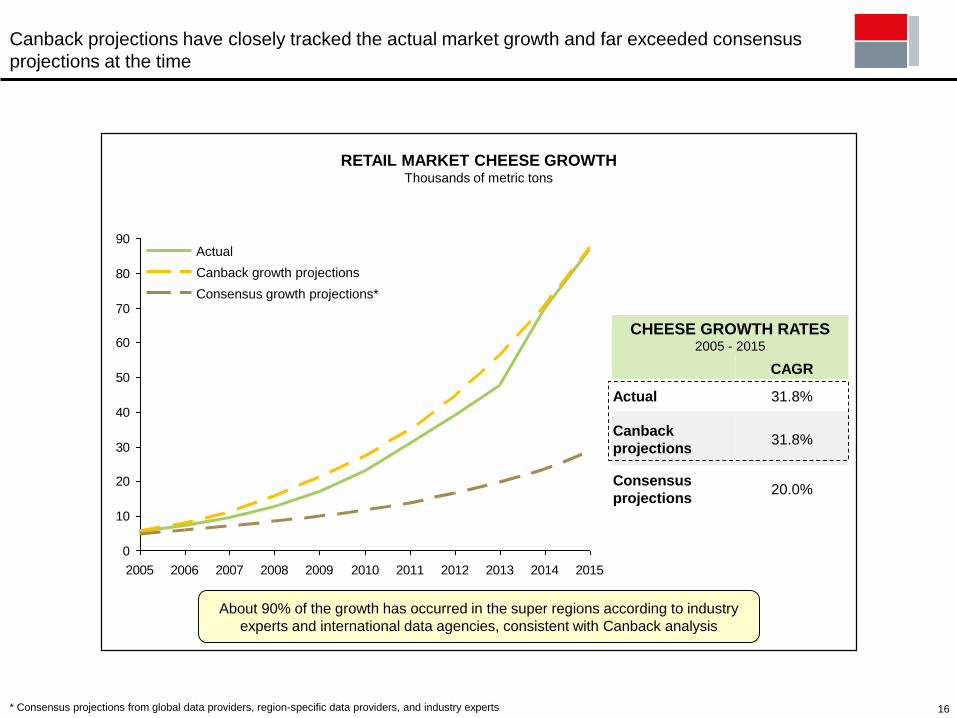
Canback projections have closely tracked the actual market growth and far exceeded consensus
projections at the time
* Consensus projections from global data providers, region-specific data providers, and industry experts
RETAIL MARKET CHEESE GROWTHThousands of metric tons
0
10
20
30
40
50
60
70
80
90
2005 2006 2007 2008 2009 2010 2011 2012 2013 2014 2015
Actual
Consensus growth projections*
Canback growth projections
About 90% of the growth has occurred in the super regions according to industry
experts and international data agencies, consistent with Canback analysis
CHEESE GROWTH RATES2005 - 2015
CAGR
Actual 31.8%
Canback
projections31.8%
Consensus
projections20.0%
17
Canback found a growth opportunity during a product’s infancy, finding a new $500 million
market in just a decade
Canback was asked to evaluate whether cheese in
China would be worthy of investment
Canback showed that cheese in China was a
worthwhile investment in 2005, and in doing so:
• Found a $500 million ten-year opportunity that
experts had not recognized
• Accurately projected the size of the market in
2015
• Identified the three key regions where nearly
all growth would occur
18
Canback contact information
AMERICAS
Boston EIU Canback, Inc.
210 Broadway, Suite 303
Cambridge MA 02139
+1-617-399-1300
Irina Blinova
Mexico City Canback Mexico
Bosque de Ciruelos 194, PH3
Bosques de las Lomas
11700 Ciudad de México, D.F.
+52-55-4164-8500
+52-155-4354-9806
Francisco Maciel Morfin
Chicago EIU Canback USA
500 N. Michigan Ave.
Suite 1925
Chicago IL 60611
+1-312-853-3716 or 3823
Tom Andrews
Maureen Lanigan
Sao Paulo EIU Canback Brazil
Av. Brigadeiro Faria Lima, 3144
3º andar Jardim Paulistano
São Paulo, 01451-000
+55-11-3845 4767
Marcio Zanetti
EUROPE
London EIU Canback Europe
20 Cabot Square
London E14 4QW
+44-20-7576-8181
Chris Pearce
Asif Chaudhary
MIDDLE EAST AND AFRICA
Dubai EIU Canback MENA
Aurora Tower, 13th Floor
Office 1301A, PO Box 450056
Dubai Media City
+971-4433-4202
+971-52-269-8425
Paul Yata
Johannesburg EIU Canback SA (Pty) Ltd
Inanda Greens Business Park
Building 8
54 Wierda Road West
Wierda Valley, Sandton, 2196
+27-83-786 2450
Arshad Abba
ASIA
Beijing EIU Canback China
Unit 1711, 17/F, Block 1
Taikang Financial Tower
38 East 3rd Ring Rd. North
Chaoyang District 100026
+86-10-8571-2188
Alex van [email protected]
Shanghai EIU Canback China
Rm 2508A, 25/F, Rui Jin Bldg
205 Mao Ming South Rd,
Shanghai 200020
+86-21-6473-7128
Seumas [email protected]
Singapore EIU Canback Southeast Asia
8 Cross St, #23-01 PWC Bldg.
Singapore 048424
+65-6534-5177
Vanny Dang
Tokyo EIU Canback Japan
Ginza Wall Building UCF 5F
6-13-16 Ginza
Chuo-ku, Tokyo 104-0061
+81-3-6338-0002
Shin Ito
Jakarta EIU Canback SE Asia
Jl. Tiang Bendera 5 no. 2A
DKI Jakarta 11230
+62-812-8743 7578
Teddy Purnomo