Embed Size (px)
Citation preview

Delivering transformational growthDelivering transformational growth
Charlie SartainChief ExecutiveChief Executive4 October 2012
1
Disclaimer
This document and the presentation are being made only to and directed only at (A) persons who have professional experience in matters relating to investments falling within Article 19(5) of the Financial Services and Markets Act 2000 (Financial Promotion) Order 2005 (the “Order”) or (B) other persons to whom it may otherwise be lawfully communicated (each a “relevant person”). This presentation and its contents are confidential and may not be reproduced, redistributed or y ( p ) p y ppassed on, directly or indirectly, to any other person or published, in whole or in part, for any purpose without the written consent of Xstrata plc (“Xstrata”). This presentation does not constitute or form part of any offer or invitation to sell or issue, or any solicitation of any offer to purchase or subscribe for any securities, or a proposal to make a takeover bid in any jurisdiction. Neither this document nor the fact of its distribution nor the making of the presentation constitutes a recommendation regarding any securities. This presentation is being provided to you for information purposes only.Certain statements, beliefs and opinions contained in this presentation, particularly those regarding the possible or assumed future financial or other performance of Xstrata, industry growth or other trend projections are or may be forward looking statements. Forward-looking statements can be identified by the use of forward-looking terminology, including the terms “believes”, “estimates”, “anticipates”, “expects”, “intends”, “plans”, “goal”, “target”, “aim”, “may”, “will”, “would”, “could” or “should” or in each case their negative or other variations or comparable terminology These forward looking statements include all matters that are not could or should or, in each case, their negative or other variations or comparable terminology. These forward-looking statements include all matters that are not historical facts. By their nature, forward-looking statements involve risks and uncertainties because they relate to events and depend on circumstances that may or may not occur in the future and may be beyond Xstrata’s ability to control or predict. Forward-looking statements are not guarantees of future performance. No representation is made that any of these statements or forecasts will come to pass or that any forecast result will be achieved.Neither Xstrata, nor any of its associates or directors, officers or advisers, provides any representation, assurance or guarantee that the occurrence of the events expressed or implied in any forward-looking statements in this presentation will actually occur. You are cautioned not to place undue reliance on these forward-looking statements.Other than in accordance with its legal or regulatory obligations (including under the UK Listing Rules and the Disclosure and Transparency Rules g g y g g g p yof the Financial Services Authority), Xstrata is not under any obligation and Xstrata expressly disclaims any intention or obligation to update or revise any forward-looking statements, whether as a result of new information, future events or otherwise.This presentation may contain references to “cost curves”. A cost curve is a graphic representation in which the total production volume of a given commodity across the relevant industry is arranged on the basis of average unit costs of production from lowest to highest to permit comparisons of the relative cost positions of particular production sites, individual producers or groups of producers across the world or within a given country or region. Generally, a producer’s position on a cost curve is described in terms of the particular percentile or quartile in which the production of a given plant or producer or group of producers appears. To construct cost curves, industry analysts compile information from a variety of sources, including reports made available by producers site visits personal contacts and trade publications. Although producers may participate to some extent in the process through which cost curves are by producers, site visits, personal contacts and trade publications. Although producers may participate to some extent in the process through which cost curves are constructed, they are typically unwilling to validate cost analyses directly because of commercial sensitivities. Inevitably, assumptions must be made by the analyst with respect to data that such analyst is unable to obtain and judgment must be brought to bear in the case of virtually all data, however obtained. Moreover, all cost curves embody a number of significant assumptions with respect to exchange rates and other variables. In summary, the manner in which cost curves are constructed means that they have a number of significant inherent limitations. Notwithstanding their shortcomings, independently produced cost curves are widely used in the industries in which Xstrata operate. No statement in this presentation is intended as a profit forecast or a profit estimate and no statement in this presentation should be interpreted to mean that earnings per Xstrata share for the current or future financial years would necessarily match or exceed the historical published earnings per Xstrata share.Th di ib i f hi i i f i i d i i b i d b l i i j i di i d i h i
2
The distribution of this presentation or any information contained in it may be restricted by law in certain jurisdictions, and any person into whose possession any document containing this presentation or any part of it comes should inform themselves about, and observe, any such restrictions.By attending the presentation and/or accepting or accessing this document you agree to be bound by the foregoing limitations and conditions and, in particular, will be taken to have represented, warranted and undertaken that you have read and agree to comply with the contents of this notice including, without limitation, the obligation to keep this document and its contents confidential and that you are a relevant person (as defined above).
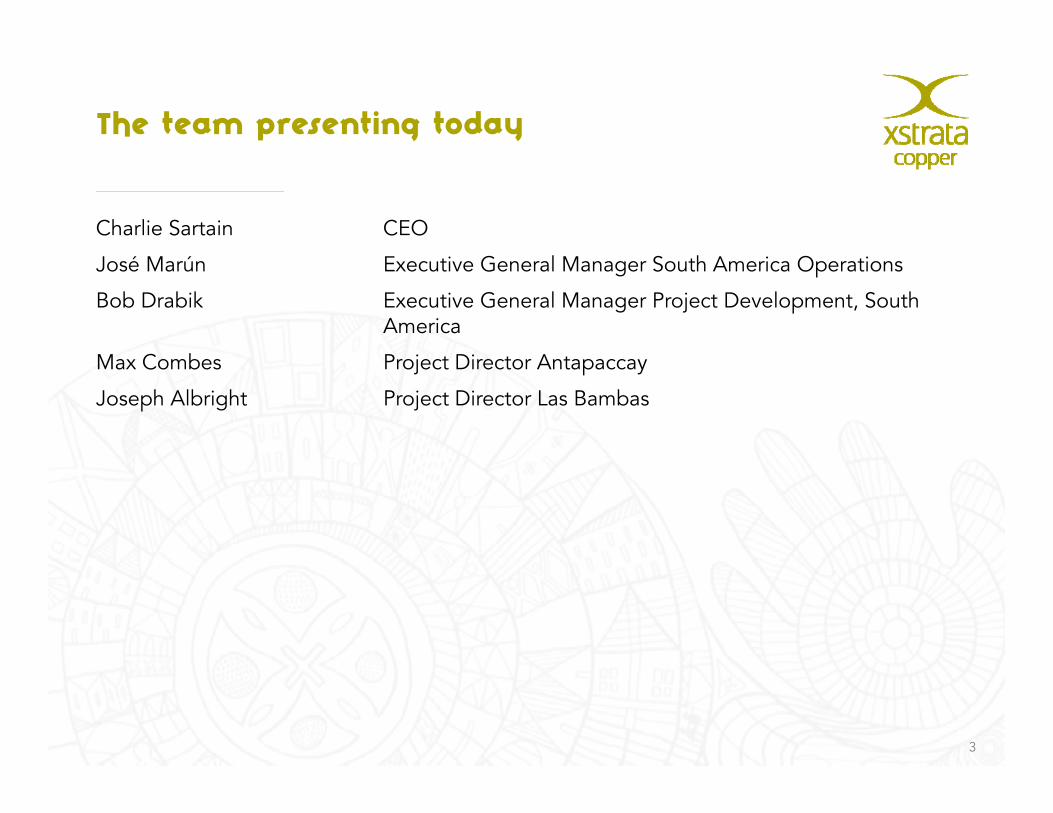
The team presenting today
Charlie Sartain CEO
José Marún Executive General Manager South America Operations
Bob Drabik Executive General Manager Project Development, South America
M C b P j Di AMax Combes Project Director Antapaccay
Joseph Albright Project Director Las Bambas
3
Agenda
• Introduction
• Copper market update
• Xstrata Copper : delivering transformational growth
– North Queensland operations
– Antamina Joint Venture
• South American operations
Coffee break
• Project Development
• Antapaccay Project
• Las Bambas ProjectLas Bambas Project
• Wrap up
4

C k tCopper market
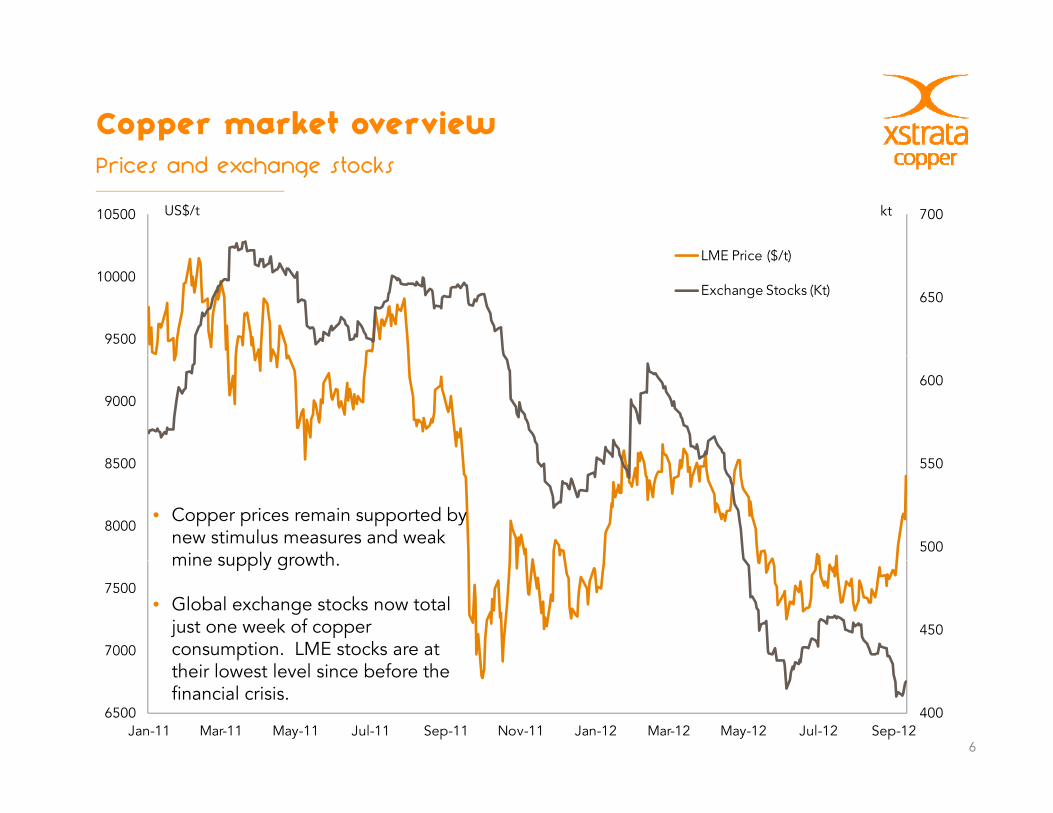
Copper market overviewPrices and exchange stocks
70010500
LME P i ($/t)
US$/t kt
650
9500
10000LME Price ($/t)
Exchange Stocks (Kt)
6009000
500
550
8000
8500
• Copper prices remain supported by new stimulus measures and weak mine supply growth
4507000
7500
mine supply growth.
• Global exchange stocks now total just one week of copper consumption. LME stocks are at
f
6
400Jan-11 Mar-11 May-11 Jul-11 Sep-11 Nov-11 Jan-12 Mar-12 May-12 Jul-12 Sep-12
6500
their lowest level since before the financial crisis.
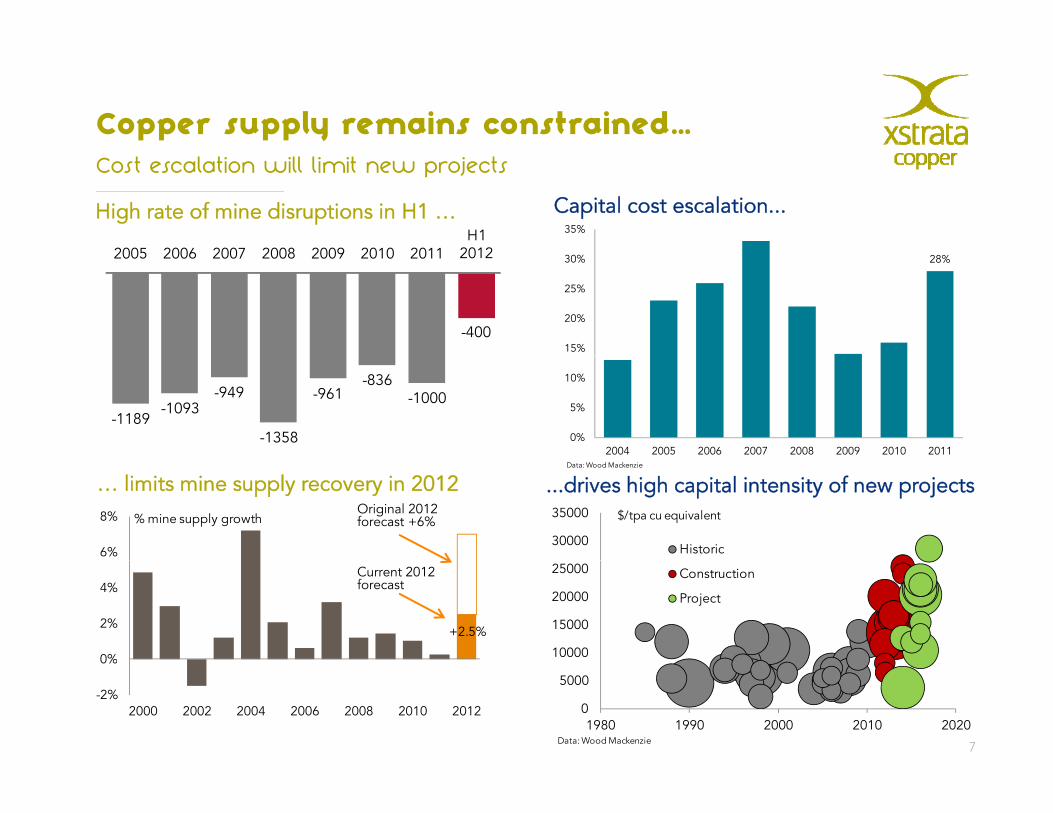
Copper supply remains constrained…
35%
Cost escalation will limit new projects
High rate of mine disruptions in H1 … Capital cost escalation...
2005 2006 2007 2008 2009 2010 2011H1
2012
15%
20%
25%
30% 28%
-400
2005 2006 2007 2008 2009 2010 2011 2012
0%
5%
10%
2004 2005 2006 2007 2008 2009 2010 2011
-1189-1093
-949
-1358
-961-836
-1000
6%
8% % mine supply growth
Data: Wood Mackenzie
… limits mine supply recovery in 2012 ...drives high capital intensity of new projects
30000
35000
Historic
$/tpa cu equivalentOriginal 2012 forecast +6%
0%
2%
4%
+2.5%
10000
15000
20000
25000 Construction
Project
Current 2012 forecast
-2%
0%
2000 2002 2004 2006 2008 2010 2012
7
0
5000
1980 1990 2000 2010 2020Data: Wood Mackenzie
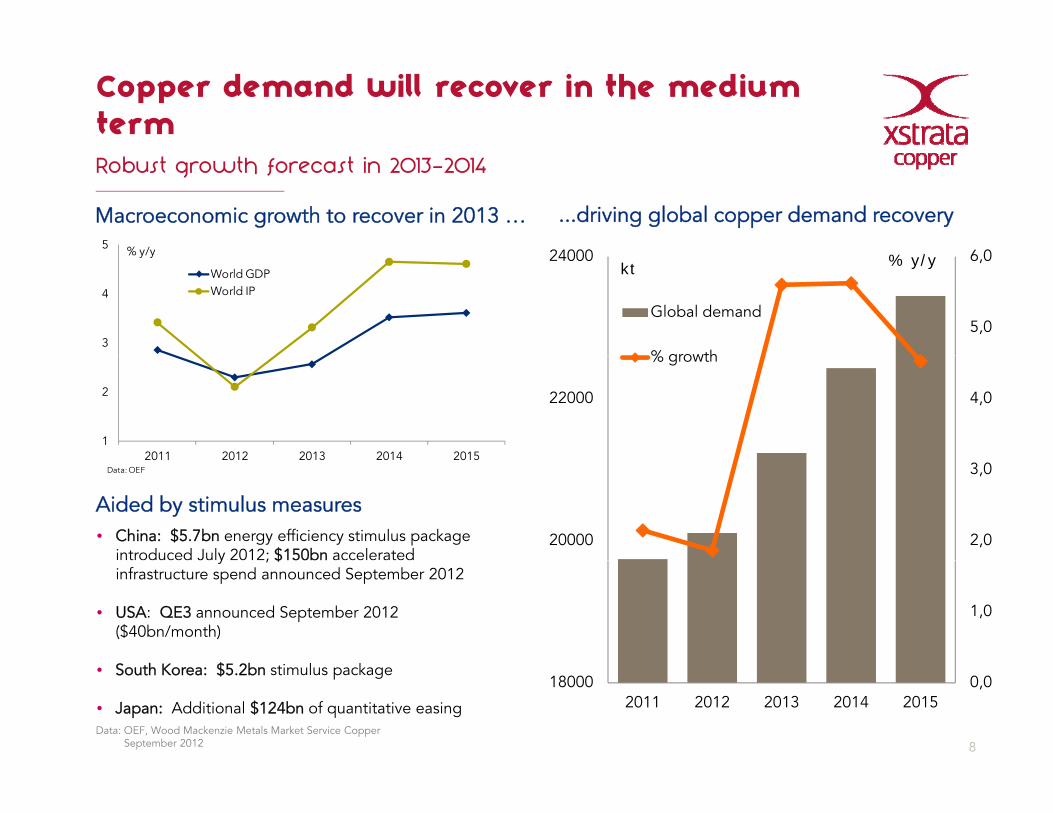
Copper demand will recover in the mediumtermRobust growth forecast in 2013-2014
Macroeconomic growth to recover in 2013 … ...driving global copper demand recovery5 % y/y 6 024000
3
4
World GDPWorld IP
% y/y
5,0
6,024000
Global demand
% growth
kt % y/y
1
2
2011 2012 2013 2014 2015
4,022000
% growth
Aided by stimulus measures• China: $5.7bn energy efficiency stimulus package
introduced July 2012; $150bn accelerated
2011 2012 2013 2014 2015Data: OEF
2,0
3,0
20000y ; $
infrastructure spend announced September 2012
• USA: QE3 announced September 2012 ($40bn/month)
h $ b l k
1,0
8Data: OEF, Wood Mackenzie Metals Market Service Copper
September 2012
• South Korea: $5.2bn stimulus package
• Japan: Additional $124bn of quantitative easing
0,0180002011 2012 2013 2014 2015
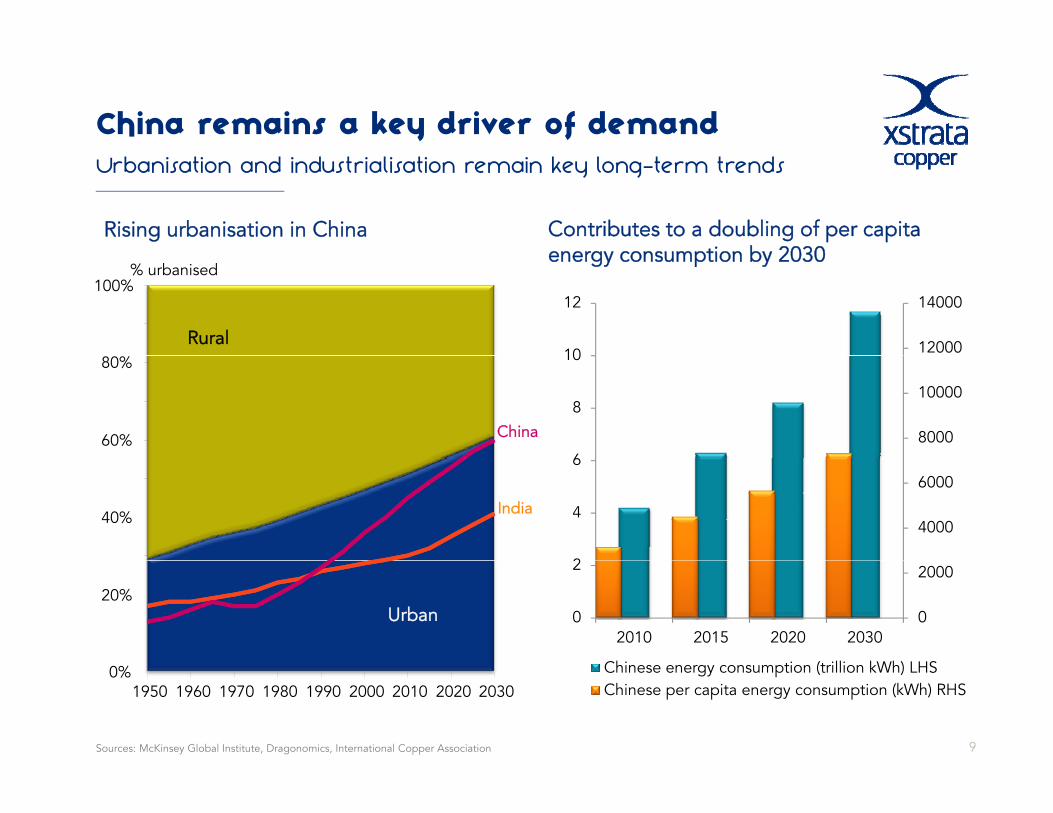
China remains a key driver of demandUrbanisation and industrialisation remain key long-term trends
Rising urbanisation in China Contributes to a doubling of per capita energy consumption by 2030
Rural
100%% urbanised
energy consumption by 2030
12000
14000
10
12
China60%
80%
8000
10000
6
8
10
India40% 4000
6000
2
4
6
Urban 20%
0
2000
0
2
2010 2015 2020 2030
Chi ti (t illi kWh) LHS
9Sources: McKinsey Global Institute, Dragonomics, International Copper Association
0%1950 1960 1970 1980 1990 2000 2010 2020 2030
Chinese energy consumption (trillion kWh) LHSChinese per capita energy consumption (kWh) RHS
Operating Operating excellenceexcellence
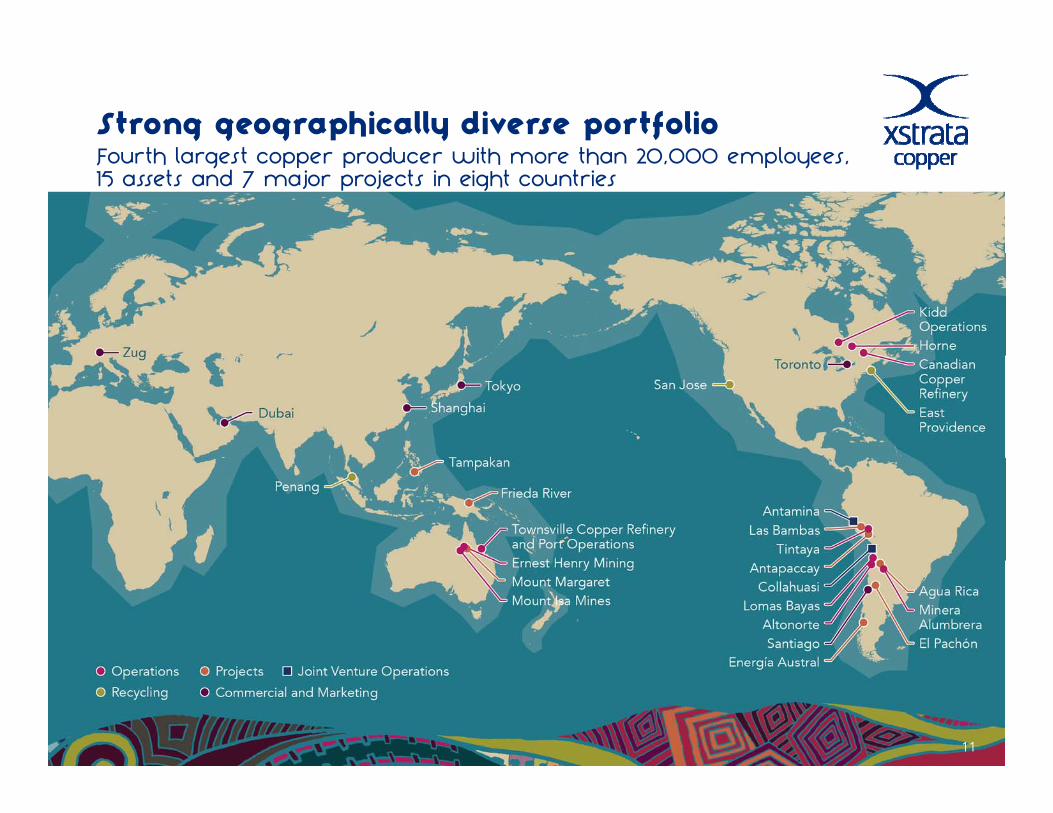
Strong geographically diverse portfolioF th l t d ith th 20 000 l Fourth largest copper producer with more than 20,000 employees, 15 assets and 7 major projects in eight countries
11
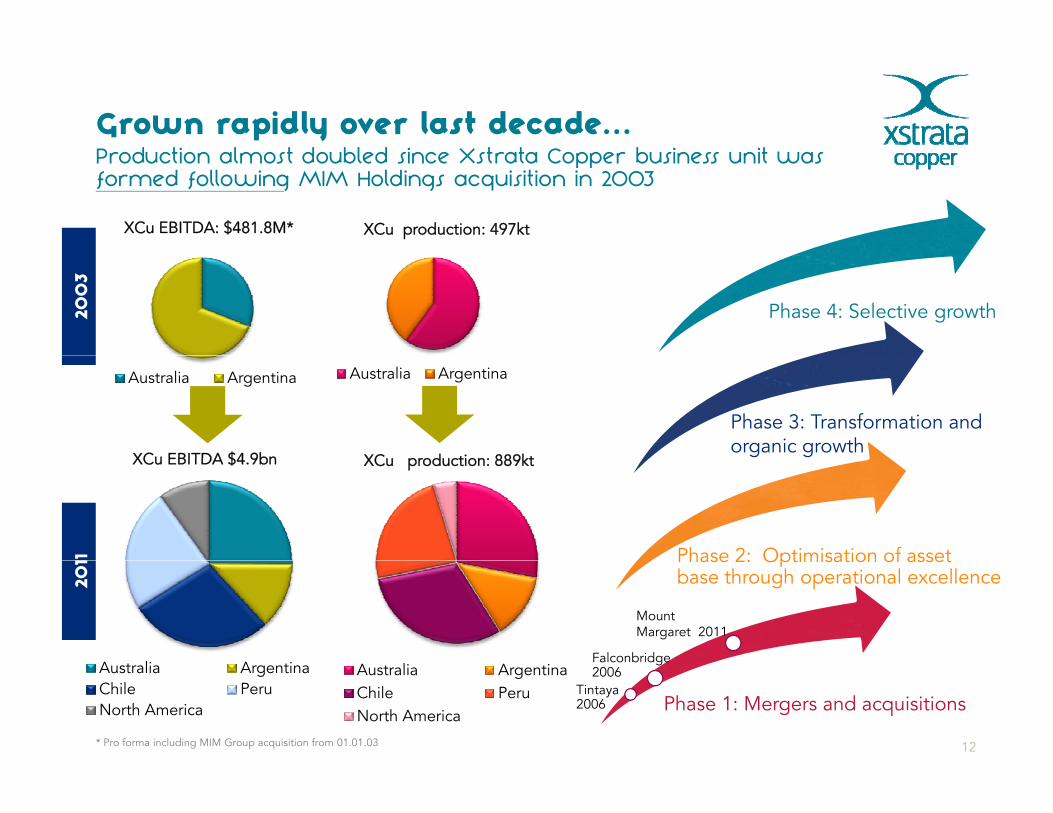
P d ti l t d bl d i X t t C b i it Grown rapidly over last decade... Production almost doubled since Xstrata Copper business unit was formed following MIM Holdings acquisition in 2003
XCu EBITDA: $481.8M* XCu production: 497kt
Phase 4: Selective growth 200
3
Phase 3: Transformation and organic growth
Australia Argentina
XCu EBITDA $4 9bn
Australia Argentina
XC d ti 889kt
Phase 2: Optimisation of asset 11
XCu EBITDA $4.9bn XCu production: 889kt
A li A i
Phase 2: Optimisation of asset base through operational excellence20
1
lFalconbridge
Mount Margaret 2011
Australia ArgentinaChile PeruNorth America
12* Pro forma including MIM Group acquisition from 01.01.03
Phase 1: Mergers and acquisitions
Australia ArgentinaChile PeruNorth America
Tintaya 2006
g2006
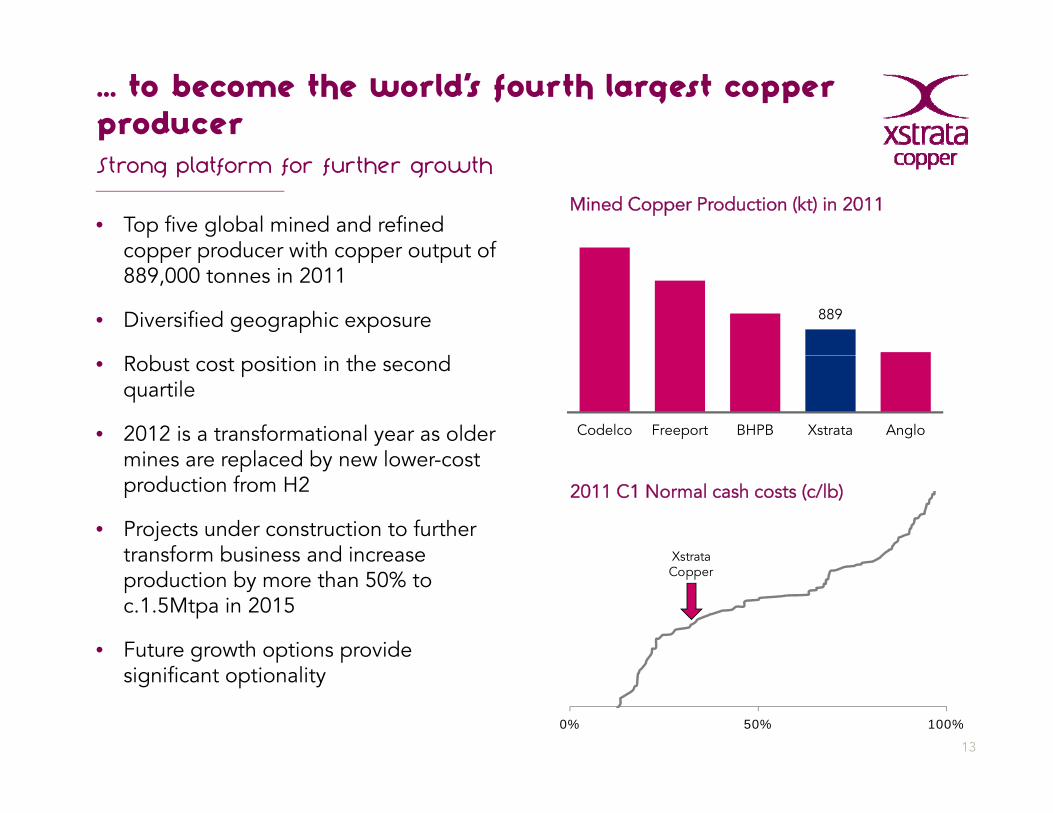
… to become the world’s fourth largest copperproducerStrong platform for further growth
• Top five global mined and refined copper producer with copper output of
Mined Copper Production (kt) in 2011
copper producer with copper output of 889,000 tonnes in 2011
• Diversified geographic exposure
b h d
889
• Robust cost position in the second quartile
• 2012 is a transformational year as oldermines are replaced by new lower cost
Codelco Freeport BHPB Xstrata Anglo
mines are replaced by new lower-costproduction from H2
• Projects under construction to further transform business and increase
2011 C1 Normal cash costs (c/lb)
Xstrata transform business and increase production by more than 50% to c.1.5Mtpa in 2015
• Future growth options provide
Xstrata Copper
13
significant optionality
0% 50% 100%
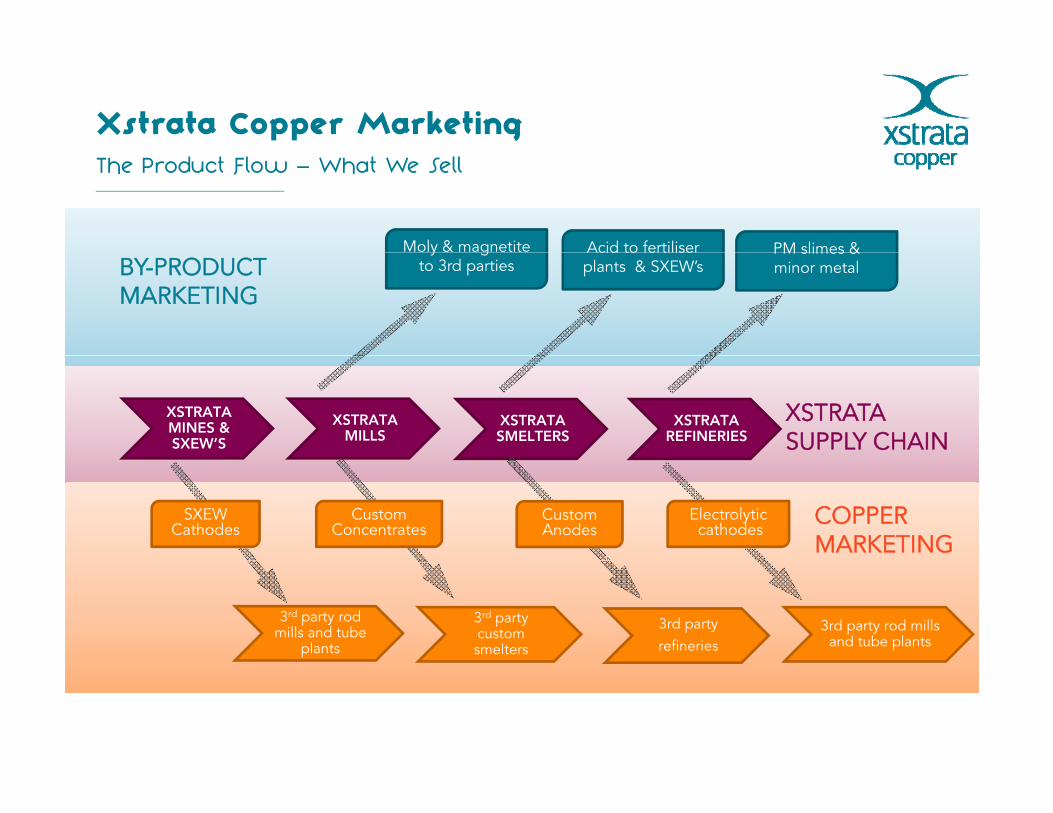
Xstrata Copper MarketingThe Product Flow – What We Sell
Acid to fertiliser Moly & magnetite PM slimes & plants & SXEW’s
y gto 3rd parties
PM slimes & minor metalBY-PRODUCT
MARKETING
XSTRATA MINES & SXEW’S
XSTRATA MILLS
XSTRATA SMELTERS
XSTRATA REFINERIES
XSTRATA SUPPLY CHAIN
CustomAnodes
CustomConcentrates
COPPER MARKETING
Electrolyticcathodes
SXEW Cathodes
3rd party custom smelters
3rd partyrefineries
3rd party rod mills and tube plants
3rd party rod mills and tube
plants
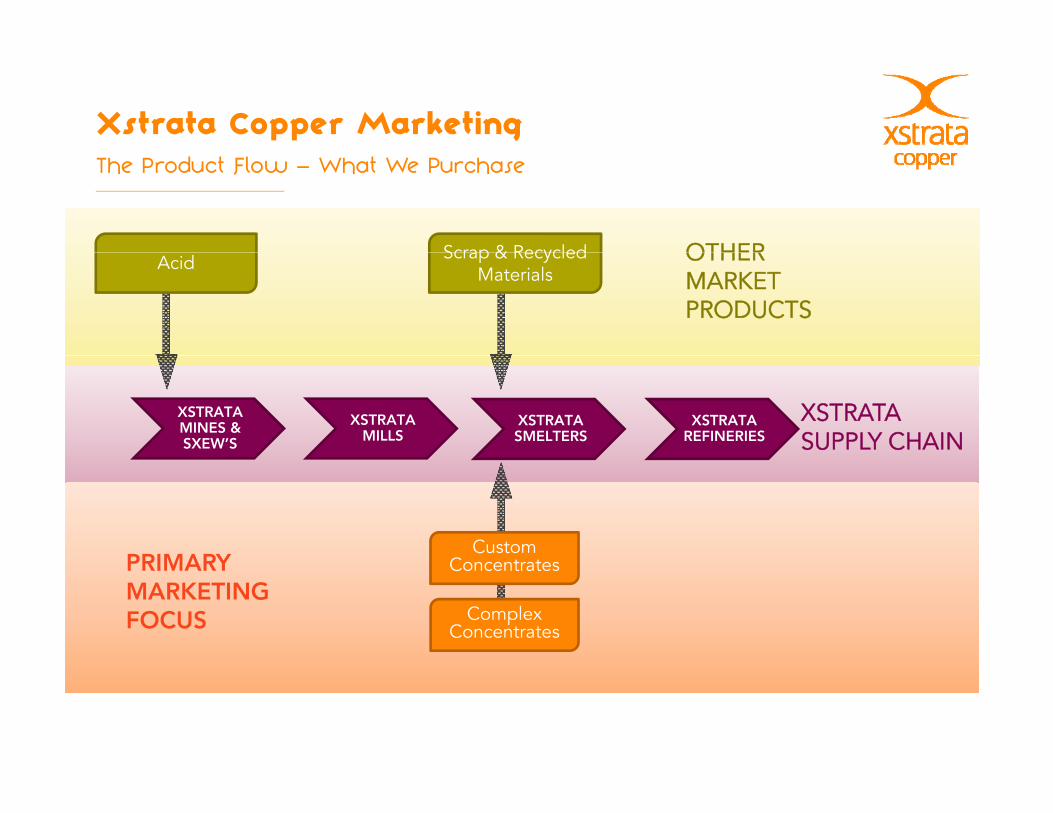
Xstrata Copper MarketingThe Product Flow – What We Purchase
Scrap & Recycled OTHER Scrap & Recycled Materials
Acid OTHER MARKET PRODUCTS
XSTRATA MINES & SXEW’S
XSTRATA MILLS
XSTRATA SMELTERS
XSTRATA REFINERIES
XSTRATA SUPPLY CHAIN
CustomC t tPRIMARY
Complex Concentrates
ConcentratesPRIMARY MARKETING FOCUS
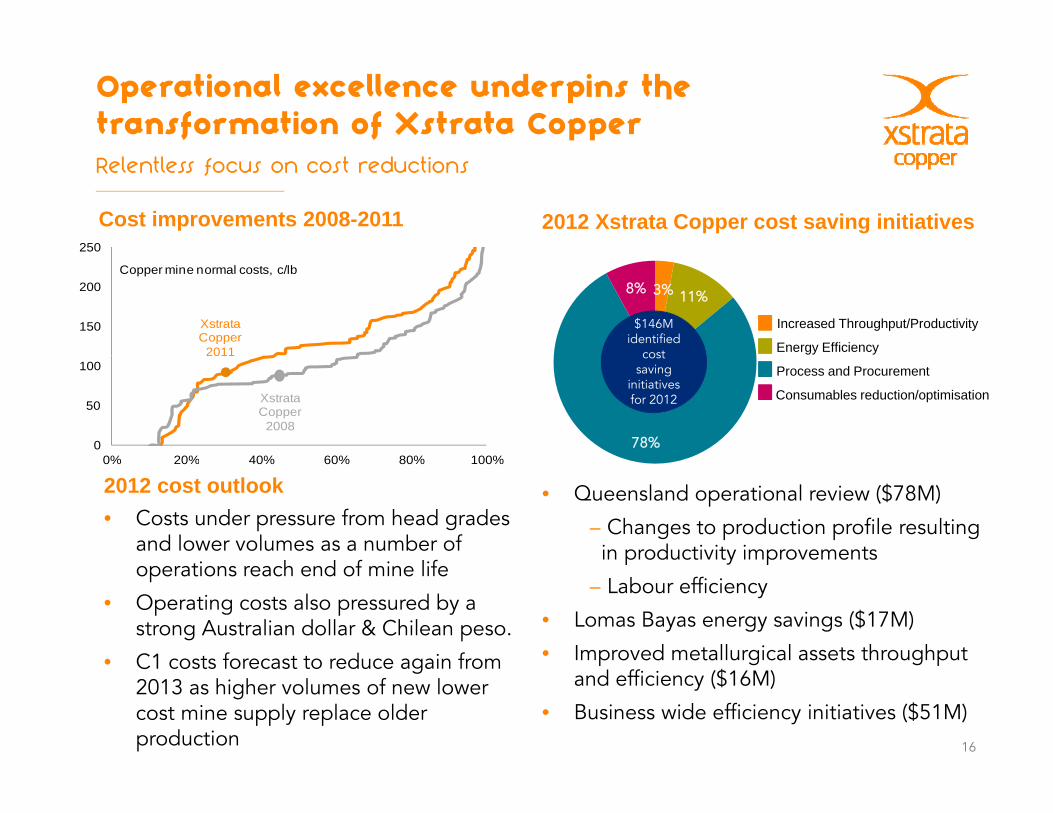
Operational excellence underpins the transformation of Xstrata CopperRelentless focus on cost reductions
2012 Xstrata Copper cost saving initiativesCost improvements 2008-2011250
3% 11%8%
$146M identified
cost
Increased Throughput/Productivity
Energy Efficiency150
200Copper mine normal costs, c/lb
XstrataCopper
2011
78%
cost saving
initiatives for 2012
Process and Procurement
Consumables reduction/optimisation
0
50
100
0% 20% 40% 60% 80% 100%
XstrataCopper
2008
2011
• Queensland operational review ($78M)
– Changes to production profile resulting in productivity improvements
2012 cost outlook • Costs under pressure from head grades
and lower volumes as a number of h d f l f
0% 20% 40% 60% 80% 100%
p y p
– Labour efficiency
• Lomas Bayas energy savings ($17M)
• Improved metallurgical assets throughput
operations reach end of mine life
• Operating costs also pressured by a strong Australian dollar & Chilean peso.
• C1 costs forecast to reduce again from
16
p g g pand efficiency ($16M)
• Business wide efficiency initiatives ($51M)
• C1 costs forecast to reduce again from 2013 as higher volumes of new lower cost mine supply replace older production
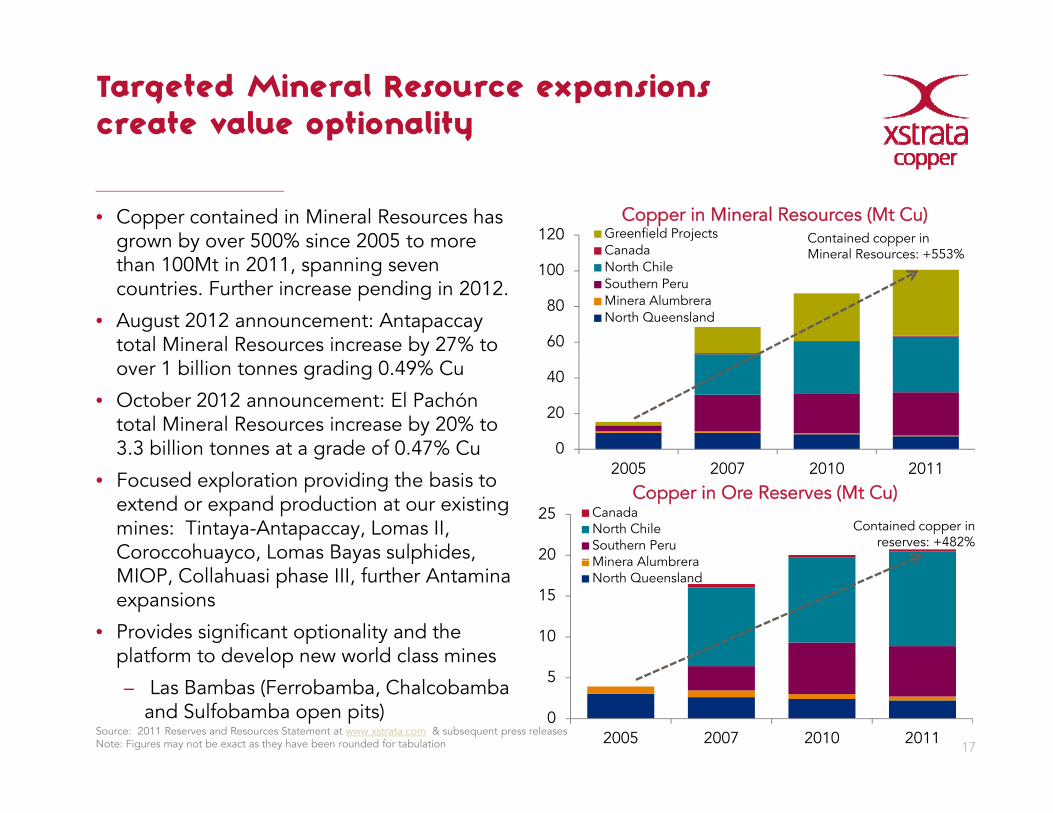
Targeted Mineral Resource expansionscreate value optionality
• Copper contained in Mineral Resources has grown by over 500% since 2005 to more
Copper in Mineral Resources (Mt Cu)120 Greenfield Projects
CanadaContained copper in Mineral Resources: +553%
than 100Mt in 2011, spanning seven countries. Further increase pending in 2012.
• August 2012 announcement: Antapaccay total Mineral Resources increase by 27% to 60
80
100CanadaNorth ChileSouthern PeruMinera AlumbreraNorth Queensland
Mineral Resources: +553%
yover 1 billion tonnes grading 0.49% Cu
• October 2012 announcement: El Pachóntotal Mineral Resources increase by 20% to 3.3 billion tonnes at a grade of 0.47% Cu 0
20
40
g
• Focused exploration providing the basis to extend or expand production at our existing mines: Tintaya-Antapaccay, Lomas II, Coroccohuayco, Lomas Bayas sulphides,
Copper in Ore Reserves (Mt Cu)
20
25 CanadaNorth ChileSouthern PeruMinera Alumbrera
Contained copper in reserves: +482%
2005 2007 2010 2011
y , y p ,MIOP, Collahuasi phase III, further Antamina expansions
• Provides significant optionality and the platform to develop new world class mines
10
15
Minera AlumbreraNorth Queensland
17
p p
– Las Bambas (Ferrobamba, Chalcobambaand Sulfobamba open pits)
Source: 2011 Reserves and Resources Statement at www.xstrata.com & subsequent press releasesNote: Figures may not be exact as they have been rounded for tabulation
0
5
2005 2007 2010 2011
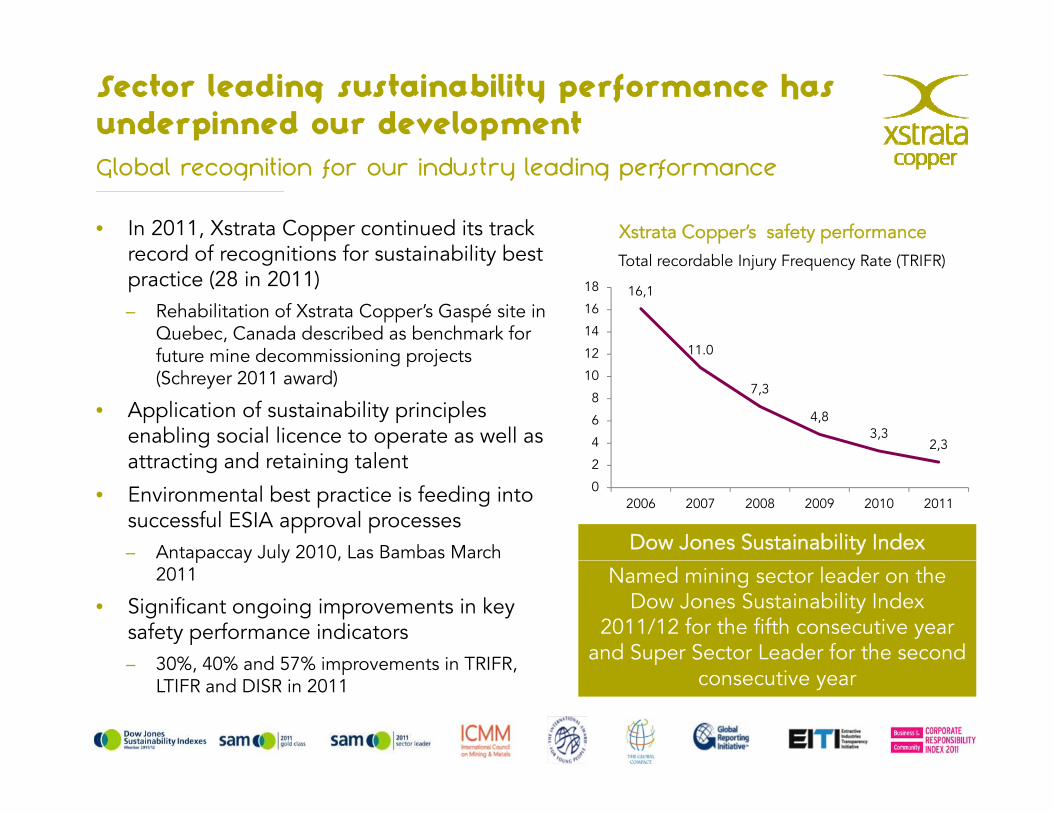
Sector leading sustainability performance has underpinned our development
• In 2011, Xstrata Copper continued its track record of recognitions for sustainability best
Global recognition for our industry leading performance
Xstrata Copper’s safety performancerecord of recognitions for sustainability best practice (28 in 2011)– Rehabilitation of Xstrata Copper’s Gaspé site in
Quebec, Canada described as benchmark for future mine decommissioning projects
Total recordable Injury Frequency Rate (TRIFR)
16,1
11.012
14
16
18
future mine decommissioning projects (Schreyer 2011 award)
• Application of sustainability principles enabling social licence to operate as well as attracting and retaining talent
7,3
4,83,3
2,34
6
8
10
12
attracting and retaining talent
• Environmental best practice is feeding into successful ESIA approval processes– Antapaccay July 2010, Las Bambas March Dow Jones Sustainability Index
0
2
2006 2007 2008 2009 2010 2011
p y y ,2011
• Significant ongoing improvements in key safety performance indicators
30% 40% and 57% improvements in TRIFR
Named mining sector leader on the Dow Jones Sustainability Index
2011/12 for the fifth consecutive year and Super Sector Leader for the second
18
– 30%, 40% and 57% improvements in TRIFR, LTIFR and DISR in 2011
pconsecutive year
DeliveringDeliveringt f ti ltransformational
growthg
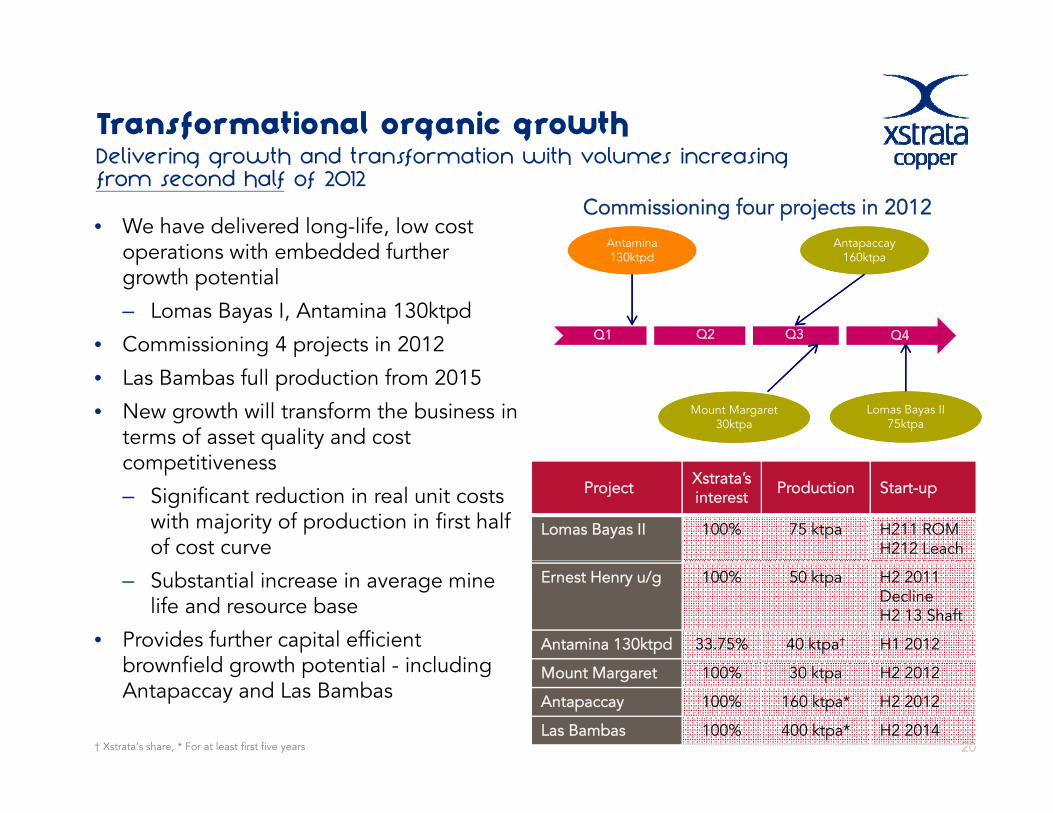
D li i th d t f ti ith l i i Transformational organic growth
• We have delivered long-life, low cost operations with embedded further
Delivering growth and transformation with volumes increasing from second half of 2012
Antapaccay160k
Antapaccay160k
Antamina 130k dAntamina 130k d
Commissioning four projects in 2012
operations with embedded further growth potential
– Lomas Bayas I, Antamina 130ktpd
• Commissioning 4 projects in 2012 Q1 Q2 Q3 Q4
160ktpa160ktpa130ktpd130ktpd
g p j
• Las Bambas full production from 2015
• New growth will transform the business in terms of asset quality and cost
titi
Lomas Bayas II 75ktpa
Lomas Bayas II 75ktpa
Mount Margaret30ktpa
Mount Margaret30ktpa
competitiveness
– Significant reduction in real unit costs with majority of production in first half of cost curve
Project Xstrata’sinterest Production Start-up
Lomas Bayas II 100% 75 ktpa H211 ROMH212 Leach
– Substantial increase in average mine life and resource base
• Provides further capital efficient brownfield growth potential including
Ernest Henry u/g 100% 50 ktpa H2 2011 DeclineH2 13 Shaft
Antamina 130ktpd 33.75% 40 ktpa† H1 2012brownfield growth potential - including Antapaccay and Las Bambas
20† Xstrata’s share, * For at least first five years
Mount Margaret 100% 30 ktpa H2 2012
Antapaccay 100% 160 ktpa* H2 2012
Las Bambas 100% 400 ktpa* H2 2014
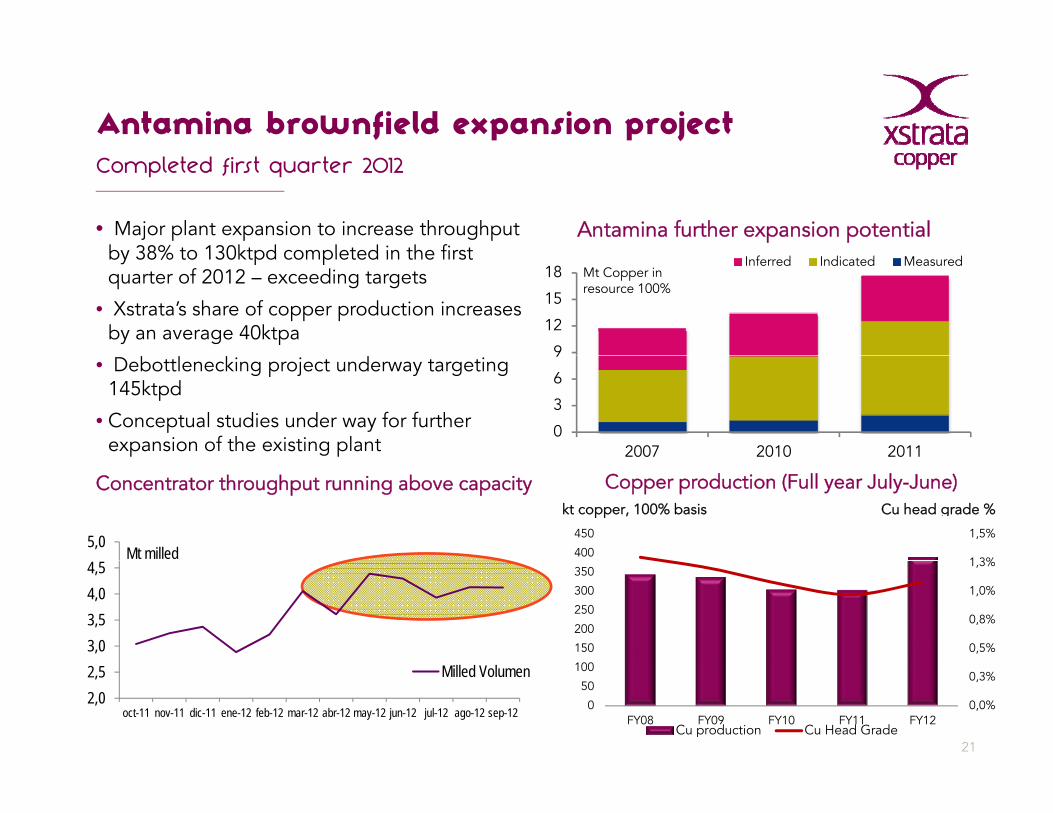
Antamina brownfield expansion projectCompleted first quarter 2012
• Major plant expansion to increase throughput by 38% to 130ktpd completed in the first
Antamina further expansion potential by 38% to 130ktpd completed in the first quarter of 2012 – exceeding targets
• Xstrata’s share of copper production increases by an average 40ktpa
9
12
15
18Inferred Indicated Measured
Mt Copper in resource 100%
• Debottlenecking project underway targeting 145ktpd
• Conceptual studies under way for further expansion of the existing plant
0
3
6
9
2007 2010 2011
Concentrator throughput running above capacity
5,0Mt milled
Copper production (Full year July-June)
1 3%
1,5%
400
450
kt copper, 100% basis Cu head grade %
3,03,54,04,5
0,5%
0,8%
1,0%
1,3%
100
150
200
250
300
350
21
2,02,5
oct-11 nov-11 dic-11 ene-12 feb-12 mar-12 abr-12 may-12 jun-12 jul-12 ago-12 sep-12
Milled Volumen
0,0%
0,3%
0
50
100
FY08 FY09 FY10 FY11 FY12Cu production Cu Head Grade
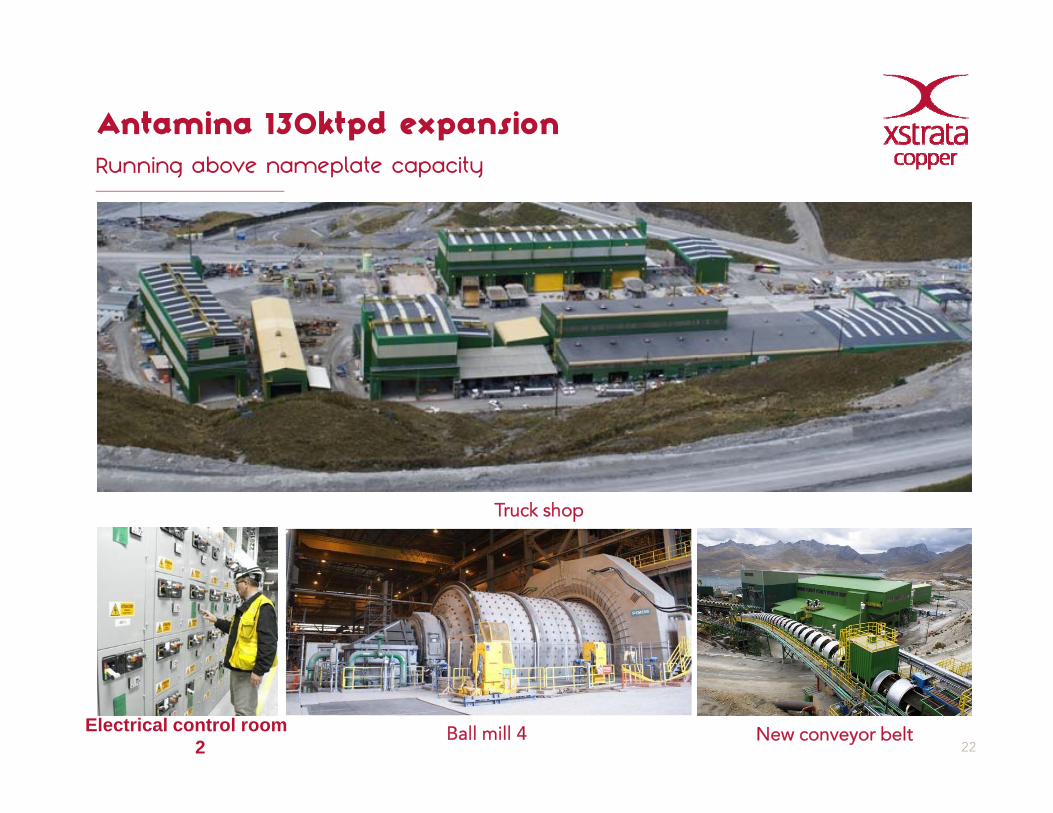
Antamina 130ktpd expansionRunning above nameplate capacity
Please do not use shadowing or 3D effects on photos or captions
Truck shop
22Ball mill 4 New conveyor beltElectrical control room
2
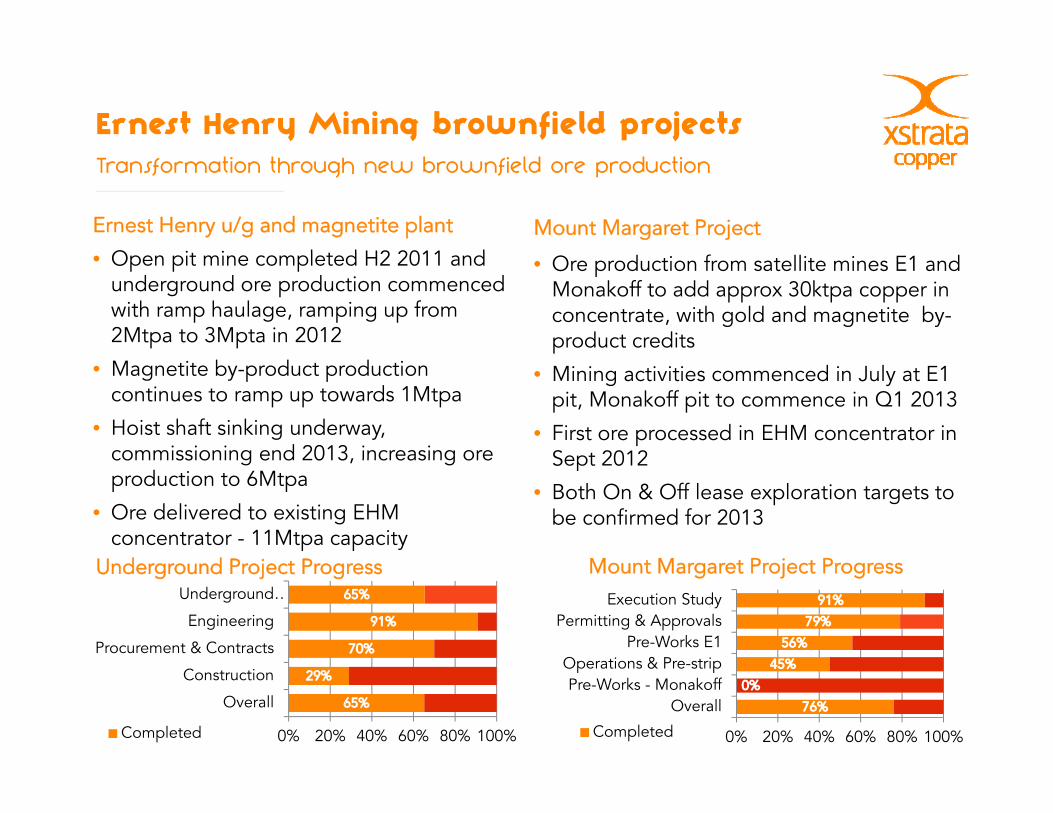
Ernest Henry Mining brownfield projects Transformation through new brownfield ore production
Ernest Henry u/g and magnetite plant
O it i l t d H2 2011 d Mount Margaret Project
• Open pit mine completed H2 2011 and underground ore production commenced with ramp haulage, ramping up from 2Mtpa to 3Mpta in 2012
• Ore production from satellite mines E1 and Monakoff to add approx 30ktpa copper in concentrate, with gold and magnetite by-product credits
• Magnetite by-product production continues to ramp up towards 1Mtpa
• Hoist shaft sinking underway, commissioning end 2013 increasing ore
• Mining activities commenced in July at E1 pit, Monakoff pit to commence in Q1 2013
• First ore processed in EHM concentrator in Sept 2012commissioning end 2013, increasing ore
production to 6Mtpa
• Ore delivered to existing EHM concentrator - 11Mtpa capacity
Sept 2012
• Both On & Off lease exploration targets to be confirmed for 2013
M t M t P j t PU d d P j P
Operations & Pre stripPre-Works E1
Permitting & ApprovalsExecution Study
Mount Margaret Project Progress
Procurement & Contracts
Engineering
Underground …
Underground Project Progress
0% 20% 40% 60% 80% 100%
OverallPre-Works - Monakoff
Operations & Pre-strip
Completed0% 20% 40% 60% 80% 100%
Overall
Construction
Completed
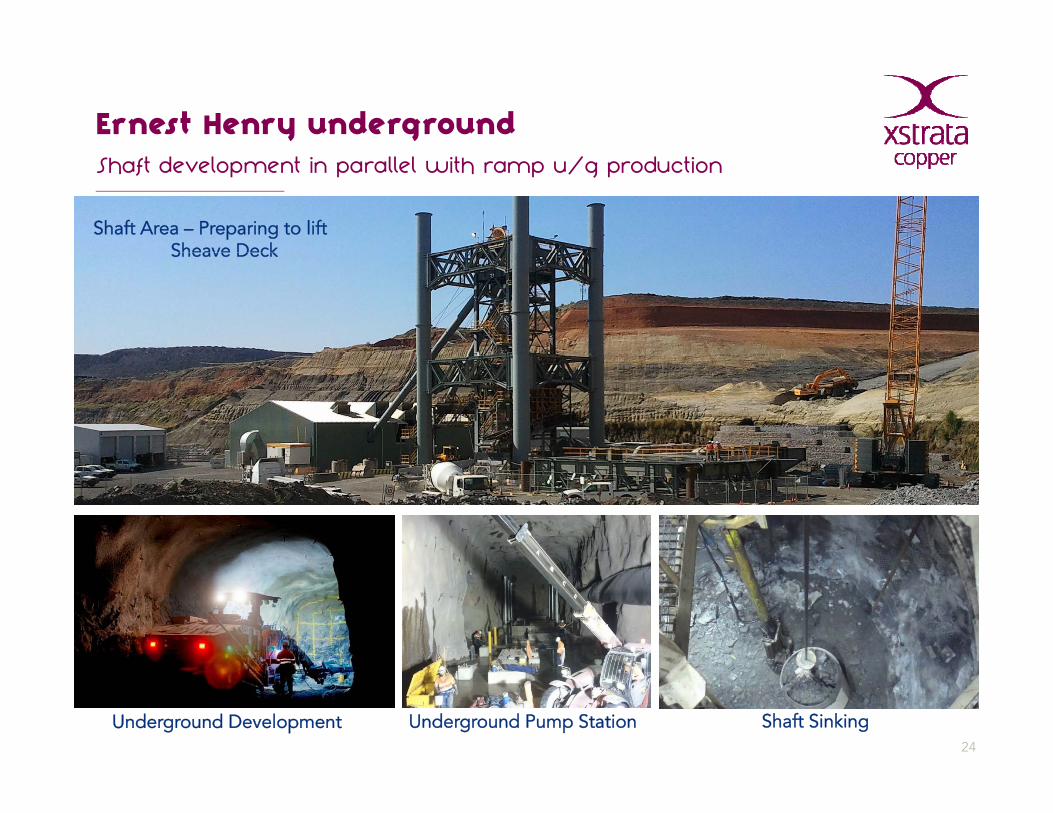
Ernest Henry undergroundShaft development in parallel with ramp u/g production
Please do not use shadowing or 3D effects on photos or captionsShaft Area – Preparing to lift Sheave DeckSheave Deck
24
Shaft SinkingUnderground Development Underground Pump Station
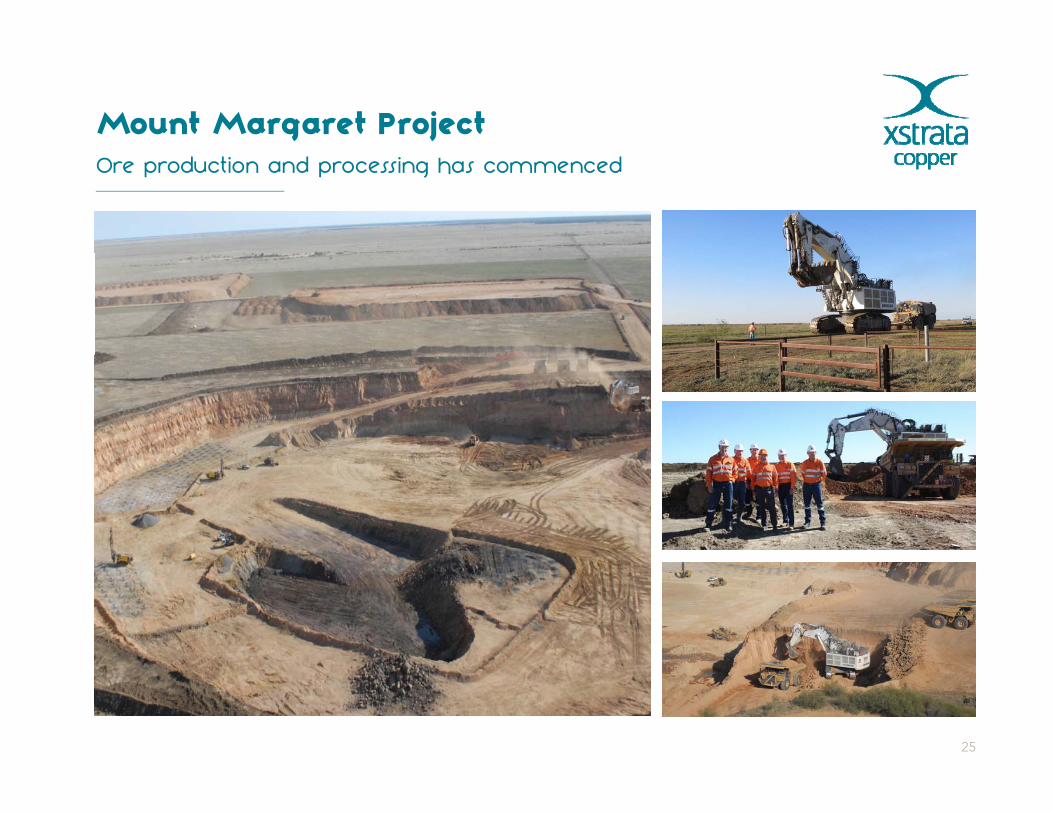
Mount Margaret Project Ore production and processing has commenced
Please do not use shadowing or 3D effects on photos
25
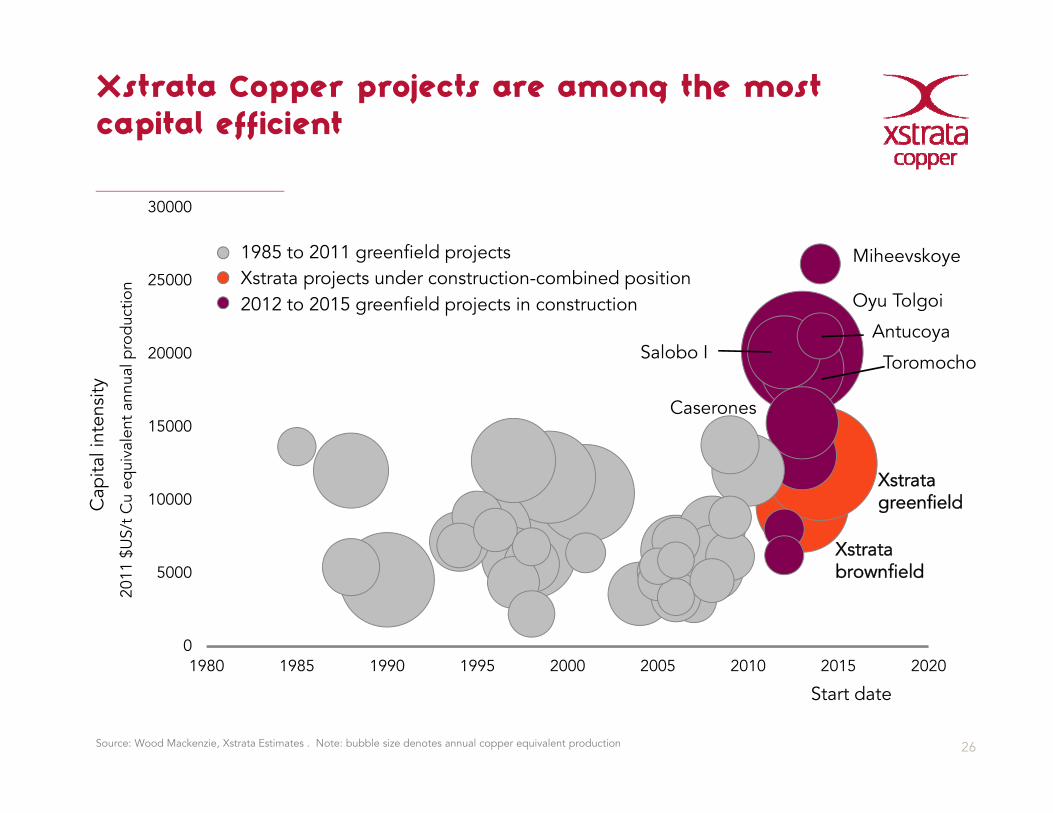
Xstrata Copper projects are among the most capital efficient
30000
Mih k1985 to 2011 greenfield projects
20000
25000Miheevskoye
prod
uctio
n
Salobo I
Oyu Tolgoi
T h
1985 to 2011 greenfield projects
2012 to 2015 greenfield projects in constructionXstrata projects under construction-combined position
Antucoya
15000
20000
l int
ensi
tyva
lent
ann
ual p Salobo I Toromocho
Caserones
10000
Xstrata
XstratagreenfieldC
apita
$U
S/t
Cu
equi
0
5000
1980 1985 1990 1995 2000 2005 2010 2015 2020
brownfield
2011
1980 1985 1990 1995 2000 2005 2010 2015 2020
26
Start date
Source: Wood Mackenzie, Xstrata Estimates . Note: bubble size denotes annual copper equivalent production
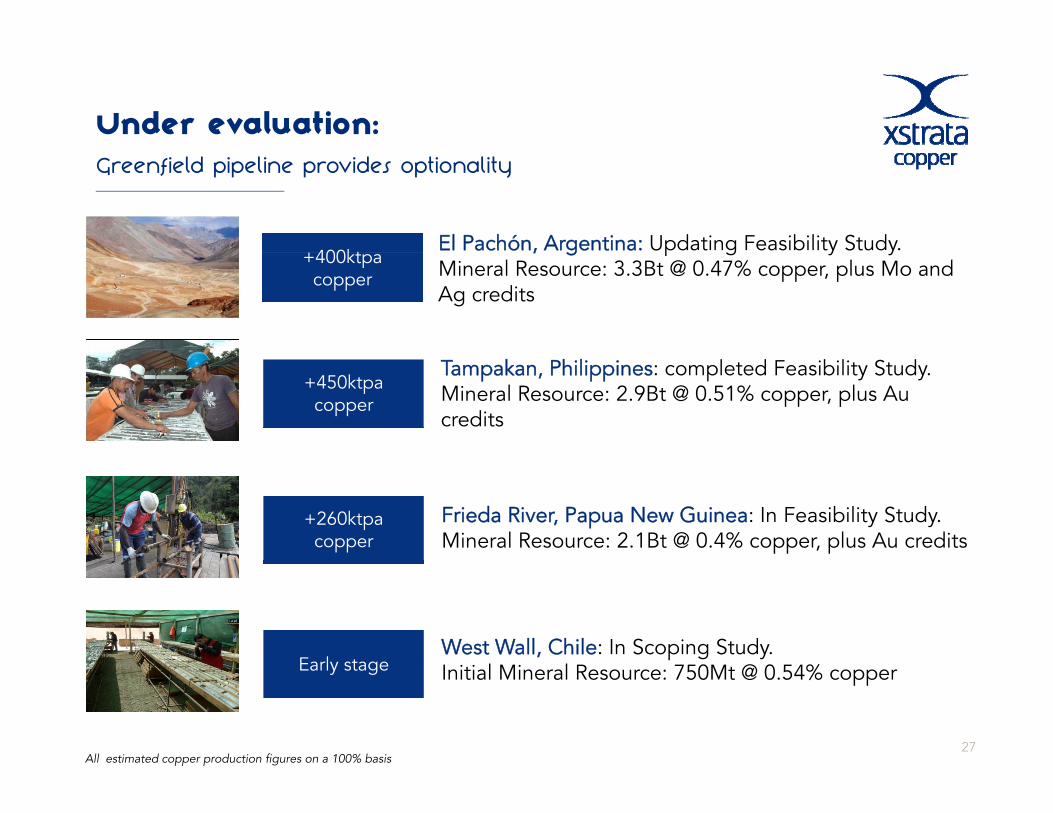
Under evaluation:Greenfield pipeline provides optionality
+400ktEl Pachón, Argentina: Updating Feasibility Study.
+400ktpacopper
, g p g y yMineral Resource: 3.3Bt @ 0.47% copper, plus Mo and Ag credits
+450ktpa copper
Tampakan, Philippines: completed Feasibility Study.Mineral Resource: 2.9Bt @ 0.51% copper, plus Au credits
+260ktpacopper
Frieda River, Papua New Guinea: In Feasibility Study. Mineral Resource: 2.1Bt @ 0.4% copper, plus Au credits
Early stage West Wall, Chile: In Scoping Study.
27
Early stage Initial Mineral Resource: 750Mt @ 0.54% copper
All estimated copper production figures on a 100% basis
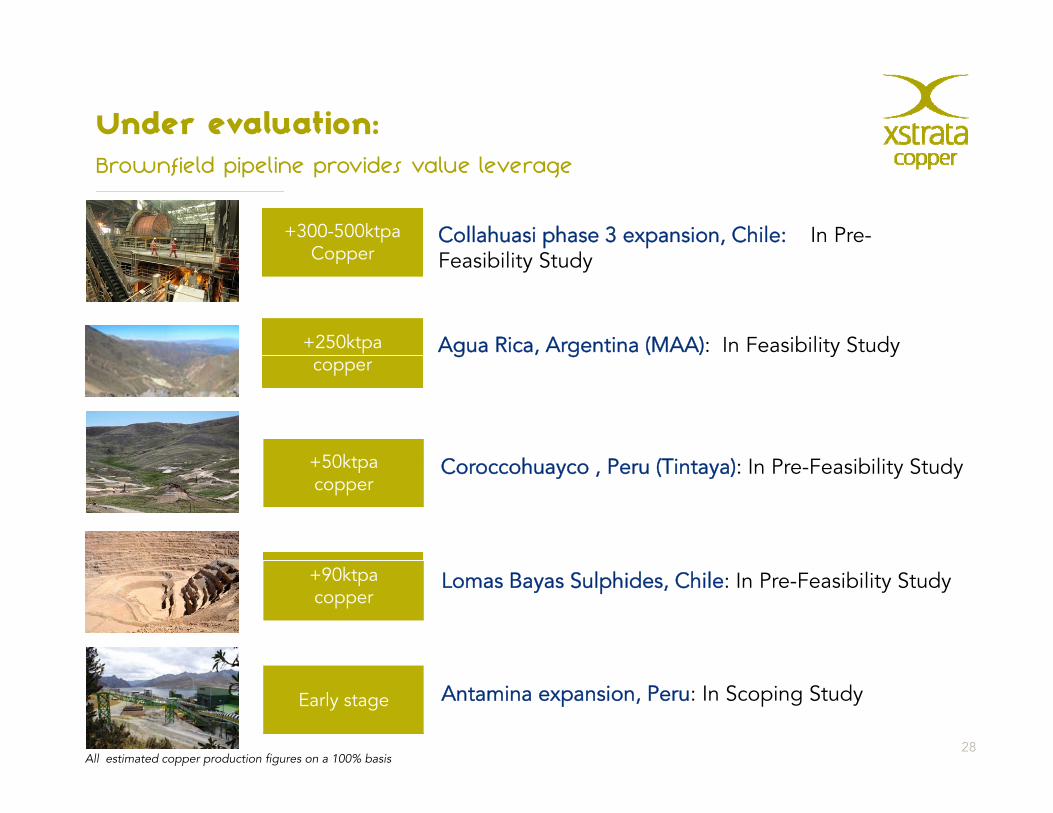
Under evaluation:Brownfield pipeline provides value leverage
+300-500ktpaCopper
Collahuasi phase 3 expansion, Chile: In Pre-F ibili S d
+250ktpa
Copper Feasibility Study
Agua Rica, Argentina (MAA): In Feasibility Study
+50kt
copper
h ( ) b l d
g g y y
+50ktpa copper
Coroccohuayco , Peru (Tintaya): In Pre-Feasibility Study
+90ktpacopper
Lomas Bayas Sulphides, Chile: In Pre-Feasibility Study
28
Early stage Antamina expansion, Peru: In Scoping Study
All estimated copper production figures on a 100% basis
Conclusions
• 2012 is a transformational year for Xstrata Copper
f ld d b f ld h f h l f f l• Organic greenfield and brownfield growth transforms the quality of our asset portfolio in terms of volume and cost. By 2015:
– 50% copper growth
– More than 80% of production in the first half of the cost curve – More than 80% of production in the first half of the cost curve
• Growth timed for a cyclical recovery
• Strong platform to deliver further growth
– Las Bambas targeted to start commissioning end 2014Las Bambas targeted to start commissioning end 2014
– Further brownfield and greenfield optionality
29Tintaya concentrator Ernest Henry new underground
mine Horne Smelter recycling

Questions?Questions?
30