Embed Size (px)
Citation preview
Charles Darwin University
Coupled rainfall and water vapour stable isotope time series reveal tropicalatmospheric processes on multiple timescales
Munksgaard, Niels C.; Zwart, Costijn; Haig, Jordahna; Cernusak, Lucas A.; Bird, Michael I.
Published in:Hydrological Processes
DOI:10.1002/hyp.13576
Published: 01/01/2020
Document VersionPeer reviewed version
Link to publication
Citation for published version (APA):Munksgaard, N. C., Zwart, C., Haig, J., Cernusak, L. A., & Bird, M. I. (2020). Coupled rainfall and water vapourstable isotope time series reveal tropical atmospheric processes on multiple timescales. Hydrological Processes,34(1), 111-124. https://doi.org/10.1002/hyp.13576
General rightsCopyright and moral rights for the publications made accessible in the public portal are retained by the authors and/or other copyright ownersand it is a condition of accessing publications that users recognise and abide by the legal requirements associated with these rights.
• Users may download and print one copy of any publication from the public portal for the purpose of private study or research. • You may not further distribute the material or use it for any profit-making activity or commercial gain • You may freely distribute the URL identifying the publication in the public portal
Take down policyIf you believe that this document breaches copyright please contact us providing details, and we will remove access to the work immediatelyand investigate your claim.
Download date: 05. Dec. 2021

"This is the pre-peer reviewed version of the following article: Munksgaard, NC, Zwart, C, Haig, J, Cernusak, LA, Bird, MI. Coupled rainfall and water vapour stable isotope time series reveal tropical atmospheric processes on multiple timescales. Hydrological Processes. 2019; 1– 14. https://doi.org/10.1002/hyp.13576 , which has been published in final form at https://doi.org/10.1002/hyp.13576 . This article may be used for non-commercial purposes in accordance with Wiley Terms and Conditions for Use of Self-Archived Versions."
For Peer ReviewCoupled rainfall and water vapour stable isotope time series
reveal tropical atmospheric processes on multiple timescales
Journal: Hydrological Processes
Manuscript ID HYP-19-0063.R2
Wiley - Manuscript type: Research Article
Date Submitted by the Author: n/a
Complete List of Authors: Munksgaard, Niels; Charles Darwin University, Research Institute for the Environment and Livelihoods; James Cook University Faculty of Science and Engineering, College of Science and EngineeringZwart, Costijn; James Cook University Faculty of Science and Engineering, College of Science and EngineeringHaig, Jordahna; James Cook University Faculty of Science and Engineering, College of Science and EngineeringCernusak, Lucas; James Cook University Faculty of Science and Engineering, College of Science and EngineeringBird, Michael; James Cook University Faculty of Science and Engineering, College of Science and Engineering
Keywords: Tropical climate, Water vapour, Rainfall, Stable isotopes
http://mc.manuscriptcentral.com/hyp
Hydrological Processes
For Peer Review
1 Coupled rainfall and water vapour stable isotope time series reveal tropical atmospheric processes
2 on multiple timescales
3
4 Niels C. Munksgaard 1,2, Costijn Zwart 1,3, Jordahna Haig 1,3, Lucas A. Cernusak 1, Michael I. Bird 1,3
5 1: Centre for Tropical Environmental and Sustainability Science, James Cook University, Cairns,
6 Australia
7 2: Research Institute for the Environment and Livelihoods, Charles Darwin University, Darwin,
8 Australia
9 3: ARC Centre of Excellence for Australian Biodiversity and Heritage, James Cook University, Cairns,
10 Australia
11 Correspondence: Niels C. Munksgaard, Centre for Tropical Environmental and Sustainability Science,
12 James Cook University, McGregor Road, Smithfield, QLD 4878, Australia. Email:
14
15 KEYWORDS: Tropical climate, Water vapour, Rainfall, Stable isotopes
16
17 FUNDING INFORMATION: This project was supported by Australian Research Council Grants
18 DP150100588 (to LC) and LE110100144 (to MB).
19
20 ABSTRACT:
21 High-frequency stable isotope data are useful for validating atmospheric moisture circulation models
22 and provide improved understanding of the mechanisms controlling isotopic compositions in tropical
23 rainfall. Here we present a near-continuous 6-month record of O- and H-isotope compositions in
24 both water vapour and daily rainfall from Northeast Australia measured by laser spectroscopy. The
25 data set spans both Wet and Dry Seasons to help address a significant data and knowledge gap in
26 the southern hemisphere tropics. We interpret the isotopic records for water vapour and rainfall in
27 the context of contemporaneous meteorological observations.
28 Surface air moisture provided near-continuous tracking of the links between isotopic variations and
29 meteorological events on local to regional spatial scales. Power spectrum analysis of the isotopic
Page 1 of 31
http://mc.manuscriptcentral.com/hyp
Hydrological Processes
123456789101112131415161718192021222324252627282930313233343536373839404142434445464748495051525354555657585960

For Peer Review
30 variation showed a range of significant periodicities, from hourly to monthly scales and cross-
31 wavelet analysis identified significant regions of common power for hourly-averaged water vapour
32 isotopic composition and relative humidity, wind direction and solar radiation. Relative humidity had
33 the greatest sub-diurnal influence on isotopic composition. On longer timescales (weeks to months)
34 isotope variability was strongly correlated with both wind direction and relative humidity.
35 The high-frequency records showed diurnal isotopic variations in O- and H-isotope compositions due
36 to local dew formation and, for deuterium excess, as a result of evapotranspiration. Several
37 significant negative isotope anomalies on a daily scale were associated with the activity of regional
38 mesoscale convective systems and the occurrence of two tropical cyclones. Calculated air parcel
39 back-trajectories identified the predominant moisture transport paths from the Southwest Pacific
40 Ocean while moisture transport from northerly directions occurred mainly during the Wet Season
41 monsoonal air flow.
42 Water vapour isotope compositions reflected the same meteorological events as recorded in rainfall
43 isotopes but provided much more detailed and continuous information on atmospheric moisture
44 cycling than the intermittent isotopic record provided by rainfall. Improved global coverage of stable
45 isotope data for atmospheric water vapour is likely to improve simulations of future changes to
46 climate drivers of the hydrological cycle.
47
48 DATA AVAILABILITY STATEMENT: The data that support the findings of this study are available from
49 the corresponding author upon reasonable request.
50
51 INTRODUCTION:
52 A key hydrological objective of stable isotope research is to understand the links between the stable
53 isotope composition of meteoric water, climate and microphysical factors operating at different
54 spatial and temporal scales. While stable O and H isotopes (δ18Oand δ2H values) have been used to
55 track the atmospheric component of the water cycle for several decades (Araguás-Araguás,
56 Froehlich & Rozanski 2000; Galewski et al. 2016), most research was focussed on the isotopic
57 measurements of precipitation - e.g. the Global Network of Isotopes in Precipitation (GNIP, IAEA
58 2018). Substantially less effort has been directed towards measurement of the isotopic composition
59 of water vapour. This imbalance is largely due to the difficulties and expense of cryogenic sampling
60 (Helliker, Roden, Cook & Ehleringer 2002) and mass spectrometric analysis of water vapour. In the
61 last decade or so, the ability to acquire continuous, high-frequency water vapour isotope data has
Page 2 of 31
http://mc.manuscriptcentral.com/hyp
Hydrological Processes
123456789101112131415161718192021222324252627282930313233343536373839404142434445464748495051525354555657585960

For Peer Review
62 increased dramatically with the advent of isotope laser-spectroscopy (Gupta, Noone, Galewski,
63 Sweeney & Vaughn 2009).
64 Because rainfall condenses from, and exchanges isotopes with, atmospheric water vapour, it is to be
65 expected that climate variables that influence the isotopic composition of rainfall also affect water
66 vapour. In their review of stable isotopes in atmospheric water vapour Galewski et al. (2016)
67 confirmed this expectation but also highlighted several complications in the use of isotope
68 composition to track atmospheric moisture in the tropics. The primary complication is that strong
69 convergence of airmasses leads to mixing of moisture with different origins and these mixing
70 components are likely to have been subject to different processes along their transport paths
71 In regions influenced by summer (Wet Season) monsoon, atmospheric moisture derived by
72 evaporation from tropical oceans is transported towards higher latitudes in the tropics/sub-tropics.
73 During transit the isotopic composition of water vapour is frequently modified in large organised
74 convection systems leading to substantial intra-seasonal isotopic variations in tropical rainfall and
75 water vapour. Precipitation isotopes commonly correlate negatively with precipitation amounts at
76 tropical coastal stations on a monthly scale (Dansgaard 1964; Rozanski, Araguás-Araguás &
77 Gonfiantini 1993). This empirical correlation, known as the 'amount effect', is often less pronounced
78 - or absent - in sample sets collected at higher frequency (e.g. Borneo, Moerman et al. 2013; North
79 Australia, Zwart et al. 2018). The ‘amount effect’ tends to mask other processes such as moisture
80 convergence and entrainment, and when using daily data, there is a weak correlation across the
81 tropics with >80% of the variance unexplained (Konecky, Noone & Cobb, 2019).
82 Mesoscale convective systems (MCSs; Houze 1994) are especially active during the wet phase of the
83 Madden Julian Oscillation (MJO), a major fluctuation in tropical weather characterised by an
84 eastward moving 'pulse' of increased cloud cover and rainfall (Kurita 2013, Kurita et al. 2011,). MCSs
85 account for a large portion of tropical rainfall and stratiform rainfall associated with these systems
86 typically causes large negative excursions in δ2H and δ18O values due to subsidence of water vapour
87 depleted in heavy isotopes from mid-Tropospheric levels (Aggarwal et al. 2016; Kurita 2013; Risi,
88 Bony, Vimeux, Chong & Decroix 2010). Water vapour and rainfall in the vicinity of Tropical Cyclones
89 (TCs) are also characterised by negative excursions of δ2H and δ18O values that are often lower than
90 in other tropical rain systems and which have a systematic distribution within TCs that are directly
91 linked to the dynamics and structural evolution of TCs (Lawrence and Gedzelman 1996, Gedzelman
92 et al. 2003).
93 In the tropics, General Circulation Models (GCMs) tend to provide an inadequate representation of
94 the coupling between atmospheric water and circulation as they are highly dependent on
Page 3 of 31
http://mc.manuscriptcentral.com/hyp
Hydrological Processes
123456789101112131415161718192021222324252627282930313233343536373839404142434445464748495051525354555657585960
For Peer Review
95 unresolved processes of moist convection and cloud formation (Stevens & Bony 2013). Water
96 isotope tracers have been incorporated into GCMs to simulate the effects of fractionation, transport
97 and condensation on the isotopic composition in the hydrological cycle (Galewski et al. 2016).
98 Consequently, there is a need for high frequency isotope data at additional sites in the tropics to
99 better validate models and test mechanistic understanding. In this regard, determination of isotopic
100 compositions of water vapour has the potential to provide a near-continuous record of atmospheric
101 moisture that is unavailable from intermittent rainfall sampling which is usually obtained on daily or
102 longer time scales.
103 The research reported here aims to:
104 1. Provide a record of water vapour isotope data from a coastal tropical site to fill a significant
105 gap in available data for the Southern Hemisphere (Galewsky et al. 2016; Wei et al. 2019).
106 2. Provide a long-term record of high-frequency (hourly to daily scale) water vapour isotope
107 data suitable for atmospheric process modelling.
108 3. Compare the isotope record obtained for water vapour with that of daily rainfall and assess
109 the relative merits of the two datasets.
110 4. Interpret the isotopic records of water vapour and rainfall in the context of
111 contemporaneous meteorological observations.
112
113 METHODS:
114 Observation site and period
115 This study was conducted from mid-December 2017 to mid-June 2018 at James Cook University
116 (16.8157◦S 145.6836◦E), 15 km northwest of Cairns, Australia. The observation site is situated ≈3 km
117 from the coast at an elevation of 30 m at the foot of a rainforest covered coastal range rising to ≈
118 600 m above sea level (Fig. 1). Cairns has a tropical monsoonal climate with most rainfall during
119 January-April (≈73% of annual rainfall), and a relatively drier season during May to October (≈14% of
120 annual rainfall). The annual mean rainfall is 1987 mm and the annual mean daily minimum
121 (maximum) temperature is 20.8oC (29.1oC) (all data 1942-2019, BoM 2019a). The monsoon trough is
122 close to Cairns from December to March bringing with it more frequent northerly and north-easterly
123 winds, hot and humid conditions and the possibility of tropical cyclones (TCs). On-shore easterly and
124 south-easterly trade winds dominate from May to October.
125 Water vapour isotopes
Page 4 of 31
http://mc.manuscriptcentral.com/hyp
Hydrological Processes
123456789101112131415161718192021222324252627282930313233343536373839404142434445464748495051525354555657585960

For Peer Review
126 The O- and H-isotope composition of water vapour was analysed continuously at ≈ 0.5 Hz using a
127 Picarro L2120i laser-based spectroscopic isotope analyser (Picarro Inc., Santa Clara, USA) coupled to
128 an automated Dew Point Generator - Calibration Unit (DPG-CU, Munksgaard et al. 2018). Total
129 measurement time was 4363 hours of which 242 hours (5.5%) was spent in calibration while
130 equipment or power failures accounted for 228 hours (5.1%). The analyser system was housed in a
131 shed at ambient temperature and a length of 3 mm ID FEP intake tube was used to sample ambient
132 air from the top of a 5 m tall mast secured to the side of the shed and extending 1 m above its roof.
133 The intake tube was fitted inside a heated PVC tube to prevent condensation within the FEP tube,
134 and the inlet was fitted with an air filter (LICOR 300–01961) and protected from ingress of rain. The
135 total volume of the inlet system was ≈80 mL, resulting in a delay of ≈3 min between air intake and
136 measurement at the analyser air flow rate of ≈25–30 mL/min.
137 The DPG-CU uses two liquid water working standards to generate water vapour in air at a defined
138 mixing ratio and O- and H-isotopic composition. The system was programmed to analyse standard
139 water vapours for a total of 1 hr at 20-hr intervals. Two liquid water standards were used: ‘Evian’
140 bottled water: δ18O ≈ −10.0 ‰, δ2H ≈ −71 ‰ and ‘Lake Eacham’ water: δ18O ≈ +2.0 ‰, δ2H ≈ +7.6 ‰,
141 relative to the VSMOW scale, where δx = (Rx - Rst)/Rst. Rx is the isotope ratio (18O/16O or 2H/1H) of the
142 sample and Rst is that of the standard. δ-values were multiplied by 1000 and expressed as per mil
143 (‰). The isotopic compositions of the water vapour generated from the liquid standards were at the
144 upper and lower limits of the observed range of ambient water vapour compositions. Accurate
145 δ-values of each batch of water standards (enough for ≈ 40 calibrations) were determined by isotope
146 analyses using secondary laboratory standards tied to the certified standards VSMOW2 and VSLAP2
147 (International Atomic Energy Agency, Vienna, Austria). The δ18O and δ2H values of water vapour
148 generated from the liquid water standards were calculated to account for both liquid-vapour
149 isotopic fractionation effects as well as the progressive distillation effect in the DPG-CU system and
150 did not require adjustment for changes in the water vapour mole fraction within the range observed
151 (Munksgaard et al. 2018).
152 Following the procedure of Munksgaard et al. (2018), logged 30-s running average water vapour
153 concentration (water volume mixing ratio, qH2O), δ18O and δ2H values were sampled at 1-min
154 intervals and processed in a customised Excel spreadsheet in the following sequence: 1. Separation
155 of standard data from ambient vapour data. 2. Determination of calibration slope and intercept
156 values for each set of standard measurements based on the mean values of the last five 1-min data
157 points. 3. Drift correction and calibration to the VSMOW scale of each ambient vapour data point (1-
158 min data) using the average slope and intercept values of the two sets of standards analysed before
Page 5 of 31
http://mc.manuscriptcentral.com/hyp
Hydrological Processes
123456789101112131415161718192021222324252627282930313233343536373839404142434445464748495051525354555657585960

For Peer Review
159 and after each 20-hr block of ambient vapour data. Finally, hourly and daily integrated values were
160 calculated from the 1-min data.
161 The internal precision of standard vapours when averaging five 1-min data points was <0.06 ‰ and <
162 0.4 ‰ for δ18O and δ2H values, respectively (1σ standard deviation) and the reproducibility of
163 standard vapours over a 10-day period was better than 0.14 ‰ and 0.75 ‰ for δ18O and δ2H values,
164 respectively (1σ standard deviation).
165 It is noted that the minimum time resolution of isotopic data is limited to several minutes due to
166 signal attenuation from the air inlet to the analytical instrument (Galewski et al. 2016).
167 Rainfall isotopes
168 Accumulated 24-hourly rainfall (≈9 am to ≈9 am) was collected using a Palmex rainfall sampler
169 designed to prevent sample evaporation and fitted with a 14.5-cm diameter funnel. The minimum
170 volume for sampling was 10 ml (equivalent to ≈ 0.5 mm rain). Stable isotope analysis was carried out
171 using a Picarro L2130i water isotope analyser and autosampler connected to a diffusion sampler
172 device (Munksgaard et al. 2011). Measurements were scaled relative to the VSMOW scale using
173 secondary water standards tied to the VSMOW2 and VSLAP2. Precision was typically ± 0.1 ‰ and ±
174 0.5 ‰ for δ18O and δ2H, respectively (1σ SD).
175 Local meteorological conditions
176 Local surface wind, humidity, air temperature and solar radiation was monitored using a
177 WeatherMaster 3000 weather station (Environdata) and rainfall intensity was recorded with a HOBO
178 RG3-M rain gauge (Onset Computer Corporation). Both instruments were located within 50 m of the
179 water vapour sampling mast.
180 Climate data and air parcel trajectories
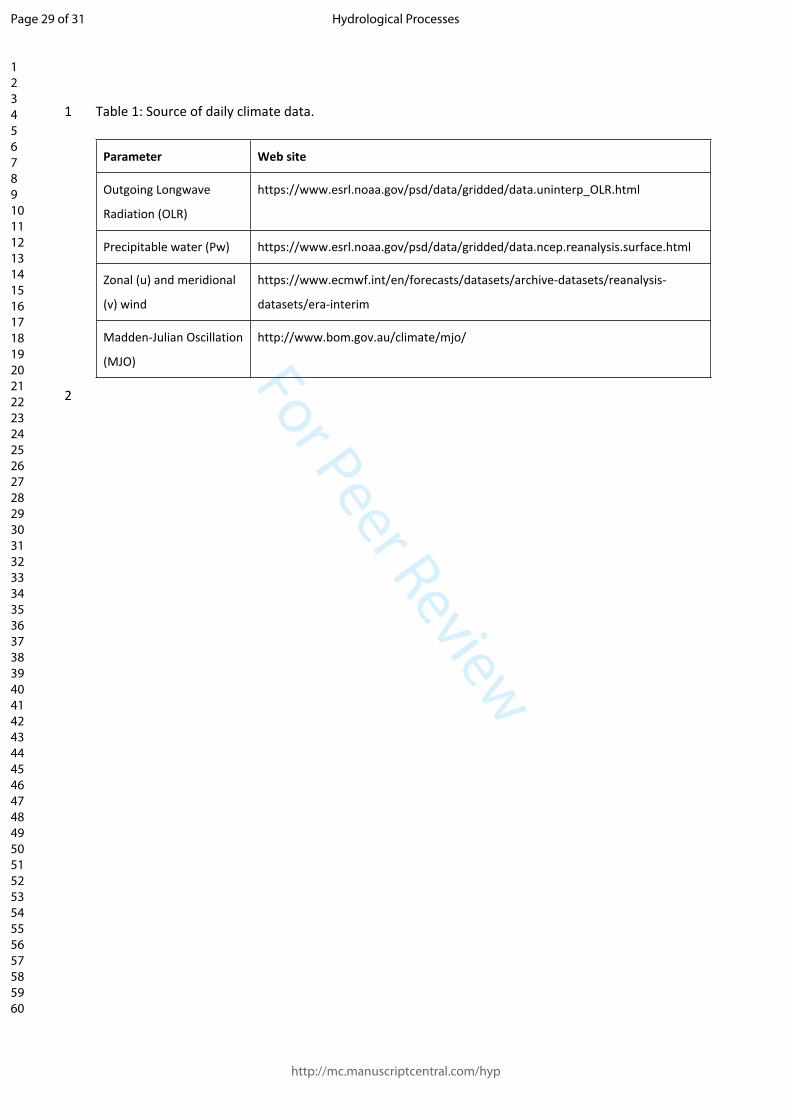
181 The sources of climate data used in our study are listed in Table 1. Daily Outgoing Longwave
182 Radiation (OLR) and Precipitable water (Pw) fields (2.5 degree resolution) were averaged over a five
183 by five degree bounding box (grid points -12.5o to -17.5o S and 142.5 o to 147.5 o E), centred over
184 Cairns. A representative location just offshore from Cairns (-16.5 o S 146.25 o E) was used to evaluate
185 ERA-Interim (Dee et al. 2011) zonal and meridional wind fields (0.75 o resolution, 37 pressure levels).
186 Air mass back trajectories and Specific Humidity data were computed using the Hybrid Single-
187 Particle Lagrangian Integrated Trajectory model (HYSPLIT, Stein et al. 2015) provided by the NOAA
188 Air Resources Laboratory at https://ready.arl.noaa.gov/HYSPLIT_traj.php. The GDAS-1 data set was
189 used as input for the wind fields and back trajectories were computed in isobaric mode with
190 runtimes of 96 hrs and an arrival height of 500 m above ground level. We investigated the effects of
Page 6 of 31
http://mc.manuscriptcentral.com/hyp
Hydrological Processes
123456789101112131415161718192021222324252627282930313233343536373839404142434445464748495051525354555657585960

For Peer Review
191 the alternative vertical motion modes in HYSPLIT (Model vertical motion and Isentropic modes) and
192 found that back trajectories were similar for the three modes and would not influence our
193 conclusions regarding air parcel transport.
194 Power spectra and wavelet analyses
195 The power spectrum (Lomb-Scargle) of water vapour 𝛿18O anomalies, Red Noise spectrum and 95%
196 confidence intervals were calculated using the REDFIT routine (Schulz & Mudelsee 2002) in the
197 program PAST3 (Hammer, Harper & Ryan 2001).
198 Wavelet and spectrum analysis are useful signal processing tools for the deconstruction of an
199 otherwise two-dimensional time series (variable over time) into time frequency space with the
200 ability to highlight localized intermittent periodicities. Cross wavelet analysis extends this by
201 comparing the continuous wavelet transform of two independent time series, highlighting regions in
202 time frequency space with large common power (Grinsted, Moore & Jevrejeva 2004). We applied
203 cross wavelet analysis to the water vapor δ18O time series and the local meteorological observations
204 (wind, relative humidity and solar radiation) to firstly identify if covariance exists between any two
205 time series and how this covariance varies in time. Missing values were interpolated using a shape-
206 preserving piecewise cubic interpolation method. Resampling the time series using this conversion
207 algorithm applies an antialiasing FIR lowpass filter to estimate the missing values whilst preserving
208 the existing trends in the dataset. A 60-minute moving average was applied to the 1-minute water
209 vapor δ18O data to maintain a consistent time step among all time series. A BoxCox transformation
210 was then applied to all datasets to transform the non-normally distributed data to an approximate
211 normal distribution. The cross-wavelet analysis was performed using the Morlet wavelet with a scale
212 resolution of 10 scales per octave, assuming an AR1 red noise spectrum following the methods
213 outlined in Grinsted et al. (2004).
214
215 RESULTS AND DISCUSSIONS:
216 Temporal variation in water vapour and rainfall isotopes
217 The power spectrum of the δ18O water vapour anomaly shows a range of significant periodicities,
218 from hourly to monthly scales (3.4, 4, 4.8, 6, 11.4, 11.9, 24 and >150 hours are highlighted in Fig 2a).
219 The cross-wavelet analysis (Fig. 2b-d) identified statistically significant regions of common power
220 (indicated by the black contours) for the hourly averaged water vapour δ 18O values and
221 meteorological conditions (relative humidity, wind direction and solar radiation). The ≈12-hour and
222 24-hour peaks in the spectral graph (Fig. 2a) reflect the diurnal cycle in relative humidity, wind
Page 7 of 31
http://mc.manuscriptcentral.com/hyp
Hydrological Processes
123456789101112131415161718192021222324252627282930313233343536373839404142434445464748495051525354555657585960
For Peer Review
223 direction and solar radiation and all three cross wavelet plots (Fig. 2b-d) show statistically significant
224 regions of higher power within the 8 to 32-hour band. The relative humidity and solar radiation plots
225 (Fig. 2c-d) have the greatest number of significant regions in this frequency band, so are likely the
226 most significant drivers of diurnal δ18O variability. However, when compared to the other
227 meteorological observations at all scales (periodicities of 4 -1024 hours) solar radiation has the least
228 power (as indicated by the colour distribution) so is least influential overall. Although all three plots
229 show significant regions at sub-diurnal scales, the cross-wavelet analysis indicates that relative
230 humidity (Fig. 2c) has the greatest sub-diurnal influence given that there are more regions of
231 significance at periodicities below 16 hours. On longer timescales (weeks to months), large
232 significant areas are present from 5-15 days (wind direction) and 21-42 days (wind direction and
233 relative humidity both in anti-phase), indicating that these are most likely the strongest drivers of
234 δ18O variability overall.
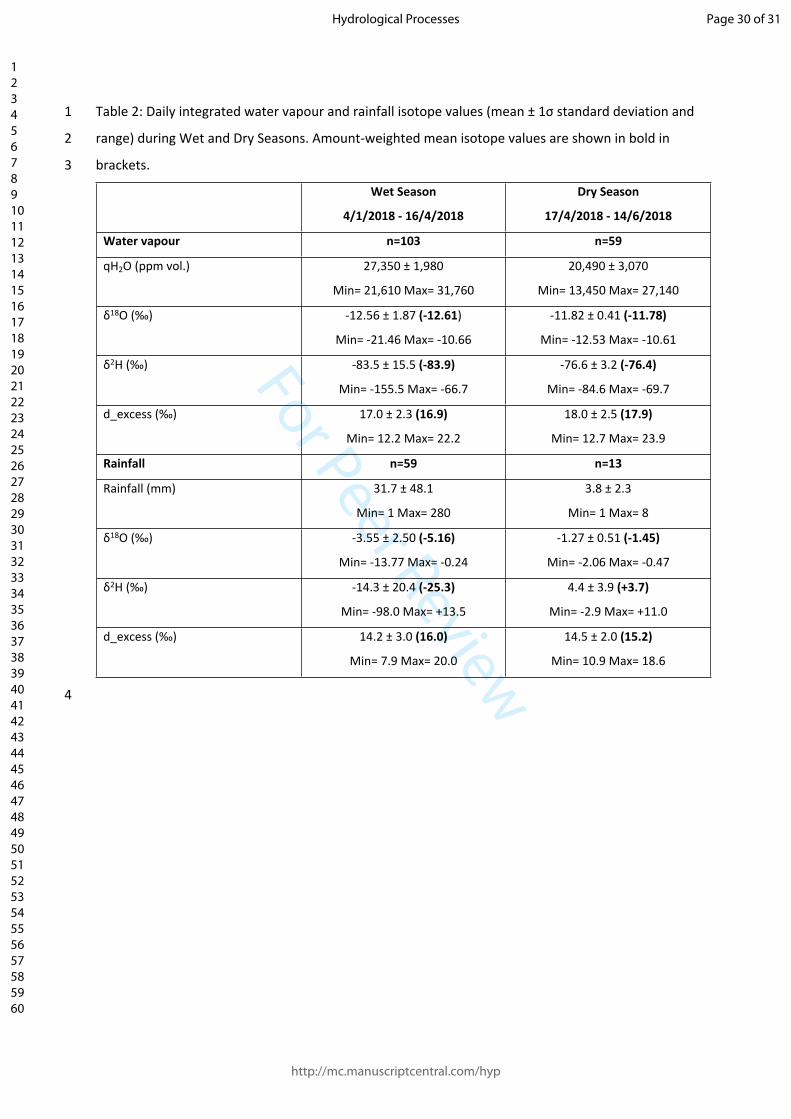
235 Table 2 lists daily integrated isotope values in water vapour and rainfall during the Wet Season
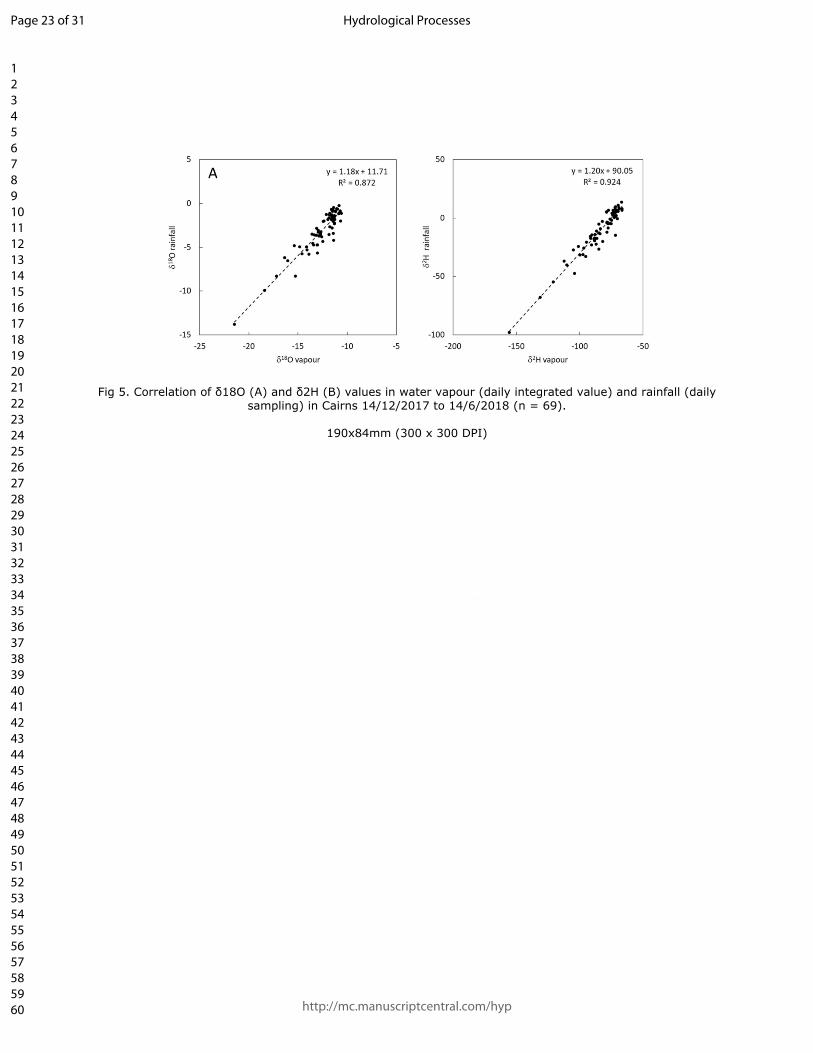
236 (4/1/2018-16/4/2018) and Dry Season observations (17/4/2018-14/6/2018). The seasonal periods
237 were defined by the first and last occurrence of a negative δ18O anomaly in either water vapour or
238 rainfall with the criterium for a negative anomaly being taken to be one standard deviation below
239 the average values for the whole observation period. Ten negative isotope anomalies were
240 observed, four of which were multi-day events. As expected, mean daily rainfall and qH2O was
241 significantly higher in the Wet Season compared to the Dry Season. As expected, there was a strong
242 correlation between δ18O and δ2H values in both rainfall and vapour (not shown). Figure 3 shows the
243 time trend of daily integrated δ18O values and d_excess in water vapour and rainfall, qH2O, rainfall
244 amount and the calculated 18O/16O fractionation (103lnα values) between rainfall and water vapour
245 over the whole observation period (103lnα values for 2H/1H show similar variations and are not
246 shown).
247 During both Wet and Dry Season observations, the daily integrated δ18O values in water vapour
248 ranged from ≈ -12.5 to -10.5 ‰ when excluding the ten events with negative isotope anomalies
249 during the Wet Season. Similarly, δ18O values in daily rainfall ranged in a narrow band of ≈ -2.5 to -
250 0.5 ‰ in both Dry and Wet Seasons except for the ten negative isotope anomalies. Consistent with
251 the ‘amount effect’ (Dansgaard 1964), the mean amount-weighted rainfall δ180 values were
252 substantially lower in the Wet than the Dry Season (-5.16 ‰ and -1.45 ‰, respectively) as were
253 amount-weighted mean δ2H values (-25.27 ‰ and +3.66 ‰, respectively).
254 Regional and local meteorology during the observation period
Page 8 of 31
http://mc.manuscriptcentral.com/hyp
Hydrological Processes
123456789101112131415161718192021222324252627282930313233343536373839404142434445464748495051525354555657585960
For Peer Review
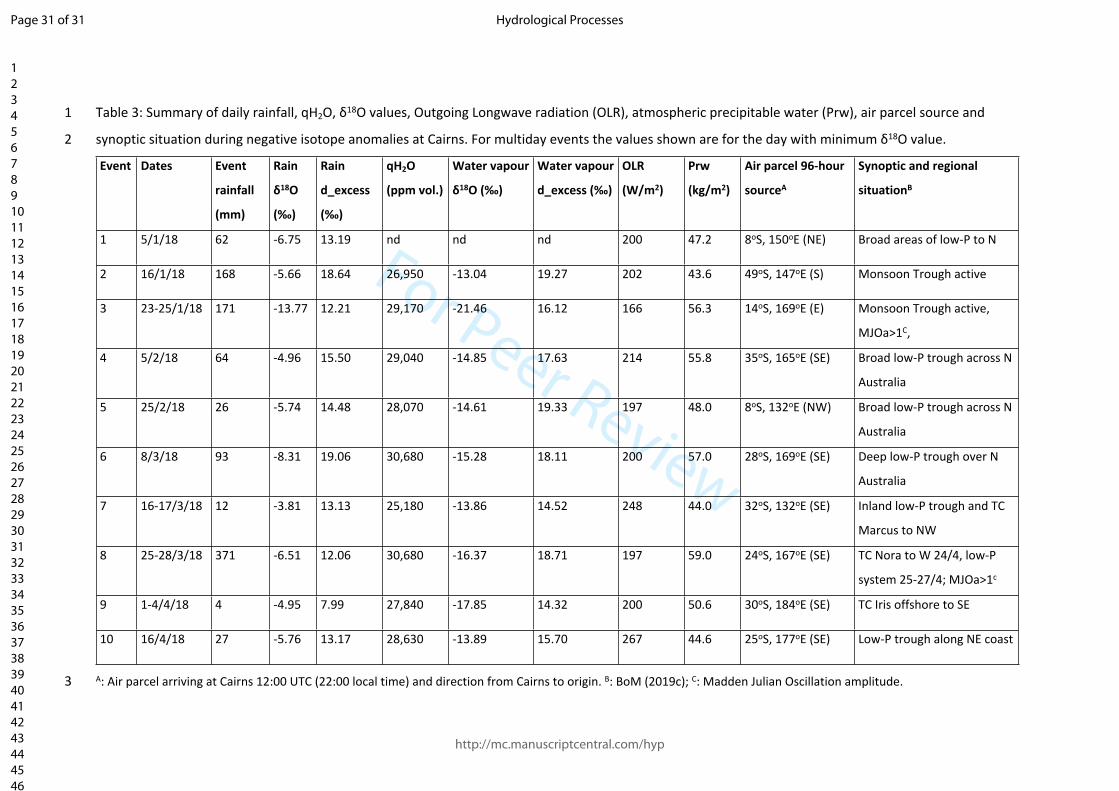
255 The synoptic situation during the ten negative isotope anomalies is summarised in Table 3. The MJO
256 amplitude was above 1 (an indication of strong activity) during 22-31 January (event 3) and 26-28
257 March 2018 (event 8). Two tropical cyclones approached the observation site, TC Nora on 24-27
258 March (event 8) and TC Iris on 2-4 April (event 9). The remaining 18O depleted events were all
259 associated with an active monsoon trough or a low-pressure trough situated across parts of North-
260 eastern Australia. Outside of periods characterised by negative isotope anomalies, air parcel
261 backtracks in both Dry and Wet Seasons were almost exclusively from the SE quadrant.
262 Satellite observations of regional conditions (5o x 5o bounding box around Cairns) showed that the
263 low values of daily mean OLR, an indicator of cloud cover/height and a proxy for convection in
264 tropical areas and high values of atmospheric precipitable water were associated with most negative
265 isotope anomalies. Eight of the ten anomalies had OLR values < 214 W/m2 (i.e. increased cloud
266 cover) compared to the mean for all observation days of 244 W/m2 and seven of the ten events had
267 precipitable water > 47 kg/m2 compared to the mean for all observation days of 40 kg/m2 (Table 3,
268 Fig. 4B).
269 The zonal (u) and meridional (v) wind data (Fig. 4C, D) illustrate the variability of synoptic conditions
270 in this region throughout the measurement period. The Dry Season (from April onward in Fig.4) was
271 characterised by relatively shallow (up to ~800hPa) south-easterly trade winds. Westerlies
272 dominated the mid to upper levels in this period (indicated by large yellow area in Fig. 4C). These
273 `shearing’ conditions inhibit deep vertical cloud development (Sumner & Bonnell 1986), resulting in
274 relatively dry conditions. Rainfall at the measurement location in this period was mainly produced by
275 orographic uplift and was short-lived in nature. In contrast, Wet Season wind profiles were highly
276 variable, highlighting the various circulation patterns that this region experiences due to moving
277 troughs, tropical depressions and cyclones. In general, winds at the surface were weaker than
278 during the Dry Season. Prolonged periods of reversals of meridional winds (becoming northerly) at
279 the surface (Fig. 4D) indicate the presence of the monsoon trough near, or south of, the
280 measurement location. Periods of shallow south-easterlies still occurred during the Wet Season,
281 however westerlies were not as prevalent in the mid troposphere, as compared to the Dry Season.
282 This amongst other factors, favours greater spatial and temporal extent of deep convection during
283 the Wet Season (Sumner & Bonnell 1986).
284 Long-term ground observations at Cairns (BoM 2019b) show that during the Dry Season, over 90% of
285 the time winds are from south-easterly to north-easterly directions. During the Wet Season this
286 percentage reduces to ≈ 80% while the remainder of the time, winds are mostly from northerly
287 directions (17%). Therefore, surface winds at our station are predominantly from the ocean to the
288 southeast, while wind directions from the rainforest west and northwest of the station are very rare.
Page 9 of 31
http://mc.manuscriptcentral.com/hyp
Hydrological Processes
123456789101112131415161718192021222324252627282930313233343536373839404142434445464748495051525354555657585960
For Peer Review
289 Drivers of isotopic variations in daily rainfall and water vapour
290 Broadly parallel changes were observed in both rainfall and vapour isotope compositions throughout
291 the monitoring period including the ten negative isotope anomaly events during the Wet Season
292 (Fig. 3). A similar relationship was observed between δ2H values in water vapour and rainfall (not
293 shown). Nine of these events were observed in both water vapour and rainfall isotopes whereas the
294 event of 5/1/18 was only recorded in rainfall due to a 2-day gap in the water vapour record. The
295 correlation between the isotope compositions of daily integrated water vapour and daily rainfall was
296 robust (p < 0.01) for both δ18O (R2 = 0.87) and δ2H (R2 = 0.92) (Fig. 5). Kurita (2013) previously
297 observed that δ2H values in rainfall and water vapour were highly correlated (R2 = 0.90, p < 0.01) in
298 the Western Pacific / Southeast Asian region suggesting that surface vapour feeds convective
299 updraft which condenses to form precipitation. However, other processes may also result in a similar
300 relationship such as exchange of water between droplets and vapor below the cloud level (Lee &
301 Fung 2008).
302 Rainfall was substantially depleted in 18O and 2H during 15 of the 73 rain days. These rain days
303 accounted for 997 mm (52%) of the total rainfall of 1920 mm during the observation period
304 underscoring their hydrological importance. Rainfall totals varied widely from 4-371 mm during
305 these events (Table 2) and did not correlate with isotopic composition. There was also no significant
306 correlation between rainfall amount and isotopic composition (i.e. no ‘amount effect’ was observed)
307 when considering all daily rainfall data recorded during the observation period even though most
308 events with high rainfall (>50 mm/day) had lower δ18O and δ2H values than events with low rainfall
309 (Fig. 3).
310 The daily integrated water vapour isotope compositions at Cairns are compared to modelled
311 predictions of δ2H values and water vapour mixing ratios (qH2O) in Fig. 6. Most daily δ2H values are
312 consistent with near-equilibrium evaporation from tropical ocean water at temperatures of 20-30oC
313 (red curve). The slight, but widespread, positive isotopic anomaly of Western Pacific Ocean water at
314 20-40oS (Delaygue, Jouzel & Dutay 2000) is the most likely reason that most data points lie slightly
315 above the evaporation curve. Condensation with Rayleigh distillation (cyan curve) and a contribution
316 from vapour derived from evaporation of raindrops (purple curve), may be invoked to explain the
317 compositions falling slightly below the evaporation curve (the curves shown in Fig. 6 were adapted
318 from Worden, Noone & Bowman 2007). Although the model curves correspond to a particular set of
319 conditions, the strongly 2H-depleted compositions recorded during the Wet Season, when the
320 isotopic effects of raindrop evaporation is likely minimal, fall well below the condensation line at
321 high qH2O values and cannot be explained by the modelled scenarios.
Page 10 of 31
http://mc.manuscriptcentral.com/hyp
Hydrological Processes
123456789101112131415161718192021222324252627282930313233343536373839404142434445464748495051525354555657585960

For Peer Review
322 The key observation linking negative isotope anomalies to meteorological events is their association
323 with low pressure systems during the Wet Season (i.e. monsoonal flow, low pressure troughs and
324 tropical cyclones). The largest negative isotope anomaly (daily mean δ18ORain = -13.77 ‰; δ18OVapour =
325 -21.46 ‰) occurred during late January 2018 when OLR was at the lowest recorded level (166 W/m2)
326 and Pw was near the maximum recorded level (56.3 kg/m2) during a strong MJO wet phase (Figs. 3
327 and 4, Table 3).
328 The association with reduced OLR values (increased cloud cover) and increased Pw values indicate
329 that regional-scale organised convective systems (MCSs) and moisture convergence are key drivers
330 of the isotopic variations (e.g. Kurita 2013; Moerman et al. 2013; Risi et al. 2008; Risi, Bony, Vimeux,
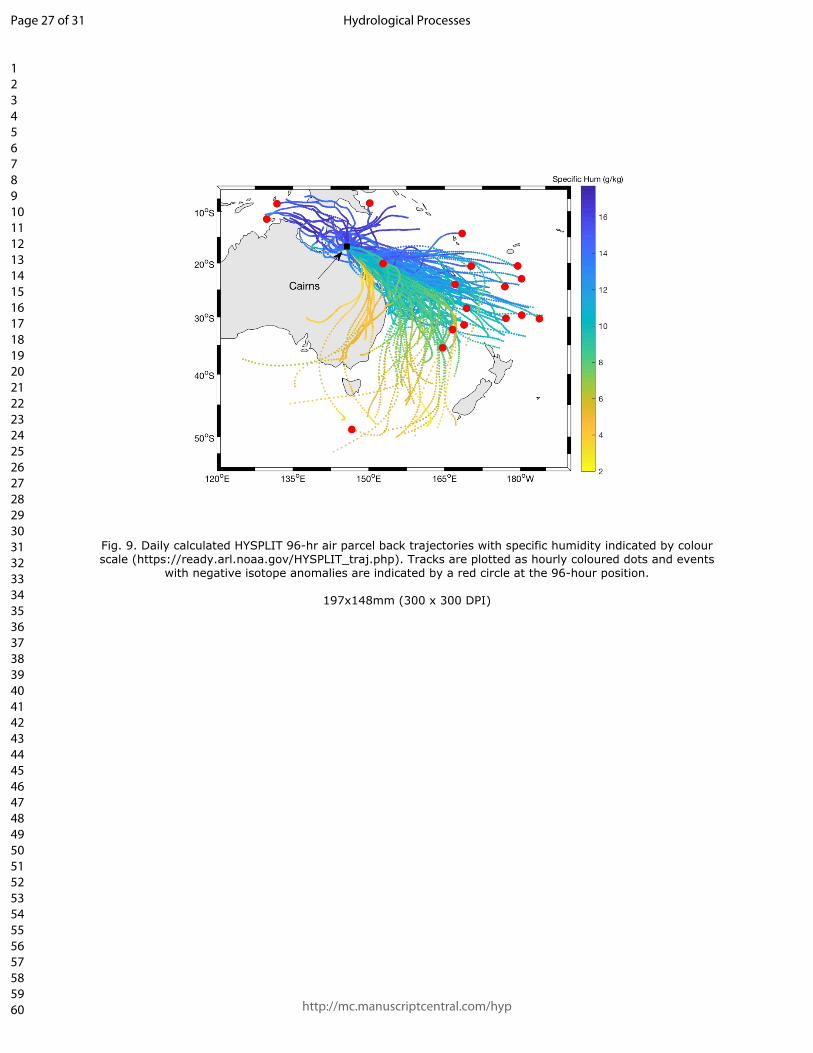
331 Chong & Decroix 2010). In MCSs high stratiform rainfall with large-scale subsidence of water vapour
332 depleted in heavy isotopes from mid-tropospheric levels is the main cause of large negative
333 excursions in δ2H and δ18O values in both water vapour and rainfall (Aggarwal et al. 2016; Kurita
334 2013; Risi et al. 2010). Mechanistically, negative isotope anomalies occur due to the deposition of
335 18O- and 2H-depleted water vapour onto ice particles at altitude which, as they fall, aggregate and
336 melt at mid tropospheric levels. In a previous study from North Australia, Zwart et al. (2018) showed
337 that distinct convective/stratiform rainfall fractions, raining areas, and cloud height distributions had
338 characteristic ranges of rainfall isotope ratios. Negative isotope anomalies occurred when stratiform
339 rainfall fractions and the horizontal extent of raining areas were largest. Similar associations
340 between intra-seasonal isotopic variation and regional meteorological conditions have been
341 documented in other tropical regions (e.g. India: Lekshmy, Midhun, Ramesh, & Jani, (2014); Borneo:
342 Moerman et al. 2013; North Australia: Zwart, Munksgaard, Kurita & Bird 2016; Western Pacific:
343 Conroy, Cobb & Noone 2013) where organised convective systems (i.e. MCSs) produce substantial
344 rainfalls.
345 It is instructive to note that during the ten 18O depleted events the 18O/16O fractionation between
346 rain and water vapour decreased below the expected equilibrium values (103lnα ≈ 9.7 to 11.8 at 0-
347 25oC) reaching values as low as 103lnα ≈ 7. This reduction was usually due to a greater reduction of
348 δ-values in rainfall than in water vapour which indicates that water vapour at ground level did not
349 fully equilibrate with rainfall. However, the evaluation of isotopic equilibrium between rainfall and
350 water vapour is uncertain because rainfall is commonly unequally distributed through the day while
351 water vapour is measured continuously.
352 We observed a seasonal change in the difference between daily amount-weighted d_excess values
353 in water vapour and rainfall (Dry Season difference +2.63 ‰, Wet Season difference +0.93 ‰; Table
354 1). This indicates an enhanced kinetic isotope fractionation during evaporation of seawater at lower
Page 11 of 31
http://mc.manuscriptcentral.com/hyp
Hydrological Processes
123456789101112131415161718192021222324252627282930313233343536373839404142434445464748495051525354555657585960

For Peer Review
355 RH during the Dry Season which leads to higher d-excess values in water vapour (Merlivat & Jouzel
356 1979). A higher relative contribution of water vapour from terrestrial surface water and falling rain
357 drops in the Dry Season may also lead to higher d_excess in vapour (Gat, Bowser & Kendall 1994; Risi
358 et al. 2008).
359 Diurnal isotopic variations
360 The mean diurnal cycles in qH2O, δ18O and d_excess values in the Dry and Wet Seasons are shown in
361 Fig. 7. Water vapour concentration (qH20), δ18O and d_excess values increased sharply in the
362 morning at ≈7:00-8:00 hrs in both seasons as air temperature (Tair) increased and relative humidity
363 (RH) decreased. However, while the qH2O and δ18O peaks lasted until ≈10:00-11:00 hrs, d_excess
364 values remained elevated until ≈18:00-19:00 hrs as Tair decreased and RH increased. d_excess values
365 typically peaked at >19 ‰ (Wet Season) and >22 ‰ (Dry Season) at 10:00-16:00 hrs and a typical
366 minimum of <16 ‰ was observed overnight in both the Wet and Dry Seasons. It is noteworthy that
367 the day-long d_excess peaks were not accompanied by similar peaks in qH2O.
368 Examination of the detailed variations in qH2O, δ18O and d_excess values and local Tair, RH and dew
369 point temperature (Tdp) at the observation site over a 4-day period (Fig. 8) provides some insight into
370 the origin of the diurnal cycles in isotope compositions. During May 2-4, which were mostly cloud-
371 free, we observed heavy overnight dew formation, nightly T minima of 18-19oC and nightly RH
372 maxima of 95-96%. Strong solar irradiance in the early morning led to rapid evaporation of the dew
373 as Tair increased more rapidly than the increase in qH2O (RH decreased even as Tdp increased). These
374 diurnal variations were reflected in slowly decreasing δ18O and qH2O values overnight and sharp
375 increases in the same values in early mornings. In contrast, during May 4-6 when cloud cover
376 increased, night-time Tair was higher (19-21oC), RH lower (89-90%) and sharp morning increases in
377 Tdp were largely absent. During these days the condensation/evaporation cycle of dew did not occur
378 and qH2O and δ18O variations were more subdued. We note that while qH2O values and Tdp
379 observations show broadly consistent trends (Fig. 8) some discrepancy between the two is evident.
380 This was most likely caused by stronger dew formation on the metal roof adjacent to the vapour
381 inlet mast while Tdp observations were obtained in an open area some distance from buildings. The
382 isotopic changes due to dew formation should have no significant effect on daily integrated
383 compositions as the opposing isotopic effects of condensation and evaporation should balance out
384 on a diurnal timescale.
385 In contrast to δ18O and qH2O values, d_excess values showed broad day-long increases (Figs. 7 and 8)
386 which were likely due to strong day-time evapotranspiration of moisture from land and vegetation
387 to the SE as surface winds from the SE quadrant dominate during the day in both Wet and Dry
Page 12 of 31
http://mc.manuscriptcentral.com/hyp
Hydrological Processes
123456789101112131415161718192021222324252627282930313233343536373839404142434445464748495051525354555657585960
For Peer Review
388 Seasons. The absence of a corresponding qH2O peak, which would be expected from the additional
389 input of moisture, may be explained by the simultaneous increase in atmospheric mixing with drier
390 air from higher atmospheric levels as solar radiance increases during the day (Welp et al. 2012). This
391 explanation is supported by observations (not shown) at the monitoring site of low wind speeds (<2
392 km/hr) before ≈7:00 hrs while wind speeds from ≈9:00 hrs until late afternoon typically are in the
393 range 5-15 km/hr. Welp et al. (2012) found that similar mid-day d_excess maxima at several
394 continental sites in the temperate zone could be explained by the combination of entrainment of
395 free tropospheric air and plant transpiration.
396 Air parcel trajectories
397 Here we use daily 96 hr air parcel back trajectories to indicate the direction from which air parcels
398 arrived at Cairns during our 6 month observation period. A 96 hr back-track duration is consistent
399 with the findings of Zwart, Munksgaard, Kurita & Bird (2016) who evaluated the relationship
400 between rainfall isotopic composition and condensation history across a range of trajectory
401 durations (24-168 hrs) at Darwin, Northern Territory, Australia. They demonstrated that correlation
402 between rainfall isotopic composition and cumulative rainfall along the track was strongest over a
403 trajectory duration of ≈ 96 hrs and dropped rapidly thereafter. The annual mean atmospheric
404 moisture residence time in the tropics has previously been estimated to be ≈ 96 hrs (Kurita 2013;
405 Läderach & Sodemann 2016).
406 At Cairns, a clear majority of air parcels arrived from the SW Pacific Ocean to the east and southeast
407 while 15 tracks originated in the Arafura and Timor Seas to the north of Australia (Fig. 9). It is
408 noticeable that the tracks associated with negative isotope anomalies in water vapour and rainfall
409 originated from widely divergent directions, although most were located north of New Zealand at
410 latitudes 15-35oS 96 hrs prior arrival. Tropical cyclones Nora (event 8) and Iris (event 9) were also
411 associated with negative isotope anomalies in Cairns. During TC Nora, 96 hr air parcel track positions
412 varied on a daily scale due to the clockwise circulation around the cyclone core which approached
413 Cairns to within ≈400 km. A similar pattern was previously documented when TC Ita passed close to
414 Cairns in 2014 (Munksgaard et al. 2015).
415 While a detailed investigation of air mass uptake and condensation of moisture along transport
416 paths (see e.g. Sodemann, Schwierz & Wernli 2008) is beyond the scope of this study, the
417 trajectories shown in Fig. 9 provide constraints on the direction from which moisture arrived at
418 Cairns as well as some qualitative information on moisture uptake along the transport path. The
419 hourly specific humidity values along air parcel tracks (colour scale in Fig. 9) indicate that significant
420 moisture uptake occurred as warming air masses moved from the south and southeast over the
Page 13 of 31
http://mc.manuscriptcentral.com/hyp
Hydrological Processes
123456789101112131415161718192021222324252627282930313233343536373839404142434445464748495051525354555657585960
For Peer Review
421 subtropical ocean towards Cairns whereas air parcels moving over the eastern Australian landmass
422 arrived with comparatively low moisture content. In contrast, tropical air parcels arriving from the
423 NE and NW quadrants retained high moisture concentrations throughout their 96 hr trajectories.
424 These contrasting groups of trajectories are often associated with different weather types and air
425 mass precipitation histories as reflected in the isotopic signatures of their moisture content. For
426 example, air masses arriving from tropical latitudes are more likely to have been influences by
427 sustained regional-scale convection systems producing negative δ2H and δ18O anomalies in water
428 vapour and rainfall than is the case for moisture arriving from higher latitudes to the south and
429 southeast.
430
431 CONCLUSIONS
432 We have reported a 6-month water vapour and rainfall isotope dataset from a Southern Hemisphere
433 tropical coastal site to fill a significant gap in the data available for atmospheric circulation
434 modelling. The high-frequency record of surface air moisture has provided near-continuous
435 information on the links between isotopic variations and meteorological events on local to regional
436 spatial scales and on hourly to seasonal temporal scales.
437 We observed ten negative isotope anomalies linked to the occurrence of low-pressure systems
438 during the Wet Season including monsoonal flow, low pressure troughs and two tropical cyclones.
439 The largest negative isotope anomalies occurred when outgoing longwave radiation was at a
440 minimum and atmospheric precipitable water was at a maximum during strong Madden-Julian wet
441 phases. These associations indicated that regional-scale organised convective systems and moisture
442 convergence were key drivers of the isotopic variations.
443 Seasonally variable, diurnal changes in the isotopic compositions in water vapour were driven partly
444 by condensation/re-evaporation cycles of overnight dew formation during cloud-free conditions as
445 well as by daytime evapotranspiration of moisture from local land and vegetation.
446 Water vapour isotope compositions reflected the same meteorological events recorded by rainfall
447 isotopes but provided more detailed and continuous information on atmospheric moisture cycling
448 than the intermittent isotopic record provided by rainfall. In addition, automated real-time isotopic
449 measurement of water vapour by laser spectroscopy is highly cost effective compared to sampling
450 and laboratory-based isotopic analysis of rainfall.
Page 14 of 31
http://mc.manuscriptcentral.com/hyp
Hydrological Processes
123456789101112131415161718192021222324252627282930313233343536373839404142434445464748495051525354555657585960
For Peer Review
451 Further improved global availability of water vapour isotope data will assist in unravelling the
452 mechanisms of moisture sourcing, mixing and recycling in the tropics, and serve to validate
453 atmospheric simulations crucial to predicting hydrological effects of climate change.
454
455 ACKNOWLEDGEMENTS: We thank Rainy Comley for assistance with rainfall sampling and Alex
456 Cheesman for providing local meteorological data.
457
458 REFERENCES
459 Aggarwal, P. K., Romatschke, U., Araguás-Araguás, L., Belachew, D., Longstaffe, F. J., Berg, P. … &
460 Funk, A. (2016). Proportions of convective and stratiform precipitation revealed in water isotope
461 ratios. Nature Geoscience, 9(8), 624–629.
462 Araguás-Araguás, L., Froehlich, K., & Rozanski, K. (2000). Deuterium and oxygen-18 isotope
463 composition of precipitation and atmospheric moisture. Hydrological Processes, 14, 1341-1355.
464 BoM (2019a). Bureau of Meteorology, Climate data online. http://www.bom.gov.au/climate/data/
465 BoM (2019b). Bureau of Meteorology, Wind Roses for Selected Locations in Australia.
466 http://www.bom.gov.au/climate/averages/wind/selection_map.shtml
467 BoM (2019c). Bureau of Meteorology, Climate Summaries.
468 http://www.bom.gov.au/climate/current/
469 Conroy, J.L., Cobb, K.M., & Noone, D. (2013) Comparison of precipitation isotope variability across
470 the tropical Pacific in observations and SWING2 model simulations. Journal of Geophysical Research,
471 118, 5867-5892.
472 Dansgaard, W. (1964). Stable isotopes in precipitation. Tellus XVI, 4, 436-468.
473 Dee, D.P., Uppala, S.M., Simmons, A.J., Berrisford, P., Poli, P., Kobayashi, S. …Vitart, F. (2011). The
474 ERA-Interim reanalysis: configuration and performance of the data assimilation system. Quarterly
475 Journal of the Royal Meteorological Society, 137, 553-597.
476 Delaygue, G., Jouzel, J., & Dutay, J-C. (2000). Oxygen 18 - salinity relationship simulated by an
477 oceanic general circulation model. Earth and Planetary Science Letters, 178, 113-123.
478 Galewsky, J., Steen-Larsen, H.C., Field, R.D., Worden, J., Risi, C., & Schneider, M. (2016). Stable
479 isotopes in atmospheric water vapor and applications to the hydrologic cycle. Reviews of Geophysics,
480 54, 809–865.
Page 15 of 31
http://mc.manuscriptcentral.com/hyp
Hydrological Processes
123456789101112131415161718192021222324252627282930313233343536373839404142434445464748495051525354555657585960
For Peer Review
481 Gat, J.R., Bowser, C.J., & Kendall, C. (1994). The contribution of evaporation from the Great Lakes to
482 the continental atmosphere: estimate based on stable isotope data. Geophysical Research Letters,
483 21 (7), 557-560.
484 Gedzelman, S., Lawrence, J., Gamache, J., Black M., Hindman, E., Black, R. …& Zhang, X. (2003).
485 Probing Hurricanes with Stable Isotopes of Rain and Water Vapor. Monthly Weather Review, 131,
486 1112–1127.
487 Grinsted, A., Moore, J.C., & Jevrejeva, S. (2004), Application of the cross wavelet transform and
488 wavelet coherence to geophysical time series. Nonlinear Processes in Geophysics, 11, 561-566.
489 Gupta, P., Noone, D., Galewsky, J., Sweeney, C., & Vaughn, B.H. (2009). Demonstration of high-
490 precision continuous measurements of water vapor isotopologues in laboratory and remote field
491 deployments using wavelength-scanned cavity ring-down spectroscopy (WS-CRDS) technology.
492 Rapid Communications in Mass Spectrometry, 23, 2534-2542.
493 Hammer, Ø., Harper, D. A. T., & Ryan, P. D. (2001). Paleontological statistics software: package for
494 education and data analysis. Palaeontologia Electronica, (4).
495 Helliker, B.R., Roden, J.S., Cook, C., & Ehleringer, J.R. (2002). A rapid and precise method for
496 sampling and determining the oxygen isotope ratio of atmospheric water vapour. Rapid
497 Communications in Mass Spectrometry, 16, 929-932.
498 Horita, J., & Wesolowski. D.J. (1994). Liquid-vapor fractionation of oxygen isotopes of water from the
499 freezing to the critical temperature. Geochimica et Cosmochimica Acta, 58, 3425–3437.
500 Houze, R. A., Jr. (2004). Mesoscale convective systems. Reviews of Geophysics 42 (4), RG4003.
501 IAEA (2018). International Atomic Energy Agency Global Network of Isotopes in Precipitation.
502 https://www.iaea.org/services/networks/gnip
503 Konecky, B. L., Noone, D. C., & Cobb, K.M. (2019). The influence of competing hydroclimate
504 processes on stable isotope ratios in tropical rainfall. Geophysical Research Letters, 46, 1622–1633.
505 Kurita, N., Noone, D., Risi, C., Schmidt, G. A., Yamada, H., & Yoneyama, K. (2011). Intraseasonal
506 isotopic variation associated with the Madden-Julian oscillation. Journal of Geophysical Research:
507 Atmospheres, 116(D24), 1984–2012.
508 Kurita, N. (2013). Water isotopic variability in response to mesoscale convective system over the
509 tropical ocean. Journal of Geophysical Research: Atmospheres, 118(18), 10,376–10,390.
510 Lawrence, J.R., & Gedzelman, S.R. (1996). Low stable isotope ratios of tropical cyclone rains.
511 Geophysical Research Letters, 23, 527–530.
Page 16 of 31
http://mc.manuscriptcentral.com/hyp
Hydrological Processes
123456789101112131415161718192021222324252627282930313233343536373839404142434445464748495051525354555657585960

For Peer Review
512 Läderach, A., & Sodemann, H. (2016). A revised picture of the atmospheric moisture residence time.
513 Geophysical Research Letters, 43, 924–933.
514 Lee, J.-E., & Fung, I. (2008). “Amount effect” of water isotopes and quantitative analysis of post-
515 condensation processes. Hydrological Processes, 22(1), 1-8.
516 Lekshmy, P.R., Midhun, M., Ramesh, R., & Jani, R.A. (2014). 18O depletion in monsoon rain relates to
517 large scale organized convection rather than the amount of rainfall. Scientific Reports, 4, 5661.
518 Merlivat, L., & Jouzel, J. (1979). Global Climatic Interpretation of the Deuterium-Oxygen 18
519 Relationship for Precipitation. Journal of Geophysical Research, 84, 5029–5033.
520 Moerman, J.W., Cobb, K.M., Adkins, J.F., Sodeman, H., Clark, B., & Tuen, A.A. (2013). Diurnal to
521 interannual rainfall δ18O variations in northern Borneo driven by regional hydrology. Earth and
522 Planetary Science Letters, 369, 108-119.
523 Munksgaard N.C, Wurster, C.M. & Bird, M.I. (2011). Continuous analysis of d18O and dD values of
524 water by diffusion sampling cavity ring-down spectrometry: a novel sampling device for unattended
525 field monitoring of precipitation, ground and surface waters. Rapid Communications in Mass
526 Spectrometry, 25, 3706-3712.
527 Munksgaard, N.C., Zwart, C., Kurita, N., Bass, A., Nott, J., & Bird, M.I. (2015). Stable Isotope Anatomy
528 of Tropical Cyclone Ita, North-Eastern Australia, April 2014. PLoS ONE, 10 (3), e0119728.
529 Munksgaard, N.C., Cheesman, A.W., Gray-Spence, A., Cernusak, L.A., & Bird, M.I. (2018). Automated
530 calibration of laser spectrometer measurements of δ18O and δ2H values in water vapour using a Dew
531 Point Generator. Rapid Communications in Mass Spectrometry, 32, 1008–1014.
532 Risi, C., Bony, S., Vimeux, F., Descroix, L., Ibrahim, B., Lebreton, E., … & Sultan, B. (2008). What
533 controls the isotopic composition of the African monsoon precipitation? Insights from event-based
534 precipitation collected during the 2006 AMMA field campaign. Geophysical Research Letters, 35,
535 L24808.
536 Risi, C., Bony, S., Vimeux, F., Chong, M., & Descroix, L. (2010). Evolution of the stable water isotopic
537 composition of the rain sampled along Sahelian squall lines. Quarterly Journal of the Royal
538 Meteorological Society, 136, 227-242.
539 Rozanski, K., Araguás-Araguás, L., & Gonfiantini, R. (1993). Isotopic patterns in modern global
540 precipitation. Climate Change in Continental Isotopic Records, Geophysical Monograph 78, American
541 Geophysical Union.
Page 17 of 31
http://mc.manuscriptcentral.com/hyp
Hydrological Processes
123456789101112131415161718192021222324252627282930313233343536373839404142434445464748495051525354555657585960

For Peer Review
542 Schulz, M., & Mudelsee, M. (2002). REDFIT: estimating red-noise spectra directly from unevenly
543 spaced paleoclimatic time series. Computers and Geosciences, 28, 421-426.
544 Sumner, G., & Bonell, M. (1986). Circulation and daily rainfall in the North Queensland wet seasons
545 1979–1982. Journal of Climatology, 6 (5), 531-549.
546 Stein, A.F., Draxler, R.R, Rolph, G.D., Stunder, B.J.B., Cohen, M.D., & Ngan, F. (2015). NOAA's HYSPLIT
547 atmospheric transport and dispersion modelling system. Bulletin of the American Meteorological
548 Society, 96, 2059-2077.
549 Stevens, B., & Bony, S. (2013). What are climate models missing? Science, 340, 1053-1054.
550 Wei, Z., Lee, X., Aemisegger, F., Benetti, M., Berkelhammer, M., Casado, M. ... & Yoshimura, K.
551 (2019). Data Descriptor: A global database of water vapor isotopes measured with high temporal
552 resolution infrared laser spectroscopy. Scientific Data, 6, 180302.
553 Welp, L.R., Lee, X., Griffis, T.J., Wen, X-F., Xiao, W., Li, S., … & Huang, J. (2012). A meta-analysis of
554 water vapor deuterium-excess in the midlatitude atmospheric surface layer. Global Biogeochemical
555 Cycles, 26, GB3021.
556 Worden, J., Noone, D., & Bowman, K. (2007). Importance of rain evaporation and continental
557 convection in the tropical water cycle. Nature, 445, 528-532.
558 Zwart, C., Munksgaard, N., Kurita, N., & Bird, M. (2016). Stable isotopic signature of Australian
559 monsoon controlled by regional convection. Quaternary Science Reviews, 151, 228–235.
560 Zwart, C., Munksgaard, N.C., Protat, A., Kurita, N., Lambrinidis, D., & Bird, M.I. (2018). The isotopic
561 signature of monsoon conditions, cloud modes, and rainfall type. Hydrological Processes, 32 (15),
562 2296-2303.
Page 18 of 31
http://mc.manuscriptcentral.com/hyp
Hydrological Processes
123456789101112131415161718192021222324252627282930313233343536373839404142434445464748495051525354555657585960

For Peer Review
Fig. 1. Location of the measurement station at James Cook University (A) near the city of Cairns, QLD, Australia (B).
Page 19 of 31
http://mc.manuscriptcentral.com/hyp
Hydrological Processes
123456789101112131415161718192021222324252627282930313233343536373839404142434445464748495051525354555657585960

For Peer Review
Fig. 2. Power spectrum of δ18O anomaly (Lomb-Scargle, black line) with Red Noise spectrum and 95% confidence interval (red and green line, respectively, generated using REDFIT Schulz and Mudelsee (2002) (A). Subplots give the cross wavelet transform of the standardized 60-minute average vapour δ18O against
wind direction [deg] (B), average relative humidity [%] (C) and average solar radiation [W/m2] (D), indicating the 95% confidence level (black contours) assuming an AR1 noise spectrum and region subject to
edge effects (white shading), power is indicated by the colormap (regions of yellow being higher power). Black arrows indicate phase relationships (right pointing: in-phase, left pointing: anti-phase, down pointing:
δ18O leading the meteorological observations by 90°, up pointing: meteorological observations leading δ18O by 90°. Software by Grinsted et al. 2004 (http://www.glaciology.net/wavelet-coherence).
282x211mm (300 x 300 DPI)
Page 20 of 31
http://mc.manuscriptcentral.com/hyp
Hydrological Processes
123456789101112131415161718192021222324252627282930313233343536373839404142434445464748495051525354555657585960

For Peer Review
Fig. 3. Six-month time line of daily integrated δ18O values in rainfall and water vapour (A), shaded bars indicate MJO with amplitude index > 1 in Western Pacific - Maritime Continent and TC indicates a nearby tropical cyclone; rainfall amount and qH2O (B); d_excess in rainfall and water vapour (C); rainfall-water vapour 18O fractionation (103lnα 18Or-wv), horizontal band indicate equilibrium fractionation between 0 and 25oC (Horita & Wesolowski 1994) (D). The main negative isotope anomalies in rain and water vapour
are indicated by vertical broken lines numbered 1-10.
190x183mm (300 x 300 DPI)
Page 21 of 31
http://mc.manuscriptcentral.com/hyp
Hydrological Processes
123456789101112131415161718192021222324252627282930313233343536373839404142434445464748495051525354555657585960

For Peer Review
Fig. 4. Six-month time line of daily integrated δ18O values in rainfall and water vapour (A), shaded bars indicate MJO with amplitude index > 1 in Western Pacific and TC indicates nearby tropical cyclone. Outgoing Longwave Radiation (OLR) and Precipitable Water in the atmosphere (1000-1 mbar) in a 5o x 5o bounding box centred on Cairns (B). Zonal wind strength (C, positive = westerly, negative = easterly wind direction) and Meridional wind strength (D, positive = southerly, negative = northerly wind direction) at Cairns. The main rain and water vapour negative isotope anomalies are indicated by vertical broken lines numbered 1-
10.
176x127mm (300 x 300 DPI)
Page 22 of 31
http://mc.manuscriptcentral.com/hyp
Hydrological Processes
123456789101112131415161718192021222324252627282930313233343536373839404142434445464748495051525354555657585960
For Peer Review
Fig 5. Correlation of δ18O (A) and δ2H (B) values in water vapour (daily integrated value) and rainfall (daily sampling) in Cairns 14/12/2017 to 14/6/2018 (n = 69).
190x84mm (300 x 300 DPI)
Page 23 of 31
http://mc.manuscriptcentral.com/hyp
Hydrological Processes
123456789101112131415161718192021222324252627282930313233343536373839404142434445464748495051525354555657585960

For Peer Review
Fig. 6. Daily-integrated δ2H versus qH2O values in Cairns water vapour 14/12/2017-14/6/2018; the solid red curve shows the isotopic composition of saturated vapour in equilibrium with ocean water at the
indicated surface temperatures, curves show modelled compositions by Worden et al. (2007) for water vapour derived from tropical ocean evaporation (orange curve), condensation of vapour with Rayleigh distillation (cyan curve) and a 50% contribution by vapour derived by rain evaporation (purple curve).
188x110mm (300 x 300 DPI)
Page 24 of 31
http://mc.manuscriptcentral.com/hyp
Hydrological Processes
123456789101112131415161718192021222324252627282930313233343536373839404142434445464748495051525354555657585960

For Peer Review
Fig. 7. Mean diurnal cycles of qH2O (A) water vapour δ18O values (B), d_excess (C) and relative humidity and temperature (D) during ‘Wet’ and ‘Dry’ observations (‘Wet’: 5/1/18-16/4/18, ‘Dry’: 17/4/18-14/6/18.
Shaded areas indicate 1σ standard deviations.
158x166mm (300 x 300 DPI)
Page 25 of 31
http://mc.manuscriptcentral.com/hyp
Hydrological Processes
123456789101112131415161718192021222324252627282930313233343536373839404142434445464748495051525354555657585960

For Peer Review
Fig. 8. Four-day time series of qH2O (A) water vapour δ18O values and d_excess (B) and relative humidity (RH), air temperature (Air T) and dew point temperature (Dew PtT) (C). Data gaps are due to calibration at
20-hour intervals. The onset of evaporation of overnight dew is indicated by vertical broken lines.
189x148mm (300 x 300 DPI)
Page 26 of 31
http://mc.manuscriptcentral.com/hyp
Hydrological Processes
123456789101112131415161718192021222324252627282930313233343536373839404142434445464748495051525354555657585960
For Peer Review
Fig. 9. Daily calculated HYSPLIT 96-hr air parcel back trajectories with specific humidity indicated by colour scale (https://ready.arl.noaa.gov/HYSPLIT_traj.php). Tracks are plotted as hourly coloured dots and events
with negative isotope anomalies are indicated by a red circle at the 96-hour position.
197x148mm (300 x 300 DPI)
Page 27 of 31
http://mc.manuscriptcentral.com/hyp
Hydrological Processes
123456789101112131415161718192021222324252627282930313233343536373839404142434445464748495051525354555657585960

For Peer Review
Graphical Abstract
Coupled rainfall and water vapour stable isotope time series reveal tropical atmospheric processes on multiple timescales
Niels C. Munksgaard, Costijn Zwart, Jordahna Haig, Lucas A. Cernusak, Michael I. Bird
High-frequency stable isotope data are useful for validating atmospheric moisture circulation
models. Here we present a 6-month record of O- and H-isotope compositions in water vapour and
daily rainfall from Northeast Australia and interpret the isotopic records in the context of
contemporaneous meteorological observations. Water vapour isotope compositions reflected the
same meteorological events as recorded in rainfall isotopes but provided much more detailed and
continuous information on atmospheric moisture cycling.
Page 28 of 31
http://mc.manuscriptcentral.com/hyp
Hydrological Processes
123456789101112131415161718192021222324252627282930313233343536373839404142434445464748495051525354555657585960
For Peer Review
1 Table 1: Source of daily climate data.
Parameter Web site
Outgoing Longwave
Radiation (OLR)
https://www.esrl.noaa.gov/psd/data/gridded/data.uninterp_OLR.html
Precipitable water (Pw) https://www.esrl.noaa.gov/psd/data/gridded/data.ncep.reanalysis.surface.html
Zonal (u) and meridional
(v) wind
https://www.ecmwf.int/en/forecasts/datasets/archive-datasets/reanalysis-
datasets/era-interim
Madden-Julian Oscillation
(MJO)
http://www.bom.gov.au/climate/mjo/
2
Page 29 of 31
http://mc.manuscriptcentral.com/hyp
Hydrological Processes
123456789101112131415161718192021222324252627282930313233343536373839404142434445464748495051525354555657585960
For Peer Review
1 Table 2: Daily integrated water vapour and rainfall isotope values (mean ± 1σ standard deviation and
2 range) during Wet and Dry Seasons. Amount-weighted mean isotope values are shown in bold in
3 brackets.
Wet Season
4/1/2018 - 16/4/2018
Dry Season
17/4/2018 - 14/6/2018
Water vapour n=103 n=59
qH2O (ppm vol.) 27,350 ± 1,980
Min= 21,610 Max= 31,760
20,490 ± 3,070
Min= 13,450 Max= 27,140
δ18O (‰) -12.56 ± 1.87 (-12.61)
Min= -21.46 Max= -10.66
-11.82 ± 0.41 (-11.78)
Min= -12.53 Max= -10.61
δ2H (‰) -83.5 ± 15.5 (-83.9)
Min= -155.5 Max= -66.7
-76.6 ± 3.2 (-76.4)
Min= -84.6 Max= -69.7
d_excess (‰) 17.0 ± 2.3 (16.9)
Min= 12.2 Max= 22.2
18.0 ± 2.5 (17.9)
Min= 12.7 Max= 23.9
Rainfall n=59 n=13
Rainfall (mm) 31.7 ± 48.1
Min= 1 Max= 280
3.8 ± 2.3
Min= 1 Max= 8
δ18O (‰) -3.55 ± 2.50 (-5.16)
Min= -13.77 Max= -0.24
-1.27 ± 0.51 (-1.45)
Min= -2.06 Max= -0.47
δ2H (‰) -14.3 ± 20.4 (-25.3)
Min= -98.0 Max= +13.5
4.4 ± 3.9 (+3.7)
Min= -2.9 Max= +11.0
d_excess (‰) 14.2 ± 3.0 (16.0)
Min= 7.9 Max= 20.0
14.5 ± 2.0 (15.2)
Min= 10.9 Max= 18.6
4
Page 30 of 31
http://mc.manuscriptcentral.com/hyp
Hydrological Processes
123456789101112131415161718192021222324252627282930313233343536373839404142434445464748495051525354555657585960
For Peer Review
1 Table 3: Summary of daily rainfall, qH2O, δ18O values, Outgoing Longwave radiation (OLR), atmospheric precipitable water (Prw), air parcel source and
2 synoptic situation during negative isotope anomalies at Cairns. For multiday events the values shown are for the day with minimum δ18O value.
Event Dates Event
rainfall
(mm)
Rain
δ18O
(‰)
Rain
d_excess
(‰)
qH2O
(ppm vol.)
Water vapour
δ18O (‰)
Water vapour
d_excess (‰)
OLR
(W/m2)
Prw
(kg/m2)
Air parcel 96-hour
sourceA
Synoptic and regional
situationB
1 5/1/18 62 -6.75 13.19 nd nd nd 200 47.2 8oS, 150oE (NE) Broad areas of low-P to N
2 16/1/18 168 -5.66 18.64 26,950 -13.04 19.27 202 43.6 49oS, 147oE (S) Monsoon Trough active
3 23-25/1/18 171 -13.77 12.21 29,170 -21.46 16.12 166 56.3 14oS, 169oE (E) Monsoon Trough active,
MJOa>1C,
4 5/2/18 64 -4.96 15.50 29,040 -14.85 17.63 214 55.8 35oS, 165oE (SE) Broad low-P trough across N
Australia
5 25/2/18 26 -5.74 14.48 28,070 -14.61 19.33 197 48.0 8oS, 132oE (NW) Broad low-P trough across N
Australia
6 8/3/18 93 -8.31 19.06 30,680 -15.28 18.11 200 57.0 28oS, 169oE (SE) Deep low-P trough over N
Australia
7 16-17/3/18 12 -3.81 13.13 25,180 -13.86 14.52 248 44.0 32oS, 132oE (SE) Inland low-P trough and TC
Marcus to NW
8 25-28/3/18 371 -6.51 12.06 30,680 -16.37 18.71 197 59.0 24oS, 167oE (SE) TC Nora to W 24/4, low-P
system 25-27/4; MJOa>1c
9 1-4/4/18 4 -4.95 7.99 27,840 -17.85 14.32 200 50.6 30oS, 184oE (SE) TC Iris offshore to SE
10 16/4/18 27 -5.76 13.17 28,630 -13.89 15.70 267 44.6 25oS, 177oE (SE) Low-P trough along NE coast
3 A: Air parcel arriving at Cairns 12:00 UTC (22:00 local time) and direction from Cairns to origin. B: BoM (2019c); C: Madden Julian Oscillation amplitude.
Page 31 of 31
http://mc.manuscriptcentral.com/hyp
Hydrological Processes
123456789101112131415161718192021222324252627282930313233343536373839404142434445464748495051525354555657585960