Embed Size (px)
Citation preview

CHARITYBENCHMARKS
SECTOR
2019REPORT
IN PARTNERSHIP WITH THE INSTITUTE OF FUNDRAISINGMEMBERS’ SUMMARY & REPORT
Every charity and fundraiser I talk to wants to know about the magic ‘B’ word – benchmarking.
At a time when many charities are experiencing challenges, and adopting new approaches and strategies in their fundraising, it’s crucial to be able to get a sense of where you are in the wider context of the charity sector. Shared information and collaboration to pool data is essential to this, and I’m delighted that Charity Benchmarks is here to provide a longitudinal and overarching view of what’s happening in fundraising. It’s a hugely valuable asset that should be part of every fundraiser’s suite of resources to help inform their fundraising strategies.
FOREWORD BY DANIEL FLUSKEY HEAD OF POLICY & EXTERNAL AFFAIRS, INSTITUTE OF FUNDRAISING
“A great, insightful report
that really does add to our sector knowledge.
I’m so pleased we got involved.”JOE JENKINS, DIRECTOR OF
SUPPORTER IMPACT & INCOME, THE CHILDREN’S SOCIETY
I’d like to thank Open and Freestyle Marketing for instigating this project and, of course, all the charities who take part. The sharing of this information benefits the whole sector, as well as those who are active participants – and I’d encourage more charities to take part in the future as the more data that is available, the richer the insights will be.
I’m delighted that the IoF is able to partner on Charity Benchmarks and look forward to it going from strength to strength in future years.
CHARITYBENCHMARKS.ORG CHARITY BENCHMARKS 2019 2
THANK YOU!We would like to say a huge thank you to all the charities who took part in Charity Benchmarks 2019. We know that it’s no small task to collate and supply everything, so we are extremely grateful to the fundraising and data teams who have worked with us to make this happen.
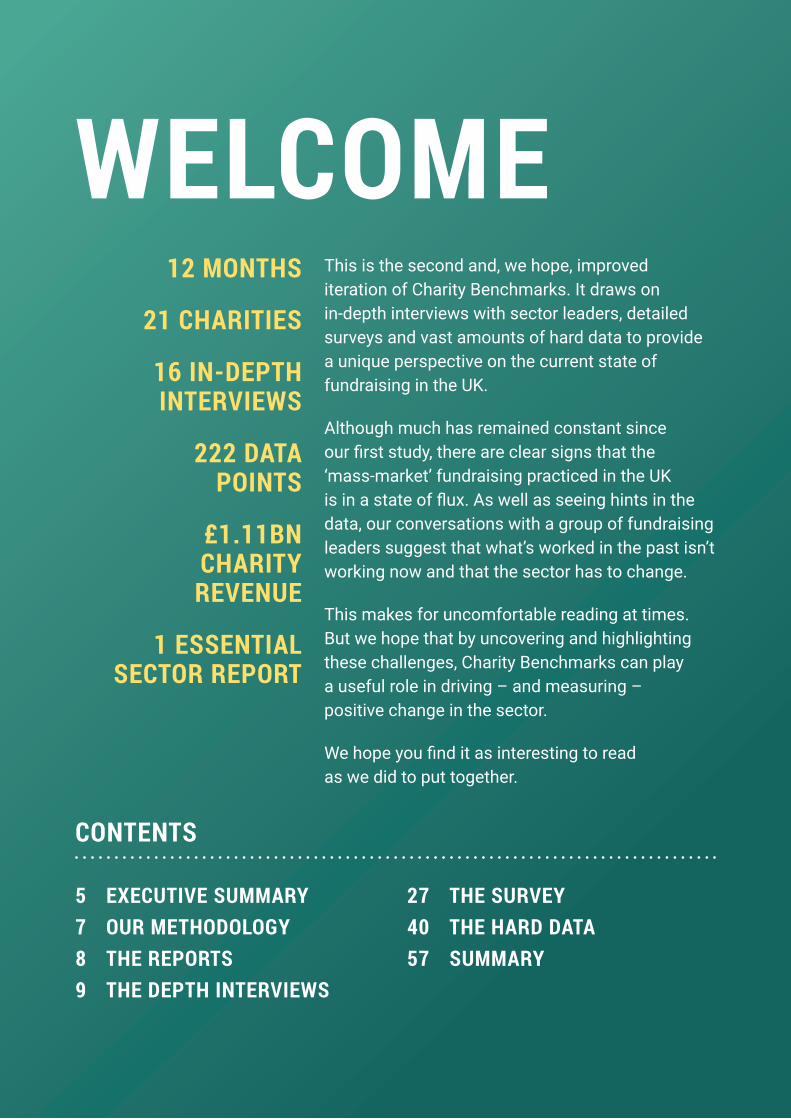
This is the second and, we hope, improved iteration of Charity Benchmarks. It draws on in-depth interviews with sector leaders, detailed surveys and vast amounts of hard data to provide a unique perspective on the current state of fundraising in the UK.
Although much has remained constant since our first study, there are clear signs that the ‘mass-market’ fundraising practiced in the UK is in a state of flux. As well as seeing hints in the data, our conversations with a group of fundraising leaders suggest that what’s worked in the past isn’t working now and that the sector has to change.
This makes for uncomfortable reading at times. But we hope that by uncovering and highlighting these challenges, Charity Benchmarks can play a useful role in driving – and measuring – positive change in the sector.
We hope you find it as interesting to read as we did to put together.
WELCOME12 MONTHS
21 CHARITIES
16 IN-DEPTH INTERVIEWS
222 DATA POINTS
£1.11BN CHARITY
REVENUE
1 ESSENTIAL SECTOR REPORT
CONTENTS
5 EXECUTIVE SUMMARY7 OUR METHODOLOGY8 THE REPORTS9 THE DEPTH INTERVIEWS
27 THE SURVEY40 THE HARD DATA57 SUMMARY

EXECUTIVE SUMMARY
The project covers all areas of fundraising, analysing and benchmarking each charity’s income. Uniquely, it also includes comparisons on direct fundraising costs and numbers of staff – across all fundraising and within individual teams.
Alongside the hard data there is a qualitative survey to gauge views and trends, as well as interviews with sector leaders to deepen perspectives and value.
SCOPE AND SCALE The study includes data from 21 charities – representing £1.1bn of fundraised income, £196m of direct fundraising cost and the activity of 1,488 staff.
PART 1: THE DEPTH INTERVIEWS In order to provide a ‘horizon scanning’ perspective as well as the lag indicators of past-year performance, we interviewed sixteen sector leaders about how they saw the state of the market.
Inevitably not all of those interviewed agreed, but there was a general consensus that fundraising faces a ‘burning platform’ situation. Not every charity is in the same position, but broadly the established, mass-market approaches are in decline – and for most there are no obvious replacements available.
This decline is being driven by a combination of demographics and consumer expectations, with old models built for old audiences failing to work for the market as it exists now.
As well as the need to continue to generate profit in order to deliver charities’ work, a lack of investment, skills, organisational buy-in and understanding at every level combine to make it difficult to innovate towards a long-term solution.
An organisation-wide engagement strategy was cited as the most likely solution to these challenges, with particular opportunities being presented by corporate partnerships, online platforms, peer-to-peer fundraising and gaming. But many charities hadn’t yet fully developed what engagement actually means, how it will work and the financial dynamics.
PART 2: THE SURVEY As in the 2018 study, we surveyed all participants to track performance, confidence and areas of challenge.
We saw a marked drop in the proportion of charities that hit their fundraising targets for the year (11% from 44%). However, fundraisers were optimistic that their net income would rise in the coming year (56% from 33%). We believe this reflects a contraction in spending and consequent improvement in ROI and net income. This hypothesis is backed up by the fact that supporter acquisition has fallen from the top priority for fundraisers down to fourth place.
67% of those surveyed thought that their team would need structural changes in the year ahead, with 89% saying that the team’s skill set would need to change. Digital skills were by far the most important in this respect – and also the most challenging to recruit.
CHARITYBENCHMARKS.ORG CHARITY BENCHMARKS 2019 5
Charity Benchmarks was set up in 2018, in partnership with the IoF, with the aim of providing information and insight to help fundraisers make better decisions and raise more money.

The perceived ambition of trustee boards fell slightly as did trustee risk appetite – which could be problematic in view of the need for innovation.
PART 3: THE HARD DATA As in the 2018 study, we took ‘hard’ data on revenues, costs and other concrete metrics and performed a range of analysis on the data set.
The product portfolios of our participants are surprisingly diverse, with different charities depending on different forms of fundraising to varying degrees.
On aggregate, however, the bulk of fundraised income came from legacy donations (£291m) followed by statutory, trusts and National Lottery (£164m) and regular giving (£156m). It is sobering to reflect in these turbulent political times how our biggest source of income is closely tied to house and share prices.
As ever, the majority of fundraising spend went on recruiting new supporters (£68m) rather than looking after existing supporters (£36m). And the majority of recruitment spend went on regular givers although this figure fell slightly.
In terms of ROI, legacies (66:1) and statutory and lottery funding (133:1) were way out in front. Regular giving returned 4:1 (up slightly from last year due to declining recruitment spend) while lotteries and raffles came last with 1.7:1.
The total number of donors giving to our participants fell. This was driven primarily by the lack of emergency appeals (around 600,000 fewer donors) but also by a worrying fall in regular giving (around 175,000) showing that attrition has outpaced recruitment.
The number of donors who are contactable by email, SMS and telemarketing under the terms of GDPR all rose, while donors contactable by mail fell slightly. Volumes of social media followers and website visits climbed significantly, but the completion rate of donations (i.e. people who visit a donation page and actually give) was only 24%. Despite charities efforts to persuade these donors to give a regular gift, 95% of donations made online were one-off payments.
CONCLUSION The fundraising sector is clearly struggling, and needs to diversify in terms of both approaches and audiences. In order to do so, new skills, resources and ways of working are needed – not just in fundraising teams, but across organisations.
We believe that Charity Benchmarks has an important role to play in this process. The study has been presented to several trustee boards already, and we urge IoF members to use its findings to help explain and reinforce the need for change.
We also urge members to participate. The more organisations that share their data, the more useful the study becomes, and the more the sector will benefit.
CHARITYBENCHMARKS.ORG CHARITY BENCHMARKS 2019 6

THE DEPTH INTERVIEWSWe undertook depth interviews with 16 sector leaders – exploring how they see the fundraising landscape today and what they think the coming years will bring.
THE SURVEYWe asked our participants a series of questions about their programmes, their organisations and how they felt about the future.
THE HARD DATAWe collected and crunched the numbers sitting behind over a billion pounds of charitable income. We looked at who and where that money came from, what it cost to generate and the teams that helped deliver it.
OUR METHODOLOGY (AND ITS LIMITATIONS)Charity Benchmarks 2019 consists of three distinct but interrelated studies. In the case of the latter two, this was our second year – which meant we began to see some interesting trends.
While we are happy with the results of this approach, there are, of course, limitations that we want to highlight.
First, and most significant, is that the 2018 and 2019 datasets are not the same. Some charities from the first project decided not to take part in this one and, conversely, some new ones joined us.
Wherever possible we secured two years’ worth of Hard Data from new participants. But the fact remains that where we talk about year-on-year trends we have to exclude those for whom we don’t have both years’ data. This means that ‘the figures’ for each year will vary according to whether we’re using the entire dataset or not.
Secondly, and unavoidably, significant swings in income (particularly at very large charities) and reporting anomalies can have a disproportionate effect on the numbers. Wherever possible we have tried to highlight this but the fact remains that even at £1bn of income, this project still isn’t big enough to flatten its outliers!
Finally, the increased qualitative/subjective content in this year’s report means that more opinion and speculation are presented alongside the numbers. Even within the ‘factual’ part of the report, the data we have chosen to illustrate represents a significant selection bias in favour of what we felt was most interesting.
That’s why we’d love to hear your take on what’s presented here. And participants can, of course, undertake their own bespoke analysis using (free) Tableau software. Please get in touch with your ideas or to find out more.
CHARITYBENCHMARKS.ORG CHARITY BENCHMARKS 2019 7
CHARITYBENCHMARKS.ORG CHARITY BENCHMARKS 2019 8
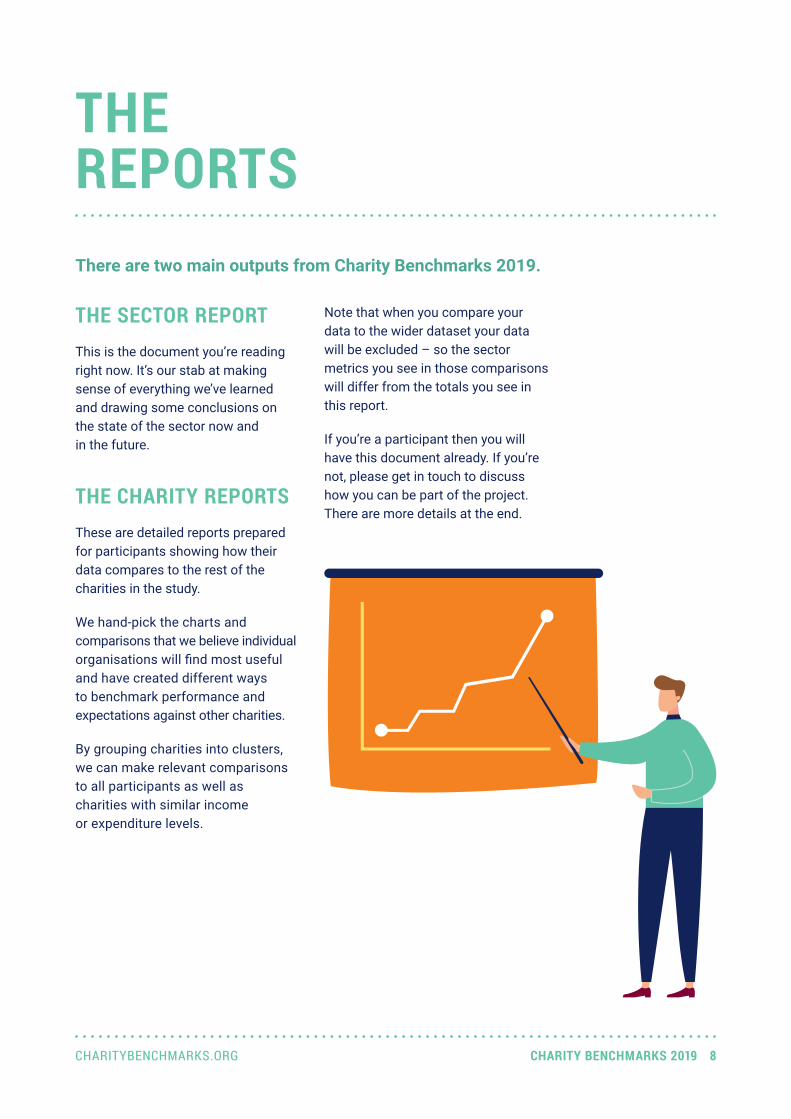
THE SECTOR REPORTThis is the document you’re reading right now. It’s our stab at making sense of everything we’ve learned and drawing some conclusions on the state of the sector now and in the future.
THE CHARITY REPORTSThese are detailed reports prepared for participants showing how their data compares to the rest of the charities in the study.
We hand-pick the charts and comparisons that we believe individual organisations will find most useful and have created different ways to benchmark performance and expectations against other charities.
By grouping charities into clusters, we can make relevant comparisons to all participants as well as charities with similar income or expenditure levels.
Note that when you compare your data to the wider dataset your data will be excluded – so the sector metrics you see in those comparisons will differ from the totals you see in this report.
If you’re a participant then you will have this document already. If you’re not, please get in touch to discuss how you can be part of the project. There are more details at the end.
There are two main outputs from Charity Benchmarks 2019.
THE REPORTS

THE DEPTH INTERVIEWS
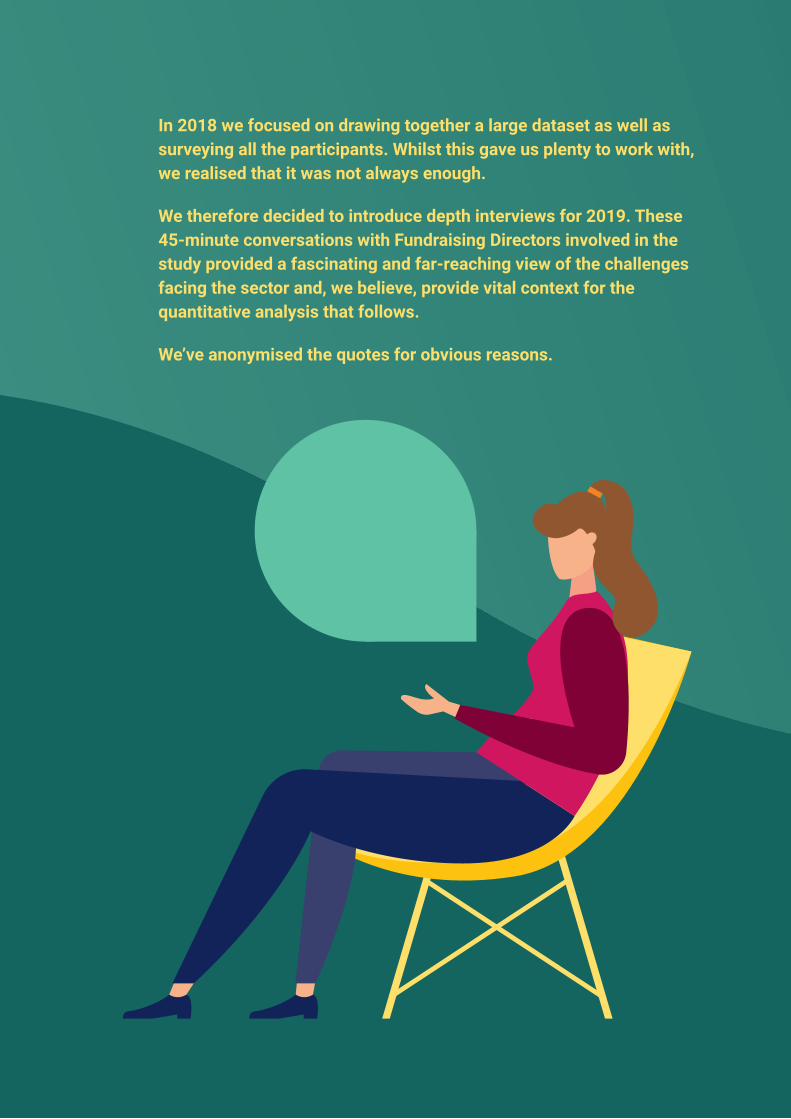
In 2018 we focused on drawing together a large dataset as well as surveying all the participants. Whilst this gave us plenty to work with, we realised that it was not always enough.
We therefore decided to introduce depth interviews for 2019. These 45-minute conversations with Fundraising Directors involved in the study provided a fascinating and far-reaching view of the challenges facing the sector and, we believe, provide vital context for the quantitative analysis that follows.
We’ve anonymised the quotes for obvious reasons.
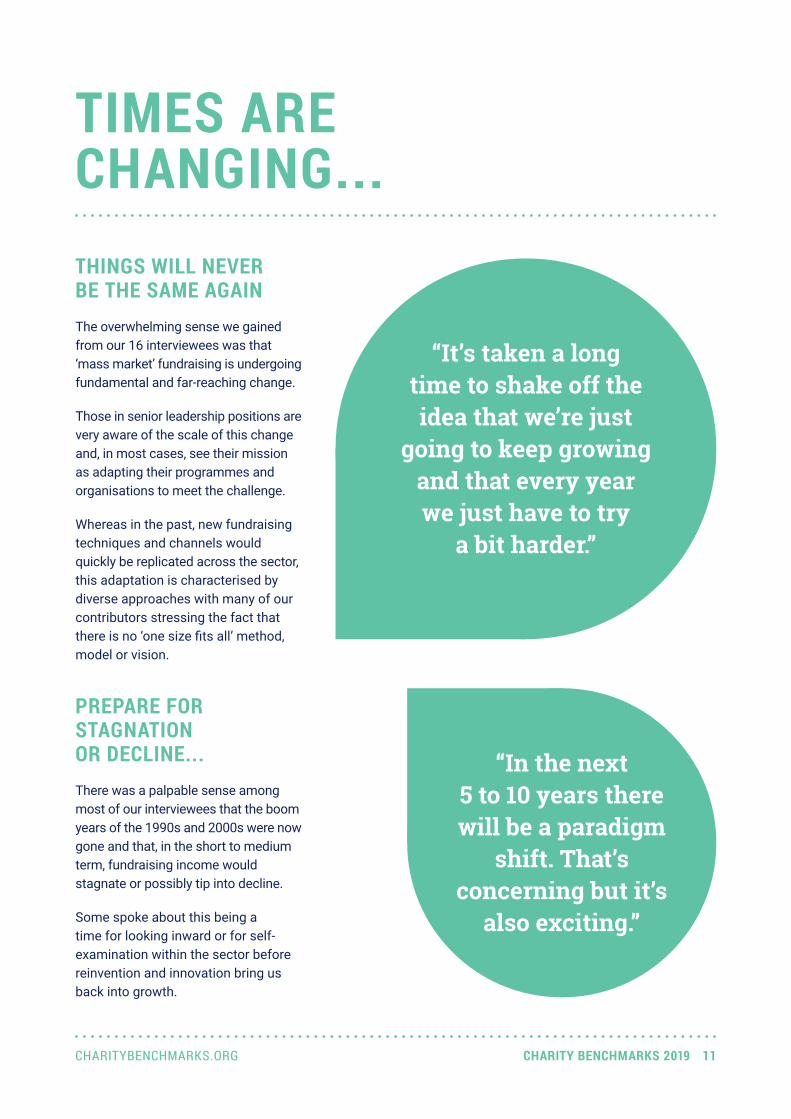
THINGS WILL NEVER BE THE SAME AGAINThe overwhelming sense we gained from our 16 interviewees was that ‘mass market’ fundraising is undergoing fundamental and far-reaching change.
Those in senior leadership positions are very aware of the scale of this change and, in most cases, see their mission as adapting their programmes and organisations to meet the challenge.
Whereas in the past, new fundraising techniques and channels would quickly be replicated across the sector, this adaptation is characterised by diverse approaches with many of our contributors stressing the fact that there is no ‘one size fits all’ method, model or vision.
PREPARE FOR STAGNATION OR DECLINE...There was a palpable sense among most of our interviewees that the boom years of the 1990s and 2000s were now gone and that, in the short to medium term, fundraising income would stagnate or possibly tip into decline.
Some spoke about this being a time for looking inward or for self-examination within the sector before reinvention and innovation bring us back into growth.
TIMES ARE CHANGING...
“In the next 5 to 10 years there will be a paradigm
shift. That’s concerning but it’s
also exciting.”
“It’s taken a long time to shake off the idea that we’re just
going to keep growing and that every year we just have to try
a bit harder.”
CHARITYBENCHMARKS.ORG CHARITY BENCHMARKS 2019 11

“That mass market paradigm has now reached the end of its useful life and it’s now for us and the next generation of fundraisers to discover what’s going to be the best way to resource these publicly funded charities and causes into the future.”
CHARITYBENCHMARKS.ORG CHARITY BENCHMARKS 2019 12
THE FUNDRAISING ENVIRONMENTNew laws (particularly GDPR) combined with a more hostile press and regulatory environment have accelerated the already decreasing viability of ‘old’ high-volume Direct Marketing models.
Austerity, the threat of Brexit and exchange rate fluctuations have all led to an atmosphere of uncertainty which has seen organisations cutting costs and reducing ‘non-core’ activity in order to protect net income.
In many cases, this means that the testing and innovation necessary to ‘future proof’ programmes hasn’t happened.
WHAT’S MAKING LIFE SO DIFFICULT?
THE FUNDRAISING AUDIENCEDemographic shifts and generational differences in how people engage with and support charities were frequent topics of conversation.
The millennials have come of age – joining Gen X as the dominant income earners in the UK – and have a profoundly different outlook to their parents and grandparents for whom many existing programmes were designed.
The fact that this shift is so closely entwined with technology and consumer expectations further complicates charities’ efforts to engage supporters and raise funds.
“As a sector we’ve had huge challenges
with the negative external exposure,
press, GDPR and regulation.”
“There is a huge shift in the way
millennials and Gen Z see the world, but they aren’t represented on
charity boards.”
CHARITYBENCHMARKS.ORG CHARITY BENCHMARKS 2019 13
“We have to sell what we’ve got. We can repackage
it. But we can’t reinvent it.”
“It feels like the gap between public
expectations and what we’re providing as a sector
is widening. We’re not meeting the pace and types of experiences
people expect.”
CHANGING CONSUMER EXPECTATIONSRecent years have seen the likes of Netflix, Amazon and Uber become part of everyday life – resulting in a huge shift in expectations in terms of choice, control, convenience and transparency. Consumers want organisations to understand them, to meet/pre-empt their needs, to listen to them and to respond accordingly.
The general feeling was that charities have struggled to keep up with this and the gap between expectation and reality is widening rather than closing.
Subscriptions, for example, are an increasingly common model for commercial organisations seeking to secure and grow value from their customers. Yet charities – the pioneers of monthly payments – have hardly changed their approach and deliver an experience that is far less personalised, optimised and controllable.
NEW COMPETITORSThe last few years have seen a sudden rise of social enterprises and ‘purpose-led’ commercial activity. Whereas once there was a clear divide between the commercial and the charity sector, businesses are increasingly presenting themselves in terms of achieving positive social and environmental impact.
CHARITYBENCHMARKS.ORG CHARITY BENCHMARKS 2019 14
Unlike charities, businesses can and do orientate their entire proposition around customer needs – and they have the money, marketing expertise, and technology to deliver a better ‘supporter experience’.
While none of our respondents suggested that significant sums of ‘charitable’ money were being diverted as a consequence, there was a palpable sense that this was both a threat and an opportunity in the Individual Giving market.
THE CHALLENGE OF THE DIGITAL ENVIRONMENTAs our figures will show, charities have fallen behind relative to the commercial sector when it comes to engaging and transacting online.
While the digital/social environment offers vast opportunities, charities have clearly found it difficult to navigate a world of multi-platform marketing, non-linear journeys, complex attribution and new models of data ownership.
Without the certainties of simple, transactional models, it’s hard to demonstrate ROI and make a case for investment – assuming the significant sums required are available in the first place!
“We have to look towards innovation
and inspiration because BAU and the current model
is not fit for purpose for the future.”
CHARITYBENCHMARKS.ORG CHARITY BENCHMARKS 2019 15
CHARITYBENCHMARKS.ORG CHARITY BENCHMARKS 2019 16
“The space for charities is closing. People increasingly don’t see a distinction between charity, social enterprises and corporates doing good. Those charities that don’t adapt will get lost; they’ll lose their relevance.”
WHY HAVE CHARITIES STRUGGLED TO ADAPT?BECAUSE THEY HAVEN’T HAD TO!For years, charities have experienced year on year growth and, as noted above, a succession of new channels and methods have appeared that have reinvigorated the core model of Regular Giving recruitment.
As a result, the necessity of diversification hasn’t really made itself felt until recently.
“In the past, new channels have...
released pressure valves – masking the reality of deep
stagnation.”
“We’re still doing the same old thing and expecting the same response.”
“When you’re in a situation of very gradual,
long term decline, it doesn’t necessarily feel like a burning platform
in any given year.”
CHARITYBENCHMARKS.ORG CHARITY BENCHMARKS 2019 17
CHARITYBENCHMARKS.ORG CHARITY BENCHMARKS 2019 18
BECAUSE THEY’RE NOT SUITED TO RADICAL CHANGEMany of our interviewees noted that the challenges facing fundraising can’t be fixed in the fundraising department alone – the whole organisation needs to be involved from the board downwards.
There was a definite feeling among many respondents that while there was an understanding of the need for change, actually driving it through the organisation was a very different matter.
The difficulty of fostering innovation and building a ‘one organisation’ strategy for all types of support were common themes – as was the challenge of putting in place the necessary culture and infrastructure.
“Broadly, the charity sector is
struggling to adapt at the pace that’s
needed to enable it to be relevant.”
“We are still really tied to an old model and
how do you shift away from that? How do you keep
the lights on whilst you change model? That’s
the challenge.”

“There is a gap at senior levels. We
need broader skills and experience in leadership roles from outside of the sector. There’s a lack of
pace, experience, disruption.”
“It’s not just the charity sector, it’s the
wider economy. There’s a massive shortage of digital
and data skills and that’s only going to get worse
with Brexit.”
BECAUSE OF A SKILLS GAPFollowing on from the above, many respondents talked about skills gaps across their organisations.
An obvious deficit was in people skilled in digital marketing – and the CRM and data analysis on which it depends.
On a more strategic level, however, there was a feeling that boards and executive teams suddenly found themselves in need of skills, capacity and confidence in the area of cultural and organisational change.
CHARITYBENCHMARKS.ORG CHARITY BENCHMARKS 2019 19
“At the heart of it is talent, and you see that at every level in organisations. Boards and executive teams need to have the capability, confidence and commitment to make the changes needed in order to adapt to the environment we’re now in.”
CHARITYBENCHMARKS.ORG CHARITY BENCHMARKS 2019 20
“Unlike Amazon, charities can’t afford
to invest and not make a profit for 10 years when it comes to infrastructure,
systems, databases and digital.”
“The fundraising sector fails to bring
boards into this bigger conversation, so they
aren’t up to speed with the context.”
BECAUSE CHARITIES ARE DIFFERENTSeveral of our respondents talked about the significant differences between commercial and charitable operating models as a barrier to change.
Businesses that have adapted successfully to the digital revolution, or emerged as a result of it, usually do so as a result of significant investment in infrastructure, skills and customer acquisition – which means significant short to medium term losses. This risk is acceptable to boards and shareholders because investors expect it and are playing a long game.
The perception was that charities are different. Understandably, charity boards are more risk averse and focused on short term profit and cost/income ratios.
Having said that, a number of respondents said that they felt boards were not being made aware of the situation and, as such, don’t understand the response required.
CHARITYBENCHMARKS.ORG CHARITY BENCHMARKS 2019 21
“We’re doing the best thing for
the mission, as opposed to the best thing for the
audience or the consumer. And that’s where we’re
different to commercial organisations.”
“We talk about movement building but
won’t give up any power. We are only inviting people
to listen to us and get involved in the way we want. That’s not what
people expect.”
BECAUSE OF THE ‘PRODUCT’Discussion of ‘business with purpose’ and commercial models of risk and investment eventually led to the question of whom charities exist to serve and how that affects fundraising.
In a world where consumer needs and desires are being met with ever more speed and precision, the fact that the ‘product’ we sell is dictated by beneficiary rather than donor needs becomes ever-more acute.
It was also noted that social media has facilitated the emergence of movements that are led/generated by individuals and ‘make a difference’ entirely on their terms.
Nobody suggested that charities should abandon their missions completely to consumer sovereignty. But there was a definite sense that there needed to be a shift.
CHARITYBENCHMARKS.ORG CHARITY BENCHMARKS 2019 22
WHAT’S THE SOLUTION?
“Opportunities through third party
digital fundraising are going to be huge – the likes
of Facebook, Instagram, peer-to-peer fundraising
and within the digital gaming and spectator
market.”
“We’re taking a more measured,
balanced approach, combining optimising the core programme,
innovation and supporter experience.”
THE ANSWER LIES WITHINAs noted above, we heard a diverse range of ideas on how fundraising can and should move forward in the short to medium term.
Nobody was predicting significant growth, and some were predicting short term decline. But overall the feeling was that there would be some growth over the next three years.
What differed from charity to charity was where that growth was expected – and that in turn was influenced by the individual charity, its context and its recent experience.
THE PROMISE OF DIGITALAs our figures show, there seems to be huge scope for growth in digital fundraising and this is where several of our respondents saw the big opportunity.
For some this was about transferring and/or optimising existing products and methods to the digital environment.
For others it was more about ‘being present’ in new online spaces where people are spending time, attention and money – social media and gaming/streaming being the obvious examples.
CHARITYBENCHMARKS.ORG CHARITY BENCHMARKS 2019 23
CHARITYBENCHMARKS.ORG CHARITY BENCHMARKS 2019 24
Either way, the clear feeling was that the digital environment was where charities can and should make big gains and perhaps catch up with their commercial peers.
ENGAGEMENT AND INTEGRATIONEngagement was a word that cropped up again and again – both as a goal and as a strategy.
There is a clear and relatively consistent sense that instead of pursuing purely transactional programmes, charities need to engage their supporters across a range of functions and channels – stewarding those who are prepared to give towards financial support but recognising that there are other, equally valid, ways to help.
For some, this strategy involved building or tapping-into mass movements and, in the process, ceding some control to supporters. For others it was more about delivering a more rewarding supporter experience across various touchpoints and products.
“We have shifted to a supporter engagement
approach, attracting support and building journeys over time. We call it an ‘attraction’ approach.”
“Our main strength is that we’ve become joined
up, telling a consistent story across campaigning,
communications and fundraising. It all hangs together.”
“We’re also investing in retail
and expanding our shops because we’ve now got
a model that is profitable, scalable and we value its
contribution beyond just income.”
DRAWING STRENGTH FROM COMMUNITIESA number of our interviewees saw the reinvention/reinforcement of community fundraising (including retail) as a significant opportunity for growth.
The ability to harness the engagement and enthusiasm of ‘super-supporters’ to spread the word and secure new donors is a logical extension of the engagement model and can, perhaps, be facilitated and managed by digital.
THE CORPORATE OPPORTUNITYAs noted, the commercial world is seen as an emerging competitor. But we also heard plenty of people cite it as a significant opportunity.
As businesses seek to embed purpose and social good in their offer, there seems to be a significant opportunity for charities to develop new and more valuable relationships with them. Almost everyone we spoke to saw corporate fundraising as one of the relatively few areas that could generate strong growth in the short to medium term.
“Going forward you’ll need to follow the supporter, be where they are, partner up with third parties, make it as easy as possible for people
to give.”
CHARITYBENCHMARKS.ORG CHARITY BENCHMARKS 2019 25
“Across the sector people are embracing change more and diversifying away from purely fundraising. It feels like as a sector we’ve stopped beating ourselves now and we’re getting on with things.”
CHARITYBENCHMARKS.ORG CHARITY BENCHMARKS 2019 26

THE SURVEY

In addition to our depth interviews, we also repeated the participant survey that we undertook in 2018. It covers some simple factual information (such as whether targets have been met or whether specific functions exist within an organisation) as well as less concrete elements such as levels of confidence and organisational priorities.
While the output of this section is less dramatic than the depth interviews, there are some clear indications of challenging times and shifting priorities among our participants.
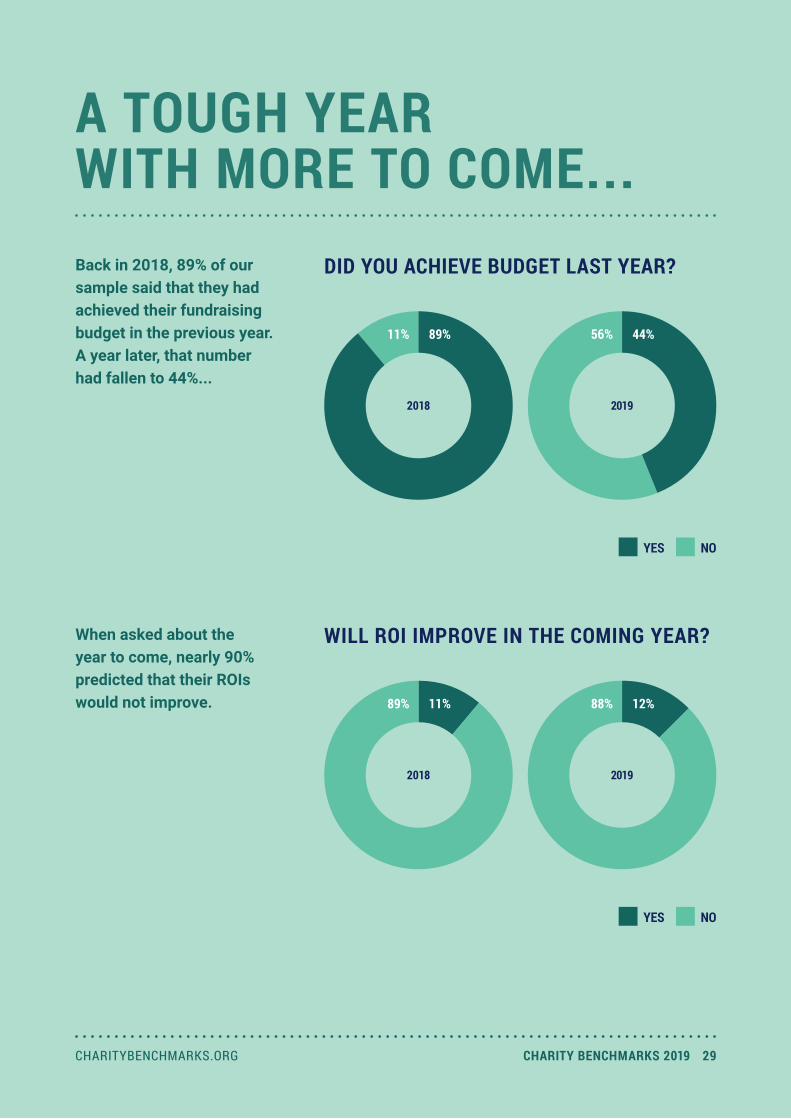
A TOUGH YEAR WITH MORE TO COME...Back in 2018, 89% of our sample said that they had achieved their fundraising budget in the previous year. A year later, that number had fallen to 44%...
WILL ROI IMPROVE IN THE COMING YEAR?When asked about the year to come, nearly 90% predicted that their ROIs would not improve.
DID YOU ACHIEVE BUDGET LAST YEAR?
YES NO
2018 2019
89% 44%
YES NO
2018 2019
89% 88%11% 12%
11% 56%
CHARITYBENCHMARKS.ORG CHARITY BENCHMARKS 2019 29
CHARITYBENCHMARKS.ORG CHARITY BENCHMARKS 2019 30
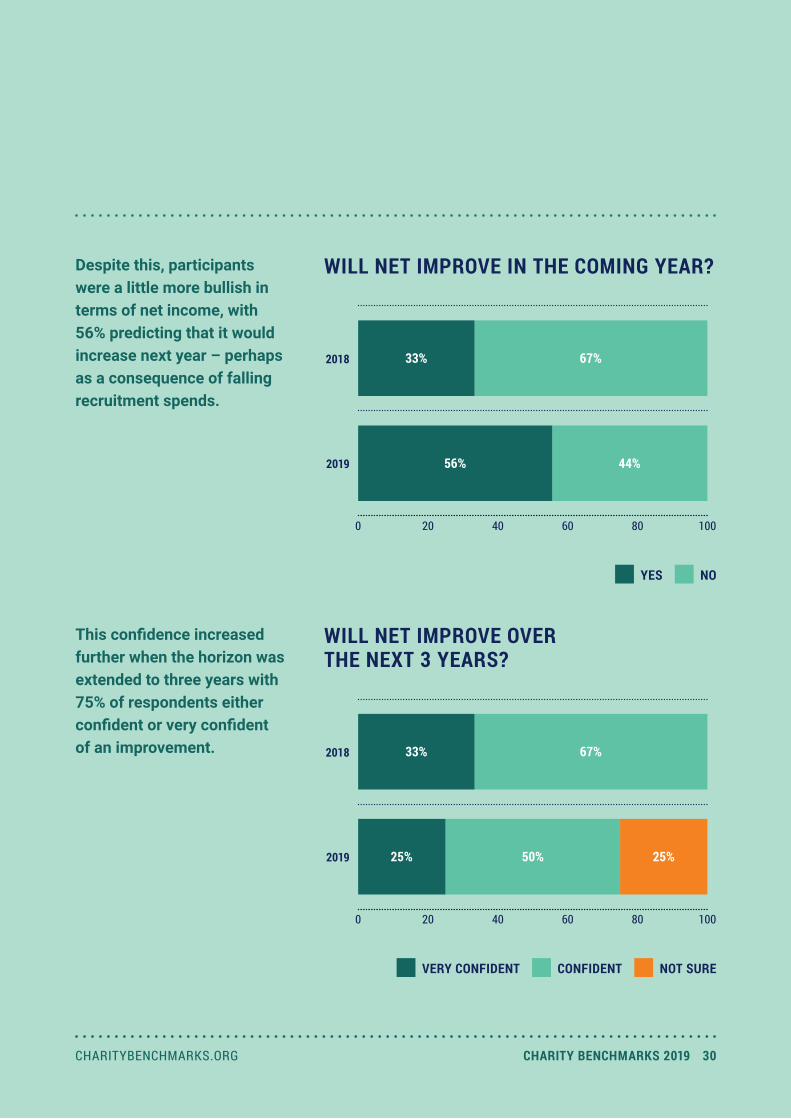
Despite this, participants were a little more bullish in terms of net income, with 56% predicting that it would increase next year – perhaps as a consequence of falling recruitment spends.
WILL NET IMPROVE IN THE COMING YEAR?
WILL NET IMPROVE OVER THE NEXT 3 YEARS?
YES NO
0 20 40 60 80 100
2018
2019
67%33%
44%56%
VERY CONFIDENT CONFIDENT NOT SURE
0 20 40 60 80 100
2018
2019
33% 67%
25% 25%50%
This confidence increased further when the horizon was extended to three years with 75% of respondents either confident or very confident of an improvement.
WHERE WILL GROWTH COME FROM?
-2 -1 0 1 2 3 4 5 6 7 8
TRUSTS
THIRD PARTY EVENTS
STATUTORY
RETAIL
RAFFLE
PAYROLL
NATIONAL EVENTS
MAJOR DONOR
LOTTERY
LEGACY
INDIVIDUAL GIVING – REGULAR
INDIVIDUAL GIVING – CASH
IN-MEM GIVING
EMERGENCY
CORPORATE
COMMUNITY OR LOCAL EVENTS
-2 -1 0 1 2 3 4 5 6 7 8
GROWTH PREDICTIONS FOR THE NEXT 3 YEARS
2018 2019
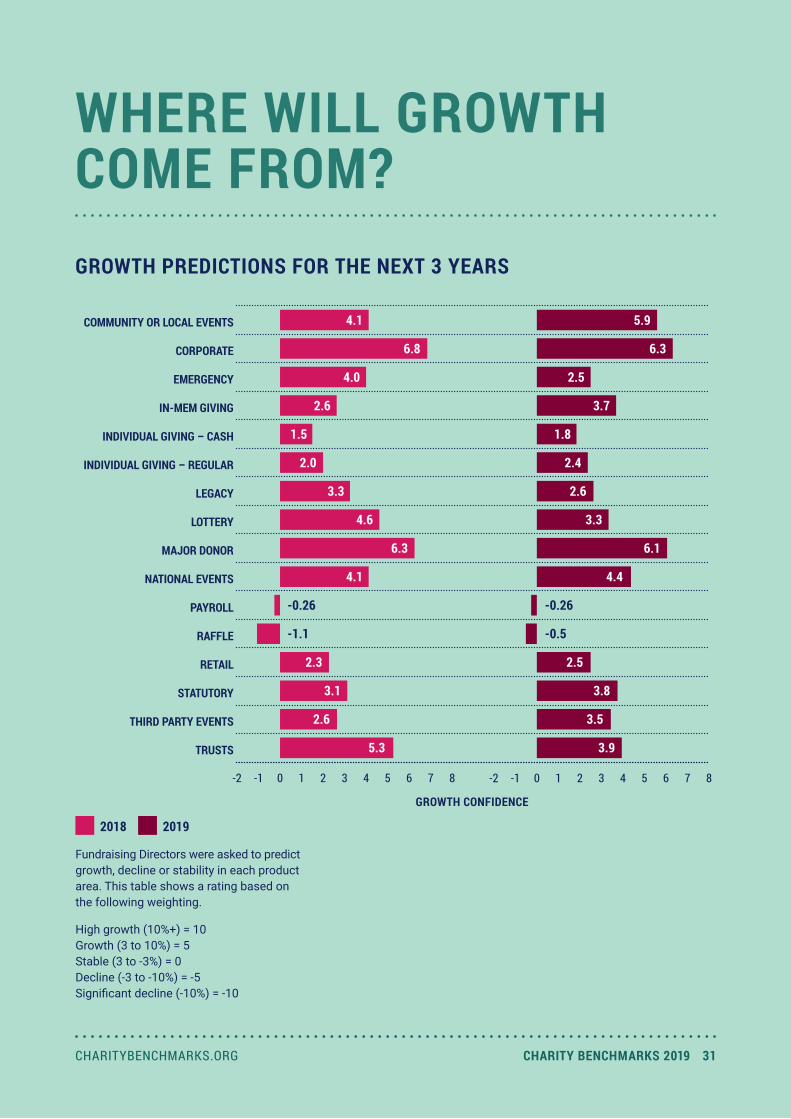
Fundraising Directors were asked to predict growth, decline or stability in each product area. This table shows a rating based on the following weighting.
High growth (10%+) = 10Growth (3 to 10%) = 5Stable (3 to -3%) = 0Decline (-3 to -10%) = -5Significant decline (-10%) = -10
GROWTH CONFIDENCE
4.1
6.8
4.0
2.6
1.5
2.0
3.3
4.6
6.3
4.1
-0.26
-1.1
2.3
3.1
2.6
5.3
5.9
6.3
2.5
3.7
1.8
2.4
2.6
3.3
6.1
4.4
2.5
3.8
3.5
3.9
-0.26
-0.5
CHARITYBENCHMARKS.ORG CHARITY BENCHMARKS 2019 31
CHARITYBENCHMARKS.ORG CHARITY BENCHMARKS 2019 32
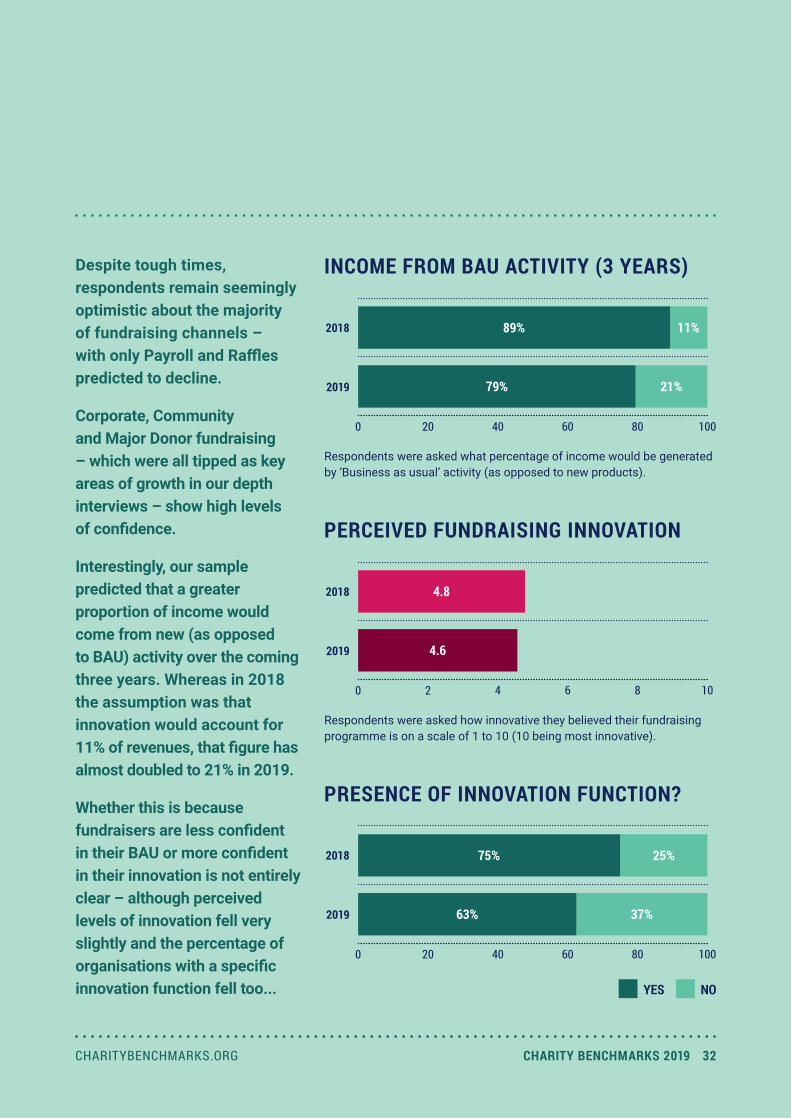
Despite tough times, respondents remain seemingly optimistic about the majority of fundraising channels – with only Payroll and Raffles predicted to decline.
Corporate, Community and Major Donor fundraising – which were all tipped as key areas of growth in our depth interviews – show high levels of confidence.
Interestingly, our sample predicted that a greater proportion of income would come from new (as opposed to BAU) activity over the coming three years. Whereas in 2018 the assumption was that innovation would account for 11% of revenues, that figure has almost doubled to 21% in 2019.
Whether this is because fundraisers are less confident in their BAU or more confident in their innovation is not entirely clear – although perceived levels of innovation fell very slightly and the percentage of organisations with a specific innovation function fell too...
PRESENCE OF INNOVATION FUNCTION?
0 20 40 60 80 100
2018
2019
75%
63%
YES NO
INCOME FROM BAU ACTIVITY (3 YEARS)
Respondents were asked what percentage of income would be generated by ‘Business as usual’ activity (as opposed to new products).
0 20 40 60 80 100
2018
2019
89%
79%
PERCEIVED FUNDRAISING INNOVATION
Respondents were asked how innovative they believed their fundraising programme is on a scale of 1 to 10 (10 being most innovative).
0 2 4 6 8 10
2018
2019
4.8
4.6
11%
21%
25%
37%
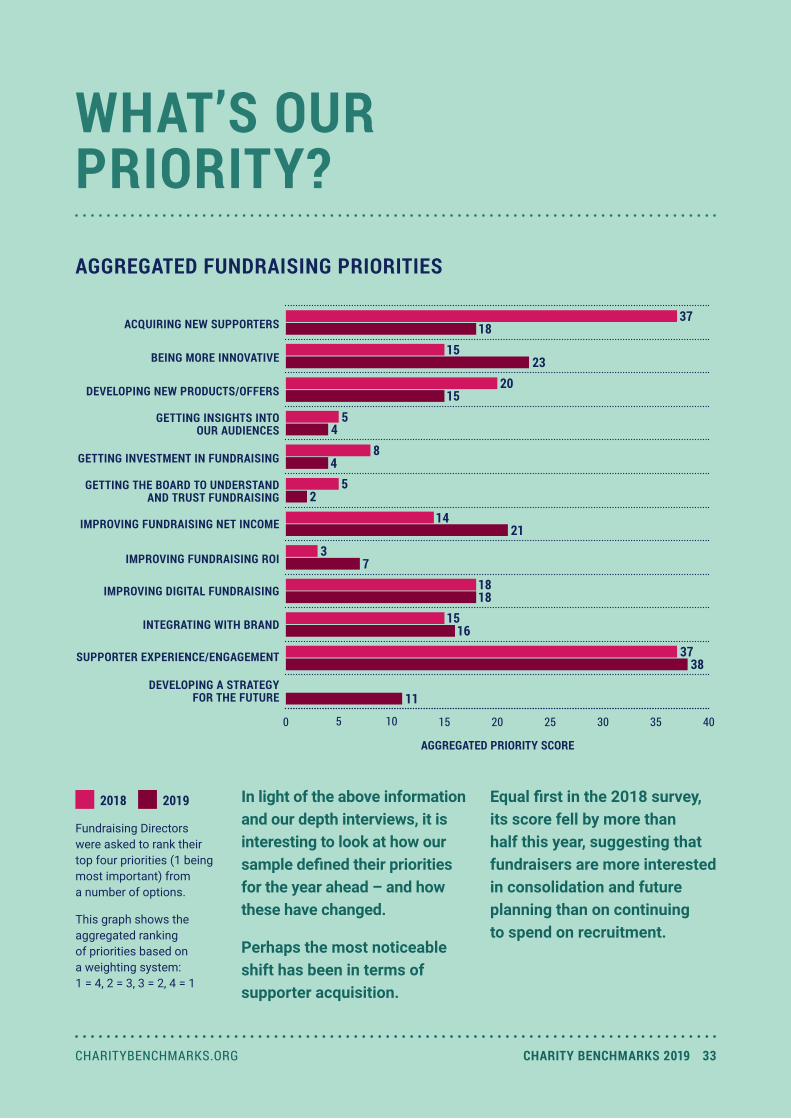
WHAT’S OUR PRIORITY?
In light of the above information and our depth interviews, it is interesting to look at how our sample defined their priorities for the year ahead – and how these have changed.
Perhaps the most noticeable shift has been in terms of supporter acquisition.
0 5 10 15 20 25 30 35 40
DEVELOPING A STRATEGY FOR THE FUTURE
SUPPORTER EXPERIENCE/ENGAGEMENT
INTEGRATING WITH BRAND
IMPROVING DIGITAL FUNDRAISING
IMPROVING FUNDRAISING ROI
IMPROVING FUNDRAISING NET INCOME
GETTING THE BOARD TO UNDERSTAND AND TRUST FUNDRAISING
GETTING INVESTMENT IN FUNDRAISING
GETTING INSIGHTS INTO OUR AUDIENCES
DEVELOPING NEW PRODUCTS/OFFERS
BEING MORE INNOVATIVE
ACQUIRING NEW SUPPORTERS
2018 2019
Fundraising Directors were asked to rank their top four priorities (1 being most important) from a number of options.
This graph shows the aggregated ranking of priorities based on a weighting system: 1 = 4, 2 = 3, 3 = 2, 4 = 1
AGGREGATED FUNDRAISING PRIORITIES
AGGREGATED PRIORITY SCORE
Equal first in the 2018 survey, its score fell by more than half this year, suggesting that fundraisers are more interested in consolidation and future planning than on continuing to spend on recruitment.
3718
1523
2015
54
84
52
1421
37
1818
1516
3837
11
CHARITYBENCHMARKS.ORG CHARITY BENCHMARKS 2019 33

CHARITYBENCHMARKS.ORG CHARITY BENCHMARKS 2019 34
This reining in of recruitment is mirrored in a marginal increase in the focus on Supporter Experience – joint first in 2018 and the clear winner this year – as well as in an increased focus on net income and improved ROI.
Oddly however, in light of the above, a significant minority of our participants don't measure supporter satisfaction!
Innovation, as might be expected, gets an increased focus but securing funding and board approval seem to be less important – perhaps because of fewer options when it comes to significant investment.
Surprisingly, developing a strategy for the future – while listed as a priority for some of our respondents – does not score particularly highly overall.
Despite this, however, almost half of our respondents have a dedicated strategy function in-house.
PRESENCE OF STRATEGY FUNCTION
YES NO
0 20 40 60 80 100
2018
2019
56%
44%
44%
56%

WHAT NEXT FOR FUNDRAISING TEAMS?Despite the chill wind that appears to be blowing through the sector and a fairly dramatic reduction in the number of staff in our sample since 2018, none of our participants predict a reduction in the size of their team and 44% predict growth – exactly as per last year.
PREDICTION ON SIZE OF TEAM
ADEQUACY OF STAFFING LEVEL
GROW STAY CONSTANT
0 20 40 60 80 100
2018
2019 44% 56%
44% 56%
Respondents were asked whether they believed their fundraising team would grow, shrink or stay constant.
0 2 4 6 8 10
2018
2019
6.8
6.1
Respondents were asked how adequate staffing levels were in their team on a scale of 1 to 10 (10 being entirely adequate).
This may be due to the fact that when it comes to having adequate staffing levels, directors rate their situation as 6.1 out of 10 – down from 6.8 in 2018.
CHARITYBENCHMARKS.ORG CHARITY BENCHMARKS 2019 35

CHARITYBENCHMARKS.ORG CHARITY BENCHMARKS 2019 36
The structure within fundraising teams, however, look set for a shakeup. Of the respondents, 67% said that they anticipated restructuring their team over the coming year (up from 44% in the previous year).
CHANGES TO TEAM STRUCTURE
YES NO
0 20 40 60 80 100
2018
2019 67% 33%
44% 56%
Respondents were asked whether the structure of their team would change over the coming 12 months.
PREDICTIONS FOR SKILL SET
YES NO
0 20 40 60 80 100
2018
2019 89% 11%
Respondents were asked whether they thought the skill set required by their team would change or not over the coming 3 years.
89% 11%
Even more pronounced was the anticipated change of skill set required within teams – with 89% of respondents saying that they expected it to change over the coming three years.

The key skill deficit is clearly digital – with 67% of organisations reporting a need for development.
Innovation was a distant second at 20% (up from 9% in 2018) and Data Analysis was, surprisingly, only mentioned by 7% (down from 13% in 2018).
SKILLS IN NEED OF DEVELOPMENT
0 10 20 30 40 50 60 70 80
INNOVATION
DIGITAL
DATA
Respondents were asked for areas in which skills would need to be improved over the next 3 years. 2018 2019
13%
7%
61%
67%
9%
20%
CHARITYBENCHMARKS.ORG CHARITY BENCHMARKS 2019 37
CHARITYBENCHMARKS.ORG CHARITY BENCHMARKS 2019 38
0 5 10 15 20 25
SUPPORTER EXPERIENCE
STRATEGY
MAJOR & HV
INNOVATION
DIRECT MARKETING
DIGITAL
DATA
CORPORATE
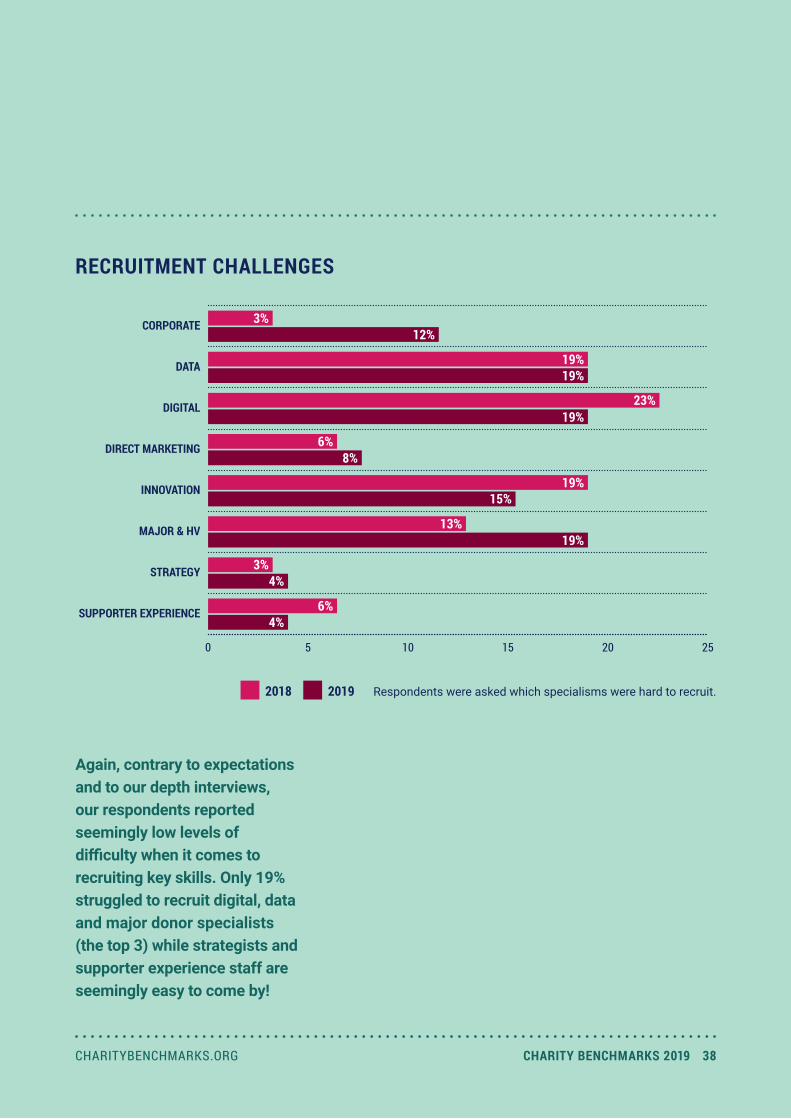
RECRUITMENT CHALLENGES
Respondents were asked which specialisms were hard to recruit. 2018 2019
Again, contrary to expectations and to our depth interviews, our respondents reported seemingly low levels of difficulty when it comes to recruiting key skills. Only 19% struggled to recruit digital, data and major donor specialists (the top 3) while strategists and supporter experience staff are seemingly easy to come by!
3%12%
19%19%
23%19%
19%
19%
6%8%
15%
13%
3%
4%
4%
6%

CHARITYBENCHMARKS.ORG CHARITY BENCHMARKS 2019 39CHARITYBENCHMARKS.ORG CHARITY BENCHMARKS 2019 39
WHAT’S THREATENING US OUTSIDE?Back in 2018, we asked participants to rate the perceived threats from GDPR and Brexit. Our assumption was that these threats would have faded in 2019 but, ironically, both have increased significantly.
Despite the sky not falling as some predicted, the effects of GDPR have clearly been felt on a tactical and strategic level and continue to impact programmes.
PREDICTED IMPACT OF GDPR
0 2 4 6 8 10
2018
2019
Respondents were asked to rate the predicted impact of GDPR on a scale of 1 to 10 (10 being the highest impact).
3.9
5.1
PREDICTED IMPACT OF BREXIT
0 2 4 6 8 10
2018
2019
Respondents were asked to rate the predicted impact of Brexit on a scale of 1 to 10 (10 being the highest impact).
3.4
4.9
The threat posed by Brexit, meanwhile, has been both delayed and heightened in light of the possibility of ‘no deal.’
As noted above, the impact of a significant economic upset could be very serious indeed.

THE HARD DATA
Finally we come to the concrete numbers – a detailed analysis of the money our participants raised over the course of a year, where it came from and what it cost to generate.
Unsurprisingly, there have been few dramatic changes since last year. But there are still plenty of ‘lag’ indicators of change in the market and the measures that charities are taking to respond to them.
This data is also a helpful reminder of just how much revenue comes from legacies and from Government – which means that our own fundraising is not the only challenge we face in these turbulent times.
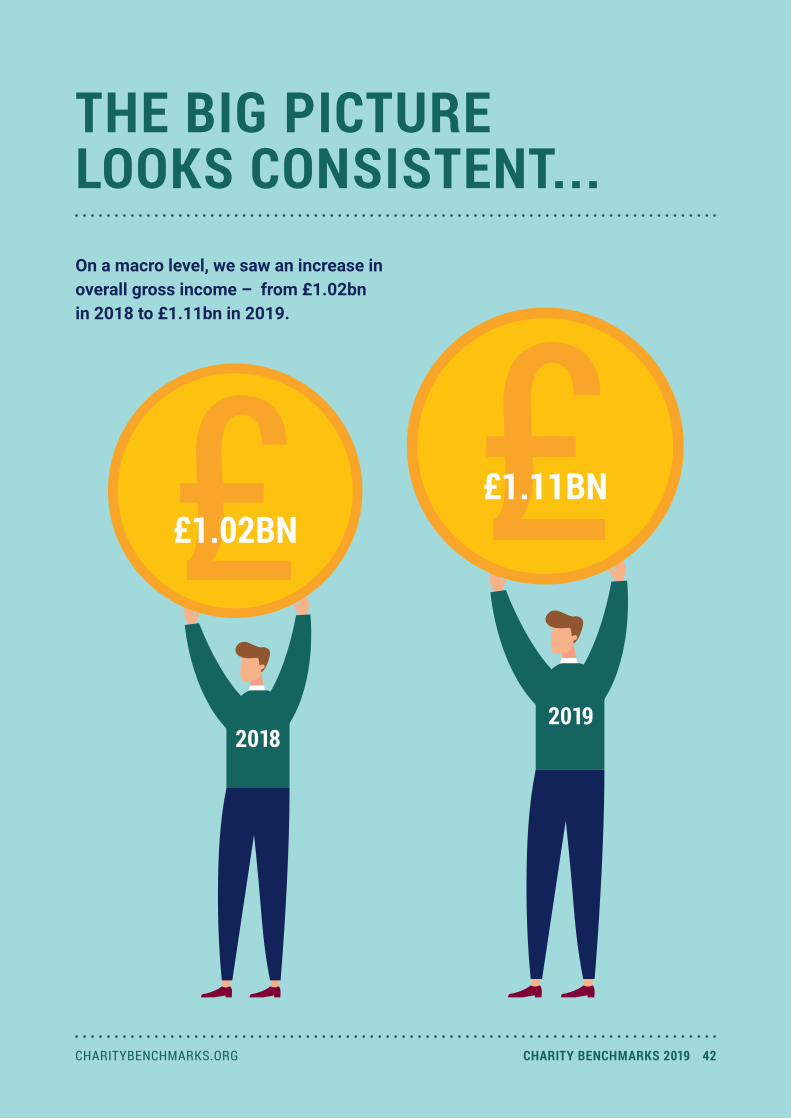
THE BIG PICTURE LOOKS CONSISTENT...On a macro level, we saw an increase in overall gross income – from £1.02bn in 2018 to £1.11bn in 2019.
20182019
££1.02BN ££1.11BN
CHARITYBENCHMARKS.ORG CHARITY BENCHMARKS 2019 42
CHARITYBENCHMARKS.ORG CHARITY BENCHMARKS 2019 43
WHERE’S THE MONEY COMING FROM?
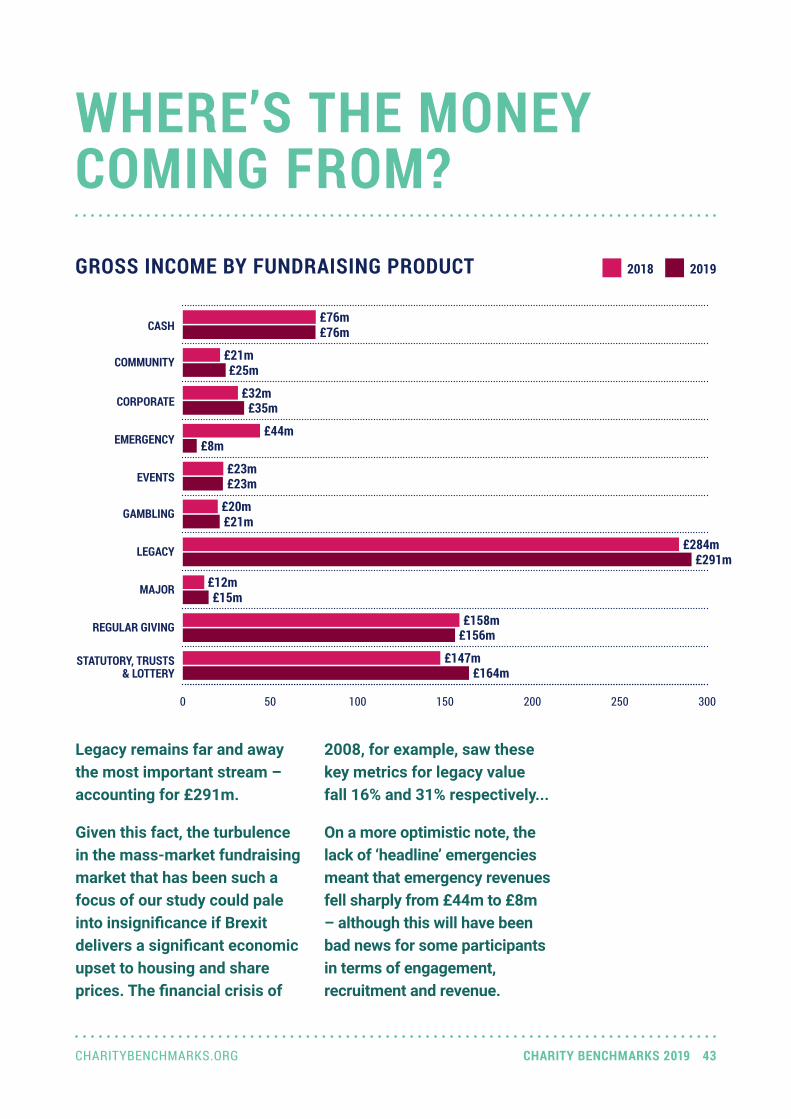
Legacy remains far and away the most important stream – accounting for £291m.
Given this fact, the turbulence in the mass-market fundraising market that has been such a focus of our study could pale into insignificance if Brexit delivers a significant economic upset to housing and share prices. The financial crisis of
0 50 100 150 200 250 300
STATUTORY, TRUSTS & LOTTERY
REGULAR GIVING
MAJOR
LEGACY
GAMBLING
EVENTS
EMERGENCY
CORPORATE
COMMUNITY
CASH
GROSS INCOME BY FUNDRAISING PRODUCT
2008, for example, saw these key metrics for legacy value fall 16% and 31% respectively...
On a more optimistic note, the lack of ‘headline’ emergencies meant that emergency revenues fell sharply from £44m to £8m – although this will have been bad news for some participants in terms of engagement, recruitment and revenue.
2018 2019
£76m
£25m
£32m£35m
£44m£8m
£23m£23m
£20m£21m
£76m
£284m£291m
£12m£15m
£158m£156m
£147m£164m
£21m

It’s interesting to note, however, that the distribution of income is far from consistent across participants who display
relatively heterogeneous portfolios and, as such, will feel the impact of these changes to a greater or lesser extent.
0% 20% 40% 60% 80% 100%
INCOME COMPOSITION BY CHARITY
CASH CORPORATE EVENTS LEGACY REGULAR GIVING
COMMUNITY EMERGENCY GAMBLING MAJOR STATUTORY, TRUSTS & LOTTERY
CHARITYBENCHMARKS.ORG CHARITY BENCHMARKS 2019 44

CHARITYBENCHMARKS.ORG CHARITY BENCHMARKS 2019 45
WHERE AND HOW ARE FUNDRAISERS SPENDING?It’s in this data that we begin to see some interesting movements. A slight contraction in the DD recruitment market
2018 2019FUNDRAISING SPEND BY FUNCTION
0 5 10 15 20 25 30 35 40
STATUTORY, TRUSTS & LOTTERY
REGULAR GIVING
MAJOR
LEGACY
GAMBLING
EVENTS
EMERGENCY
CORPORATE
COMMUNITY
CASH
saw expenditure fall from £40m to £39m while spend on cash appeals rose from £26m to £31m.
£26m£31m
£3m£3m
£3m£5m
£1m£3m
£11m£12m
£13m£13m
£5m£4m
£1m£2m
£40m£39m
£2m£1m
WHERE ARE WE GETTING BANG FOR OUR BUCK?
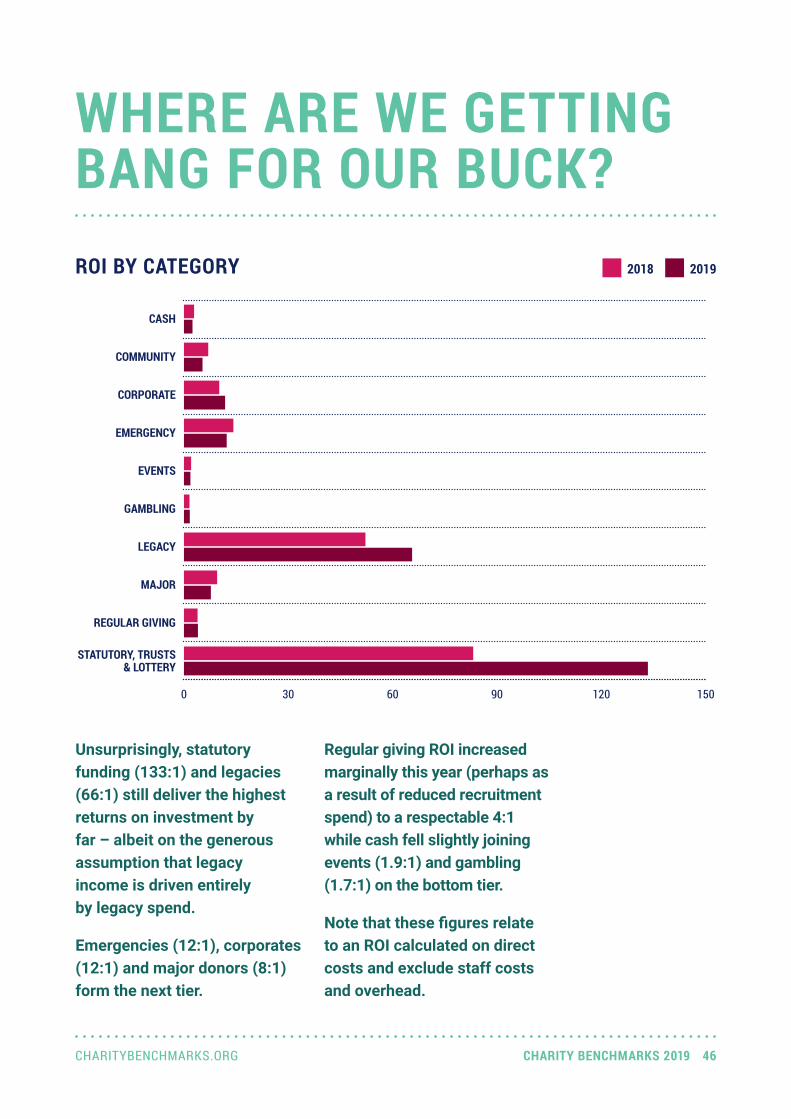
Unsurprisingly, statutory funding (133:1) and legacies (66:1) still deliver the highest returns on investment by far – albeit on the generous assumption that legacy income is driven entirely by legacy spend.
Emergencies (12:1), corporates (12:1) and major donors (8:1) form the next tier.
Regular giving ROI increased marginally this year (perhaps as a result of reduced recruitment spend) to a respectable 4:1 while cash fell slightly joining events (1.9:1) and gambling (1.7:1) on the bottom tier.
Note that these figures relate to an ROI calculated on direct costs and exclude staff costs and overhead.
0 30 60 90 120 150
STATUTORY, TRUSTS & LOTTERY
REGULAR GIVING
MAJOR
LEGACY
GAMBLING
EVENTS
EMERGENCY
CORPORATE
COMMUNITY
CASH
ROI BY CATEGORY 2018 2019
CHARITYBENCHMARKS.ORG CHARITY BENCHMARKS 2019 46
CHARITYBENCHMARKS.ORG CHARITY BENCHMARKS 2019 47
WHO’S RAISING THE MONEY?
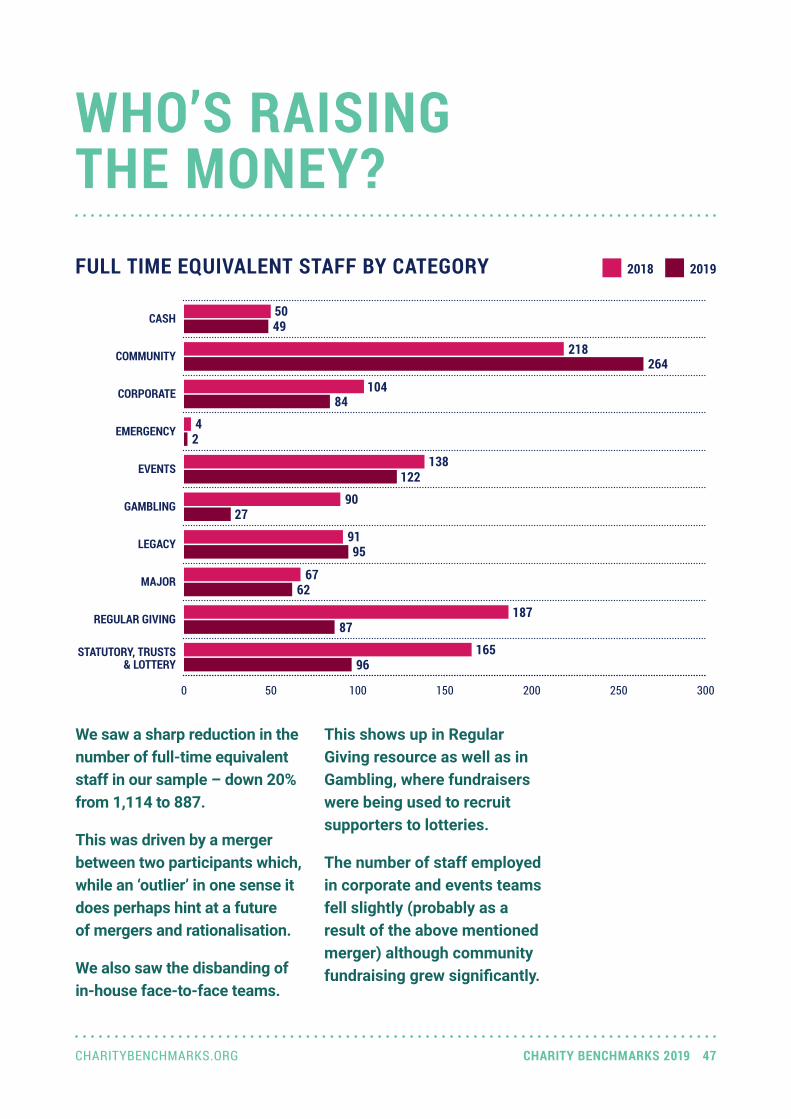
We saw a sharp reduction in the number of full-time equivalent staff in our sample – down 20% from 1,114 to 887.
This was driven by a merger between two participants which, while an ‘outlier’ in one sense it does perhaps hint at a future of mergers and rationalisation.
We also saw the disbanding of in-house face-to-face teams.
This shows up in Regular Giving resource as well as in Gambling, where fundraisers were being used to recruit supporters to lotteries.
The number of staff employed in corporate and events teams fell slightly (probably as a result of the above mentioned merger) although community fundraising grew significantly.
0 50 100 150 200 250 300
STATUTORY, TRUSTS & LOTTERY
REGULAR GIVING
MAJOR
LEGACY
GAMBLING
EVENTS
EMERGENCY
CORPORATE
COMMUNITY
CASH
FULL TIME EQUIVALENT STAFF BY CATEGORY 2018 2019
5049
218264
10484
42
138122
9027
9195
6762
18787
16596

A happy statistical product of all this data is the amount of money generated per staff member. On a macro level, the average fundraiser in our
GROSS INCOME PER FULL TIME EMPLOYEE
0.0 0.5 1.0 1.5 2.0 2.5 3.0 3.5
AVERAGE
STATUTORY, TRUSTS & LOTTERY
REGULAR GIVING
MAJOR
LEGACY
GAMBLING
EVENTS
CORPORATE
COMMUNITY
CASH£1.53m
£1.57m
£0.10m£0.09m
£0.30m£0.42m
£0.17m£0.19m
£0.22m£0.79m
£3.11m£3.08m
£0.18m£0.24m
£0.85m£1.80m
£0.89m£1.70m
sample raised an average of £916,000 (up from £734,000 last year) – with legacy fundraisers top of the chart at £3m per head!
£0.73m£0.92m
2018 2019
CHARITYBENCHMARKS.ORG CHARITY BENCHMARKS 2019 48
CHARITYBENCHMARKS.ORG CHARITY BENCHMARKS 2019 49
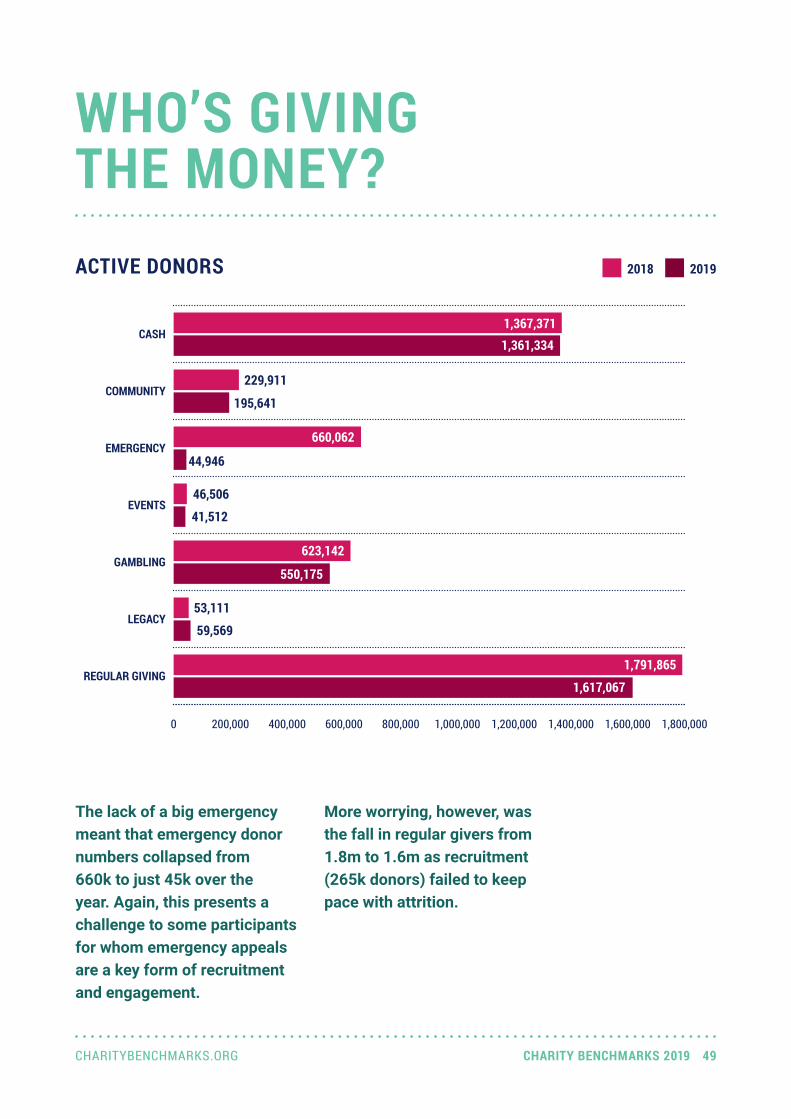
WHO’S GIVING THE MONEY?
The lack of a big emergency meant that emergency donor numbers collapsed from 660k to just 45k over the year. Again, this presents a challenge to some participants for whom emergency appeals are a key form of recruitment and engagement.
0 200,000 400,000 600,000 800,000 1,000,000 1,200,000 1,400,000 1,600,000 1,800,000
REGULAR GIVING
LEGACY
GAMBLING
EVENTS
EMERGENCY
COMMUNITY
CASH
More worrying, however, was the fall in regular givers from 1.8m to 1.6m as recruitment (265k donors) failed to keep pace with attrition.
ACTIVE DONORS 2018 2019
1,367,3711,361,334
229,911
195,641
660,062
44,946
46,506
41,512
623,142
550,175
53,111
59,569
1,791,865
1,617,067

CONTACT, COMPLAINTS AND COMMUNICATIONSThis year saw a marked increase in the percentage of supporters for whom charities have a legitimate, legal basis for contact. This is probably due to
0 10 20 30 40 50 60 70 80
FUNDRAISING MAIL
FUNDRAISING SMS
FUNDRAISING TM
FUNDRAISING EMAIL
PERCENTAGE OF DONORS CONTACTABLE
Percentage of supporters contactable (consented or within scope of Legitimate Interest) by channel.
2018 2019
a combination of a more informed (and therefore less precautionary) interpretation of GDPR and more robust consent capture among new and renewing supporters.
13%
23%
56%
61%
8%
10%
15%
20%
CHARITYBENCHMARKS.ORG CHARITY BENCHMARKS 2019 50
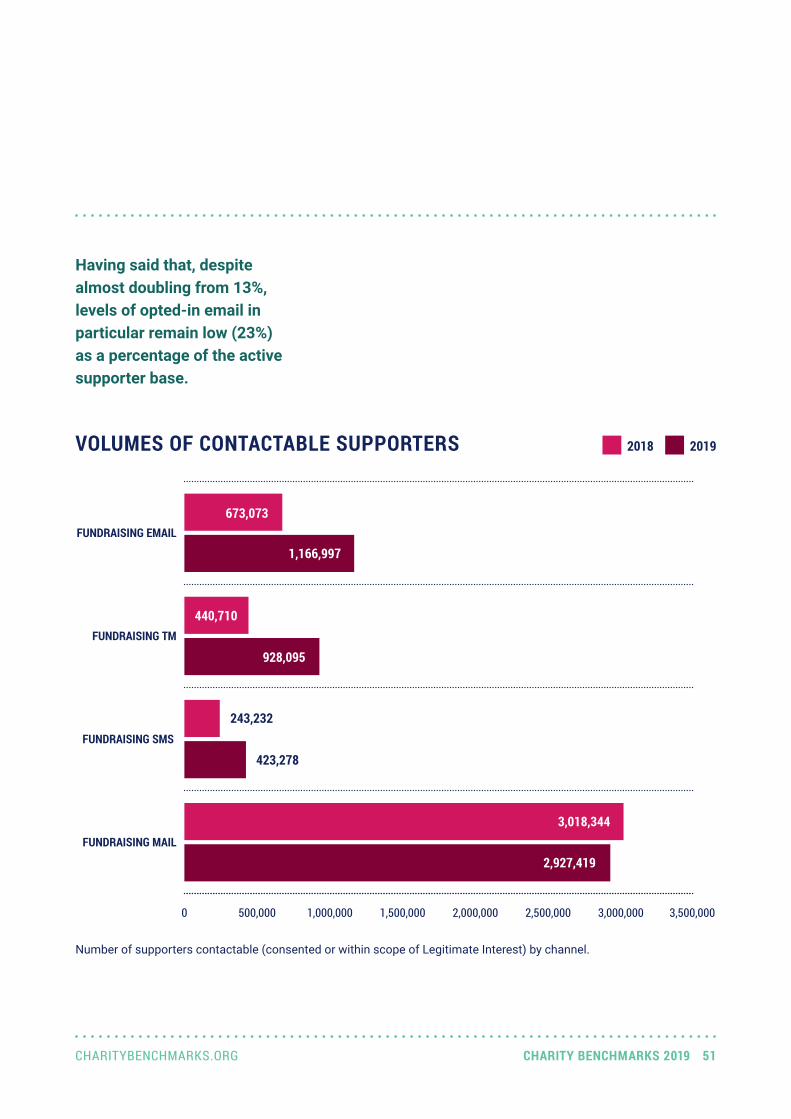
VOLUMES OF CONTACTABLE SUPPORTERS
0 500,000 1,000,000 1,500,000 2,000,000 2,500,000 3,000,000 3,500,000
FUNDRAISING MAIL
FUNDRAISING SMS
FUNDRAISING TM
FUNDRAISING EMAIL
Number of supporters contactable (consented or within scope of Legitimate Interest) by channel.
2018 2019
Having said that, despite almost doubling from 13%, levels of opted-in email in particular remain low (23%) as a percentage of the active supporter base.
673,073
1,166,997
440,710
928,095
243,232
423,278
3,018,344
2,927,419
CHARITYBENCHMARKS.ORG CHARITY BENCHMARKS 2019 51
CHARITYBENCHMARKS.ORG CHARITY BENCHMARKS 2019 52
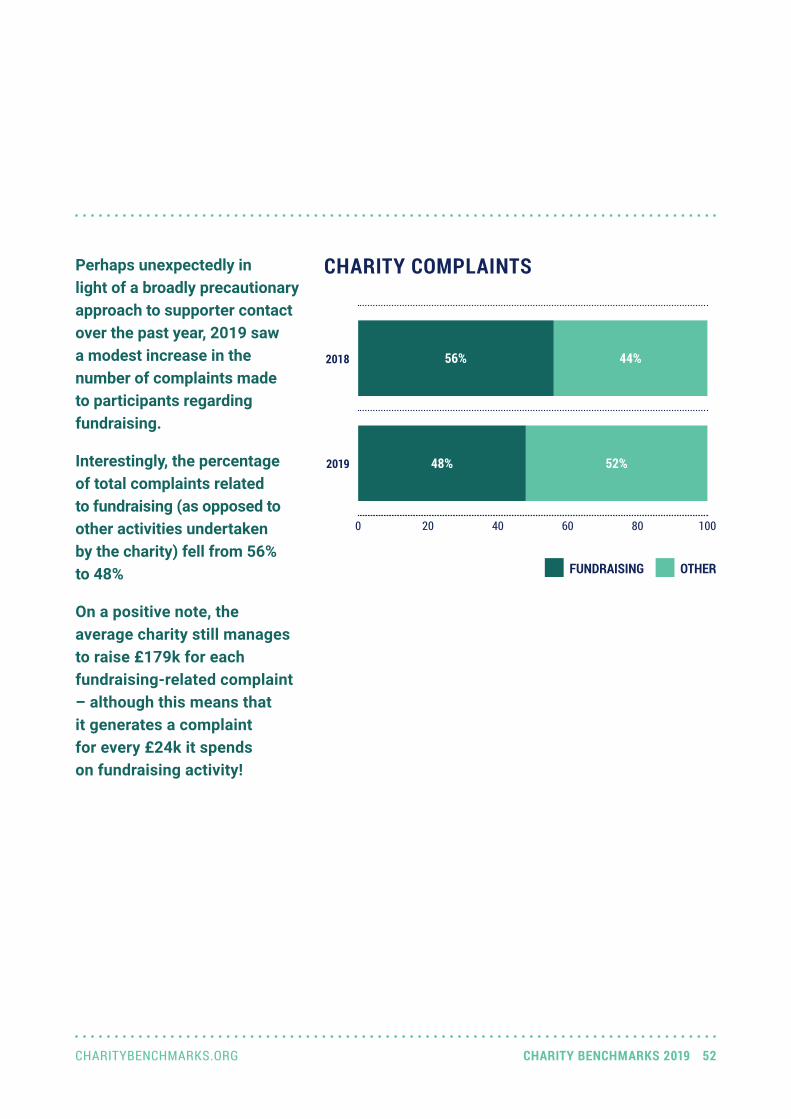
Perhaps unexpectedly in light of a broadly precautionary approach to supporter contact over the past year, 2019 saw a modest increase in the number of complaints made to participants regarding fundraising.
Interestingly, the percentage of total complaints related to fundraising (as opposed to other activities undertaken by the charity) fell from 56% to 48%
On a positive note, the average charity still manages to raise £179k for each fundraising-related complaint – although this means that it generates a complaint for every £24k it spends on fundraising activity!
CHARITY COMPLAINTS
0 20 40 60 80 100
2018
2019
56%
48%
FUNDRAISING OTHER
44%
52%

Although we are seeing stagnation and contraction in donor volumes and revenues overall, levels of digital engagement showed significant gains.
While Facebook and Twitter seem to have plateaued
THE DIGITAL WORLD
(1.85m and 1.25m respectively), the number of Instagram followers among our participants rose by 40% – albeit from a modest base.
The volume of unique visits to participants’ sites shot up by 25% to almost 5m a month.
SOCIAL REACH AND WEB TRAFFIC 2018 2019
0 1,000,000 2,000,000 3,000,000 4,000,000 5,000,000
MONTHLY UNIQUE WEBSITE VISITS
TWITTER FOLLOWERS
INSTAGRAM FOLLOWERS
FACEBOOK FANS
4,830,479
4,137,178
1,256,230
1,215,367
117,056
172,748
1,686,765
1,854,835
CHARITYBENCHMARKS.ORG CHARITY BENCHMARKS 2019 53
CHARITYBENCHMARKS.ORG CHARITY BENCHMARKS 2019 54
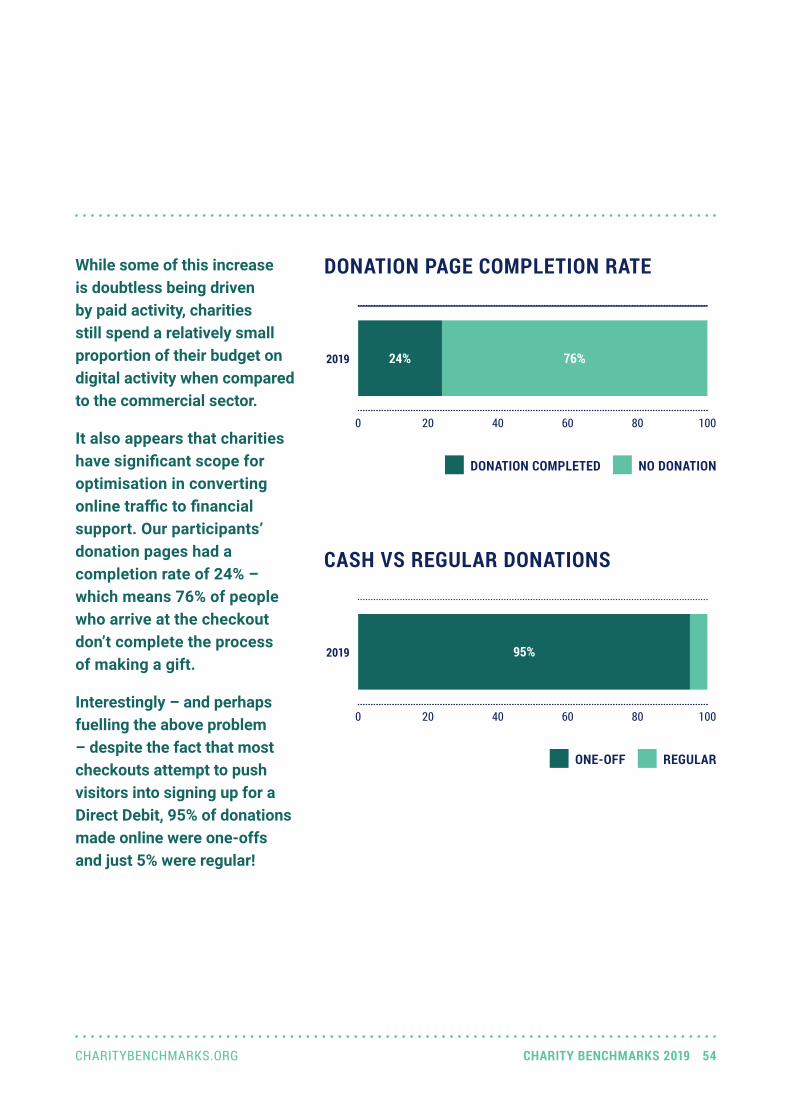
While some of this increase is doubtless being driven by paid activity, charities still spend a relatively small proportion of their budget on digital activity when compared to the commercial sector.
It also appears that charities have significant scope for optimisation in converting online traffic to financial support. Our participants’ donation pages had a completion rate of 24% – which means 76% of people who arrive at the checkout don’t complete the process of making a gift.
Interestingly – and perhaps fuelling the above problem – despite the fact that most checkouts attempt to push visitors into signing up for a Direct Debit, 95% of donations made online were one-offs and just 5% were regular!
DONATION PAGE COMPLETION RATE
DONATION COMPLETED NO DONATION
0 20 40 60 80 100
2019 24% 76%
CASH VS REGULAR DONATIONS
ONE-OFF REGULAR
0 20 40 60 80 100
2019 95%
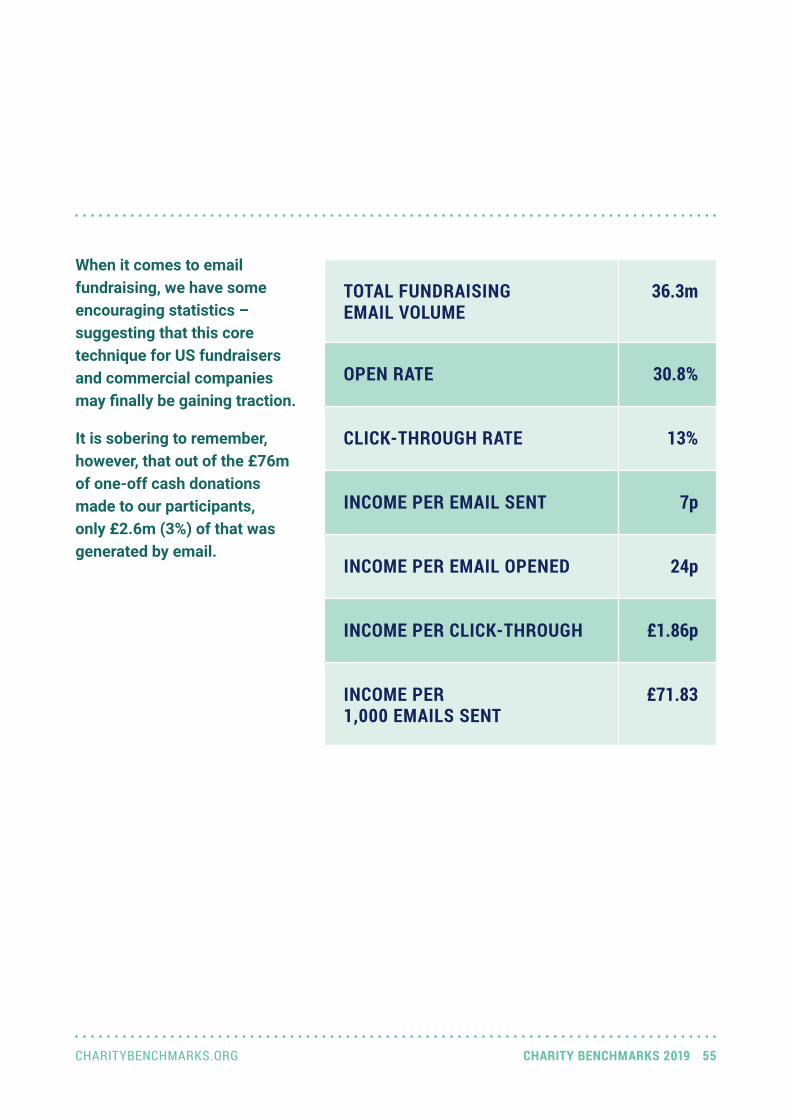
When it comes to email fundraising, we have some encouraging statistics – suggesting that this core technique for US fundraisers and commercial companies may finally be gaining traction.
It is sobering to remember, however, that out of the £76m of one-off cash donations made to our participants, only £2.6m (3%) of that was generated by email.
TOTAL FUNDRAISING EMAIL VOLUME
36.3m
OPEN RATE 30.8%
CLICK-THROUGH RATE 13%
INCOME PER EMAIL SENT 7p
INCOME PER EMAIL OPENED 24p
INCOME PER CLICK-THROUGH £1.86p
INCOME PER 1,000 EMAILS SENT
£71.83
CHARITYBENCHMARKS.ORG CHARITY BENCHMARKS 2019 55

CHARITYBENCHMARKS.ORG CHARITY BENCHMARKS 2019 56
LOOKING FORWARD
It’s clear from every section of this report that digital is an absolutely vital area of focus for charities and, therefore, of huge interest to participants and to the sector in general.
We are keen to get more granular with our digital benchmarks – looking at revenue, volumes and spend by platform, product area and donation type.
We know from our failed attempts at putting this dataset together last year that it’s a tall order getting the data together. But we believe that this is a vital next step for benchmarking and we’d love to do it – whether on our own or in partnership.

We hope you have found this report useful and thought-provoking. And if you’re a participant then thank you once again for being part of the project.
Moving forwards, the more organisations that take part in Charity Benchmarks, the more useful and relevant it becomes. So if you didn’t participate in 2019 and would like to see how your performance stacks up against the rest of the sector then it’s not too late. Get in touch and we can incorporate your results – now and in the future.
And, of course, as more charities get involved, we will update the reports and share them with existing participants.
charitybenchmarks.org
HELP US MAKE CHARITY BENCHMARKS BETTER!
ABOUT USCharity Benchmarks is a joint venture from Freestyle Marketing and Open.
Freestyle Marketing is a fundraising consultancy run by Allan Freeman – who has been working with many of the UK’s biggest charities for more than 25 years. Some of its recent clients include Cancer Research UK, British Heart Foundation, British Red Cross, Age UK, Unicef and Dogs Trust.
[email protected] 344734freestylemarketing.co.uk
Open is the UK’s leading specialist strategic and creative fundraising agency. Its clients include the British Heart Foundation, Crisis, Comic Relief, Friends of the Earth, Oxfam, Unicef, the World Food Programme and many others.
[email protected] 7490 9930opencreates.com@LifeAtOpen
Credits: Allan Freeman, Mark Foster and Lucy Edwards made this all happen. Justin Wylie and Katie Blore conducted and interpreted the depth interviews. Paul Smith crunched all the data and drew all the graphs. Alex Baker and Phil Haley
kept the project on the straight and narrow. James Briggs wrote this report. Katie Blore wrote the Charity Reports. Emily Lovett made it all look beautiful.
CHARITYBENCHMARKS.ORG CHARITY BENCHMARKS 2019 57


![Index [] · environmental management practices, sector environmental performance indicators and benchmarks of excellence for the public administration sector under Regulation (EC)](https://img.pdfslide.us/doc/110x75/5f8a90a0cd79846e8d420e9f/index-environmental-management-practices-sector-environmental-performance-indicators.jpg)