Embed Size (px)
Citation preview
Charitable Contributions, Endowments and
Inequality in Higher Education
Damien Capelle
Princeton University
1/28

Introduction
Donations and Endowments...
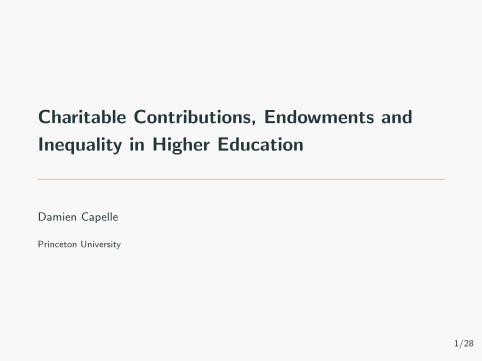
• ... are extremely unequally distributed across colleges
• ... are subject to special tax treatment
– Income tax deduction for charitable contributions
– Endowments are tax exempt
• ... (increasingly) attracts a lot of public attention
– Tax avoidance for the wealthy
– Income tax deduction is a regressive subsidy
– Strong positive correlation between average parental income of students and
amount of donations/endowment income ⇒ Very local redistribution
– Adversely affects hiring incentives and behaviors of colleges: legacy, sports
– Inefficient hoarding of endowment
2/28
What I do
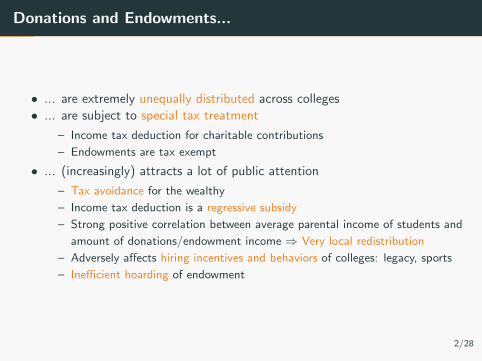
• Gather and construct facts about distribution of donations and
endowments
• Classical measure of distribution: Gini, top share
• Document origin and destination of flows of donations
• Tractable framework that links
• donations, endowments,
• allocation of students across colleges,
• income distribution, intergenerational mobility
• Use the theory to examine effects of tax regimes regarding charitable
contributions and endowments
• Focus mainly on distributional implications
• Implications for sorting of students across colleges
• Key modeling difference with Capelle (2019)
• Allow colleges to build L-T relationships with donors
• ...and accumulate wealth over time
3/28
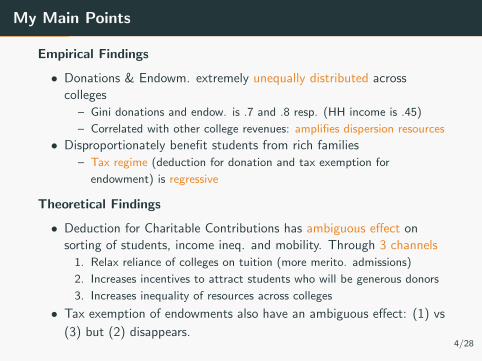
My Main Points
Empirical Findings
• Donations & Endowm. extremely unequally distributed across
colleges
– Gini donations and endow. is .7 and .8 resp. (HH income is .45)
– Correlated with other college revenues: amplifies dispersion resources
• Disproportionately benefit students from rich families
– Tax regime (deduction for donation and tax exemption for
endowment) is regressive
Theoretical Findings
• Deduction for Charitable Contributions has ambiguous effect on
sorting of students, income ineq. and mobility. Through 3 channels
1. Relax reliance of colleges on tuition (more merito. admissions)
2. Increases incentives to attract students who will be generous donors
3. Increases inequality of resources across colleges
• Tax exemption of endowments also have an ambiguous effect: (1) vs
(3) but (2) disappears.4/28
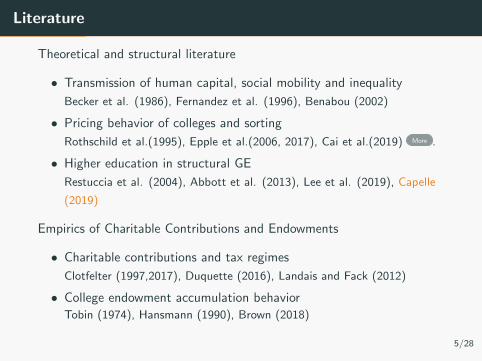
Literature
Theoretical and structural literature
• Transmission of human capital, social mobility and inequality
Becker et al. (1986), Fernandez et al. (1996), Benabou (2002)
• Pricing behavior of colleges and sorting
Rothschild et al.(1995), Epple et al.(2006, 2017), Cai et al.(2019) More .
• Higher education in structural GE
Restuccia et al. (2004), Abbott et al. (2013), Lee et al. (2019), Capelle
(2019)
Empirics of Charitable Contributions and Endowments
• Charitable contributions and tax regimes
Clotfelter (1997,2017), Duquette (2016), Landais and Fack (2012)
• College endowment accumulation behavior
Tobin (1974), Hansmann (1990), Brown (2018)
5/28
Table of Contents
Introduction
Stylized Facts
The Model
Extension with Endowment
Quantitative Analysis (skip today)
Conclusion
6/28
Stylized Facts
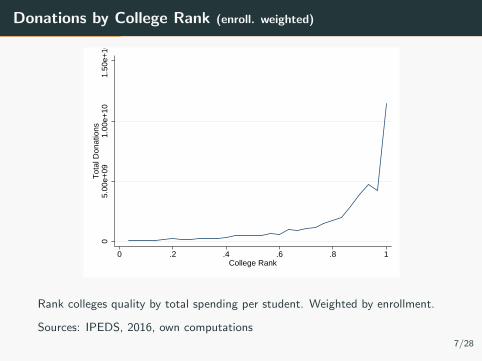
Donations by College Rank (enroll. weighted)
05.
00e+
091.
00e+
101.
50e+
10T
otal
Don
atio
ns
0 .2 .4 .6 .8 1College Rank
Rank colleges quality by total spending per student. Weighted by enrollment.
Sources: IPEDS, 2016, own computations
7/28
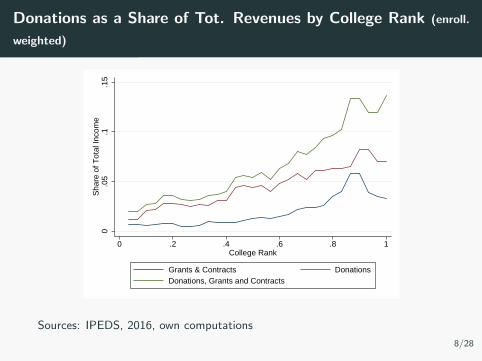
Donations as a Share of Tot. Revenues by College Rank (enroll.
weighted)
0.0
5.1
.15
Sha
re o
f Tot
al In
com
e
0 .2 .4 .6 .8 1College Rank
Grants & Contracts DonationsDonations, Grants and Contracts
Sources: IPEDS, 2016, own computations
8/28
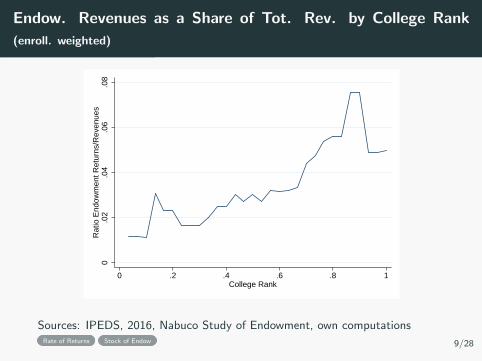
Endow. Revenues as a Share of Tot. Rev. by College Rank
(enroll. weighted)
0.0
2.0
4.0
6.0
8R
atio
End
owm
ent R
etur
ns/R
even
ues
0 .2 .4 .6 .8 1College Rank
Sources: IPEDS, 2016, Nabuco Study of Endowment, own computationsRate of Returns Stock of Endow 9/28
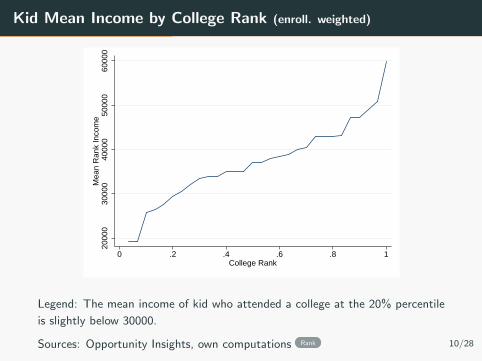
Kid Mean Income by College Rank (enroll. weighted)
2000
030
000
4000
050
000
6000
0M
ean
Ran
k In
com
e
0 .2 .4 .6 .8 1College Rank
Legend: The mean income of kid who attended a college at the 20% percentile
is slightly below 30000.
Sources: Opportunity Insights, own computations Rank 10/28
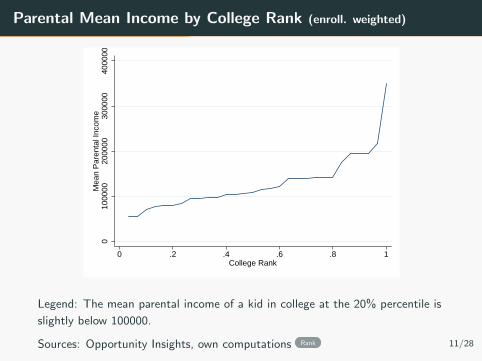
Parental Mean Income by College Rank (enroll. weighted)
010
0000
2000
0030
0000
4000
00M
ean
Par
enta
l Inc
ome
0 .2 .4 .6 .8 1College Rank
Legend: The mean parental income of a kid in college at the 20% percentile is
slightly below 100000.
Sources: Opportunity Insights, own computations Rank 11/28
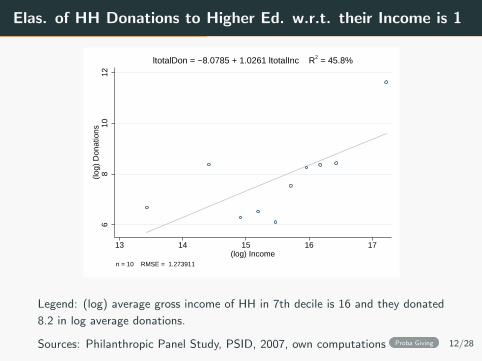
Elas. of HH Donations to Higher Ed. w.r.t. their Income is 1
68
1012
(log)
Don
atio
ns
13 14 15 16 17(log) Income
n = 10 RMSE = 1.273911
ltotalDon = −8.0785 + 1.0261 ltotalInc R2 = 45.8%
Legend: (log) average gross income of HH in 7th decile is 16 and they donated
8.2 in log average donations.
Sources: Philanthropic Panel Study, PSID, 2007, own computations Proba Giving 12/28
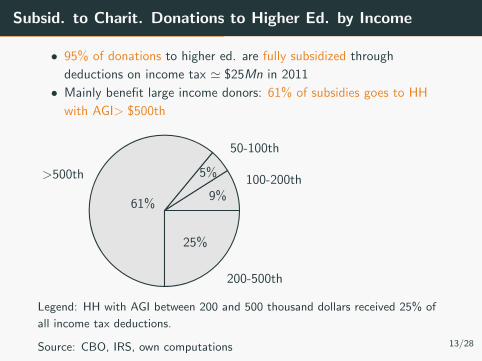
Subsid. to Charit. Donations to Higher Ed. by Income
• 95% of donations to higher ed. are fully subsidized through
deductions on income tax ' $25Mn in 2011
• Mainly benefit large income donors: 61% of subsidies goes to HH
with AGI> $500th
100-200th9%
50-100th
5%>500th
61%
200-500th
25%
Legend: HH with AGI between 200 and 500 thousand dollars received 25% of
all income tax deductions.
Source: CBO, IRS, own computations 13/28

The Model

The Model
Outline
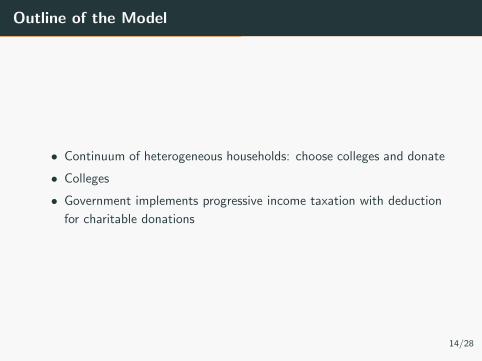
Outline of the Model
• Continuum of heterogeneous households: choose colleges and donate
• Colleges
• Government implements progressive income taxation with deduction
for charitable donations
14/28

The Model
Households
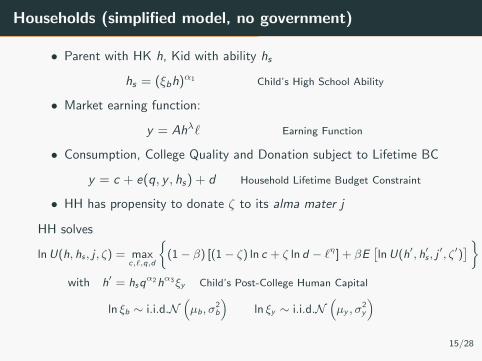
Households (simplified model, no government)
• Parent with HK h, Kid with ability hs
hs = (ξbh)α1 Child’s High School Ability
• Market earning function:
y = Ahλ` Earning Function
• Consumption, College Quality and Donation subject to Lifetime BC
y = c + e(q, y , hs) + d Household Lifetime Budget Constraint
• HH has propensity to donate ζ to its alma mater j
HH solves
lnU(h, hs , j , ζ) = maxc,`,q,d
{(1− β) [(1− ζ) ln c + ζ ln d − `η] + βE
[lnU(h′, h′s , j
′, ζ′)]}
with h′ = hsqα2hα3ξy Child’s Post-College Human Capital
ln ξb ∼ i.i.d.N(µb, σ
2b
)ln ξy ∼ i.i.d.N
(µy , σ
2y
)15/28
The Model
Colleges
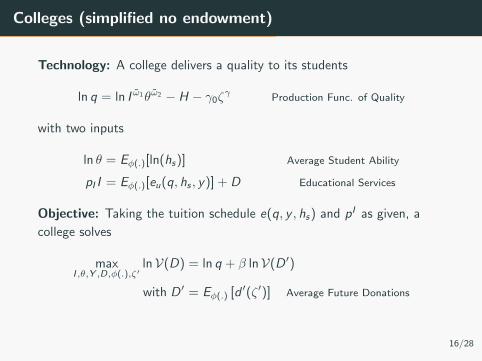
Colleges (simplified no endowment)
Technology: A college delivers a quality to its students
ln q = ln I ω̃1θω̃2 − H − γ0ζγ
Production Func. of Quality
with two inputs
ln θ = Eφ(.)[ln(hs)] Average Student Ability
pI I = Eφ(.)[eu(q, hs , y)] + D Educational Services
Objective: Taking the tuition schedule e(q, y , hs) and pI as given, a
college solves
maxI ,θ,Y ,D,φ(.),ζ′
lnV(D) = ln q + β lnV(D ′)
with D ′ = Eφ(.) [d ′(ζ ′)] Average Future Donations
16/28

The Model
Government
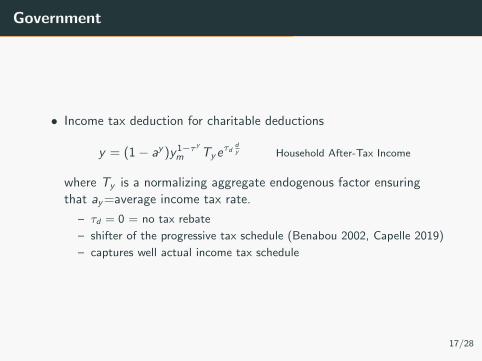
Government
• Income tax deduction for charitable deductions
y = (1− ay )y1−τ y
m Tyeτd
dy Household After-Tax Income
where Ty is a normalizing aggregate endogenous factor ensuring
that ay=average income tax rate.
– τd = 0 = no tax rebate
– shifter of the progressive tax schedule (Benabou 2002, Capelle 2019)
– captures well actual income tax schedule
17/28
The Model
Equilibrium: Tuition Schedule, Sorting Rule and
Law of Motion
Restrictions
– Steady-state
– Distribution of HK is log-normal
– Colleges are indifferent between all student types (interior F.O.C.)
18/28
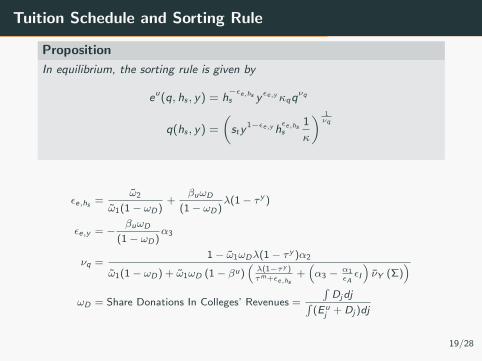
Tuition Schedule and Sorting Rule
Proposition
In equilibrium, the sorting rule is given by
eu(q, hs , y) = h−εe,hss y εe,yκqq
νq
q(hs , y) =
(sty
1−εe,y hεe,hss
1
κ
) 1νq
εe,hs =ω̃2
ω̃1(1 − ωD)+
βuωD
(1 − ωD)λ(1 − τ y )
εe,y = −βuωD
(1 − ωD)α3
νq =1 − ω̃1ωDλ(1 − τ y )α2
ω̃1(1 − ωD) + ω̃1ωD (1 − βu)(λ(1−τy )τm+εe,hs
+(α3 − α1
εAεI
)ν̄Y (Σ)
)ωD = Share Donations In Colleges’ Revenues =
∫Djdj∫
(Euj + Dj )dj
19/28
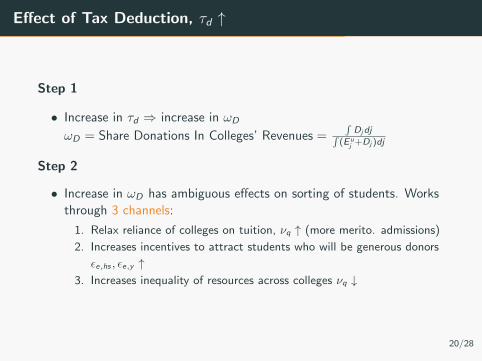
Effect of Tax Deduction, τd ↑
Step 1
• Increase in τd ⇒ increase in ωD
ωD = Share Donations In Colleges’ Revenues =∫Djdj∫
(E uj +Dj )dj
Step 2
• Increase in ωD has ambiguous effects on sorting of students. Works
through 3 channels:
1. Relax reliance of colleges on tuition, νq ↑ (more merito. admissions)
2. Increases incentives to attract students who will be generous donors
εe,hs , εe,y ↑3. Increases inequality of resources across colleges νq ↓
20/28
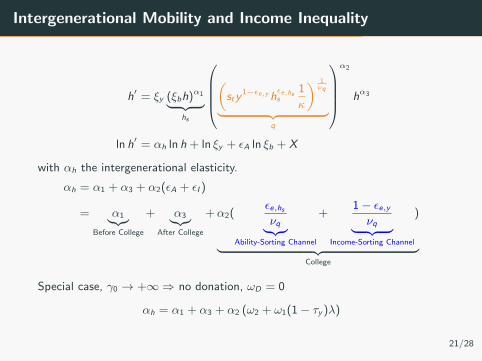
Intergenerational Mobility and Income Inequality
h′ = ξy (ξbh)α1︸ ︷︷ ︸hs
(sty
1−εe,y hεe,hss
1
κ
) 1νq
︸ ︷︷ ︸q
α2
hα3
ln h′ = αh ln h + ln ξy + εA ln ξb + X
with αh the intergenerational elasticity.
αh = α1 + α3 + α2(εA + εI )
= α1︸︷︷︸Before College
+ α3︸︷︷︸After College
+α2(εe,hsνq︸︷︷︸
Ability-Sorting Channel
+1− εe,yνq︸ ︷︷ ︸
Income-Sorting Channel
)
︸ ︷︷ ︸College
Special case, γ0 → +∞⇒ no donation, ωD = 0
αh = α1 + α3 + α2 (ω2 + ω1(1− τy )λ)
21/28
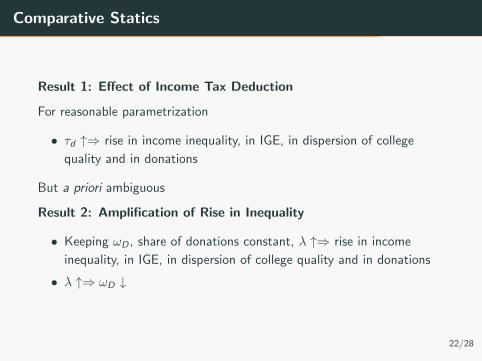
Comparative Statics
Result 1: Effect of Income Tax Deduction
For reasonable parametrization
• τd ↑⇒ rise in income inequality, in IGE, in dispersion of college
quality and in donations
But a priori ambiguous
Result 2: Amplification of Rise in Inequality
• Keeping ωD , share of donations constant, λ ↑⇒ rise in income
inequality, in IGE, in dispersion of college quality and in donations
• λ ↑⇒ ωD ↓
22/28

Extension with Endowment
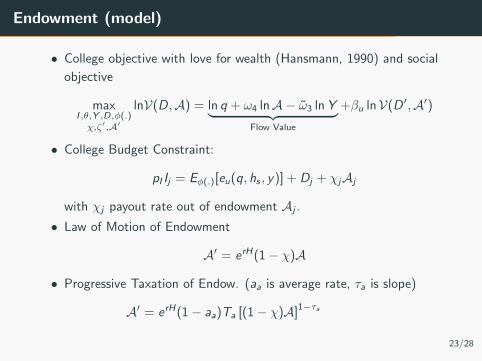
Endowment (model)
• College objective with love for wealth (Hansmann, 1990) and social
objective
maxI ,θ,Y ,D,φ(.)χ,ζ′,A′
lnV(D,A) = ln q + ω4 lnA− ω̃3 lnY︸ ︷︷ ︸Flow Value
+βu lnV(D ′,A′)
• College Budget Constraint:
pI Ij = Eφ(.)[eu(q, hs , y)] + Dj + χjAj
with χj payout rate out of endowment Aj .
• Law of Motion of Endowment
A′ = erH(1− χ)A
• Progressive Taxation of Endow. (aa is average rate, τa is slope)
A′ = erH(1− aa)Ta [(1− χ)A]1−τa
23/28
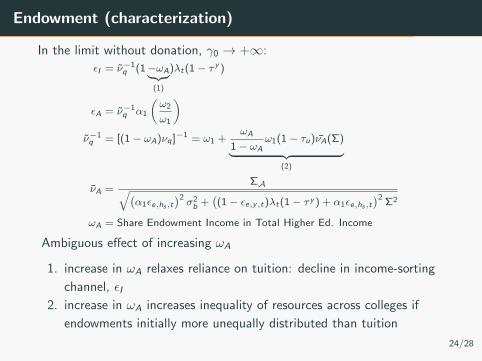
Endowment (characterization)
In the limit without donation, γ0 → +∞:
εI = ν̃−1q (1−ωA︸ ︷︷ ︸
(1)
)λt(1 − τ y )
εA = ν̃−1q α1
(ω2
ω1
)ν̃−1q = [(1 − ωA)νq ]−1 = ω1 +
ωA
1 − ωAω1(1 − τu)ν̄A(Σ)︸ ︷︷ ︸
(2)
ν̄A =ΣA√(
α1εe,hs ,t)2σ2b +
((1 − εe,y,t)λt(1 − τ y ) + α1εe,hs ,t
)2Σ2
ωA = Share Endowment Income in Total Higher Ed. Income
Ambiguous effect of increasing ωA
1. increase in ωA relaxes reliance on tuition: decline in income-sorting
channel, εI2. increase in ωA increases inequality of resources across colleges if
endowments initially more unequally distributed than tuition
24/28
Endowment (comparative statics)
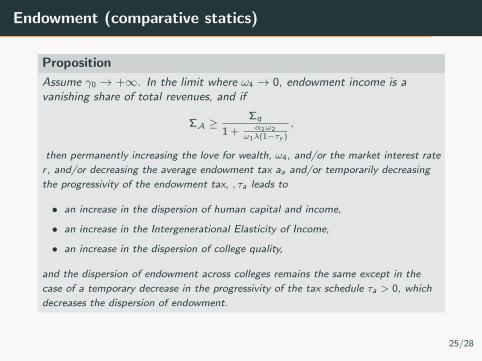
Proposition
Assume γ0 → +∞. In the limit where ω4 → 0, endowment income is avanishing share of total revenues, and if
ΣA ≥Σq
1 + α1ω2ω1λ(1−τy )
,
then permanently increasing the love for wealth, ω4, and/or the market interest rate
r , and/or decreasing the average endowment tax aa and/or temporarily decreasing
the progressivity of the endowment tax, , τa leads to
• an increase in the dispersion of human capital and income,
• an increase in the Intergenerational Elasticity of Income,
• an increase in the dispersion of college quality,
and the dispersion of endowment across colleges remains the same except in the
case of a temporary decrease in the progressivity of the tax schedule τa > 0, which
decreases the dispersion of endowment.
25/28
Conclusion
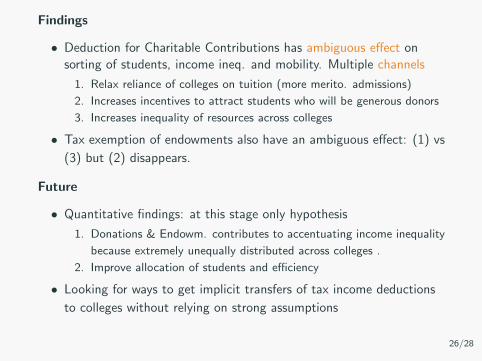
Findings
• Deduction for Charitable Contributions has ambiguous effect on
sorting of students, income ineq. and mobility. Multiple channels
1. Relax reliance of colleges on tuition (more merito. admissions)
2. Increases incentives to attract students who will be generous donors
3. Increases inequality of resources across colleges
• Tax exemption of endowments also have an ambiguous effect: (1) vs
(3) but (2) disappears.
Future
• Quantitative findings: at this stage only hypothesis
1. Donations & Endowm. contributes to accentuating income inequality
because extremely unequally distributed across colleges .
2. Improve allocation of students and efficiency
• Looking for ways to get implicit transfers of tax income deductions
to colleges without relying on strong assumptions
26/28
References
27/28
Appendix
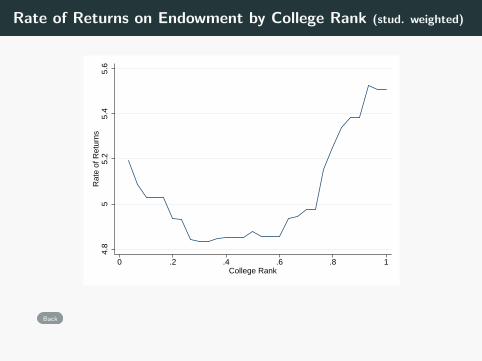
Rate of Returns on Endowment by College Rank (stud. weighted)
4.8
55.
25.
45.
6R
ate
of R
etur
ns
0 .2 .4 .6 .8 1College Rank
Back
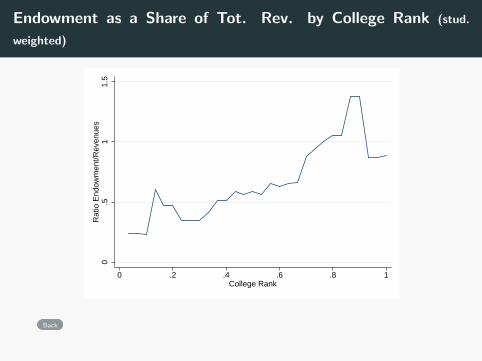
Endowment as a Share of Tot. Rev. by College Rank (stud.
weighted)
0.5
11.
5R
atio
End
owm
ent/R
even
ues
0 .2 .4 .6 .8 1College Rank
Back
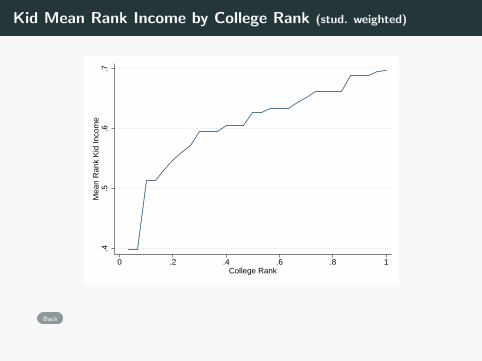
Kid Mean Rank Income by College Rank (stud. weighted)
.4.5
.6.7
Mea
n R
ank
Kid
Inco
me
0 .2 .4 .6 .8 1College Rank
Back
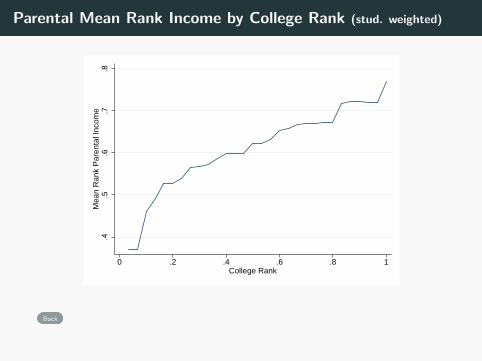
Parental Mean Rank Income by College Rank (stud. weighted)
.4.5
.6.7
.8M
ean
Ran
k P
aren
tal I
ncom
e
0 .2 .4 .6 .8 1College Rank
Back
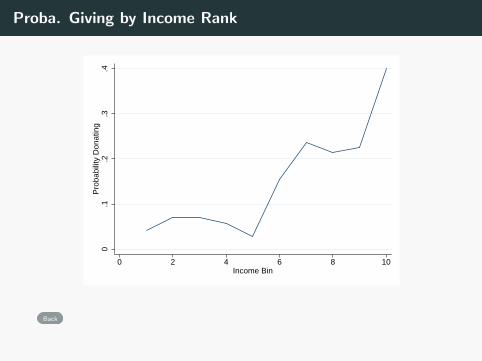
Proba. Giving by Income Rank
0.1
.2.3
.4P
roba
bilit
y D
onat
ing
0 2 4 6 8 10Income Bin
Back