Embed Size (px)
Citation preview
Charging ForwardInvestor Day 2021
1

Investor Day
Patrick Nolan – Vice President, Investor Relations
March 23, 2021
Charging ForwardWelcome and Agenda
2
Forward-Looking StatementsThis presentation may contain forward-looking statements as contemplated by the 1995 Private Securities Litigation Reform Act that
are based on management’s current outlook, expectations, estimates and projections. Words such as “anticipates,” “believes,”
“continues,” “could,” “designed,” “effect,” “estimates,” “evaluates,” “expects,” “forecasts,” “goal,” “guidance,” “initiative,” “intends,”
“may,” “outlook,” “plans,” “potential,” “predicts,” “project,” “pursue,” “seek,” “should,” “target,” “when,” “will,” “would,” and variations of
such words and similar expressions are intended to identify such forward-looking statements. Further, all statements, other than
statements of historical fact contained or incorporated by reference in this presentation that we expect or anticipate will or may occur
in the future regarding our financial position, business strategy and measures to implement that strategy, including changes to
operations, competitive strengths, goals, expansion and growth of our business and operations, plans, references to future success
and other such matters, are forward-looking statements. Accounting estimates, such as those described under the heading “Critical
Accounting Policies and Estimates” in Item 7 of our Annual Report on Form 10-K for the year ended December 31, 2020 (“Form 10-
K”), are inherently forward-looking. All forward-looking statements are based on assumptions and analyses made by us in light of our
experience and our perception of historical trends, current conditions and expected future developments, as well as other factors we
believe are appropriate in the circumstances. Forward-looking statements are not guarantees of performance, and the Company’s
actual results may differ materially from those expressed, projected or implied in or by the forward-looking statements.
3
You should not place undue reliance on these forward-looking statements, which speak only as of the date of this presentation.
Forward-looking statements are subject to risks and uncertainties, many of which are difficult to predict and generally beyond our
control, that could cause actual results to differ materially from those expressed, projected or implied in or by the forward-looking
statements. These risks and uncertainties, among others, include: the difficulty in forecasting margin performance and free cash flow
through 2025 in light of the variables that can impact those results over that period of time; the difficulty in forecasting demand for
electric vehicles and our EV revenue growth to 2030; the ability to identify targets and consummate acquisitions on acceptable terms;
failure to realize the expected benefits of acquisitions; the ability to identify appropriate combustion portfolio businesses for
disposition and consummate planned dispositions on acceptable terms; competitive challenges from existing and new competitors
including OEM customers; the challenges associated with rapidly-changing technologies, particularly as relates to electric vehicles,
and our ability to innovate in response; uncertainties regarding the extent and duration of impacts of matters associated with COVID-
19, including additional production disruptions; the failure to realize the expected benefits of the acquisition of Delphi Technologies
PLC that the Company completed on October 1, 2020; the failure to promptly and effectively integrate acquired businesses; the
potential for unknown or inestimable liabilities relating to the acquired businesses; the possibility that the proposed transaction
between the Company and AKASOL AG will not be consummated; failure to obtain necessary regulatory approvals or to satisfy any
of the other conditions to the proposed transaction; our dependence on automotive and truck production, both of which are highly
cyclical and subject to disruptions; our reliance on major OEM customers; commodities availability and pricing; supply disruptions;
fluctuations in interest rates and foreign currency exchange rates; availability of credit; our dependence on key management; our
dependence on information systems; the uncertainty of the global economic environment; the outcome of existing or any future legal
proceedings; future changes in laws and regulations, including, by way of example, tariffs, in the countries in which we operate;
impacts from any potential future acquisition or divestiture transactions; and the other risks noted in reports that we file with the
Securities and Exchange Commission, including Item 1A, “Risk Factors” in our most recently-filed Form 10-K. We do not undertake
any obligation to update or announce publicly any updates to or revisions to any of the forward-looking statements in this
presentation to reflect any change in our expectations or any change in events, conditions, circumstances, or assumptions underlying
the statements.
4
Non-GAAP Financial MeasuresThis presentation contains information about BorgWarner’s financial results that is not presented in accordance with accounting
principles generally accepted in the United States (“GAAP”). Such non-GAAP financial measures are reconciled to their closest
GAAP financial measures in the Appendix. The provision of these comparable GAAP financial measures for 2021 and later is not
intended to indicate that BorgWarner is explicitly or implicitly providing projections on those GAAP financial measures, and actual
results for such measures are likely to vary from those presented. The reconciliations include all information reasonably available to
the company at the date of this presentation and the adjustments that management can reasonably predict.
Management believes that these non-GAAP financial measures are useful to management, investors, and banking institutions in their
analysis of the Company's business and operating performance. Management also uses this information for operational planning and
decision-making purposes.
Non-GAAP financial measures are not and should not be considered a substitute for any GAAP measure. Additionally, because not
all companies use identical calculations, the non-GAAP financial measures as presented by BorgWarner may not be comparable to
similarly titled measures reported by other companies.
5
Today’s Agenda
Accelerating Our Electrification Strategy Fred Lissalde, Chief Executive Officer
Technology Leadership in Electrification Stefan Demmerle,
President, PowerDrive Systems
Financial Performance and Outlook Kevin Nowlan, Chief Financial Officer
Closing Remarks Fred Lissalde
Break All
Q&A All
6

Questions
FOR THOSE DIALING IN
United States: (844) 264-9340
International: (267) 753-2116
Conference ID: 9958459
To ask a question: Press *1
FOR THOSE LISTENING ON-LINE
Submit your questions to [email protected] during the call
7
Investor Day
Fred Lissalde – Chief Executive Officer
March 23, 2021
Charging ForwardAccelerating Our Electrification Strategy
8
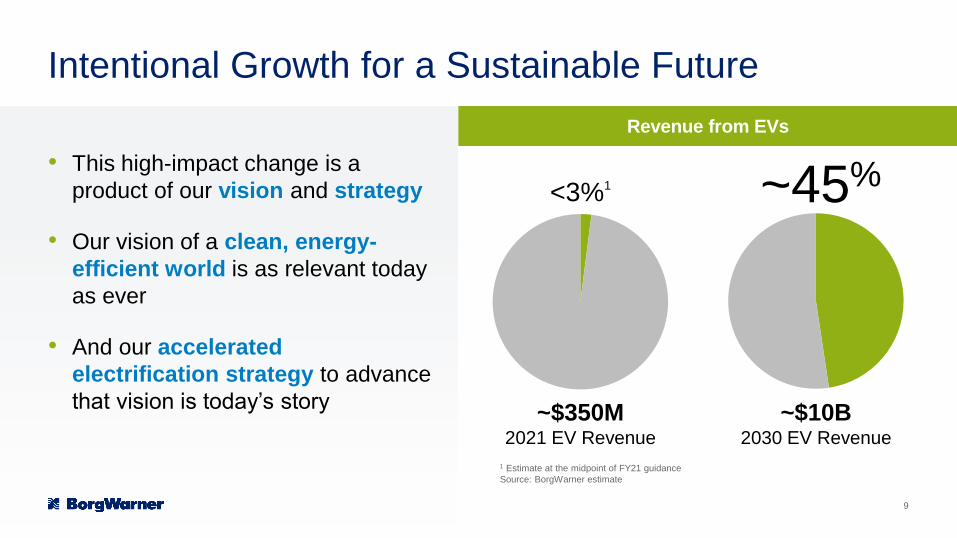
Intentional Growth for a Sustainable Future
• This high-impact change is a
product of our vision and strategy
• Our vision of a clean, energy-
efficient world is as relevant today
as ever
• And our accelerated
electrification strategy to advance
that vision is today’s story
1 Estimate at the midpoint of FY21 guidance
Source: BorgWarner estimate
~$350M2021 EV Revenue
~45%<3%1
~$10B2030 EV Revenue
Revenue from EVs
9
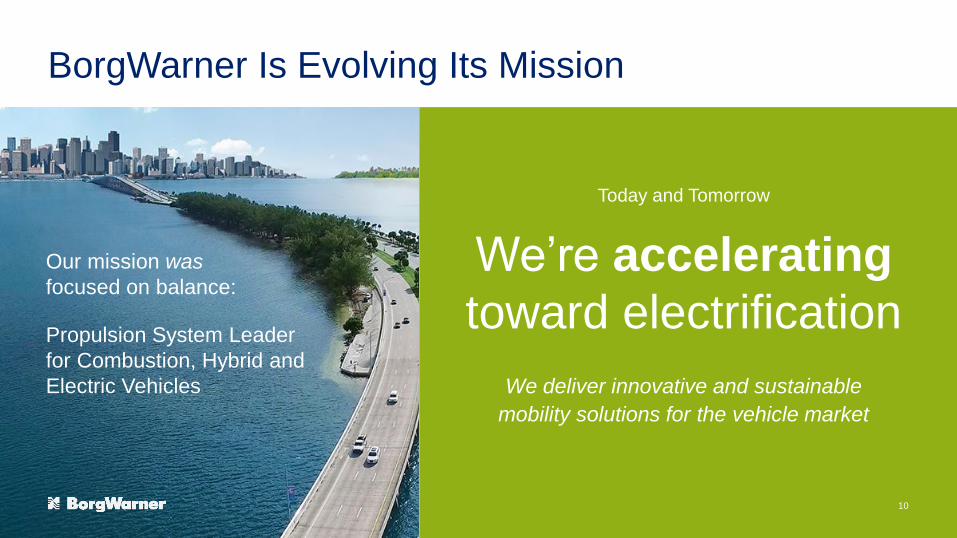
BorgWarner Is Evolving Its Mission
Our mission was
focused on balance:
Today and Tomorrow
We deliver innovative and sustainable
mobility solutions for the vehicle market
We’re accelerating
toward electrificationPropulsion System Leader
for Combustion, Hybrid and
Electric Vehicles
10
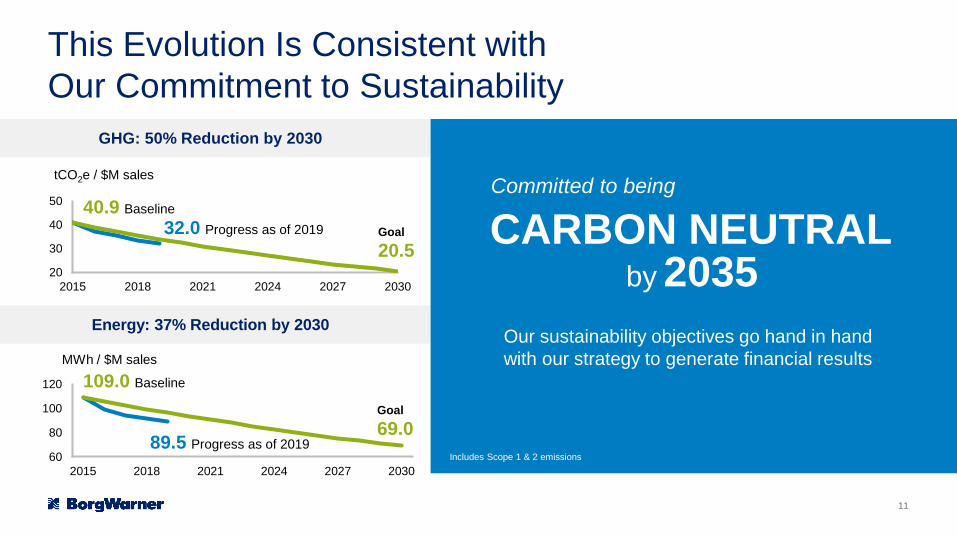
This Evolution Is Consistent with
Our Commitment to Sustainability
60
80
100
120
2015 2018 2021 2024 2027 2030
GHG: 50% Reduction by 2030
Energy: 37% Reduction by 2030
tCO2e / $M sales
20
30
40
50
2015 2018 2021 2024 2027 2030
40.9 Baseline
89.5 Progress as of 2019
Goal
20.5
MWh / $M sales
32.0 Progress as of 2019
109.0 Baseline
Goal
69.0
Our sustainability objectives go hand in hand
with our strategy to generate financial results
Committed to being
CARBON NEUTRAL by 2035
Includes Scope 1 & 2 emissions
11
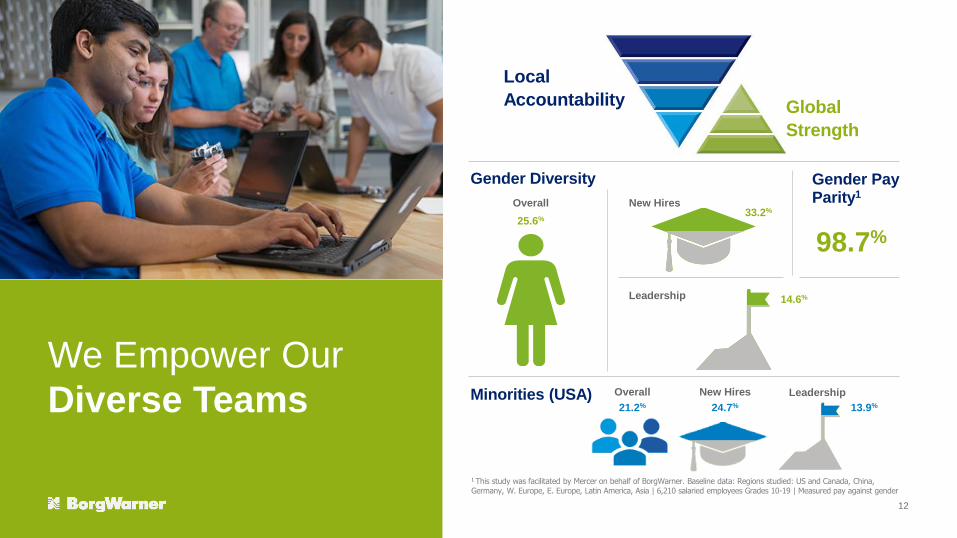
We Empower Our
Diverse Teams
Gender Pay Parity1
98.7%
Gender Diversity
Overall
25.6%
New Hires33.2%
14.6%Leadership
Local
Accountability Global
Strength
1 This study was facilitated by Mercer on behalf of BorgWarner. Baseline data: Regions studied: US and Canada, China, Germany, W. Europe, E. Europe, Latin America, Asia | 6,210 salaried employees Grades 10-19 | Measured pay against gender
We Empower Our
Diverse Teams Minorities (USA) Overall
21.2%
New Hires
24.7% 13.9%
Leadership
12
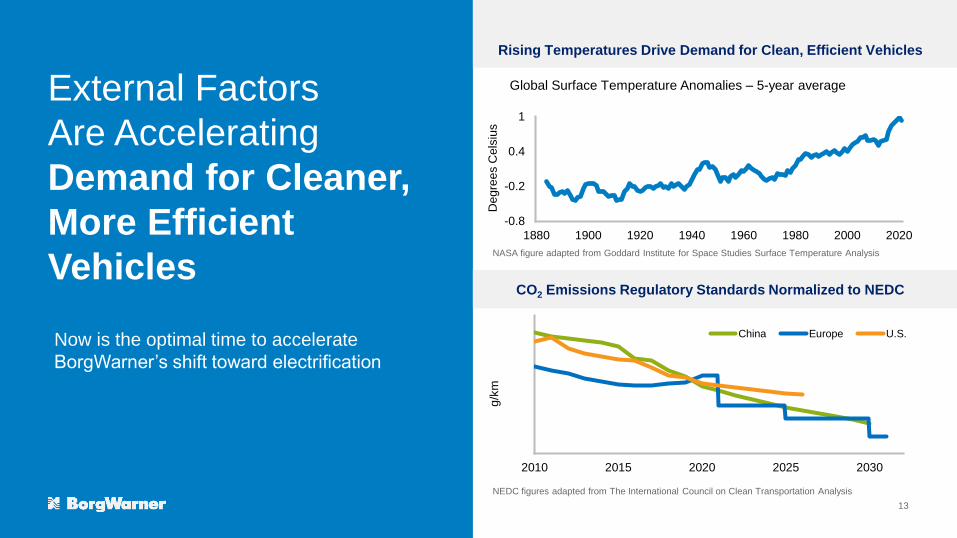
External Factors
Are Accelerating
Demand for Cleaner,
More Efficient
Vehicles
Rising Temperatures Drive Demand for Clean, Efficient Vehicles
40
60
80
100
120
140
160
180
200
2010 2015 2020 2025 2030
China Europe U.S.
NASA figure adapted from Goddard Institute for Space Studies Surface Temperature Analysis
Now is the optimal time to accelerate
BorgWarner’s shift toward electrification
CO2 Emissions Regulatory Standards Normalized to NEDC
NEDC figures adapted from The International Council on Clean Transportation Analysis
-0.8
-0.2
0.4
1
1880 1900 1920 1940 1960 1980 2000 2020
Global Surface Temperature Anomalies – 5-year average
De
gre
es
Cels
ius
g/k
m13
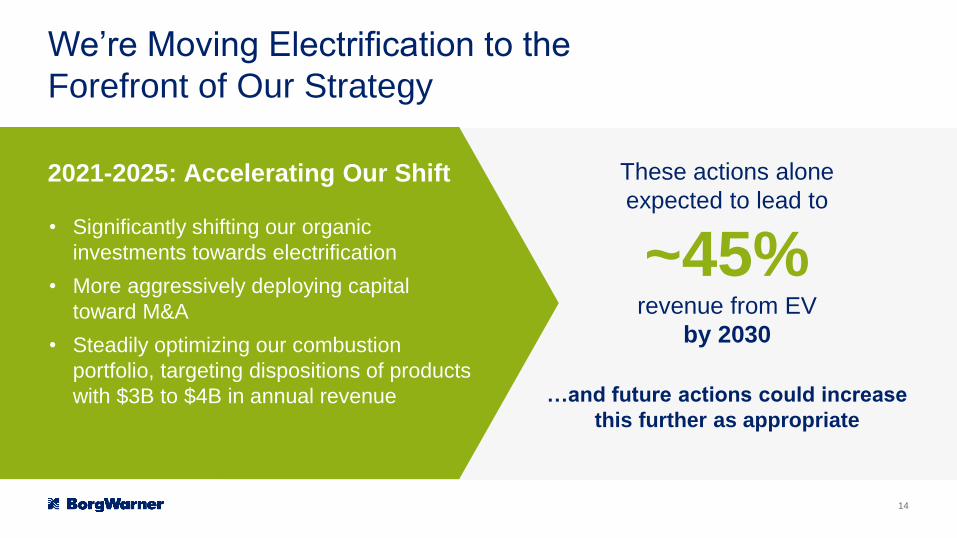
We’re Moving Electrification to the
Forefront of Our Strategy
These actions alone
expected to lead to
~45%revenue from EV
by 2030
…and future actions could increase
this further as appropriate
2021-2025: Accelerating Our Shift
• Significantly shifting our organic
investments towards electrification
• More aggressively deploying capital
toward M&A
• Steadily optimizing our combustion
portfolio, targeting dispositions of products
with $3B to $4B in annual revenue
14
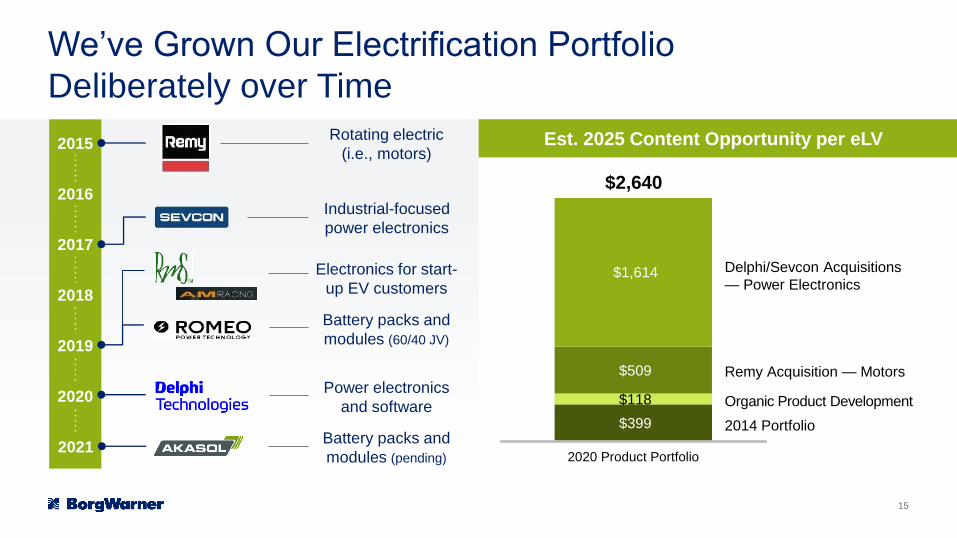
$399
$118
$509
$2,640
2020 Product Portfolio
2020
2017
2019
2016
2018
2015
2021
Est. 2025 Content Opportunity per eLV
2014 Portfolio
Remy Acquisition — Motors
Organic Product Development
Delphi/Sevcon Acquisitions
— Power Electronics$1,614
Rotating electric
(i.e., motors)
Industrial-focused
power electronics
Electronics for start-
up EV customers
Battery packs and
modules (60/40 JV)
Power electronics
and software
Battery packs and
modules (pending)
We’ve Grown Our Electrification Portfolio
Deliberately over Time
15
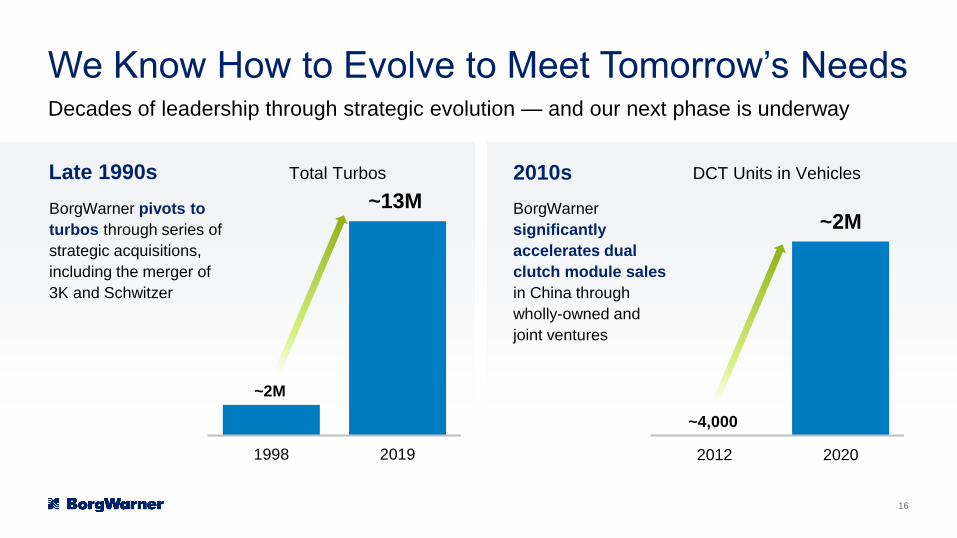
We Know How to Evolve to Meet Tomorrow’s NeedsDecades of leadership through strategic evolution — and our next phase is underway
BorgWarner pivots to
turbos through series of
strategic acquisitions,
including the merger of
3K and Schwitzer
BorgWarner
significantly
accelerates dual
clutch module sales
in China through
wholly-owned and
joint ventures
Late 1990s 2010s
~4,000
~2M
2012 2020
DCT Units in Vehicles
~2M
~13M
1998 2019
Total Turbos
16
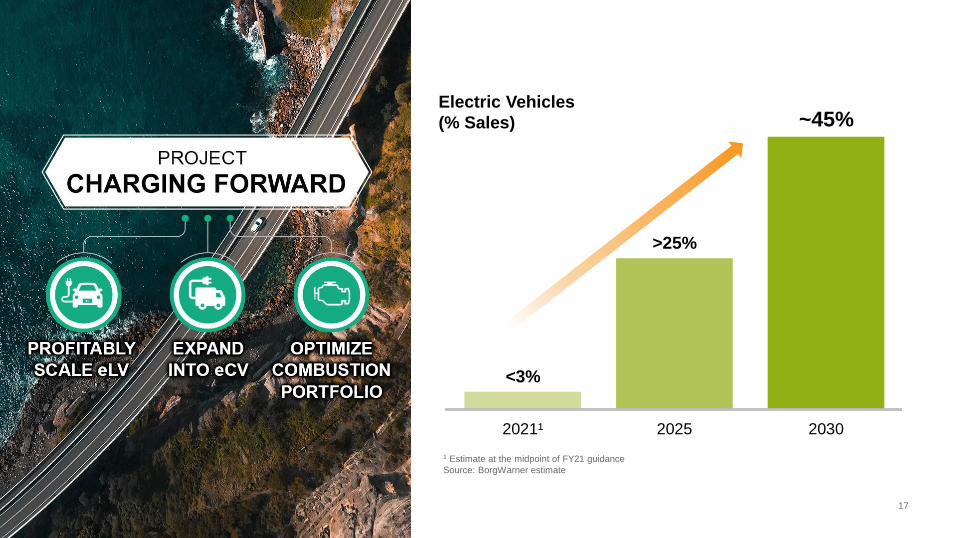
Electric Vehicles
(% Sales)
<3%
>25%
~45%
2021¹ 2025 2030
1 Estimate at the midpoint of FY21 guidance
Source: BorgWarner estimate
17
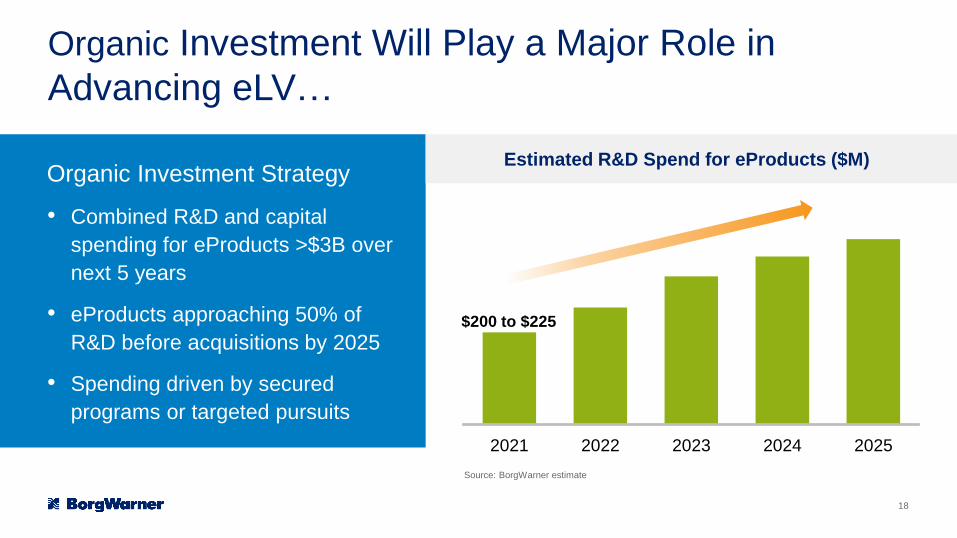
$200 to $225
2021 2022 2023 2024 2025
Organic Investment Will Play a Major Role in
Advancing eLV…
Organic Investment Strategy
• Combined R&D and capital
spending for eProducts >$3B over
next 5 years
• eProducts approaching 50% of
R&D before acquisitions by 2025
• Spending driven by secured
programs or targeted pursuits
Estimated R&D Spend for eProducts ($M)
Source: BorgWarner estimate
18
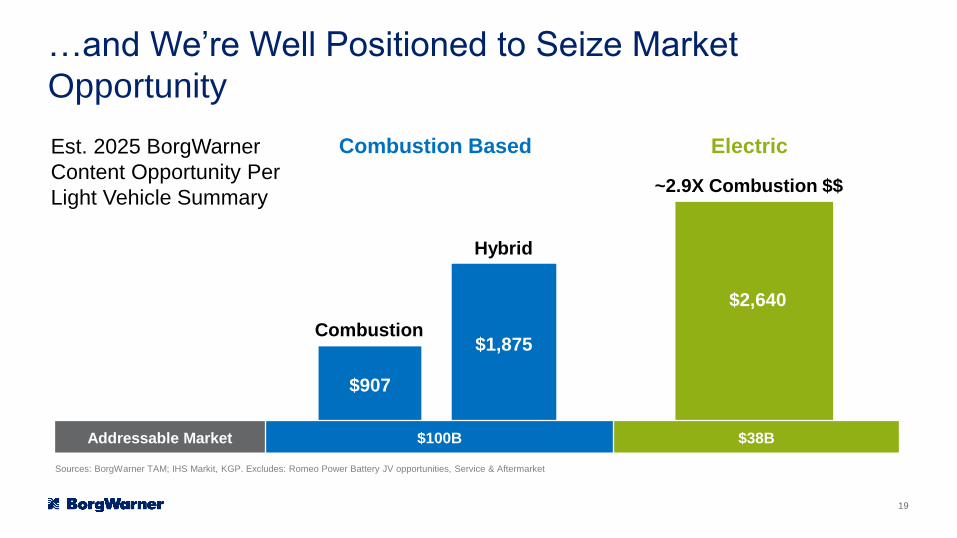
$907
$1,875
…and We’re Well Positioned to Seize Market
Opportunity
$2,640
Combustion Based Electric
~2.9X Combustion $$
Addressable Market $100B $38B
Est. 2025 BorgWarner
Content Opportunity Per
Light Vehicle Summary
Combustion
Hybrid
Sources: BorgWarner TAM; IHS Markit, KGP. Excludes: Romeo Power Battery JV opportunities, Service & Aftermarket
19
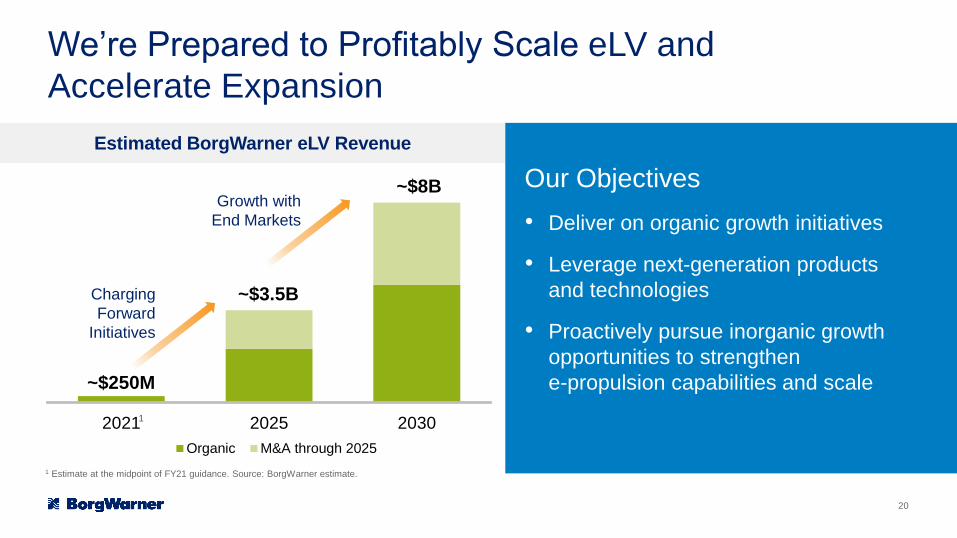
~$250M
2021 2025 2030
Organic M&A through 2025
We’re Prepared to Profitably Scale eLV and
Accelerate Expansion
~$3.5B
~$8B
Estimated BorgWarner eLV Revenue
Charging
Forward
Initiatives
1
1 Estimate at the midpoint of FY21 guidance. Source: BorgWarner estimate.
Our Objectives
• Deliver on organic growth initiatives
• Leverage next-generation products
and technologies
• Proactively pursue inorganic growth
opportunities to strengthen
e-propulsion capabilities and scale
Growth with
End Markets
20
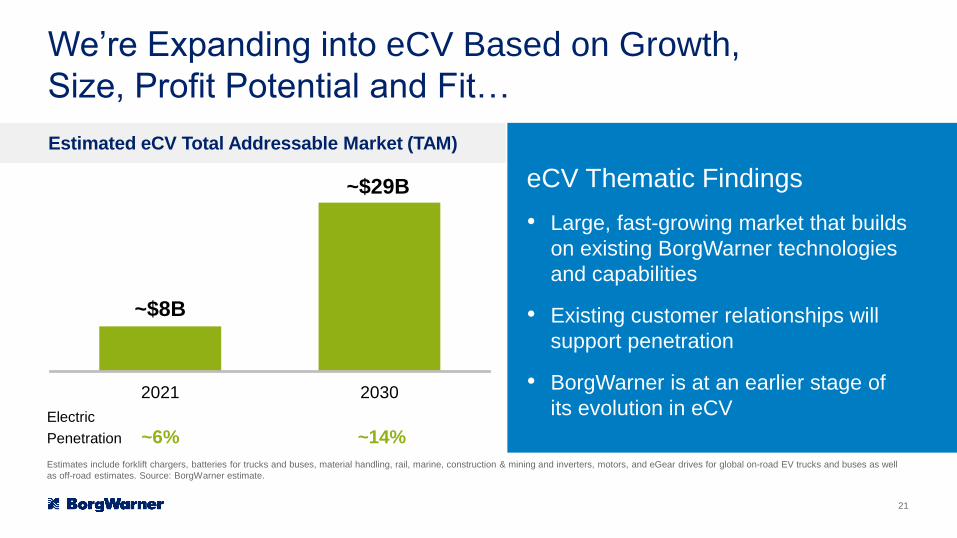
We’re Expanding into eCV Based on Growth,
Size, Profit Potential and Fit…
eCV Thematic Findings
• Large, fast-growing market that builds
on existing BorgWarner technologies
and capabilities
• Existing customer relationships will
support penetration
• BorgWarner is at an earlier stage of
its evolution in eCV
Estimated eCV Total Addressable Market (TAM)
~$8B
~$29B
2021 2030
Electric
Penetration ~6% ~14%
Estimates include forklift chargers, batteries for trucks and buses, material handling, rail, marine, construction & mining and inverters, motors, and eGear drives for global on-road EV trucks and buses as well
as off-road estimates. Source: BorgWarner estimate.
21
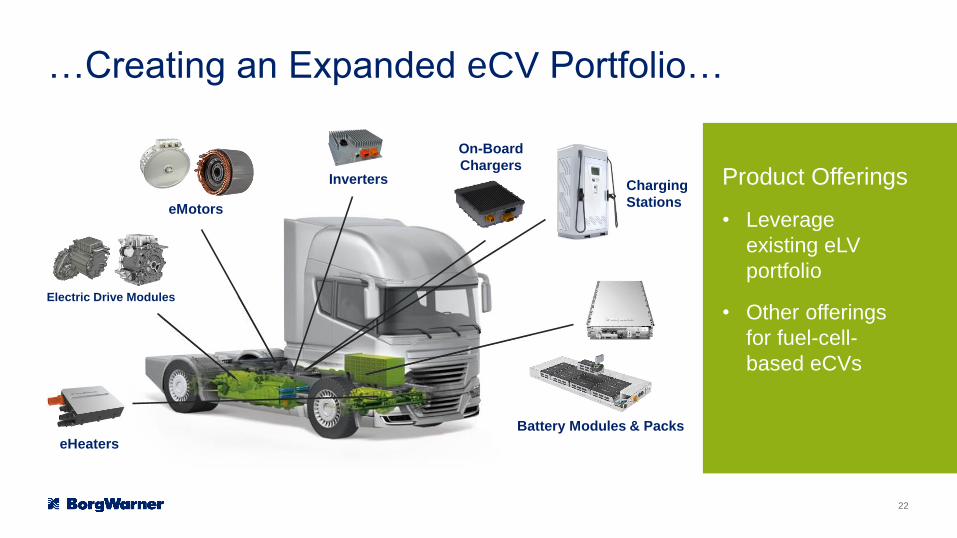
…Creating an Expanded eCV Portfolio…
Electric Drive Modules
eMotors
Inverters
On-Board
Chargers
Battery Modules & Packs
Charging
Stations
eHeaters
Product Offerings
• Leverage
existing eLV
portfolio
• Other offerings
for fuel-cell-
based eCVs
22
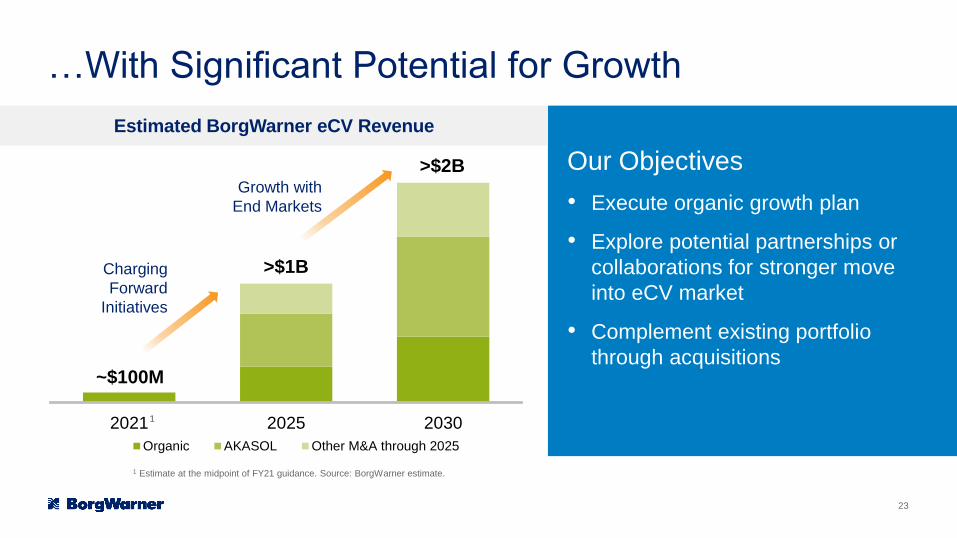
…With Significant Potential for Growth
2021 2025 2030
Organic AKASOL Other M&A through 2025
~$100M
>$1B
>$2B Our Objectives
• Execute organic growth plan
• Explore potential partnerships or
collaborations for stronger move
into eCV market
• Complement existing portfolio
through acquisitions
Estimated BorgWarner eCV Revenue
Charging
Forward
Initiatives
Growth with
End Markets
1
1 Estimate at the midpoint of FY21 guidance. Source: BorgWarner estimate.
23
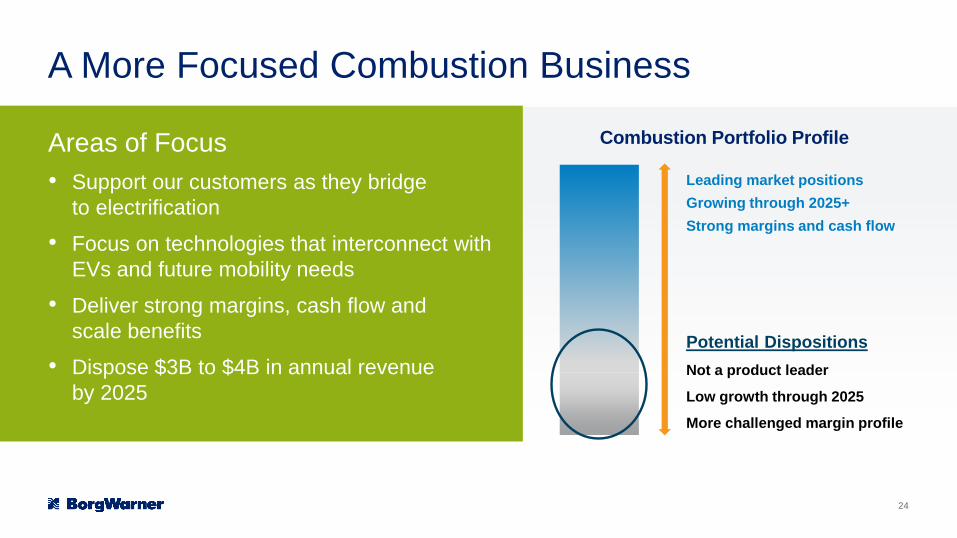
A More Focused Combustion Business
Areas of Focus
• Support our customers as they bridge
to electrification
• Focus on technologies that interconnect with
EVs and future mobility needs
• Deliver strong margins, cash flow and
scale benefits
• Dispose $3B to $4B in annual revenue
by 2025
Leading market positions
Growing through 2025+
Strong margins and cash flow
Potential Dispositions
Not a product leader
Low growth through 2025
More challenged margin profile
Combustion Portfolio Profile
24
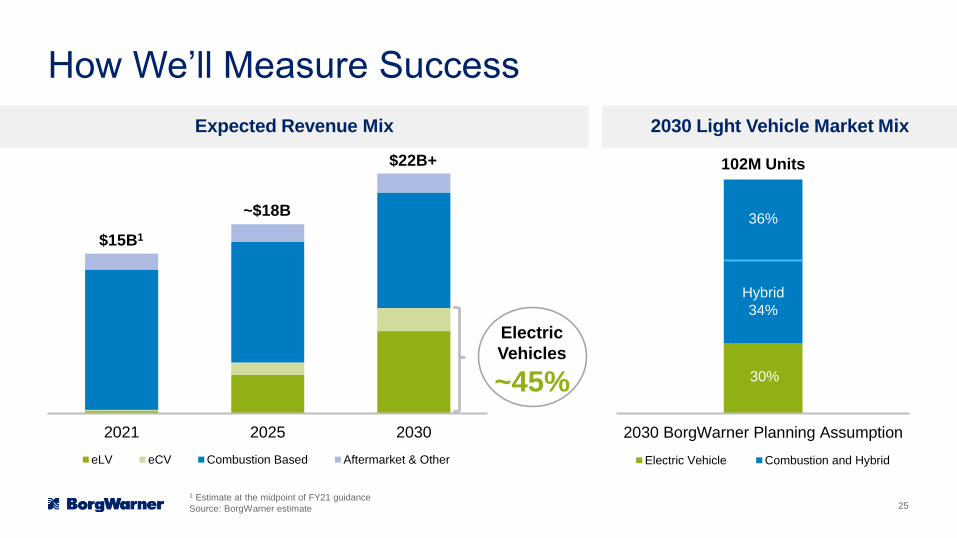
30%
2030 BorgWarner Planning Assumption
Electric Vehicle Combustion and Hybrid
How We’ll Measure Success
2021 2025 2030
eLV eCV Combustion Based Aftermarket & Other
1 Estimate at the midpoint of FY21 guidance
Source: BorgWarner estimate
Expected Revenue Mix
Electric
Vehicles
~45%
2030 Light Vehicle Market Mix
36%
102M Units
$15B1
~$18B
$22B+
Hybrid
34%
25
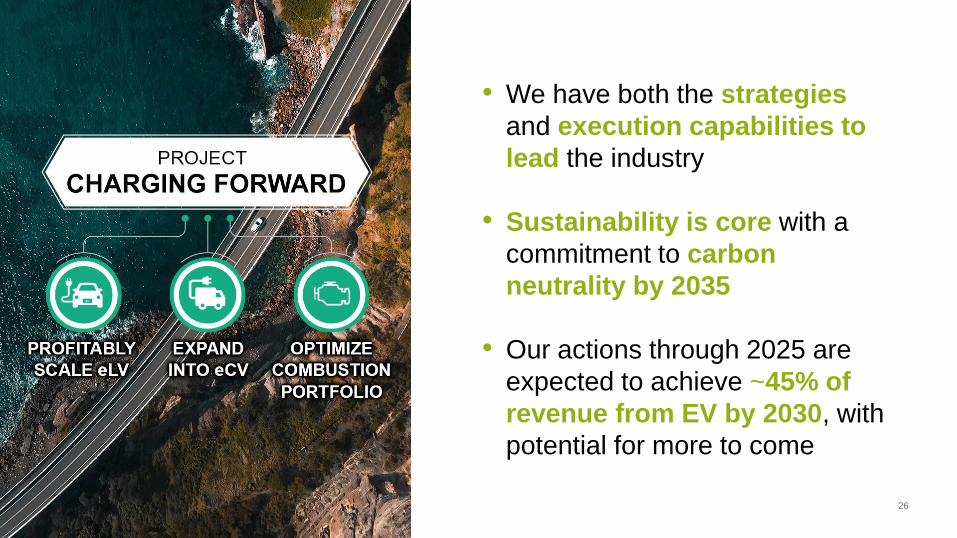
• We have both the strategies
and execution capabilities to
lead the industry
• Sustainability is core with a
commitment to carbon
neutrality by 2035
• Our actions through 2025 are
expected to achieve ~45% of
revenue from EV by 2030, with
potential for more to come
26
27
Investor Day
Stefan Demmerle – President, PowerDrive Systems
March 23, 2021
Charging ForwardTechnology Leadership Positions BorgWarner
to Capture Electrification Opportunities
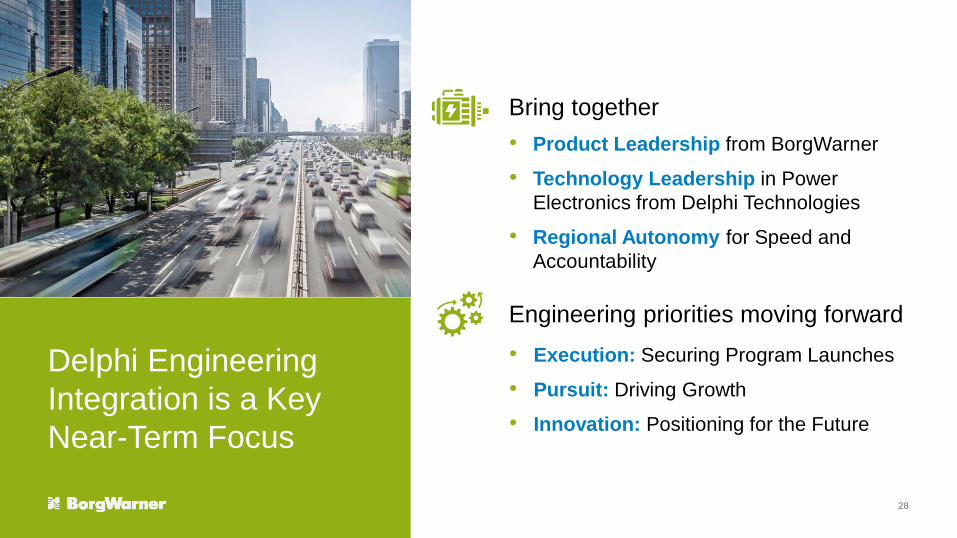
Delphi Engineering
Integration is a Key
Near-Term Focus
Bring together
• Product Leadership from BorgWarner
• Technology Leadership in Power
Electronics from Delphi Technologies
• Regional Autonomy for Speed and
Accountability
Engineering priorities moving forward
• Execution: Securing Program Launches
• Pursuit: Driving Growth
• Innovation: Positioning for the Future
28
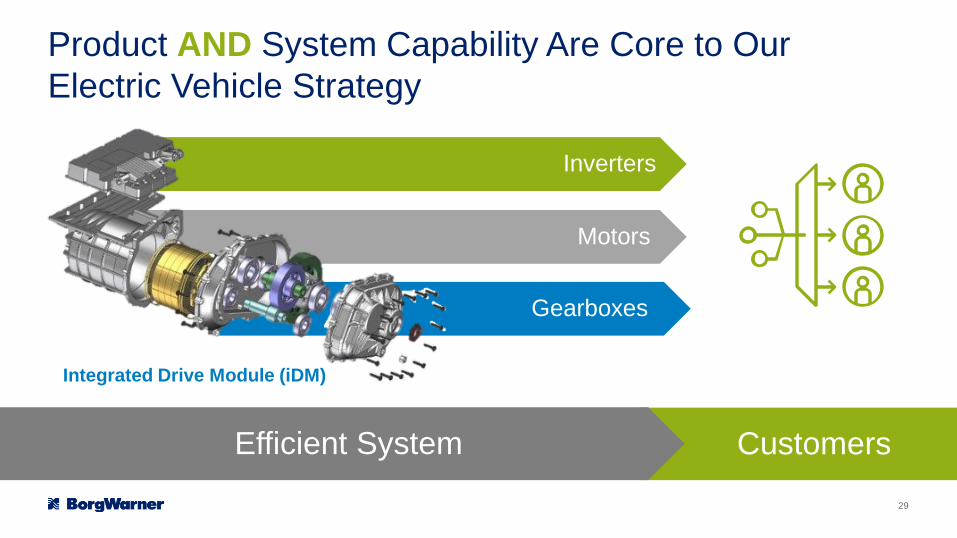
Product AND System Capability Are Core to Our
Electric Vehicle Strategy
Inverters
Motors
Gearboxes
Efficient System Customers
Integrated Drive Module (iDM)
29
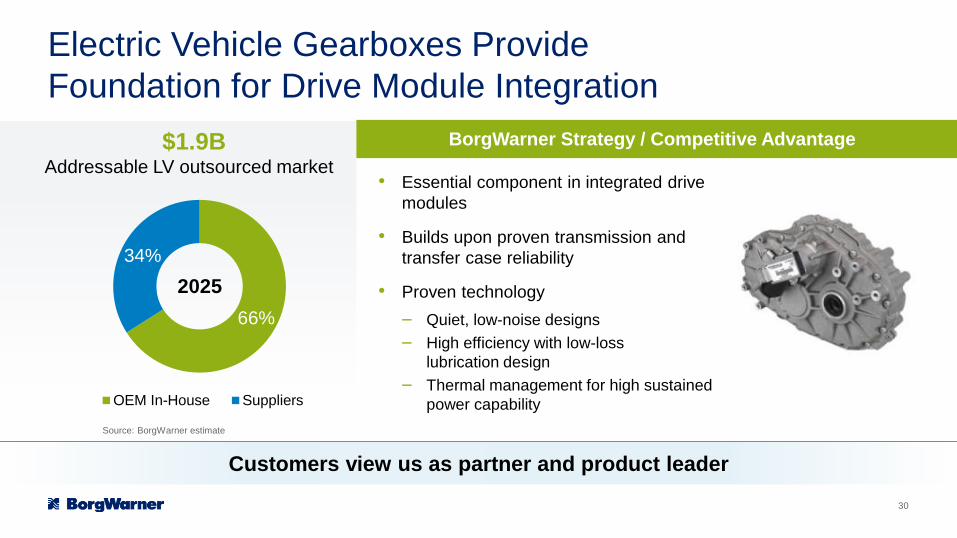
Electric Vehicle Gearboxes Provide
Foundation for Drive Module Integration
66%
34%
OEM In-House Suppliers
2025
$1.9BAddressable LV outsourced market
Customers view us as partner and product leader
• Essential component in integrated drive
modules
• Builds upon proven transmission and
transfer case reliability
• Proven technology
– Quiet, low-noise designs
– High efficiency with low-loss
lubrication design
– Thermal management for high sustained
power capability
BorgWarner Strategy / Competitive Advantage
Source: BorgWarner estimate
30
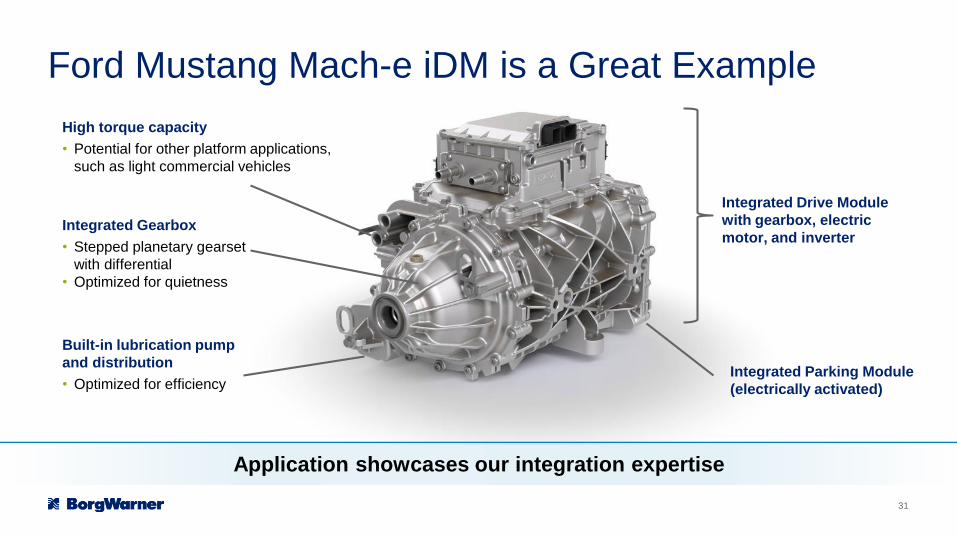
Ford Mustang Mach-e iDM is a Great Example
High torque capacity
• Potential for other platform applications,
such as light commercial vehicles
Integrated Gearbox
• Stepped planetary gearset
with differential
• Optimized for quietness
Integrated Drive Module
with gearbox, electric
motor, and inverter
Integrated Parking Module
(electrically activated)
Built-in lubrication pump
and distribution
• Optimized for efficiency
Application showcases our integration expertise
31
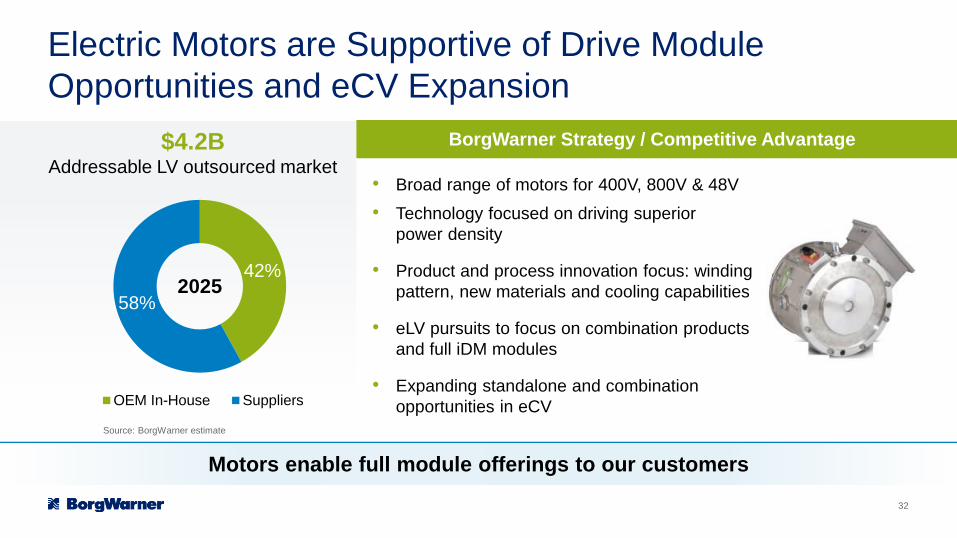
Electric Motors are Supportive of Drive Module
Opportunities and eCV Expansion
42%
58%
OEM In-House Suppliers
2025
$4.2BAddressable LV outsourced market
• Broad range of motors for 400V, 800V & 48V
• Technology focused on driving superior
power density
• Product and process innovation focus: winding
pattern, new materials and cooling capabilities
• eLV pursuits to focus on combination products
and full iDM modules
• Expanding standalone and combination
opportunities in eCV
BorgWarner Strategy / Competitive Advantage
Motors enable full module offerings to our customers
Source: BorgWarner estimate
32
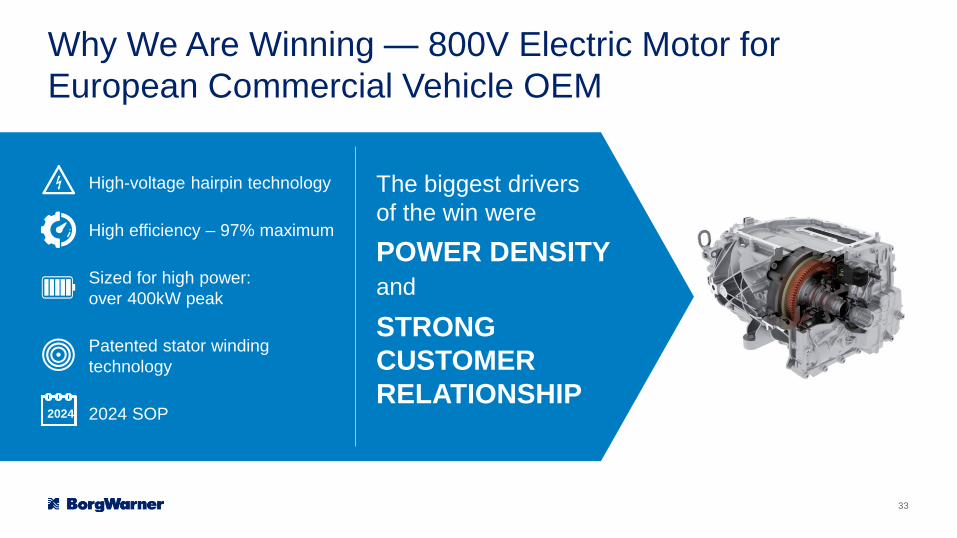
Why We Are Winning — 800V Electric Motor for
European Commercial Vehicle OEM
High-voltage hairpin technology
High efficiency – 97% maximum
Sized for high power:
over 400kW peak
Patented stator winding
technology
2024 SOP2024
The biggest drivers
of the win were
POWER DENSITY
and
STRONG
CUSTOMER
RELATIONSHIP
33
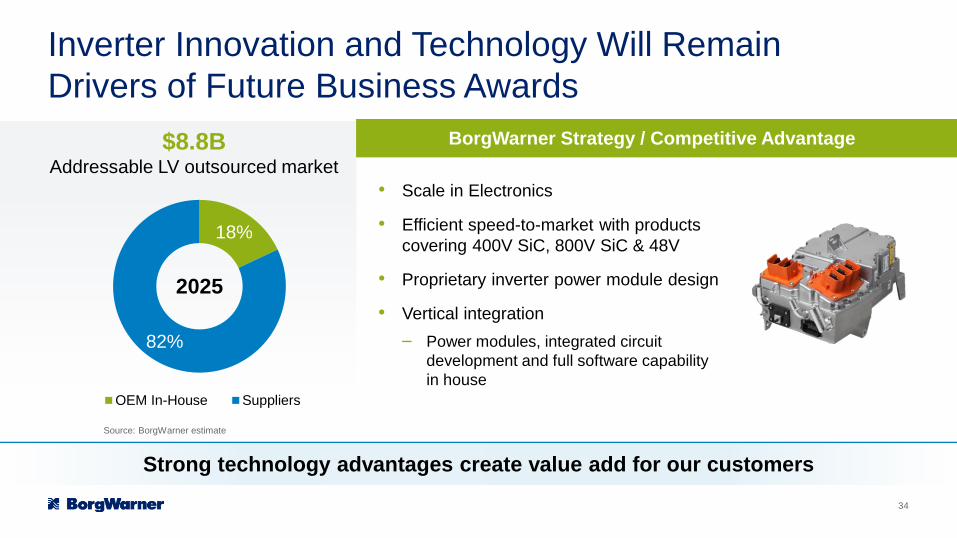
Inverter Innovation and Technology Will Remain
Drivers of Future Business Awards
18%
82%
OEM In-House Suppliers
2025
$8.8BAddressable LV outsourced market
Strong technology advantages create value add for our customers
• Scale in Electronics
• Efficient speed-to-market with products
covering 400V SiC, 800V SiC & 48V
• Proprietary inverter power module design
• Vertical integration
– Power modules, integrated circuit
development and full software capability
in house
BorgWarner Strategy / Competitive Advantage
Source: BorgWarner estimate
34
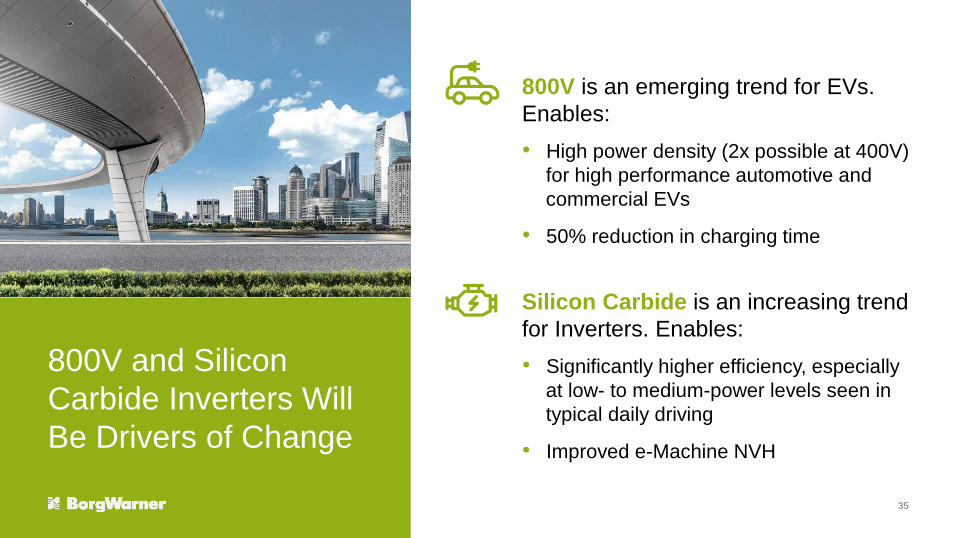
800V and Silicon
Carbide Inverters Will
Be Drivers of Change
800V is an emerging trend for EVs.
Enables:
• High power density (2x possible at 400V)
for high performance automotive and
commercial EVs
• 50% reduction in charging time
Silicon Carbide is an increasing trend
for Inverters. Enables:
• Significantly higher efficiency, especially
at low- to medium-power levels seen in
typical daily driving
• Improved e-Machine NVH
35
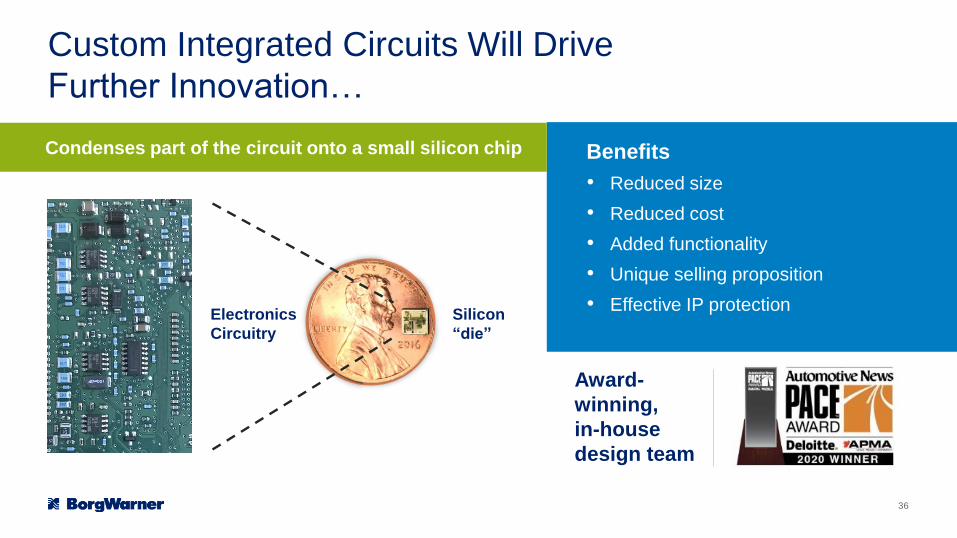
Custom Integrated Circuits Will Drive
Further Innovation…
Silicon
“die”
Electronics
Circuitry
Benefits
• Reduced size
• Reduced cost
• Added functionality
• Unique selling proposition
• Effective IP protection
Condenses part of the circuit onto a small silicon chip
Award-
winning,
in-house
design team
36
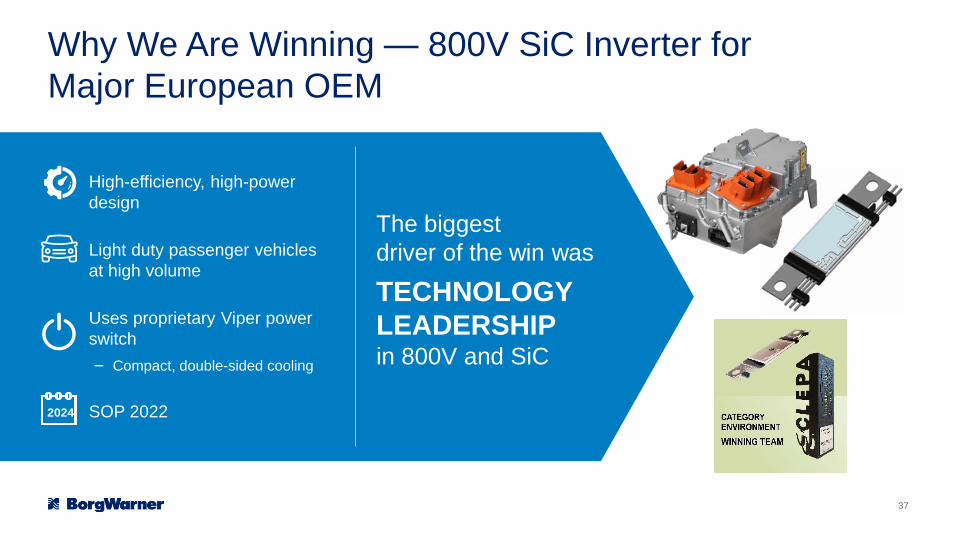
Why We Are Winning — 800V SiC Inverter for
Major European OEM
High-efficiency, high-power
design
Light duty passenger vehicles
at high volume
Uses proprietary Viper power
switch
– Compact, double-sided cooling
SOP 2022
The biggest
driver of the win was
TECHNOLOGY
LEADERSHIPin 800V and SiC
2024
37
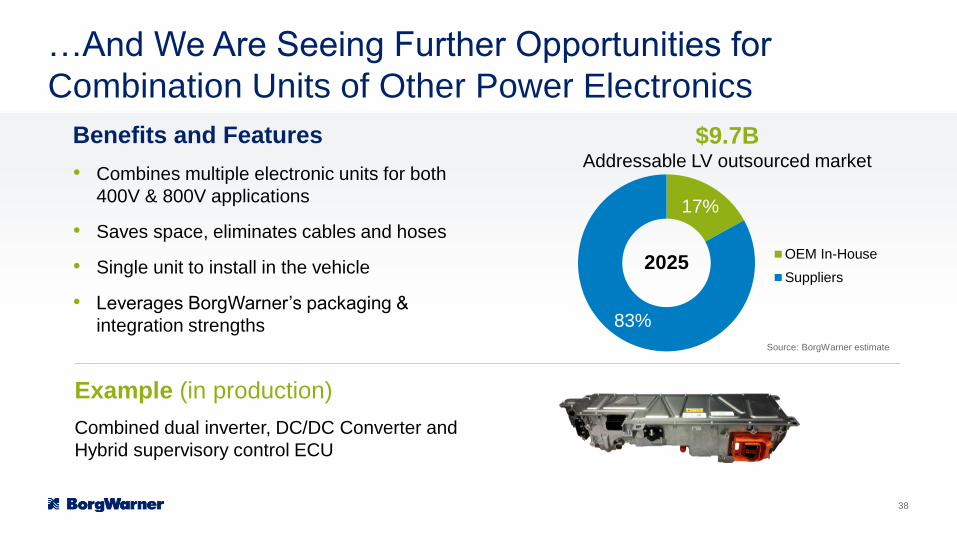
…And We Are Seeing Further Opportunities for
Combination Units of Other Power Electronics
Benefits and Features
• Combines multiple electronic units for both
400V & 800V applications
• Saves space, eliminates cables and hoses
• Single unit to install in the vehicle
• Leverages BorgWarner’s packaging &
integration strengths
Example (in production)
Combined dual inverter, DC/DC Converter and
Hybrid supervisory control ECU
17%
83%
OEM In-House
Suppliers2025
$9.7BAddressable LV outsourced market
Source: BorgWarner estimate
38
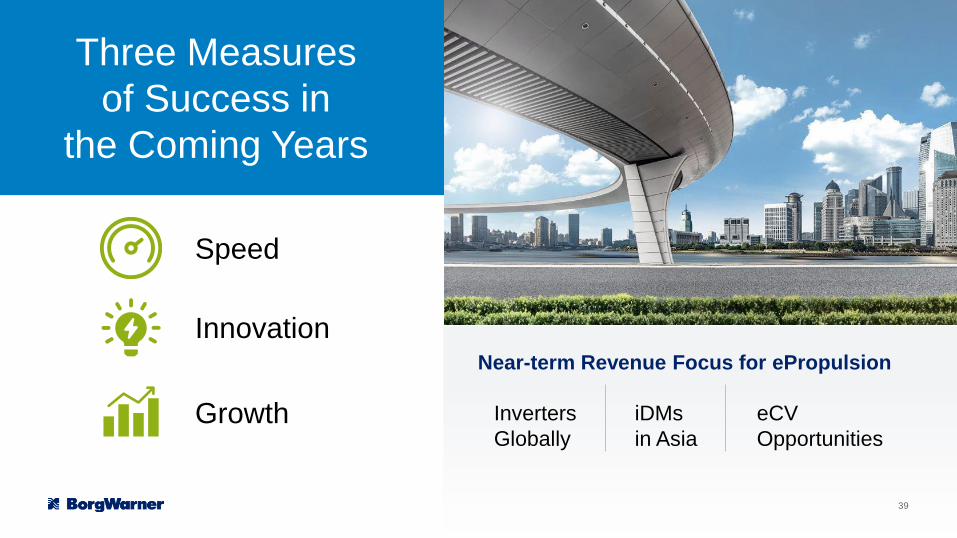
Three Measures
of Success in
the Coming Years
Growth
Innovation
Speed
Inverters
Globally
iDMs
in Asia
eCV
Opportunities
Near-term Revenue Focus for ePropulsion
39
© BorgWarner Inc. 40
Investor Day
Kevin Nowlan – Chief Financial Officer
March 23, 2021
Charging ForwardFinancial Performance and Outlook
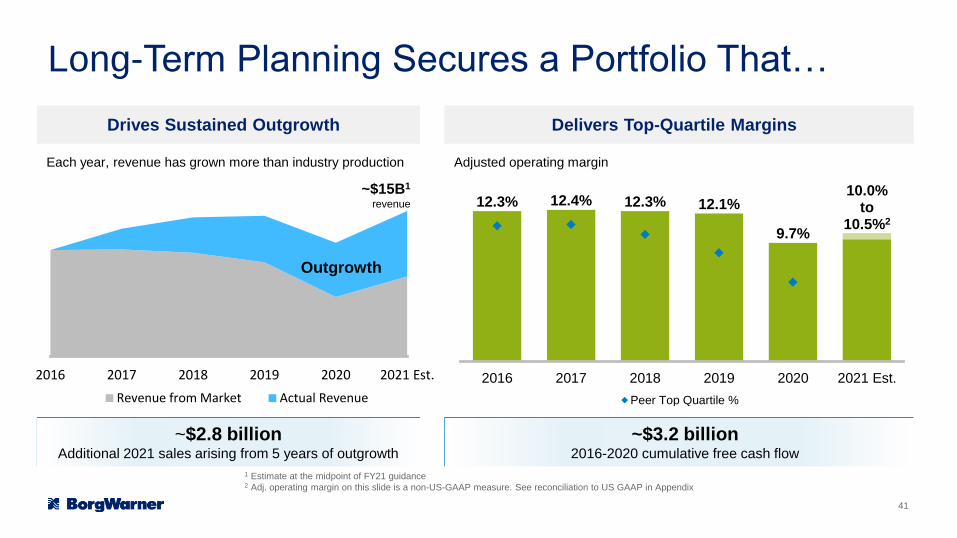
2016 2017 2018 2019 2020 2021 Est.
Revenue from Market Actual Revenue
12.3% 12.4% 12.3% 12.1%
9.7%
10.0%to
10.5%2
2016 2017 2018 2019 2020 2021 Est.
Peer Top Quartile %
Long-Term Planning Secures a Portfolio That…
Each year, revenue has grown more than industry production Adjusted operating margin
~$3.2 billion2016-2020 cumulative free cash flow
~$2.8 billion Additional 2021 sales arising from 5 years of outgrowth
Drives Sustained Outgrowth Delivers Top-Quartile Margins
Outgrowth
~$15B1
revenue
1 Estimate at the midpoint of FY21 guidance2 Adj. operating margin on this slide is a non-US-GAAP measure. See reconciliation to US GAAP in Appendix
41
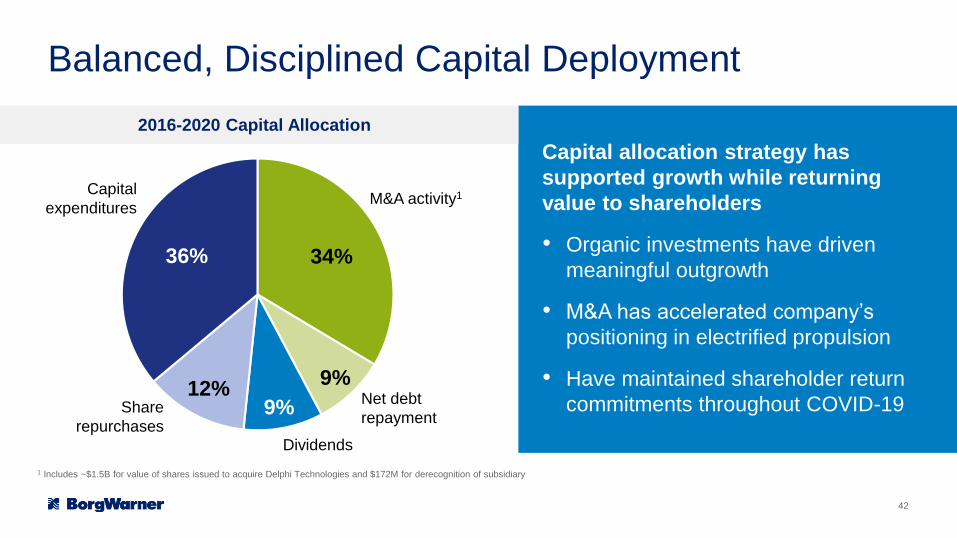
Balanced, Disciplined Capital Deployment
Capital allocation strategy has
supported growth while returning
value to shareholders
• Organic investments have driven
meaningful outgrowth
• M&A has accelerated company’s
positioning in electrified propulsion
• Have maintained shareholder return
commitments throughout COVID-19
34%
9%
9%12%
36%
2016-2020 Capital Allocation
Capital
expendituresM&A activity1
Net debt
repaymentShare
repurchasesDividends
1 Includes ~$1.5B for value of shares issued to acquire Delphi Technologies and $172M for derecognition of subsidiary
42

$399
$118
$509
$1,614
$399
$2,640
2014 Product Portfolio 2020 Product Portfolio
Acquisitions Are Driving Long-Term Value Creation
SiC Inverters GDi systems
Delphi Integration On Track
$15M $90M
$175M
2020 2021 Guidance 2023
Est. Cumulative Cost Synergies
M&A Has Enhanced Content Opportunity Per Vehicle
Multiple Program Awards Post Signing
Est. 2025 Content Opportunity Per Electric Vehicle
2014 Portfolio
Remy Acquisition — Motors
Organic Product Development
Delphi/Sevcon Acquisitions —
Power Electronics
43
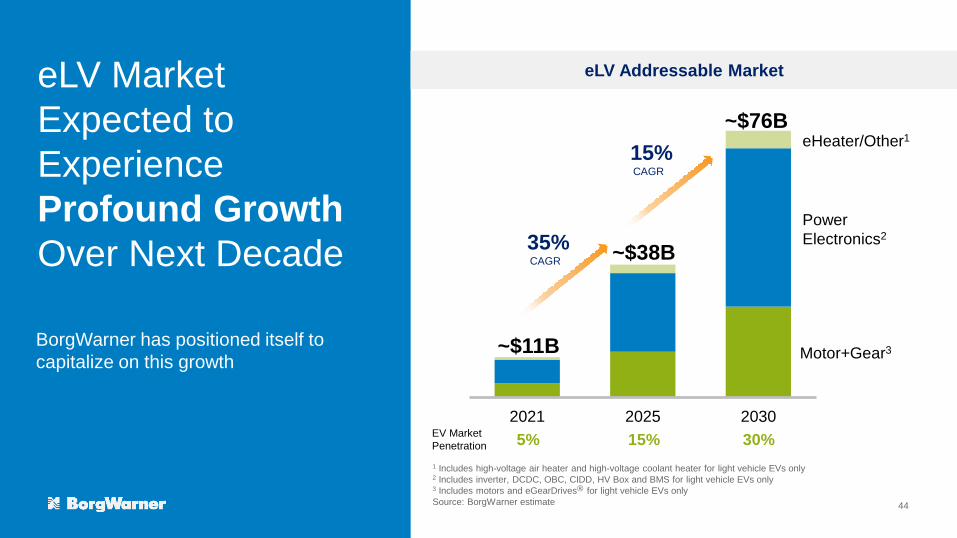
eLV Addressable Market
2021 2025 2030
1 Includes high-voltage air heater and high-voltage coolant heater for light vehicle EVs only2 Includes inverter, DCDC, OBC, CIDD, HV Box and BMS for light vehicle EVs only 3 Includes motors and eGearDrives® for light vehicle EVs only
Source: BorgWarner estimate
~$76B
~$38B
~$11B
eHeater/Other1
Power
Electronics2
Motor+Gear3
15%CAGR
35%CAGR
eLV Market
Expected to
Experience
Profound Growth
Over Next Decade
BorgWarner has positioned itself to
capitalize on this growth
EV Market
Penetration 5% 15% 30%
44
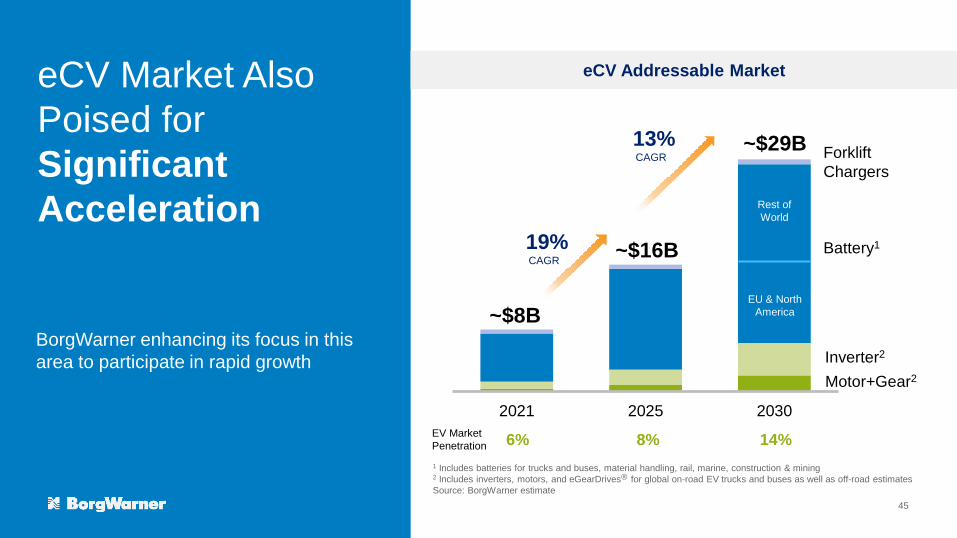
eCV Addressable Market
1 Includes batteries for trucks and buses, material handling, rail, marine, construction & mining2 Includes inverters, motors, and eGearDrives® for global on-road EV trucks and buses as well as off-road estimates
Source: BorgWarner estimate
Forklift
Chargers
Battery1
Inverter2
~$8B
~$16B
~$29B
2021 2025 2030
Motor+Gear2
13%CAGR
19%CAGR
EV Market
Penetration 6% 8% 14%
eCV Market Also
Poised for
Significant
Acceleration
BorgWarner enhancing its focus in this
area to participate in rapid growth
EU & North
America
Rest of
World
45
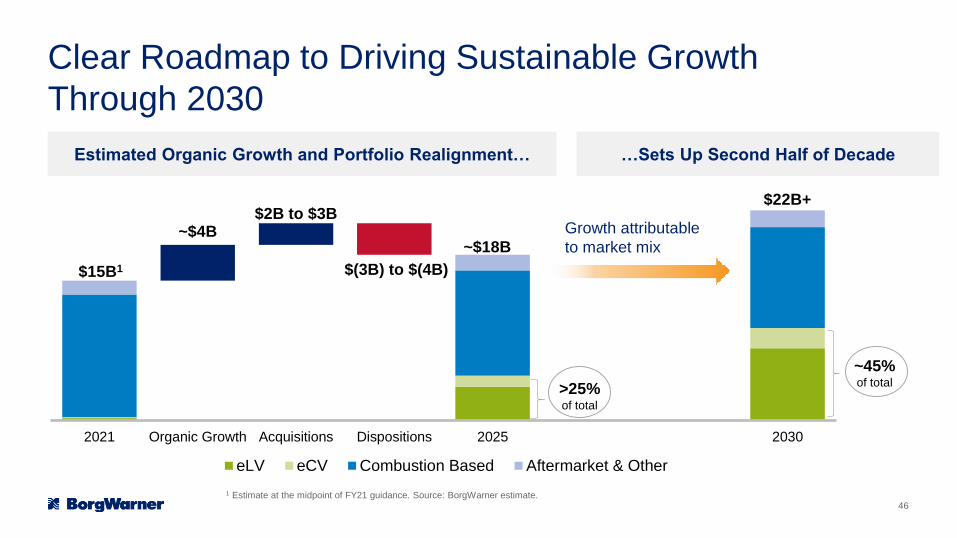
Clear Roadmap to Driving Sustainable Growth
Through 2030
1 Estimate at the midpoint of FY21 guidance. Source: BorgWarner estimate.
Estimated Organic Growth and Portfolio Realignment… …Sets Up Second Half of Decade
~$4B$2B to $3B
$(3B) to $(4B)
2021 Organic Growth Acquisitions Dispositions 2025 2030
eLV eCV Combustion Based Aftermarket & Other
$15B1
~$18B
$22B+
Growth attributable
to market mix
~45%of total
>25%of total
46
-23.0%
-13.0%
-3.0%
7.0%
17.0%
27.0%
$(500)
$(300)
$(100)
$100
$300
$500
$700
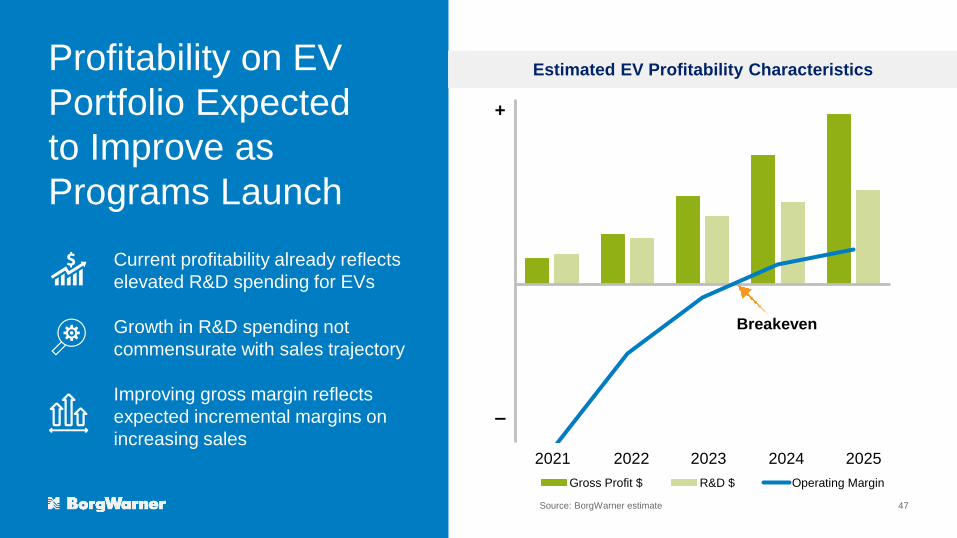
Gross Profit $ R&D $ Operating Margin
Profitability on EV
Portfolio Expected
to Improve as
Programs Launch
Current profitability already reflects
elevated R&D spending for EVs
Growth in R&D spending not
commensurate with sales trajectory
Improving gross margin reflects
expected incremental margins on
increasing sales–
+
Breakeven
2021 2022 2023 2024 2025
Source: BorgWarner estimate
Estimated EV Profitability Characteristics
47
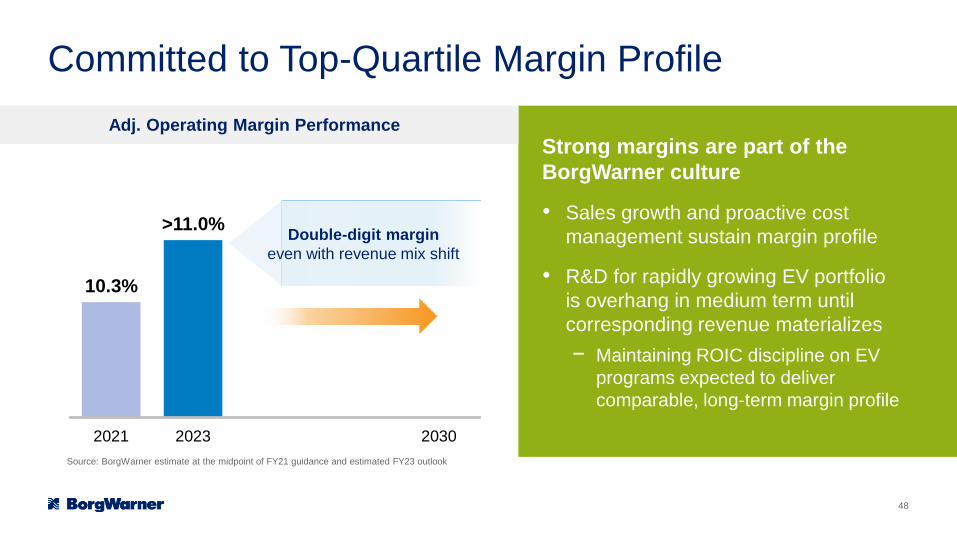
10.3%
>11.0%
9.0%
2021 2023 2030
Committed to Top-Quartile Margin Profile
Source: BorgWarner estimate at the midpoint of FY21 guidance and estimated FY23 outlook
Adj. Operating Margin Performance
Strong margins are part of the
BorgWarner culture
• Sales growth and proactive cost
management sustain margin profile
• R&D for rapidly growing EV portfolio
is overhang in medium term until
corresponding revenue materializes
− Maintaining ROIC discipline on EV
programs expected to deliver
comparable, long-term margin profile
Double-digit margin
even with revenue mix shift
48
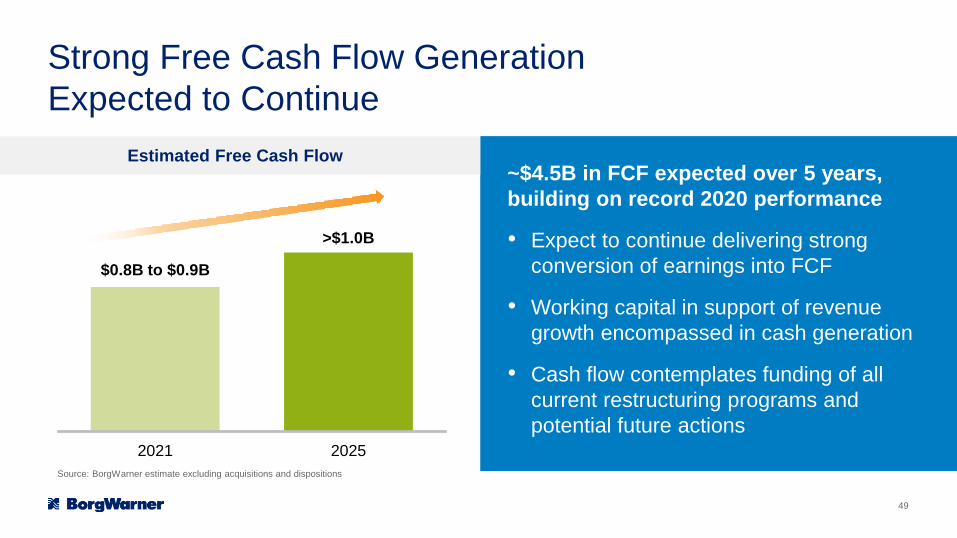
Strong Free Cash Flow Generation
Expected to Continue
$0.8B to $0.9B
>$1.0B
2021 2025
~$4.5B in FCF expected over 5 years,
building on record 2020 performance
• Expect to continue delivering strong
conversion of earnings into FCF
• Working capital in support of revenue
growth encompassed in cash generation
• Cash flow contemplates funding of all
current restructuring programs and
potential future actions
Estimated Free Cash Flow
Source: BorgWarner estimate excluding acquisitions and dispositions
49
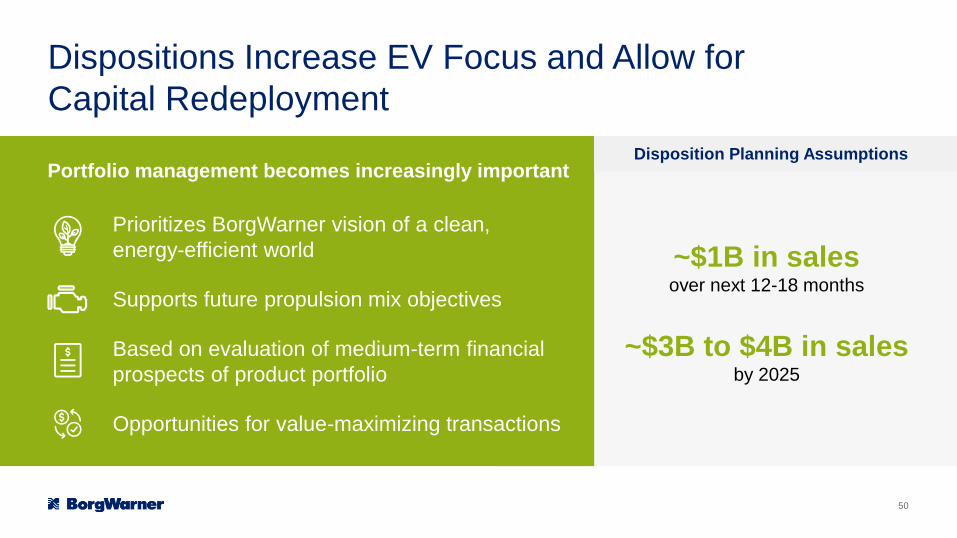
Dispositions Increase EV Focus and Allow for
Capital Redeployment
~$1B in salesover next 12-18 months
~$3B to $4B in salesby 2025
Prioritizes BorgWarner vision of a clean,
energy-efficient world
Supports future propulsion mix objectives
Based on evaluation of medium-term financial
prospects of product portfolio
Opportunities for value-maximizing transactions
Portfolio management becomes increasingly important Disposition Planning Assumptions
50
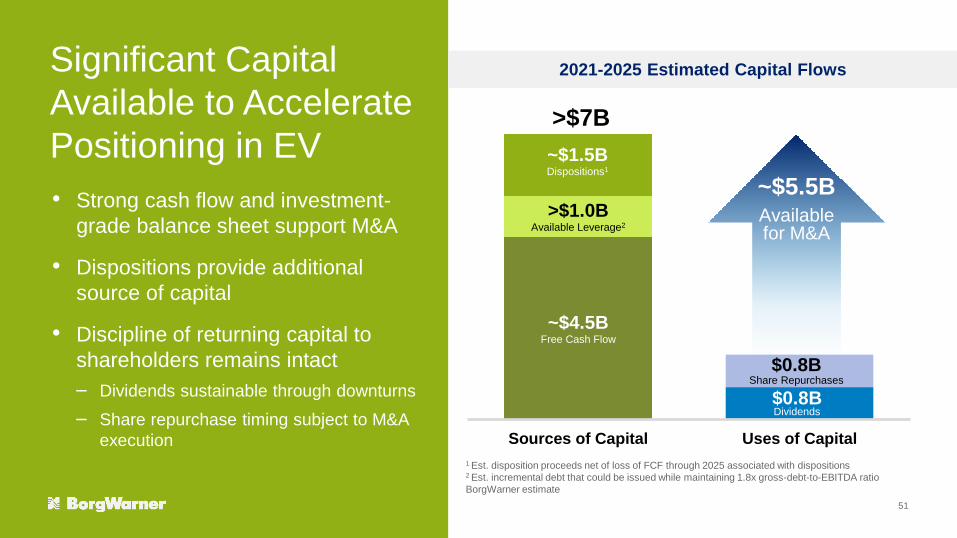
Significant Capital
Available to Accelerate
Positioning in EV
• Strong cash flow and investment-
grade balance sheet support M&A
• Dispositions provide additional
source of capital
• Discipline of returning capital to
shareholders remains intact
– Dividends sustainable through downturns
– Share repurchase timing subject to M&A
execution
$5.0B+1 Est. disposition proceeds net of loss of FCF through 2025 associated with dispositions2 Est. incremental debt that could be issued while maintaining 1.8x gross-debt-to-EBITDA ratio
BorgWarner estimate
~$4.5BFree Cash Flow
>$1.0BAvailable Leverage2
~$1.5BDispositions1
$0.8BDividends
Sources of Capital Uses of Capital
~$5.5BAvailable for M&A
>$7B
2021-2025 Estimated Capital Flows
$0.8BShare Repurchases
51
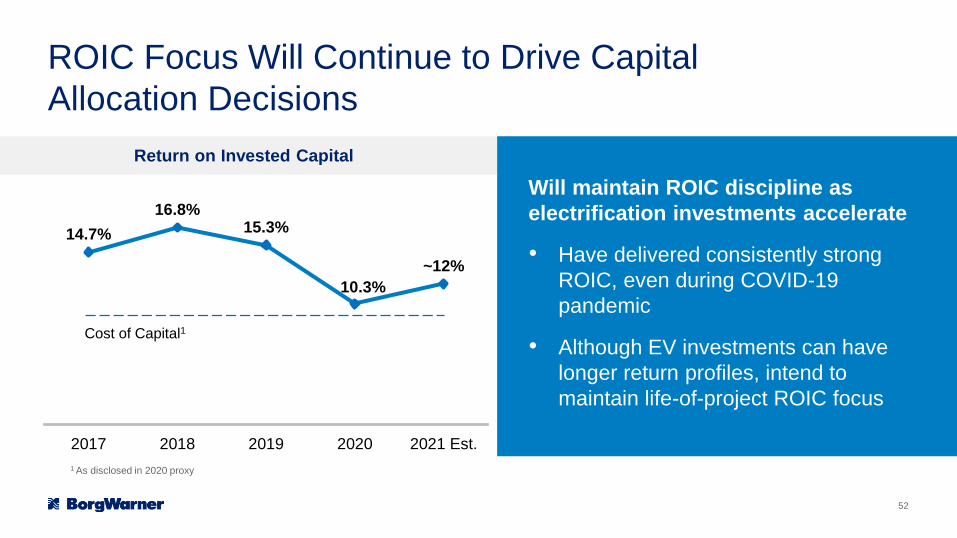
14.7%
16.8%15.3%
10.3%
~12%
2017 2018 2019 2020 2021 Est.
ROIC Focus Will Continue to Drive Capital
Allocation Decisions
Return on Invested Capital
Will maintain ROIC discipline as
electrification investments accelerate
• Have delivered consistently strong
ROIC, even during COVID-19
pandemic
• Although EV investments can have
longer return profiles, intend to
maintain life-of-project ROIC focus
Cost of Capital1
1 As disclosed in 2020 proxy
52
Financial
Summary• Strategic growth actions expected to drive
EV revenue of:
− >25% of sales in 2025
− ~45% of sales in 2030
• Top-quartile margin performance
expected to be sustained, even while
funding EV investments
• Strong FCF generation expected to
continue through 2025 & beyond
• More aggressive portfolio management
also expected to contribute to positioning
in EVs
53

54
Appendix
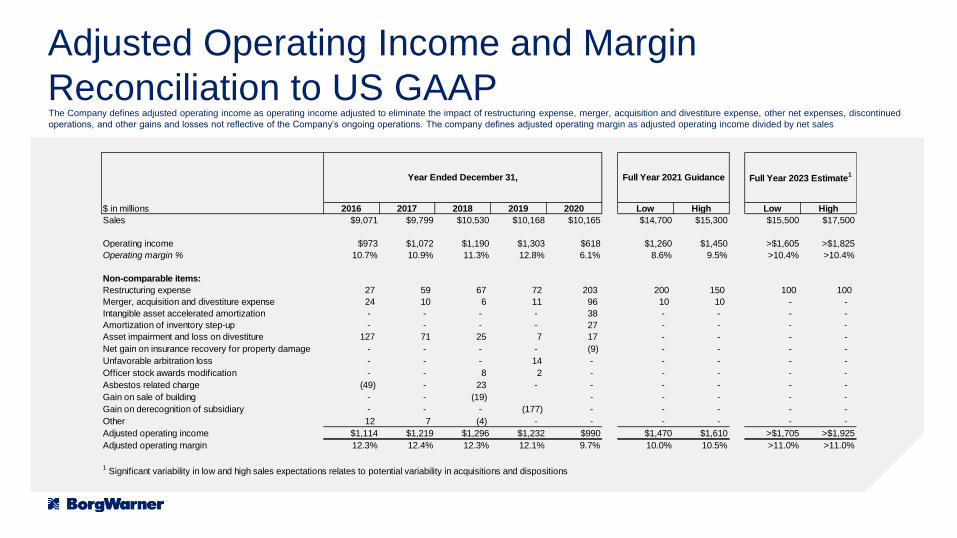
Adjusted Operating Income and Margin
Reconciliation to US GAAPThe Company defines adjusted operating income as operating income adjusted to eliminate the impact of restructuring expense, merger, acquisition and divestiture expense, other net expenses, discontinued
operations, and other gains and losses not reflective of the Company’s ongoing operations. The company defines adjusted operating margin as adjusted operating income divided by net sales
$ in millions 2016 2017 2018 2019 2020 Low High Low High
Sales $9,071 $9,799 $10,530 $10,168 $10,165 $14,700 $15,300 $15,500 $17,500
Operating income $973 $1,072 $1,190 $1,303 $618 $1,260 $1,450 >$1,605 >$1,825
Operating margin % 10.7% 10.9% 11.3% 12.8% 6.1% 8.6% 9.5% >10.4% >10.4%
Non-comparable items:
Restructuring expense 27 59 67 72 203 200 150 100 100
Merger, acquisition and divestiture expense 24 10 6 11 96 10 10 - -
Intangible asset accelerated amortization - - - - 38 - - - -
Amortization of inventory step-up - - - - 27 - - - -
Asset impairment and loss on divestiture 127 71 25 7 17 - - - -
Net gain on insurance recovery for property damage - - - - (9) - - - -
Unfavorable arbitration loss - - - 14 - - - - -
Officer stock awards modification - - 8 2 - - - - -
Asbestos related charge (49) - 23 - - - - - -
Gain on sale of building - - (19) - - - - -
Gain on derecognition of subsidiary - - - (177) - - - - -
Other 12 7 (4) - - - - - -
Adjusted operating income $1,114 $1,219 $1,296 $1,232 $990 $1,470 $1,610 >$1,705 >$1,925
Adjusted operating margin 12.3% 12.4% 12.3% 12.1% 9.7% 10.0% 10.5% >11.0% >11.0%
1 Significant variability in low and high sales expectations relates to potential variability in acquisitions and dispositions
Year Ended December 31, Full Year 2021 Guidance Full Year 2023 Estimate1
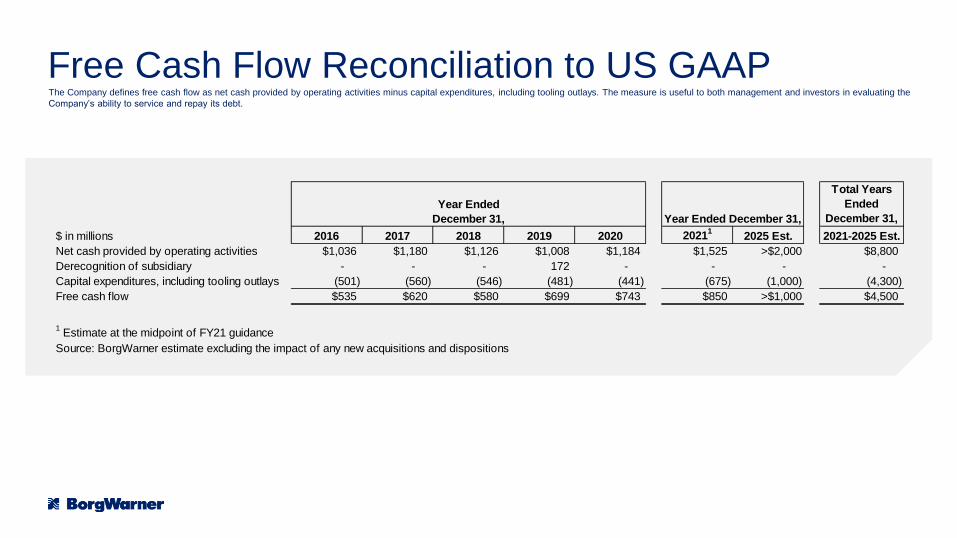
Free Cash Flow Reconciliation to US GAAPThe Company defines free cash flow as net cash provided by operating activities minus capital expenditures, including tooling outlays. The measure is useful to both management and investors in evaluating the
Company’s ability to service and repay its debt.
Total Years
Ended
December 31,
$ in millions 2016 2017 2018 2019 2020 20211
2025 Est. 2021-2025 Est.
Net cash provided by operating activities $1,036 $1,180 $1,126 $1,008 $1,184 $1,525 >$2,000 $8,800
Derecognition of subsidiary - - - 172 - - - -
Capital expenditures, including tooling outlays (501) (560) (546) (481) (441) (675) (1,000) (4,300)
Free cash flow $535 $620 $580 $699 $743 $850 >$1,000 $4,500
1 Estimate at the midpoint of FY21 guidance
Source: BorgWarner estimate excluding the impact of any new acquisitions and dispositions
Year Ended
December 31, Year Ended December 31,
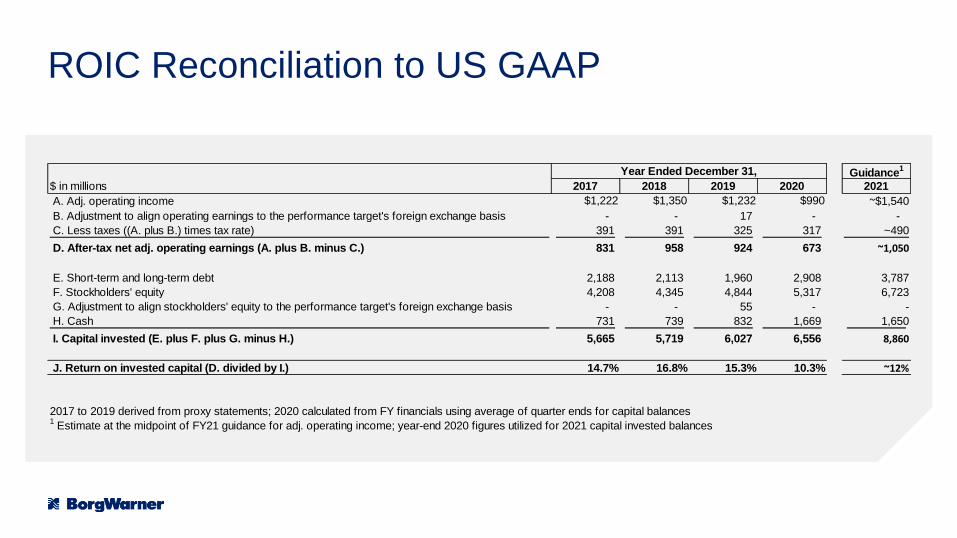
ROIC Reconciliation to US GAAP
Guidance1
$ in millions 2017 2018 2019 2020 2021
A. Adj. operating income $1,222 $1,350 $1,232 $990 ~$1,540
B. Adjustment to align operating earnings to the performance target's foreign exchange basis - - 17 - -
C. Less taxes ((A. plus B.) times tax rate) 391 391 325 317 ~490
D. After-tax net adj. operating earnings (A. plus B. minus C.) 831 958 924 673 ~1,050
E. Short-term and long-term debt 2,188 2,113 1,960 2,908 3,787
F. Stockholders' equity 4,208 4,345 4,844 5,317 6,723
G. Adjustment to align stockholders' equity to the performance target's foreign exchange basis - - 55 - -
H. Cash 731 739 832 1,669 1,650
I. Capital invested (E. plus F. plus G. minus H.) 5,665 5,719 6,027 6,556 8,860
J. Return on invested capital (D. divided by I.) 14.7% 16.8% 15.3% 10.3% ~12%
2017 to 2019 derived from proxy statements; 2020 calculated from FY financials using average of quarter ends for capital balances1 Estimate at the midpoint of FY21 guidance for adj. operating income; year-end 2020 figures utilized for 2021 capital invested balances
Year Ended December 31,