Embed Size (px)
Citation preview
Charging Forward: Deploying Electric Vehicle Infrastructure for Uber and Lyft in California
March 2021 A White Paper from the Pacific Southwest Region University Transportation Center
Alan Jenn, PhD, Institute of Transportation Studies, University of California Davis
Charging Forward: Deploying Electric Vehicle Infrastructure for Uber and Lyft in California
2
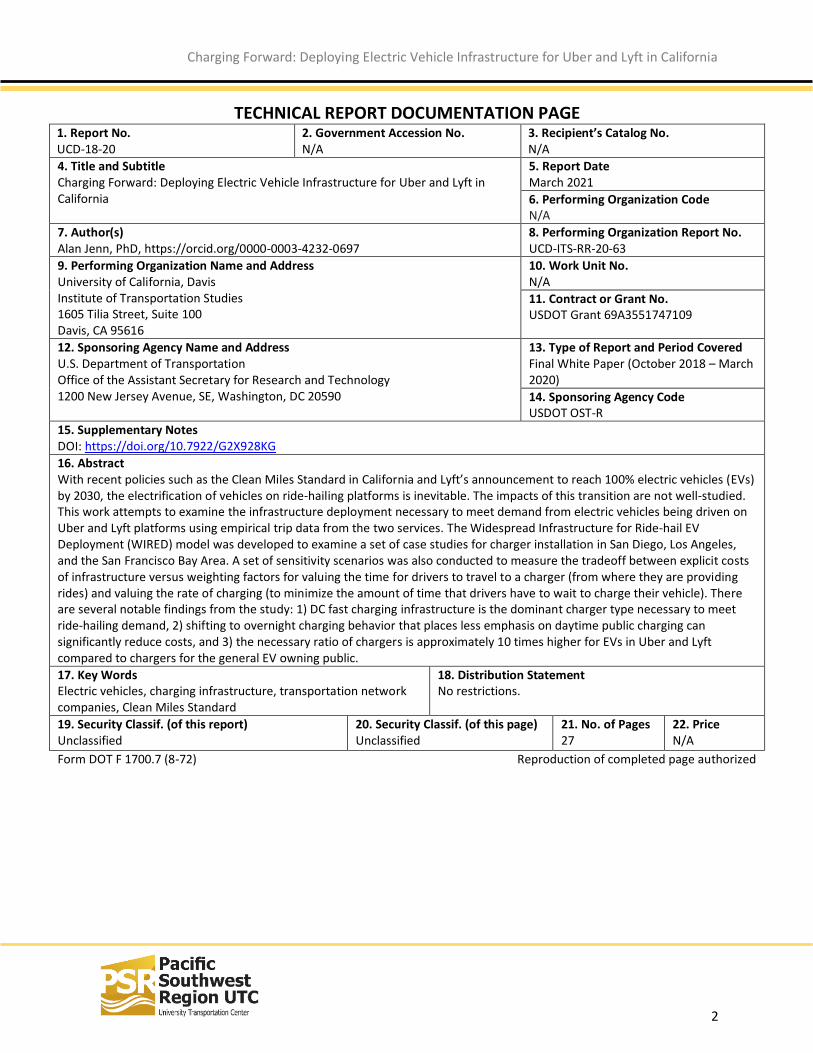
TECHNICAL REPORT DOCUMENTATION PAGE 1. Report No. UCD-18-20
2. Government Accession No. N/A
3. Recipient’s Catalog No. N/A
4. Title and Subtitle Charging Forward: Deploying Electric Vehicle Infrastructure for Uber and Lyft in California
5. Report Date March 2021
6. Performing Organization Code N/A
7. Author(s) Alan Jenn, PhD, https://orcid.org/0000-0003-4232-0697
8. Performing Organization Report No. UCD-ITS-RR-20-63
9. Performing Organization Name and Address University of California, Davis Institute of Transportation Studies 1605 Tilia Street, Suite 100 Davis, CA 95616
10. Work Unit No. N/A
11. Contract or Grant No. USDOT Grant 69A3551747109
12. Sponsoring Agency Name and Address U.S. Department of Transportation Office of the Assistant Secretary for Research and Technology 1200 New Jersey Avenue, SE, Washington, DC 20590
13. Type of Report and Period Covered Final White Paper (October 2018 – March 2020)
14. Sponsoring Agency Code USDOT OST-R
15. Supplementary Notes DOI: https://doi.org/10.7922/G2X928KG
16. Abstract With recent policies such as the Clean Miles Standard in California and Lyft’s announcement to reach 100% electric vehicles (EVs) by 2030, the electrification of vehicles on ride-hailing platforms is inevitable. The impacts of this transition are not well-studied. This work attempts to examine the infrastructure deployment necessary to meet demand from electric vehicles being driven on Uber and Lyft platforms using empirical trip data from the two services. The Widespread Infrastructure for Ride-hail EV Deployment (WIRED) model was developed to examine a set of case studies for charger installation in San Diego, Los Angeles, and the San Francisco Bay Area. A set of sensitivity scenarios was also conducted to measure the tradeoff between explicit costs of infrastructure versus weighting factors for valuing the time for drivers to travel to a charger (from where they are providing rides) and valuing the rate of charging (to minimize the amount of time that drivers have to wait to charge their vehicle). There are several notable findings from the study: 1) DC fast charging infrastructure is the dominant charger type necessary to meet ride-hailing demand, 2) shifting to overnight charging behavior that places less emphasis on daytime public charging can significantly reduce costs, and 3) the necessary ratio of chargers is approximately 10 times higher for EVs in Uber and Lyft compared to chargers for the general EV owning public.
17. Key Words Electric vehicles, charging infrastructure, transportation network companies, Clean Miles Standard
18. Distribution Statement No restrictions.
19. Security Classif. (of this report) Unclassified
20. Security Classif. (of this page) Unclassified
21. No. of Pages 27
22. Price N/A
Form DOT F 1700.7 (8-72) Reproduction of completed page authorized

Charging Forward: Deploying Electric Vehicle Infrastructure for Uber and Lyft in California
3
[page intentionally left blank]
Charging Forward: Deploying Electric Vehicle Infrastructure for Uber and Lyft in California
4
TABLE OF CONTENTS
About the Pacific Southwest Region University Transportation Center ........................................ 6
U.S. Department of Transportation (USDOT) Disclaimer ............................................................... 7
Disclosure ........................................................................................................................................ 8
Acknowledgements......................................................................................................................... 9
Abstract ......................................................................................................................................... 10
Executive Summary ....................................................................................................................... 11
Introduction .................................................................................................................................. 12
Data and Methods ........................................................................................................................ 13
Ride-Hail Datasets ..................................................................................................................... 13
Bootstrap Demand Simulation ................................................................................................. 14
Infrastructure Model ................................................................................................................ 15
Scenarios ................................................................................................................................... 16
Results ........................................................................................................................................... 17
Discussion and Conclusions .......................................................................................................... 24
References .................................................................................................................................... 25
Data Management ........................................................................................................................ 27
Charging Forward: Deploying Electric Vehicle Infrastructure for Uber and Lyft in California
5
List of Figures
Figure 1. Daily average energy demand over 90 simulated days of 1000 electric vehicles in Uber and Lyft at an aggregated census tract level in Greater Los Angeles. .................................... 15
Figure 2. Charging infrastructure deployment for a fleet of 1000 EV ride-hail vehicles in San Diego county. This scenario result places both a low value on charging time and a low value on travel time. ......................................................................................................................... 18
Figure 3. Charging infrastructure deployment for a fleet of 1000 EV ride-hail vehicles in the Greater Los Angeles region. This scenario result places both a low value on charging time and a low value on travel time. .............................................................................................. 19
Figure 4. Charging infrastructure deployment for a fleet of 1000 EV ride-hail vehicles in San Francisco Bay Area. This scenario result places both a low value on charging time and a low value on travel time. ............................................................................................................... 20
Figure 5. Charging infrastructure deployment for a fleet of 1000 EV ride-hail vehicles in San Diego county. This scenario places a high value on travel time but a low value on charging time. Note that in contrast with Figure 2, there are a substantial number of slower Level 2 chargers installed throughout the region. .............................................................................. 21
Figure 6. Comparison of the average travel time to the number of chargers in the scenarios run from the WIRED model. There are four combinations of weights for high valuation (+) and low valuation (-) of travel time (TT) and charge rates (ChrgRte). Each point represents aggregated values from a single scenario run, with the city denoted by color and the total cost of all infrastructure installed denoted by the size of each point. ................................... 22
Figure 7. Comparison of the distribution of total infrastructure installation costs across all scenarios between scenarios where drivers will maximize overnight charging (Uber and Lyft drivers do not charge at public infrastructure unless their battery capacity in a given day falls to 0% SOC) compared to a scenario where drivers will charge exclusively at public infrastructure. ......................................................................................................................... 23
Charging Forward: Deploying Electric Vehicle Infrastructure for Uber and Lyft in California
6
About the Pacific Southwest Region University Transportation Center The Pacific Southwest Region University Transportation Center (UTC) is the Region 9 University Transportation Center funded under the U.S. Department of Transportation’s University Transportation Centers Program. Established in 2016, the Pacific Southwest Region UTC (PSR) is led by the University of Southern California and includes seven partners: Long Beach State University; University of California, Davis; University of California, Irvine; University of California, Los Angeles; University of Hawaii; Northern Arizona University; Pima Community College.
The Pacific Southwest Region UTC conducts an integrated, multidisciplinary program of research, education and technology transfer aimed at improving the mobility of people and goods throughout the region. The program is organized around four themes: 1) technology to address transportation problems and improve mobility; 2) improving mobility for vulnerable populations; 3) Improving resilience and protecting the environment; and 4) managing mobility in high growth areas.

Charging Forward: Deploying Electric Vehicle Infrastructure for Uber and Lyft in California
7
U.S. Department of Transportation (USDOT) Disclaimer The contents of this report reflect the views of the authors, who are responsible for the facts and the accuracy of the information presented herein. This document is disseminated in the interest of information exchange. The report is funded, partially or entirely, by a grant from the U.S. Department of Transportation’s University Transportation Centers Program. However, the U.S. Government assumes no liability for the contents or use thereof.

Charging Forward: Deploying Electric Vehicle Infrastructure for Uber and Lyft in California
8
Disclosure Alan Jenn, PhD, conducted this research titled, “Charging Infrastructure Development for Transportation Network Company Electrification” at the University of California, Davis, Institute of Transportation Studies. The research took place from October 2018 to March 2020 and was funded by a grant from the U.S. Department of Transportation in the amount of $37,981.00. The research was conducted as part of the Pacific Southwest Region University Transportation Center research program.
Charging Forward: Deploying Electric Vehicle Infrastructure for Uber and Lyft in California
9
Acknowledgements This study was funded by a grant from the Pacific Southwest Region University Transportation Center (PSR), supported by USDOT through the University Transportation Centers program. The authors would like to thank the PSR and USDOT for their support of university-based research in transportation, and especially for the funding provided in support of this project.
The author would also like to acknowledge the 3 Revolutions Future Mobility Program of the Institute of Transportation Studies at UC Davis, and the California Energy Commission for supporting and funding this study. Additionally, the author would like to thank Peter Day at Lyft, and Adam Gromis and Michiko Namazu at Uber for supporting this research effort by providing the data necessary to conduct this analysis.
Charging Forward: Deploying Electric Vehicle Infrastructure for Uber and Lyft in California
10
Abstract With recent policies such as the Clean Miles Standard in California and Lyft’s announcement to reach 100% electric vehicles (EVs) by 2030, the electrification of vehicles on ride-hailing platforms is inevitable. The impacts of this transition are not well-studied. This work attempts to examine the infrastructure deployment necessary to meet demand from electric vehicles being driven on Uber and Lyft platforms using empirical trip data from the two services. We develop the Widespread Infrastructure for Ride-hail EV Deployment (WIRED) model to examine a set of case studies for charger installation in San Diego, Los Angeles, and the San Francisco Bay Area. We also conduct a set of sensitivity scenarios to measure the tradeoff between explicit costs of infrastructure versus weighting factors for valuing the time for drivers to travel to a charger (from where they are providing rides) and valuing the rate of charging (to minimize the amount of time that drivers have to wait to charge their vehicle). There are several notable findings from our study: 1) DC fast charging infrastructure is the dominant charger type necessary to meet ride-hailing demand, 2) shifting to overnight charging behavior that places less emphasis on daytime public charging can significantly reduce costs, and 3) the necessary ratio of chargers is approximately 10 times higher for EVs in Uber and Lyft compared to chargers for the general EV owning public.
Charging Forward: Deploying Electric Vehicle Infrastructure for Uber and Lyft in California
11
Charging Forward: Deploying Electric Vehicle Infrastructure for Uber and Lyft in California
Executive Summary The objective of this study is to investigate how to deploy electric vehicle charging infrastructure to meet the electricity demand coming from electric vehicles (EVs) on ride-hailing services such as Uber and Lyft in California. The recently passed Clean Miles Standard in California will require ride-hailing companies such as Uber and Lyft to transition the vehicles operating on their platforms to electric cars. Combined with Uber and Lyft’s recent announcements to transition to full electrification, the charging demands from these vehicles will be substantial.
The general approach of our study is conducted in two steps: first, we simulate the charging demand from electric vehicles on ride-hailing services; second, we use the Widespread Infrastructure for Ride-Hailing EV Deployment (WIRED) model, an optimization procedure for deploying charging stations to meet demand. We employ empirical datasets from both Uber and Lyft to conduct our study. The Lyft dataset contains trip level records from July 2017 through July 2018. The trips cover all electric vehicles in Lyft’s San Diego, Los Angeles, and San Francisco as well as a representative sample of 5000 gasoline ICE vehicles.
We develop the Widespread Infrastructure for Ride-hail EV Deployment (WIRED) model to examine a set of case studies for charger installation in San Diego, Los Angeles, and the San Francisco Bay Area. We also conduct a set of sensitivity scenarios to measure the tradeoff between explicit costs of infrastructure versus weighting factors for valuing the time for drivers to travel to a charger (from where they are providing rides) and valuing the rate of charging (to minimize the amount of time that drivers have to wait to charge their vehicle). There are several notable findings from our study: 1) DC fast charging infrastructure is the dominant charger type necessary to meet ride-hailing demand, 2) shifting to overnight charging behavior that places less emphasis on daytime public charging can significantly reduce costs, and 3) the necessary ratio of chargers is approximately 10 times higher for EVs in Uber and Lyft compared to chargers for the general EV owning public.
Charging Forward: Deploying Electric Vehicle Infrastructure for Uber and Lyft in California
12
Introduction Over the last few years, the United States transportation sector has undergone a series of transformative “revolutions”. These include a technological transformation from gasoline internal combustion engine (ICE) vehicles to plug-in electric vehicles (PEVs)—a transition spurred by a growing need to mitigate the effects of climate change in transportation. The commercialization of this technology in the US began in late 2010, with the first widely available electric vehicle models: the Chevrolet Volt and the Nissan Leaf. Cumulatively, over a million PEVs have sold in the US, with around half in California. Additionally, there are over 40 available vehicle models1 with many more on the way2, providing customers with additional choices on the market.
Simultaneously, transportation mode choice has also been rapidly altering away from privately-owned, personal transportation with the advent of the sharing gig economy. Transportation network companies (TNCs) such as Uber and Lyft have rapidly grown in the same timeframe as electric vehicles. While they currently constitute a small fraction of total miles traveled in the light-duty transportation sector, Uber and Lyft have combined 7 million drivers, are worth a combined value of over $100 billion, and offer millions of rides per day34. Many experts believe that properly managed TNCs represent an important future transportation solution by offering a platform for shared-rides, which can decrease total miles traveled (and hence emissions) while reducing congestion (1).
The combination of electrification and a sharing economy provides further synergies to improve sustainable mobility and combat climate change. As a result, several policies have passed to support the coupling of Uber and Lyft drivers with electric vehicles to realize these benefits. This includes legislation in California, SB 10145, which enabled the California Air Resources Board to create the Clean Miles Standard regulation that requires TNCs to begin improving the fuel efficiency and to electrify vehicles on their platforms. In addition to these regulatory efforts, TNCs themselves have given signals of a serious transition to PEVs: Lyft announced in June 2020 that they are committed to 100% electric vehicles on their platform by 20306. This study attempts to understand the impacts of electrifying vehicles on TNC platforms in California. The high travel intensity of vehicles in ride-hailing services and difference in travel/charging behavior will lead to large impacts on the electric vehicle public charging infrastructure. This study employs empirical trip data from Uber and Lyft to strategically deploy chargers to meet demand from TNC fleets.
1 https://evadoption.com/ev-models/ 2 https://www.caranddriver.com/news/g29994375/future-electric-cars-trucks/ 3 https://www.businessofapps.com/data/uber-statistics/ 4 https://www.businessofapps.com/data/lyft-statistics/ 5 Senate Bill No. 1014 California Clean Miles Standard and Incentive Program: zero-emission vehicles. 6 https://www.lyft.com/blog/posts/leading-the-transition-to-zero-emissions
Charging Forward: Deploying Electric Vehicle Infrastructure for Uber and Lyft in California
13
Both charging behavior and public EV charging infrastructure have been extensively studied in the literature. Often the deployment of infrastructure is modeled based on the charging behavior of EV drivers (2,3,4,5), dynamic traffic behavior of fleets (6), or on the overall energy demand from the vehicles (7,8). The benefits to consumers, economic gain, environmental impacts, and effects on EV adoption from the installation of charging infrastructure have also been demonstrated in several studies (9,10,11).
However, very few studies have examined the relationship between ride-hailing specific fleets and charging infrastructure, the vast majority of studies associating electric vehicles and shared mobility are with car-sharing (rather than ride-hailing) services. One example by Bauer et al. demonstrates that efficient deployment and use of infrastructure allows for ride-hailing fleets to electrify at minimal cost. They employ an agent-based simulation of BEV fleets in New York City and San Francisco and find that performance can be maintained even with a sparse distribution of chargers (12). Similarly, Vosooghi et al. conduct a similar study, with a specific focus on charging types (normal and rapid charging, and battery swapping). They find that the best level of service is enabled through battery swapping infrastructure (13). Another study by Lokhandwala and Cai examines the optimization of charging infrastructure in shared fleets using New York City taxicab data as a case study. The authors demonstrate that charging infrastructure (and charging requirement) will not affect service provision of TNCs very dramatically (14). There are a few other studies based on taxi data case studies (15,16), but they are not necessarily accurate representation of shared-mobility travel behavior because of differences in users, routing, and operations.
The benefits of coupling electric vehicles and ride-hailing fleets are even rarer. Jenn et al. explores the potential benefits to EV adoption from exposure in ride-hailing (17). Separate studies have examined the energy and environmental implications of this coupling through empirical data in California (18) and Austin, Texas (19).
Our study examines the demand for electric vehicle charging infrastructure, specific to ride-hailing electric vehicles, using empirical data in California from Uber and Lyft trips.
Data and Methods
Ride-Hail Datasets
We employ empirical datasets from both Uber and Lyft to conduct our study. The Lyft dataset contains trip level records from July 2017 through July 2018. The trips cover all electric vehicles in Lyft’s San Diego, Los Angeles, and San Francisco as well as a representative sample of 5000 gasoline ICE vehicles. Over the two years, we observe over 1.7 million trips across all three territories. Each trip record contains an anonymized driver ID number, allowing us to follow drivers over time (and hence accurate representation of daily behavior, rather than just trip behavior). Trip pickup attributes include the census tract of pickup as well as the time of pickup.

Charging Forward: Deploying Electric Vehicle Infrastructure for Uber and Lyft in California
14
Uber provided four separate datasets that are more aggregate in nature and covers July 2017 through the end of 2018 across California. The datasets contain information on:
• Proportion of rides given each hour of the day for EVs, broken down by day of the week, quarter of the year, and year
• Proportion of rides given each hour of the day for non-EVs, broken down by day of the week, quarter of the year, and year
• Number of trip miles driven each day by electric vehicles
• Approximate number of trips by electric vehicles in the 4th quarter of 2018 broken down by census tract
While the Uber data is at a much lower resolution than the Lyft data, we are able to combine it with the trip-level detail of the Lyft dataset and provide weighting factors to simulate similar volumes of trips and miles travelled.
Bootstrap Demand Simulation
To fully account for variation of day-to-day energy demand and spatial travel patterns of ride-hail EVs, we bootstrap daily demand of trips using the Uber and Lyft datasets. This allows for a simulation of variable number of electric vehicles in the fleet while maintaining the spatial and temporal travel patterns seen in the empirical data. The bootstrap procedure (Hesterberg, 2011) to simulate a fleet of size n in a given region is as follows:
1. Draw n trips from weighted Uber and Lyft data
2. For each draw, extract all trips made by that driver in the date corresponding to the taken trip
3. Steps 1 and 2 represent the trips made in a single day by the ride-hailing fleet in a region, we repeat the first two steps a total of 90 times to represent 3 months of ride-hailing demand
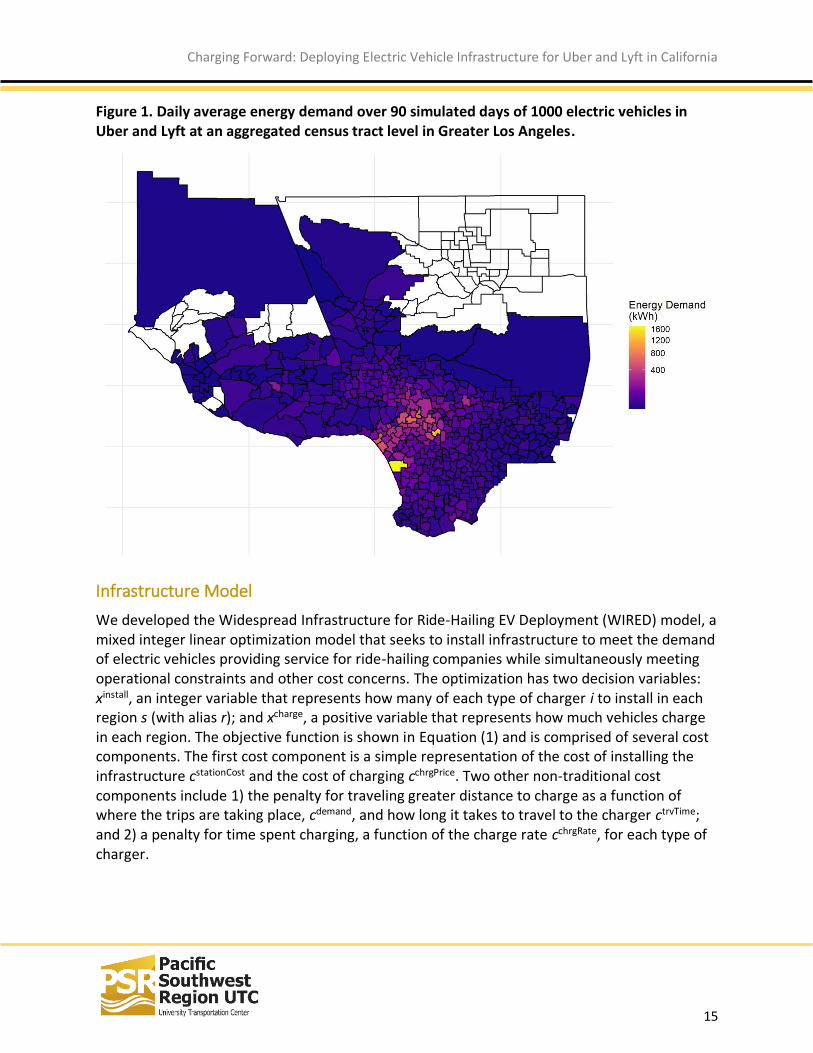
An example of simulated average daily demand (based on distance traveled from the origin of the trip) is shown in Figure 1. Note that we perform a distance-based hierarchical clustering algorithm that groups census tracts to reduce the complexity of the WIRED model. We reduce the number of regions by ~6-7 fold depending on the region.
Charging Forward: Deploying Electric Vehicle Infrastructure for Uber and Lyft in California
15
Figure 1. Daily average energy demand over 90 simulated days of 1000 electric vehicles in Uber and Lyft at an aggregated census tract level in Greater Los Angeles.
Infrastructure Model
We developed the Widespread Infrastructure for Ride-Hailing EV Deployment (WIRED) model, a mixed integer linear optimization model that seeks to install infrastructure to meet the demand of electric vehicles providing service for ride-hailing companies while simultaneously meeting operational constraints and other cost concerns. The optimization has two decision variables: xinstall, an integer variable that represents how many of each type of charger i to install in each region s (with alias r); and xcharge, a positive variable that represents how much vehicles charge in each region. The objective function is shown in Equation (1) and is comprised of several cost components. The first cost component is a simple representation of the cost of installing the infrastructure cstationCost and the cost of charging cchrgPrice. Two other non-traditional cost components include 1) the penalty for traveling greater distance to charge as a function of where the trips are taking place, cdemand, and how long it takes to travel to the charger ctrvTime; and 2) a penalty for time spent charging, a function of the charge rate cchrgRate, for each type of charger.

Charging Forward: Deploying Electric Vehicle Infrastructure for Uber and Lyft in California
16
Objective function:
𝐦𝐢𝐧𝒘.𝒓.𝒕:𝒙𝒊𝒓
𝐢𝐧𝐬𝐭𝐚𝐥𝐥,𝒙𝒊𝒓𝒔𝐜𝐡𝐚𝐫𝐠𝐞
∑∑𝒙𝒊𝒓𝐢𝐧𝐬𝐭𝐚𝐥𝐥𝒄𝒊
𝐬𝐭𝐚𝐭𝐢𝐨𝐧𝐂𝐨𝐬𝐭 +
𝒓𝒊
∑∑∑[𝒙𝒊𝒓𝒔𝐜𝐡𝐚𝐫𝐠𝐞
𝒄𝒊𝐜𝐡𝐫𝐠𝐏𝐫𝐢𝐜𝐞
+𝒘𝟏(𝒄𝒔𝐝𝐞𝐦𝐚𝐧𝐝𝒄𝒔𝒓
𝐭𝐫𝐯𝐓𝐢𝐦𝐞𝒙𝒊𝒓𝒔𝐜𝐡𝐚𝐫𝐠𝐞
)
𝒔
+𝒘𝟐(𝒙𝒊𝒓𝒔𝐜𝐡𝐚𝐫𝐠𝐞
𝒄𝒊𝒄𝒉𝒓𝒈𝑹𝒂𝒕𝒆)
𝒓
]
𝒊
(1)
Subject to the following constraints:
Total charging demand must be fulfilled:
∑∑∑𝑥𝑖𝑟𝑠chrgAmount
− 𝑐𝑠demand ≥ 0
𝑠𝑟𝑖
(2)
Charging in each period cannot exceed charging capacity:
(𝑥𝑖𝑟install + 𝑐𝑖𝑟
existing)𝑐𝑖
chrgRate−∑𝑥𝑖𝑟𝑠
chrgAmount≥ 0;∀𝑖𝑟
𝑠
(3)
Allocate charging to original demand locations:
∑∑𝑥𝑖𝑟𝑠chrgAmount
− 𝑐𝑠demand ≥ 0;
𝑟
∀𝑠
𝑖
(4)
Scenarios
The WIRED model is run across a combination of parameters in order to examine different scenarios and to conduct sensitivity analysis on the model outcomes. These parameters include:
• Number of EVs serving the region: low [100], medium [1,000], high [10,000]
• Value of travel time (w1): low [.01], high [10]
• Value of charge rate (w2): low [1,000], high [10,000]
• Overnight charging: this parameter reduces energy demand by the capacity of each vehicle’s battery size—in other words simulating a scenario in which drivers will attempt to only use public charging when they run out of charge
These parameters allow the WIRED model to explore non-straightforward cost measures concerning important values to TNC drivers. By accounting for issues related to the length of time to charge an EV and length of time to travel to a charger, we are able to explicitly understand the cost tradeoffs to minimize these effects with improved charger deployment.
Charging Forward: Deploying Electric Vehicle Infrastructure for Uber and Lyft in California
17
Results In the results section, we will demonstrate some of the spatial capabilities of the WIRED model in baseline scenarios. We then discuss some of the critical findings from the multiple scenario runs conducted in this study. In Figure 2Figure 4, we examine the same scenario deploying 1000 ride-hail EVs in San Diego, Los Angeles, and the San Francisco Bay Area. These figures also represent a set of “baseline” results where the system places a relatively lower emphasis on the value of travel time to chargers and the amount of time it takes to charge the electric vehicle. Additionally, the drivers are assumed to charge entirely from public infrastructure—which has been observed in a study by Jenn where the vast majority of charging events occurred at DC fast chargers for electric vehicles in ride-hailing services (18).
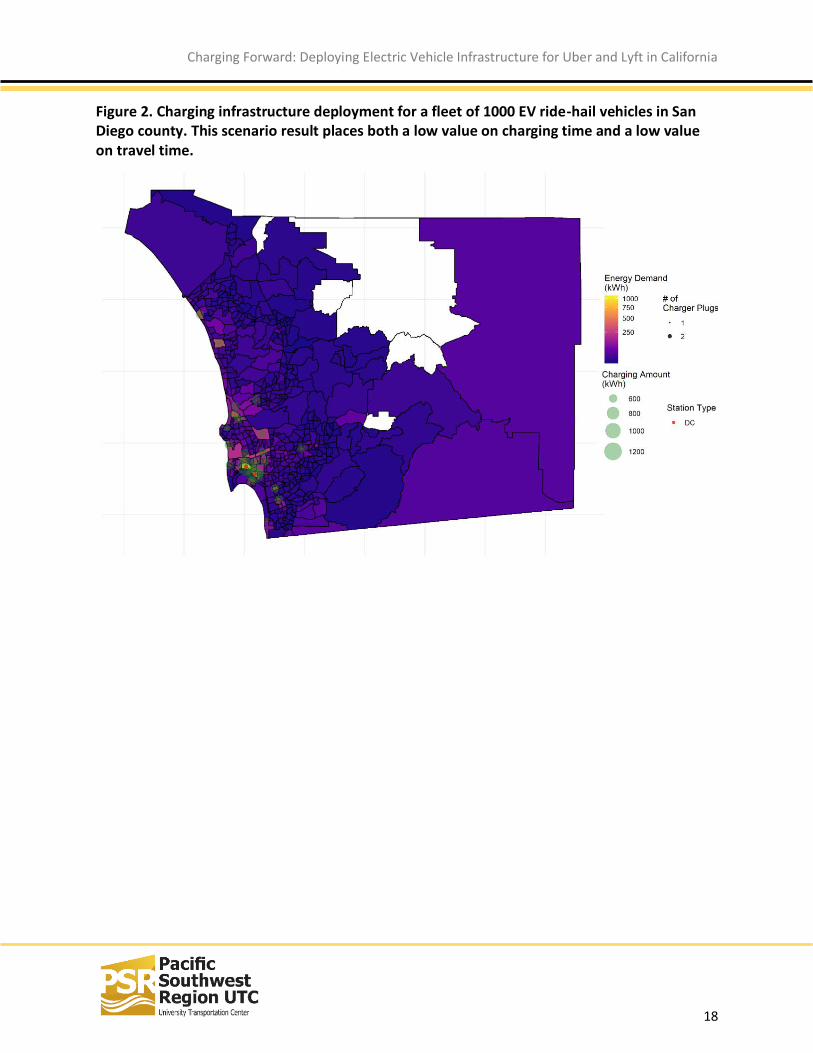
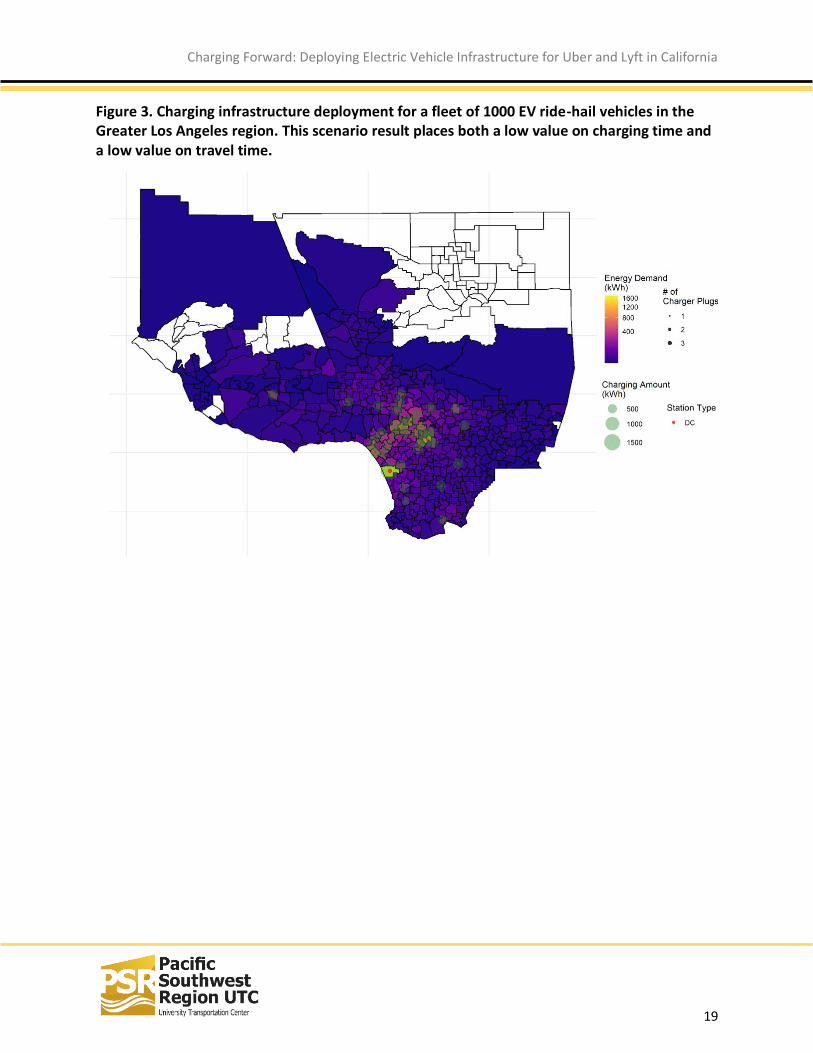
One of the common observations consistent across all three regions is that the highest demand occurs in two areas: the major airport in the region (SAN for San Diego, LAX for Los Angeles, and SFO for San Francisco) and in the downtown area of the city. It is therefore no coincidence that these locations feature prominently as areas for placing charging infrastructure—our results indicate that these zones tend to have more chargers placed in their vicinity in addition to being the areas where energy is being dispensed to charge ride-hail EVs. The remaining chargers are distributed throughout the rest of the region with a focus on high energy demand areas—though charging demand never exceeds the downtown and airport regions. Most stations charge under 500 kWh per day, though some of the most popular charging locations can dispense as high as 3 MWh in a single day (these have up to 6 DC Fast charging plugs at a station).
Charging Forward: Deploying Electric Vehicle Infrastructure for Uber and Lyft in California
18
Figure 2. Charging infrastructure deployment for a fleet of 1000 EV ride-hail vehicles in San Diego county. This scenario result places both a low value on charging time and a low value on travel time.
Charging Forward: Deploying Electric Vehicle Infrastructure for Uber and Lyft in California
19
Figure 3. Charging infrastructure deployment for a fleet of 1000 EV ride-hail vehicles in the Greater Los Angeles region. This scenario result places both a low value on charging time and a low value on travel time.

Charging Forward: Deploying Electric Vehicle Infrastructure for Uber and Lyft in California
20
Figure 4. Charging infrastructure deployment for a fleet of 1000 EV ride-hail vehicles in San Francisco Bay Area. This scenario result places both a low value on charging time and a low value on travel time.
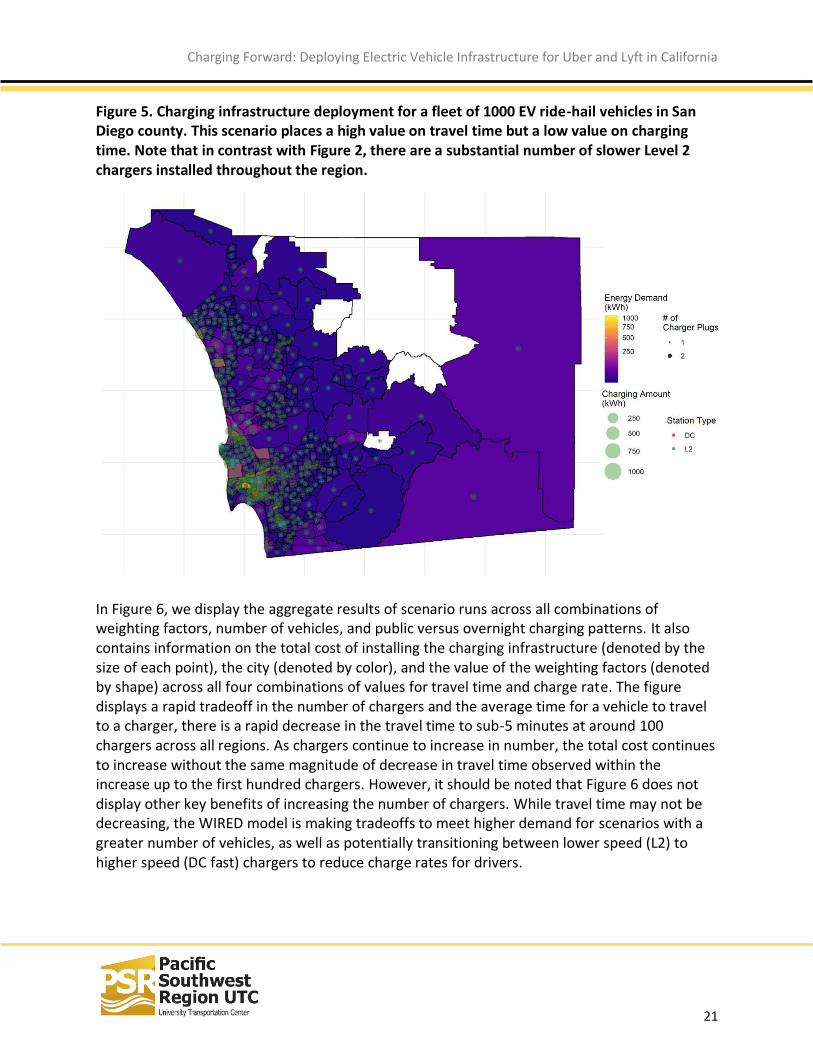
The number of chargers installed in a given scenario is highly dependent on the weighting factors for travel time and charge rate. In our baseline scenarios, the WIRED model adds a total of 26, 41, and 43 plugs to San Diego, Los Angeles, and San Francisco respectively. In scenarios with high weighting factors and a large number of EVs providing service, the number of chargers reaches as high as 685 DC fast chargers in a single city (as of the beginning of 2020 there are approximately 2000 non-Tesla public DC fast chargers in the state of California). Note that in Figure 2Figure 4, all chargers are DC fast chargers. Nevertheless, despite the relatively intensive charging requirements, we find that placing a high value on travel time but a low value on charging time, that TNC EVs can fulfill their demand employing L2 chargers. In Figure 5, 274 Level 2 chargers are distributed around San Diego county to meet the needs of electric vehicles throughout the region. A relatively large number of DC fast chargers are still required in strategic areas to allow for demand in extremely intensive travel regions to be met. The tradeoff being made in these scenarios is a dramatic lowering in the average cost of chargers used to meet charging demand. Due to the relatively low price of level 2 chargers compared to DC fast charging infrastructure, the scenario seen in Figure 5 has less than half of the average charger cost observed in Figure 2.
Charging Forward: Deploying Electric Vehicle Infrastructure for Uber and Lyft in California
21
Figure 5. Charging infrastructure deployment for a fleet of 1000 EV ride-hail vehicles in San Diego county. This scenario places a high value on travel time but a low value on charging time. Note that in contrast with Figure 2, there are a substantial number of slower Level 2 chargers installed throughout the region.
In Figure 6, we display the aggregate results of scenario runs across all combinations of weighting factors, number of vehicles, and public versus overnight charging patterns. It also contains information on the total cost of installing the charging infrastructure (denoted by the size of each point), the city (denoted by color), and the value of the weighting factors (denoted by shape) across all four combinations of values for travel time and charge rate. The figure displays a rapid tradeoff in the number of chargers and the average time for a vehicle to travel to a charger, there is a rapid decrease in the travel time to sub-5 minutes at around 100 chargers across all regions. As chargers continue to increase in number, the total cost continues to increase without the same magnitude of decrease in travel time observed within the increase up to the first hundred chargers. However, it should be noted that Figure 6 does not display other key benefits of increasing the number of chargers. While travel time may not be decreasing, the WIRED model is making tradeoffs to meet higher demand for scenarios with a greater number of vehicles, as well as potentially transitioning between lower speed (L2) to higher speed (DC fast) chargers to reduce charge rates for drivers.

Charging Forward: Deploying Electric Vehicle Infrastructure for Uber and Lyft in California
22
Figure 6. Comparison of the average travel time to the number of chargers in the scenarios run from the WIRED model. There are four combinations of weights for high valuation (+) and low valuation (-) of travel time (TT) and charge rates (ChrgRte). Each point represents aggregated values from a single scenario run, with the city denoted by color and the total cost of all infrastructure installed denoted by the size of each point.
The primary set of scenarios shown in the Results section assumes that TNC EVs will typically employ public charging infrastructure to fuel their vehicles, an observation made empirically in an earlier study by Jenn (18). Nevertheless, it is certainly within the realm of possibility that future drivers may begin to shift to overnight charging. This behavior is potentially compelling because 1) it does not interfere with drivers’ ability to provide their ride-hailing services, and 2) it may be cheaper than charging during the day. Therefore, we also investigate the opposite end of the spectrum from our initial assumptions where drivers will only employ public chargers if they run out of charge in the vehicle in a given day.
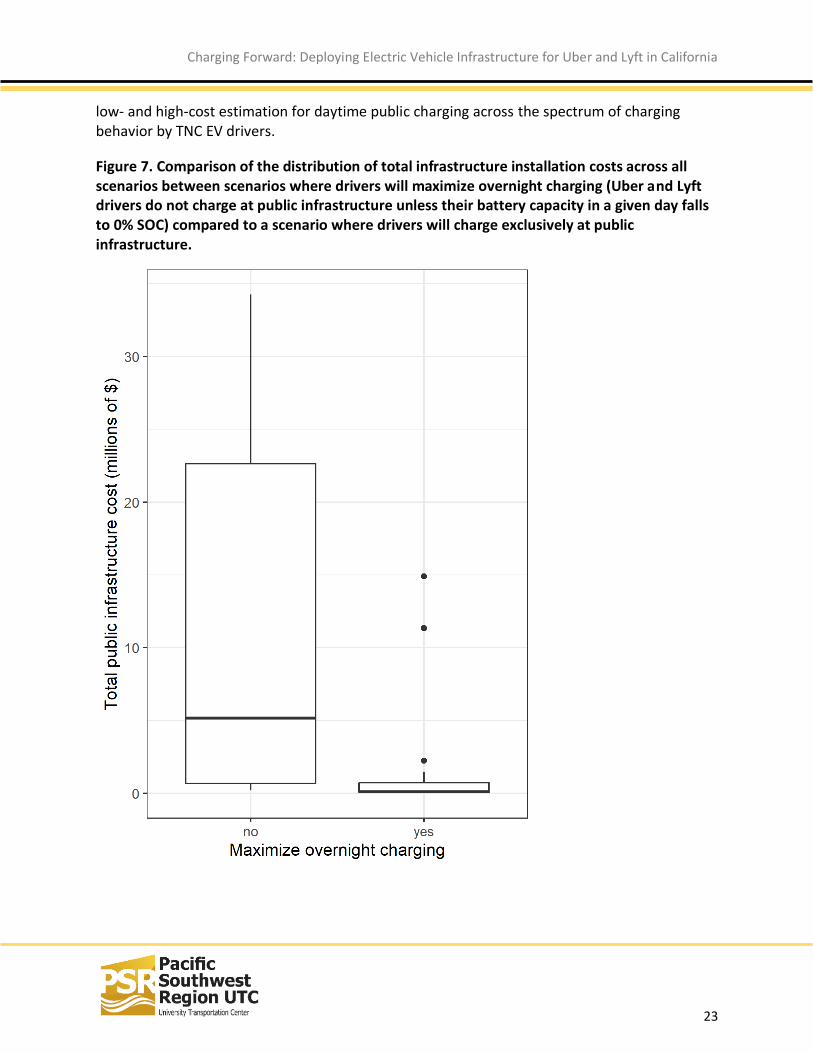
In Figure 7 we compare the distribution of total cost of installing infrastructure in purely public charging versus maximizing overnight charging across all other scenarios. We find that if Uber and Lyft drivers were to rely primarily on overnight charging, only a marginal increase in chargers is necessary to sustain the trip demand. However, note that the WIRED model does not install infrastructure to meet overnight charging demand. This demand is assumed to be met by existing public infrastructure or charging at home—hence substantially lowering system costs for infrastructure installation. The comparison made in Figure 7 can be characterized as
Charging Forward: Deploying Electric Vehicle Infrastructure for Uber and Lyft in California
23
low- and high-cost estimation for daytime public charging across the spectrum of charging behavior by TNC EV drivers.
Figure 7. Comparison of the distribution of total infrastructure installation costs across all scenarios between scenarios where drivers will maximize overnight charging (Uber and Lyft drivers do not charge at public infrastructure unless their battery capacity in a given day falls to 0% SOC) compared to a scenario where drivers will charge exclusively at public infrastructure.
Charging Forward: Deploying Electric Vehicle Infrastructure for Uber and Lyft in California
24
Discussion and Conclusions It is clear that the charging demand and behavior from TNCs is substantially different from charging from the general public. The tremendous demand on public infrastructure indicates that serious attention must be placed on the potentially tremendous charging demand coming from a rapidly growing segment of light-duty transportation. Despite the relatively small volume of electric vehicles operating for Uber and Lyft in California, they are already placing tremendous stress on the public charging infrastructure. Electrification of TNCs is relatively unexplored, and their associated impacts on infrastructure have only been studied in long-term scenarios, such as those that consider futures with complete ride-sharing and automation. Nevertheless, impacts of electrification in these fleets is evident even today—solving this issue will require a confluence of stakeholders including ride-hailing companies (Uber and Lyft), regulatory agencies (California Air Resources Board, the California Energy Commission, and the California Public Utilities Commission), charging network providers (EVGo, Electrify America, Chargepoint, etc.), local utilities, and local/regional planners to name a few. Our work is not intended to act as the primary planning resource for installation of future infrastructure for EVs operating on ride-hailing services, but rather to provide context and begin to lay the foundation for future studies in a sorely needed field of research.
While the current ratio of chargers to electric vehicles for the general public is about 1 slow charger (L1/L2) per 10 EVs and about 3-4 DC fast chargers per 1000 EVs. Our modeling indicates that this ratio must be approximately an order of magnitude higher for ride-hailing EVs. It is critical to note that the WIRED model attempts to maximize the utilization of chargers to reduce the associated costs of additional infrastructure installations. By increasing utilization, the availability of charging infrastructure is correspondingly decreased—in order to avoid issues such as charger congestion, maximizing utilization must include careful planning processes for drivers to strategically charge. Whether through a queuing model or congestion pricing at charging infrastructure, drivers must be provided a signal to maintain high utilization at chargers—without this our WIRED model serves only as a lower bound for the required number of chargers to meet demand.
Future work will integrate existing stations and projections of public infrastructure to meet demand from EVs owned by the general public into the WIRED model. This will allow electric vehicles in Uber and Lyft to charge from existing (or potential new) public charging infrastructure. Further constraints will be necessary to accommodate the heterogeneity in availability of public chargers that may be occupied by vehicles from the general public—this can also extend to the network generated by WIRED (to allow anyone to use the charging network from this study).
Charging Forward: Deploying Electric Vehicle Infrastructure for Uber and Lyft in California
25
References
1. Sperling D. Three Revolutions: Steering Automated, Shared, and Electric Vehicles to a Better Future; 2018.
2. Anderson JE, Lehne M, Hardinghaus M. What Electric Vehicle Users Want: Real-World Preferences for Public Charging Infrastructure. International Journal of Sustainable Transportation. 2018; 12(5): p. 341-352.
3. Davidov S. Optimal Charging Infrastructure Planning Based on a Charging Convenience Buffer. Energy. 2019.
4. Globisch J, Plotz P, Dutschke E, Wietschel M. Consumer Preferences for Public Charging Infrastructure for Electric Vehicles. Transport Policy. 2018; 81: p. 54-63.
5. He J, Yang H, Tang TQ, Huang HJ. An Optimal Charging Station Location Model with the Consideration of Electric Vehicle's Driving Range. Transportation Research Part C: Emerging Technologies. 2018; 86: p. 641-654.
6. Ferro G, Minciardi R, Robba M. A User Equilibrium Model for Electric Vehicles: Joint Traffic and Energy Demand Assignment. Energy. 2020; 198.
7. Funke SA, Sprei F, Gnann T, Plotz P. How much charging infrastructure do electric vehicles need? A review of the evidence and international comparison. Tranportation Research Part D: Transport and Environment. 2019; 77: p. 224-242.
8. Gnann T, Funke S, Jakobsson N, Plotz P, Sprei F, Bennehag A. Fast charging infrastructure for electric vehicles: Today's situation and future needs. Transportation Research Part D: Transport and Environment. 2018; 62: p. 314-329.
9. Greene DL, Kontou E, Borlaug B, Brooker A, Muratori M. Public charging infrastructure for plug-in electric vehicles: What is it worth? Transportation Research Part D: Transport and Environment. 2020; 78.
10. Javid RJ, Salari M, Javid RJ. Environmental and economic impacts of expanding electric vehicle public charging infrastructure in California's counties. Transportation Research Part D: Transport and Environment. 2019; 77: p. 320-334.
11. Levinson R, West TH. Impact of public electric vehicle charging infrastructure. Transportation Research Part D: Transport and Environment. 2018; 64: p. 158-177.
12. Bauer GS, PHadke A, Greenblatt JB, Rajagopal D. Electrifying Urban Ridesourcing Fleets at No Added Cost through Efficient Use of Charging Infrastructure. Transportation Research Part C: Emerging Technologies. 2019; 105: p. 385-404.
Charging Forward: Deploying Electric Vehicle Infrastructure for Uber and Lyft in California
26
13. Vosooghi R, Puchinger J, Bischoff J, Jankovic M, Vouillon A. Shared Autonomous Electric Vehicle Service Performance: Assessing the Impact of Charging Infrastructure. Transportation Research Part D: Transport and Environment. 2019; 81.
14. Lokhandwala M, Cai H. Dynamic Ride Sharing Using Traditional Taxis and Shared Autonomous Taxis: A Case Study of NYC. Transportation Research Part C: Emerging Technologies. 2018; 97: p. 45-60.
15. Morro-Mello I, Padilha-Feltrin A, Melo JD, Calvino A. Fast Charging Stations Placement Methodology for Electric Taxis in Urban Zones. Energy. 2019; 188.
16. Shahraki N, Cai H, Turkay M, Xu M. Optimal Locations of Electric Public Charging Stations Using Real World Vehicle Travel Patterns. Transportation Research Part D: Transport and Environment. 2015; 41: p. 165-176.
17. Jenn A, Laberteaux K, Clewlow R. New mobility service users' perceptions on electric vehicle adoption. International Journal of Sustainable Transportation. 2018; 12(7): p. 526-540.
18. Jenn A. Emissions benefits of electric vehicles in Uber and Lyft ride-hailing services. Nature Energy. 2020;: p. 1-6.
19. Wenzel T, Rames C, Kontou E, Henao A. Travel and energy implications of ridesourcing service in Austin, Texas. Transportation Research Part D: Transport and Environment. 2019; 70: p. 18-34.

Charging Forward: Deploying Electric Vehicle Infrastructure for Uber and Lyft in California
27
Data Management
Products of Research
There are two different types of data being used for this project. The first involves TNC operation data from both Uber and Lyft. The second set of data are public charging infrastructure usage data, that contain information on charging behavior of users at public stations. The majority of the data from these sources are specifically regarding DC fast chargers.
Data Format and Content
All of the data are in comma separated value format. The TNC data generically contain trip-based information on rides being provided by the TNC services. This includes locations, times, and quantity of trips, as well as attributes of the vehicles providing the trips. The charging data contain comprehensive data on all charging events in a particular network. This includes duration, average power, and timing.
Data Access and Sharing
Both the trip data from TNCs as well as the charging infrastructure use data from charging network providers are confidential and are unable to be shared with the general public. Data access would have to be requested directly from the primary sources: Uber, Lyft, EVGo, Chargepoint.
Reuse and Redistribution
Both the trip data from TNCs as well as the charging infrastructure use data from charging network providers are confidential and cannot be used and redistributed for use by the general public.