Embed Size (px)
Citation preview
Charge lifetime measurements at high average current usingaK2CsSb photocathode inside a dc high voltage photogun
R.R. Mammei,* R. Suleiman, J. Feingold, P. A. Adderley, J. Clark, S. Covert, J. Grames, J. Hansknecht,
D. Machie, and M. Poelker
Thomas Jefferson National Accelerator Facility, Newport News, Virginia 23606, USA
T. Rao, J. Smedley, and J. Walsh
Brookhaven National Laboratory, Upton, New York 11973, USA
J. L. McCarter
Department of Physics, University of Virginia, Charlottesville, Virginia 22901, USA
M. Ruiz-Oses
Stony Brook University, Stony Brook, New York 11794, USA(Received 16 August 2012; published 13 March 2013)
Two K2CsSb photocathodes were manufactured at Brookhaven National Lab and delivered to Jefferson
Lab within a compact vacuum apparatus at pressure �10�11 Torr. These photocathodes were evaluated
using a dc high voltage photogun biased at voltages up to 200 kV, and illuminated with laser light at
wavelengths 440 or 532 nm, to generate dc electron beams at currents up to 20 mA. Some conditions
produced exceptionally large photocathode charge lifetimes, without measurable quantum efficiency
decay, even from the center of the photocathode where operation using GaAs photocathodes is precluded
due to ion bombardment. Under other conditions the charge lifetime was poor due to extensive ion
bombardment under severely degraded vacuum conditions, and as a result of localized heating via the
laser beam. Following beam delivery, the photocathodes were evaluated using a scanning electron
microscope to determine surface morphology.
DOI: 10.1103/PhysRevSTAB.16.033401 PACS numbers: 29.25.Bx, 29.27.Fh, 79.60.�i, 52.59.Sa
I. INTRODUCTION
There are two popular photocathode choices for gener-ating high average current electron beams at acceleratorsusing relatively inexpensive rf-pulsed green-laser light:GaAs and K2CsSb. The GaAs photocathode can exhibitvery high quantum efficiency (QE) and it can produce abeam with small thermal emittance [1], but it is widelyrecognized to be a very fragile photocathode requiringstrict adherence to procedures that maintain cleanlinessof the photocathode surface on an atomic scale. Onceinside the photogun, it is prone to rapid QE loss that canresult from many situations including poor vacuum, highvoltage discharges within the gun, and low level fieldemission. The K2CsSb photocathode can exhibit highQE, but whereas GaAs can be purchased from numerousreliable vendors, K2CsSb is a compound ‘‘grown’’ by theuser near the gun, by successive application of elemental
species on a suitable substrate. Consistent results dependon adherence to proper growth procedures. The K2CsSbphotocathode has a slightly larger thermal emittance [2]compared to GaAs but it is considered to be a promptemitter because of its positive-electron affinity (PEA) na-ture, producing shorter bunches than GaAs. The biggestadvantage however is the photocathode’s ability to surviveunder markedly harsher vacuum conditions compared toGaAs [3].The basis for these introductory comments stems from
reports of accelerator operation at a handful of locations
[4–8]. Notably, the Jefferson Lab (JLab) free electron laser
(FEL) employs GaAs inside a dc high voltage photogun
biased at 350 kV and routinely operates at 5 mA average
current [8], although occasional high voltage discharges
sometimes necessitate time consuming photocathode re-
placement. The Boeing FEL used K2CsSb inside a normal
conducting rf gun and produced a maximum average cur-
rent of 32 mA [3]. The photocathode provided high QE and
was very robust, surviving inside a vacuum chamber
known to have a leak to the water cooling jacket of the
photogun. QE would decrease during operation but could
be restored to 100% of its original value by application of
more cesium. The Cornell University photogun group re-
cently set impressive new milestones using both of these
*Corresponding [email protected]
Published by the American Physical Society under the terms ofthe Creative Commons Attribution 3.0 License. Further distri-bution of this work must maintain attribution to the author(s) andthe published article’s title, journal citation, and DOI.
PHYSICAL REVIEW SPECIAL TOPICS - ACCELERATORS AND BEAMS 16, 033401 (2013)
1098-4402=13=16(3)=033401(16) 033401-1 Published by the American Physical Society
photocathodes by demonstrating sustained delivery of20 mA average current for 8 hours from K2CsSb [9] withno observed QE decay and 50 mA for several minutesusing GaAs with a 100 C charge lifetime [10].
The purpose of this work was to compare the perform-
ance of the K2CsSb photocathode inside a dc high voltage
photogun that had been used extensively to characterize
GaAs performance [11]. Under nominally identical con-
ditions (gun and beam line vacuum, drive laser wavelength
and laser spot size, etc.), the performance of the two
photocathodes can be quantitatively assessed. The follow-
ing observations will be described in detail in sections that
follow.K2CsSb photocathodes can be manufactured at one
location and delivered to the photogun many miles awayunder UHV conditions, without appreciable QE decay.
Under UHV conditions (< 10�11 Torr), the lifetimeof the K2CsSb photocathode does not appear to besignificantly affected by ion bombardment. However,under degraded vacuum conditions (� 10�9 Torr) ionbombardment was a serious problem that led to the com-plete removal of the photocathode material from thesubstrate.
Under UHV conditions (< 10�11 Torr), the QE of theK2CsSb photocathode was most strongly dependent onlaser heating.
The geometric normalized rms emittance of the photo-cathode, before and after sustained use, was comparable toreported values.
Scanning electron microscope (SEM) measurementsindicate significant morphological changes associatedwith use.
II. EXPERIMENT
A. Photocathode preparation
Two K2CsSb photocathodes were manufactured atBrookhaven National Lab (BNL) inside an ultrahigh vac-uum deposition chamber (base pressure�2� 10�11 Torr)by sequentially depositing high-purity Sb, K, and Cs onto aheated substrate referred to as a ‘‘puck.’’ Photocathode #1was fabricated on April 1, 2011 and photocathode #2 onNovember 18, 2011. Each photocathode was delivered toJLab within a few days of fabrication, in the mannerdescribed below. The constituent sources consisted ofhigh-purity Sb pellets, resistively heated in a tungstencrucible, while the K and Cs sources consisted of SAESalkali dispenser strips [12] for photocathode #1, andAlvatec source vials [13] for photocathode #2. The puckwas similar to pucks used at the Continuous Electron BeamAccelerator Facility at JLab for securing GaAs photocath-odes [11] but made of aluminum with a thin layer ofstainless steel explosion bonded to the top which servedas the coating substrate. The substrate must be heatedduring the photocathode fabrication and, because the
heater inside the BNL deposition chamber had modestheating capability, aluminum was chosen for the puckbody because it has relatively small mass and good thermalheat conduction. Stainless steel was chosen as the photo-cathode substrate as previous measurements at BNL indi-cated it provided high QE at 532 nm [14]. The stainlesssteel surface was polished using diamond paste with 9 �mgrit, cleaned with a citric-acid soap in an ultrasonic bath,rinsed in deionized water and then vacuum baked to 200�Cinside a load lock system before insertion into the deposi-tion chamber. Figure 1 shows a photograph of the puckresting in a fork holder composed of BeCu, which was usedto translate the puck sequentially over the three depositionsources.No attempt was made to limit the photocathode active
area—the entire stainless steel substrate was coated with
photocathode chemicals. The fork and puck could be
heated to 150�C and cooled to �80�C, and biased to
5 kV in order to make QE measurements during and after
the depositions. A crystal microbalance was used to moni-
tor and control the deposition rate of the Sb and K sources.
The following deposition procedure was used: (i) the puck
was heated to 100�C and�14 nm of Sb was applied to the
substrate at a rate of �0:5 nm=s; (ii) the puck temperature
was raised to 140�C and 30 nm of K was applied at a rate of
�0:5 nm=s; (iii) the puck was cooled to 135�C, biasedat�20 V, and illuminated with�0:5 mW of 532 nm light;
(iv) Cs was applied while monitoring the extracted
photocurrent until photocurrent ceased to increase; and
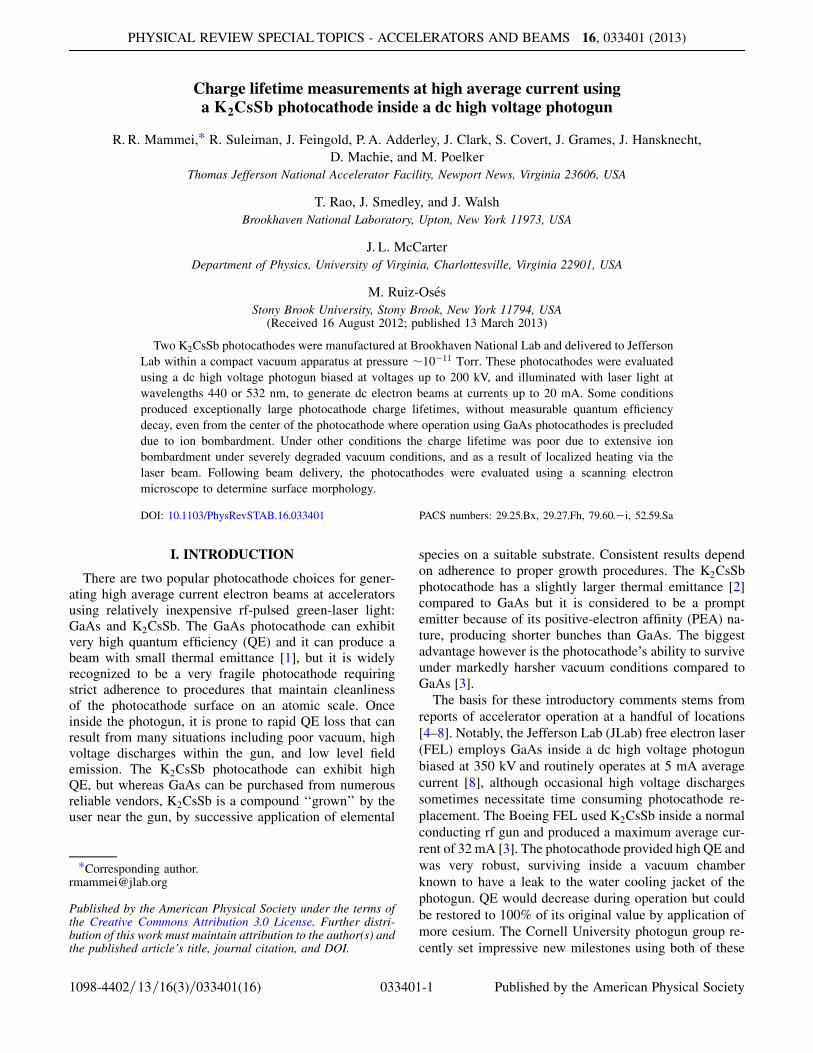
(v) the puck was quickly cooled to room temperature.The QE spectrum of both photocathodes, taken just after
reaching room temperature, is shown in Fig. 2. The QE at532 nm was 0.8% and 2.8% for photocathode #1 and #2,respectively. The QE of photocathode #1 was low becausethe K dispenser became depleted during fabrication.Additional Sb and Cs was applied in an attempt to increaseQE, although in hindsight, these steps were likely notbeneficial. Photocathode #1 may have been composed ofa mixed state of Cs3Sb and K2CsSb. The spectrum forphotocathode #2 is more typical for deposition on a stain-less steel substrate and the peak QE of both photocathodeswas over 20% in the UV. Further information concerning
FIG. 1. The transfer arm of the BNL K2CsSb depositionsystem holding the stainless steel and aluminum puck. Thepuck can be biased for QE measurements, heated, and cooled.
R. R. MAMMEI et al. Phys. Rev. ST Accel. Beams 16, 033401 (2013)
033401-2
the growth methods and QE spectral measurements can befound in Ref. [14]. Other groups report higher QE at532 nm, of the order of 8% [2,3], suggesting our growthprocedure is not optimized.
B. Transfer the photocathodes to JLab
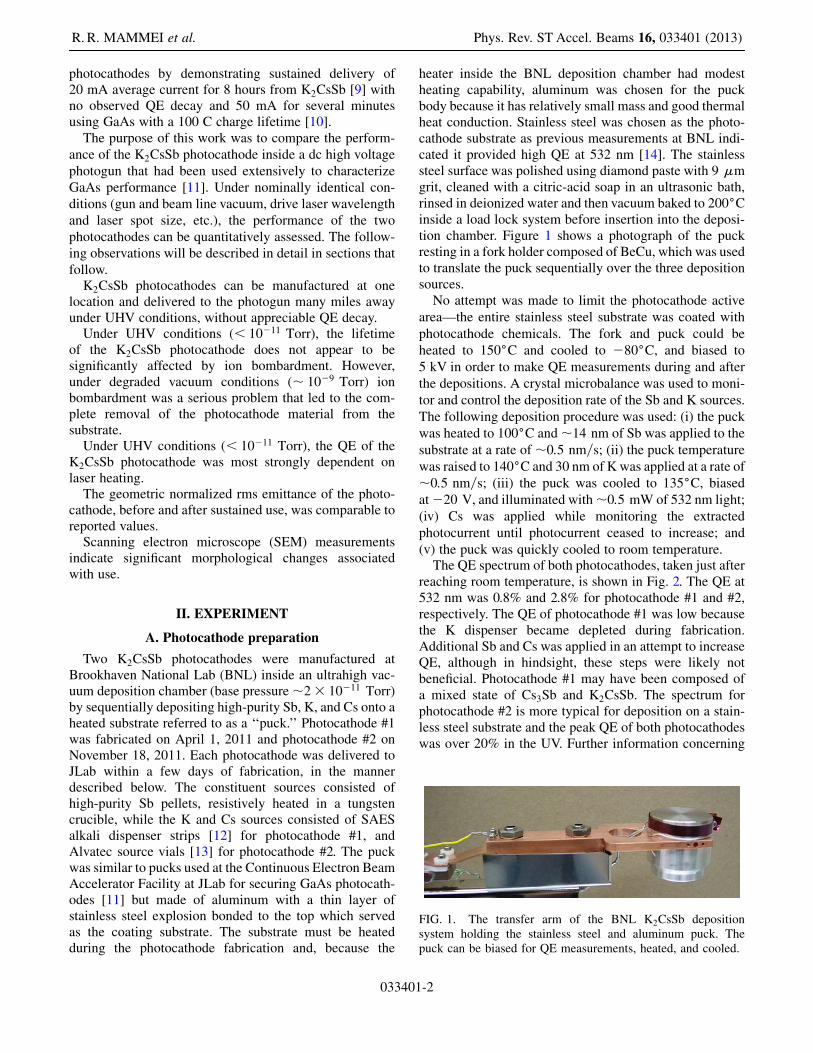
After fabrication, the puck was pulled from the deposi-tion vacuum chamber and moved into a baked vacuum‘‘suitcase’’ composed of a rotating/translating UHV sam-ple manipulator with ‘‘cradle’’ attached to the end to holdthe puck, a 4.5 inch six-way Conflat flange (CF) vacuumcross, and an all-metal gate valve opposite the manipulator.A diagram of the suitcase is shown in Fig. 3. A small ionpump (20 L=s N2) and NEG pump (600 L=s H2) providedpressure �10�11 Torr. The cradle grasps the sides of thepuck, with the photocathode surface facing perpendicularto the linear motion of the manipulator. Once the puck wasinstalled inside the suitcase, the gate valve was closed andthe cradle was then pressed against the back face of thegate valve to prevent the puck from falling out duringtransit. The trip duration via automobile from BNL toJLab (450 miles) was 10 hours. The pressure inside thesuitcase remained at �10�11 Torr with occasional inter-mittent pressures spikes to 10�9 Torr when the vehicleencountered bumps in the road. The ion pump was pow-ered during the entire trip.
C. Load lock dc high voltage photogunand diagnostic beam line
Upon arrival at JLab, the vacuum suitcase was attachedto a small vacuum cross appended to a gate valve on theGaAs preparation chamber. This vacuum cross was evacu-ated and baked for 12 hours at 100�C to achieve vacuum�1� 10�10 Torr. The vacuum within the suitcase did notdegrade appreciably during the bakeout of the interveningcross. Following bakeout, the gate valves at the preparationchamber and suitcase were opened, and the K2CsSb photo-cathode was quickly transferred first to the preparationchamber and then into the photogun high voltage chamber.Note that the preparation chamber, which normally servesto activate GaAs photocathodes, was not used for this
FIG. 2. Spectral response of the K2CsSb photocathodes cre-ated at BNL just after deposition.
FIG. 3. Schematic of the vacuum suitcase composed of amagnetic sample manipulator, six-way cross with 4.5’’ CF,gate valve, and vacuum pumps.
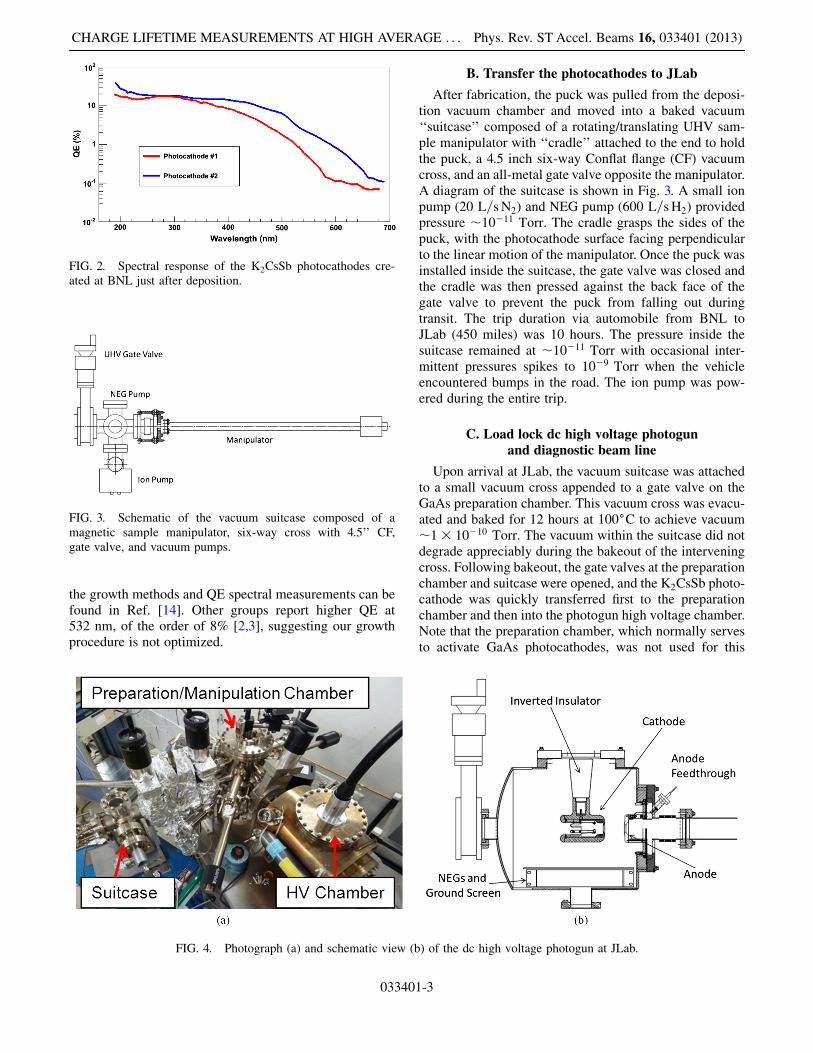
FIG. 4. Photograph (a) and schematic view (b) of the dc high voltage photogun at JLab.
CHARGE LIFETIME MEASUREMENTS AT HIGH AVERAGE . . . Phys. Rev. ST Accel. Beams 16, 033401 (2013)
033401-3
experiment. The load locked photogun is depicted in Fig. 4and described more fully in Ref. [15].
The photocathode was inserted into a large-grainniobium electrode with 25� focusing angle [16].Photoemitted electrons are accelerated to a kinetic energyup to 200 keV over a 6.3 cm cathode/anode gap. The ringanode is electrically isolated and attached to a sensitivecurrent monitor that detects both field emission and pho-toemission that does not pass through the anode. Thecathode electrode hangs from an alumina insulator(11 cm long) that extends into the vacuum chamber. Tennonevaporable getter pump modules (SAES WP1250-ST707) surround the cathode/anode gap and provide pres-sure 2� 10�12 Torr (uncorrected, N2 equivalent).
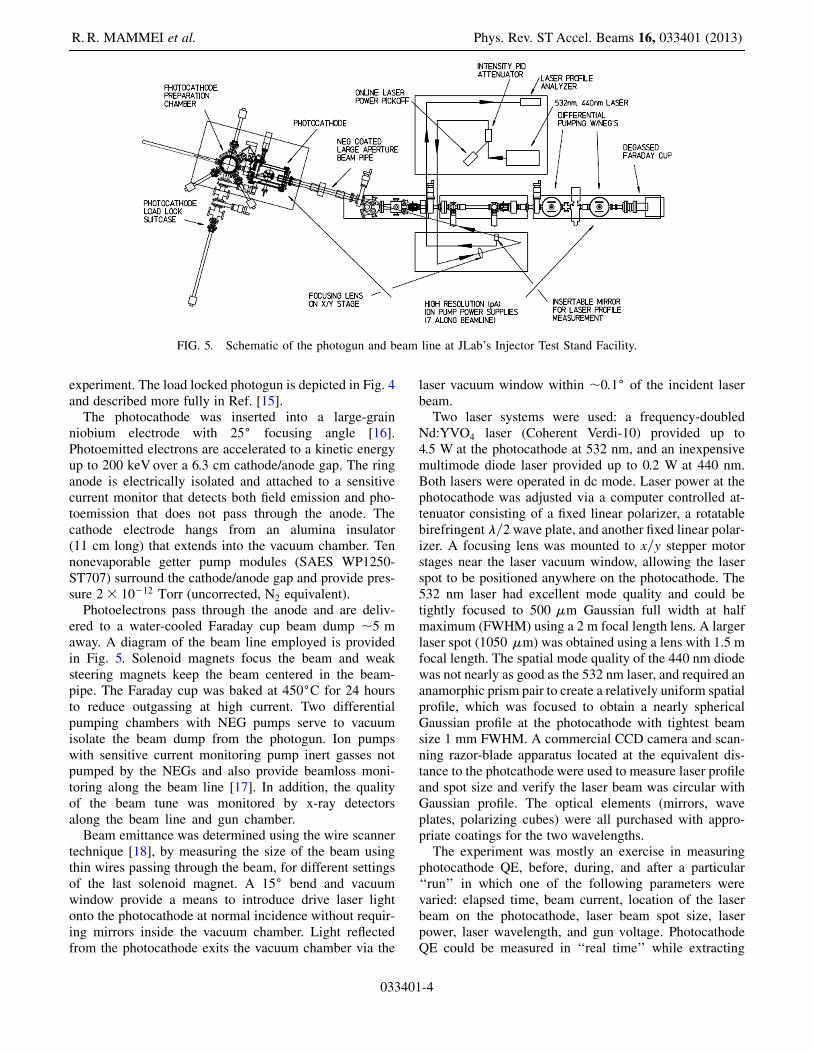
Photoelectrons pass through the anode and are deliv-ered to a water-cooled Faraday cup beam dump �5 maway. A diagram of the beam line employed is providedin Fig. 5. Solenoid magnets focus the beam and weaksteering magnets keep the beam centered in the beam-pipe. The Faraday cup was baked at 450�C for 24 hoursto reduce outgassing at high current. Two differentialpumping chambers with NEG pumps serve to vacuumisolate the beam dump from the photogun. Ion pumpswith sensitive current monitoring pump inert gasses notpumped by the NEGs and also provide beamloss moni-toring along the beam line [17]. In addition, the qualityof the beam tune was monitored by x-ray detectorsalong the beam line and gun chamber.
Beam emittance was determined using the wire scannertechnique [18], by measuring the size of the beam usingthin wires passing through the beam, for different settingsof the last solenoid magnet. A 15� bend and vacuumwindow provide a means to introduce drive laser lightonto the photocathode at normal incidence without requir-ing mirrors inside the vacuum chamber. Light reflectedfrom the photocathode exits the vacuum chamber via the
laser vacuum window within �0:1� of the incident laserbeam.Two laser systems were used: a frequency-doubled
Nd:YVO4 laser (Coherent Verdi-10) provided up to4.5 W at the photocathode at 532 nm, and an inexpensivemultimode diode laser provided up to 0.2 W at 440 nm.Both lasers were operated in dc mode. Laser power at thephotocathode was adjusted via a computer controlled at-tenuator consisting of a fixed linear polarizer, a rotatablebirefringent �=2wave plate, and another fixed linear polar-izer. A focusing lens was mounted to x=y stepper motorstages near the laser vacuum window, allowing the laserspot to be positioned anywhere on the photocathode. The532 nm laser had excellent mode quality and could betightly focused to 500 �m Gaussian full width at halfmaximum (FWHM) using a 2 m focal length lens. A largerlaser spot (1050 �m) was obtained using a lens with 1.5 mfocal length. The spatial mode quality of the 440 nm diodewas not nearly as good as the 532 nm laser, and required ananamorphic prism pair to create a relatively uniform spatialprofile, which was focused to obtain a nearly sphericalGaussian profile at the photocathode with tightest beamsize 1 mm FWHM. A commercial CCD camera and scan-ning razor-blade apparatus located at the equivalent dis-tance to the photcathode were used to measure laser profileand spot size and verify the laser beam was circular withGaussian profile. The optical elements (mirrors, waveplates, polarizing cubes) were all purchased with appro-priate coatings for the two wavelengths.The experiment was mostly an exercise in measuring
photocathode QE, before, during, and after a particular‘‘run’’ in which one of the following parameters werevaried: elapsed time, beam current, location of the laserbeam on the photocathode, laser beam spot size, laserpower, laser wavelength, and gun voltage. PhotocathodeQE could be measured in ‘‘real time’’ while extracting
FIG. 5. Schematic of the photogun and beam line at JLab’s Injector Test Stand Facility.
R. R. MAMMEI et al. Phys. Rev. ST Accel. Beams 16, 033401 (2013)
033401-4
beam by monitoring the delivered photocurrent to thedump, and the laser power through a calibrated partialreflector. The laser power was also measured by notingthe setting of the calibrated laser attenuator. Before andafter a run, the QE of the entire photocathode surface wasmeasured by extracting �1 �A from the grounded photo-cathode, with the anode biased at�375 V, while scanningthe laser across the photocathode by translating the focus-ing lens on stepper motor stages. Lasers were left poweredthroughout the duration of the experiment (and shutteredwhen beam was not extracted) to minimize laser powerdrift, which was less than 3% drift over 12 hours. Unlessotherwise noted, measurements were made at fixed beamcurrent by continually adjusting the laser power via asoftware feedback loop that controlled the laser attenuator.The term charge lifetime is defined as the amount of chargethat could be extracted from the photocathode before QEfell to 1=e of the initial value.
III. RESULTS
A. Initial measurements using K2CsSbphotocathode #1 at 532 nm
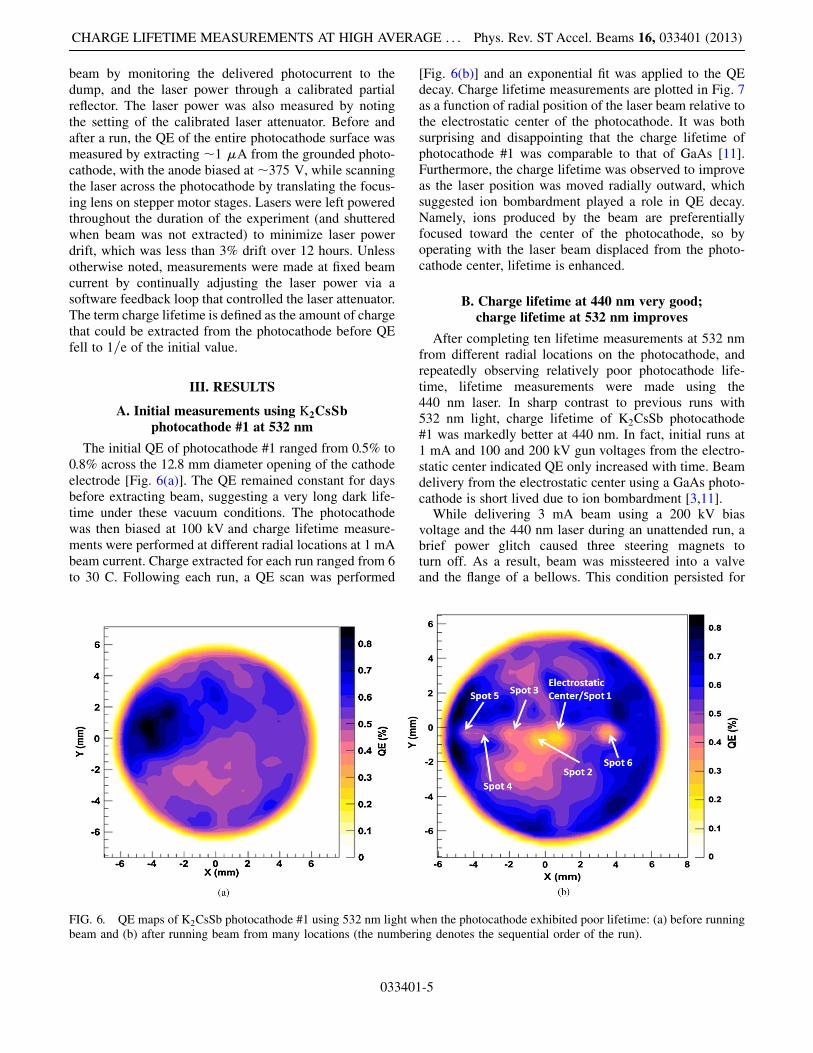
The initial QE of photocathode #1 ranged from 0.5% to0.8% across the 12.8 mm diameter opening of the cathodeelectrode [Fig. 6(a)]. The QE remained constant for daysbefore extracting beam, suggesting a very long dark life-time under these vacuum conditions. The photocathodewas then biased at 100 kV and charge lifetime measure-ments were performed at different radial locations at 1 mAbeam current. Charge extracted for each run ranged from 6to 30 C. Following each run, a QE scan was performed
[Fig. 6(b)] and an exponential fit was applied to the QEdecay. Charge lifetime measurements are plotted in Fig. 7as a function of radial position of the laser beam relative tothe electrostatic center of the photocathode. It was bothsurprising and disappointing that the charge lifetime ofphotocathode #1 was comparable to that of GaAs [11].Furthermore, the charge lifetime was observed to improveas the laser position was moved radially outward, whichsuggested ion bombardment played a role in QE decay.Namely, ions produced by the beam are preferentiallyfocused toward the center of the photocathode, so byoperating with the laser beam displaced from the photo-cathode center, lifetime is enhanced.
B. Charge lifetime at 440 nm very good;charge lifetime at 532 nm improves
After completing ten lifetime measurements at 532 nmfrom different radial locations on the photocathode, andrepeatedly observing relatively poor photocathode life-time, lifetime measurements were made using the440 nm laser. In sharp contrast to previous runs with532 nm light, charge lifetime of K2CsSb photocathode#1 was markedly better at 440 nm. In fact, initial runs at1 mA and 100 and 200 kV gun voltages from the electro-static center indicated QE only increased with time. Beamdelivery from the electrostatic center using a GaAs photo-cathode is short lived due to ion bombardment [3,11].While delivering 3 mA beam using a 200 kV bias
voltage and the 440 nm laser during an unattended run, abrief power glitch caused three steering magnets toturn off. As a result, beam was missteered into a valveand the flange of a bellows. This condition persisted for
FIG. 6. QE maps of K2CsSb photocathode #1 using 532 nm light when the photocathode exhibited poor lifetime: (a) before runningbeam and (b) after running beam from many locations (the numbering denotes the sequential order of the run).
CHARGE LIFETIME MEASUREMENTS AT HIGH AVERAGE . . . Phys. Rev. ST Accel. Beams 16, 033401 (2013)
033401-5
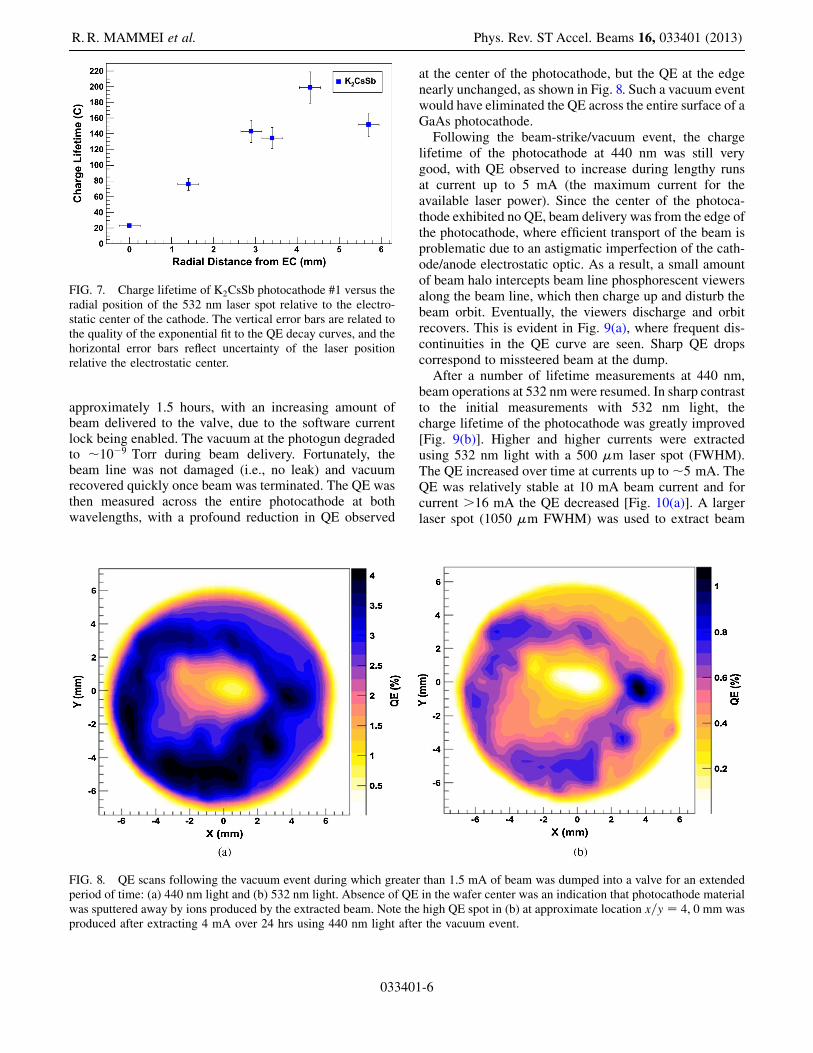
approximately 1.5 hours, with an increasing amount ofbeam delivered to the valve, due to the software currentlock being enabled. The vacuum at the photogun degradedto �10�9 Torr during beam delivery. Fortunately, thebeam line was not damaged (i.e., no leak) and vacuumrecovered quickly once beam was terminated. The QE wasthen measured across the entire photocathode at bothwavelengths, with a profound reduction in QE observed
at the center of the photocathode, but the QE at the edgenearly unchanged, as shown in Fig. 8. Such a vacuum eventwould have eliminated the QE across the entire surface of aGaAs photocathode.Following the beam-strike/vacuum event, the charge
lifetime of the photocathode at 440 nm was still verygood, with QE observed to increase during lengthy runsat current up to 5 mA (the maximum current for theavailable laser power). Since the center of the photoca-thode exhibited no QE, beam delivery was from the edge ofthe photocathode, where efficient transport of the beam isproblematic due to an astigmatic imperfection of the cath-ode/anode electrostatic optic. As a result, a small amountof beam halo intercepts beam line phosphorescent viewersalong the beam line, which then charge up and disturb thebeam orbit. Eventually, the viewers discharge and orbitrecovers. This is evident in Fig. 9(a), where frequent dis-continuities in the QE curve are seen. Sharp QE dropscorrespond to missteered beam at the dump.After a number of lifetime measurements at 440 nm,
beam operations at 532 nmwere resumed. In sharp contrastto the initial measurements with 532 nm light, thecharge lifetime of the photocathode was greatly improved[Fig. 9(b)]. Higher and higher currents were extractedusing 532 nm light with a 500 �m laser spot (FWHM).The QE increased over time at currents up to�5 mA. TheQE was relatively stable at 10 mA beam current and forcurrent >16 mA the QE decreased [Fig. 10(a)]. A largerlaser spot (1050 �m FWHM) was used to extract beam
FIG. 7. Charge lifetime of K2CsSb photocathode #1 versus theradial position of the 532 nm laser spot relative to the electro-static center of the cathode. The vertical error bars are related tothe quality of the exponential fit to the QE decay curves, and thehorizontal error bars reflect uncertainty of the laser positionrelative the electrostatic center.
FIG. 8. QE scans following the vacuum event during which greater than 1.5 mA of beam was dumped into a valve for an extendedperiod of time: (a) 440 nm light and (b) 532 nm light. Absence of QE in the wafer center was an indication that photocathode materialwas sputtered away by ions produced by the extracted beam. Note the high QE spot in (b) at approximate location x=y ¼ 4, 0 mm wasproduced after extracting 4 mA over 24 hrs using 440 nm light after the vacuum event.
R. R. MAMMEI et al. Phys. Rev. ST Accel. Beams 16, 033401 (2013)
033401-6
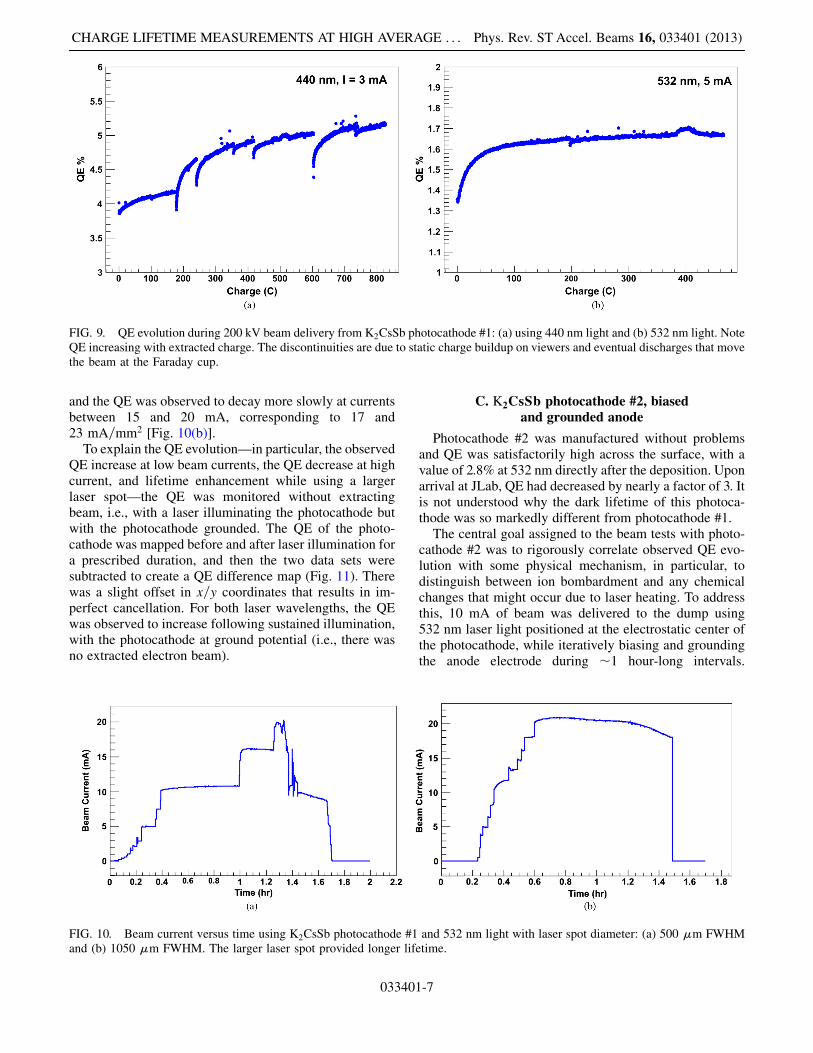
and the QE was observed to decay more slowly at currentsbetween 15 and 20 mA, corresponding to 17 and23 mA=mm2 [Fig. 10(b)].
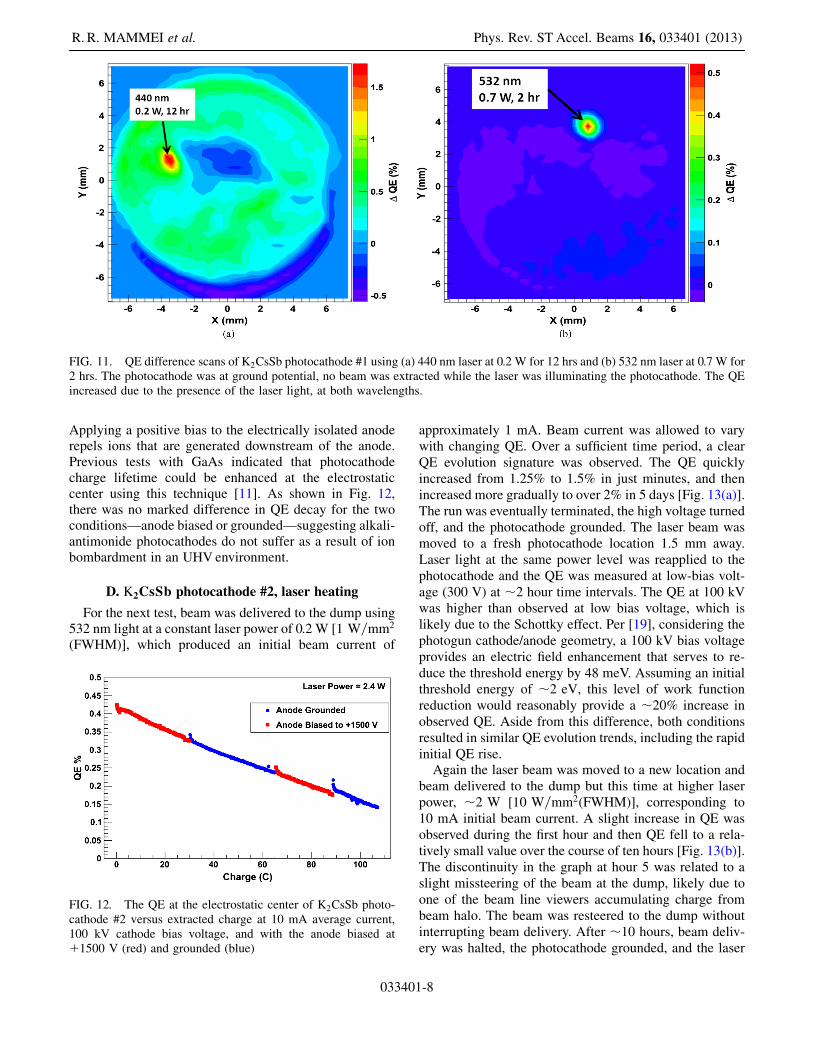
To explain the QE evolution—in particular, the observedQE increase at low beam currents, the QE decrease at highcurrent, and lifetime enhancement while using a largerlaser spot—the QE was monitored without extractingbeam, i.e., with a laser illuminating the photocathode butwith the photocathode grounded. The QE of the photo-cathode was mapped before and after laser illumination fora prescribed duration, and then the two data sets weresubtracted to create a QE difference map (Fig. 11). Therewas a slight offset in x=y coordinates that results in im-perfect cancellation. For both laser wavelengths, the QEwas observed to increase following sustained illumination,with the photocathode at ground potential (i.e., there wasno extracted electron beam).
C. K2CsSb photocathode #2, biasedand grounded anode
Photocathode #2 was manufactured without problemsand QE was satisfactorily high across the surface, with avalue of 2.8% at 532 nm directly after the deposition. Uponarrival at JLab, QE had decreased by nearly a factor of 3. Itis not understood why the dark lifetime of this photoca-thode was so markedly different from photocathode #1.The central goal assigned to the beam tests with photo-
cathode #2 was to rigorously correlate observed QE evo-lution with some physical mechanism, in particular, todistinguish between ion bombardment and any chemicalchanges that might occur due to laser heating. To addressthis, 10 mA of beam was delivered to the dump using532 nm laser light positioned at the electrostatic center ofthe photocathode, while iteratively biasing and groundingthe anode electrode during �1 hour-long intervals.
FIG. 9. QE evolution during 200 kV beam delivery from K2CsSb photocathode #1: (a) using 440 nm light and (b) 532 nm light. NoteQE increasing with extracted charge. The discontinuities are due to static charge buildup on viewers and eventual discharges that movethe beam at the Faraday cup.
FIG. 10. Beam current versus time using K2CsSb photocathode #1 and 532 nm light with laser spot diameter: (a) 500 �m FWHMand (b) 1050 �m FWHM. The larger laser spot provided longer lifetime.
CHARGE LIFETIME MEASUREMENTS AT HIGH AVERAGE . . . Phys. Rev. ST Accel. Beams 16, 033401 (2013)
033401-7
Applying a positive bias to the electrically isolated anoderepels ions that are generated downstream of the anode.Previous tests with GaAs indicated that photocathodecharge lifetime could be enhanced at the electrostaticcenter using this technique [11]. As shown in Fig. 12,there was no marked difference in QE decay for the twoconditions—anode biased or grounded—suggesting alkali-antimonide photocathodes do not suffer as a result of ionbombardment in an UHV environment.
D. K2CsSb photocathode #2, laser heating
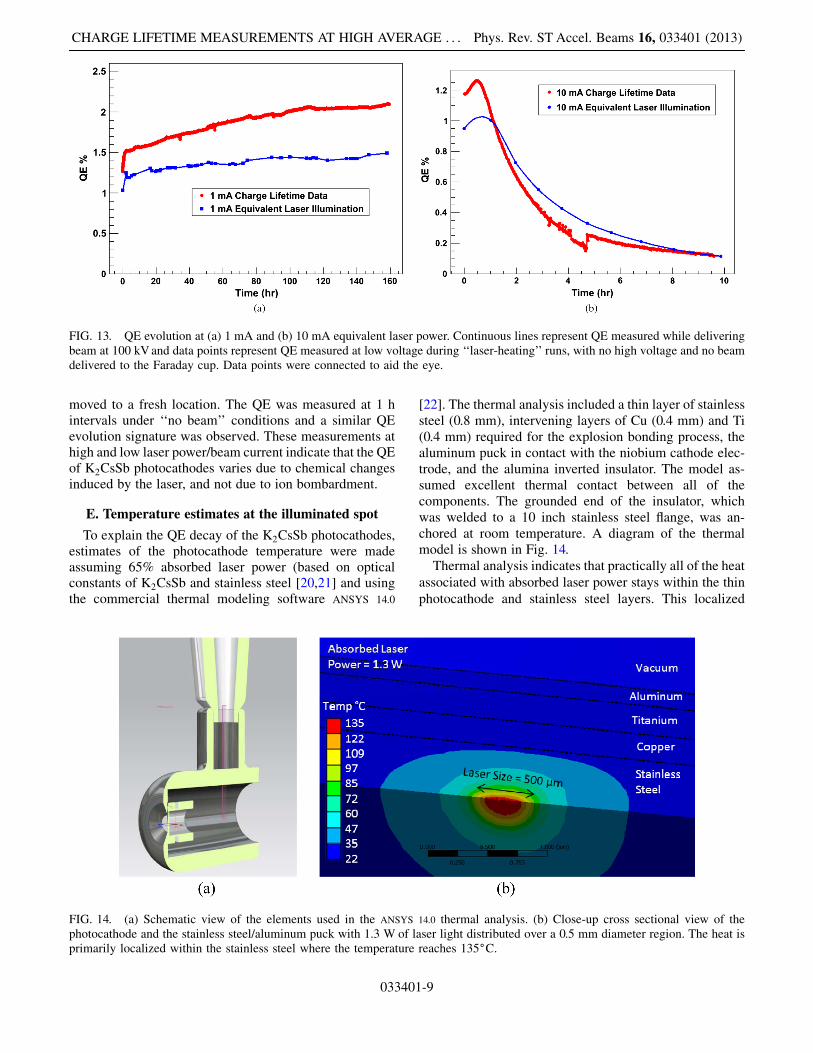
For the next test, beam was delivered to the dump using532 nm light at a constant laser power of 0.2 W [1 W=mm2
(FWHM)], which produced an initial beam current of
approximately 1 mA. Beam current was allowed to varywith changing QE. Over a sufficient time period, a clearQE evolution signature was observed. The QE quicklyincreased from 1.25% to 1.5% in just minutes, and thenincreased more gradually to over 2% in 5 days [Fig. 13(a)].The run was eventually terminated, the high voltage turnedoff, and the photocathode grounded. The laser beam wasmoved to a fresh photocathode location 1.5 mm away.Laser light at the same power level was reapplied to thephotocathode and the QE was measured at low-bias volt-age (300 V) at �2 hour time intervals. The QE at 100 kVwas higher than observed at low bias voltage, which islikely due to the Schottky effect. Per [19], considering thephotogun cathode/anode geometry, a 100 kV bias voltageprovides an electric field enhancement that serves to re-duce the threshold energy by 48 meV. Assuming an initialthreshold energy of �2 eV, this level of work functionreduction would reasonably provide a �20% increase inobserved QE. Aside from this difference, both conditionsresulted in similar QE evolution trends, including the rapidinitial QE rise.Again the laser beam was moved to a new location and
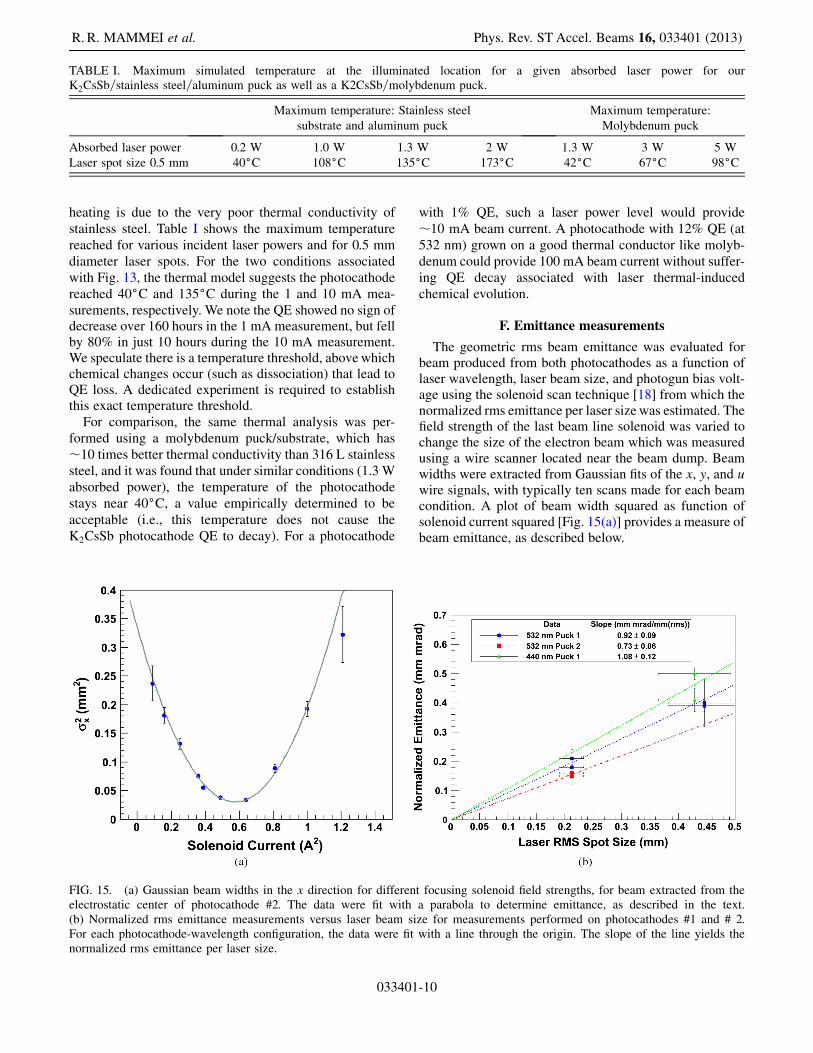
beam delivered to the dump but this time at higher laserpower, �2 W [10 W=mm2(FWHM)], corresponding to10 mA initial beam current. A slight increase in QE wasobserved during the first hour and then QE fell to a rela-tively small value over the course of ten hours [Fig. 13(b)].The discontinuity in the graph at hour 5 was related to aslight missteering of the beam at the dump, likely due toone of the beam line viewers accumulating charge frombeam halo. The beam was resteered to the dump withoutinterrupting beam delivery. After �10 hours, beam deliv-ery was halted, the photocathode grounded, and the laser
FIG. 12. The QE at the electrostatic center of K2CsSb photo-cathode #2 versus extracted charge at 10 mA average current,100 kV cathode bias voltage, and with the anode biased atþ1500 V (red) and grounded (blue)
FIG. 11. QE difference scans ofK2CsSb photocathode #1 using (a) 440 nm laser at 0.2 W for 12 hrs and (b) 532 nm laser at 0.7 W for2 hrs. The photocathode was at ground potential, no beam was extracted while the laser was illuminating the photocathode. The QEincreased due to the presence of the laser light, at both wavelengths.
R. R. MAMMEI et al. Phys. Rev. ST Accel. Beams 16, 033401 (2013)
033401-8
moved to a fresh location. The QE was measured at 1 hintervals under ‘‘no beam’’ conditions and a similar QEevolution signature was observed. These measurements athigh and low laser power/beam current indicate that the QEof K2CsSb photocathodes varies due to chemical changesinduced by the laser, and not due to ion bombardment.
E. Temperature estimates at the illuminated spot
To explain the QE decay of the K2CsSb photocathodes,estimates of the photocathode temperature were madeassuming 65% absorbed laser power (based on opticalconstants of K2CsSb and stainless steel [20,21] and usingthe commercial thermal modeling software ANSYS 14.0
[22]. The thermal analysis included a thin layer of stainlesssteel (0.8 mm), intervening layers of Cu (0.4 mm) and Ti(0.4 mm) required for the explosion bonding process, thealuminum puck in contact with the niobium cathode elec-trode, and the alumina inverted insulator. The model as-sumed excellent thermal contact between all of thecomponents. The grounded end of the insulator, whichwas welded to a 10 inch stainless steel flange, was an-chored at room temperature. A diagram of the thermalmodel is shown in Fig. 14.Thermal analysis indicates that practically all of the heat
associated with absorbed laser power stays within the thin
photocathode and stainless steel layers. This localized
FIG. 14. (a) Schematic view of the elements used in the ANSYS 14.0 thermal analysis. (b) Close-up cross sectional view of thephotocathode and the stainless steel/aluminum puck with 1.3 W of laser light distributed over a 0.5 mm diameter region. The heat isprimarily localized within the stainless steel where the temperature reaches 135�C.
FIG. 13. QE evolution at (a) 1 mA and (b) 10 mA equivalent laser power. Continuous lines represent QE measured while deliveringbeam at 100 kVand data points represent QE measured at low voltage during ‘‘laser-heating’’ runs, with no high voltage and no beamdelivered to the Faraday cup. Data points were connected to aid the eye.
CHARGE LIFETIME MEASUREMENTS AT HIGH AVERAGE . . . Phys. Rev. ST Accel. Beams 16, 033401 (2013)
033401-9
heating is due to the very poor thermal conductivity of
stainless steel. Table I shows the maximum temperaturereached for various incident laser powers and for 0.5 mmdiameter laser spots. For the two conditions associatedwith Fig. 13, the thermal model suggests the photocathodereached 40�C and 135�C during the 1 and 10 mA mea-surements, respectively. We note the QE showed no sign ofdecrease over 160 hours in the 1 mA measurement, but fellby 80% in just 10 hours during the 10 mA measurement.We speculate there is a temperature threshold, above whichchemical changes occur (such as dissociation) that lead toQE loss. A dedicated experiment is required to establishthis exact temperature threshold.
For comparison, the same thermal analysis was per-formed using a molybdenum puck/substrate, which has�10 times better thermal conductivity than 316 L stainlesssteel, and it was found that under similar conditions (1.3 Wabsorbed power), the temperature of the photocathodestays near 40�C, a value empirically determined to be
acceptable (i.e., this temperature does not cause theK2CsSb photocathode QE to decay). For a photocathode
with 1% QE, such a laser power level would provide
�10 mA beam current. A photocathode with 12% QE (at532 nm) grown on a good thermal conductor like molyb-denum could provide 100 mA beam current without suffer-ing QE decay associated with laser thermal-inducedchemical evolution.
F. Emittance measurements
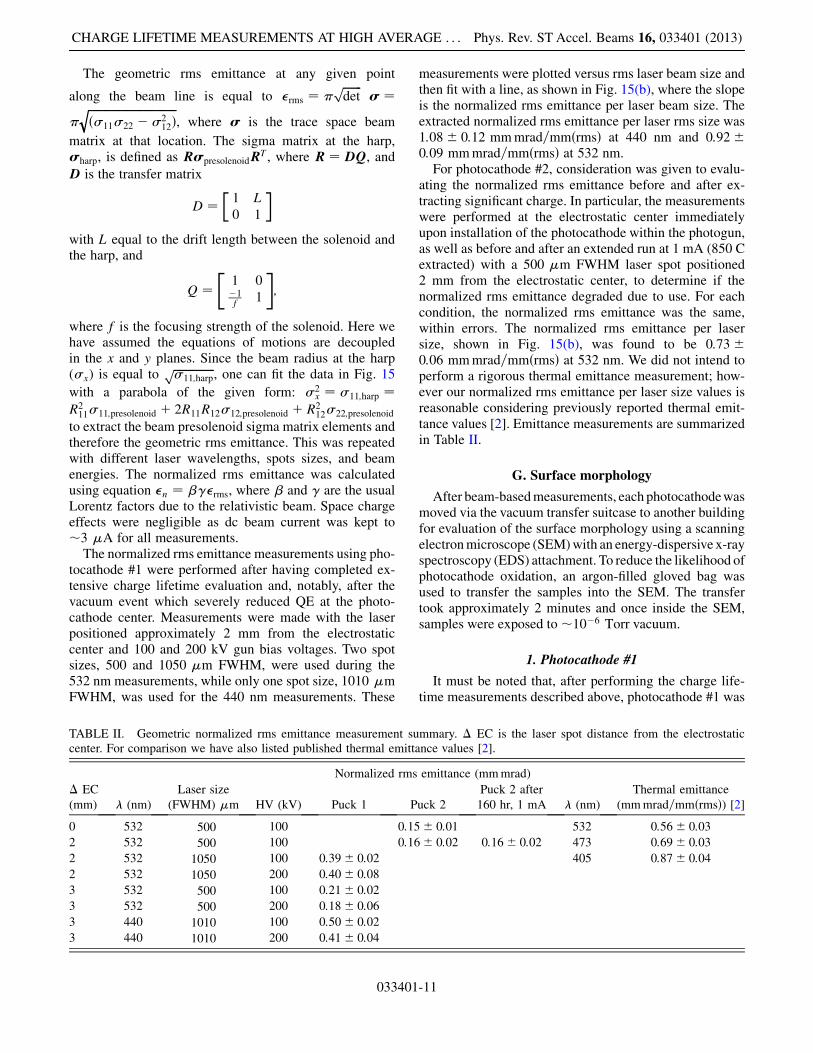
The geometric rms beam emittance was evaluated forbeam produced from both photocathodes as a function oflaser wavelength, laser beam size, and photogun bias volt-age using the solenoid scan technique [18] from which thenormalized rms emittance per laser size was estimated. Thefield strength of the last beam line solenoid was varied tochange the size of the electron beam which was measuredusing a wire scanner located near the beam dump. Beamwidths were extracted from Gaussian fits of the x, y, and uwire signals, with typically ten scans made for each beamcondition. A plot of beam width squared as function ofsolenoid current squared [Fig. 15(a)] provides a measure ofbeam emittance, as described below.
FIG. 15. (a) Gaussian beam widths in the x direction for different focusing solenoid field strengths, for beam extracted from theelectrostatic center of photocathode #2. The data were fit with a parabola to determine emittance, as described in the text.(b) Normalized rms emittance measurements versus laser beam size for measurements performed on photocathodes #1 and # 2.For each photocathode-wavelength configuration, the data were fit with a line through the origin. The slope of the line yields thenormalized rms emittance per laser size.
TABLE I. Maximum simulated temperature at the illuminated location for a given absorbed laser power for ourK2CsSb=stainless steel=aluminum puck as well as a K2CsSb=molybdenum puck.
Maximum temperature: Stainless steel
substrate and aluminum puck
Maximum temperature:
Molybdenum puck
Absorbed laser power 0.2 W 1.0 W 1.3 W 2 W 1.3 W 3 W 5 W
Laser spot size 0.5 mm 40�C 108�C 135�C 173�C 42�C 67�C 98�C
R.R. MAMMEI et al. Phys. Rev. ST Accel. Beams 16, 033401 (2013)
033401-10
The geometric rms emittance at any given point
along the beam line is equal to �rms ¼ �ffiffiffiffiffiffiffi
detp
� ¼�
ffiffiffiffiffiffiffiffiffiffiffiffiffiffiffiffiffiffiffiffiffiffiffiffiffiffiffiffiffiffiffiffi
ð�11�22 � �212Þ
q
, where � is the trace space beam
matrix at that location. The sigma matrix at the harp,�harp, is defined as R�presolenoidR
T , where R ¼ DQ, and
D is the transfer matrix
D ¼ 1 L0 1
� �
with L equal to the drift length between the solenoid andthe harp, and
Q ¼ 1 0�1f 1
" #
;
where f is the focusing strength of the solenoid. Here wehave assumed the equations of motions are decoupledin the x and y planes. Since the beam radius at the harp(�x) is equal to
ffiffiffiffiffiffiffiffiffiffiffiffiffiffiffi
�11;harpp
, one can fit the data in Fig. 15
with a parabola of the given form: �2x ¼ �11;harp ¼
R211�11;presolenoid þ 2R11R12�12;presolenoid þ R2
12�22;presolenoid
to extract the beam presolenoid sigma matrix elements andtherefore the geometric rms emittance. This was repeatedwith different laser wavelengths, spots sizes, and beamenergies. The normalized rms emittance was calculatedusing equation �n ¼ ���rms, where � and � are the usualLorentz factors due to the relativistic beam. Space chargeeffects were negligible as dc beam current was kept to�3 �A for all measurements.
The normalized rms emittance measurements using pho-tocathode #1 were performed after having completed ex-tensive charge lifetime evaluation and, notably, after thevacuum event which severely reduced QE at the photo-cathode center. Measurements were made with the laserpositioned approximately 2 mm from the electrostaticcenter and 100 and 200 kV gun bias voltages. Two spotsizes, 500 and 1050 �m FWHM, were used during the532 nm measurements, while only one spot size, 1010 �mFWHM, was used for the 440 nm measurements. These
measurements were plotted versus rms laser beam size andthen fit with a line, as shown in Fig. 15(b), where the slopeis the normalized rms emittance per laser beam size. Theextracted normalized rms emittance per laser rms size was1:08� 0:12 mmmrad=mmðrmsÞ at 440 nm and 0:92�0:09 mmmrad=mmðrmsÞ at 532 nm.For photocathode #2, consideration was given to evalu-
ating the normalized rms emittance before and after ex-tracting significant charge. In particular, the measurementswere performed at the electrostatic center immediatelyupon installation of the photocathode within the photogun,as well as before and after an extended run at 1 mA (850 Cextracted) with a 500 �m FWHM laser spot positioned2 mm from the electrostatic center, to determine if thenormalized rms emittance degraded due to use. For eachcondition, the normalized rms emittance was the same,within errors. The normalized rms emittance per lasersize, shown in Fig. 15(b), was found to be 0:73�0:06 mmmrad=mmðrmsÞ at 532 nm. We did not intend toperform a rigorous thermal emittance measurement; how-ever our normalized rms emittance per laser size values isreasonable considering previously reported thermal emit-tance values [2]. Emittance measurements are summarizedin Table II.
G. Surface morphology
After beam-basedmeasurements, each photocathodewasmoved via the vacuum transfer suitcase to another buildingfor evaluation of the surface morphology using a scanningelectronmicroscope (SEM)with an energy-dispersive x-rayspectroscopy (EDS) attachment. To reduce the likelihood ofphotocathode oxidation, an argon-filled gloved bag wasused to transfer the samples into the SEM. The transfertook approximately 2 minutes and once inside the SEM,samples were exposed to�10�6 Torr vacuum.
1. Photocathode #1
It must be noted that, after performing the charge life-time measurements described above, photocathode #1 was
TABLE II. Geometric normalized rms emittance measurement summary. � EC is the laser spot distance from the electrostaticcenter. For comparison we have also listed published thermal emittance values [2].
Normalized rms emittance (mmmrad)
� EC
(mm) � (nm)
Laser size
(FWHM) �m HV (kV) Puck 1 Puck 2
Puck 2 after
160 hr, 1 mA � (nm)
Thermal emittance
(mmmrad=mmðrmsÞ) [2]0 532 500 100 0:15� 0:01 532 0:56� 0:03
2 532 500 100 0:16� 0:02 0:16� 0:02 473 0:69� 0:03
2 532 1050 100 0:39� 0:02 405 0:87� 0:04
2 532 1050 200 0:40� 0:08
3 532 500 100 0:21� 0:02
3 532 500 200 0:18� 0:06
3 440 1010 100 0:50� 0:02
3 440 1010 200 0:41� 0:04
CHARGE LIFETIME MEASUREMENTS AT HIGH AVERAGE . . . Phys. Rev. ST Accel. Beams 16, 033401 (2013)
033401-11
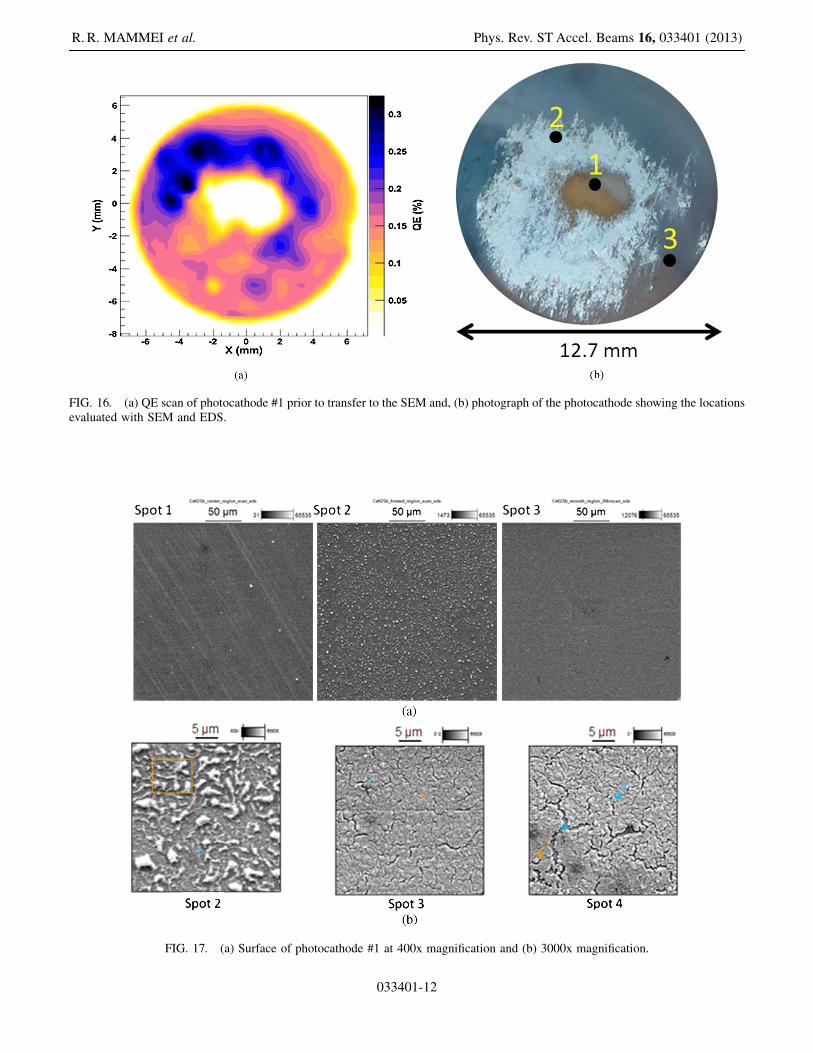
FIG. 16. (a) QE scan of photocathode #1 prior to transfer to the SEM and, (b) photograph of the photocathode showing the locationsevaluated with SEM and EDS.
FIG. 17. (a) Surface of photocathode #1 at 400x magnification and (b) 3000x magnification.
R. R. MAMMEI et al. Phys. Rev. ST Accel. Beams 16, 033401 (2013)
033401-12
subjected to global heating inside the photogun highvoltage chamber, in a failed attempt to quantify K2CsSbphotcathode lifetime as a function of vacuum level.Specifically, the NEG pumps were heated to approximately100�C to liberate hydrogen in a relatively controlled man-ner. An inadvertent consequence was that the photocathodewas heated too. In addition, a relatively small amount of Cs(� one monolayer) was applied to the entire surface in anattempt to restore QE. These activities reduced QE by afactor of 3 [Fig. 16(a)] and likely had some impact on thechemical composition, however surface science evaluationwas still deemed worthwhile.
Surface topography and chemical composition wereevaluated at four locations using a 10 keV electron beam(Fig. 16), corresponding to the center of the photocathodethat suffered nearly complete QE elimination during the
vacuum event that occurred when beam was missteeredinto the beam line, two locations representative of wheremost of the production beam delivery occurred and aregion that was protected behind the cathode electrode[not shown in Fig. 16(b)].Figure 17 shows images of locations 1, 2, and 3 at 400x
magnification and locations 2, 3, and 4 at 3000x magnifi-cation. Figure 18 shows the atom percent composition asdetermined by EDS x-ray data which confirms that loca-tion 1 is purely stainless steel, indicating the vacuumevent was severe enough to sputter away the entire photo-cathode layer. Importantly, the rest of the cathode survivedthis major event, which would have completely destroyedthe negative electron affinity surface condition of a GaAsphotocathode. The 3000x image of location 2 indicatesislands of Cs, K, and Sb (the white flakes), with stainlesssteel and Sb in between (the darker regions), as comparedto locations 3 and 4 which show a more uniform photo-cathode layer with some cracks exposing the stainless steelsubstrateunderneath. Interestingly, location 2 still exhibits consid-erable QE.
2. Photocathode #2
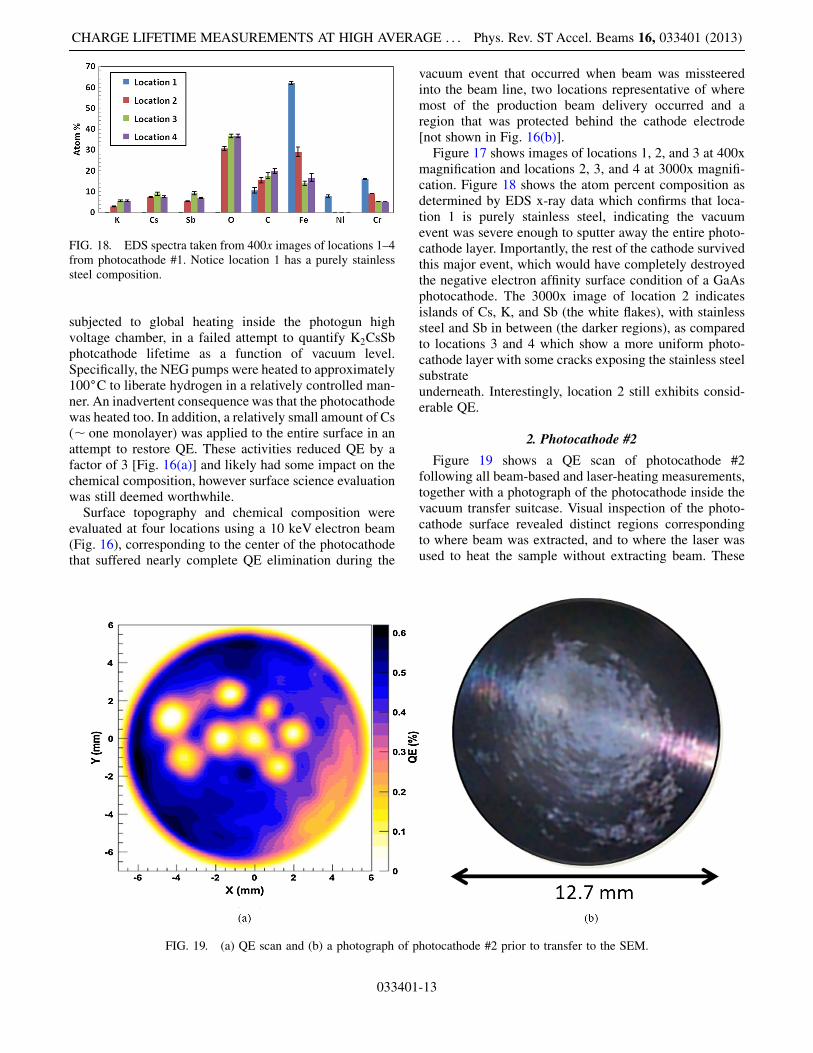
Figure 19 shows a QE scan of photocathode #2following all beam-based and laser-heating measurements,together with a photograph of the photocathode inside thevacuum transfer suitcase. Visual inspection of the photo-cathode surface revealed distinct regions correspondingto where beam was extracted, and to where the laser wasused to heat the sample without extracting beam. These
FIG. 18. EDS spectra taken from 400x images of locations 1–4from photocathode #1. Notice location 1 has a purely stainlesssteel composition.
FIG. 19. (a) QE scan and (b) a photograph of photocathode #2 prior to transfer to the SEM.
CHARGE LIFETIME MEASUREMENTS AT HIGH AVERAGE . . . Phys. Rev. ST Accel. Beams 16, 033401 (2013)
033401-13
distinctive visual markers made it possible to study photo-cathode regions with known history, to distinguish thecharacteristics of the photocathode related to beam deliv-ery and laser heating from nominally unused locations.
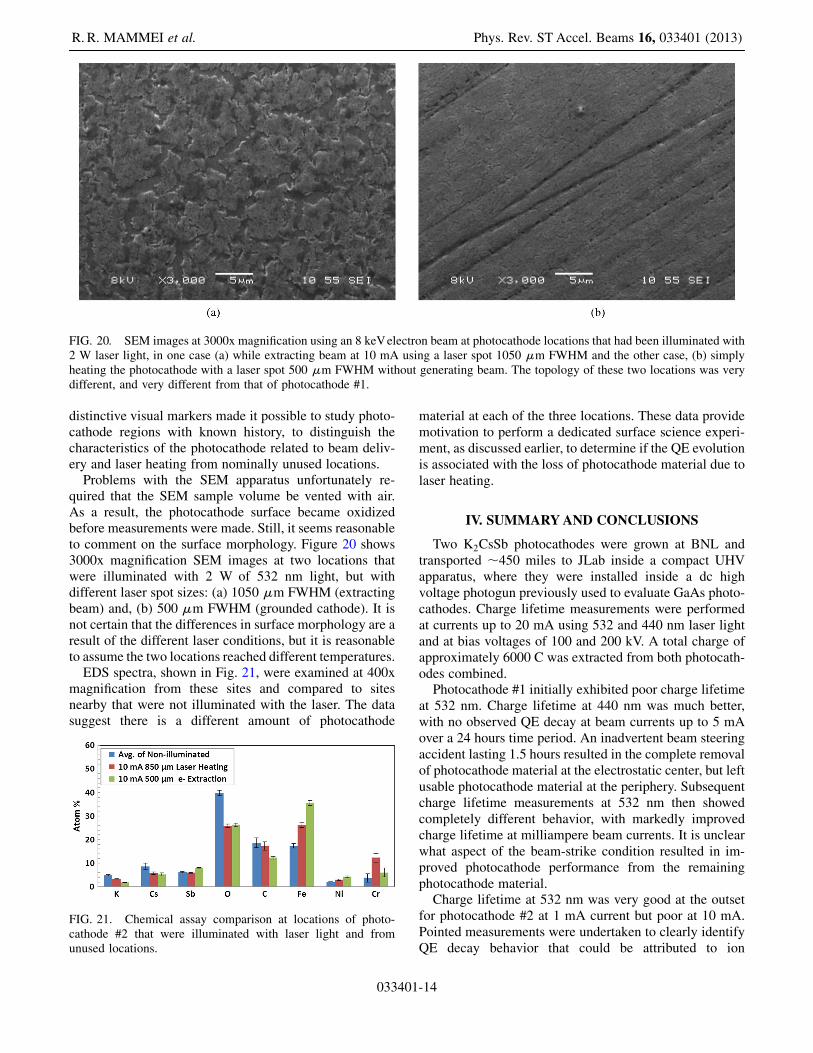
Problems with the SEM apparatus unfortunately re-quired that the SEM sample volume be vented with air.As a result, the photocathode surface became oxidizedbefore measurements were made. Still, it seems reasonableto comment on the surface morphology. Figure 20 shows3000x magnification SEM images at two locations thatwere illuminated with 2 W of 532 nm light, but withdifferent laser spot sizes: (a) 1050 �m FWHM (extractingbeam) and, (b) 500 �m FWHM (grounded cathode). It isnot certain that the differences in surface morphology are aresult of the different laser conditions, but it is reasonableto assume the two locations reached different temperatures.
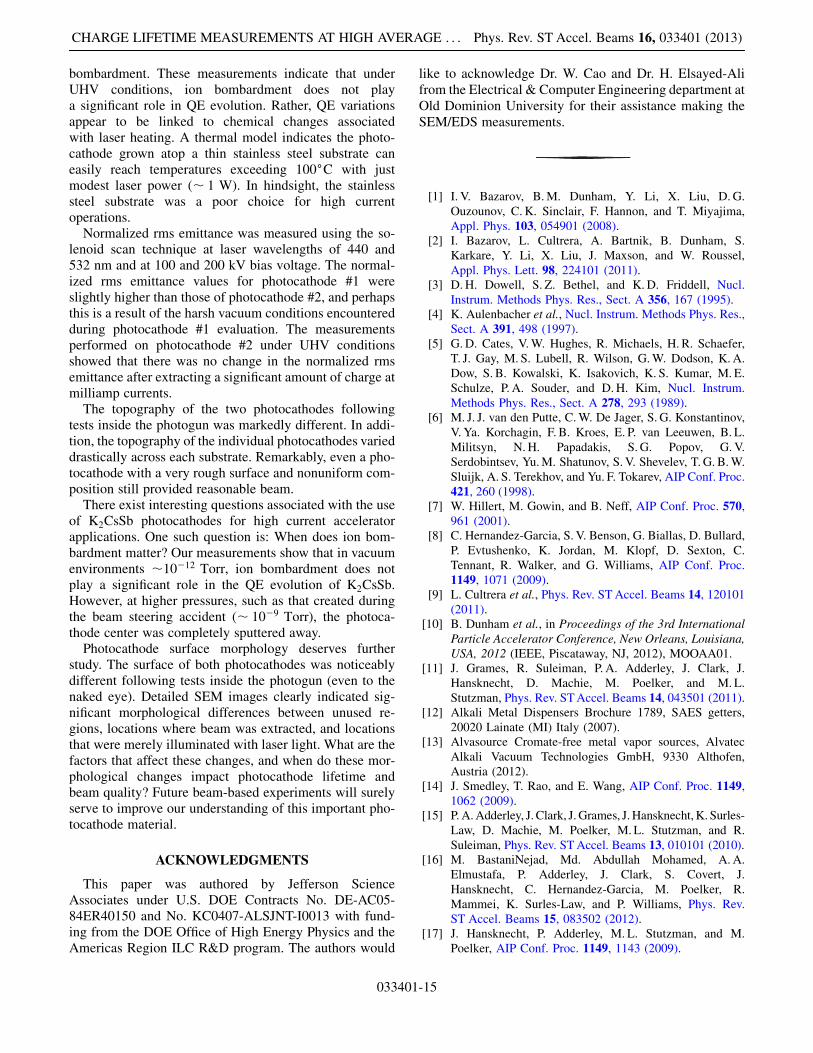
EDS spectra, shown in Fig. 21, were examined at 400xmagnification from these sites and compared to sitesnearby that were not illuminated with the laser. The datasuggest there is a different amount of photocathode
material at each of the three locations. These data providemotivation to perform a dedicated surface science experi-ment, as discussed earlier, to determine if the QE evolutionis associated with the loss of photocathode material due tolaser heating.
IV. SUMMARYAND CONCLUSIONS
Two K2CsSb photocathodes were grown at BNL andtransported �450 miles to JLab inside a compact UHVapparatus, where they were installed inside a dc highvoltage photogun previously used to evaluate GaAs photo-cathodes. Charge lifetime measurements were performedat currents up to 20 mA using 532 and 440 nm laser lightand at bias voltages of 100 and 200 kV. A total charge ofapproximately 6000 C was extracted from both photocath-odes combined.Photocathode #1 initially exhibited poor charge lifetime
at 532 nm. Charge lifetime at 440 nm was much better,with no observed QE decay at beam currents up to 5 mAover a 24 hours time period. An inadvertent beam steeringaccident lasting 1.5 hours resulted in the complete removalof photocathode material at the electrostatic center, but leftusable photocathode material at the periphery. Subsequentcharge lifetime measurements at 532 nm then showedcompletely different behavior, with markedly improvedcharge lifetime at milliampere beam currents. It is unclearwhat aspect of the beam-strike condition resulted in im-proved photocathode performance from the remainingphotocathode material.Charge lifetime at 532 nm was very good at the outset
for photocathode #2 at 1 mA current but poor at 10 mA.Pointed measurements were undertaken to clearly identifyQE decay behavior that could be attributed to ion
FIG. 20. SEM images at 3000x magnification using an 8 keVelectron beam at photocathode locations that had been illuminated with2 W laser light, in one case (a) while extracting beam at 10 mA using a laser spot 1050 �m FWHM and the other case, (b) simplyheating the photocathode with a laser spot 500 �m FWHM without generating beam. The topology of these two locations was verydifferent, and very different from that of photocathode #1.
FIG. 21. Chemical assay comparison at locations of photo-cathode #2 that were illuminated with laser light and fromunused locations.
R. R. MAMMEI et al. Phys. Rev. ST Accel. Beams 16, 033401 (2013)
033401-14
bombardment. These measurements indicate that underUHV conditions, ion bombardment does not playa significant role in QE evolution. Rather, QE variationsappear to be linked to chemical changes associatedwith laser heating. A thermal model indicates the photo-cathode grown atop a thin stainless steel substrate caneasily reach temperatures exceeding 100�C with justmodest laser power (� 1 W). In hindsight, the stainlesssteel substrate was a poor choice for high currentoperations.
Normalized rms emittance was measured using the so-lenoid scan technique at laser wavelengths of 440 and532 nm and at 100 and 200 kV bias voltage. The normal-ized rms emittance values for photocathode #1 wereslightly higher than those of photocathode #2, and perhapsthis is a result of the harsh vacuum conditions encounteredduring photocathode #1 evaluation. The measurementsperformed on photocathode #2 under UHV conditionsshowed that there was no change in the normalized rmsemittance after extracting a significant amount of charge atmilliamp currents.
The topography of the two photocathodes followingtests inside the photogun was markedly different. In addi-tion, the topography of the individual photocathodes varieddrastically across each substrate. Remarkably, even a pho-tocathode with a very rough surface and nonuniform com-position still provided reasonable beam.
There exist interesting questions associated with the useof K2CsSb photocathodes for high current acceleratorapplications. One such question is: When does ion bom-bardment matter? Our measurements show that in vacuumenvironments �10�12 Torr, ion bombardment does notplay a significant role in the QE evolution of K2CsSb.However, at higher pressures, such as that created duringthe beam steering accident (� 10�9 Torr), the photoca-thode center was completely sputtered away.
Photocathode surface morphology deserves furtherstudy. The surface of both photocathodes was noticeablydifferent following tests inside the photogun (even to thenaked eye). Detailed SEM images clearly indicated sig-nificant morphological differences between unused re-gions, locations where beam was extracted, and locationsthat were merely illuminated with laser light. What are thefactors that affect these changes, and when do these mor-phological changes impact photocathode lifetime andbeam quality? Future beam-based experiments will surelyserve to improve our understanding of this important pho-tocathode material.
ACKNOWLEDGMENTS
This paper was authored by Jefferson ScienceAssociates under U.S. DOE Contracts No. DE-AC05-84ER40150 and No. KC0407-ALSJNT-I0013 with fund-ing from the DOE Office of High Energy Physics and theAmericas Region ILC R&D program. The authors would
like to acknowledge Dr. W. Cao and Dr. H. Elsayed-Alifrom the Electrical & Computer Engineering department atOld Dominion University for their assistance making theSEM/EDS measurements.
[1] I. V. Bazarov, B.M. Dunham, Y. Li, X. Liu, D. G.
Ouzounov, C. K. Sinclair, F. Hannon, and T. Miyajima,
Appl. Phys. 103, 054901 (2008).[2] I. Bazarov, L. Cultrera, A. Bartnik, B. Dunham, S.
Karkare, Y. Li, X. Liu, J. Maxson, and W. Roussel,
Appl. Phys. Lett. 98, 224101 (2011).[3] D. H. Dowell, S. Z. Bethel, and K.D. Friddell, Nucl.
Instrum. Methods Phys. Res., Sect. A 356, 167 (1995).[4] K. Aulenbacher et al., Nucl. Instrum. Methods Phys. Res.,
Sect. A 391, 498 (1997).[5] G. D. Cates, V.W. Hughes, R. Michaels, H. R. Schaefer,
T. J. Gay, M. S. Lubell, R. Wilson, G.W. Dodson, K. A.
Dow, S. B. Kowalski, K. Isakovich, K. S. Kumar, M. E.
Schulze, P. A. Souder, and D.H. Kim, Nucl. Instrum.
Methods Phys. Res., Sect. A 278, 293 (1989).[6] M. J. J. van den Putte, C.W. De Jager, S. G. Konstantinov,
V. Ya. Korchagin, F. B. Kroes, E. P. van Leeuwen, B. L.
Militsyn, N.H. Papadakis, S. G. Popov, G. V.
Serdobintsev, Yu.M. Shatunov, S. V. Shevelev, T. G. B.W.
Sluijk, A. S. Terekhov, and Yu. F. Tokarev, AIP Conf. Proc.
421, 260 (1998).[7] W. Hillert, M. Gowin, and B. Neff, AIP Conf. Proc. 570,
961 (2001).[8] C. Hernandez-Garcia, S. V. Benson, G. Biallas, D. Bullard,
P. Evtushenko, K. Jordan, M. Klopf, D. Sexton, C.
Tennant, R. Walker, and G. Williams, AIP Conf. Proc.
1149, 1071 (2009).[9] L. Cultrera et al., Phys. Rev. STAccel. Beams 14, 120101
(2011).[10] B. Dunham et al., in Proceedings of the 3rd International
Particle Accelerator Conference, New Orleans, Louisiana,
USA, 2012 (IEEE, Piscataway, NJ, 2012), MOOAA01.[11] J. Grames, R. Suleiman, P. A. Adderley, J. Clark, J.
Hansknecht, D. Machie, M. Poelker, and M. L.
Stutzman, Phys. Rev. STAccel. Beams 14, 043501 (2011).[12] Alkali Metal Dispensers Brochure 1789, SAES getters,
20020 Lainate (MI) Italy (2007).[13] Alvasource Cromate-free metal vapor sources, Alvatec
Alkali Vacuum Technologies GmbH, 9330 Althofen,
Austria (2012).[14] J. Smedley, T. Rao, and E. Wang, AIP Conf. Proc. 1149,
1062 (2009).[15] P.A.Adderley, J. Clark, J.Grames, J.Hansknecht,K. Surles-
Law, D. Machie, M. Poelker, M.L. Stutzman, and R.
Suleiman, Phys. Rev. STAccel. Beams 13, 010101 (2010).[16] M. BastaniNejad, Md. Abdullah Mohamed, A. A.
Elmustafa, P. Adderley, J. Clark, S. Covert, J.
Hansknecht, C. Hernandez-Garcia, M. Poelker, R.
Mammei, K. Surles-Law, and P. Williams, Phys. Rev.
ST Accel. Beams 15, 083502 (2012).[17] J. Hansknecht, P. Adderley, M. L. Stutzman, and M.
Poelker, AIP Conf. Proc. 1149, 1143 (2009).
CHARGE LIFETIME MEASUREMENTS AT HIGH AVERAGE . . . Phys. Rev. ST Accel. Beams 16, 033401 (2013)
033401-15
[18] B.M. Dunham, Ph.D. thesis, University of Illinois atUrbana-Champaign, 1993.
[19] J. R. Howorth, A. L. Harmer, E.W. L. Trawny, R.Holtom, and C. J. R. Sheppard, Appl. Phys. Lett. 23, 123(1973).
[20] D. Motta and S. Schonert, Nucl. Instrum. Methods Phys.Res., Sect. A 539, 217 (2005).
[21] B. Karlsson and C.G. Ribbing, J. Appl. Phys. 53, 6340(1982).
[22] ANSYS�, Release 14.0, ANSYS Inc. (2012).
R. R. MAMMEI et al. Phys. Rev. ST Accel. Beams 16, 033401 (2013)
033401-16