Embed Size (px)
Citation preview
14th
LACCEI International Multi-Conference for Engineering, Education, and Technology: “Engineering Innovations for
Global Sustainability”, 20-22 July 2016, San José, Costa Rica.
Characterization of Rice Husk and the Crystallization
Process of Amorphous Silica from Rice Husk Ash Ana Rivas, PhD1, Grace Vera, Eng.2, Julio Caceres, Eng.3,Víctor Palacios MSc.4, Andrés Rigail PhD 5 Mauricio Cornejo PhD6
1 Escuela Superior Politécnica del Litoral, ESPOL, FIMCP, Campus Gustavo Galindo Km 30.5 Vía Perimetral, P.O. Box 09-01-
5863, Guayaquil, Ecuador. Universidad Simón Bolívar-Venezuela. [email protected] or [email protected] 6ESPOL-Ecuador. [email protected]
2 ESPOL. [email protected]. [email protected], Espol. [email protected]. ESPOL. [email protected].
Abstract– Rice husk (RH) is a rich silica by-product of rice
production with great potential for industrial applications. After
combustion, a rice husk ash rich in silica is obtained, with some
amount of other inorganic components constituted mainly of
alkaline elements. The study was conducted to characterize both
the rice husk and rice husk ash (RHA) in order to evaluate their
constitution and the form in which mentioned impurities are
present. The amorphous silica crystallized when heated under
certain conditions. In this way, the examination of the
crystallization process of rice husk ash with different impurity
levels was also carried out by varying the temperature, time and
heating conditions. The study reveals a preferential distribution of
silica at the cell tip of the outer RH surface cells. The impurities
form compounds with combinations of different elements such as
Ca and Mg, P and K, and are mainly localized below the inner
surface in the form of spherical and cuboidal shapes, as well as
irregular morphologies.
Digital Object Identifier (DOI):
http://dx.doi.org/10.18687/LACCEI2016.1.1.093
ISBN: 978-0-9822896-9-3
ISSN: 2414-6390
14th LACCEI International Multi-Conference for Engineering, Education, and Technology: “Engineering Innovations for
Global Sustainability”, 20-22 July 2016, San José, Costa Rica. 1
Characterization of Rice Husk and the Crystallization
Process of Amorphous Silica from Rice Husk Ash
Ana Rivas, PhD1, Grace Vera, Eng.2, Julio Caceres, Eng.3,Víctor Palacios MSc.4, Andrés Rigail PhD 5 Mauricio Cornejo PhD6 1 Escuela Superior Politécnica del Litoral, ESPOL, FIMCP, Campus Gustavo Galindo Km 30.5 Vía Perimetral, P.O. Box 09-01-
5863, Guayaquil, Ecuador. Universidad Simón Bolívar-Venezuela. [email protected] or [email protected] 6ESPOL-Ecuador. [email protected]
2 ESPOL. [email protected]. [email protected], Espol. [email protected]. ESPOL. [email protected].
Abstract– Rice husk (RH) is a rich silica by-product of rice
production with great potential for industrial applications. After
combustion, a rice husk ash rich in silica is obtained, with some
amount of other inorganic components constituted mainly of
alkaline elements. The study was conducted to characterize both
the rice husk and rice husk ash (RHA) in order to evaluate their
constitution and the form in which mentioned impurities are
present. The amorphous silica crystallized when heated under
certain conditions. In this way, the examination of the
crystallization process of rice husk ash with different impurity
levels was also carried out by varying the temperature, time and
heating conditions. The study reveals a preferential distribution of
silica at the cell tip of the outer RH surface cells. The impurities
form compounds with combinations of different elements such as
Ca and Mg, P and K, and are mainly localized below the inner
surface in the form of spherical and cuboidal shapes, as well as
irregular morphologies.
. I. INTRODUCTION
Rice is harvested in large amounts worldwide, being the
world paddy production in 2015 around 740 million tonnes.
Rice hush (RH) represents about 20% of the rice grains, from
which near 30 million tonnes of ash is feasible to obtain (20%
of rice husk). Rice husk, besides organic components
constituted by cellulose, lignin and hemicellulose, also
contains around 20% of silica (SiO2). The combustion of
organic components at temperatures between 550 and 700°C
leads to rich silica ash (SiO2) in an amorphous state. In this
regard, unique characteristics of rice husk ash (RHA), such as
high silica contents (87– 97 wt. % SiO2), high porosity, low
density, high surface area and low thermal conductivity makes
it an alternative material for a variety of industrial applications
[1]. During heating, the amorphous silica becomes crystalline, and the transition temperature for this transformation, as well
as the type of phases formed, are highly affected by the level
of impurities present in the RHA. The impurities commonly
present in RHA are K, Ca, P and Fe in oxide form. These
substances promote the formation of cristobalite and trydimite
[2, affecting the structural transformation of silica from
amorphous to crystalline state [3. Additionally, the
composition of RH is not unique, it varies depending on paddy
type and source, soil fertilizers, climate conditions and sample
preparation, among others [4.
Silica in the amorphous state is preferred for some
potential applications of RHA, such as nitrides, carbides and
other inorganic materials [5. Thus, for those applications, it is
of great interest to establish the most favorable conditions to
keep the RHA silica in the amorphous state. In recent studies
[6], the authors evaluated the evolution of silica crystallization
by continuous heating in situ from room temperature to
1450°C, highlighting the effect of impurity levels in this
process. The transition temperature could also be affected by
the heating mode. In this regard, the main purpose of this study
is to evaluate the effect of isothermal heating on the
amorphous- crystalline transformation of amorphous silica rich
RHA. Moreover, the influence of different impurity
concentration levels on amorphous- crystalline transformation
will be assessed and the results are compared with those
previously obtained by dynamic in situ heating. Furthermore,
given the importance of the initial features of the rice hush on
the amorphous to crystalline transformation, especially the
impurities present in the material, a characterization of the
samples was also performed by Fourier Transform Infrared
(FTIR) Spectroscopy, Scanning Electron Microscopy (SEM)
and X-Ray diffraction (XRD). The emphasis in the
characterization was placed on the silicon distribution and type
of impurities in the samples.
II. EXPERIMENTAL PROCEDURE
The procedure followed to prepare the samples is showed
in Figure 1. Rice husk, collected from a rice mill in the region
of Taura, Guayas-Ecuador, was washed in distillated water and
dried. A portion of this sample was then pulverized to a
granulometry lower than 40µm, from which some samples
were prepared for Fourier Transform Infrared (FTIR) analysis,
with a Thermo Scientific Nicolet iS10-FTIR Spectrometer.
Additionally, A single unit of rice hush in the as-received
condition was analyzed by scanning electron microscopy
(SEM), using a FEI- Inspect and Phenom 1255 microscopes.
A fraction of the washed and dried sample was directly
calcinated at 650°C during 3h, and a second one was purified
previous calcination, in a 1NHCl water solution during 16h.
After the calcination process, these samples, labelled Sample 1 Digital Object Identifier (DOI): http://dx.doi.org/10.18687/LACCEI2016.1.1.093ISBN: 978-0-9822896-9-3ISSN: 2414-6390
14th LACCEI International Multi-Conference for Engineering, Education, and Technology: “Engineering Innovations for
Global Sustainability”, 20-22 July 2016, San José, Costa Rica. 2
and Sample 2, respectively, were analysed by a SEM Phenom
1255 microscope. Subsequently, both samples were subjected
to static annealing to evaluate the crystallization process of the
amorphous silica present in RHA. This heat treatment was
performed in a furnace at temperatures between 800 and
1000°C during 2 and 6h, in order to evaluate the effect of
temperature and soaking time on crystallization. After
annealing some samples were analysed by X-ray diffraction
(XRD), using a Panalytical X'Pert (40 kV, 30 mA) X-ray
diffractometer. Scans were taken with a 2θ, step size of 0,017
and a counting time per step of 0,1s using a Cu-Kα radiation
source (λ=1.542 Å). The isothermal crystallization results were
then compared with those obtained by continuous heating
carried out in situ, from room temperature up to 1450°C [6].
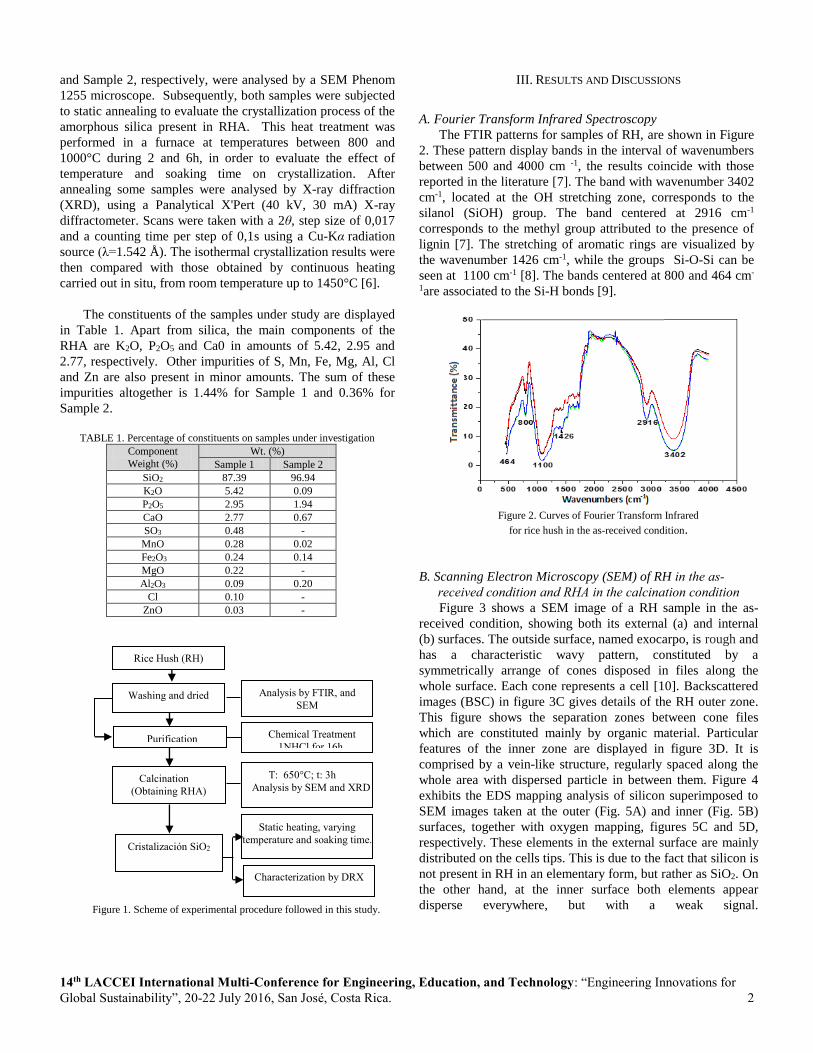
The constituents of the samples under study are displayed
in Table 1. Apart from silica, the main components of the
RHA are K2O, P2O5 and Ca0 in amounts of 5.42, 2.95 and
2.77, respectively. Other impurities of S, Mn, Fe, Mg, Al, Cl
and Zn are also present in minor amounts. The sum of these
impurities altogether is 1.44% for Sample 1 and 0.36% for
Sample 2.
TABLE 1. Percentage of constituents on samples under investigation
Component
Weight (%)
Wt. (%)
Sample 1 Sample 2
SiO2 87.39 96.94
K2O 5.42 0.09
P2O5 2.95 1.94
CaO 2.77 0.67
SO3 0.48 -
MnO 0.28 0.02
Fe2O3 0.24 0.14
MgO 0.22 -
Al2O3 0.09 0.20
Cl 0.10 -
ZnO 0.03 -
Figure 1. Scheme of experimental procedure followed in this study.
III. RESULTS AND DISCUSSIONS
A. Fourier Transform Infrared Spectroscopy
The FTIR patterns for samples of RH, are shown in Figure
2. These pattern display bands in the interval of wavenumbers
between 500 and 4000 cm -1, the results coincide with those
reported in the literature [7]. The band with wavenumber 3402
cm-1, located at the OH stretching zone, corresponds to the
silanol (SiOH) group. The band centered at 2916 cm-1
corresponds to the methyl group attributed to the presence of
lignin [7]. The stretching of aromatic rings are visualized by
the wavenumber 1426 cm-1, while the groups Si-O-Si can be
seen at 1100 cm-1 [8]. The bands centered at 800 and 464 cm-
1are associated to the Si-H bonds [9].
Figure 2. Curves of Fourier Transform Infrared
for rice hush in the as-received condition.
B. Scanning Electron Microscopy (SEM) of RH in the as-
received condition and RHA in the calcination condition
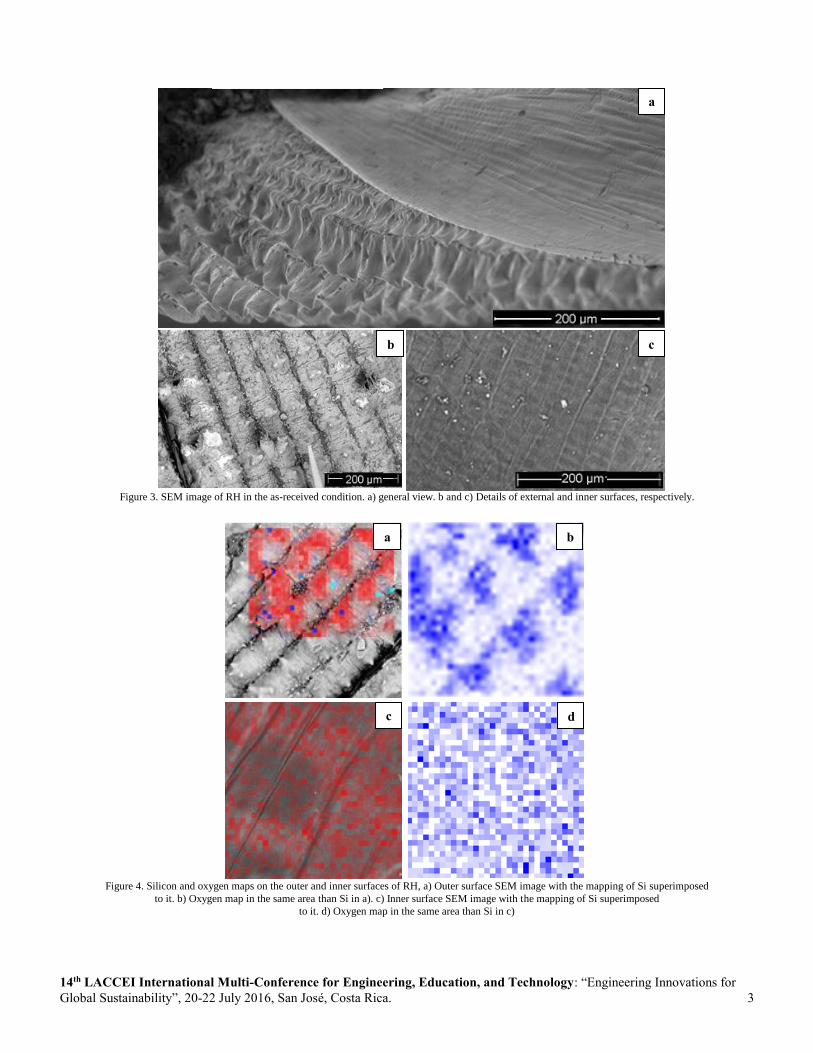
Figure 3 shows a SEM image of a RH sample in the as-
received condition, showing both its external (a) and internal
(b) surfaces. The outside surface, named exocarpo, is rough and
has a characteristic wavy pattern, constituted by a
symmetrically arrange of cones disposed in files along the
whole surface. Each cone represents a cell [10]. Backscattered
images (BSC) in figure 3C gives details of the RH outer zone.
This figure shows the separation zones between cone files
which are constituted mainly by organic material. Particular
features of the inner zone are displayed in figure 3D. It is
comprised by a vein-like structure, regularly spaced along the
whole area with dispersed particle in between them. Figure 4
exhibits the EDS mapping analysis of silicon superimposed to
SEM images taken at the outer (Fig. 5A) and inner (Fig. 5B)
surfaces, together with oxygen mapping, figures 5C and 5D,
respectively. These elements in the external surface are mainly
distributed on the cells tips. This is due to the fact that silicon is
not present in RH in an elementary form, but rather as SiO2. On
the other hand, at the inner surface both elements appear
disperse everywhere, but with a weak signal.
Rice Hush (RH)
Washing and dried
Purification
RHA
Cristalización SiO2
Chemical Treatment
1NHCl for 16h. XRanalysys
Calcination
(Obtaining RHA)
Static heating, varying
temperature and soaking time.
Characterization by DRX
T: 650°C; t: 3h
Analysis by SEM and XRD
Analysis by FTIR, and
SEM
14th LACCEI International Multi-Conference for Engineering, Education, and Technology: “Engineering Innovations for
Global Sustainability”, 20-22 July 2016, San José, Costa Rica. 3
Figure 3. SEM image of RH in the as-received condition. a) general view. b and c) Details of external and inner surfaces, respectively.
Figure 4. Silicon and oxygen maps on the outer and inner surfaces of RH, a) Outer surface SEM image with the mapping of Si superimposed
to it. b) Oxygen map in the same area than Si in a). c) Inner surface SEM image with the mapping of Si superimposed
to it. d) Oxygen map in the same area than Si in c)
a
b c
b
c
a
d
14th LACCEI International Multi-Conference for Engineering, Education, and Technology: “Engineering Innovations for
Global Sustainability”, 20-22 July 2016, San José, Costa Rica. 4
This suggests lower concentrations of silica in the interior of
the RH. The distribution of silica in RH results is coincident
with the reported by other researchers [11]. The silica together
with lignin, provides resistance and rigidity to RH [12, 13],
protecting the RH from the surroundings.
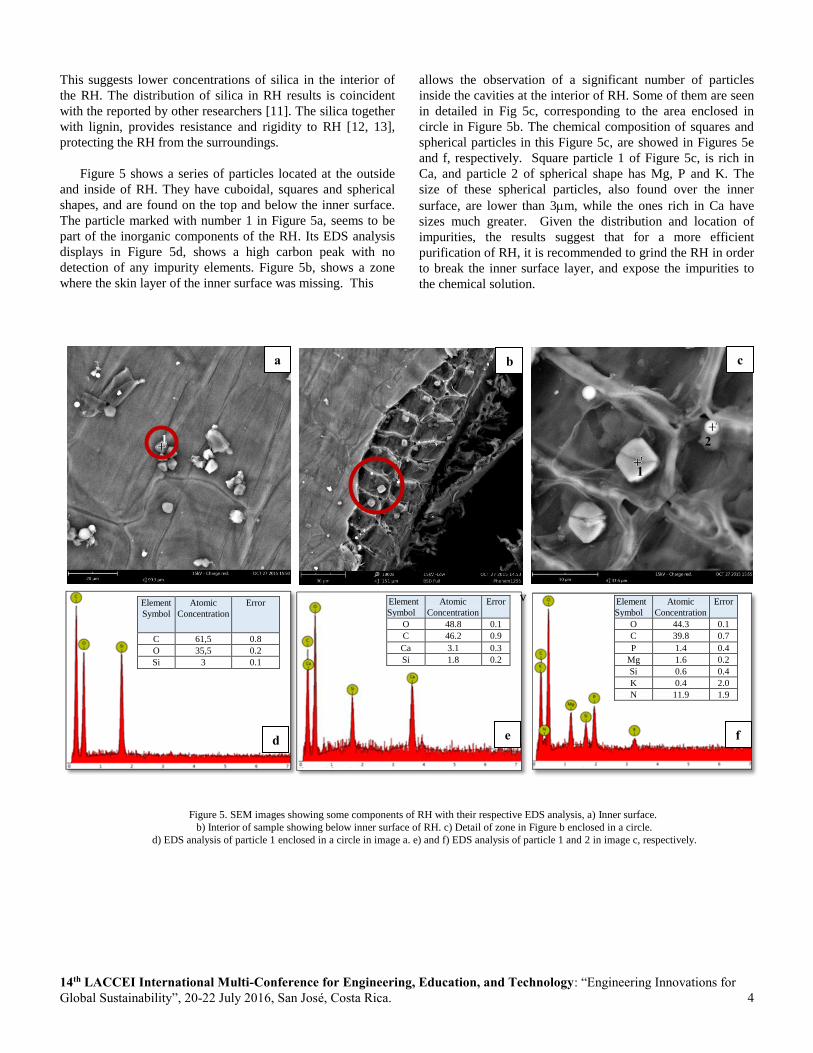
Figure 5 shows a series of particles located at the outside
and inside of RH. They have cuboidal, squares and spherical
shapes, and are found on the top and below the inner surface.
The particle marked with number 1 in Figure 5a, seems to be
part of the inorganic components of the RH. Its EDS analysis
displays in Figure 5d, shows a high carbon peak with no
detection of any impurity elements. Figure 5b, shows a zone
where the skin layer of the inner surface was missing. This
allows the observation of a significant number of particles
inside the cavities at the interior of RH. Some of them are seen
in detailed in Fig 5c, corresponding to the area enclosed in
circle in Figure 5b. The chemical composition of squares and
spherical particles in this Figure 5c, are showed in Figures 5e
and f, respectively. Square particle 1 of Figure 5c, is rich in
Ca, and particle 2 of spherical shape has Mg, P and K. The
size of these spherical particles, also found over the inner
surface, are lower than 3m, while the ones rich in Ca have
sizes much greater. Given the distribution and location of
impurities, the results suggest that for a more efficient
purification of RH, it is recommended to grind the RH in order
to break the inner surface layer, and expose the impurities to
the chemical solution.
v
Element
Symbol
Atomic
Concentration
Error
C 61,5 0.8
O 35,5 0.2
Si 3 0.1
Element
Symbol
Atomic
Concentration
Error
O 44.3 0.1
C 39.8 0.7
P 1.4 0.4
Mg 1.6 0.2
Si 0.6 0.4
K 0.4 2.0
N 11.9 1.9
Element
Symbol
Atomic
Concentration
Error
O 48.8 0.1
C 46.2 0.9
Ca 3.1 0.3
Si 1.8 0.2
Figure 5. SEM images showing some components of RH with their respective EDS analysis, a) Inner surface.
b) Interior of sample showing below inner surface of RH. c) Detail of zone in Figure b enclosed in a circle.
d) EDS analysis of particle 1 enclosed in a circle in image a. e) and f) EDS analysis of particle 1 and 2 in image c, respectively.
a b c
d e f
1
2 1
14th LACCEI International Multi-Conference for Engineering, Education, and Technology: “Engineering Innovations for
Global Sustainability”, 20-22 July 2016, San José, Costa Rica. 5
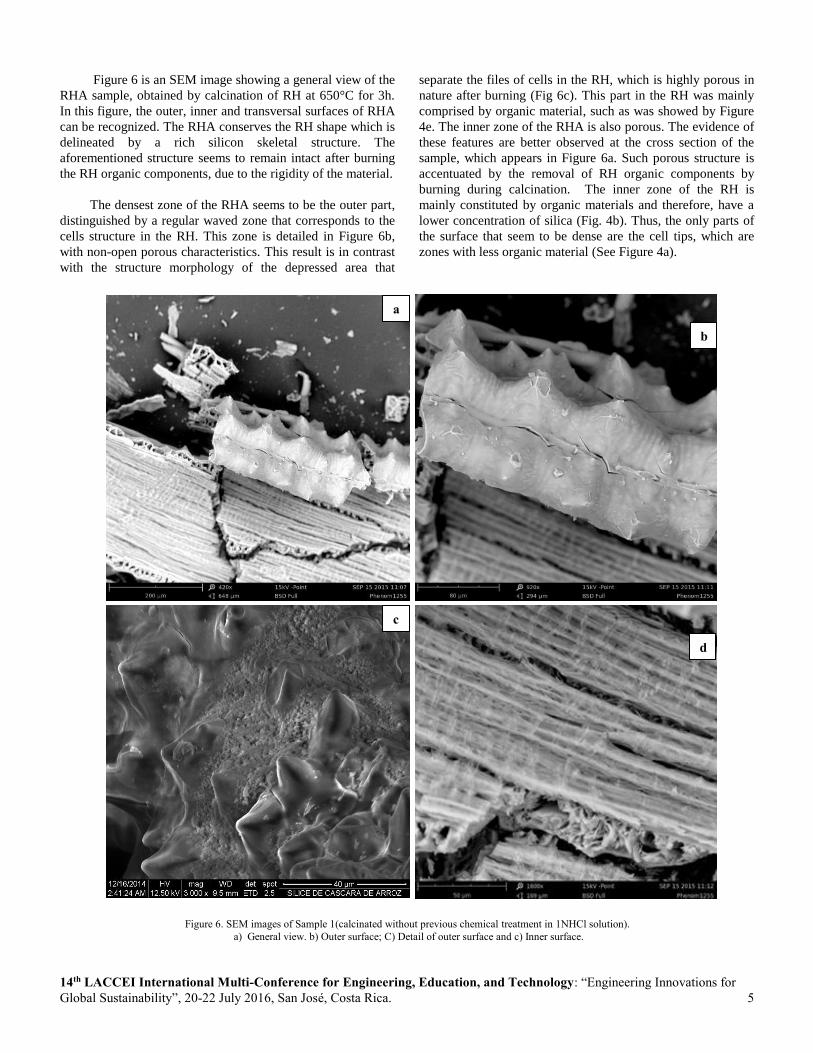
Figure 6 is an SEM image showing a general view of the
RHA sample, obtained by calcination of RH at 650°C for 3h.
In this figure, the outer, inner and transversal surfaces of RHA
can be recognized. The RHA conserves the RH shape which is
delineated by a rich silicon skeletal structure. The
aforementioned structure seems to remain intact after burning
the RH organic components, due to the rigidity of the material.
The densest zone of the RHA seems to be the outer part,
distinguished by a regular waved zone that corresponds to the
cells structure in the RH. This zone is detailed in Figure 6b,
with non-open porous characteristics. This result is in contrast
with the structure morphology of the depressed area that
separate the files of cells in the RH, which is highly porous in
nature after burning (Fig 6c). This part in the RH was mainly
comprised by organic material, such as was showed by Figure
4e. The inner zone of the RHA is also porous. The evidence of
these features are better observed at the cross section of the
sample, which appears in Figure 6a. Such porous structure is
accentuated by the removal of RH organic components by
burning during calcination. The inner zone of the RH is
mainly constituted by organic materials and therefore, have a
lower concentration of silica (Fig. 4b). Thus, the only parts of
the surface that seem to be dense are the cell tips, which are
zones with less organic material (See Figure 4a).
Figure 6. SEM images of Sample 1(calcinated without previous chemical treatment in 1NHCl solution).
a) General view. b) Outer surface; C) Detail of outer surface and c) Inner surface.
a
b
c
d
14th LACCEI International Multi-Conference for Engineering, Education, and Technology: “Engineering Innovations for
Global Sustainability”, 20-22 July 2016, San José, Costa Rica. 6
C. X ray diffraction of RHA in the calcination condition and
after isothermal heating
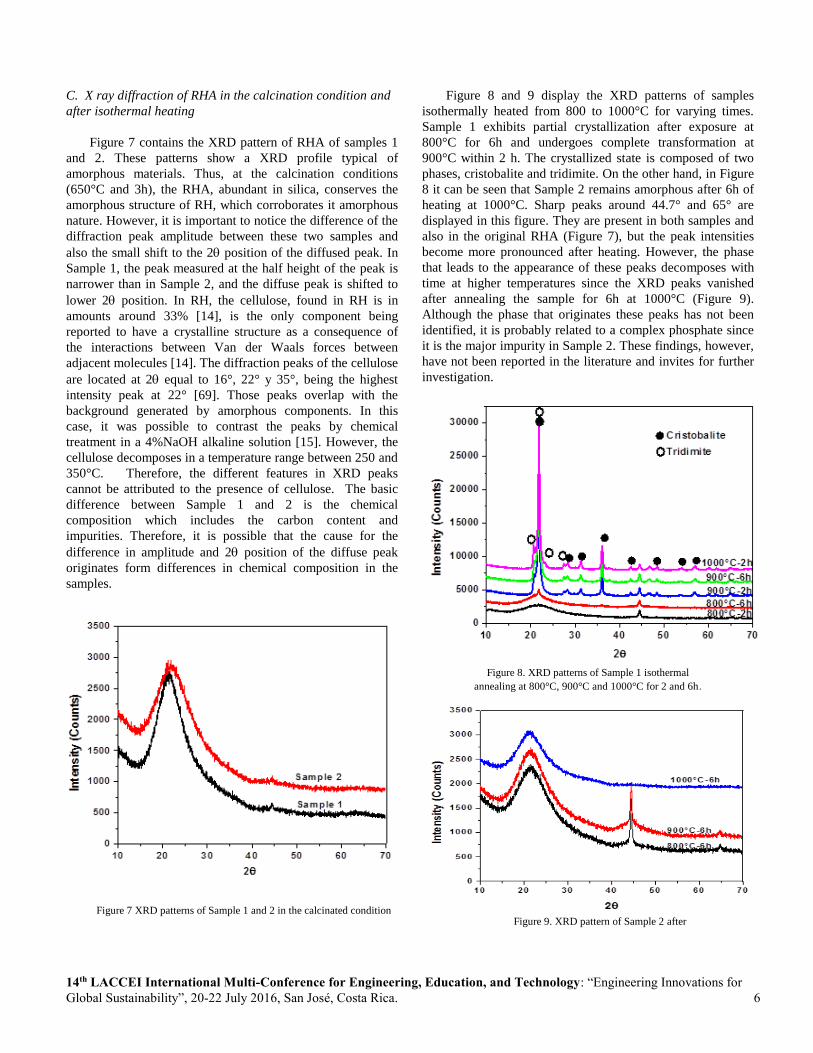
Figure 7 contains the XRD pattern of RHA of samples 1
and 2. These patterns show a XRD profile typical of
amorphous materials. Thus, at the calcination conditions
(650°C and 3h), the RHA, abundant in silica, conserves the
amorphous structure of RH, which corroborates it amorphous
nature. However, it is important to notice the difference of the
diffraction peak amplitude between these two samples and
also the small shift to the 2 position of the diffused peak. In
Sample 1, the peak measured at the half height of the peak is
narrower than in Sample 2, and the diffuse peak is shifted to
lower 2 position. In RH, the cellulose, found in RH is in
amounts around 33% [14], is the only component being
reported to have a crystalline structure as a consequence of
the interactions between Van der Waals forces between
adjacent molecules [14]. The diffraction peaks of the cellulose
are located at 2 equal to 16°, 22° y 35°, being the highest
intensity peak at 22° [69]. Those peaks overlap with the
background generated by amorphous components. In this
case, it was possible to contrast the peaks by chemical
treatment in a 4%NaOH alkaline solution [15]. However, the
cellulose decomposes in a temperature range between 250 and
350°C. Therefore, the different features in XRD peaks
cannot be attributed to the presence of cellulose. The basic
difference between Sample 1 and 2 is the chemical
composition which includes the carbon content and
impurities. Therefore, it is possible that the cause for the
difference in amplitude and 2 position of the diffuse peak
originates form differences in chemical composition in the
samples.
Figure 7 XRD patterns of Sample 1 and 2 in the calcinated condition
Figure 8 and 9 display the XRD patterns of samples
isothermally heated from 800 to 1000°C for varying times.
Sample 1 exhibits partial crystallization after exposure at
800°C for 6h and undergoes complete transformation at
900°C within 2 h. The crystallized state is composed of two
phases, cristobalite and tridimite. On the other hand, in Figure
8 it can be seen that Sample 2 remains amorphous after 6h of
heating at 1000°C. Sharp peaks around 44.7° and 65° are
displayed in this figure. They are present in both samples and
also in the original RHA (Figure 7), but the peak intensities
become more pronounced after heating. However, the phase
that leads to the appearance of these peaks decomposes with
time at higher temperatures since the XRD peaks vanished
after annealing the sample for 6h at 1000°C (Figure 9).
Although the phase that originates these peaks has not been
identified, it is probably related to a complex phosphate since
it is the major impurity in Sample 2. These findings, however,
have not been reported in the literature and invites for further
investigation.
Figure 8. XRD patterns of Sample 1 isothermal
annealing at 800°C, 900°C and 1000°C for 2 and 6h.
Figure 9. XRD pattern of Sample 2 after
14th LACCEI International Multi-Conference for Engineering, Education, and Technology: “Engineering Innovations for
Global Sustainability”, 20-22 July 2016, San José, Costa Rica. 7
Isothermal annealing at 800, 900 and 1000°C for 6h.
Table 1 shows the difference in chemical composition of
the samples under investigation. The main impurity in Sample
1 is K, found in a dioxide form; its concentration in Sample 1
is 5.42%, while in Sample 2 is less than 0. 10%. As previously
pointed out, the presence of alkaline elements promotes
crystallization of amorphous silica at lower temperatures [16].
This behavior is due to their decomposition at low
temperatures, which may produce low melting eutectic
compounds with silica, thus favoring crystallization.
Therefore, the results obtained upon isothermal heating are
consistent with those expected. Sample 1 with higher amounts
of impurities exhibited a transition from amorphous to
crystalline phase at much lower temperatures than Sample 2.
Moreover, at high temperatures the content of low melting
impurities such as those based on potassium may decrease,
which may raise the crystallization temperature.
Comparing these results of the crystallization
temperatures of samples subjected to isothermal heating with
those obtained by dynamic heating, it is found that the
crystallization of amorphous silica, beside time and
temperature, is also dependent on heating condition. It was
found in previous work [6] that in Sample 1, the first trace of
crystallization appears at 900°C and became entirely
crystalline at 1200°C, when heated continuously. On the other
hand, in isothermal annealing, it starts to transform from
amorphous to crystalline after 6h at 800°C and the
transformation is completed after 2h at 900°C. In contrast,
Sample 2, begins to crystallize at temperatures greater than
1000°C in both continuous and isothermal heating.
Therefore, in contrast with Sample 1, Sample 2 has an
isothermal starting crystallization temperature above 1000°C,
similar to dynamic heating. This results could be associated
with the increase in sample purity of Sample 2 at high
temperatures, probably due to the decomposition of some
impurity compounds present in the sample and subsequent
evaporation. Such could be the case of the phase associated to
the sharp peak located at 44.7° and 65° that disappears at
1000°C (Figure 9). It has been demonstrated that the higher
the purity level of RHA, the higher the transition temperature
from amorphous to crystalline is.
CONCLUSIONS
The silicon in RH is mainly concentrated at the tips of the
cells located at the RH outer surface, with less content of
organic material.
The impurities in the RH sample are located at the inner
surface and in the interior, they exhibit different shapes and
chemical compositions.
The crystallization process of RHA amorphous silica
depends on its chemical composition, time, temperature and
heating condition. The sample with greater levels of
impurities and static heating, crystallize at lower temperatures.
The crystallization temperature of amorphous RHA is raised
with the increase in purity levels, while heating conditions do
not show a remarkable influence.
ACKNOWLEDGMENT
The authors are thankful to the following institutions in Ecuador:
Prometeo program of SENESCYT for sponsoring the present research;
LEMAT- ESPOL for the support with the experimental work and X-Ray
Diffraction; ANDEC S.A for the X-ray Fluorescence analysis and to
Nanoinstrumentos for SEM + EDS analysis.
REFERENCES
[1] N. Soltani, A. Bahrami, M.I. Pech-Canul, L.A. Gonzalez. Review on the
physicochemical treatments of rice husk for production of advanced
materials. Chemical Engineering Journal 264 (2015) 899–935.
[2] Masashi HIGUCHI and Yasuo AZUMA. Journal of the Ceramic Society
of Japan, 105 [5] (1997) 385-390 (in Japanese).
[3] Yasushi Shinohara and Norihiko Kohyama. Industrial Health, 42 (2004),
277–285,
[4] Iyenagbe B. Ugheoke and Othman MamatA critical assessment and new
research directions of rice husk silica processing methods and
propertiesMaejo Int. J. Sci. Technol. 2012, 6(03), 430-448.
[5] Chandrasekhar, K.G. Satyanarayana, P.N, Pramada and P. Raghavan.
Journal of Materials Science 38 (2003) 3159-3168.
[6] Ana Rivas, Grace Vera, Víctor Palacios, Mauricio Cornejo, Andrés
Rigail, Guillermo Solórzano. Phase transformation of amorphous rice
husk silica. Unpublished.
[7] M. G. A. Vieira, A. F. de Almeida Neto, M. G. Carlos da Silva. C.
Nóbrega and A. A. Melo Filho. Characterization and use of in natura
and calcined rice husks for biosorption of heavy metals ions from
aqueous effluents. Brazilian Journal of Chemical Engineering. Vol. 29,
No. 03, (212) 619 – 633.
[8] C. R. T. Tarley, y M. A. Z. Arruda, Biosorption of heavy metals using
rice milling by-products. Characterization and application for removal
of metals from aqueous effluents. Chemosphere, 54 (2004). 987-995.
[9] W. Nakbanpote, B.A. Goodman, Thiravetyan y Cooper adsorption on
rice husk derived materials studied by EPR and FTIR. Colloids Surf, A.
304, 7-13 (2007).
[10] D. Napierska, L.C.J Thomassen, D. Lison, J. A Martens y P. H Hoet. La
cascarilla de arroz como fuente de SiO2. Rev. Fac. Ing. Univ. Antioquia.
N.o 41. pp. 7-20 (2007).
[11] B.-Dae Park , S. Gon Wi, Kwang H. Lee, A. P. Singh , T. H Yoonc, Y.
S. Kim. Characterization of anatomical features and silica distribution in
rice husk using microscopic and micro-analytical techniques, 1.
Biomass and Bioenergy, Volume 25, Issue 3, September 2003, Pages
319–327.
[12] R.A. Ruseckaite, E. Ciannamea, P. Leiva, P.M. Stefan. Particle boards
based on rice husk Polymer and Biopolymer Analysis and
Characterization. Nova Science Publishing, Inc., New York. pp. 1-12.
[13] L. Ludeña, D. Fasce, V.A. Alvarez y P. M. Stefani. Nanocellulose from
rice husk following alkaline treatment to remove silica. BioResources.
6(2). 1440-1453. (2011).
[14] J. Nurain, A. Ishak y D. Alain. Extraction, preparation and
characterization of cellulose fibres and nanocrystals from rice husk.
Industrial Crops and Products 37 (2012) 93– 99.
14th LACCEI International Multi-Conference for Engineering, Education, and Technology: “Engineering Innovations for
Global Sustainability”, 20-22 July 2016, San José, Costa Rica. 8
[15] Z., Y.P., Lynd, L.R., 2004. Toward an aggregated understanding of
enzymatic hydrolysis of cellulose: noncomplex cellulose system.
Biotechnology. Bioeng. 88(7) (2004), 797–824
[16] Omatola, K. M1 and Onojah, A. D.2. Elemental analysis of rice husk
ash using X-ray fluorescence technique. International Journal of Physical
Sciences, 4 (4), (2009) 189-193.