Embed Size (px)
Citation preview
Synthesis of High Purity Silicon from Rice Husks
by
Kingsley Kweku Larbi
A thesis submitted in conformity with the requirements
for the degree of Master of Applied Science
Graduate Department of Materials Science and Engineering University of Toronto
© Copyright by Kingsley Kweku Larbi 2010
ii
Synthesis of High Purity Silicon from Rice Husks
Kingsley Kweku Larbi
Master of Applied Science
Department of Materials Science and Engineering
University of Toronto
2010
Abstract
Impurity optimized silicon is needed for the advancement of terrestrial photovoltaic power
generation. In this study the possibility of producing solar grade silicon from rice husks has been
pursued. An integrated process flowsheet was developed and practiced that included initial
leaching, reduction of Rice husk ash (RHA) and post-reduction purification of silicon.
Metallothermic reduction of purified RHA with magnesium was investigated within the
temperature range of 500-950 oC. The reduction product was purified by two stage acid leaching
sequence. Analysis of the final silicon powder product by XRD and ICP-OES showed crystalline
silicon with boron content to be less than 3ppm- corresponding to reduction by a factor greater
than 10, whilst the phosphorus content was reduced by a factor of over 20 and reaching less than
73ppm. The effects of temperature, magnesium amount and leaching agents optimized in this
study. A one step test melting was also carried out to convert the silicon powder into silicon
chunks.
iii
Acknowledgments With much gratitude I wish to thank several people and funding institutions who contributed in
no small ways to make this research project successful. Firstly, I sincerely thank Professor
Mansoor Barati and Professor Alex McLean for giving me the opportunity to work on this
project and under their joint supervision throughout my study period.
Secondly, I sincerely thank Dr. Hiroshi Sodha for constantly offering me his time and expert
advice on this project. A sincere gratitude is extended to members of my research group –
Sustainable Materials Processing Research Group, for their support and constructive criticism on
this project.
I wish to thank the MSE department as well for their timely technical and administrative support
throughout the course of this project
I wish to acknowledge the following individuals for providing me with training and technical
guidance on the analytical techniques presented in this work; George Kretschmann of Geology
Dept. (XRD), Dr. Srebri Petrov of Chemistry Dept.,(QXRD), Dr. Dan Mathers of Chemistry
Dept.,(ICP), Sal Boccia of MSE Dept (SEM), Dr. Yindong Yang of MSE Dept. (Leco carbon
analysis).
I am also thankful for the financial support and technical guidance from staff and people of
Process Research Ortech (PRO), especially Dr. Lakshmanan, Dr. Sridhar and Dr. Roy. I further
express my gratitude to Ontario Centers of Excellence and University of Toronto Open
Fellowships for their financial support.
Finally, I wish to thank my friends and family, especially my wife Mrs. Josephine Larbi for her
moral support and endurance of the late night hours I had to spend in the laboratory and away
from her.
iv
Table of Contents
Abstract .......................................................................................................................................... ii
Acknowledgments ........................................................................................................................ iii
Table of Contents ......................................................................................................................... iv
List of Tables .............................................................................................................................. viii
List of Figures ............................................................................................................................... ix
List of Appendices ....................................................................................................................... xii
CHAPTER ONE: Introduction .............................................................................................. 1
CHAPTER TWO: Literature Survey .................................................................................... 3
2.1 Sources of Silicon Raw Materials ........................................................................................ 3
2.2 Characteristics of Amorphous Silica .................................................................................... 3
2.3. Properties of Silicon ............................................................................................................ 5
2.4 Impurities in Bulk Crystalline Silicon .................................................................................. 9
2.5 Existing Silicon Manufacturing Technologies ................................................................... 11
2.5.1 Production of Metallurgical-grade Silicon (MG-Si) ................................................ 12
2.5.2 Production of Electronic grade Silicon (EG-Si) ...................................................... 14
2.6 Silicon Purification Techniques ......................................................................................... 16
2.7 Summary of Literature Review .......................................................................................... 17
CHAPTER THREE: Synthesis of Silicon from Rice Husk Ash ........................................ 18
3.1 Characteristics and Availability of Rice Husks ................................................................. 18
3.2 Silicon from Rice Husk - A Review of Literature ............................................................. 19
3.3 Silicon from Rice Husks - Summary ................................................................................. 22
3.4 Thermodynamics of Metallothermic Reactions for RHA (SiO2) ....................................... 22
CHAPTER FOUR: Experimental Work ............................................................................. 24
v
4.1 Materials and Reagents ...................................................................................................... 25
4.2 Sample Preparation – Rice Husk Ash ................................................................................ 26
4.2.1 Combustion of Rice Husks ...................................................................................... 26
4.2.2 Moisture Content Determination ............................................................................. 27
4.3 Characterization of RHA Sample ....................................................................................... 28
4.3.1 Chemical Composition Analysis .............................................................................. 28
4.3.2 Particle Size Analysis .............................................................................................. 28
4.3.3 Surface Area Measurement ...................................................................................... 29
4.3.4 XRD Analysis .......................................................................................................... 30
4.3.5 Scanning Electron Microscopy (SEM) Studies ....................................................... 30
4.4. Purification Treatment of RHA ......................................................................................... 31
4.4.1 Leaching of RHA ..................................................................................................... 31
4.4.2 Roasting of Acid Leached Ash ................................................................................ 32
4.5 Selection of Reducing Agent for RHA (SiO2) ................................................................... 33
4.6 Pelletizing of Reactants ...................................................................................................... 34
4.6.1 Determination of Percent Compaction and Porosity ............................................... 36
4.7 Reduction Experiments ...................................................................................................... 36
4.7.1 FactSage™ Study ..................................................................................................... 36
4.7.2 Differential Thermal Analysis DTA ........................................................................ 37
4.7.3 Reduction in Argon Atmosphere ............................................................................. 37
4.8 Quantitative XRD Analysis of Reduction Products ........................................................... 39
4.9 Post-Reduction Purification and Analyses ......................................................................... 40
4.9.1 Leaching of Reduction Products-Kinetic Study ...................................................... 40
4.9.2 Leaching of Reduction Products .............................................................................. 41
4.9.3 Sample Digestions for ICP-OES Analysis ............................................................... 43
4.10 Test Melting of Silicon Powders ...................................................................................... 44
vi
CHAPTER FIVE: Results and Discussion .......................................................................... 46
5.1 Optical Images of as-received Rice Husks Material .......................................................... 46
5.2 Characterization of As-received RHA ............................................................................... 47
5.2.1 Chemical Composition ............................................................................................. 47
5.2.2 Particle Size Analysis .............................................................................................. 49
5.2.3 XRD Analysis .......................................................................................................... 50
5.2.4 SEM Analysis of as-received RHA ......................................................................... 51
5.2.5 Surface Area Analysis .............................................................................................. 52
5.3. Purification of as-received RHA ....................................................................................... 54
5.3.1 Effect of Leaching Treatment .................................................................................. 55
5.3.2 Effect of Roasting Treatment ................................................................................... 56
5.3.3 Combined Effect of Purification Treatment ............................................................ 58
5.4. Pelletizing and Reduction of Reactants ............................................................................. 61
5.4.1 Pellet Properties ....................................................................................................... 61
5.4.2 Characteristics of Reduction Product ....................................................................... 63
5.4.3 Effect of Composition on Reduction Product .......................................................... 66
5.4.4 Effect of Temperature on Reduction Product .......................................................... 70
5.4.5 Reduction Mechanism ............................................................................................. 76
5.5 Post Reduction Purification ................................................................................................ 79
5.5.1 Effect of Reagent Type on Dissolution .................................................................... 82
5.5.2 Effect of Temperature on Rate Controlling Mechanism .......................................... 85
5.5.3 Fitting of Leaching Data to Transport Control Model ............................................. 87
5.6 Characterization of as-produced Silicon ............................................................................ 94
vii
CHAPTER SIX: Summary, Conclusions and Future Works .......................................... 103
6.1 Summary and Conclusions ....................................................................................... 103
6.2 Future Works ............................................................................................................ 105
References .............................................................................................................................. 106
viii
List of Tables
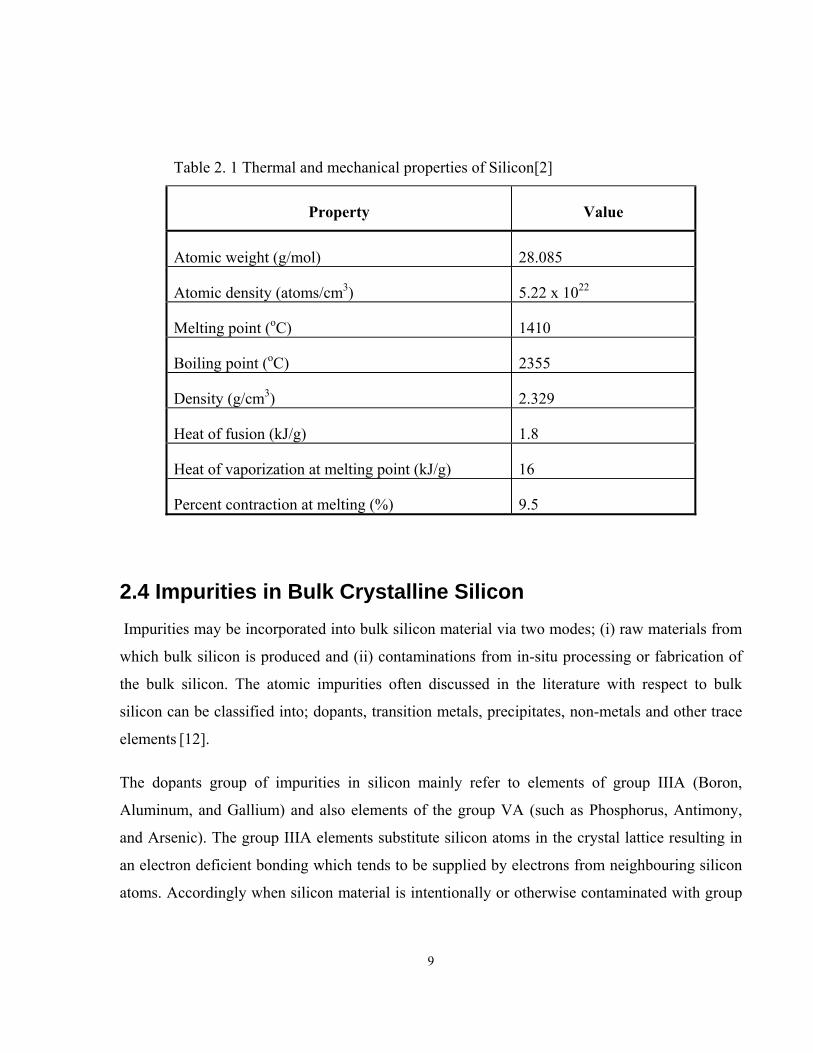
Table 2.1 Thermal and mechanical properties of silicon ................................................................ 9
Table 2.2 Impurities in metallurgical grade silicon ...................................................................... 13
Table 3.1 Typical proximate analysis of rice husks ...................................................................... 19
Table 3.2 Silica-metal reaction thermodynamic data* ................................................................. 23
Table 4.1 Summary of materials and reagents .............................................................................. 25
Table 5.1 Comparison of the main oxides present in as-received RHA ..................................... 47
Table 5.2 Comparison of elemental impurities present in as-received RHA............................... 48
Table 5. 3 Pellet making conditions .............................................................................................. 61
Table 5.4 Pellets properties ........................................................................................................... 62
Table 5.5 Effect of excess magnesium on phases in reduction product at 650⁰C ....................... 68
Table 5.6 Effect of temperature on phases in reduction product .................................................. 73
Table 5.7 Physico-chemical properties of R900 reduction sample ............................................... 79
Table 5.8 Leaching reagent type and effective concentrations ..................................................... 81
Table 5.9 Leaching data at different temperatures ...................................................................... 85
Table 5.10 Values of km and Ceq from excel solver ..................................................................... 92
Table 5.11 Particle size analysis of RH-Si .................................................................................... 98
Table 5.12 Chemical analysis of RH-Si ....................................................................................... 99
Table 5.13 Overall impurity reduction by process ..................................................................... 100
ix
List of Figures Figure 2.1 Typical XRD pattern of amorphous silica from RHA ................................................... 4
Figure 2.2 Diamond cubic lattice of crystalline silicon .................................................................. 5
Figure 2.3 Diamond cubic lattice of silicon with interatomic sites ................................................ 6
Figure 2.4 Energy band of crystalline silicon ................................................................................. 7
Figure 2.5 Free energy of formation of oxides of elements ............................................................ 8
Figure 2.6 Effect of metal atom impurities on p-type solar cells efficiency ................................. 11
Figure 2.7 Schematics of metallurgical grade silicon production process .................................... 14
Figure 2.8 Schematics of (a) Siemens reactor, (b) Czochralski crystal puller .............................. 15
Figure 3.1 XRD pattern of Magnesium reduced RHA at 620 oC ………………………..... 22
Figure 4.1 Scheme of experimental work……………………………………………………..... 24
Figure 4.2 Schematic of expanded Torbed reactor ...................................................................... 27
Figure 4.3 Leaching experiment set-up ........................................................................................ 32
Figure 4.4 Set-up for roasting of acid leached RHA .................................................................... 33
Figure 4.5 Si-O-Mg phase diagram at 650°C ............................................................................... 34
Figure 4.6 Set-up for pellet making .............................................................................................. 35
Figure 4.7 Schematic of reduction experimental set-up ............................................................... 38
Figure 4.8 Leaching kinetic study set-up ...................................................................................... 41
Figure 4.9 Schematic of leaching set-up ....................................................................................... 43
Figure 4.10 Test melting of as-produced silicon powder ............................................................. 45
Figure 5.1 Photographs of rice husks and rice husk ash (RHA).................................................. 46
Figure 5. 2 Particle size analysis of as-received RHA .................................................................. 50
Figure 5.3 XRD pattern of as-received RHA ............................................................................... 51
Figure 5.4 SEM micrograph of as-received RHA ........................................................................ 52
Figure 5.5 BET isotherm plot for as-received RHA .................................................................... 53
Figure 5.6 BET linear calculation model plot for as-received RHA ............................................ 54
Figure 5.7 Effect of leaching treatment on impurity reduction in as-received RHA .................... 55
Figure 5.8 Plot of % carbon removal from leached RHA ............................................................. 57
Figure 5.9 Comparison of metal oxides and carbon in treated/untreated RHA ............................ 58
Figure 5.10 Comparison of silica content in treated/untreated RHA ............................................ 59
Figure 5. 11 SEM micrograph (1500X) of leached and roasted RHA .......................................... 60
x
Figure 5.12 XRD pattern of leached and roasted RHA ................................................................ 60
Figure 5.13 Photograph of as-produced pelletized reactants ........................................................ 61
Figure 5.14 Plot of percent compaction against weight of pellet ................................................. 62
Figure 5.15 Photographs of typical reduction product .................................................................. 63
Figure 5.16 SEM micrographs of reduction product at 500X ...................................................... 64
Figure 5.17 EDX spectra of reduction product SEM micrograph in Figure 5.16 ......................... 65
Figure 5.18 FactSage™ calculation of effect of magnesium content on phases in reduction
product at 650 °C and inert atmosphere ................................................................................ 66
Figure 5.19 XRD pattern comparing effect of % excess magnesium on phases formed .............. 67
Figure 5.20 Experimentally measured effect of magnesium content on phases in reduction
product at 650 °C and in inert atmosphere ............................................................................ 69
Figure 5.21 Effect of magnesium-silica mole ratio on Si yield from reduction product .............. 70
Figure 5.22 FactSage™ calculation of effect of temperature on Mg2Si formation ...................... 71
Figure 5.23 FactSage™ calculation of effect of temperature on Si yield ..................................... 71
Figure 5.24 XRD pattern comparing effect of temperature on phases formed ............................. 72
Figure 5.25 Experimentally measured effect of temperature on Mg2Si phase formation in
reduction product under argon atmosphere ........................................................................... 74
Figure 5.26 Experimentally measured effect of temperature on Si yield in reduction product
under argon atmosphere ........................................................................................................ 75
Figure 5.27 DTA result of magnesium –RHA powder mixture (48 mg) ...................................... 76
Figure 5.28 Temperature-time plot for magnesium–RHA under argon atmosphere .................... 77
Figure 5.29 Pellet condition before and after on-set of reaction in pellet ..................................... 78
Figure 5.30 Effect of Reagent type 1 & II on dissolution ............................................................. 83
Figure 5.31 Effect of Reagent type III & IV on dissolution ......................................................... 83
Figure 5.32 Effect of [H+] concentration on fraction of Mg dissolved ......................................... 84
Figure 5.33 Plot of fraction dissolved against time ...................................................................... 87
Figure 5.34 Effect of temperature on dissolution of R900 sample ............................................... 91
Figure 5.35 Arrhenius plot for first stage leaching of reduction product ..................................... 93
Figure 5.36 As-produced silicon from rice husks ......................................................................... 95
Figure 5.37 Comparison of XRD patterns of as-produced Si to high purity Si standard ............. 96
Figure 5.38 SEM micrograph of RH- Si (taken at 500X) ............................................................. 97
Figure 5.39 Silicon chunks from melting of RH-Si .................................................................... 101

xi
Figure 5.40 SEM micrograph of polished RH-Si chunk ............................................................. 101
Figure5.41 EDX spectrum of black rectangle area of Figure 5.40 ............................................. 102
Figure 5.42 EDX spectrum of white rectangle area in Figure 5.40 ............................................ 102
Figure 6.1 Suggested integrated process for producing silicon from rice husks....................... 104
xii
List of Appendices
APPENDIX A : Effect of Sequence of Purification Treatment on Purity of RHA .................... 111
APPENDIX B : Photograph of Reduction Experimental Set-up ............................................... 112
APPENDIX C : Typical Material Recovery Factors by Process Step ........................................ 113
APPENDIX D : Quantifiable Detection Limit of Elements by ICP-OES .................................. 114
APPENDIX E: Author’s Presentations and Publications ........................................................... 116
1
CHAPTER ONE: Introduction Worldwide concerns over energy related climate change coupled with spiraling cost of fossil
fuels in recent years has increased interests in renewable energy alternatives. Although solar
photovoltaic power generation is a proven technology, especially in the space industry,
development of this technology to meet terrestrial energy demands has been limited.
One of the issues that have limited the widespread use of solar photovoltaic power has been the
high cost associated with the materials used in fabricating the solar cells. Currently silicon in
both monocrystalline and polycrystalline form is the dominant semiconductor material used in
the fabrication of most commercially available solar cells or modules, commanding over 90% of
the market share of all PV technologies [1].
Metallurgical grade and electronic or semiconductor grade silicon are produced on commercial
scale by the carbothermic and Siemens process respectively. Metallurgical grade silicon is
typically 98-99.5% and contains high content of electro-active impurities such as B(5-70 ppm),
P(5-100ppm), Al(3000-5000 ppm) and transition metals which are recognized to reduce the
conversion efficiencies of p-n junction silicon solar cells and panels. Electronic grade silicon on
the other hand which has total impurities less than one part per billion (< 1ppb) is too expensive
for large scale production of solar cells [2]. For fabrication of efficient silicon solar cells it is
generally recognized the B and P levels have to be reduced to less than 1ppm each and with an
overall silicon feedstock purity in the range of 5-7N
Owing to the lack of a dedicated process for producing solar grade silicon, manufacturers of
crystalline silicon solar cells have been dependent on limited rejects from crystal growth and
electronic silicon production plants as well as scrap silicon from the integrated circuit industries.
With an industry-wide growth rate more than double that of the electronic industry, the
traditional silicon supply sources for the PV industry is in constant short supply. The use of
higher-grade feedstock material for solar cells ultimately increases the cost of PV modules, a
trend that does not make this clean and renewable energy technology competitive with
conventional electrical power production systems.
2
Much of the current research effort to produce low cost solar grade silicon has focused either on
upgrading metallurgical grade silicon or by chemical vapor phase refining [3]. The vapor phase
refining processes, which are essentially modifications of the classical Siemens process succeed
in making the silicon highly pure but prohibitively expensive. Moreover the processes are
complex, inherently energy intensive, predominantly batch processes and involve emission of
corrosive gases such as chlorine [3]. The metallurgical process route has not been efficient in
reducing problematic dopant impurities such as boron (B) and phosphorus (P) to the level
generally accepted for solar cells fabrication hence this approach to solar silicon remains in the
research phase.
An alternative approach to synthesis of low cost solar grade silicon from plant biomass such as
rice husk which has a significant source of high purity silica has only been explored by relatively
few research groups. However, the narrow and isolated experimental conditions of previous
works and lack of an optimized process have limited the engineering application of such results.
The lack of a commercially viable route for synthesis of bulk high purity silicon using
amorphous silica from rice husk therefore provides a good motivation to conduct further research
into the feasibility of this approach.
In this study, feasibility of synthesizing high purity silicon from rice husk ash is investigated.
The objective of this research is to investigate the possibility of producing solar grade silicon
from Rice Husk Ash (RHA) by:
Developing an integrated process for production of silicon from RHA
Identifying and optimizing conditions for each step of the process
Studying the fundamentals involved in the major purification steps of the process
.
3
CHAPTER TWO: Literature Survey
2.1 Sources of Silicon Raw Materials Dietl [4], identified two main sources of silicon raw materials that are economically useful for
the synthesis of low cost silicon for photovoltaic applications. The primary source of silicon is
silicon dioxide which has the chemical formula of (SiO2) and commonly known as silica. Among
the known polymorphs of silica, quartz and quartzite rocks are the most stable and relatively pure
form that can be found in almost all mineralogical rocks [5].
Silicon precursors or volatile compounds of silicon represent the secondary source of silicon that
is widely used in technological processing industries. Notably, the halides of silicon and
flousilicic acids- a waste by-product of the phosphate fertilizer industry receive continuous
attention for the synthesis of low cost silicon due to their ease of purification by fractional
distillation [4].
Lately, the sources of silica and silicon in biomass resources such as rice husk are being
researched intensively for several industrial applications [6]. Most biomass resources are waste
by-products whose disposal cause environmental nuisance hence developing uses for these waste
resources are in common agreement with the global paradigm shift towards sustainable
development
2.2 Characteristics of Amorphous Silica The Dictionary of Composite Materials Technology [7] defines amorphous silica as a naturally
occurring or synthetically produced oxide of silicon characterized by the absence of a
pronounced crystalline structure and whose X-ray diffraction patterns have no sharp peaks. This
type of silica may be anhydrous or have a significant water of hydration in its structure. The
classification of amorphous silica into gel or powders largely depends on the bond strengths
between the ultimate colloidal particles. Silica gels are characterized by a coherent three
dimensional network of contiguous particles whilst silica powders consist of small granules of
silica gel or aggregates of submicron particles that are weakly linked together [8].
4
The desirable physico-chemical and mechanical properties of amorphous silica, notably their
high reactivity, excellent binding properties, relatively high purity and excellent mechanical
strength make this material useful in a wide range of technologies. Although hosts of synthetic
silica are produced commercially, the ones produced from plant origins such as rice husks have
been noted to have some significant advantages over those from mineral and synthetic origins
[9].
In particular, the processing steps are relatively simple and require no elaborate infrastructure or
consumption of costly reagents as in the case of the synthetic processes. In addition the final
silica powder produced from plant sources contains a narrow range of metal oxide impurities [9],
which makes them exceptionally desirable in applications where high purity silica at modest cost
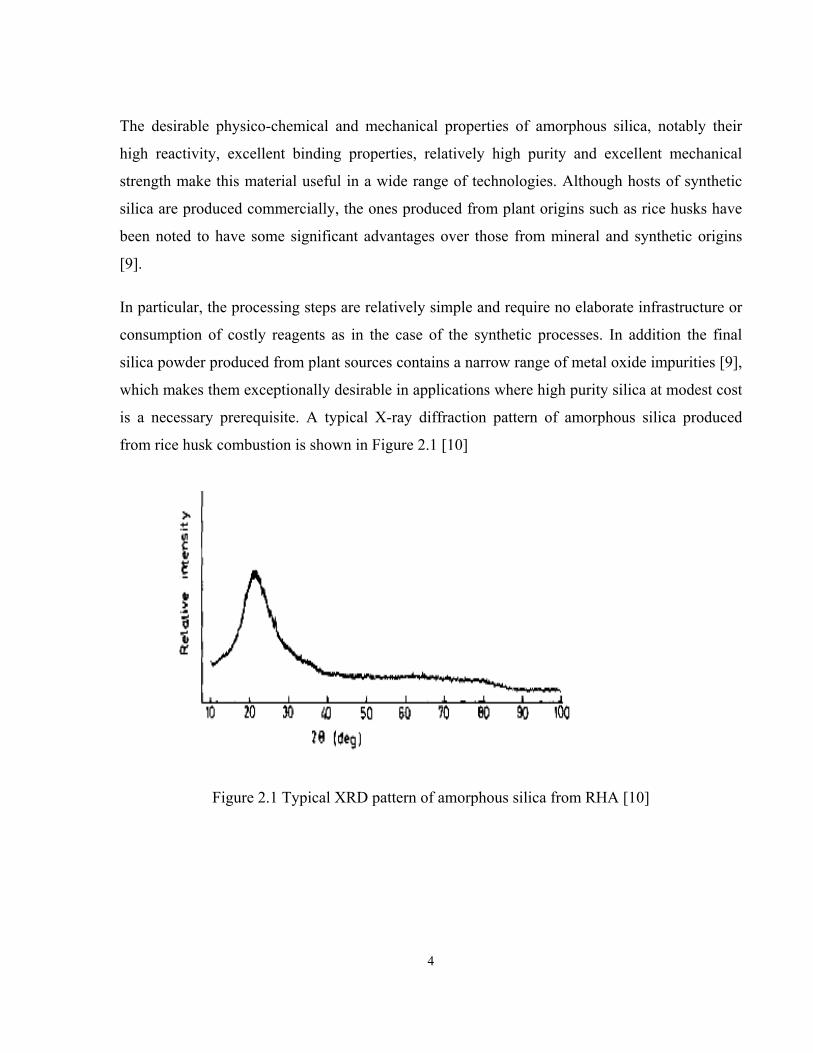
is a necessary prerequisite. A typical X-ray diffraction pattern of amorphous silica produced
from rice husk combustion is shown in Figure 2.1 [10]
Figure 2.1 Typical XRD pattern of amorphous silica from RHA [10]
5
2.3. Properties of Silicon Silicon is known to be exceeded in natural abundance only by oxygen in the earth crust. It
however does not occur freely in nature but in combination with oxygen to form oxides mainly
silica and silicates [2]. Historically, the crystalline form of silicon was first prepared by Deville
in 1854[11]. The peculiar properties of silicon were not however well understood or explained
until the advent of quantum mechanics in the early 1920’s, which led to the widespread use of
this material in the then burgeoning solid state electronic device industry [12]. Today silicon still
remains the material of choice for the microelectronic, and more so the photovoltaic industry.
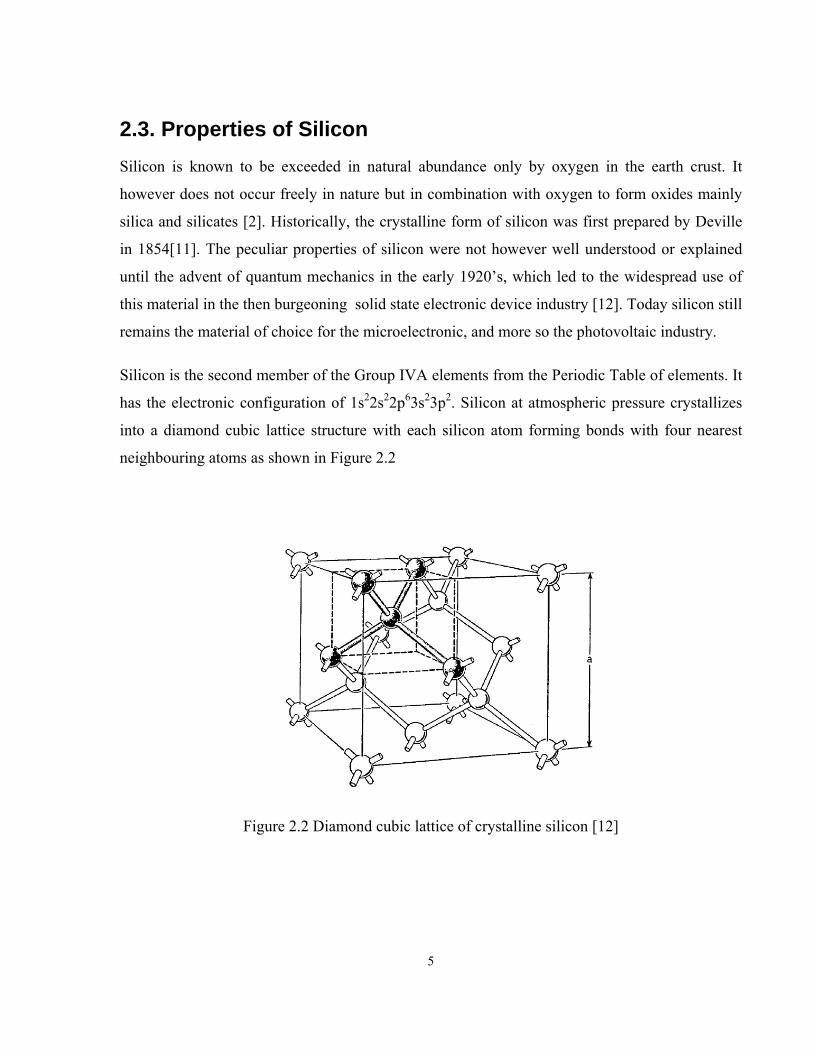
Silicon is the second member of the Group IVA elements from the Periodic Table of elements. It
has the electronic configuration of 1s22s22p63s23p2. Silicon at atmospheric pressure crystallizes
into a diamond cubic lattice structure with each silicon atom forming bonds with four nearest
neighbouring atoms as shown in Figure 2.2
Figure 2.2 Diamond cubic lattice of crystalline silicon [12]
6
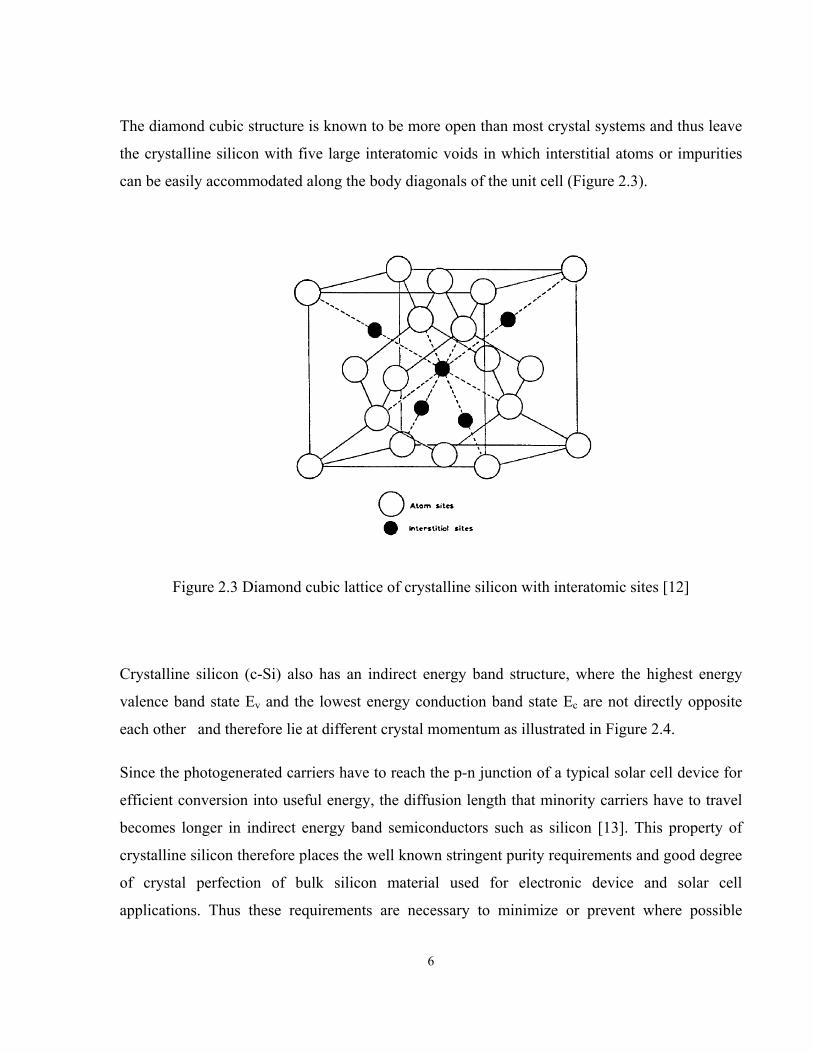
The diamond cubic structure is known to be more open than most crystal systems and thus leave
the crystalline silicon with five large interatomic voids in which interstitial atoms or impurities
can be easily accommodated along the body diagonals of the unit cell (Figure 2.3).
Figure 2.3 Diamond cubic lattice of crystalline silicon with interatomic sites [12]
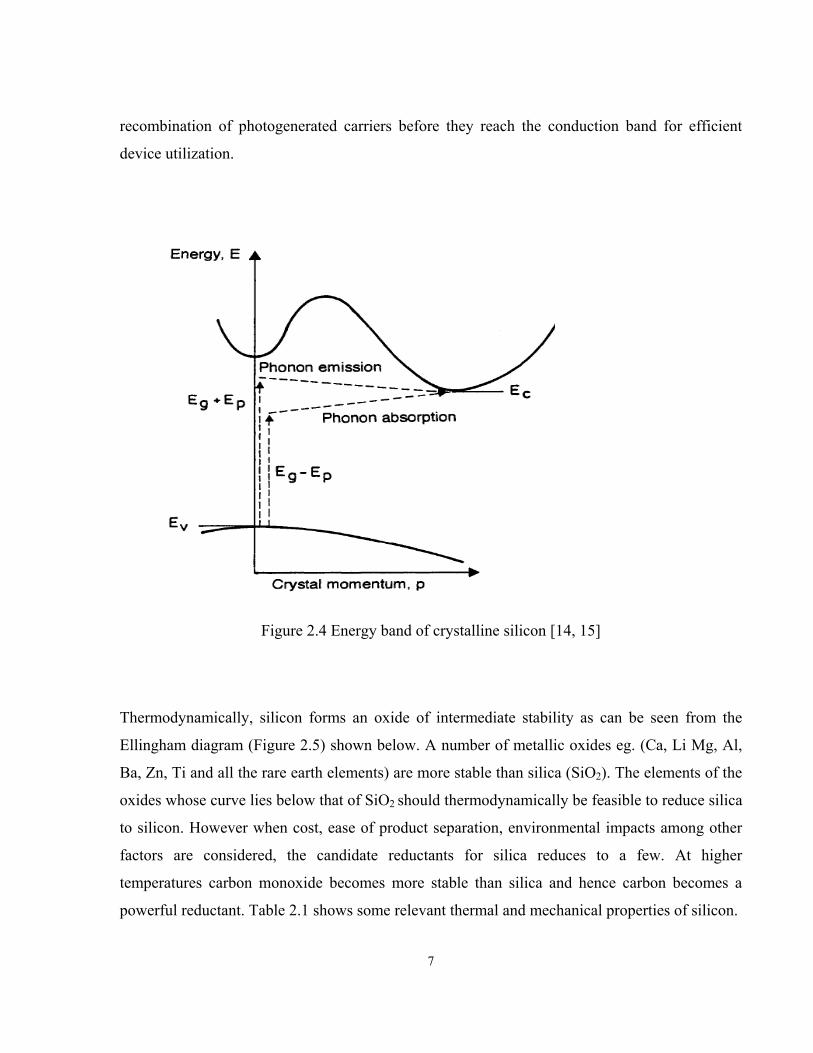
Crystalline silicon (c-Si) also has an indirect energy band structure, where the highest energy
valence band state Ev and the lowest energy conduction band state Ec are not directly opposite
each other and therefore lie at different crystal momentum as illustrated in Figure 2.4.
Since the photogenerated carriers have to reach the p-n junction of a typical solar cell device for
efficient conversion into useful energy, the diffusion length that minority carriers have to travel
becomes longer in indirect energy band semiconductors such as silicon [13]. This property of
crystalline silicon therefore places the well known stringent purity requirements and good degree
of crystal perfection of bulk silicon material used for electronic device and solar cell
applications. Thus these requirements are necessary to minimize or prevent where possible
7
recombination of photogenerated carriers before they reach the conduction band for efficient
device utilization.
Figure 2.4 Energy band of crystalline silicon [14, 15]
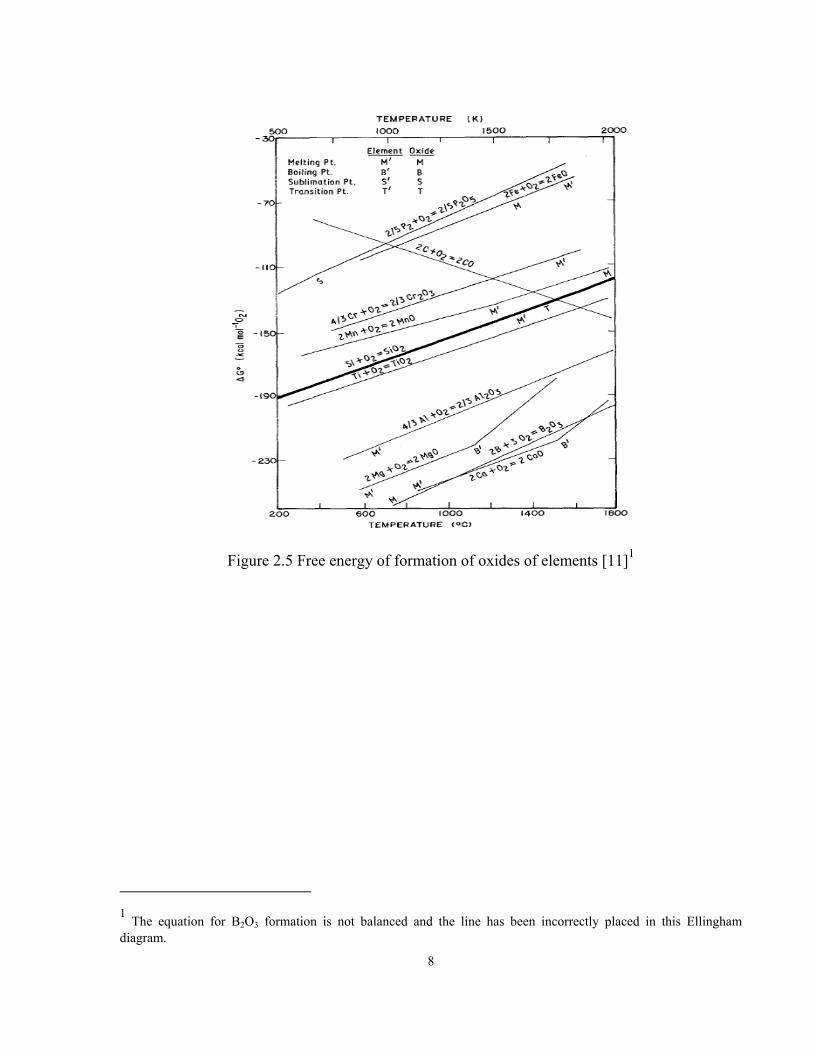
Thermodynamically, silicon forms an oxide of intermediate stability as can be seen from the
Ellingham diagram (Figure 2.5) shown below. A number of metallic oxides eg. (Ca, Li Mg, Al,
Ba, Zn, Ti and all the rare earth elements) are more stable than silica (SiO2). The elements of the
oxides whose curve lies below that of SiO2 should thermodynamically be feasible to reduce silica
to silicon. However when cost, ease of product separation, environmental impacts among other
factors are considered, the candidate reductants for silica reduces to a few. At higher
temperatures carbon monoxide becomes more stable than silica and hence carbon becomes a
powerful reductant. Table 2.1 shows some relevant thermal and mechanical properties of silicon.
8
Figure 2.5 Free energy of formation of oxides of elements [11]1
1 The equation for B2O3 formation is not balanced and the line has been incorrectly placed in this Ellingham diagram.
9
2.4 Impurities in Bulk Crystalline Silicon Impurities may be incorporated into bulk silicon material via two modes; (i) raw materials from
which bulk silicon is produced and (ii) contaminations from in-situ processing or fabrication of
the bulk silicon. The atomic impurities often discussed in the literature with respect to bulk
silicon can be classified into; dopants, transition metals, precipitates, non-metals and other trace
elements [12].
The dopants group of impurities in silicon mainly refer to elements of group IIIA (Boron,
Aluminum, and Gallium) and also elements of the group VA (such as Phosphorus, Antimony,
and Arsenic). The group IIIA elements substitute silicon atoms in the crystal lattice resulting in
an electron deficient bonding which tends to be supplied by electrons from neighbouring silicon
atoms. Accordingly when silicon material is intentionally or otherwise contaminated with group
Table 2. 1 Thermal and mechanical properties of Silicon[2]
Property Value
Atomic weight (g/mol) 28.085
Atomic density (atoms/cm3) 5.22 x 10²²
Melting point (oC) 1410
Boiling point (oC) 2355
Density (g/cm3) 2.329
Heat of fusion (kJ/g) 1.8
Heat of vaporization at melting point (kJ/g) 16
Percent contraction at melting (%) 9.5
10
IIIA elements the resulting semiconductor material is called a p-type semiconductor and the
Group IIIA elements are termed as acceptor impurities.
Group VA elements substitute silicon atoms in a silicon crystal lattice with excess electrons. The
resulting silicon material is termed an n-type semiconductor and donor impurity for the substitute
element. Boron and phosphorus represent typical dopant impurities in silicon and are the most
problematic impurities in terms of their removal from silicon. Their presence in crystalline
silicon tends to modify the semiconductor properties of silicon substantially and they are
therefore undesirable impurities beyond specified concentrations.
Likewise, the transition metals (mainly Ti, Fe, Cr, Ni, V, Co, Mn, and Cu) impurities are known
to degrade minority carrier life times and solar cell performance significantly. The minority
carrier life time is the time elapsed before a free electron combines with a hole in the crystal
lattice. Fortunately, these transition impurities have relatively low solid solubility and hence low
segregation coefficients in silicon and are thus removed substantially by known crystal growth
techniques.
Non metallic impurities such as oxygen, nitrogen, carbon and hydrogen dissolve in silicon
mainly as interstitial impurities. The interactive effects of non metallic impurities and single
atom impurities in silicon may facilitate formation of precipitated impurities such as SiC, SiO2,
silicides and others. The synergetic effects of various impurity groups have been the subject of
much ongoing research
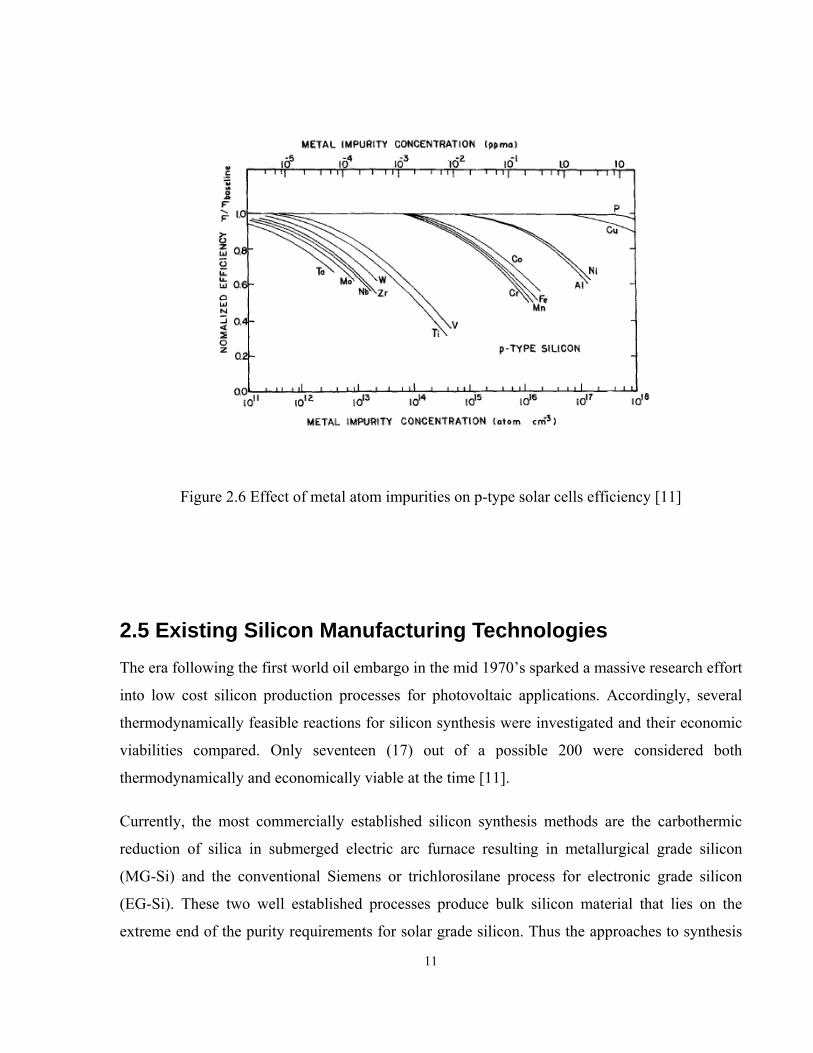
The effect of some single metal impurities on the efficiency of a p-type silicon solar cell
originally published by Hopkins et al [11] is shown in Figure 2.6.
11
Figure 2.6 Effect of metal atom impurities on p-type solar cells efficiency [11]
2.5 Existing Silicon Manufacturing Technologies The era following the first world oil embargo in the mid 1970’s sparked a massive research effort
into low cost silicon production processes for photovoltaic applications. Accordingly, several
thermodynamically feasible reactions for silicon synthesis were investigated and their economic
viabilities compared. Only seventeen (17) out of a possible 200 were considered both
thermodynamically and economically viable at the time [11].
Currently, the most commercially established silicon synthesis methods are the carbothermic
reduction of silica in submerged electric arc furnace resulting in metallurgical grade silicon
(MG-Si) and the conventional Siemens or trichlorosilane process for electronic grade silicon
(EG-Si). These two well established processes produce bulk silicon material that lies on the
extreme end of the purity requirements for solar grade silicon. Thus the approaches to synthesis
12
of solar grade silicon are currently pursued along the improvement or modifications of these two
existing technologies.
2.5.1 Production of Metallurgical-grade Silicon (MG-Si) The commercial carbothermic production of silicon is carried out in submerged arc furnaces. The
furnace consists essentially of a set of pre-baked carbon electrodes, refractory lined steel crucible
and the charge mix. The charge mix typically comprise of silica in the form of lumpy quartz or
quartzite rocks, coke or coal, and wood chips. The coke acts as the reducing agent and the wood
chips serve to improve charge porosity. After thorough blending of the charge, they are loaded
into overhead mix bins from which the charge mix is fed into the open furnace through chutes.
For open furnaces, a stocking machine is used to spread the charge mix after they are dropped
into the furnace. This machine is also useful for adjusting the raw materials as needed to correct
the charge composition as well prevent any gaseous build up in the furnace [16].
The overall reaction to produce silicon metal can be represented by the equation:
SiO2(s) + 2C(s) = Si (l) + 2CO (g) 2.1
The chemistry of the process is however made complex by side reactions which yield two
intermediate compounds namely gaseous silicon monoxide (SiO) and silicon carbide (SiC).
In the inner hot zone of the furnace where liquid silicon is produced and where the temperature
range is 1900 to 2100 oC, the key reactions may be described by the following equations [2]:
2 SiO2 (l) + SiC(s) = 3SiO (g) + CO (g) 2.2
SiO (g) + SiC(s) = 2Si (l) + CO (g) 2.3
In the outer zone where the temperature is typically below 1900oC, main reaction chemistry can
be represented as follows:
SiO (g) + 2C(s) = SiC(s) + CO (g) 2.4
2SiO (g) = Si (l) + SiO2(s) 2.5
13
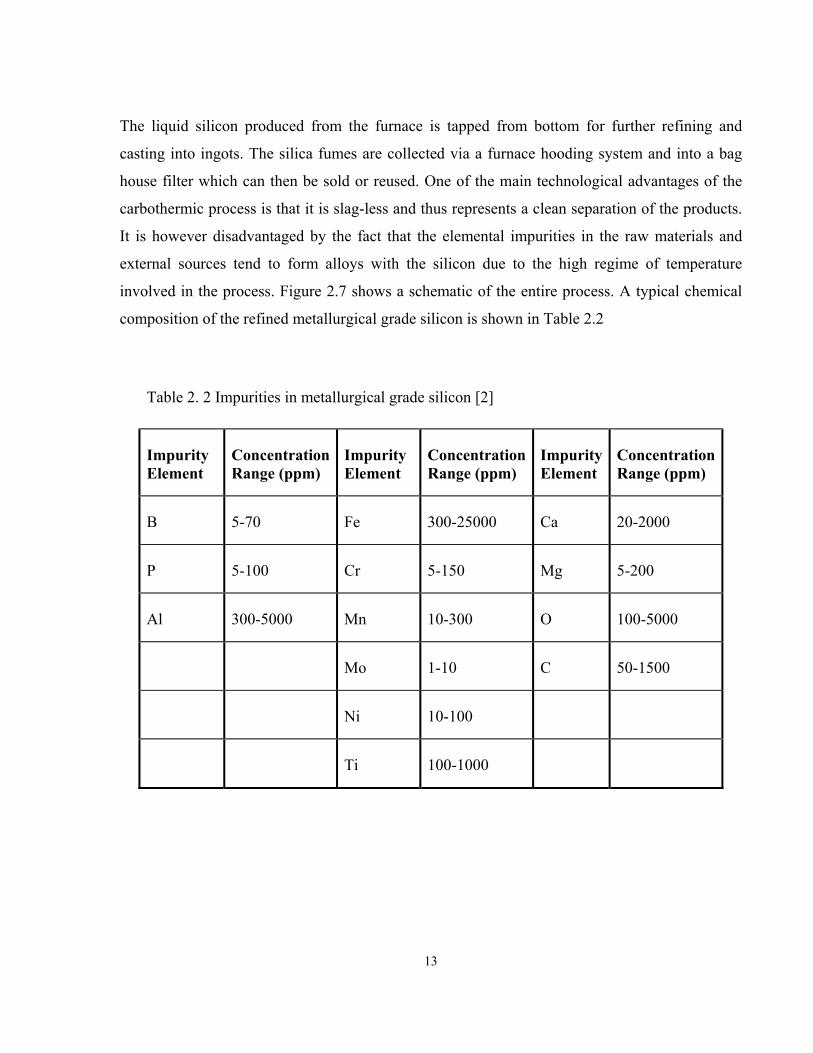
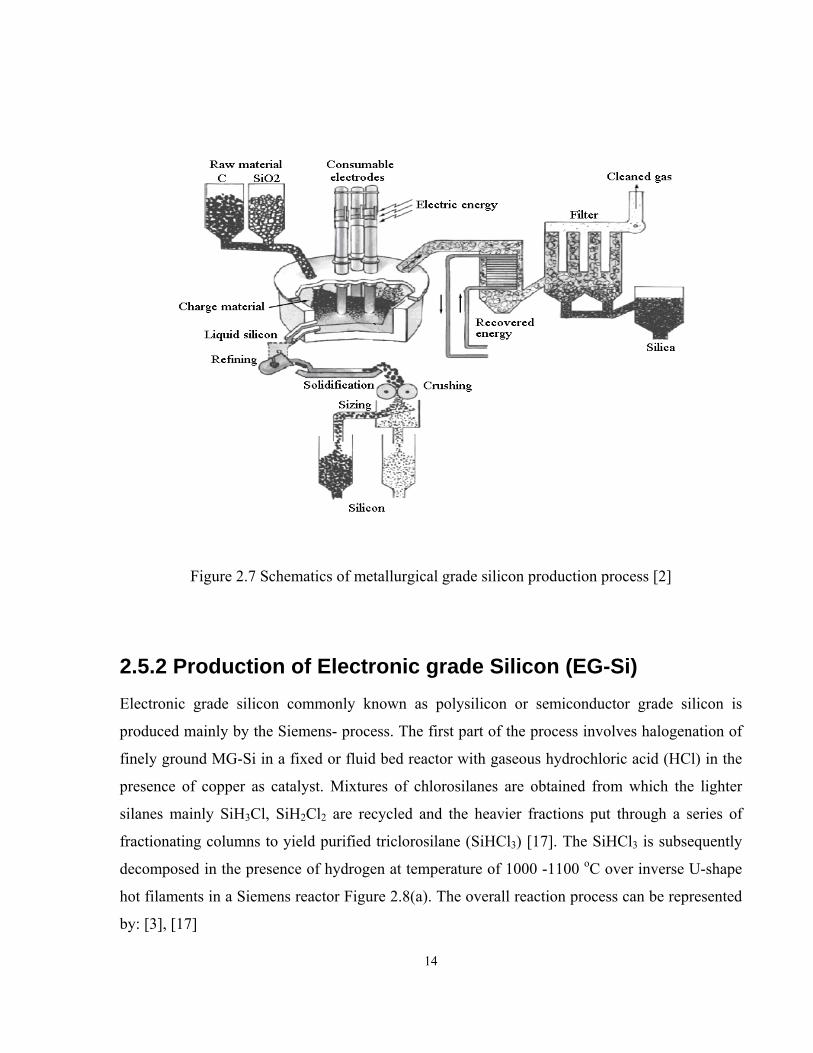
The liquid silicon produced from the furnace is tapped from bottom for further refining and
casting into ingots. The silica fumes are collected via a furnace hooding system and into a bag
house filter which can then be sold or reused. One of the main technological advantages of the
carbothermic process is that it is slag-less and thus represents a clean separation of the products.
It is however disadvantaged by the fact that the elemental impurities in the raw materials and
external sources tend to form alloys with the silicon due to the high regime of temperature
involved in the process. Figure 2.7 shows a schematic of the entire process. A typical chemical
composition of the refined metallurgical grade silicon is shown in Table 2.2
Table 2. 2 Impurities in metallurgical grade silicon [2]
Impurity Element
Concentration Range (ppm)
Impurity Element
Concentration Range (ppm)
Impurity Element
Concentration Range (ppm)
B 5-70 Fe 300-25000 Ca 20-2000
P 5-100 Cr 5-150 Mg 5-200
Al 300-5000 Mn 10-300 O 100-5000
Mo 1-10 C 50-1500
Ni 10-100
Ti 100-1000
14
Figure 2.7 Schematics of metallurgical grade silicon production process [2]
2.5.2 Production of Electronic grade Silicon (EG-Si) Electronic grade silicon commonly known as polysilicon or semiconductor grade silicon is
produced mainly by the Siemens- process. The first part of the process involves halogenation of
finely ground MG-Si in a fixed or fluid bed reactor with gaseous hydrochloric acid (HCl) in the
presence of copper as catalyst. Mixtures of chlorosilanes are obtained from which the lighter
silanes mainly SiH3Cl, SiH2Cl2 are recycled and the heavier fractions put through a series of
fractionating columns to yield purified triclorosilane (SiHCl3) [17]. The SiHCl3 is subsequently
decomposed in the presence of hydrogen at temperature of 1000 -1100 oC over inverse U-shape
hot filaments in a Siemens reactor Figure 2.8(a). The overall reaction process can be represented
by: [3], [17]
15
Si(s) + 3HCl (g) = HSiCl3 (g) + H2(g) 300 oC 2.6
2HSiCl3 (g) + H2 (g) = Si + SiCl4 (g) + 2HCl (g) 900- 1100 oC 2.7
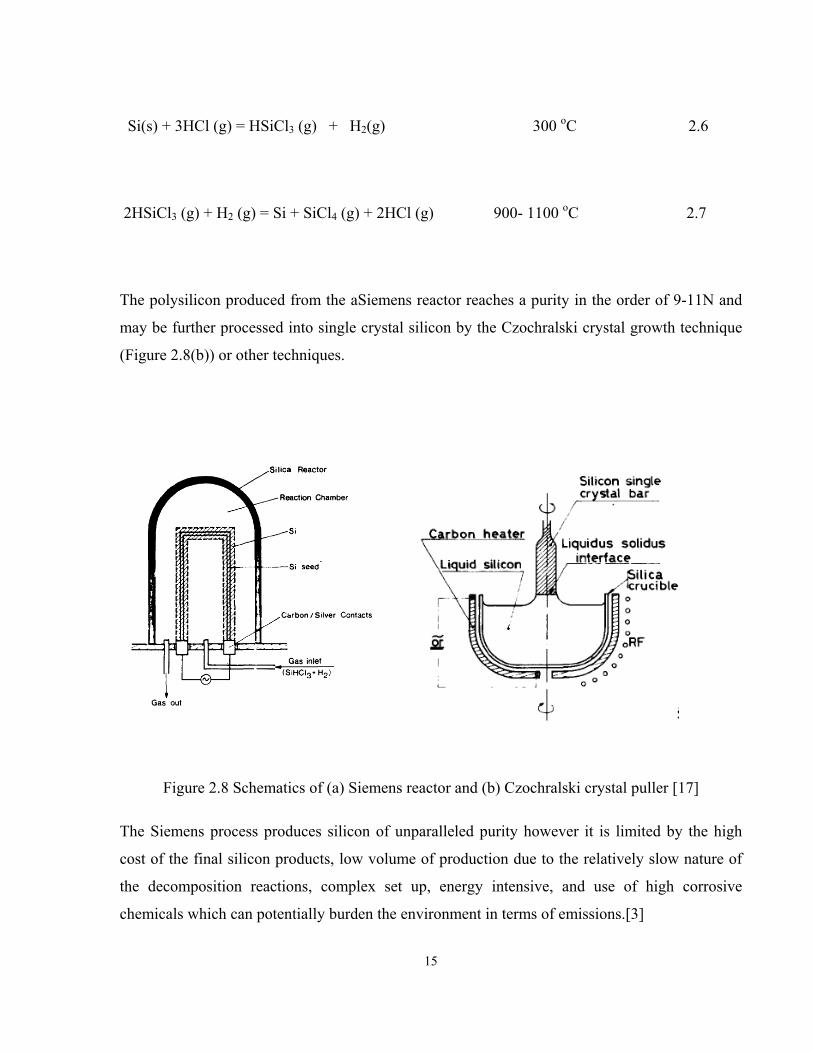
The polysilicon produced from the aSiemens reactor reaches a purity in the order of 9-11N and
may be further processed into single crystal silicon by the Czochralski crystal growth technique
(Figure 2.8(b)) or other techniques.
Figure 2.8 Schematics of (a) Siemens reactor and (b) Czochralski crystal puller [17]
The Siemens process produces silicon of unparalleled purity however it is limited by the high
cost of the final silicon products, low volume of production due to the relatively slow nature of
the decomposition reactions, complex set up, energy intensive, and use of high corrosive
chemicals which can potentially burden the environment in terms of emissions.[3]
16
Presently modifications have been made to the process to include decomposition of silanes
(SiH4) over seed silicon granules in fluid bed reactors. However the cost reduction potential of
the final silicon product by the original process and its variants still remain low.
2.6 Silicon Purification Techniques The metallurgical approaches to synthesis of solar grade silicon represent a tireless effort at
upgrading the silicon metal produced by the commercial carbothermic process. A number of
process techniques that have been tested and proven to remove metallic impurities other than
boron and phosphorus to a reasonable extent include [18],[19]
• Solid-liquid extraction (acid leaching)
• Al -base refining (recrystallization from Al solution)
• Liquid-Liquid extraction (slagging)
• Liquid gas extraction (gas blowing and evaporation)
• High vacuum refining and plasma-arc reduction of impurities
• Directional solidification of molten charge
Detailed descriptions of these techniques have been covered in the papers by Barthey et al [11],
Dietl [18], and Gribov et al [19] along with citation of a host of research papers.
The efficacy of hydrometallurgical treatments such as acid leaching on removal of dopants
impurities (B, Al, and P) has often been debated in literature publications. Whilst the general
consensus or perhaps perception is that the technique is ineffective in removing dopants
impurities from MG-Si, it remains to be proven that the same technique can be used to purify
silicon from sources other than metallurgical grade and quartz.
17
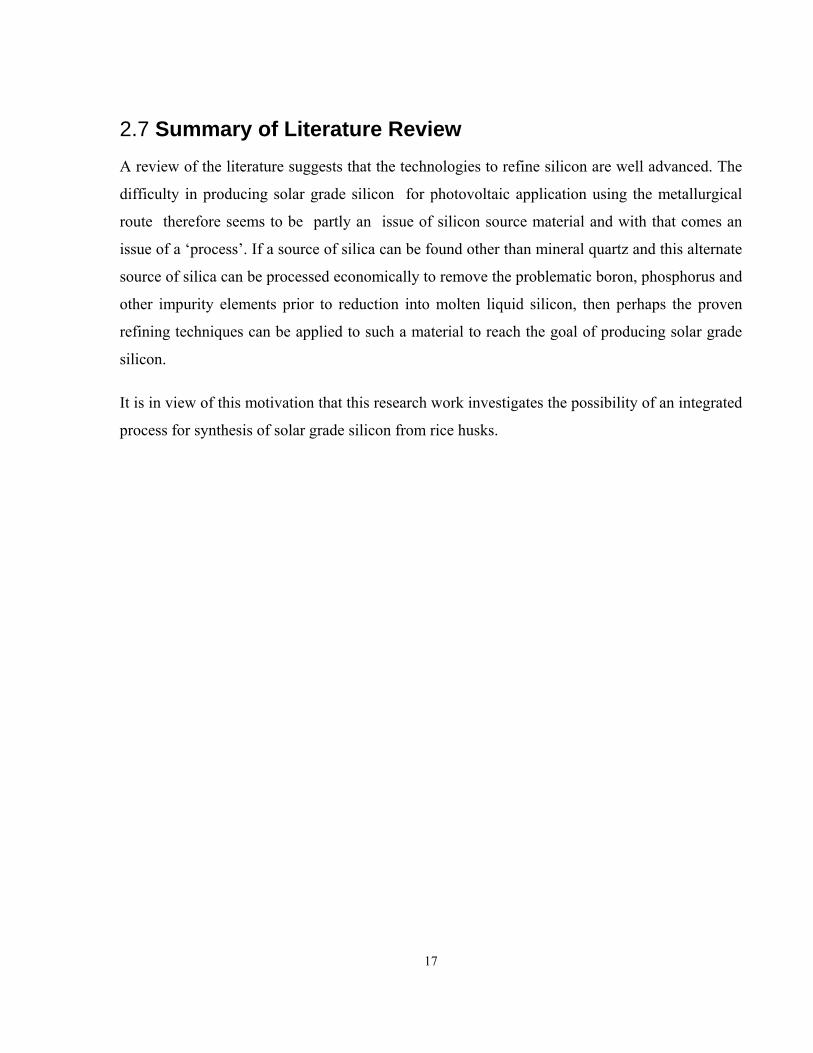
2.7 Summary of Literature Review A review of the literature suggests that the technologies to refine silicon are well advanced. The
difficulty in producing solar grade silicon for photovoltaic application using the metallurgical
route therefore seems to be partly an issue of silicon source material and with that comes an
issue of a ‘process’. If a source of silica can be found other than mineral quartz and this alternate
source of silica can be processed economically to remove the problematic boron, phosphorus and
other impurity elements prior to reduction into molten liquid silicon, then perhaps the proven
refining techniques can be applied to such a material to reach the goal of producing solar grade
silicon.
It is in view of this motivation that this research work investigates the possibility of an integrated
process for synthesis of solar grade silicon from rice husks.

18
CHAPTER THREE: Synthesis of Silicon from Rice Husk Ash The metallurgical route combined with directional solidification has been successful only in
removing metallic impurities with low segregation coefficients in silicon but ineffective
economically, in removing high segregation impurities (B, P, As, Al), which are known to be
very deleterious to the solar cells performance [20].
For these impurities, the logical approach and therefore growing consensus has been to use very
high purity silica and reductant raw materials that are almost free of such impurities.
It is against this background that the potential of amorphous silica obtained from rice husk ash
may be explored for the production of solar grade silicon.
3.1 Characteristics and Availability of Rice Husks Rice husk is a waste by-product of the rice milling industry. It constitutes about 20% the weight
of a harvested rice paddy and the mineral ash content of the rice husks ranges between 15-30%
of which 87-97% is amorphous silica depending on the combustion technique and conditions
employed [4], [6],[21], [22]
The rice plant has high amorphous silica content because it naturally absorbs from the soil and
transports silicon in the form of silicic acid to its outer surfaces. The silicic acid on reaching the
outer surfaces of the rice plant becomes concentrated due to evaporation and is subsequently
polymerized into silica cellulose membrane [23]. Because of this natural selectivity, the rice plant
limits the uptake of heavy metallic elements that are found in large concentration in other cheap
sources of silica such as quartz, bentonite and diatomaceous earth. A typical proximate analysis
of rice husk is shown in Table 3.1
19
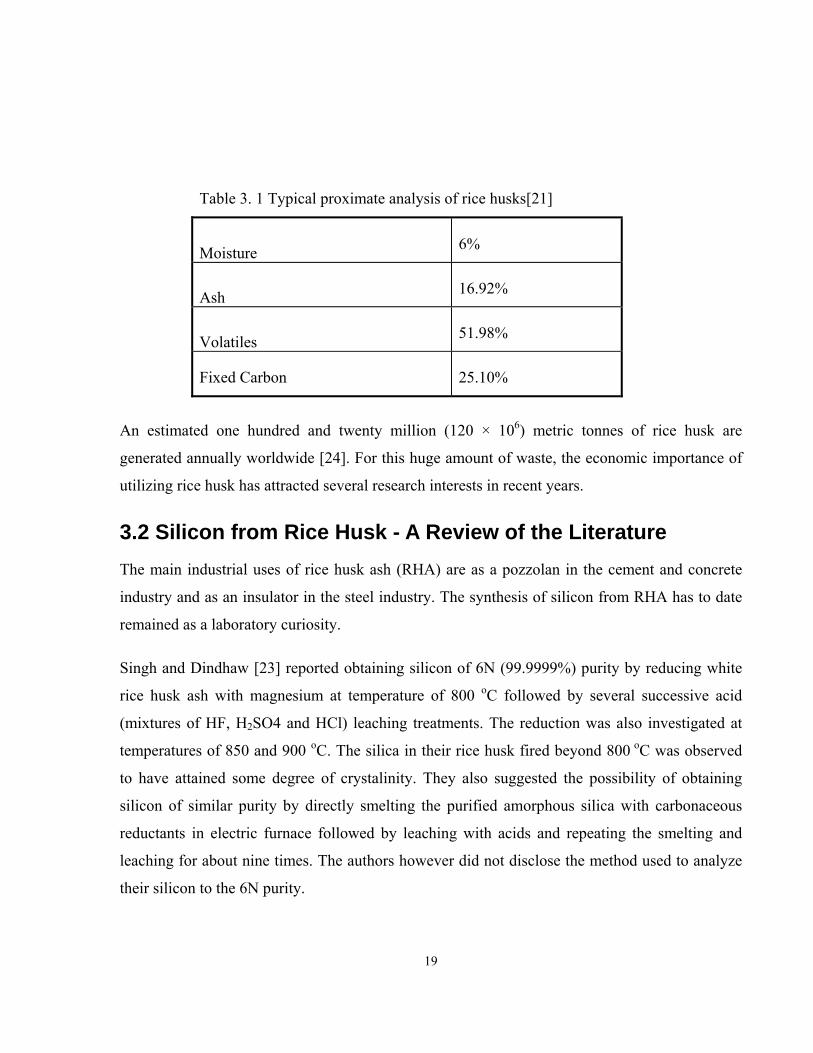
An estimated one hundred and twenty million (120 × 106) metric tonnes of rice husk are
generated annually worldwide [24]. For this huge amount of waste, the economic importance of
utilizing rice husk has attracted several research interests in recent years.
3.2 Silicon from Rice Husk - A Review of the Literature The main industrial uses of rice husk ash (RHA) are as a pozzolan in the cement and concrete
industry and as an insulator in the steel industry. The synthesis of silicon from RHA has to date
remained as a laboratory curiosity.
Singh and Dindhaw [23] reported obtaining silicon of 6N (99.9999%) purity by reducing white
rice husk ash with magnesium at temperature of 800 oC followed by several successive acid
(mixtures of HF, H2SO4 and HCl) leaching treatments. The reduction was also investigated at
temperatures of 850 and 900 oC. The silica in their rice husk fired beyond 800 oC was observed
to have attained some degree of crystalinity. They also suggested the possibility of obtaining
silicon of similar purity by directly smelting the purified amorphous silica with carbonaceous
reductants in electric furnace followed by leaching with acids and repeating the smelting and
leaching for about nine times. The authors however did not disclose the method used to analyze
their silicon to the 6N purity.
Table 3. 1 Typical proximate analysis of rice husks[21]
Moisture 6%
Ash 16.92%
Volatiles 51.98%
Fixed Carbon 25.10%
20
Amick et al. [25] also patented a process for producing rice husk silica with adjusted silica to
carbon ratio for direct reduction into high purity silicon with no addition of carbonaceous
reductants. The method as described by Amick et al. comprise of leaching rice husk in
semiconductor grade hydrochloric acid followed by pyrolysis of the leached husk at 900 oC in an
atmosphere of 1% anhydrous HCl/Ar gas stream for a period of about one hour. The pyrolyzed
rice husk which has a carbon -to -silica ratio of 4:1 is further processed in a conventional fluid
bed combuster with Ar/CO2 atmosphere at a temperature of 950 oC to obtain stoichiometric
carbon -to- silica ratio of 2:1. Reduction of the ash so produced at a temperature of 1900 oC
reportedly yielded silicon with total impurity less than 75 ppm. The boron and phosphorus
content were reported to be less than 10 ppm each.
Subsequently, Hunt et al. [26] investigated the possibility of producing high purity silicon from
rice husk by purifying the rice husk silica according to the method of Amick et al, followed by
pelletizing and reduction in a modified electric arc furnace. The pelletizing was carried using
carbon black as a reductant and sucrose as a binder. The authors concluded that purified RHA
could be a potential silica source for solar grade silicon production.
Bose et al. [22] subjected powdered silicon obtained by magnesium reduction of rice husk ash at
a temperature of 600-650 oC to melting and directional solidification and found that boron was
the active impurity in the polycrystalline silicon ingot obtained. They determined the minority
carrier life time of their polycrystalline silicon material to be of the order of 1-5µs and concluded
that to be promising for photovoltaic applications. A minimum carrier lifetime requirement for
efficient solar cells fabricated from multicrystalline silicon wafers is however estimated as 25 µs
[2].
The magnesium reduction of rice husk ash has also been investigated by Banerjee et al. [27] and
by Ikram and Akther [10]. Banerjee et al reduced acid leached rice husk ash by intimately
mixing the ash with magnesium powder and firing the powdered mixture in a sealed graphite
crucible in a muffle furnace. The reaction product was successively leached in mineral acids
(HCl, H2SO4, and HF) in a Teflon beaker. A spectrochemical analysis of the final silicon product
showed a high boron content of 20-200ppm as well as high magnesium (50-1000ppm) and
21
aluminum (10-200 ppm). They attributed the contamination of the silicon to the use of laboratory
grade magnesium and also from glassware. In comparison with the silica produced by Singh and
Dhindaw, Barnerjee et al. reported the silica had attained some degree of crystalinity when
produced from roasting of husk at temperatures between 500-600 oC.
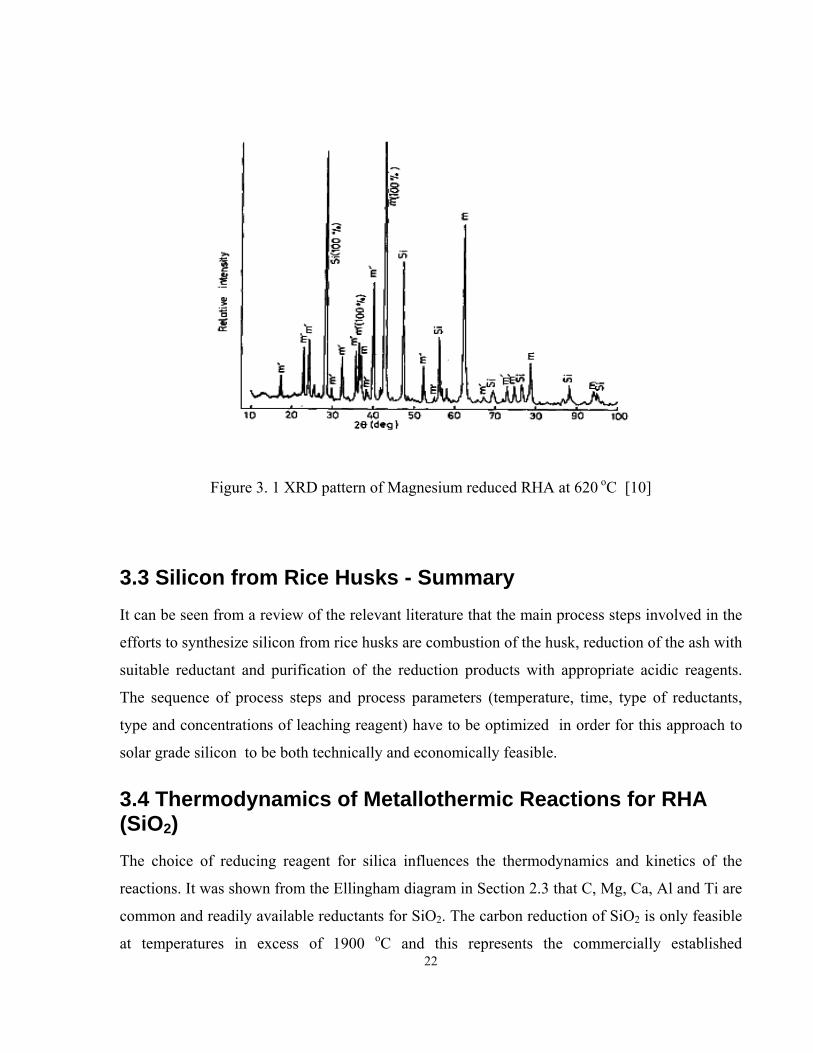
Following a similar approach but with 4N purity magnesium, Ikram and Akhter reported silicon
of 99.95% purity with Boron content of approximately 2ppm.The process steps followed by
Ikram and Akhter [10] , comprise boiling rice husk in 1:10 HCl and distilled water for 15
minutes, burning of the acid treated husk in air to obtain black ash, firing of the black ash in a
muffle furnace to obtain white ash, leaching of the white RHA in dilute HCl , reduction of the
leached white RHA with magnesium of 4N purity followed by sequential leaching with HCl, HF
and a mixture of HF and H2SO4.
Contrary to the report by Banerjee et al and in agreement with Singh and Dhindaw, these authors
reported that no crystalinity was observed in the RHA produced at 620 oC. Only the RHA fired
to 900 oC had attained significant crystallinity with reflections or sharp peaks of different phases
of SiO2 in their XRD pattern. They concluded that the silicon can be upgraded to solar grade
silicon by conventional refining methods. The XRD patterns of the magnesium reduced white
RHA product by Ikram and Akhter is shown in Figure 3.1.
Calciothermic reduction of purified rice husk ash was reported by Mishra et al.[28] They mixed
a stoichiometric composition of granular calcium and purified rice husk silica and subsequently
fired the powdered mixture in a sealed sillimanite crucible in a muffle furnace at temperature of
about 720 oC. The reduction product was milled to fine powder and successively leached with
concentrated nitric acid (HNO3) and hydrofluoric (HF) acid to obtain silicon of 99.9% purity
with a boron content of 10 ppm. They suggested that the use of MgO coated crucibles and high
purity reagent can lead to producing solar grade silicon by this method.
22
Figure 3. 1 XRD pattern of Magnesium reduced RHA at 620 oC [10]
3.3 Silicon from Rice Husks - Summary It can be seen from a review of the relevant literature that the main process steps involved in the
efforts to synthesize silicon from rice husks are combustion of the husk, reduction of the ash with
suitable reductant and purification of the reduction products with appropriate acidic reagents.
The sequence of process steps and process parameters (temperature, time, type of reductants,
type and concentrations of leaching reagent) have to be optimized in order for this approach to
solar grade silicon to be both technically and economically feasible.
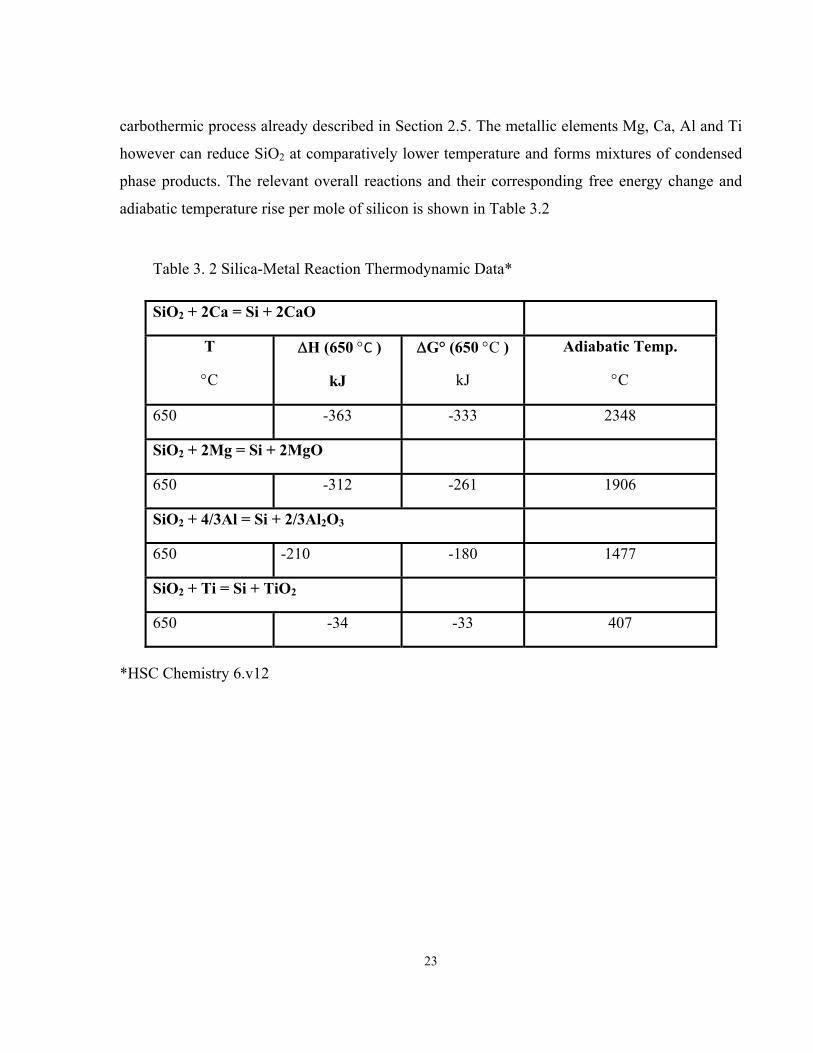
3.4 Thermodynamics of Metallothermic Reactions for RHA (SiO2) The choice of reducing reagent for silica influences the thermodynamics and kinetics of the
reactions. It was shown from the Ellingham diagram in Section 2.3 that C, Mg, Ca, Al and Ti are
common and readily available reductants for SiO2. The carbon reduction of SiO2 is only feasible
at temperatures in excess of 1900 oC and this represents the commercially established
23
carbothermic process already described in Section 2.5. The metallic elements Mg, Ca, Al and Ti
however can reduce SiO2 at comparatively lower temperature and forms mixtures of condensed
phase products. The relevant overall reactions and their corresponding free energy change and
adiabatic temperature rise per mole of silicon is shown in Table 3.2
Table 3. 2 Silica-Metal Reaction Thermodynamic Data*
SiO2 + 2Ca = Si + 2CaO
T
°C
ΔH (650 °C )
kJ
ΔG° (650 °C )
kJ
Adiabatic Temp.
°C
650 -363 -333 2348
SiO2 + 2Mg = Si + 2MgO
650 -312 -261 1906
SiO2 + 4/3Al = Si + 2/3Al2O3
650 -210 -180 1477
SiO2 + Ti = Si + TiO2
650 -34 -33 407
*HSC Chemistry 6.v12
24
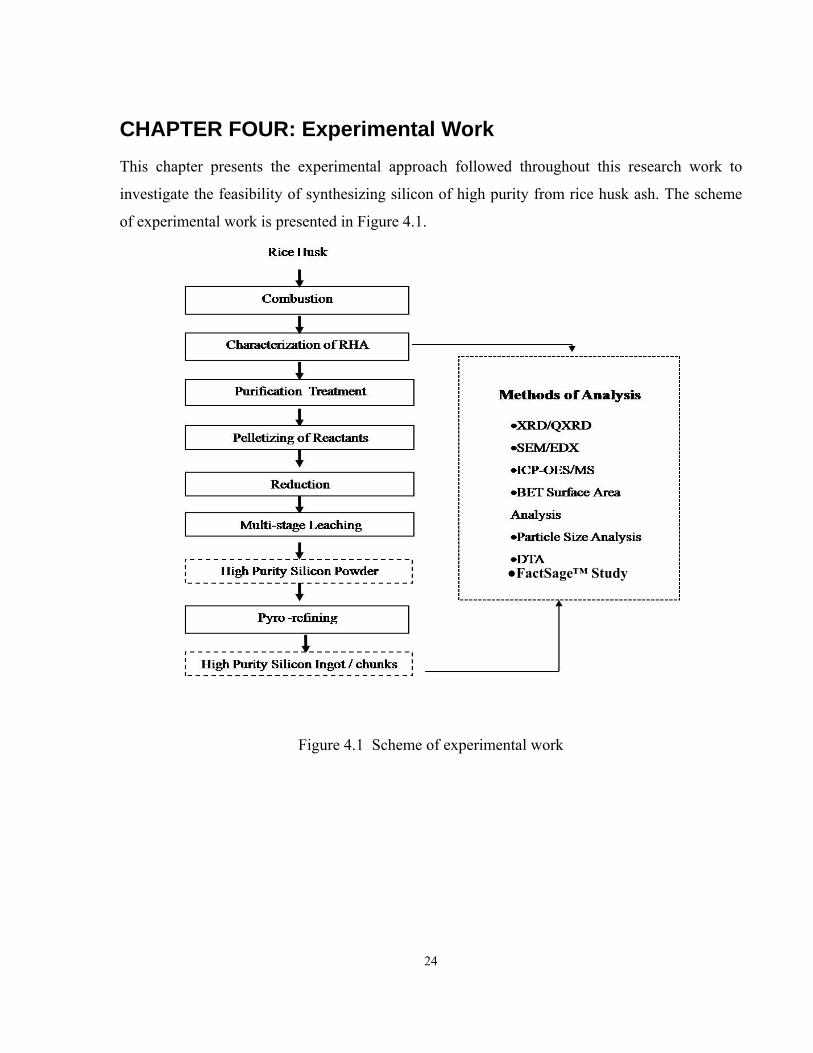
CHAPTER FOUR: Experimental Work This chapter presents the experimental approach followed throughout this research work to
investigate the feasibility of synthesizing silicon of high purity from rice husk ash. The scheme
of experimental work is presented in Figure 4.1.
Figure 4.1 Scheme of experimental work
●FactSage™ Study
25
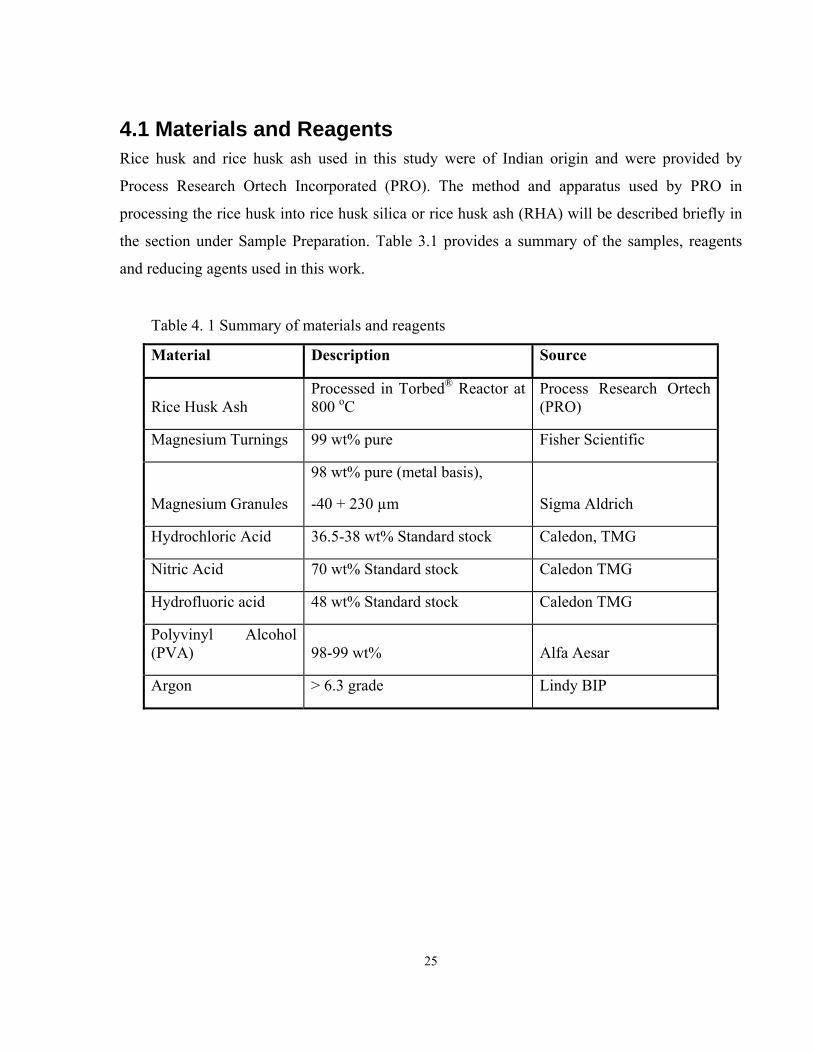
4.1 Materials and Reagents Rice husk and rice husk ash used in this study were of Indian origin and were provided by
Process Research Ortech Incorporated (PRO). The method and apparatus used by PRO in
processing the rice husk into rice husk silica or rice husk ash (RHA) will be described briefly in
the section under Sample Preparation. Table 3.1 provides a summary of the samples, reagents
and reducing agents used in this work.
Table 4. 1 Summary of materials and reagents
Material Description Source
Rice Husk Ash Processed in Torbed® Reactor at 800 oC
Process Research Ortech (PRO)
Magnesium Turnings 99 wt% pure Fisher Scientific
Magnesium Granules
98 wt% pure (metal basis),
-40 + 230 µm Sigma Aldrich
Hydrochloric Acid 36.5-38 wt% Standard stock Caledon, TMG
Nitric Acid 70 wt% Standard stock Caledon TMG
Hydrofluoric acid 48 wt% Standard stock Caledon TMG
Polyvinyl Alcohol (PVA) 98-99 wt% Alfa Aesar
Argon > 6.3 grade Lindy BIP
26
4.2 Sample Preparation – Rice Husk Ash
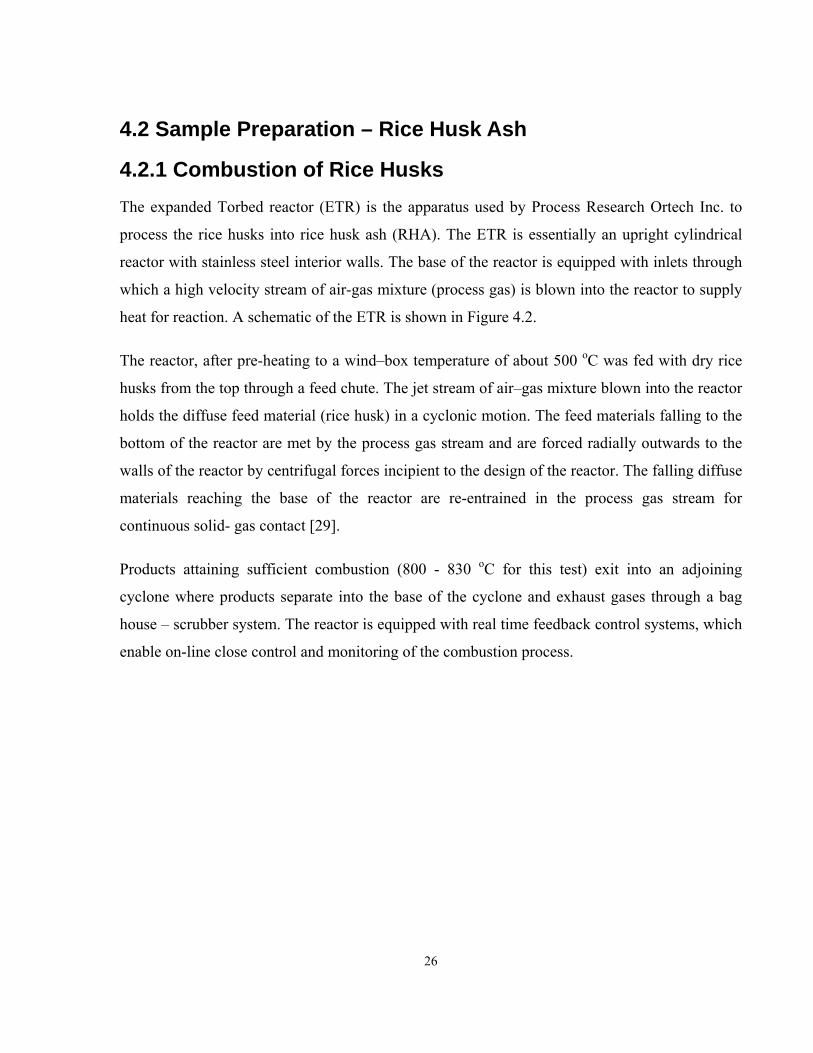
4.2.1 Combustion of Rice Husks The expanded Torbed reactor (ETR) is the apparatus used by Process Research Ortech Inc. to
process the rice husks into rice husk ash (RHA). The ETR is essentially an upright cylindrical
reactor with stainless steel interior walls. The base of the reactor is equipped with inlets through
which a high velocity stream of air-gas mixture (process gas) is blown into the reactor to supply
heat for reaction. A schematic of the ETR is shown in Figure 4.2.
The reactor, after pre-heating to a wind–box temperature of about 500 oC was fed with dry rice
husks from the top through a feed chute. The jet stream of air–gas mixture blown into the reactor
holds the diffuse feed material (rice husk) in a cyclonic motion. The feed materials falling to the
bottom of the reactor are met by the process gas stream and are forced radially outwards to the
walls of the reactor by centrifugal forces incipient to the design of the reactor. The falling diffuse
materials reaching the base of the reactor are re-entrained in the process gas stream for
continuous solid- gas contact [29].
Products attaining sufficient combustion (800 - 830 oC for this test) exit into an adjoining
cyclone where products separate into the base of the cyclone and exhaust gases through a bag
house – scrubber system. The reactor is equipped with real time feedback control systems, which
enable on-line close control and monitoring of the combustion process.
27
Figure 4.2 Schematic of expanded Torbed reactor [29]
4.2.2 Moisture Content Determination The moisture content of the rice husk ash was determined by the Drying Oven method. Using a
Mettler HK 160 analytical balance of sensitivity 0.0001 g, a quantity of the rice husk ash was
weighed into a cleaned and dried ceramic boat of predetermined tare weight. The boat and
content was weighed and then placed in a Precision thelco mechanical convection oven and dried
to constant weight at 105 oC over 4 to 5 hours. The ceramic boat and content was re-weighed and
the moisture content determined. The moisture content was found to be below 0.5 wt% hence all
weighting of RHA were considered to be on dry basis without moisture content corrections.
28
4.3 Characterization of RHA Sample
4.3.1 Chemical Composition Analysis The bulk of the as received rice husk ash (RHA) was blended and riffled using a Jones riffles to
ensure homogenous and representative samples were selected for both chemical composition and
other analysis. Analyses requested were multi-acid digestion Inductively Coupled Plasma (ICP-
MS/OES), Whole Rock Assay, and Leco total carbon content. The ANALEST laboratory of
University of Toronto Chemistry Department was used for in-house chemical composition
analysis. External laboratory which was involved in the chemical compositional analysis of
samples from this research is International Plasma Laboratory (IPL)-Vancouver.
4.3.2 Particle Size Analysis Laser diffraction particle size analysis method was used to characterize the particle size of the as
received RHA. The Malvern Master Sizer S instrument was used. The measurable particle size
range of the instrument is 0.05-3000 µm and it is equipped with a small volume sample
dispersion unit. A lens range of 300RF, a beam length of 2.4mm, and a presentation of 30AD
with polydisperse analysis was used for this measurement. About 0.5 g of the rice husk ash was
dispersed in de-ionized water in the sample dispersion unit of the instrument, vigorously mixed
for about two (2) minutes at speed of 2100 rpm, and sonicated for 45 seconds. The ultrasonic
waves were used to break or minimize any particle agglomerates that may be present in the
suspension. Measurements were taken and the diffraction data and graphs recorded by the
instrument software program.
29
4.3.3 Surface Area Measurement The Coulter SA 3100 Analyzer together with the BET (Brauner Emmet Teller) calculation model
was used to determine the surface area of the as-received RHA.
For sample preparation, about 2 g of the rice husk ash was weighed into the glass tube sample
holder of the instrument and the free space volume (space in tube not occupied by sample) was
measured using helium gas. The sample tube and contents were then outgassed with the system’s
in-built vacuum pump. Analysis for the surface area began by introducing known doses of
nitrogen (adsorbate gas) into the previously evacuated tube containing the sample. The glass tube
was maintained at a constant temperature by immersion into a Dewar of nitrogen. When the
pressure in the tube was equilibrated following each dose of the adsorbate gas, the pressure
reading was recorded and then used to compute the volume of gas adsorbed on to the surface and
pores of the sample.
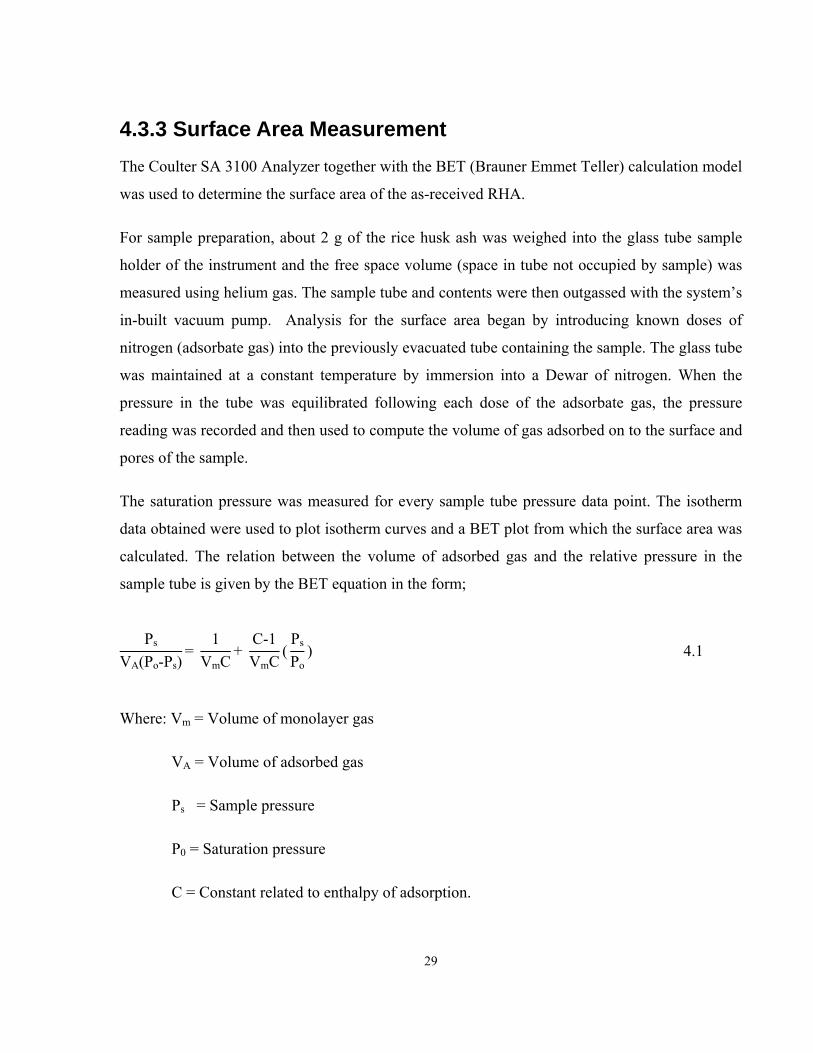
The saturation pressure was measured for every sample tube pressure data point. The isotherm
data obtained were used to plot isotherm curves and a BET plot from which the surface area was
calculated. The relation between the volume of adsorbed gas and the relative pressure in the
sample tube is given by the BET equation in the form;
Ps
VA(Po-Ps)=
1VmC
+ C-1VmC
(Ps
Po) 4.1
Where: Vm = Volume of monolayer gas
VA = Volume of adsorbed gas
Ps = Sample pressure
P0 = Saturation pressure
C = Constant related to enthalpy of adsorption.
30
The BET model assumes a cross-sectional area of the adsorbate molecule (Am) to be 0.162 nm 2
for the nitrogen gas, which enables the specific BET surface area (SBET) in m2/g to be calculated
from the expression: [30]
SBET = VmNAAm
Mv 4.2
NA and Mv are respectively the Avogadro’s number and gram molar volume of an ideal gas.
4.3.4 XRD Analysis Philips Diffractometer (model PW 3710) with X’PERT graphics software package was used to
analyze the structures of the rice husk ash sample. An aluminum-glass composite sample holder
with a rectangular slot measuring 2 cm × 1 cm × 0.2 cm was filled with the powdered sample
using the front loading method. The samples were analyzed using a CuKα radiation (λ =
1.54056Å) with a nickel filter. Bragg’s angle (2theta) range of 10 -50o and a scan speed of 0.72
degree per minute with a step-size of 0.015° was used. The Philips diffractometer was operated
at 40 kV and 40 mA. The structural pattern was recorded and analyzed with X’PERT
HighScore™ software.
4.3.5 Scanning Electron Microscopy (SEM) Studies The Hitachi S2500 scanning electron microscope was used to characterize the particle
morphologies of the samples. Sample specimens with diameter of 12 mm each were gold coated
in a gold sputter coater for 90 seconds at 15 mA current output. The gold coating was necessary
to ensure a conducting surface was obtained for electron bombardment and characterization. The
scanning electron microscope was operated at 20 kV and a working distance of 15 mm. Selected
areas of interest were focused and micrographs were taken. For samples requiring SEM and
EDX analysis, the Hitachi S570 scanning electron microscope was used.
31
4.4. Purification Treatment of RHA
4.4.1 Leaching of RHA Acid leaching of the rice husk ash was carried out to remove soluble elemental impurities and
hence increase the purity of the silica content. Leaching was carried out at 10 wt% solids in 10
wt% HCl. The HCl solution was prepared from a standard HCl stock of mean concentration 37
wt% and density 1.19 g/mL.
The leaching reactor was 1-2L teflon beaker with teflon lid. Holes were drilled in the lid to
accommodate a separator funnel for introduction of preheated acid to the pre-heated solid to be
leached; as well a thermometer and a three blade teflon coated steel impeller. The port for the
separator funnel doubled as a sampling port. The experimental set-up for leaching is shown in
Figure 4.3.
Leaching time was varied between 1and 4 hrs and the temperature was varied between 60 and 90 oC with continuous stirring at 250 rpm. Vacuum assisted filtration was used to separate the
residue and leach liquor. The residue was thoroughly washed with cold de-ionized water. The
residue obtained was oven dried to constant weight at 105 oC. Samples of the dry residue were
digested and analyzed by ICP- OES/MS to determine impurity reduction under the various
leaching conditions.
32
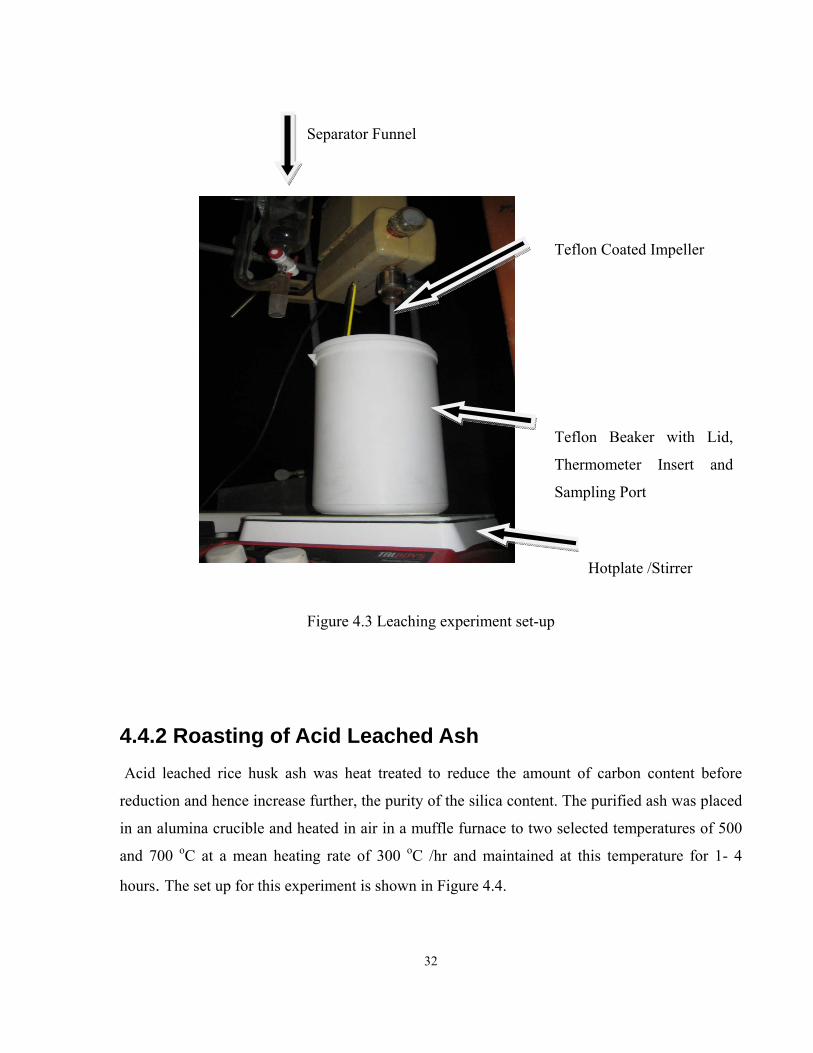
Figure 4.3 Leaching experiment set-up
4.4.2 Roasting of Acid Leached Ash Acid leached rice husk ash was heat treated to reduce the amount of carbon content before
reduction and hence increase further, the purity of the silica content. The purified ash was placed
in an alumina crucible and heated in air in a muffle furnace to two selected temperatures of 500
and 700 oC at a mean heating rate of 300 oC /hr and maintained at this temperature for 1- 4
hours. The set up for this experiment is shown in Figure 4.4.
Separator Funnel
Teflon Coated Impeller
Teflon Beaker with Lid,
Thermometer Insert and
Sampling Port
Hotplate /Stirrer
33
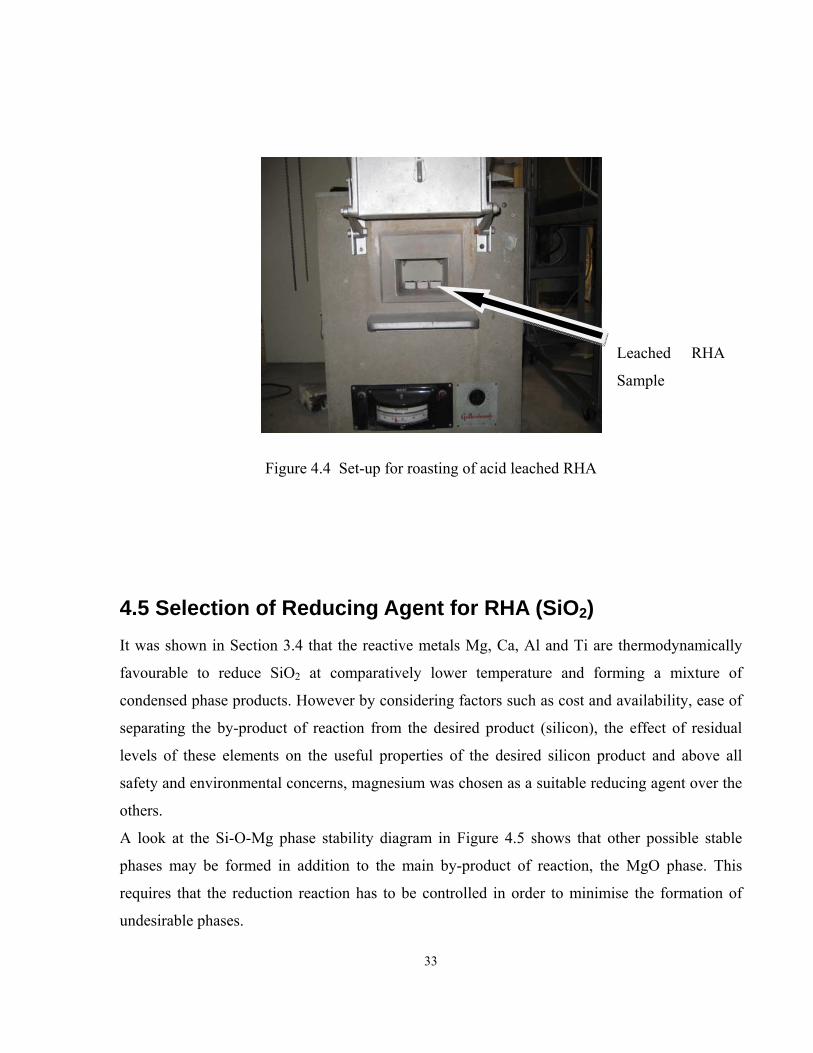
Figure 4.4 Set-up for roasting of acid leached RHA
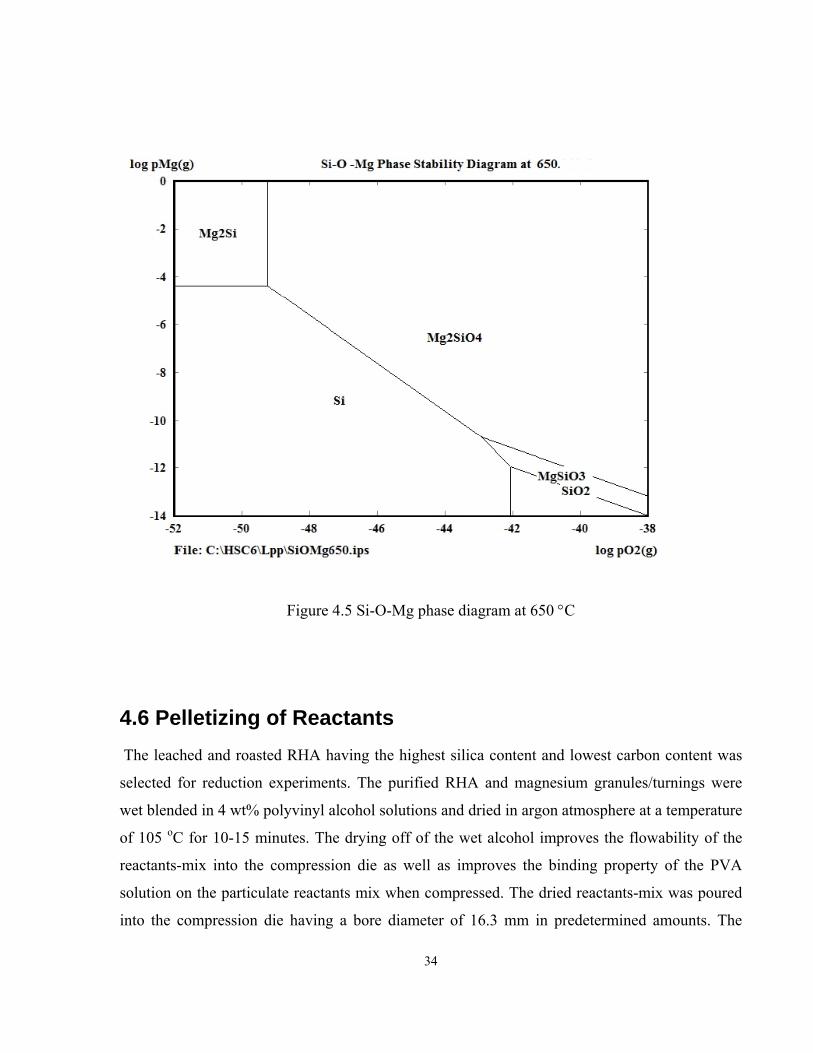
4.5 Selection of Reducing Agent for RHA (SiO2) It was shown in Section 3.4 that the reactive metals Mg, Ca, Al and Ti are thermodynamically
favourable to reduce SiO2 at comparatively lower temperature and forming a mixture of
condensed phase products. However by considering factors such as cost and availability, ease of
separating the by-product of reaction from the desired product (silicon), the effect of residual
levels of these elements on the useful properties of the desired silicon product and above all
safety and environmental concerns, magnesium was chosen as a suitable reducing agent over the
others.
A look at the Si-O-Mg phase stability diagram in Figure 4.5 shows that other possible stable
phases may be formed in addition to the main by-product of reaction, the MgO phase. This
requires that the reduction reaction has to be controlled in order to minimise the formation of
undesirable phases.
Leached RHA
Sample
34
Figure 4.5 Si-O-Mg phase diagram at 650 °C
4.6 Pelletizing of Reactants The leached and roasted RHA having the highest silica content and lowest carbon content was
selected for reduction experiments. The purified RHA and magnesium granules/turnings were
wet blended in 4 wt% polyvinyl alcohol solutions and dried in argon atmosphere at a temperature
of 105 oC for 10-15 minutes. The drying off of the wet alcohol improves the flowability of the
reactants-mix into the compression die as well as improves the binding property of the PVA
solution on the particulate reactants mix when compressed. The dried reactants-mix was poured
into the compression die having a bore diameter of 16.3 mm in predetermined amounts. The
35
interior surfaces of the compression die were lubricated with a solution of stearic acid in
kerosene or alternatively benzene before introduction of the reactants-mix. The quick drying
action of the solution on the wall of the die leaves a thin film coating which facilitates ejection of
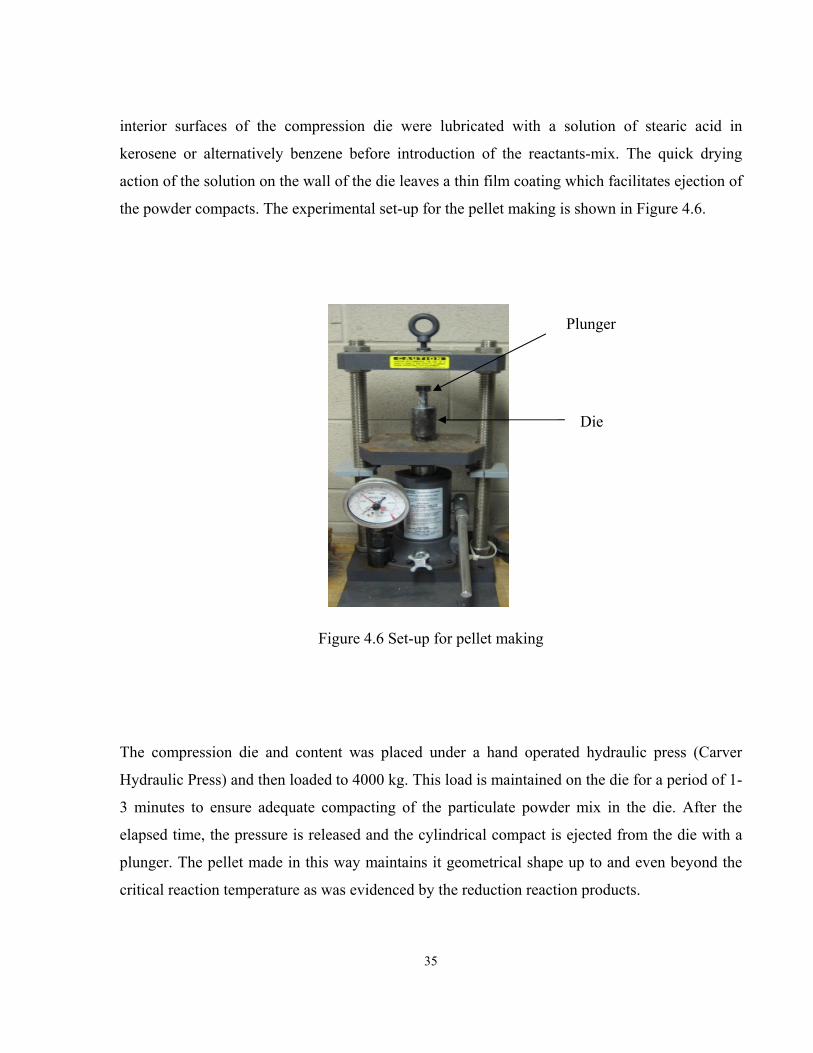
the powder compacts. The experimental set-up for the pellet making is shown in Figure 4.6.
Figure 4.6 Set-up for pellet making
The compression die and content was placed under a hand operated hydraulic press (Carver
Hydraulic Press) and then loaded to 4000 kg. This load is maintained on the die for a period of 1-
3 minutes to ensure adequate compacting of the particulate powder mix in the die. After the
elapsed time, the pressure is released and the cylindrical compact is ejected from the die with a
plunger. The pellet made in this way maintains it geometrical shape up to and even beyond the
critical reaction temperature as was evidenced by the reduction reaction products.
Plunger
Die
36
4.6.1 Determination of Percent Compaction and Porosity The percent compactness and porosity of the pellets may be determined by considering the
geometry of the pellets along with the weight and density of the component materials in the
pellets.
%Compaction=ρ
P
ρth×100 4.3
% Porosity = 100 1- ρp
ρth 4.4
Where ρp = bulk density of pellet
ρth = theoretical density of pellet based on composition.
The mass of silica and magnesium can be readily determined from the percent composition of
the mixed reactants.
4.7 Reduction Experiments The reduction of silica (SiO2) by magnesium (Mg) was first studied theoretically using
FactSage™ program and then in a small amount employing Differential Thermal Analysis. The
results obtained from these preliminary studies were used to reduce the number of the bench
scale experiments.
4.7.1 FactSage™ Study FactSage™ is a fully integrated database computing system in chemical thermodynamics. The
FactSage™ study was undertaken to examine the effects of process variables such as
temperature, and ratio of Mg: SiO2 on the relative amounts of the equilibrium phases in the
reaction products.
37
The Equilibrium calculation model and the pure solids database in FactSage™ were used to
investigate the effects of temperature, trace oxygen amount or partial pressure and Mg: SiO2
from the simplified reaction model equation on a gram mole basis:
(gram) 60 SiO2 + <48(1+ α)>Mg + <B> O2 + <40-B>Ar = 4.5
(25,1,s,#1) (25,1,s,#1) (25,1,g,#1) (25,1,g,#1)
Where
α = % fraction of reductants reagent in excess of stoichiometric requirement
B = Amount of oxygen in the inert gas stream or trapped in the furnace atmosphere. The
simulation was performed at 600, 650, 700, 800 and 900 oC and <(1+α)> varying from 1 to 1.25
at 0.05 intervals with <B> fixed at 0 and with argon as the inert gas.
4.7.2 Differential Thermal Analysis DTA Differential thermal-analysis of a stoichiometric mixture of purified RHA and magnesium was
carried out using NETZSCH STA 409 PC/PG instrument. 48mg sample was loaded into DTA
alumina crucible and with a certified alumina material as a reference; a heating program was
initiated with a heating rate of 5 oC/min from 35 oC to 1150 oC with continuous argon flush. The
specific heat absorbed or evolved (µV/mg) was recorded as function of temperature.
4.7.3 Reduction in Argon Atmosphere A schematic of the experimental set-up for the metallothermic reduction in controlled
atmosphere is shown in Figure 4.7. The set-up consists of a Lindberg horizontal tube furnace
with input power rating of 1300W. The work tube is recrystallized alumina with a length (L) of
760 mm, outer diameter (OD) of 60 mm and inner diameter (ID) of 54 mm. The furnace was
calibrated to determine the hot zone at the desired temperature ranges for the experiments.
38
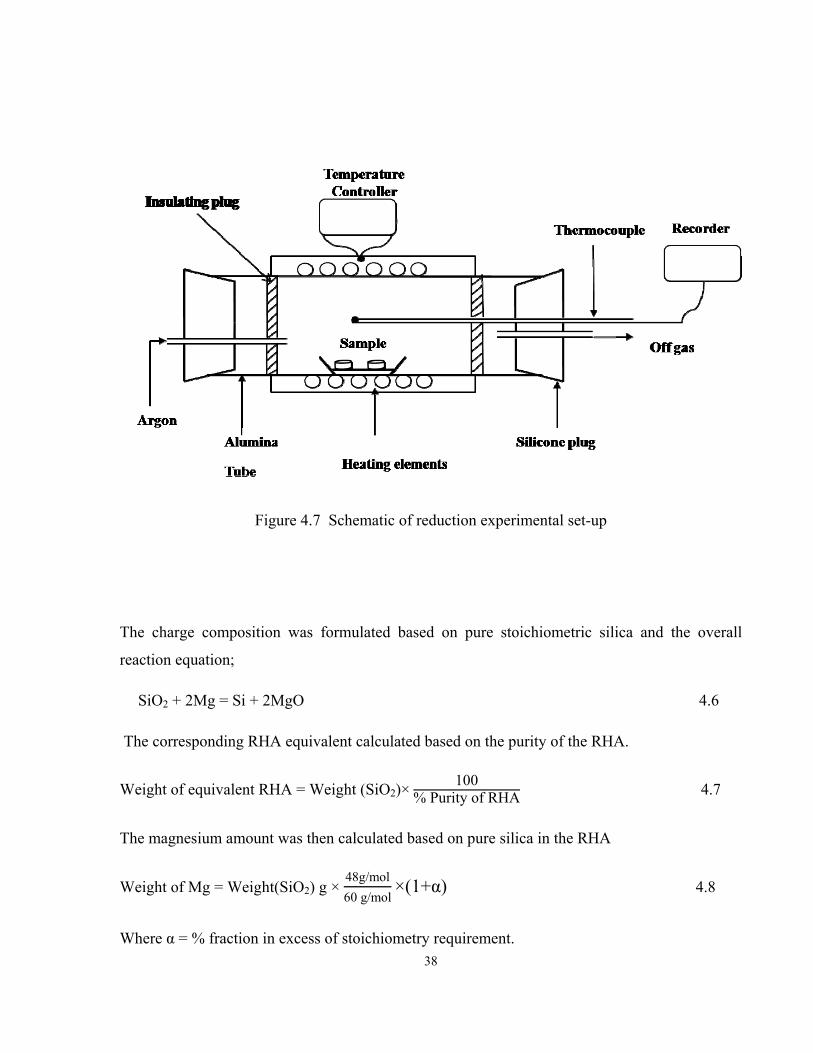
Figure 4.7 Schematic of reduction experimental set-up
The charge composition was formulated based on pure stoichiometric silica and the overall
reaction equation;
SiO2 + 2Mg = Si + 2MgO 4.6
The corresponding RHA equivalent calculated based on the purity of the RHA.
Weight of equivalent RHA = Weight (SiO2)×100
% Purity of RHA 4.7
The magnesium amount was then calculated based on pure silica in the RHA
Weight of Mg = Weight(SiO2) g × 48g/mol60 g/mol
×(1+α) 4.8
Where α = % fraction in excess of stoichiometry requirement.
39
The effect of Mg/SiO2 ratio was investigated by varying the amount of magnesium in the charge.
The reduction experiments in argon atmosphere were carried out at selected temperatures in the
range of 500-950 °C to examine the effect of temperature. The reduction procedure in controlled
atmosphere is as outlined below;
• Preheating the furnace to a temperature of 400 °C.
• Introducing the charge into the furnace hot-zone and high argon flushing for 15 minutes.
• Steadily heating the charge at approximately 10 °C/min under flowing argon to the
selected holding temperature and holding it there for one hour.
• Allowing furnace and charge to cool down naturally to room temperature.
4.8 Quantitative XRD Analysis of Reduction Products Phases present in the reduction product were analyzed using a Philips X-ray diffractometer with
instrumental settings and software programs as previously described. Each reduction sample was
prepared and scanned in the Bragg-Brentano’s 2θ range of 10 - 90° with step size of 0.015 and
time per step of 1.25 s which corresponds to a scan rate of 0.72degmin-1.
The relative amount of phases present in the reduction product was determined using the
Reitveld method. The Reitveld method is a whole pattern fitting method which uses crystal
structure data and peak profile information to generate and fit calculated XRD patterns to
experimentally determined patterns by means of least squares refinements [31].
The scale factor obtained from the Reitveld method has been shown by Hill and Howard [32] to
be related to the weight of each crystalline phase in a multiphase powder mixture by the
following formula.
Wp = Sp(ZMV)p / ∑ Si ZMV ii 4.9
Where
Wp is weight of phase p in the multi-phase powder mixture,
40
S, Z, M and V are respectively the Reitveld scale factor, the number of formula units per unit
cell, the mass of the formula unit and the unit cell volume. Thus the technique requires no
laborious preparation of calibration standards for determining accurately relative phase amounts.
The quantitative analyses on the reduction product were performed using Bruker AXS Topas
v.2.1 software program. Input data for all identified phases in the XRD pattern of the reduction
products were taken from Inorganic Crystal Structure Database (ICSD).
The parameters that were refined included individual structural properties of the identified
phases, their x-ray absorption, particle size, lattice parameters, preferred orientation and user
defined peak profile function.
The background of each XRD pattern was refined by Chebyshev 10th order polynomial and the
modified pseudo-Voigt function was used to model the peak shape profile. Linear or micro-
absorption of phases in the sample as well as zero displacement was also refined [33].
4.9 Post-Reduction Purification and Analyses
4.9.1 Leaching of Reduction Products-Kinetic Study The kinetics of first stage post- reduction leaching was investigated to determine effect of
leaching agent type and concentrations, as well as temperature and time on the dissolution of the
magnesium by–product phases in the reduction product. The reduction product having initial
charge composition of 5 wt% excess magnesium was manually ground in agate mortar and
passed through US Tyler Sieve # 48 (0.297 mm) in order to ensure uniformly close sized
particles. The leaching agents tested were hydrochloric acid (HCl) and mixtures of hydrochloric
acid and acetic acid (CH3COOH). The leaching temperatures investigated were 20, 35, 50 and 70
°C. Leaching times were varied from few seconds to one (1) hour.
All leaching kinetic studies were done using an aqua-bath (Barnstead) for close control of
temperature. The set-up for leaching kinetic study is as shown in Figure 4.8.
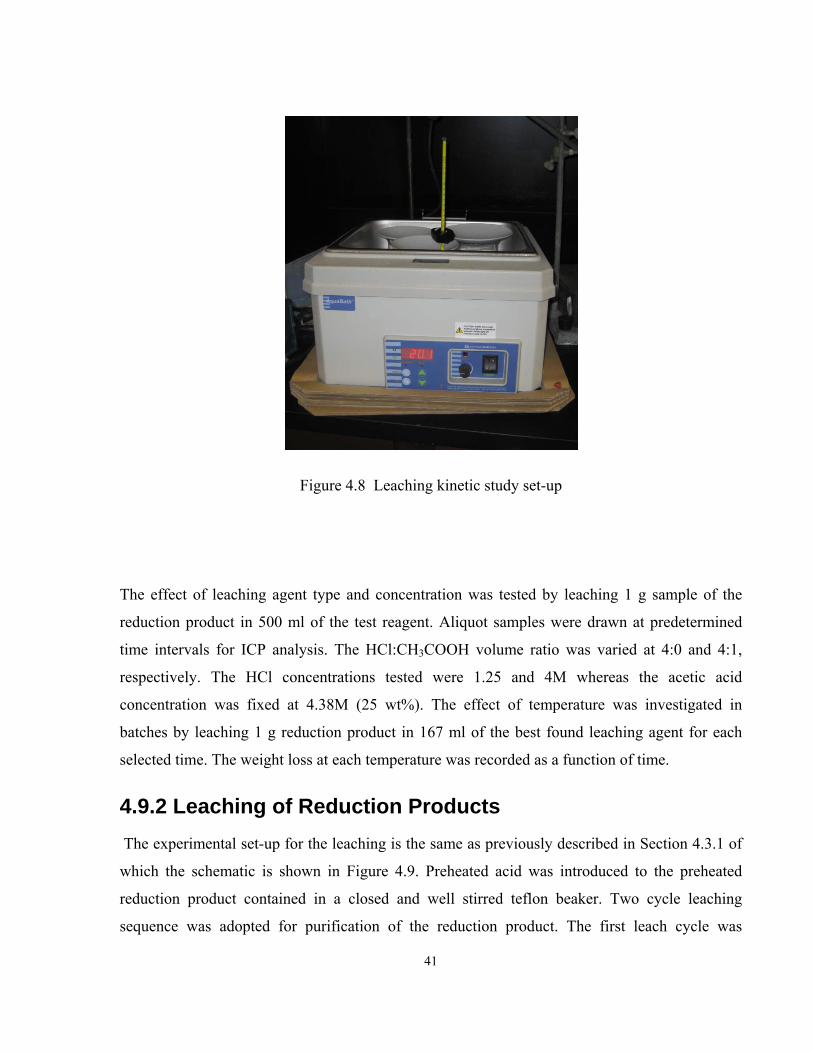
41
Figure 4.8 Leaching kinetic study set-up
The effect of leaching agent type and concentration was tested by leaching 1 g sample of the
reduction product in 500 ml of the test reagent. Aliquot samples were drawn at predetermined
time intervals for ICP analysis. The HCl:CH3COOH volume ratio was varied at 4:0 and 4:1,
respectively. The HCl concentrations tested were 1.25 and 4M whereas the acetic acid
concentration was fixed at 4.38M (25 wt%). The effect of temperature was investigated in
batches by leaching 1 g reduction product in 167 ml of the best found leaching agent for each
selected time. The weight loss at each temperature was recorded as a function of time.
4.9.2 Leaching of Reduction Products The experimental set-up for the leaching is the same as previously described in Section 4.3.1 of
which the schematic is shown in Figure 4.9. Preheated acid was introduced to the preheated
reduction product contained in a closed and well stirred teflon beaker. Two cycle leaching
sequence was adopted for purification of the reduction product. The first leach cycle was
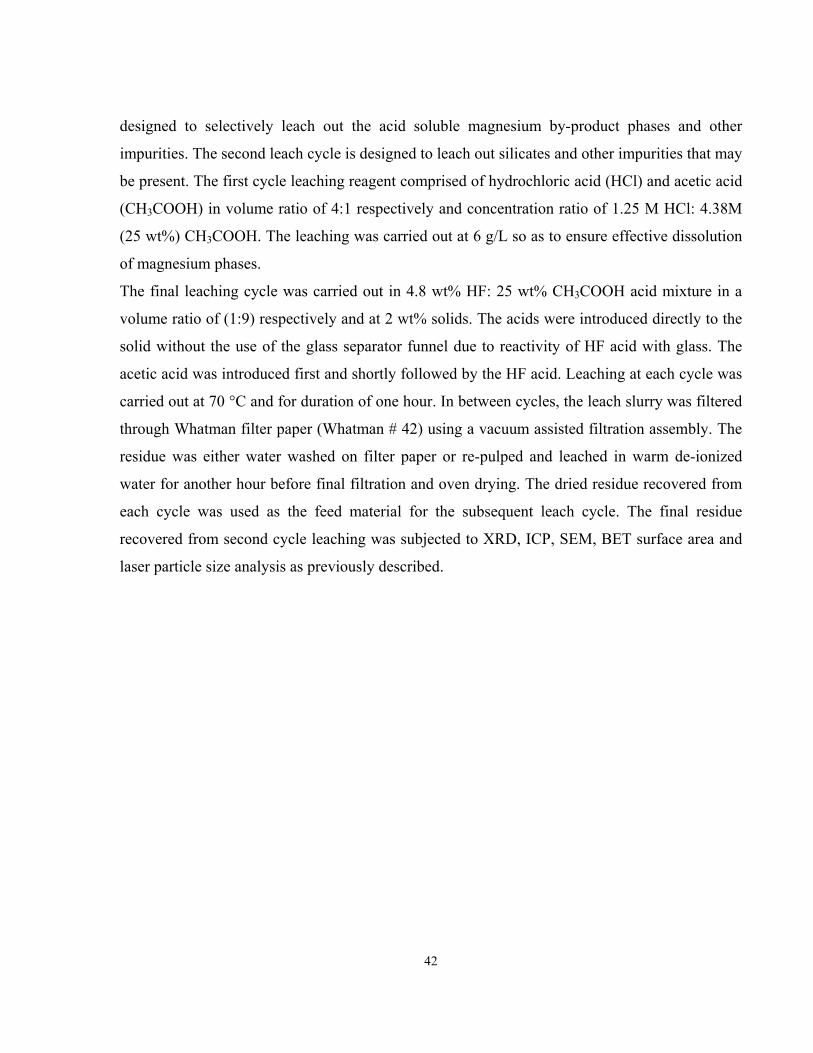
42
designed to selectively leach out the acid soluble magnesium by-product phases and other
impurities. The second leach cycle is designed to leach out silicates and other impurities that may
be present. The first cycle leaching reagent comprised of hydrochloric acid (HCl) and acetic acid
(CH3COOH) in volume ratio of 4:1 respectively and concentration ratio of 1.25 M HCl: 4.38M
(25 wt%) CH3COOH. The leaching was carried out at 6 g/L so as to ensure effective dissolution
of magnesium phases.
The final leaching cycle was carried out in 4.8 wt% HF: 25 wt% CH3COOH acid mixture in a
volume ratio of (1:9) respectively and at 2 wt% solids. The acids were introduced directly to the
solid without the use of the glass separator funnel due to reactivity of HF acid with glass. The
acetic acid was introduced first and shortly followed by the HF acid. Leaching at each cycle was
carried out at 70 °C and for duration of one hour. In between cycles, the leach slurry was filtered
through Whatman filter paper (Whatman # 42) using a vacuum assisted filtration assembly. The
residue was either water washed on filter paper or re-pulped and leached in warm de-ionized
water for another hour before final filtration and oven drying. The dried residue recovered from
each cycle was used as the feed material for the subsequent leach cycle. The final residue
recovered from second cycle leaching was subjected to XRD, ICP, SEM, BET surface area and
laser particle size analysis as previously described.
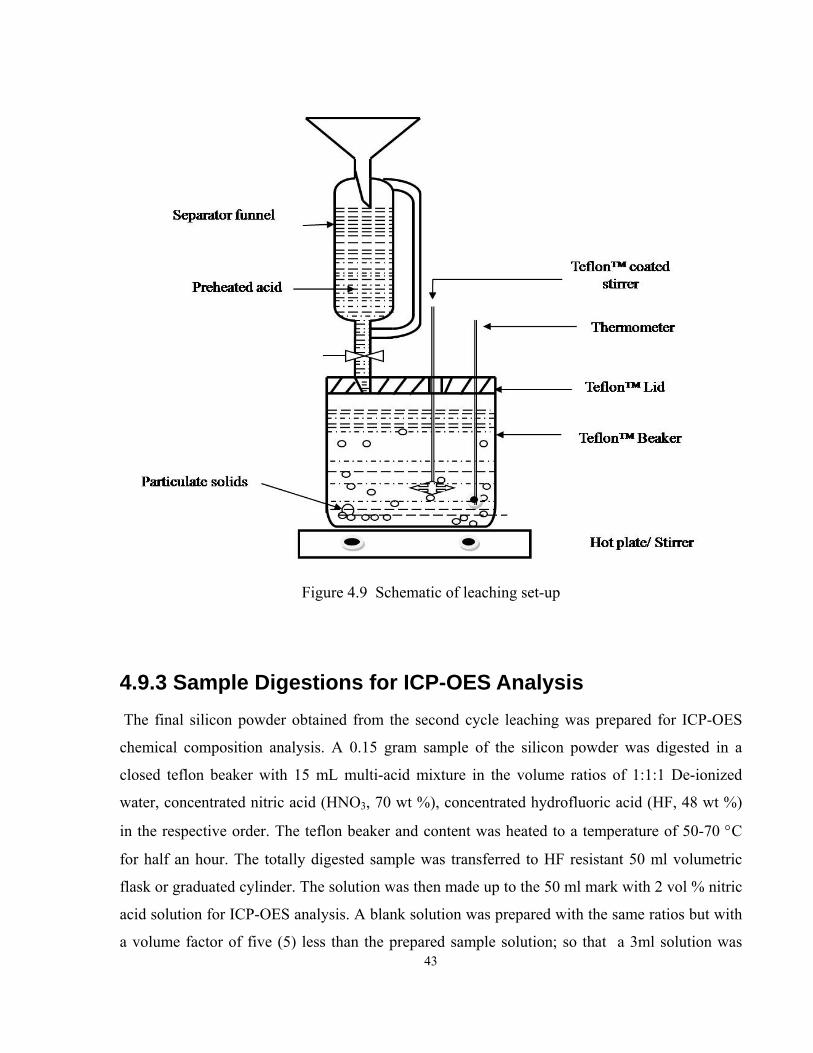
43
Figure 4.9 Schematic of leaching set-up
4.9.3 Sample Digestions for ICP-OES Analysis The final silicon powder obtained from the second cycle leaching was prepared for ICP-OES
chemical composition analysis. A 0.15 gram sample of the silicon powder was digested in a
closed teflon beaker with 15 mL multi-acid mixture in the volume ratios of 1:1:1 De-ionized
water, concentrated nitric acid (HNO3, 70 wt %), concentrated hydrofluoric acid (HF, 48 wt %)
in the respective order. The teflon beaker and content was heated to a temperature of 50-70 °C
for half an hour. The totally digested sample was transferred to HF resistant 50 ml volumetric
flask or graduated cylinder. The solution was then made up to the 50 ml mark with 2 vol % nitric
acid solution for ICP-OES analysis. A blank solution was prepared with the same ratios but with
a volume factor of five (5) less than the prepared sample solution; so that a 3ml solution was
44
diluted with 2 vol% nitric acid to 10 mL to form the blank solution. The calculation for the
impurity element (analyte) in the solid silicon sample is given by the following expression:
Analyte in (Si)solid in ppm= 1000×C′(mg
L )×prep Vol(L)
wt of Si (g) 4.10
Where, C′ is the difference between measured ICP-OES concentration of the analyte in the
sample and that in the blank solution.
When the difference results in a negative concentration, the minimum quantifiable detection
limit (D) of the ICP instrument for that analyte is used. The equation becomes;
Analyte in (Si) solid in ppm = 1000 D(mg
L ) prep Vol(L)
wt of Si (g) 4.11
4.10 Test Melting of Silicon Powders Samples of the silicon powders obtained after the second cycle leaching were compacted at room
temperature (with no addition of binders) into 2.5 g disc pellets. A 5 g sample in the form of two
disc pellets was contained in a sealed alumina crucible. The crucible and contents were then
placed in the hot-zone of a vertical tube furnace and heated at 100 °C /hr to 1500 °C under
flowing argon. The hold time at 1500 °C was kept at four (4) hours after which cooling to room
temperature was allowed at 100 °C/hr. Figure 4.10 shows silicon compact and furnace set-up
used in the test melting experiment.
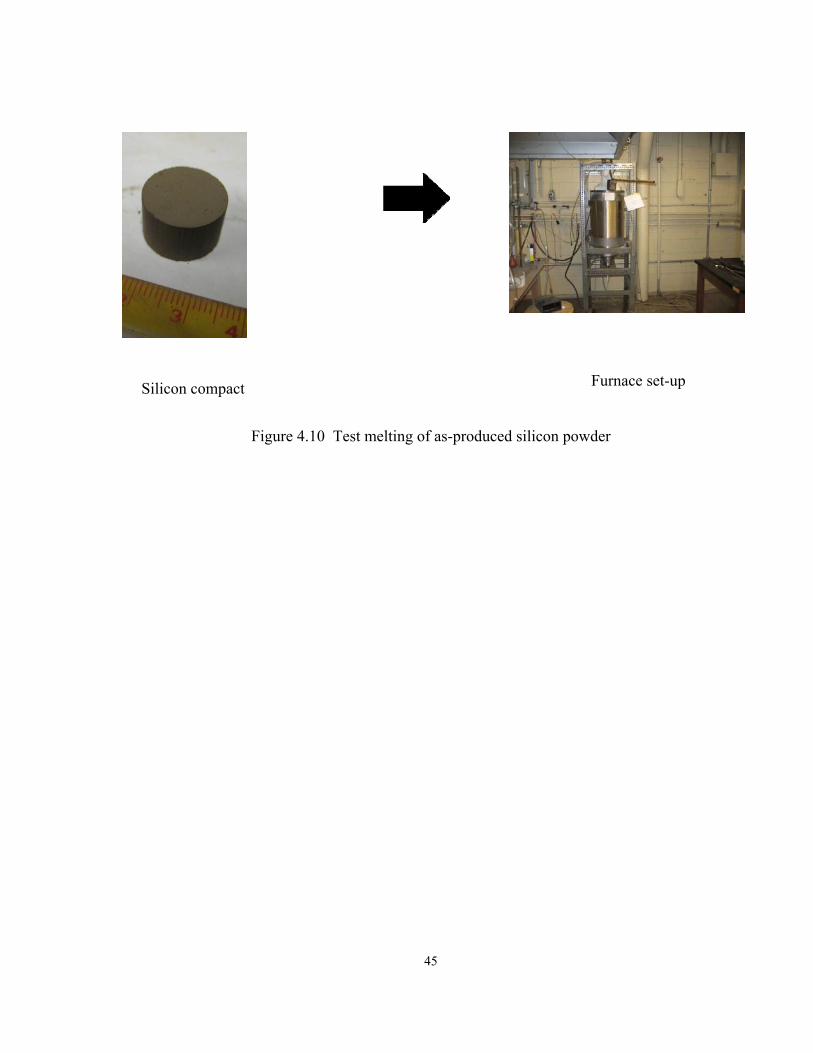
45
Figure 4.10 Test melting of as-produced silicon powder
Silicon compact Furnace set-up
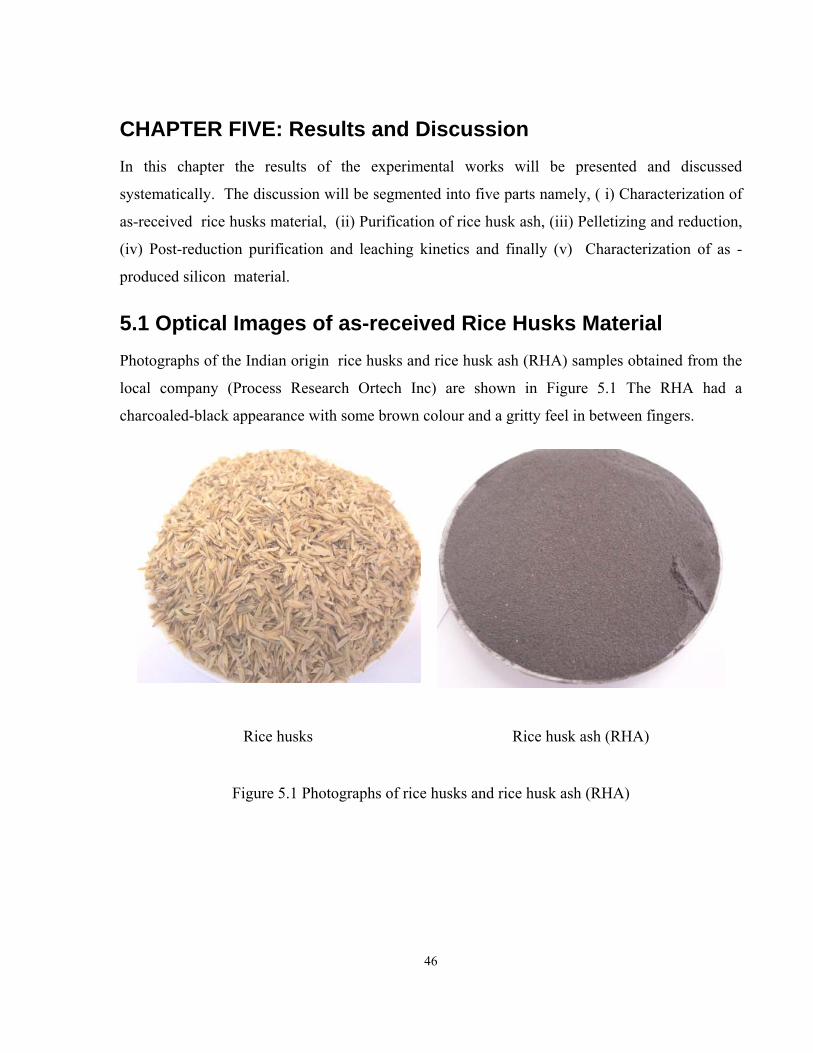
46
CHAPTER FIVE: Results and Discussion In this chapter the results of the experimental works will be presented and discussed
systematically. The discussion will be segmented into five parts namely, ( i) Characterization of
as-received rice husks material, (ii) Purification of rice husk ash, (iii) Pelletizing and reduction,
(iv) Post-reduction purification and leaching kinetics and finally (v) Characterization of as -
produced silicon material.
5.1 Optical Images of as-received Rice Husks Material Photographs of the Indian origin rice husks and rice husk ash (RHA) samples obtained from the
local company (Process Research Ortech Inc) are shown in Figure 5.1 The RHA had a
charcoaled-black appearance with some brown colour and a gritty feel in between fingers.
Rice husks Rice husk ash (RHA)
Figure 5.1 Photographs of rice husks and rice husk ash (RHA)
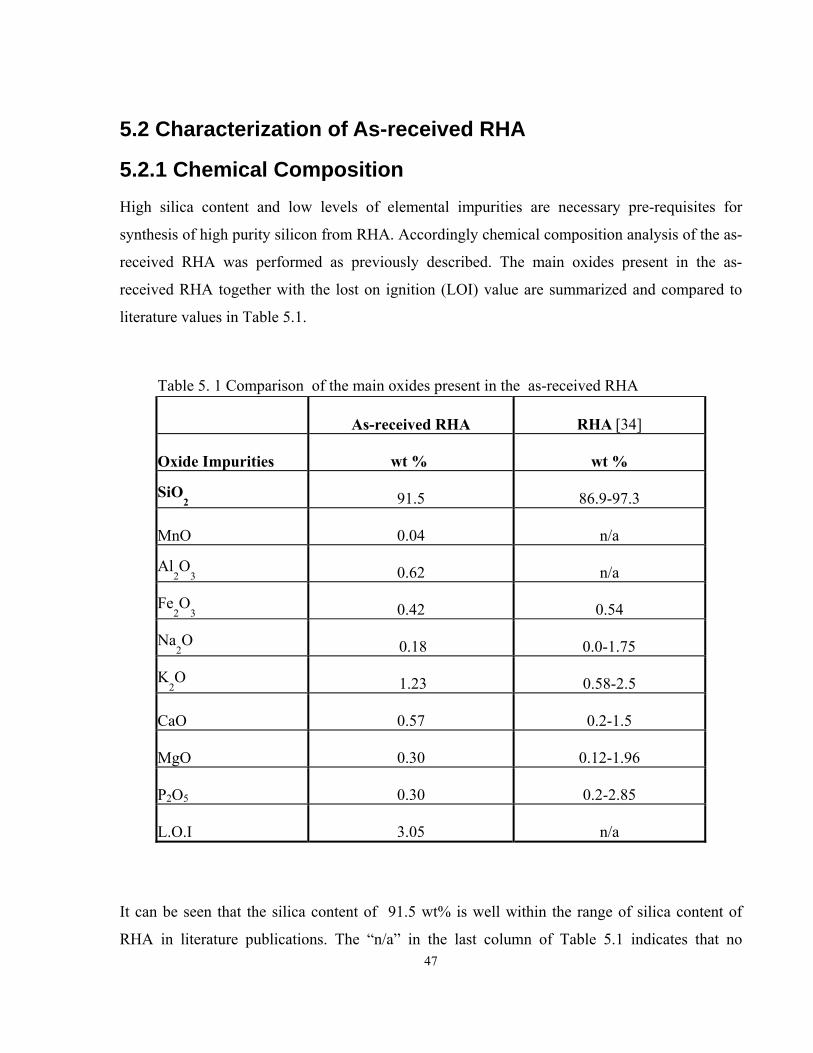
47
5.2 Characterization of As-received RHA
5.2.1 Chemical Composition High silica content and low levels of elemental impurities are necessary pre-requisites for
synthesis of high purity silicon from RHA. Accordingly chemical composition analysis of the as-
received RHA was performed as previously described. The main oxides present in the as-
received RHA together with the lost on ignition (LOI) value are summarized and compared to
literature values in Table 5.1.
It can be seen that the silica content of 91.5 wt% is well within the range of silica content of
RHA in literature publications. The “n/a” in the last column of Table 5.1 indicates that no
Table 5. 1 Comparison of the main oxides present in the as-received RHA
As-received RHA RHA [34]
Oxide Impurities wt % wt %
SiO2 91.5 86.9-97.3
MnO 0.04 n/a
Al2O
3 0.62 n/a
Fe2O
3 0.42 0.54
Na2O 0.18 0.0-1.75
K2O 1.23 0.58-2.5
CaO 0.57 0.2-1.5
MgO 0.30 0.12-1.96
P2O5 0.30 0.2-2.85
L.O.I 3.05 n/a
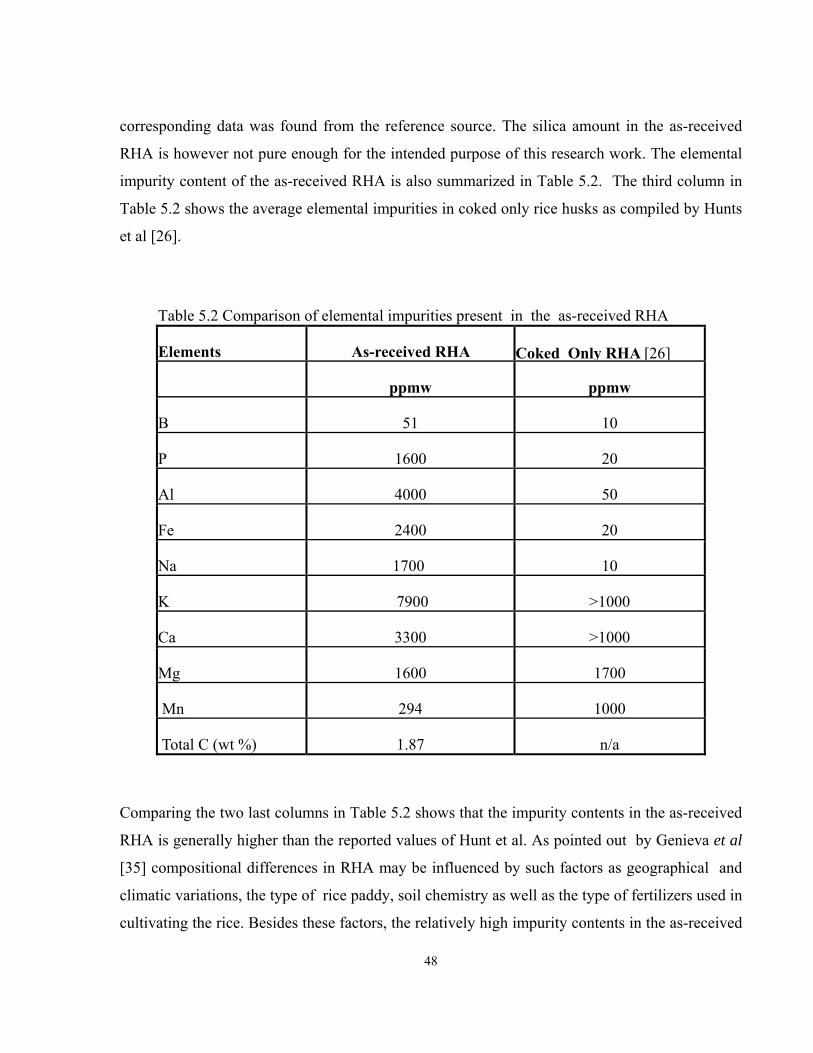
48
corresponding data was found from the reference source. The silica amount in the as-received
RHA is however not pure enough for the intended purpose of this research work. The elemental
impurity content of the as-received RHA is also summarized in Table 5.2. The third column in
Table 5.2 shows the average elemental impurities in coked only rice husks as compiled by Hunts
et al [26].
Comparing the two last columns in Table 5.2 shows that the impurity contents in the as-received
RHA is generally higher than the reported values of Hunt et al. As pointed out by Genieva et al
[35] compositional differences in RHA may be influenced by such factors as geographical and
climatic variations, the type of rice paddy, soil chemistry as well as the type of fertilizers used in
cultivating the rice. Besides these factors, the relatively high impurity contents in the as-received
Table 5.2 Comparison of elemental impurities present in the as-received RHA
Elements As-received RHA Coked Only RHA [26]
ppmw ppmw
B 51 10
P 1600 20
Al 4000 50
Fe 2400 20
Na 1700 10
K 7900 >1000
Ca 3300 >1000
Mg 1600 1700
Mn 294 1000
Total C (wt %) 1.87 n/a
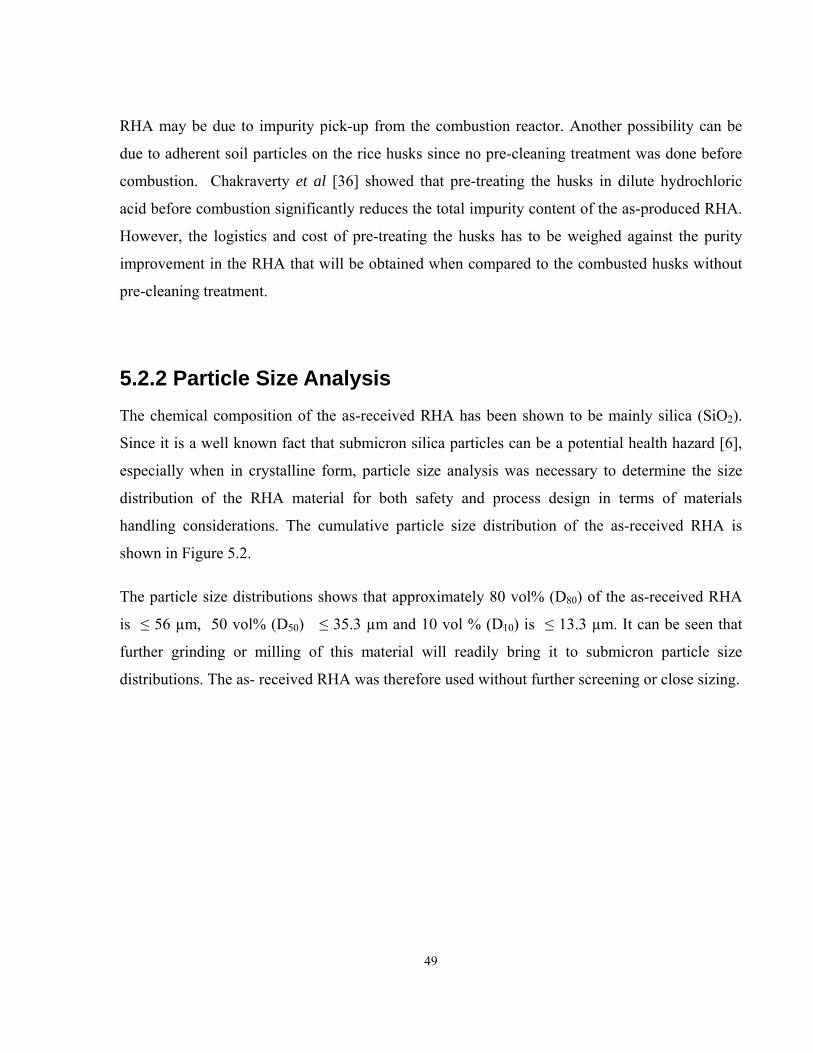
49
RHA may be due to impurity pick-up from the combustion reactor. Another possibility can be
due to adherent soil particles on the rice husks since no pre-cleaning treatment was done before
combustion. Chakraverty et al [36] showed that pre-treating the husks in dilute hydrochloric
acid before combustion significantly reduces the total impurity content of the as-produced RHA.
However, the logistics and cost of pre-treating the husks has to be weighed against the purity
improvement in the RHA that will be obtained when compared to the combusted husks without
pre-cleaning treatment.
5.2.2 Particle Size Analysis The chemical composition of the as-received RHA has been shown to be mainly silica (SiO2).
Since it is a well known fact that submicron silica particles can be a potential health hazard [6],
especially when in crystalline form, particle size analysis was necessary to determine the size
distribution of the RHA material for both safety and process design in terms of materials
handling considerations. The cumulative particle size distribution of the as-received RHA is
shown in Figure 5.2.
The particle size distributions shows that approximately 80 vol% (D80) of the as-received RHA
is ≤ 56 µm, 50 vol% (D50) ≤ 35.3 µm and 10 vol % (D10) is ≤ 13.3 µm. It can be seen that
further grinding or milling of this material will readily bring it to submicron particle size
distributions. The as- received RHA was therefore used without further screening or close sizing.
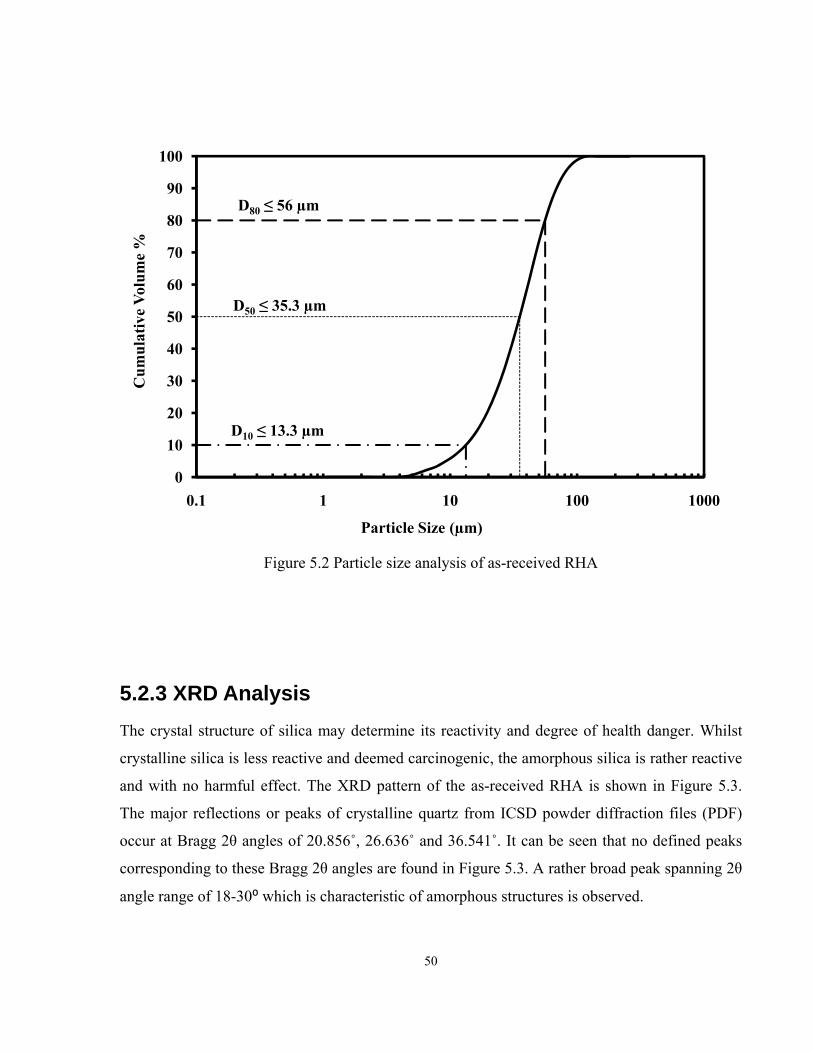
50
Figure 5.2 Particle size analysis of as-received RHA
5.2.3 XRD Analysis The crystal structure of silica may determine its reactivity and degree of health danger. Whilst
crystalline silica is less reactive and deemed carcinogenic, the amorphous silica is rather reactive
and with no harmful effect. The XRD pattern of the as-received RHA is shown in Figure 5.3.
The major reflections or peaks of crystalline quartz from ICSD powder diffraction files (PDF)
occur at Bragg 2θ angles of 20.856˚, 26.636˚ and 36.541˚. It can be seen that no defined peaks
corresponding to these Bragg 2θ angles are found in Figure 5.3. A rather broad peak spanning 2θ
angle range of 18-30⁰ which is characteristic of amorphous structures is observed.
0
10
20
30
40
50
60
70
80
90
100
0.1 1 10 100 1000
Cum
ulat
ive
Volu
me
%
Particle Size (µm)
D50 ≤ 35.3 µm
D80 ≤ 56 µm
D10 ≤ 13.3 µm
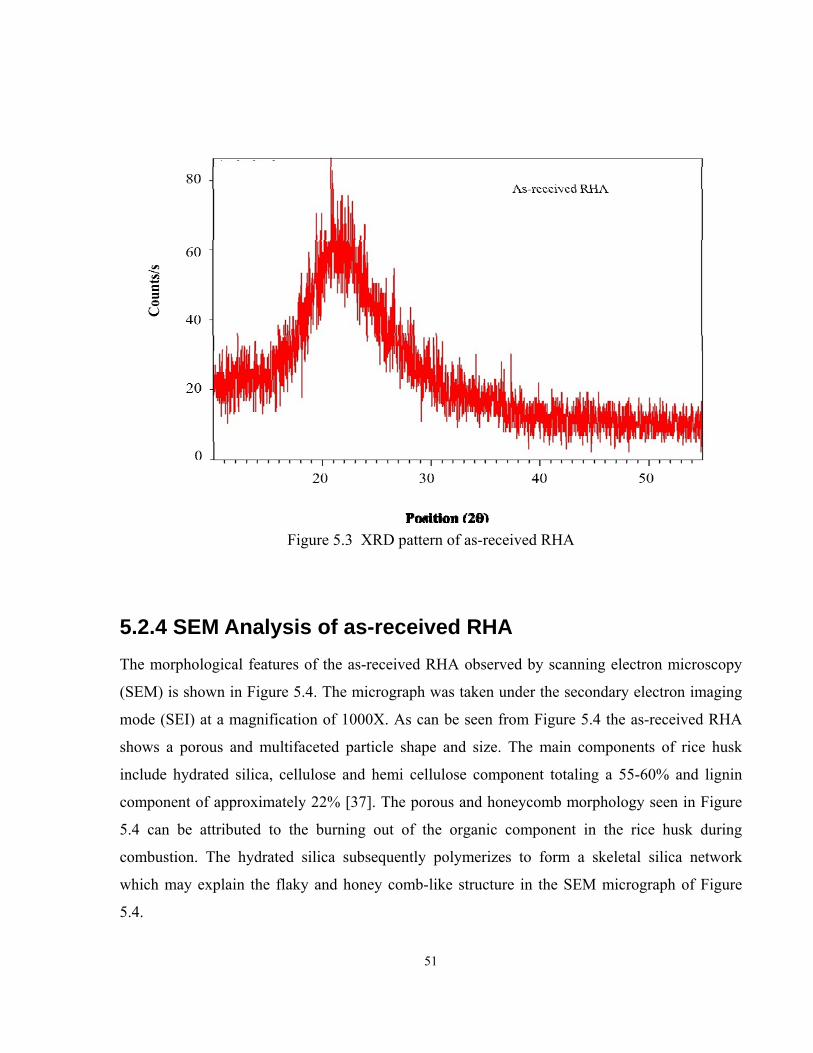
51
Figure 5.3 XRD pattern of as-received RHA
5.2.4 SEM Analysis of as-received RHA The morphological features of the as-received RHA observed by scanning electron microscopy
(SEM) is shown in Figure 5.4. The micrograph was taken under the secondary electron imaging
mode (SEI) at a magnification of 1000X. As can be seen from Figure 5.4 the as-received RHA
shows a porous and multifaceted particle shape and size. The main components of rice husk
include hydrated silica, cellulose and hemi cellulose component totaling a 55-60% and lignin
component of approximately 22% [37]. The porous and honeycomb morphology seen in Figure
5.4 can be attributed to the burning out of the organic component in the rice husk during
combustion. The hydrated silica subsequently polymerizes to form a skeletal silica network
which may explain the flaky and honey comb-like structure in the SEM micrograph of Figure
5.4.
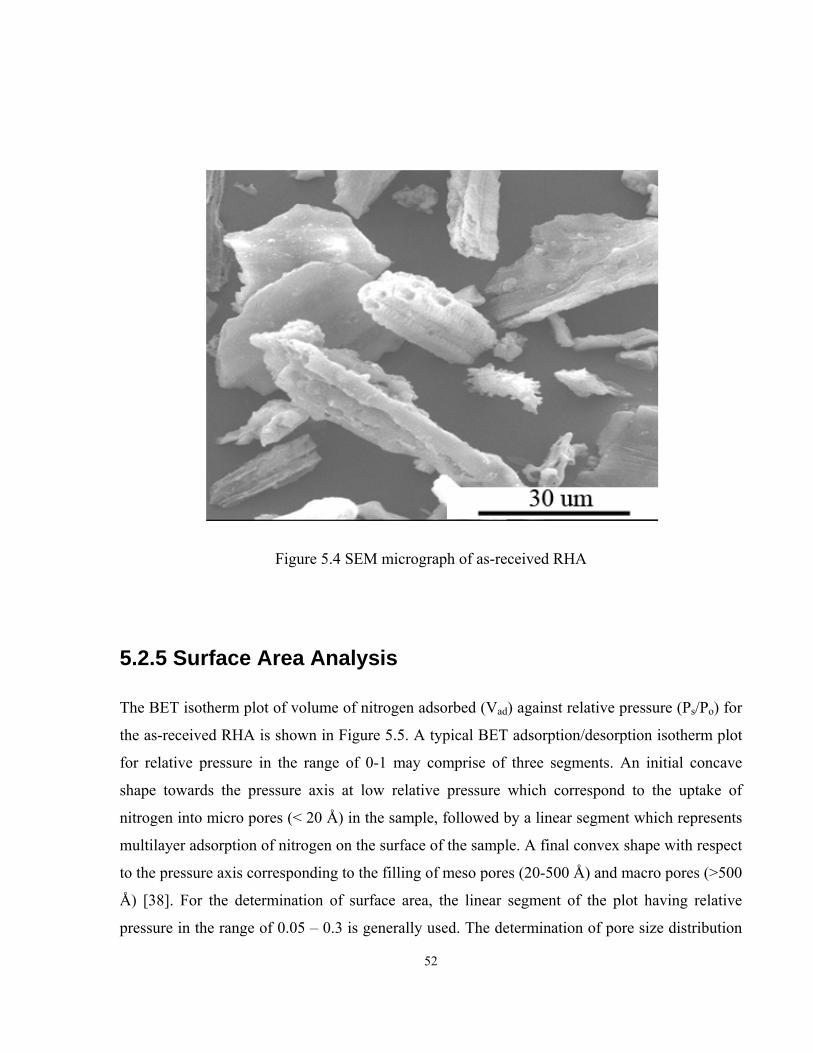
52
Figure 5.4 SEM micrograph of as-received RHA
5.2.5 Surface Area Analysis
The BET isotherm plot of volume of nitrogen adsorbed (Vad) against relative pressure (Ps/Po) for
the as-received RHA is shown in Figure 5.5. A typical BET adsorption/desorption isotherm plot
for relative pressure in the range of 0-1 may comprise of three segments. An initial concave
shape towards the pressure axis at low relative pressure which correspond to the uptake of
nitrogen into micro pores (< 20 Å) in the sample, followed by a linear segment which represents
multilayer adsorption of nitrogen on the surface of the sample. A final convex shape with respect
to the pressure axis corresponding to the filling of meso pores (20-500 Å) and macro pores (>500
Å) [38]. For the determination of surface area, the linear segment of the plot having relative
pressure in the range of 0.05 – 0.3 is generally used. The determination of pore size distribution
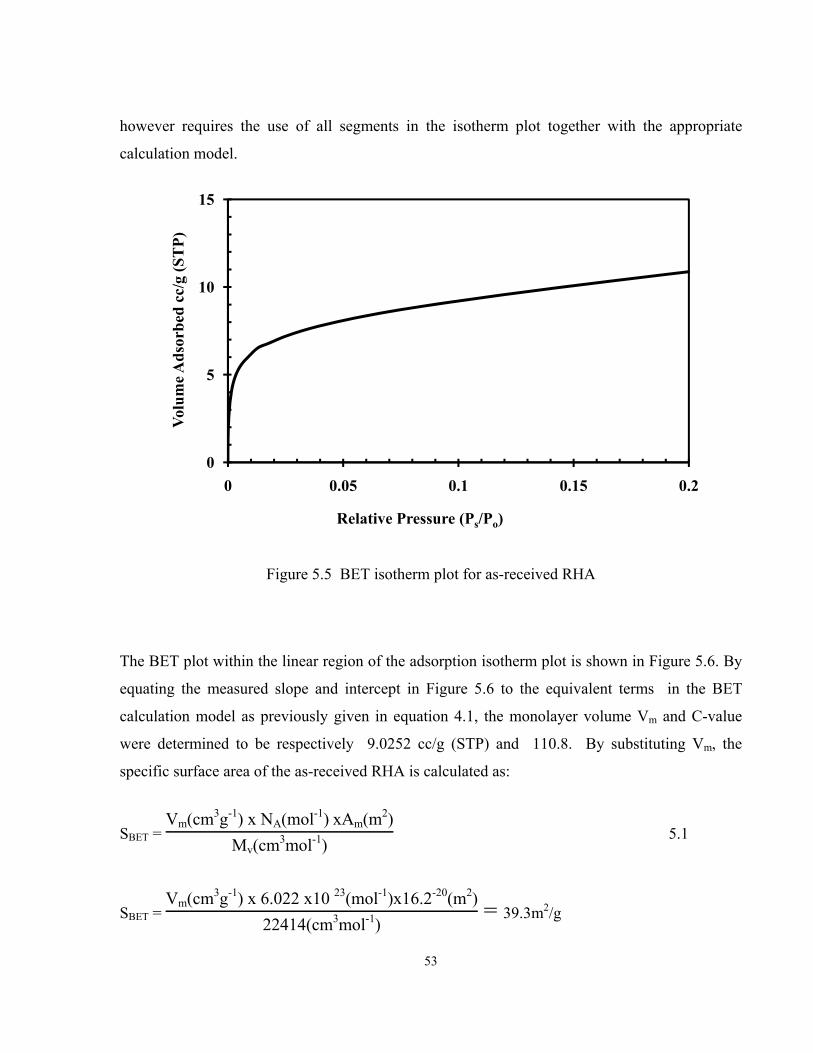
53
however requires the use of all segments in the isotherm plot together with the appropriate
calculation model.
Figure 5.5 BET isotherm plot for as-received RHA
The BET plot within the linear region of the adsorption isotherm plot is shown in Figure 5.6. By
equating the measured slope and intercept in Figure 5.6 to the equivalent terms in the BET
calculation model as previously given in equation 4.1, the monolayer volume Vm and C-value
were determined to be respectively 9.0252 cc/g (STP) and 110.8. By substituting Vm, the
specific surface area of the as-received RHA is calculated as:
SBET = Vm(cm3g-1) x NA(mol-1) xAm(m2)
Mv(cm3mol-1) 5.1
SBET = Vm(cm3g-1) x 6.022 x10 23(mol-1)x16.2-20(m2)
22414(cm3mol-1) = 39.3m2/g
0
5
10
15
0 0.05 0.1 0.15 0.2
Volu
me A
dsor
bed
cc/g
(ST
P)
Relative Pressure (Ps/Po)
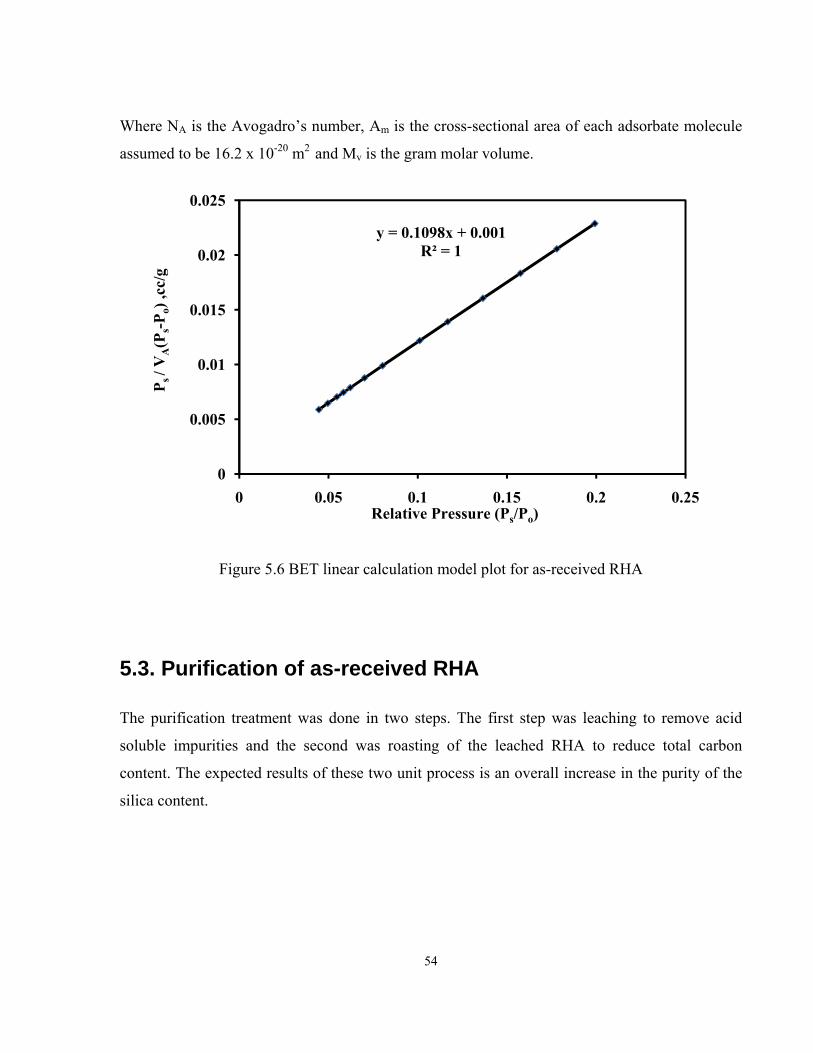
54
Where NA is the Avogadro’s number, Am is the cross-sectional area of each adsorbate molecule
assumed to be 16.2 x 10⁻²⁰ m2 and Mv is the gram molar volume.
Figure 5.6 BET linear calculation model plot for as-received RHA
5.3. Purification of as-received RHA
The purification treatment was done in two steps. The first step was leaching to remove acid
soluble impurities and the second was roasting of the leached RHA to reduce total carbon
content. The expected results of these two unit process is an overall increase in the purity of the
silica content.
y = 0.1098x + 0.001R² = 1
0
0.005
0.01
0.015
0.02
0.025
0 0.05 0.1 0.15 0.2 0.25Relative Pressure (Ps/Po)
P s /
VA(P
s-Po)
,cc/
g
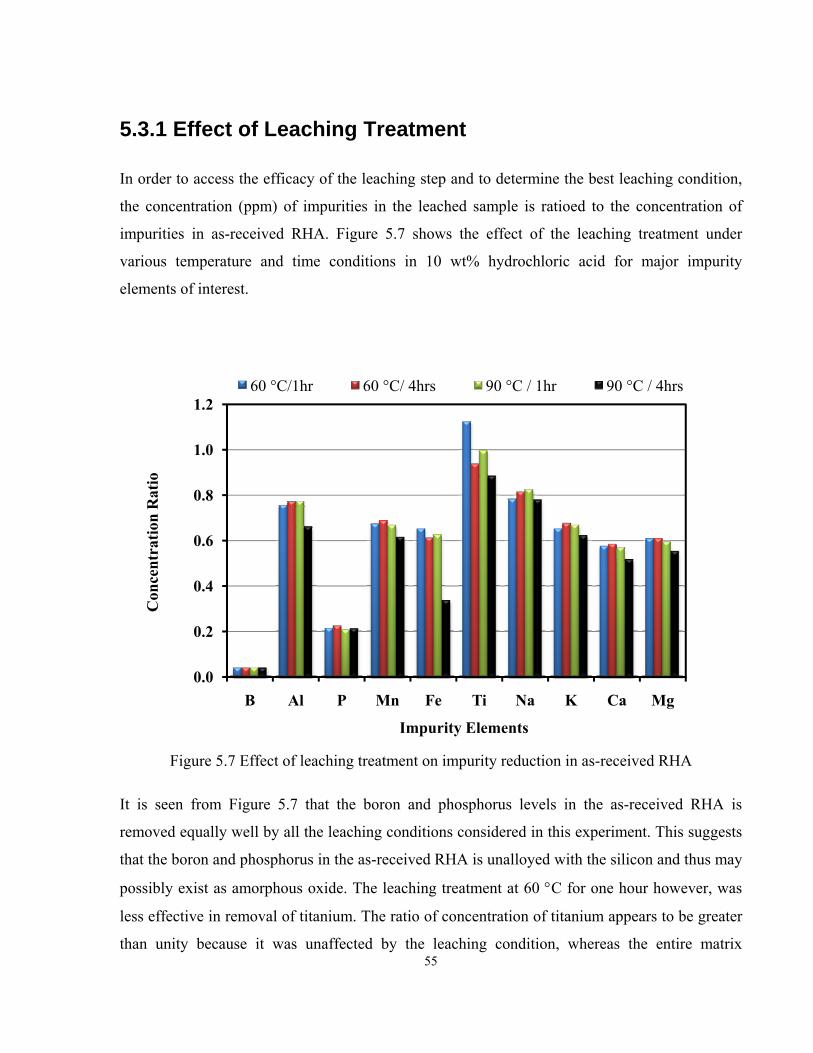
55
5.3.1 Effect of Leaching Treatment
In order to access the efficacy of the leaching step and to determine the best leaching condition,
the concentration (ppm) of impurities in the leached sample is ratioed to the concentration of
impurities in as-received RHA. Figure 5.7 shows the effect of the leaching treatment under
various temperature and time conditions in 10 wt% hydrochloric acid for major impurity
elements of interest.
Figure 5.7 Effect of leaching treatment on impurity reduction in as-received RHA
It is seen from Figure 5.7 that the boron and phosphorus levels in the as-received RHA is
removed equally well by all the leaching conditions considered in this experiment. This suggests
that the boron and phosphorus in the as-received RHA is unalloyed with the silicon and thus may
possibly exist as amorphous oxide. The leaching treatment at 60 °C for one hour however, was
less effective in removal of titanium. The ratio of concentration of titanium appears to be greater
than unity because it was unaffected by the leaching condition, whereas the entire matrix
0.0
0.2
0.4
0.6
0.8
1.0
1.2
B Al P Mn Fe Ti Na K Ca Mg
60 °C/1hr 60 °C/ 4hrs 90 °C / 1hr 90 °C / 4hrs
Con
cent
ratio
n R
atio
Impurity Elements
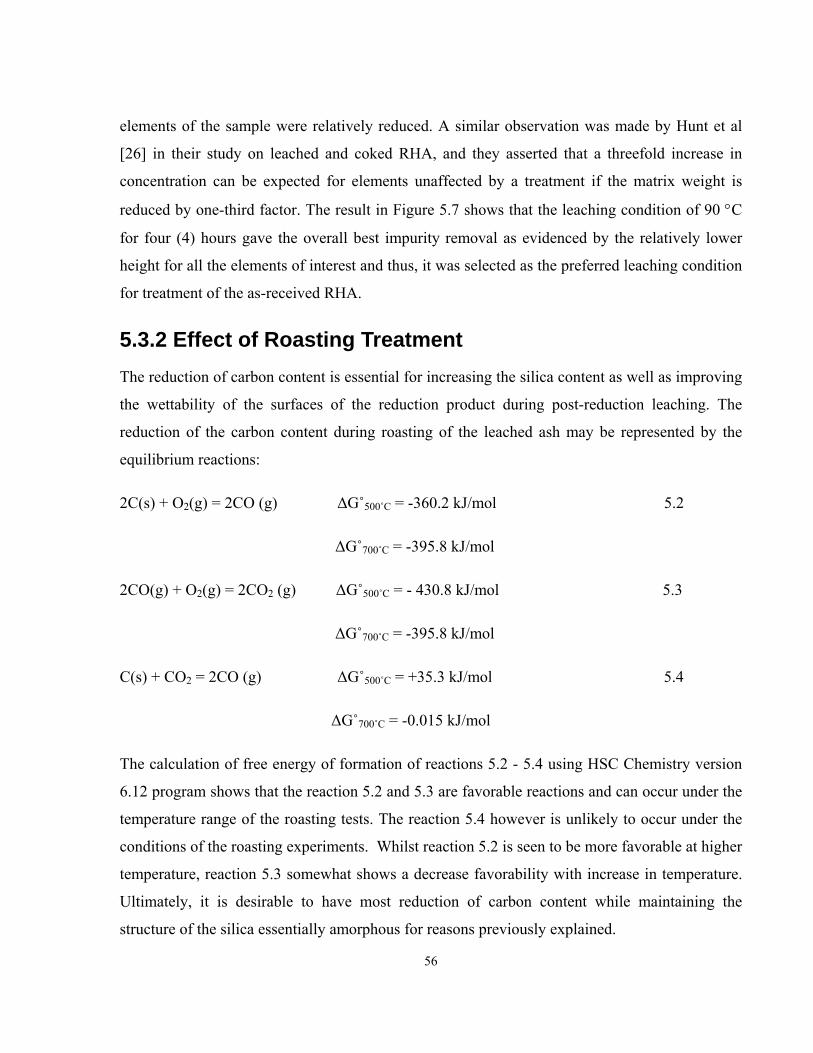
56
elements of the sample were relatively reduced. A similar observation was made by Hunt et al
[26] in their study on leached and coked RHA, and they asserted that a threefold increase in
concentration can be expected for elements unaffected by a treatment if the matrix weight is
reduced by one-third factor. The result in Figure 5.7 shows that the leaching condition of 90 °C
for four (4) hours gave the overall best impurity removal as evidenced by the relatively lower
height for all the elements of interest and thus, it was selected as the preferred leaching condition
for treatment of the as-received RHA.
5.3.2 Effect of Roasting Treatment The reduction of carbon content is essential for increasing the silica content as well as improving
the wettability of the surfaces of the reduction product during post-reduction leaching. The
reduction of the carbon content during roasting of the leached ash may be represented by the
equilibrium reactions:
2C(s) + O2(g) = 2CO (g) ΔG˚500˚C = -360.2 kJ/mol 5.2
ΔG˚700˚C = -395.8 kJ/mol
2CO(g) + O2(g) = 2CO2 (g) ΔG˚500˚C = - 430.8 kJ/mol 5.3
ΔG˚700˚C = -395.8 kJ/mol
C(s) + CO2 = 2CO (g) ΔG˚500˚C = +35.3 kJ/mol 5.4
ΔG˚700˚C = -0.015 kJ/mol
The calculation of free energy of formation of reactions 5.2 - 5.4 using HSC Chemistry version
6.12 program shows that the reaction 5.2 and 5.3 are favorable reactions and can occur under the
temperature range of the roasting tests. The reaction 5.4 however is unlikely to occur under the
conditions of the roasting experiments. Whilst reaction 5.2 is seen to be more favorable at higher
temperature, reaction 5.3 somewhat shows a decrease favorability with increase in temperature.
Ultimately, it is desirable to have most reduction of carbon content while maintaining the
structure of the silica essentially amorphous for reasons previously explained.
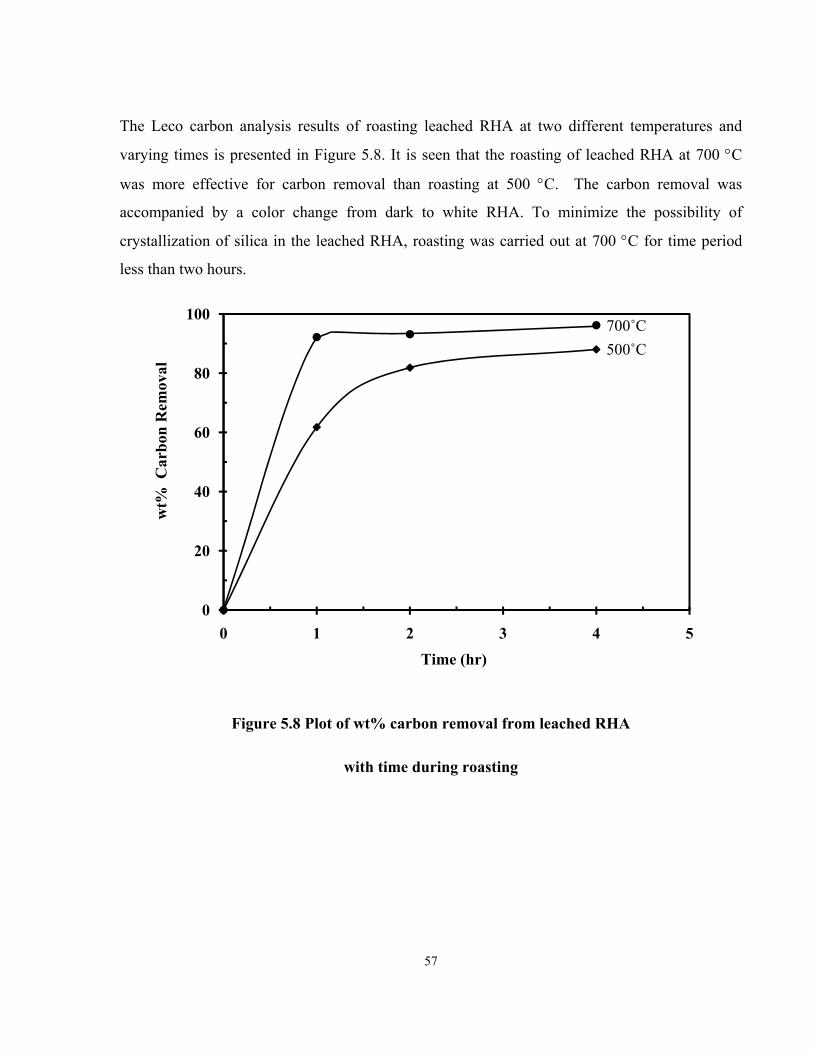
57
The Leco carbon analysis results of roasting leached RHA at two different temperatures and
varying times is presented in Figure 5.8. It is seen that the roasting of leached RHA at 700 °C
was more effective for carbon removal than roasting at 500 °C. The carbon removal was
accompanied by a color change from dark to white RHA. To minimize the possibility of
crystallization of silica in the leached RHA, roasting was carried out at 700 °C for time period
less than two hours.
Figure 5.8 Plot of wt% carbon removal from leached RHA
with time during roasting
0
20
40
60
80
100
0 1 2 3 4 5Time (hr)
wt%
Car
bon
Rem
oval
500˚C700˚C
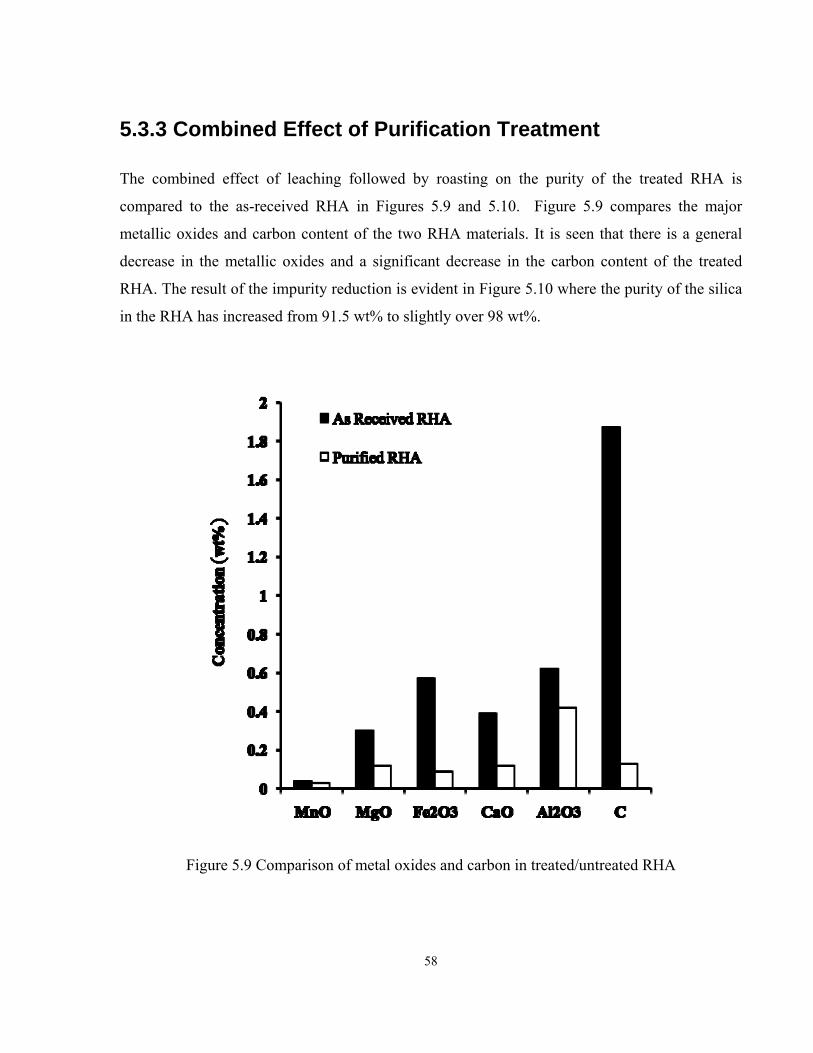
58
5.3.3 Combined Effect of Purification Treatment
The combined effect of leaching followed by roasting on the purity of the treated RHA is
compared to the as-received RHA in Figures 5.9 and 5.10. Figure 5.9 compares the major
metallic oxides and carbon content of the two RHA materials. It is seen that there is a general
decrease in the metallic oxides and a significant decrease in the carbon content of the treated
RHA. The result of the impurity reduction is evident in Figure 5.10 where the purity of the silica
in the RHA has increased from 91.5 wt% to slightly over 98 wt%.
Figure 5.9 Comparison of metal oxides and carbon in treated/untreated RHA
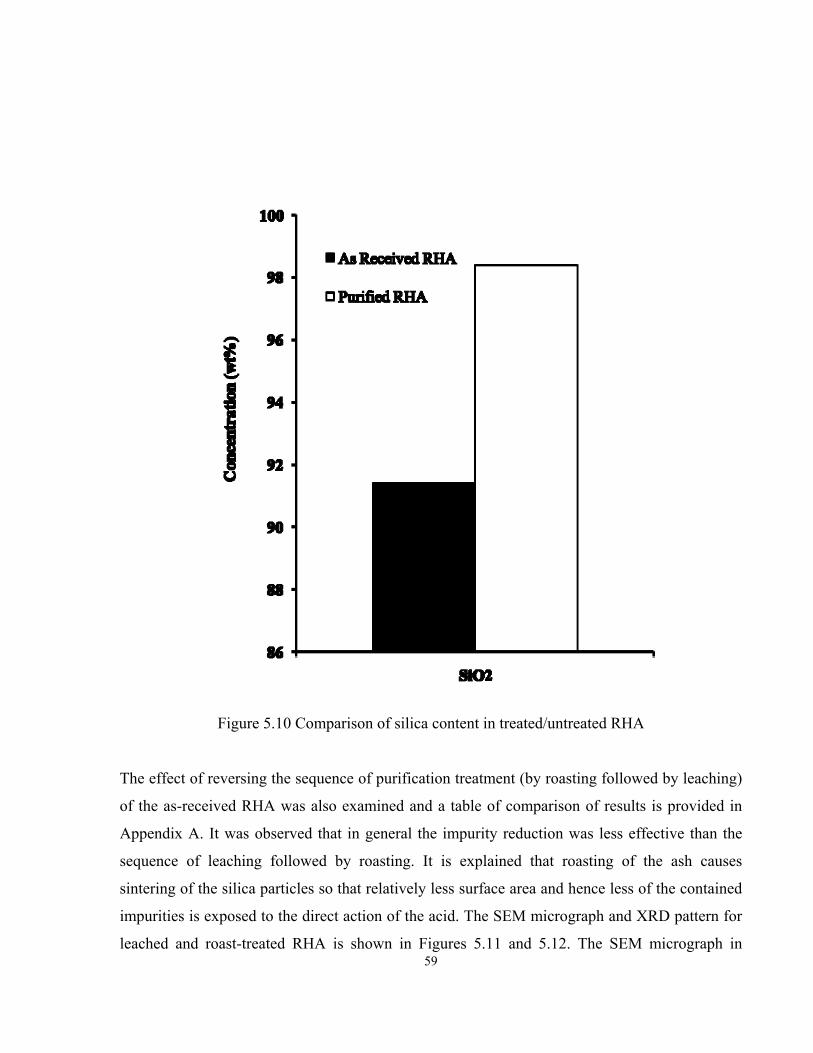
59
Figure 5.10 Comparison of silica content in treated/untreated RHA
The effect of reversing the sequence of purification treatment (by roasting followed by leaching)
of the as-received RHA was also examined and a table of comparison of results is provided in
Appendix A. It was observed that in general the impurity reduction was less effective than the
sequence of leaching followed by roasting. It is explained that roasting of the ash causes
sintering of the silica particles so that relatively less surface area and hence less of the contained
impurities is exposed to the direct action of the acid. The SEM micrograph and XRD pattern for
leached and roast-treated RHA is shown in Figures 5.11 and 5.12. The SEM micrograph in
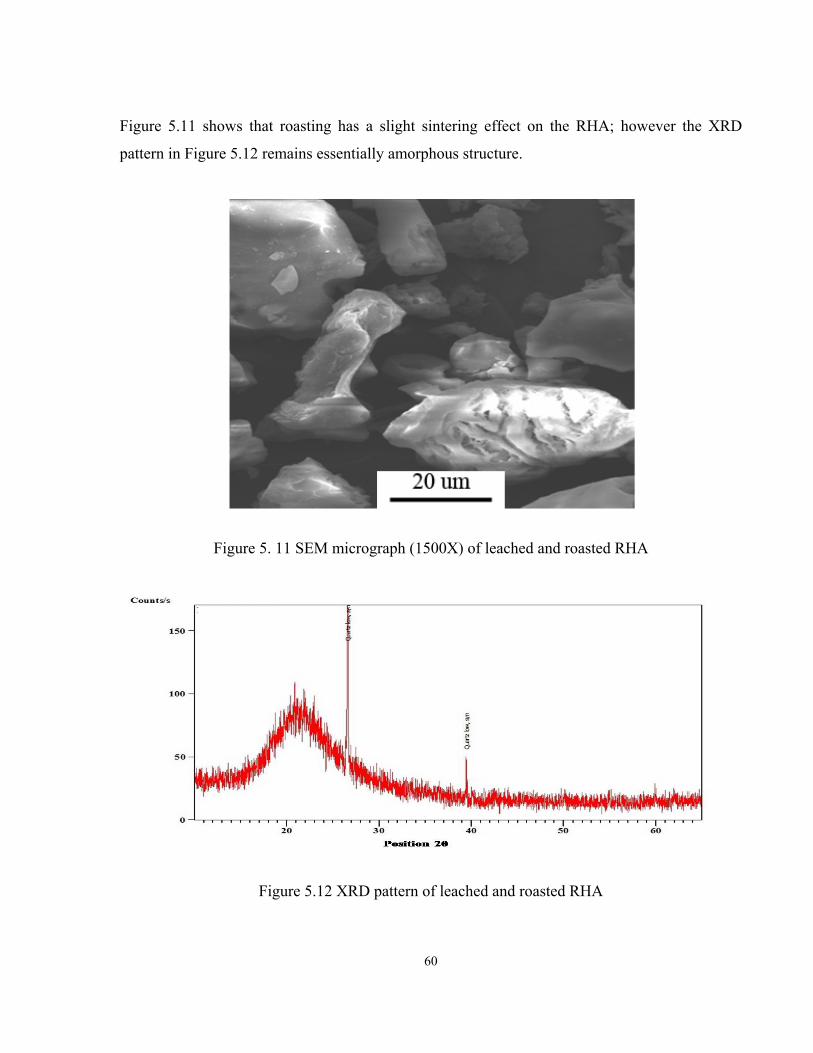
60
Figure 5.11 shows that roasting has a slight sintering effect on the RHA; however the XRD
pattern in Figure 5.12 remains essentially amorphous structure.
Figure 5. 11 SEM micrograph (1500X) of leached and roasted RHA
Figure 5.12 XRD pattern of leached and roasted RHA
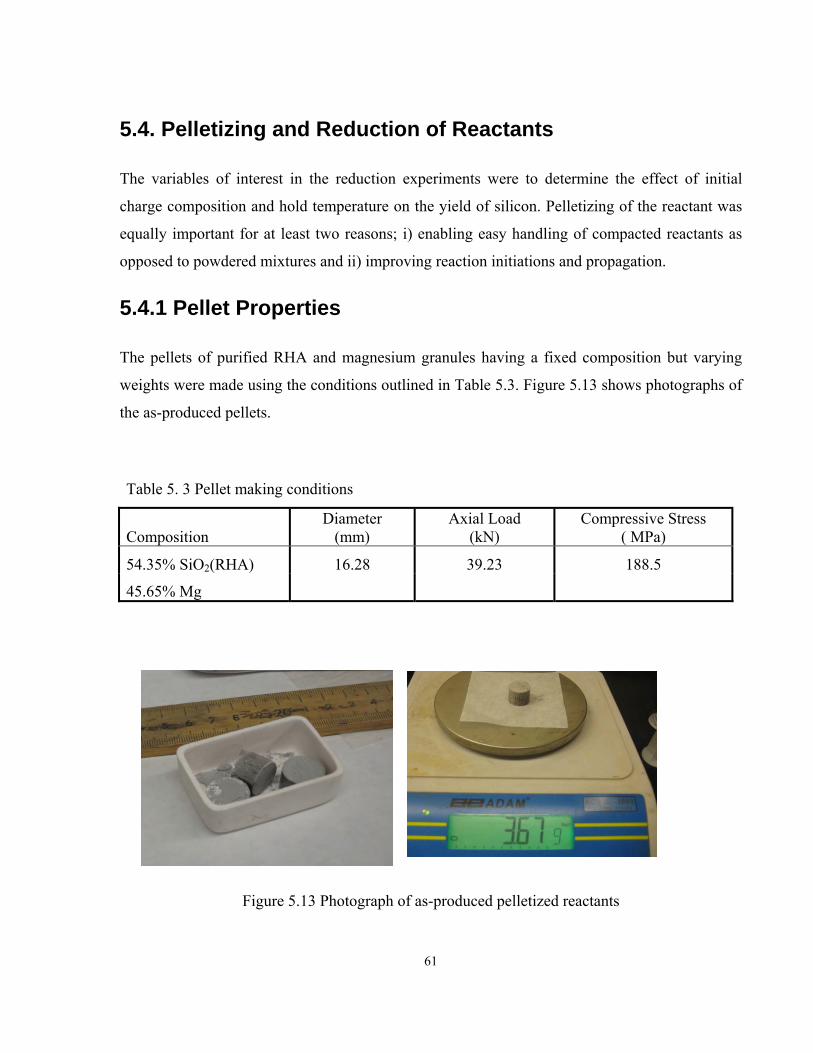
61
5.4. Pelletizing and Reduction of Reactants
The variables of interest in the reduction experiments were to determine the effect of initial
charge composition and hold temperature on the yield of silicon. Pelletizing of the reactant was
equally important for at least two reasons; i) enabling easy handling of compacted reactants as
opposed to powdered mixtures and ii) improving reaction initiations and propagation.
5.4.1 Pellet Properties
The pellets of purified RHA and magnesium granules having a fixed composition but varying
weights were made using the conditions outlined in Table 5.3. Figure 5.13 shows photographs of
the as-produced pellets.
Table 5. 3 Pellet making conditions
Composition Diameter
(mm) Axial Load
(kN) Compressive Stress
( MPa)
54.35% SiO2(RHA) 16.28 39.23 188.5
45.65% Mg
Figure 5.13 Photograph of as-produced pelletized reactants
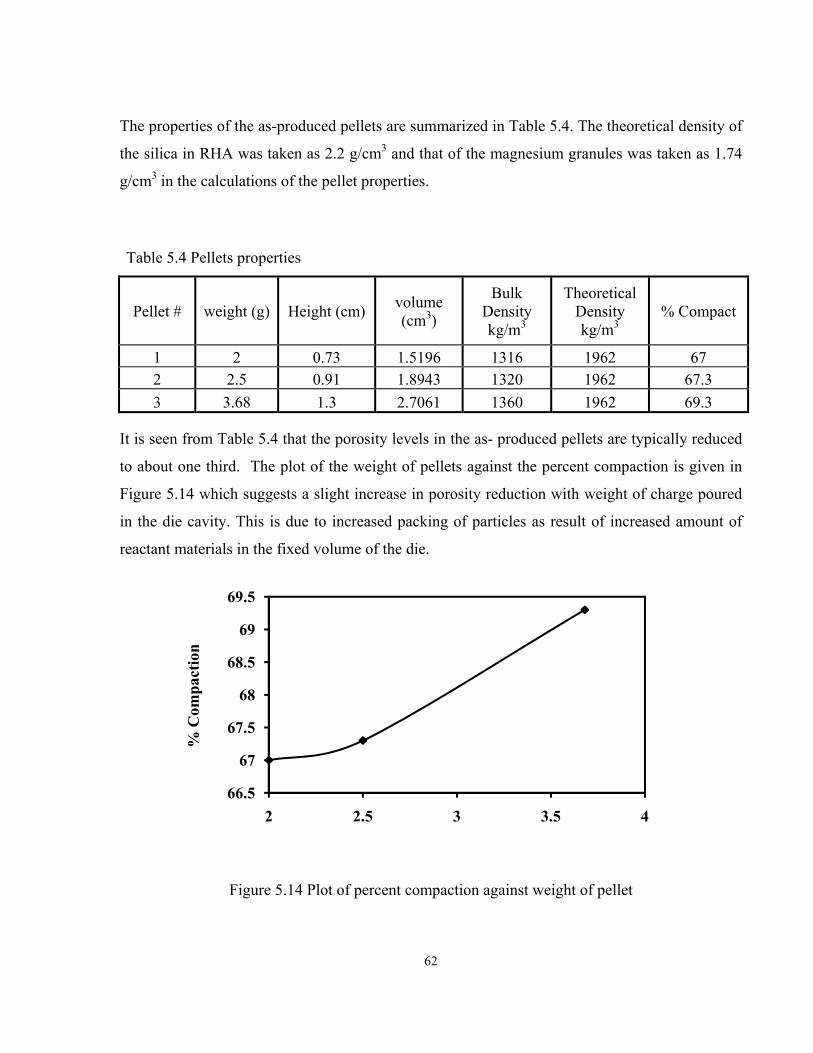
62
The properties of the as-produced pellets are summarized in Table 5.4. The theoretical density of
the silica in RHA was taken as 2.2 g/cm3 and that of the magnesium granules was taken as 1.74
g/cm3 in the calculations of the pellet properties.
Table 5.4 Pellets properties
Pellet # weight (g) Height (cm) volume (cm3)
Bulk Density kg/m3
Theoretical Density kg/m3
% Compact
1 2 0.73 1.5196 1316 1962 67 2 2.5 0.91 1.8943 1320 1962 67.3 3 3.68 1.3 2.7061 1360 1962 69.3
It is seen from Table 5.4 that the porosity levels in the as- produced pellets are typically reduced
to about one third. The plot of the weight of pellets against the percent compaction is given in
Figure 5.14 which suggests a slight increase in porosity reduction with weight of charge poured
in the die cavity. This is due to increased packing of particles as result of increased amount of
reactant materials in the fixed volume of the die.
Figure 5.14 Plot of percent compaction against weight of pellet
66.5
67
67.5
68
68.5
69
69.5
2 2.5 3 3.5 4
% C
ompa
ctio
n
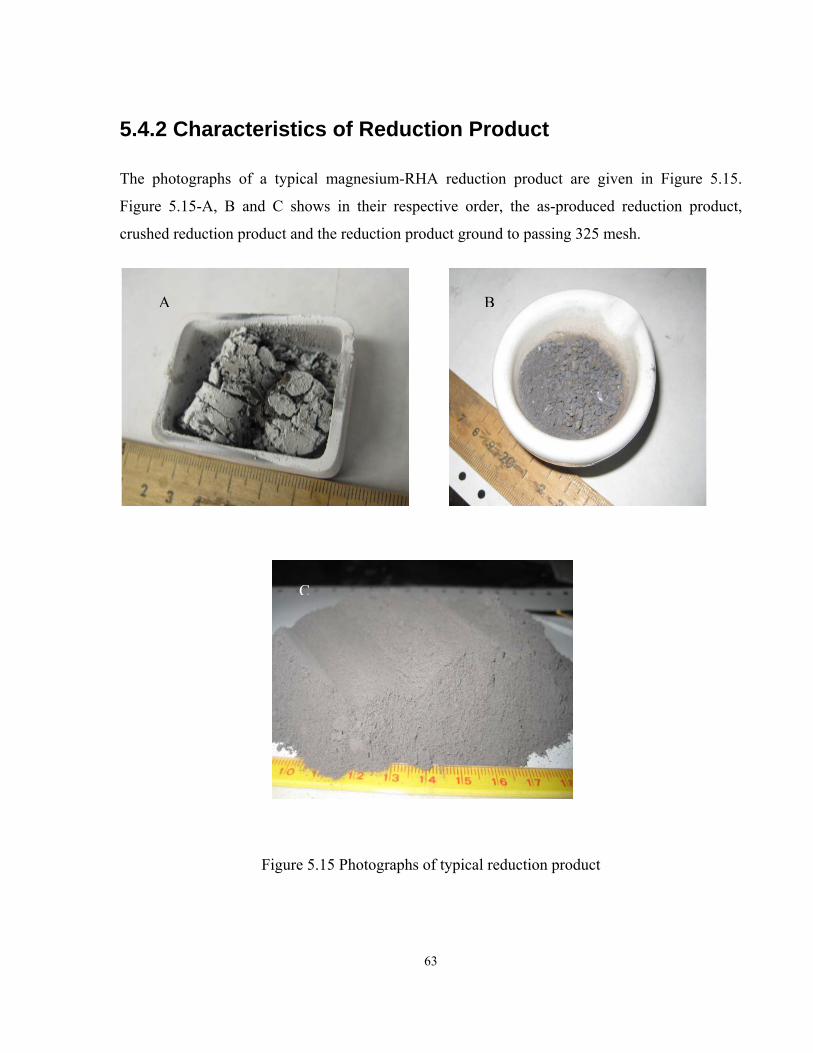
63
5.4.2 Characteristics of Reduction Product
The photographs of a typical magnesium-RHA reduction product are given in Figure 5.15.
Figure 5.15-A, B and C shows in their respective order, the as-produced reduction product,
crushed reduction product and the reduction product ground to passing 325 mesh.
Figure 5.15 Photographs of typical reduction product
A B
C
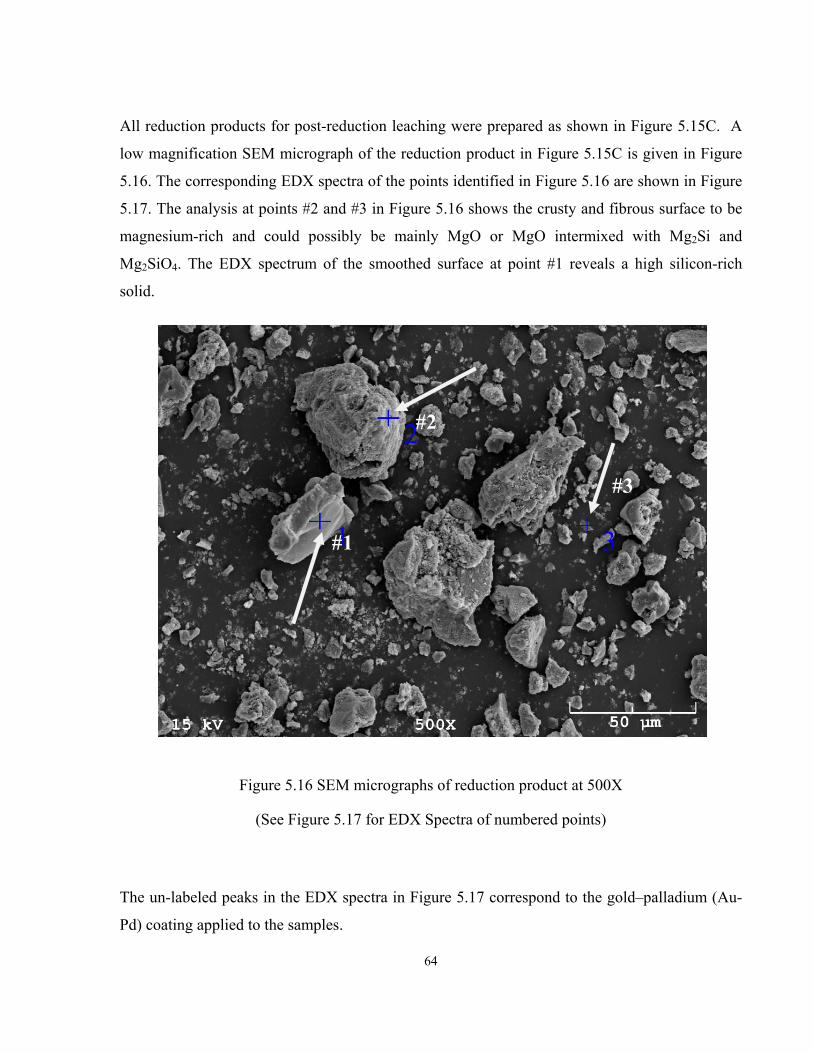
64
All reduction products for post-reduction leaching were prepared as shown in Figure 5.15C. A
low magnification SEM micrograph of the reduction product in Figure 5.15C is given in Figure
5.16. The corresponding EDX spectra of the points identified in Figure 5.16 are shown in Figure
5.17. The analysis at points #2 and #3 in Figure 5.16 shows the crusty and fibrous surface to be
magnesium-rich and could possibly be mainly MgO or MgO intermixed with Mg2Si and
Mg2SiO4. The EDX spectrum of the smoothed surface at point #1 reveals a high silicon-rich
solid.
Figure 5.16 SEM micrographs of reduction product at 500X
(See Figure 5.17 for EDX Spectra of numbered points)
The un-labeled peaks in the EDX spectra in Figure 5.17 correspond to the gold–palladium (Au-
Pd) coating applied to the samples.
#1
#2
#3
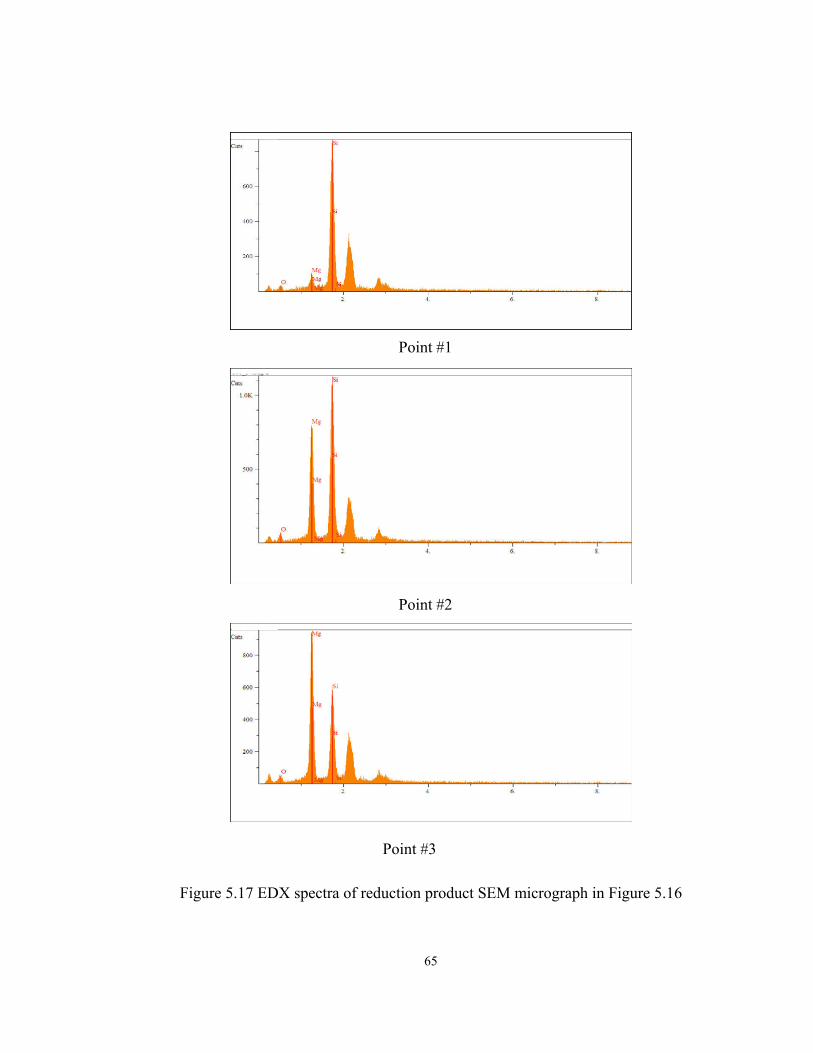
65
Figure 5.17 EDX spectra of reduction product SEM micrograph in Figure 5.16
Point #1
Point #2
Point #3
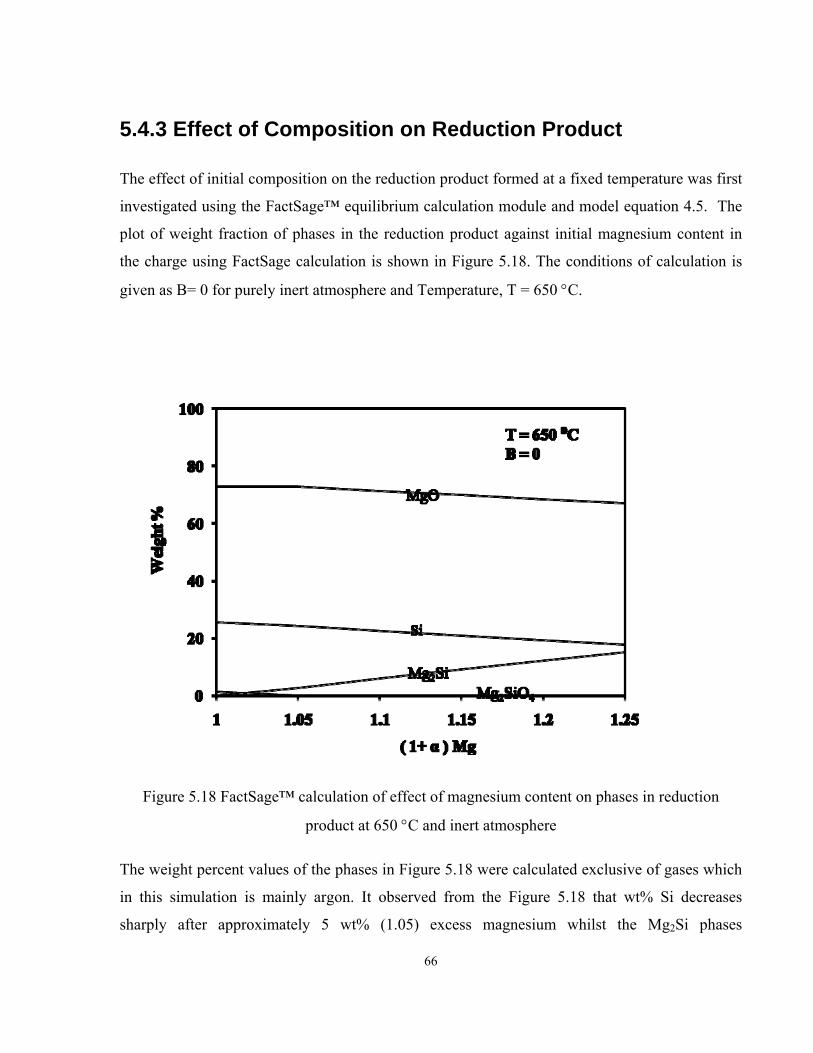
66
5.4.3 Effect of Composition on Reduction Product
The effect of initial composition on the reduction product formed at a fixed temperature was first
investigated using the FactSage™ equilibrium calculation module and model equation 4.5. The
plot of weight fraction of phases in the reduction product against initial magnesium content in
the charge using FactSage calculation is shown in Figure 5.18. The conditions of calculation is
given as B= 0 for purely inert atmosphere and Temperature, T = 650 °C.
Figure 5.18 FactSage™ calculation of effect of magnesium content on phases in reduction
product at 650 °C and inert atmosphere
The weight percent values of the phases in Figure 5.18 were calculated exclusive of gases which
in this simulation is mainly argon. It observed from the Figure 5.18 that wt% Si decreases
sharply after approximately 5 wt% (1.05) excess magnesium whilst the Mg2Si phases
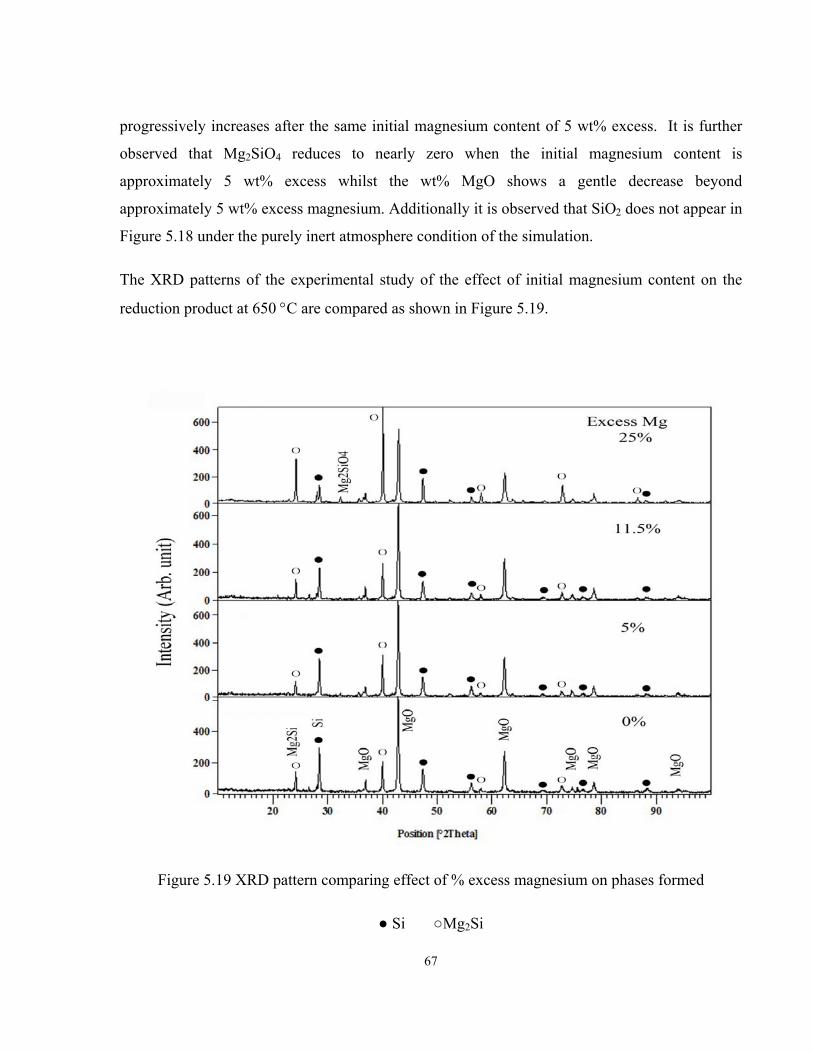
67
progressively increases after the same initial magnesium content of 5 wt% excess. It is further
observed that Mg2SiO4 reduces to nearly zero when the initial magnesium content is
approximately 5 wt% excess whilst the wt% MgO shows a gentle decrease beyond
approximately 5 wt% excess magnesium. Additionally it is observed that SiO2 does not appear in
Figure 5.18 under the purely inert atmosphere condition of the simulation.
The XRD patterns of the experimental study of the effect of initial magnesium content on the
reduction product at 650 °C are compared as shown in Figure 5.19.
Figure 5.19 XRD pattern comparing effect of % excess magnesium on phases formed
● Si ○Mg2Si
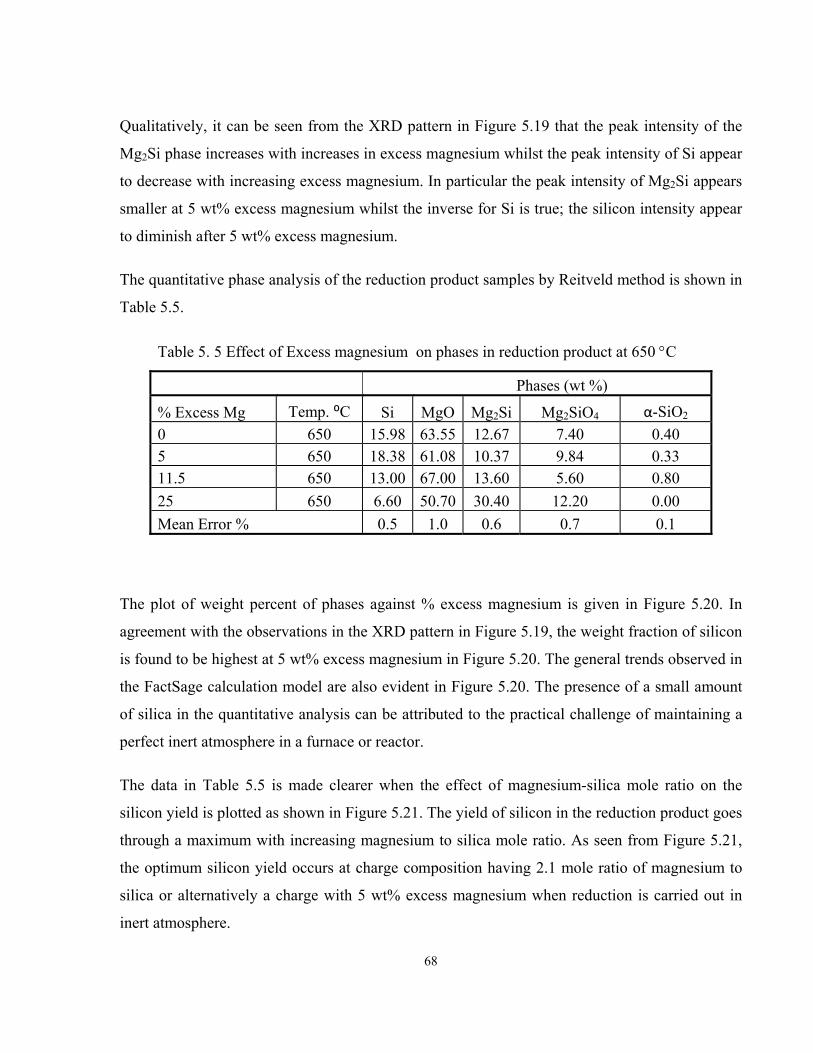
68
Qualitatively, it can be seen from the XRD pattern in Figure 5.19 that the peak intensity of the
Mg2Si phase increases with increases in excess magnesium whilst the peak intensity of Si appear
to decrease with increasing excess magnesium. In particular the peak intensity of Mg2Si appears
smaller at 5 wt% excess magnesium whilst the inverse for Si is true; the silicon intensity appear
to diminish after 5 wt% excess magnesium.
The quantitative phase analysis of the reduction product samples by Reitveld method is shown in
Table 5.5.
Table 5. 5 Effect of Excess magnesium on phases in reduction product at 650 °C
Phases (wt %)
% Excess Mg Temp. ⁰C Si MgO Mg2Si Mg2SiO4 α-SiO2 0 650 15.98 63.55 12.67 7.40 0.40 5 650 18.38 61.08 10.37 9.84 0.33 11.5 650 13.00 67.00 13.60 5.60 0.80 25 650 6.60 50.70 30.40 12.20 0.00 Mean Error % 0.5 1.0 0.6 0.7 0.1
The plot of weight percent of phases against % excess magnesium is given in Figure 5.20. In
agreement with the observations in the XRD pattern in Figure 5.19, the weight fraction of silicon
is found to be highest at 5 wt% excess magnesium in Figure 5.20. The general trends observed in
the FactSage calculation model are also evident in Figure 5.20. The presence of a small amount
of silica in the quantitative analysis can be attributed to the practical challenge of maintaining a
perfect inert atmosphere in a furnace or reactor.
The data in Table 5.5 is made clearer when the effect of magnesium-silica mole ratio on the
silicon yield is plotted as shown in Figure 5.21. The yield of silicon in the reduction product goes
through a maximum with increasing magnesium to silica mole ratio. As seen from Figure 5.21,
the optimum silicon yield occurs at charge composition having 2.1 mole ratio of magnesium to
silica or alternatively a charge with 5 wt% excess magnesium when reduction is carried out in
inert atmosphere.
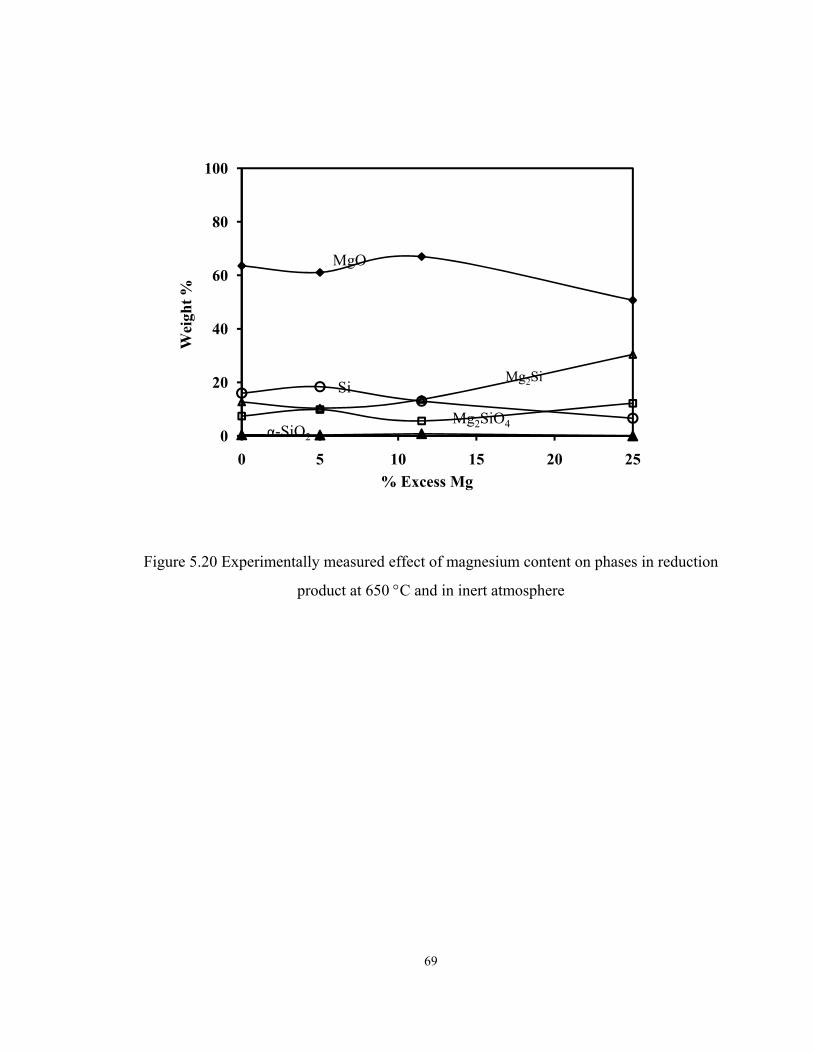
69
Figure 5.20 Experimentally measured effect of magnesium content on phases in reduction
product at 650 °C and in inert atmosphere
0
20
40
60
80
100
0 5 10 15 20 25% Excess Mg
SiMg2Si
Mg2SiO4α-SiO2
Wei
ght %
MgO
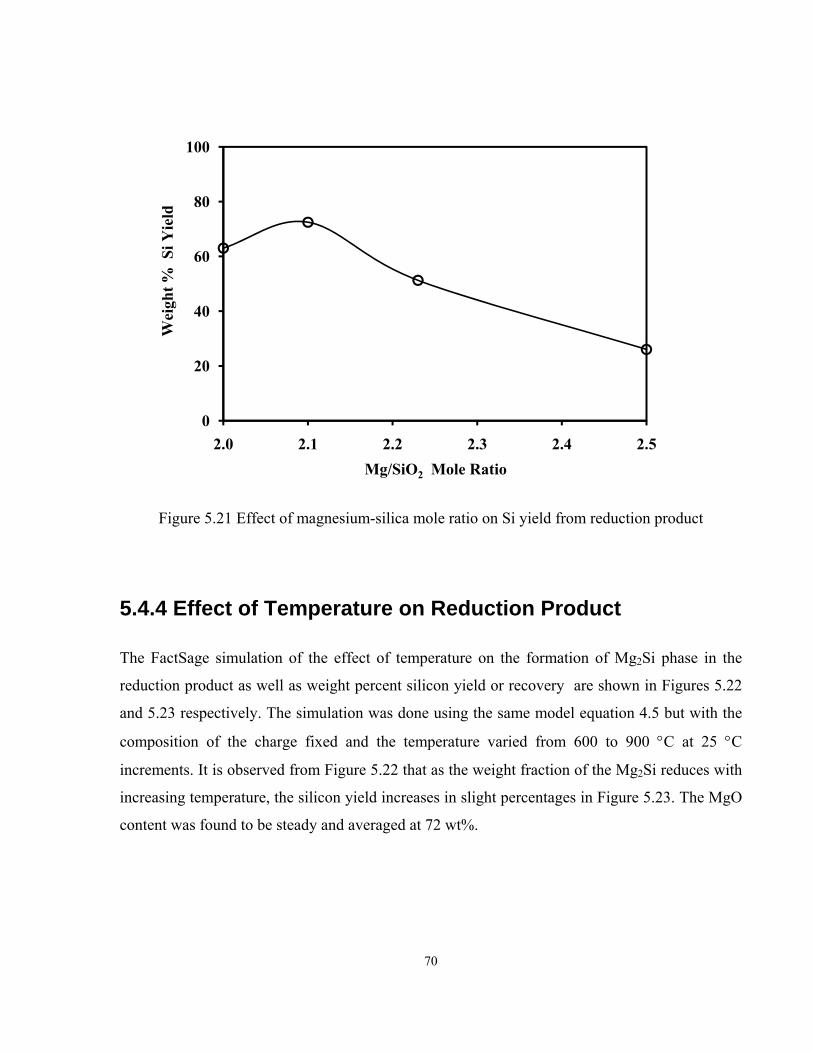
70
Figure 5.21 Effect of magnesium-silica mole ratio on Si yield from reduction product
5.4.4 Effect of Temperature on Reduction Product
The FactSage simulation of the effect of temperature on the formation of Mg2Si phase in the
reduction product as well as weight percent silicon yield or recovery are shown in Figures 5.22
and 5.23 respectively. The simulation was done using the same model equation 4.5 but with the
composition of the charge fixed and the temperature varied from 600 to 900 °C at 25 °C
increments. It is observed from Figure 5.22 that as the weight fraction of the Mg2Si reduces with
increasing temperature, the silicon yield increases in slight percentages in Figure 5.23. The MgO
content was found to be steady and averaged at 72 wt%.
0
20
40
60
80
100
2.0 2.1 2.2 2.3 2.4 2.5
Wei
ght %
Si Y
ield
Mg/SiO2 Mole Ratio
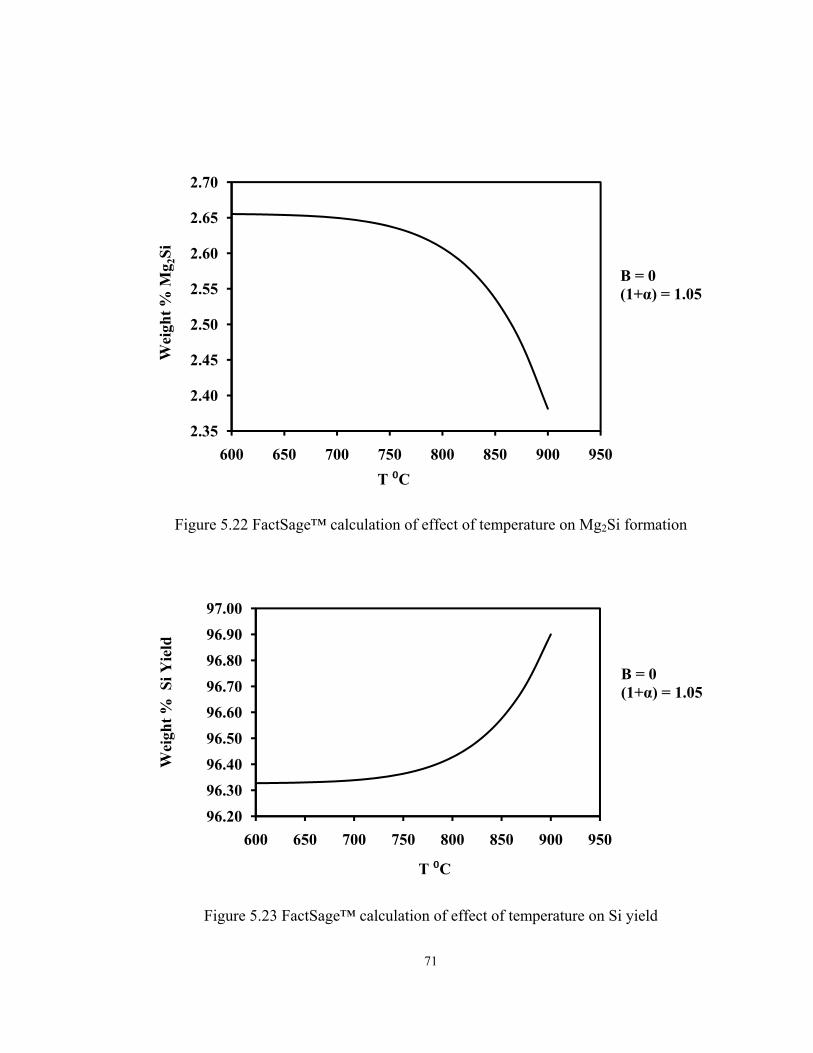
71
Figure 5.22 FactSage™ calculation of effect of temperature on Mg2Si formation
Figure 5.23 FactSage™ calculation of effect of temperature on Si yield
2.35
2.40
2.45
2.50
2.55
2.60
2.65
2.70
600 650 700 750 800 850 900 950
B = 0(1+α) = 1.05
T ⁰C
Wei
ght %
Mg 2
Si
96.2096.3096.4096.5096.6096.7096.8096.9097.00
600 650 700 750 800 850 900 950
Wei
ght %
Si Y
ield
T ⁰C
B = 0(1+α) = 1.05
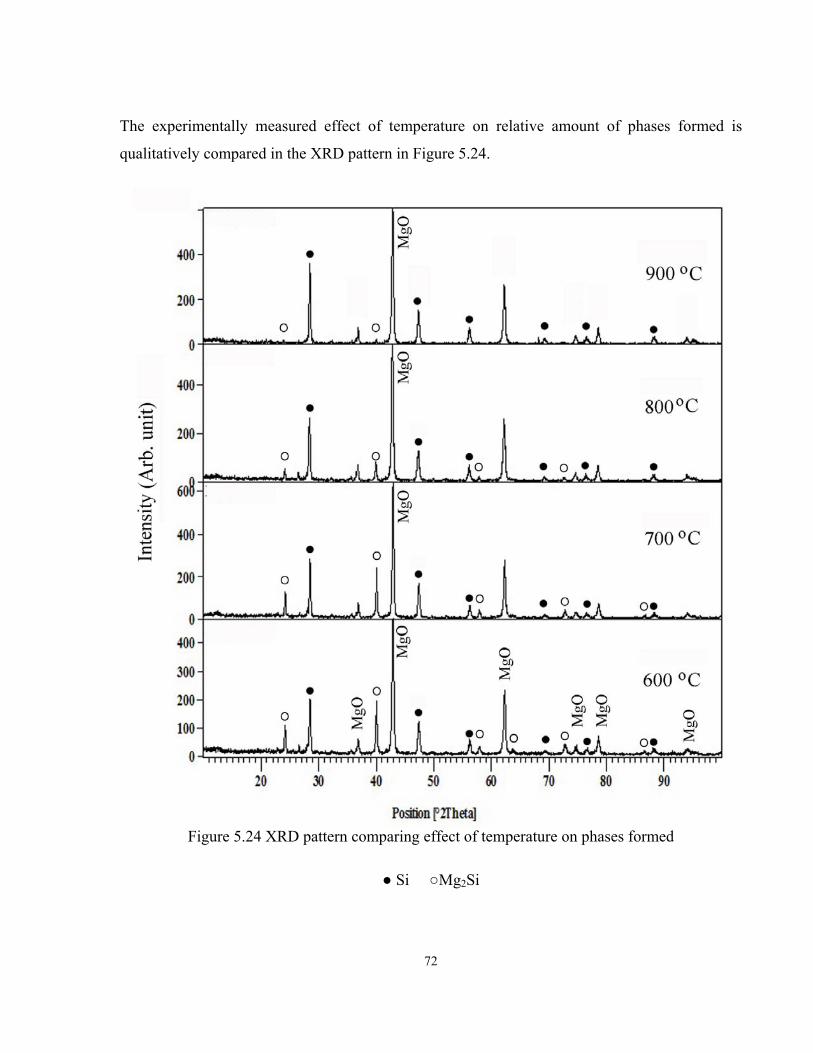
72
The experimentally measured effect of temperature on relative amount of phases formed is
qualitatively compared in the XRD pattern in Figure 5.24.
Figure 5.24 XRD pattern comparing effect of temperature on phases formed
● Si ○Mg2Si
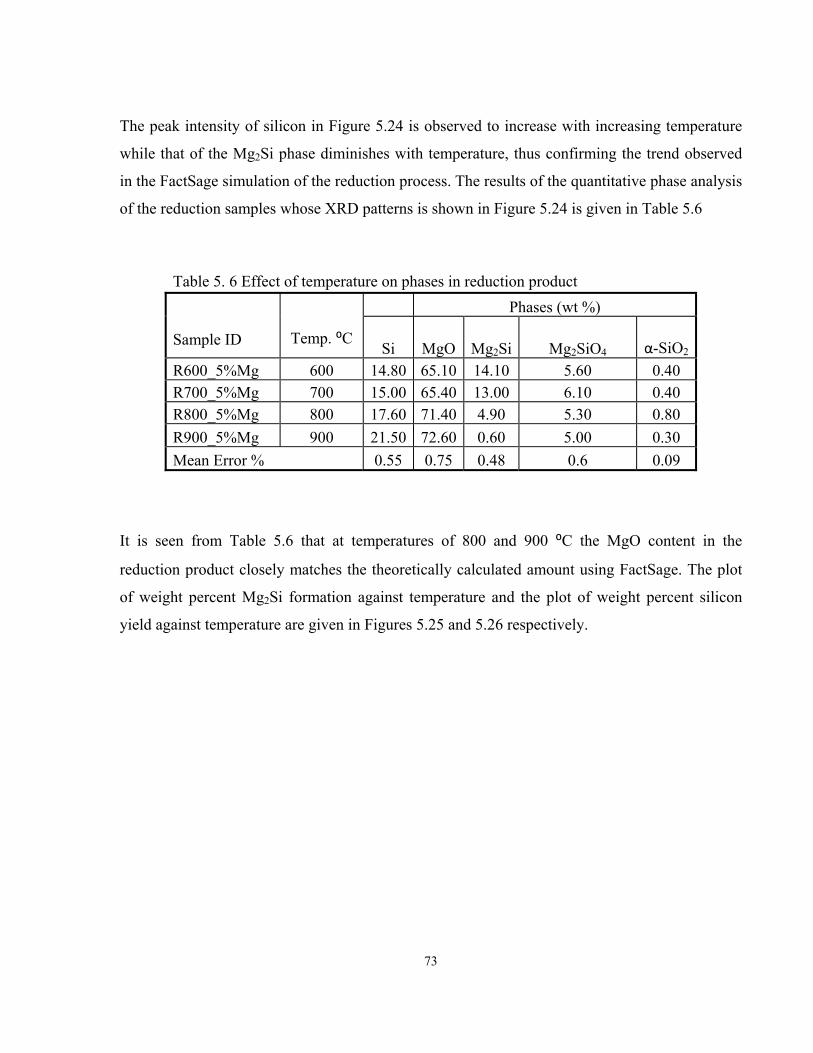
73
The peak intensity of silicon in Figure 5.24 is observed to increase with increasing temperature
while that of the Mg2Si phase diminishes with temperature, thus confirming the trend observed
in the FactSage simulation of the reduction process. The results of the quantitative phase analysis
of the reduction samples whose XRD patterns is shown in Figure 5.24 is given in Table 5.6
Table 5. 6 Effect of temperature on phases in reduction product
Sample ID
Temp. ⁰C
Phases (wt %)
Si MgO Mg2Si Mg2SiO4 α-SiO2
R600_5%Mg 600 14.80 65.10 14.10 5.60 0.40 R700_5%Mg 700 15.00 65.40 13.00 6.10 0.40 R800_5%Mg 800 17.60 71.40 4.90 5.30 0.80 R900_5%Mg 900 21.50 72.60 0.60 5.00 0.30 Mean Error % 0.55 0.75 0.48 0.6 0.09
It is seen from Table 5.6 that at temperatures of 800 and 900 ⁰C the MgO content in the
reduction product closely matches the theoretically calculated amount using FactSage. The plot
of weight percent Mg2Si formation against temperature and the plot of weight percent silicon
yield against temperature are given in Figures 5.25 and 5.26 respectively.
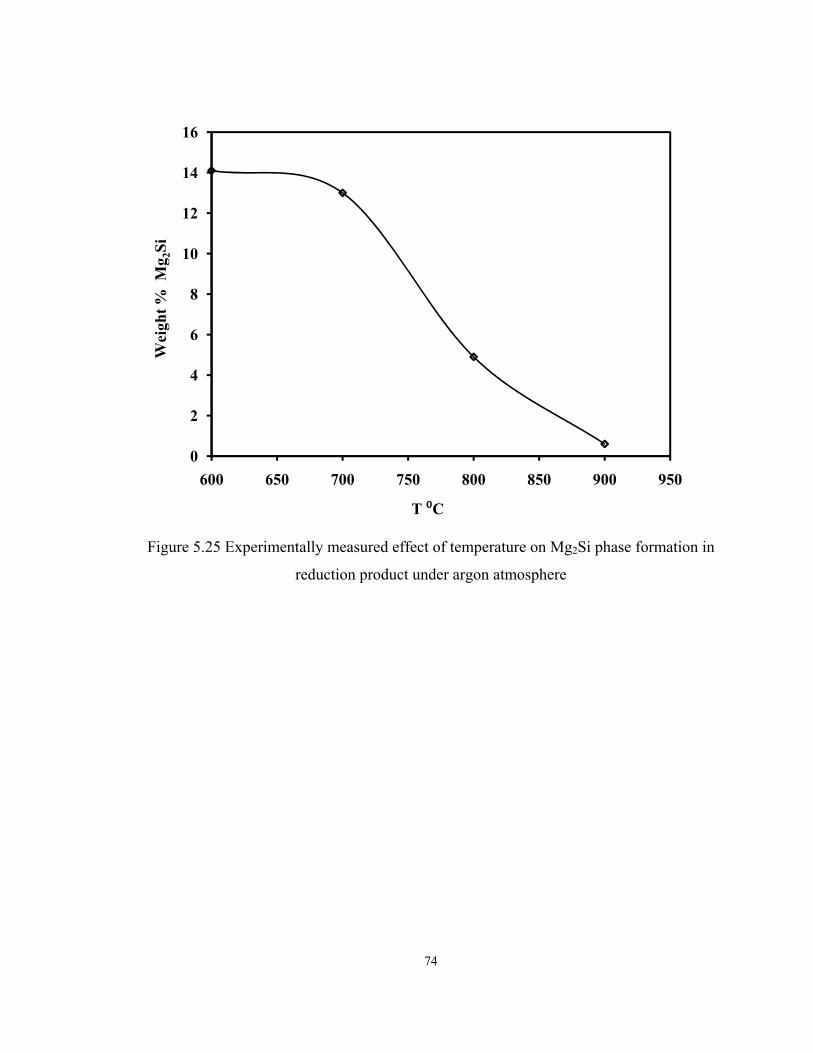
74
Figure 5.25 Experimentally measured effect of temperature on Mg2Si phase formation in
reduction product under argon atmosphere
0
2
4
6
8
10
12
14
16
600 650 700 750 800 850 900 950
T ⁰C
Wei
ght %
Mg 2
Si
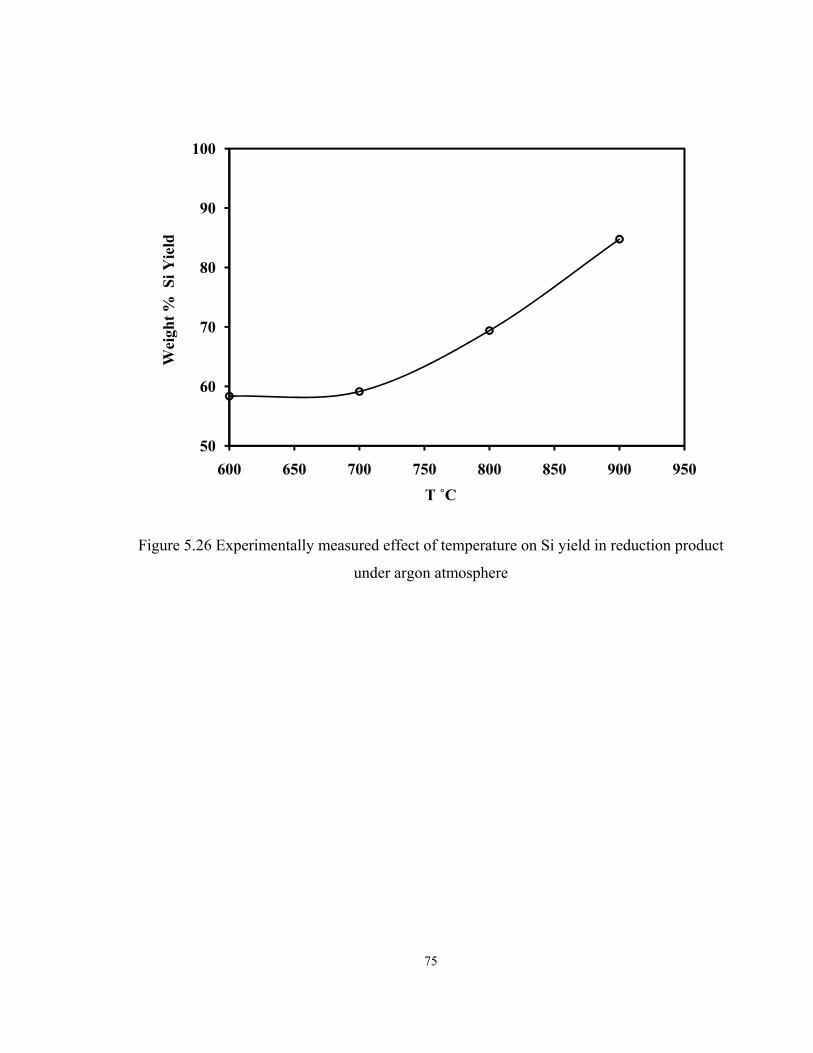
75
Figure 5.26 Experimentally measured effect of temperature on Si yield in reduction product
under argon atmosphere
50
60
70
80
90
100
600 650 700 750 800 850 900 950T ˚C
Wei
ght %
Si Y
ield
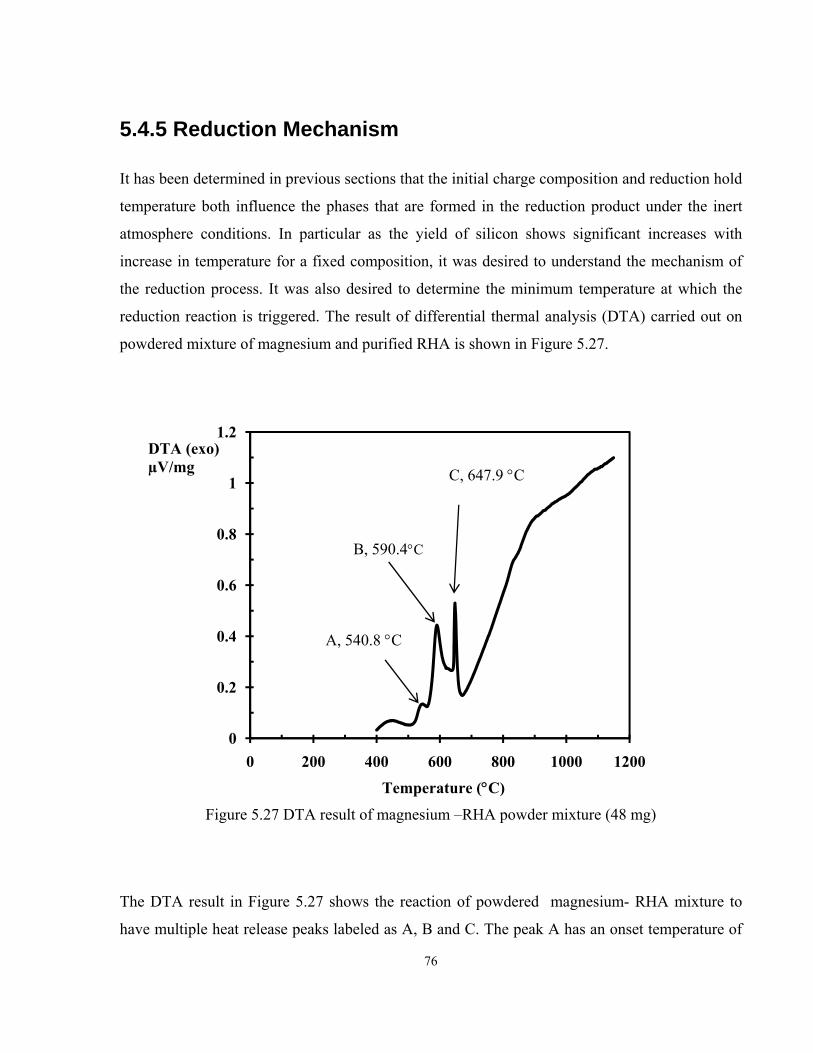
76
5.4.5 Reduction Mechanism
It has been determined in previous sections that the initial charge composition and reduction hold
temperature both influence the phases that are formed in the reduction product under the inert
atmosphere conditions. In particular as the yield of silicon shows significant increases with
increase in temperature for a fixed composition, it was desired to understand the mechanism of
the reduction process. It was also desired to determine the minimum temperature at which the
reduction reaction is triggered. The result of differential thermal analysis (DTA) carried out on
powdered mixture of magnesium and purified RHA is shown in Figure 5.27.
Figure 5.27 DTA result of magnesium –RHA powder mixture (48 mg)
The DTA result in Figure 5.27 shows the reaction of powdered magnesium- RHA mixture to
have multiple heat release peaks labeled as A, B and C. The peak A has an onset temperature of
0
0.2
0.4
0.6
0.8
1
1.2
0 200 400 600 800 1000 1200
Temperature (°C)
DTA (exo)µV/mg
A, 540.8 °C
B, 590.4°C
C, 647.9 °C
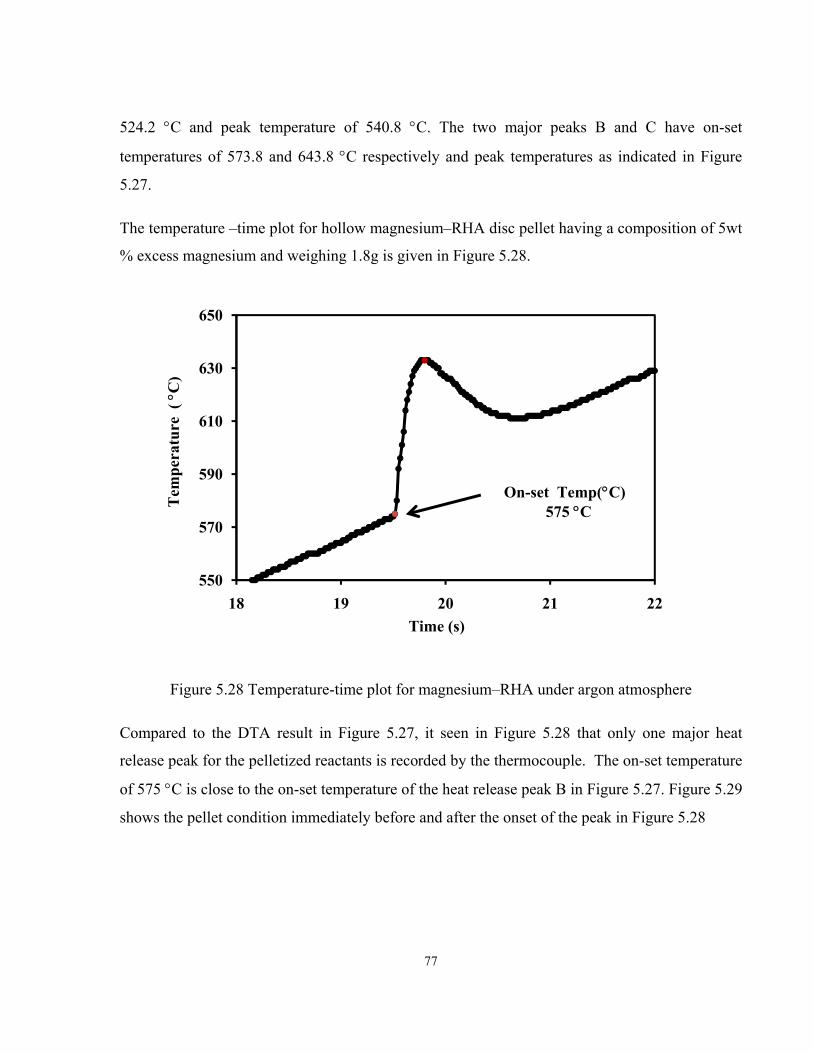
77
524.2 °C and peak temperature of 540.8 °C. The two major peaks B and C have on-set
temperatures of 573.8 and 643.8 °C respectively and peak temperatures as indicated in Figure
5.27.
The temperature –time plot for hollow magnesium–RHA disc pellet having a composition of 5wt
% excess magnesium and weighing 1.8g is given in Figure 5.28.
Figure 5.28 Temperature-time plot for magnesium–RHA under argon atmosphere
Compared to the DTA result in Figure 5.27, it seen in Figure 5.28 that only one major heat
release peak for the pelletized reactants is recorded by the thermocouple. The on-set temperature
of 575 °C is close to the on-set temperature of the heat release peak B in Figure 5.27. Figure 5.29
shows the pellet condition immediately before and after the onset of the peak in Figure 5.28
550
570
590
610
630
650
18 19 20 21 22
On-set Temp(°C) 575 °C
Time (s)
Tem
pera
ture
( °C
)
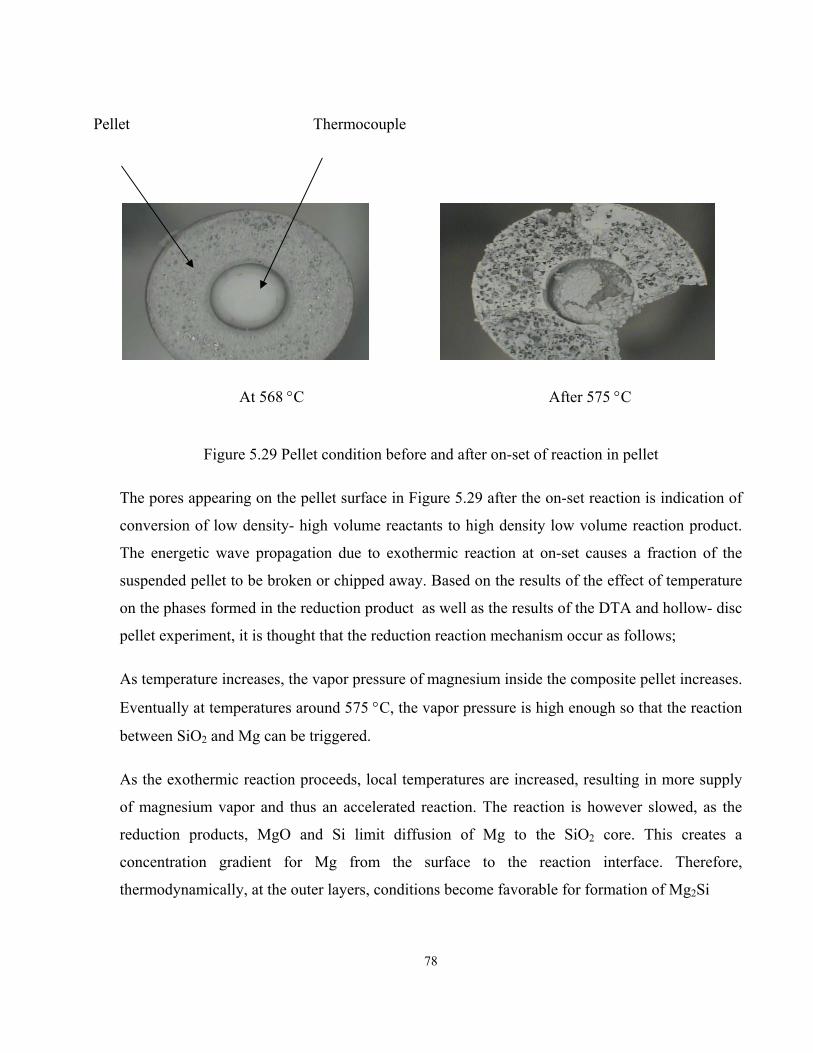
78
At 568 °C
After 575 °C
Figure 5.29 Pellet condition before and after on-set of reaction in pellet
The pores appearing on the pellet surface in Figure 5.29 after the on-set reaction is indication of
conversion of low density- high volume reactants to high density low volume reaction product.
The energetic wave propagation due to exothermic reaction at on-set causes a fraction of the
suspended pellet to be broken or chipped away. Based on the results of the effect of temperature
on the phases formed in the reduction product as well as the results of the DTA and hollow- disc
pellet experiment, it is thought that the reduction reaction mechanism occur as follows;
As temperature increases, the vapor pressure of magnesium inside the composite pellet increases.
Eventually at temperatures around 575 °C, the vapor pressure is high enough so that the reaction
between SiO2 and Mg can be triggered.
As the exothermic reaction proceeds, local temperatures are increased, resulting in more supply
of magnesium vapor and thus an accelerated reaction. The reaction is however slowed, as the
reduction products, MgO and Si limit diffusion of Mg to the SiO2 core. This creates a
concentration gradient for Mg from the surface to the reaction interface. Therefore,
thermodynamically, at the outer layers, conditions become favorable for formation of Mg2Si
Pellet Thermocouple
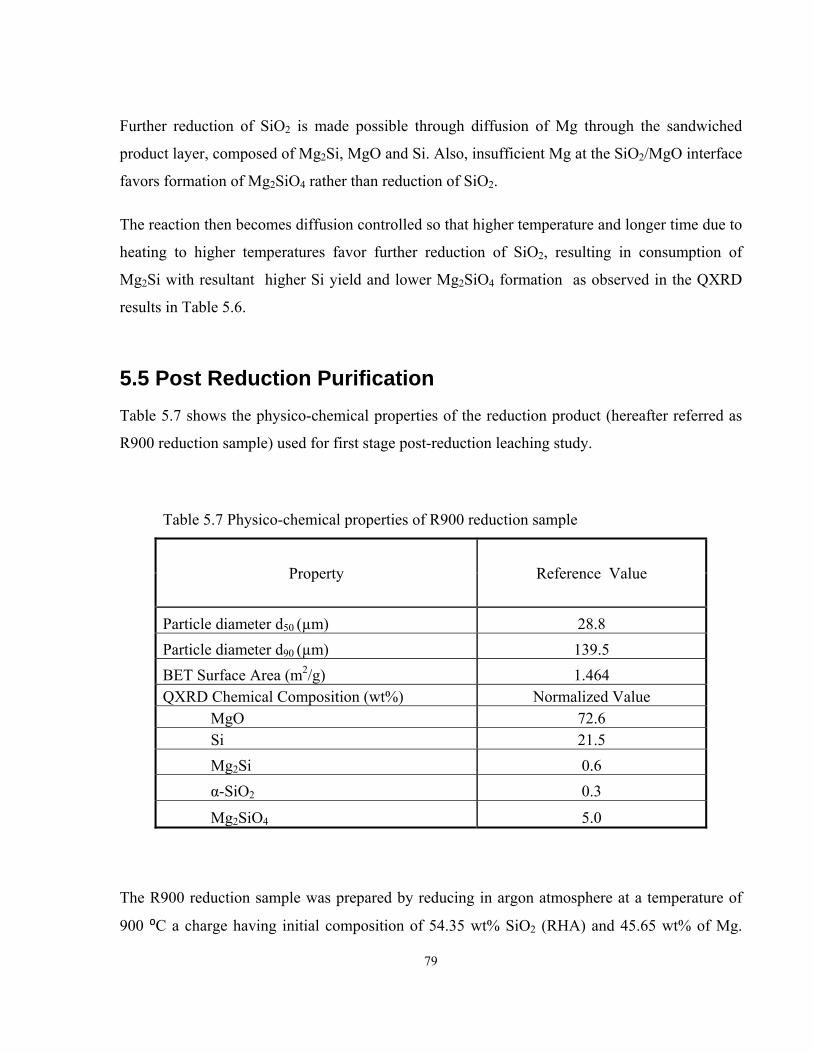
79
Further reduction of SiO2 is made possible through diffusion of Mg through the sandwiched
product layer, composed of Mg2Si, MgO and Si. Also, insufficient Mg at the SiO2/MgO interface
favors formation of Mg2SiO4 rather than reduction of SiO2.
The reaction then becomes diffusion controlled so that higher temperature and longer time due to
heating to higher temperatures favor further reduction of SiO2, resulting in consumption of
Mg2Si with resultant higher Si yield and lower Mg2SiO4 formation as observed in the QXRD
results in Table 5.6.
5.5 Post Reduction Purification Table 5.7 shows the physico-chemical properties of the reduction product (hereafter referred as
R900 reduction sample) used for first stage post-reduction leaching study.
Table 5.7 Physico-chemical properties of R900 reduction sample
Property Reference Value
Particle diameter d50 (µm) 28.8 Particle diameter d90 (µm) 139.5 BET Surface Area (m2/g) 1.464 QXRD Chemical Composition (wt%) Normalized Value
MgO 72.6 Si 21.5 Mg2Si 0.6 α-SiO2 0.3
Mg2SiO4 5.0
The R900 reduction sample was prepared by reducing in argon atmosphere at a temperature of
900 ⁰C a charge having initial composition of 54.35 wt% SiO2 (RHA) and 45.65 wt% of Mg.
80
The composition of the R900 reduction sample as determined from quantitative XRD (QXRD)
has been normalized for the major phases identified in the reduction sample on analysis by
powder XRD method. The oxides of aluminum, iron, manganese and other transition group
metals were not detected in the XRD but may be present as trace elemental amounts in the
sample. It is seen from Table 5.7 that magnesium oxide (MgO) is the major phase whilst Mg2Si
and Mg2SiO4 are the minor phases. The leaching reagent considered for dissolving the MgO
phases and other elemental species were limited to hydrochloric acid (HCl) and combination of
hydrochloric and acetic acid (CH3COOH). This is because in general chloride and acetate salts
are soluble in aqueous medium. The generalized reaction of MgO and other metallic oxides with
HCl is given by Raschman and Fedorockova [39]:
MexOy(s) + 2yH+(aq.) → xMe(2y/x)+ (aq.) + yH2O(l) 5.5
Where x=y=1 for MgO, the dominant by-product for the silica-magnesium reaction.
For a mixed acid of HCl and CH3COOH , the possible reactions include:
HCl (aq) + H2O (aq) = H3O+(aq) + Cl- ( aq) 5.6
CH3COOH + H2O(l) = H3O+ (aq) + CH3COO- 5.7
MgO(s) + 2H3O+aq = Mg2+ (aq) + 3H2O (l) 5.8
Mg2+ (aq) + 2 Cl- = MgCl2 (aq) 5.9
Mg2+ (aq) + 2CH3COO- = (CH3COO)2Mg(aq) 5.10
The literature value for the pKa for reaction 5.7 is given as 4.756 at room temperature [40]
This gives the equilibrium constant for α-molar concentration of CH3COOH with x-molar dissociation to be :
Ka = H+ [ CH3COO-][CH3COOH]
= x2
α-x = 1.76x10⁻⁵
Assuming x is <<< α, then α-x ≈ α. Thus the molar (M) hydrogen ion concentration can be
calculated as
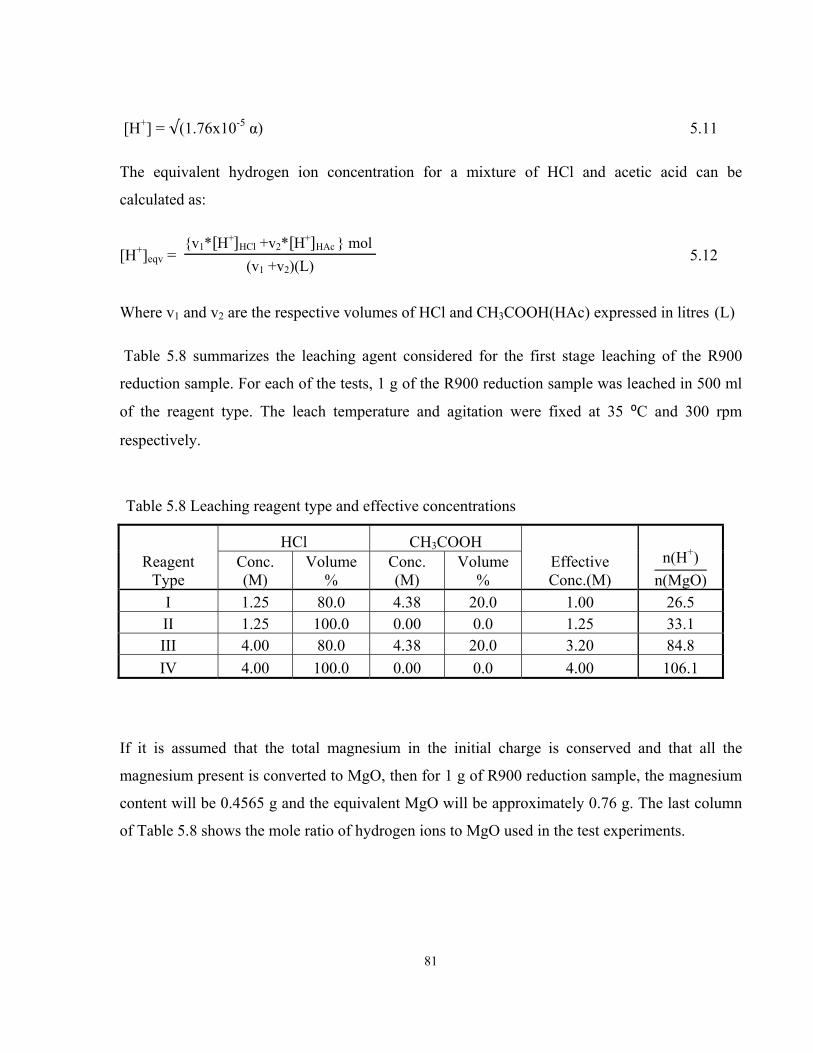
81
[H+] = √(1.76x10⁻⁵ α) 5.11
The equivalent hydrogen ion concentration for a mixture of HCl and acetic acid can be
calculated as:
[H+]eqv = {v1* H+
HCl +v2* H+HAc } mol
(v1 +v2)(L) 5.12
Where v1 and v2 are the respective volumes of HCl and CH3COOH(HAc) expressed in litres (L)
Table 5.8 summarizes the leaching agent considered for the first stage leaching of the R900
reduction sample. For each of the tests, 1 g of the R900 reduction sample was leached in 500 ml
of the reagent type. The leach temperature and agitation were fixed at 35 ⁰C and 300 rpm
respectively.
Table 5.8 Leaching reagent type and effective concentrations
Reagent Type
HCl CH3COOH Effective Conc.(M)
n(H+)n(MgO)
Conc. (M)
Volume %
Conc. (M)
Volume %
I 1.25 80.0 4.38 20.0 1.00 26.5 II 1.25 100.0 0.00 0.0 1.25 33.1 III 4.00 80.0 4.38 20.0 3.20 84.8 IV 4.00 100.0 0.00 0.0 4.00 106.1
If it is assumed that the total magnesium in the initial charge is conserved and that all the
magnesium present is converted to MgO, then for 1 g of R900 reduction sample, the magnesium
content will be 0.4565 g and the equivalent MgO will be approximately 0.76 g. The last column
of Table 5.8 shows the mole ratio of hydrogen ions to MgO used in the test experiments.
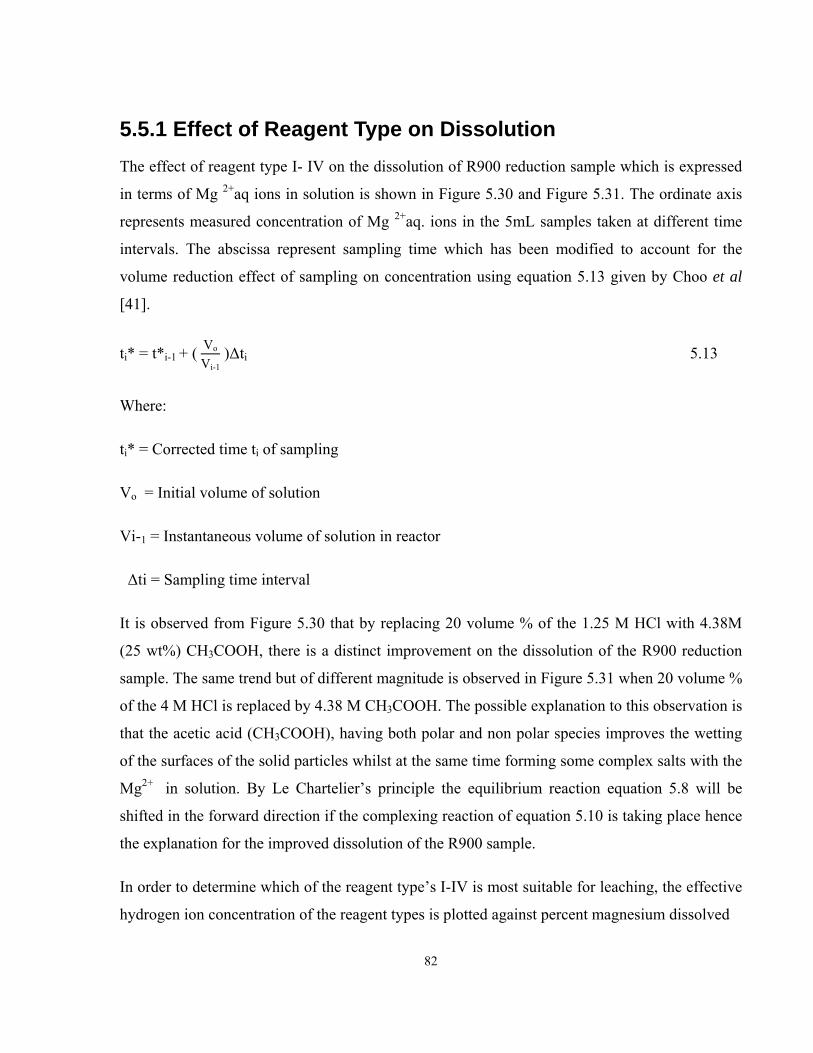
82
5.5.1 Effect of Reagent Type on Dissolution
The effect of reagent type I- IV on the dissolution of R900 reduction sample which is expressed
in terms of Mg 2+aq ions in solution is shown in Figure 5.30 and Figure 5.31. The ordinate axis
represents measured concentration of Mg 2+aq. ions in the 5mL samples taken at different time
intervals. The abscissa represent sampling time which has been modified to account for the
volume reduction effect of sampling on concentration using equation 5.13 given by Choo et al
[41].
ti* = t*i-1 + ( Vo
Vi-1 )Δti 5.13
Where:
ti* = Corrected time ti of sampling
Vo = Initial volume of solution
Vi-1 = Instantaneous volume of solution in reactor
Δti = Sampling time interval
It is observed from Figure 5.30 that by replacing 20 volume % of the 1.25 M HCl with 4.38M
(25 wt%) CH3COOH, there is a distinct improvement on the dissolution of the R900 reduction
sample. The same trend but of different magnitude is observed in Figure 5.31 when 20 volume %
of the 4 M HCl is replaced by 4.38 M CH3COOH. The possible explanation to this observation is
that the acetic acid (CH3COOH), having both polar and non polar species improves the wetting
of the surfaces of the solid particles whilst at the same time forming some complex salts with the
Mg2+ in solution. By Le Chartelier’s principle the equilibrium reaction equation 5.8 will be
shifted in the forward direction if the complexing reaction of equation 5.10 is taking place hence
the explanation for the improved dissolution of the R900 sample.
In order to determine which of the reagent type’s I-IV is most suitable for leaching, the effective
hydrogen ion concentration of the reagent types is plotted against percent magnesium dissolved
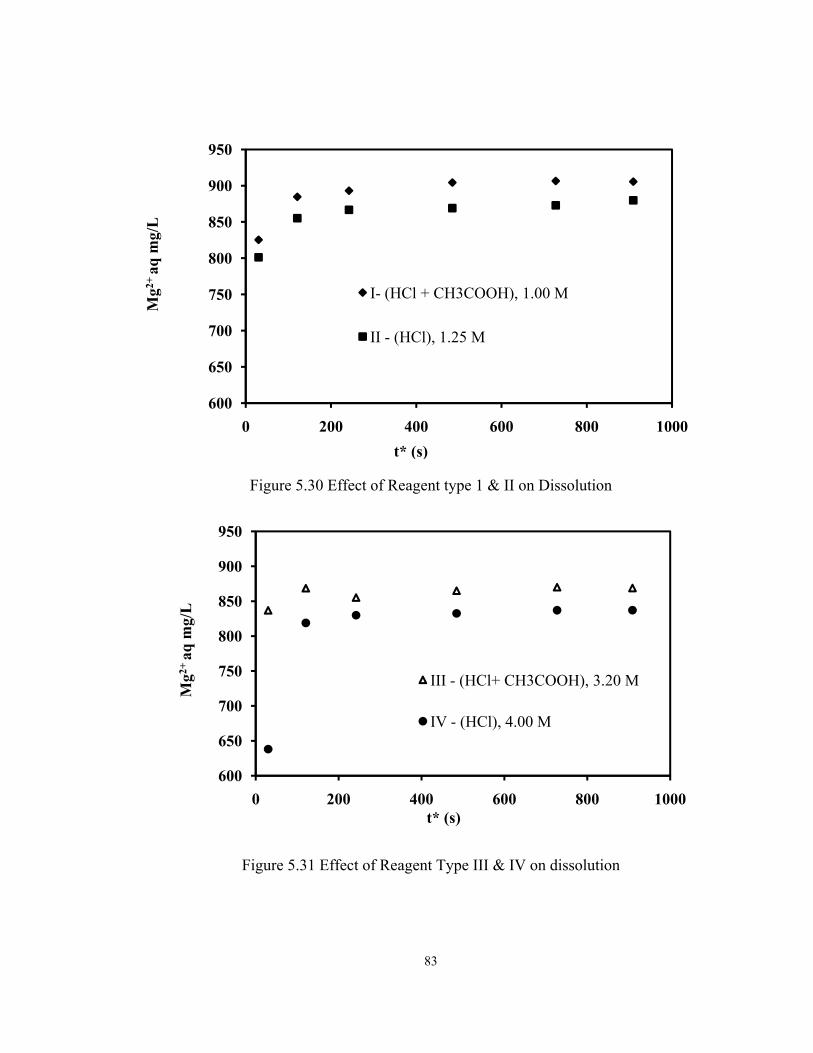
83
Figure 5.30 Effect of Reagent type 1 & II on Dissolution
Figure 5.31 Effect of Reagent Type III & IV on dissolution
600
650
700
750
800
850
900
950
0 200 400 600 800 1000
I- (HCl + CH3COOH), 1.00 M
II - (HCl), 1.25 M
t* (s)
Mg2+
aq
mg/
L
600
650
700
750
800
850
900
950
0 200 400 600 800 1000
III - (HCl+ CH3COOH), 3.20 M
IV - (HCl), 4.00 M
Mg2+
aq
mg/
L
t* (s)
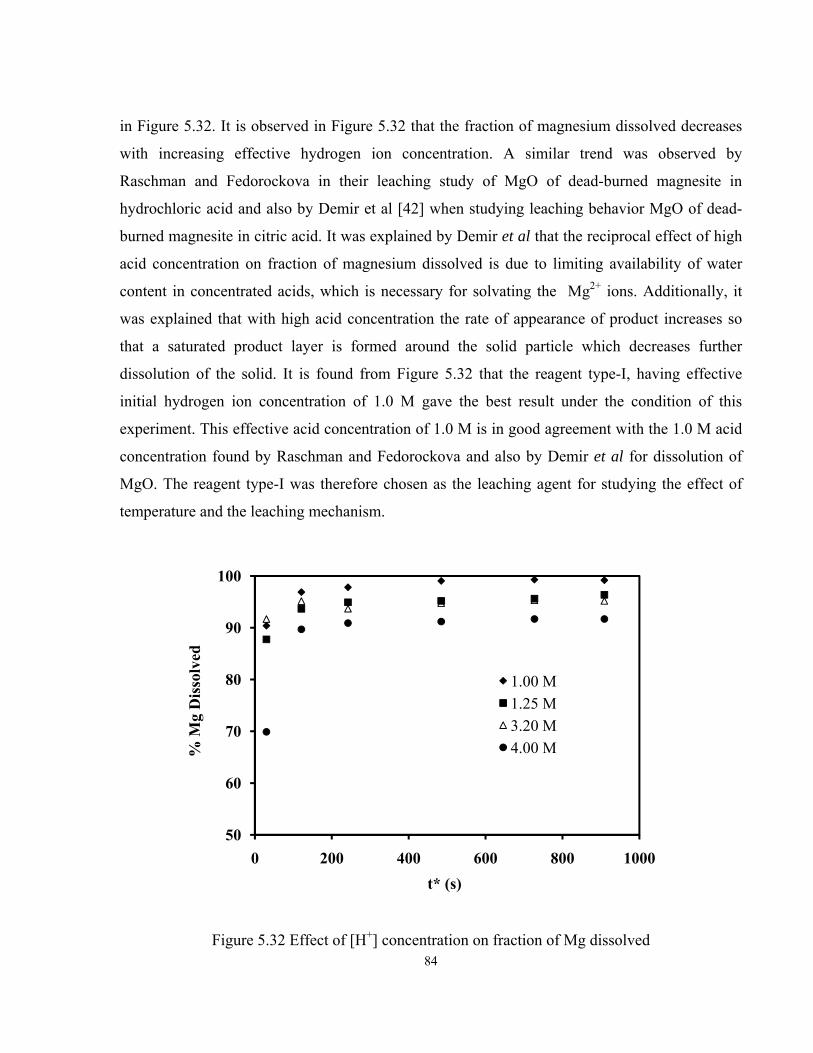
84
in Figure 5.32. It is observed in Figure 5.32 that the fraction of magnesium dissolved decreases
with increasing effective hydrogen ion concentration. A similar trend was observed by
Raschman and Fedorockova in their leaching study of MgO of dead-burned magnesite in
hydrochloric acid and also by Demir et al [42] when studying leaching behavior MgO of dead-
burned magnesite in citric acid. It was explained by Demir et al that the reciprocal effect of high
acid concentration on fraction of magnesium dissolved is due to limiting availability of water
content in concentrated acids, which is necessary for solvating the Mg2+ ions. Additionally, it
was explained that with high acid concentration the rate of appearance of product increases so
that a saturated product layer is formed around the solid particle which decreases further
dissolution of the solid. It is found from Figure 5.32 that the reagent type-I, having effective
initial hydrogen ion concentration of 1.0 M gave the best result under the condition of this
experiment. This effective acid concentration of 1.0 M is in good agreement with the 1.0 M acid
concentration found by Raschman and Fedorockova and also by Demir et al for dissolution of
MgO. The reagent type-I was therefore chosen as the leaching agent for studying the effect of
temperature and the leaching mechanism.
Figure 5.32 Effect of [H+] concentration on fraction of Mg dissolved
50
60
70
80
90
100
0 200 400 600 800 1000
1.00 M1.25 M3.20 M4.00 M
t* (s)
%M
g D
isso
lved
85
5.5.2 Effect of Temperature on Rate Controlling Mechanism The leaching data obtained at different temperatures was tested with both the shrinking particle
model and mass transport control model in order to determine the rate controlling mechanism.
Table 5.9 summarizes the leaching data obtained at different temperatures of 20, 35, 50 and 70
°C. W20, W35, W50 and W70 are the corresponding instantaneous dry weight of the solid
residue after leaching.
In a chemical control process pertaining to leaching of particulates solids or powders, the rate
expression for a first order reaction is given by [43],[44]:
- dWdt
= kAC 5.14
Where;
W = weight of solid at time, t
A = surface area of solid
C = constant acid concentration
k = rate or velocity constant
Table 5. 9 Leaching data at different temperatures
Temperature ( °C ) 20 °C 35 °C 50 °C 70 °C
Time,(s) W20,(g) W35,(g) W50, (g) W70, (g) 0 1 1 1 1
300 0.39 0.37 0.35 0.33 600 0.37 0.35 0.33 0.31 900 0.35 0.33 0.32 0.3 1800 0.33 0.32 0.3 0.28 2700 0.33 0.3 0.28 0.27 3600 0.32 0.29 0.26 0.26
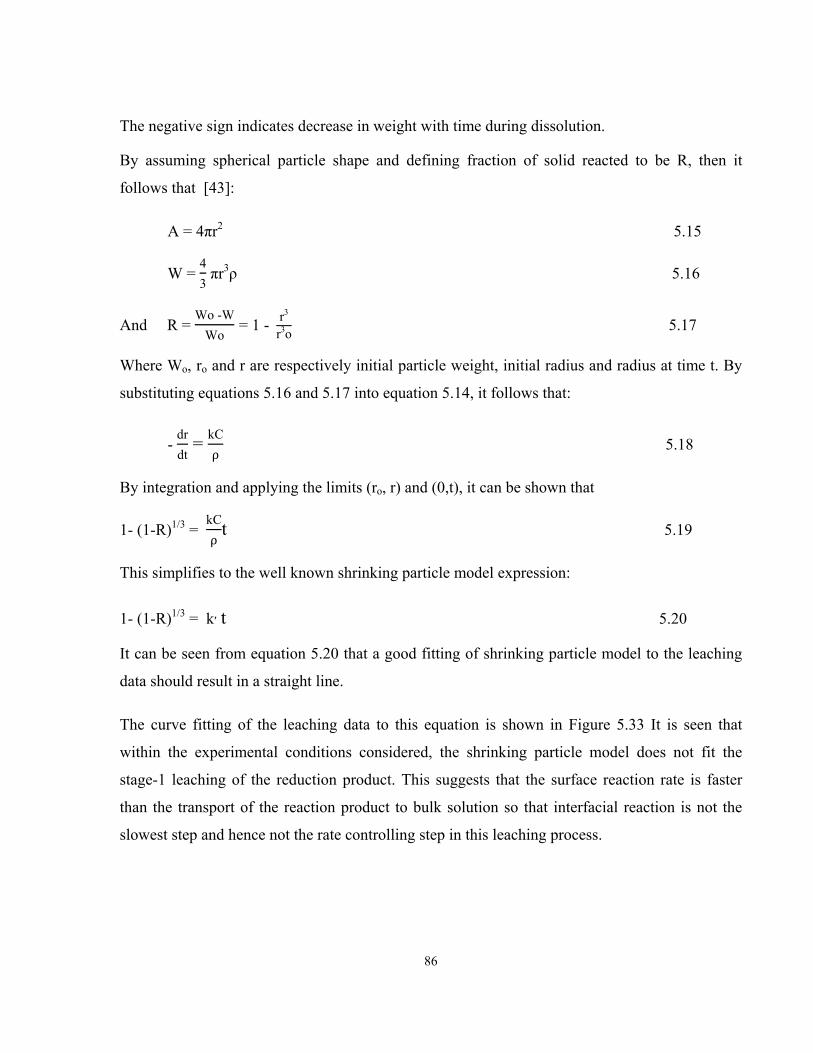
86
The negative sign indicates decrease in weight with time during dissolution.
By assuming spherical particle shape and defining fraction of solid reacted to be R, then it
follows that [43]:
A = 4πr2 5.15
W = 43 πr3ρ 5.16
And R = Wo -W
Wo = 1 - r3
r3o 5.17
Where Wo, ro and r are respectively initial particle weight, initial radius and radius at time t. By
substituting equations 5.16 and 5.17 into equation 5.14, it follows that:
- drdt
= kCρ
5.18
By integration and applying the limits (ro, r) and (0,t), it can be shown that
1- (1-R)1/3 = kCρ
t 5.19
This simplifies to the well known shrinking particle model expression:
1- (1-R)1/3 = k׳ t 5.20
It can be seen from equation 5.20 that a good fitting of shrinking particle model to the leaching
data should result in a straight line.
The curve fitting of the leaching data to this equation is shown in Figure 5.33 It is seen that
within the experimental conditions considered, the shrinking particle model does not fit the
stage-1 leaching of the reduction product. This suggests that the surface reaction rate is faster
than the transport of the reaction product to bulk solution so that interfacial reaction is not the
slowest step and hence not the rate controlling step in this leaching process.
87
Figure 5.33 Plot of fraction dissolved against time
5.5.3 Fitting of Leaching Data to Transport Control Model Assuming a first order reaction kinetics, the mass transfer constant km, expression for a mass
transport control process is given by [45] :
dCbi
dt = - kmA(Cb
i – Cii )
V 5.21
Where:
Cbi = concentration of species i, in the bulk solution
Cii = concentration of species i, at the solid- liquid interface
0.600
0.650
0.700
0.750
0.800
0.850
0.900
0.950
1.000
0 1000 2000 3000 4000
20 C
30 C
50 C
70 C
1-(1
-R)1/
3
Time, t(s)
88
A = interfacial surface area
V = volume of leach solution assumed to be constant
km = mass transport velocity constant
Negative sign indicate negative concentration gradient.
From equation 5.21, it follows that:
dCbi
(Cbi – Ci
i = - kmA
Vdt 5.22
By integration of equation 5.22
ln(Cbi- Ci
i) = - kmAV
t + lnß
ln(Cbi – Ci
i
ß = - kmA
Vt
Cbi- Ci
i = ßexp(- kmAV
t )
as t 0, Cbi = Co
i
ß = Coi- Ci
i
as t ∞ , Cbi = Ci
i = Ceqi
Where:
Ceqi is equilibrium concentration of species i as t ∞
By substituting the boundary conditions, the transport control model expression becomes:
Cbi = Ceq
i + ( Coi- Ceq
i) exp(- kmAV
t ) 5.23
89
For spherical particulate with changing surface area and mass, the relative change in surface area
may be expressed as:
AAo
= 4nπr2
4nπro2 = r
ro 2 5.24
Where:
A = the surface area of solid at time t
Ao = initial or original surface area of solid
r = particle radius at time t
ro = initial particle radius
n = number of individual particles
The corresponding relative change in weight may be given by:
WWo
= 4nπr3ρ
4nπro3 ρ
= rro
3 5.25
By definition of fraction reacted:
Wo -WWo
= ΔWWo
= 1 - r3
r3o
rro
= (1- ΔWWo
)1/3 5.26
From equation 5.24:
AAo
= rro
2 = (1- ΔWWo
)2/3 5.27
Equation 5.27 shows that effect of changing surface area can be accounted for in terms of the
relative weight changes.
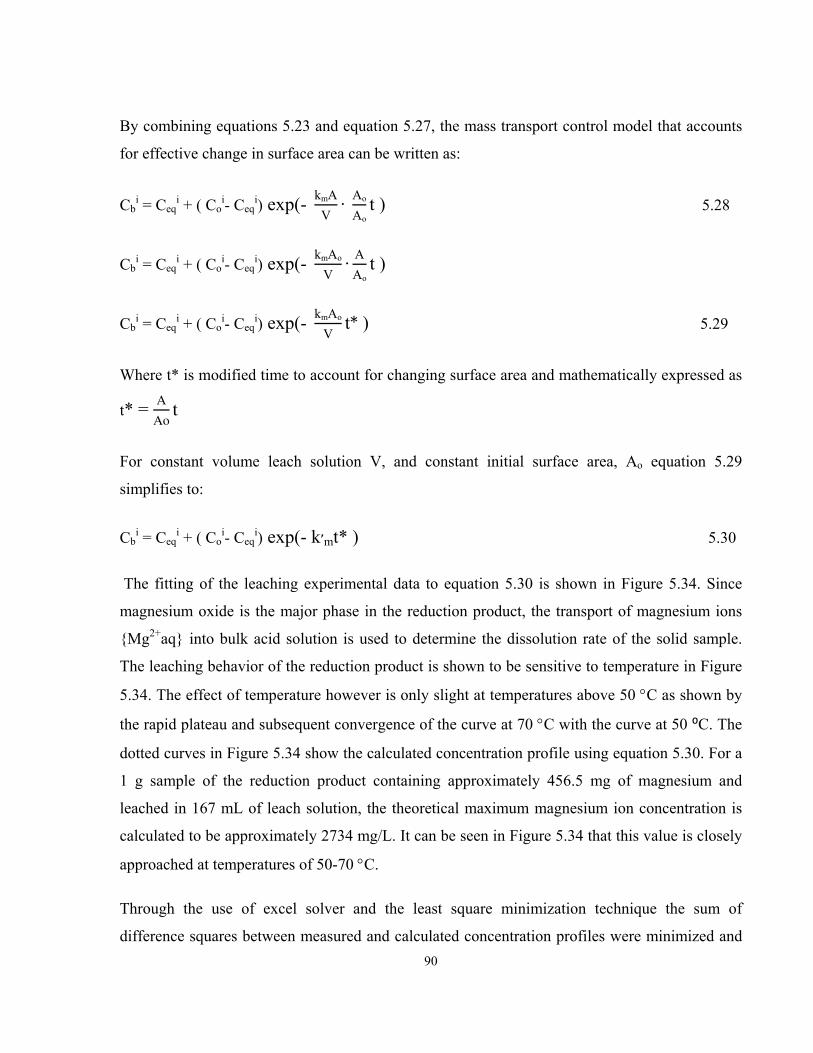
90
By combining equations 5.23 and equation 5.27, the mass transport control model that accounts
for effective change in surface area can be written as:
Cbi = Ceq
i + ( Coi- Ceq
i) exp(- kmAV
· Ao
Aot ) 5.28
Cbi = Ceq
i + ( Coi- Ceq
i) exp(- kmAo
V· A
Aot )
Cbi = Ceq
i + ( Coi- Ceq
i) exp(- kmAo
Vt* ) 5.29
Where t* is modified time to account for changing surface area and mathematically expressed as
t* = A
Aot
For constant volume leach solution V, and constant initial surface area, Ao equation 5.29
simplifies to:
Cbi = Ceq
i + ( Coi- Ceq
i) exp(- k׳mt* ) 5.30
The fitting of the leaching experimental data to equation 5.30 is shown in Figure 5.34. Since
magnesium oxide is the major phase in the reduction product, the transport of magnesium ions
{Mg2+aq} into bulk acid solution is used to determine the dissolution rate of the solid sample.
The leaching behavior of the reduction product is shown to be sensitive to temperature in Figure
5.34. The effect of temperature however is only slight at temperatures above 50 °C as shown by
the rapid plateau and subsequent convergence of the curve at 70 °C with the curve at 50 ⁰C. The
dotted curves in Figure 5.34 show the calculated concentration profile using equation 5.30. For a
1 g sample of the reduction product containing approximately 456.5 mg of magnesium and
leached in 167 mL of leach solution, the theoretical maximum magnesium ion concentration is
calculated to be approximately 2734 mg/L. It can be seen in Figure 5.34 that this value is closely
approached at temperatures of 50-70 °C.
Through the use of excel solver and the least square minimization technique the sum of
difference squares between measured and calculated concentration profiles were minimized and
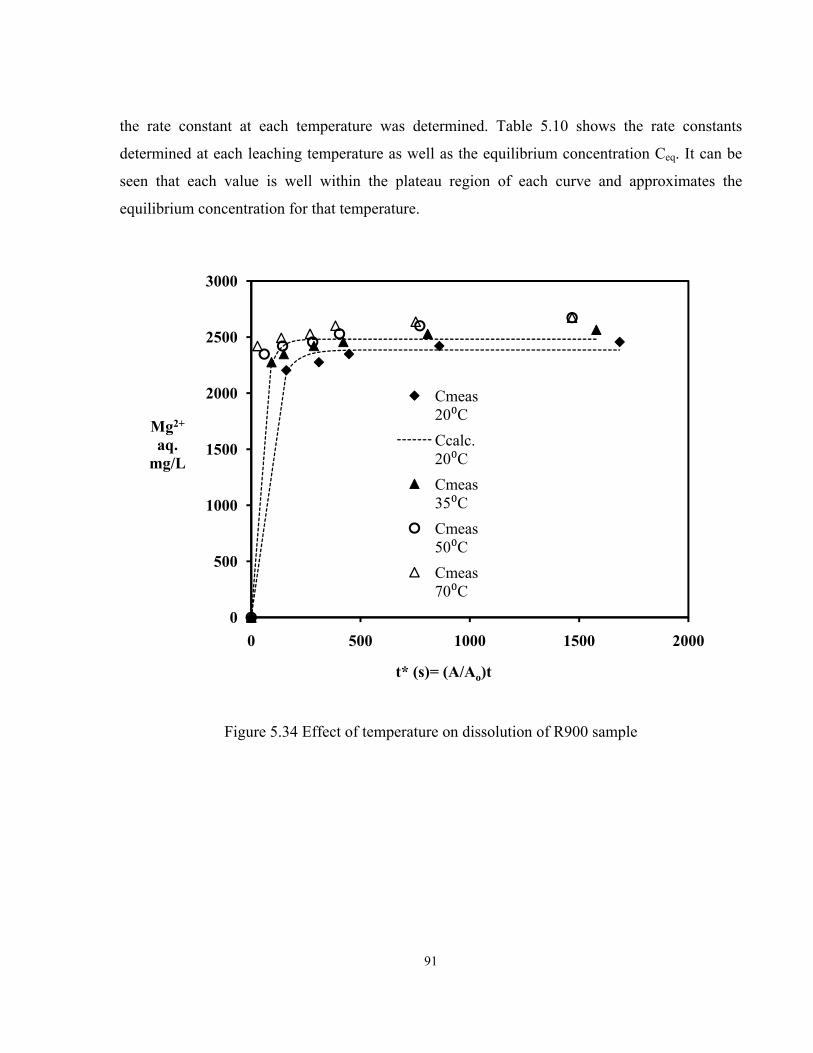
91
the rate constant at each temperature was determined. Table 5.10 shows the rate constants
determined at each leaching temperature as well as the equilibrium concentration Ceq. It can be
seen that each value is well within the plateau region of each curve and approximates the
equilibrium concentration for that temperature.
Figure 5.34 Effect of temperature on dissolution of R900 sample
0
500
1000
1500
2000
2500
3000
0 500 1000 1500 2000
Cmeas 20⁰CCcalc. 20⁰CCmeas 35⁰CCmeas 50⁰CCmeas 70⁰C
t* (s)= (A/Ao)t
Mg2+
aq.mg/L
92
Table 5. 10 Values of km and Ceq from excel solver calculations
T(°K) km Ceq (mg/L) 293 0.0155 2385 308 0.0253 2481 323 0.0428 2538 343 0.0957 2586
The mass transport constant km is diffusion related constant and hence can be related to the
Arrhenius expression:
km = koexp (-EA/RT) 5.31
Where EA, ko, and R are respectively apparent activation energy, pre-exponential factor, and
molar gas constant
The plot of the natural logarithm of the km values in Table 5.10 against the reciprocal absolute
temperature is given in Figure 5.35.
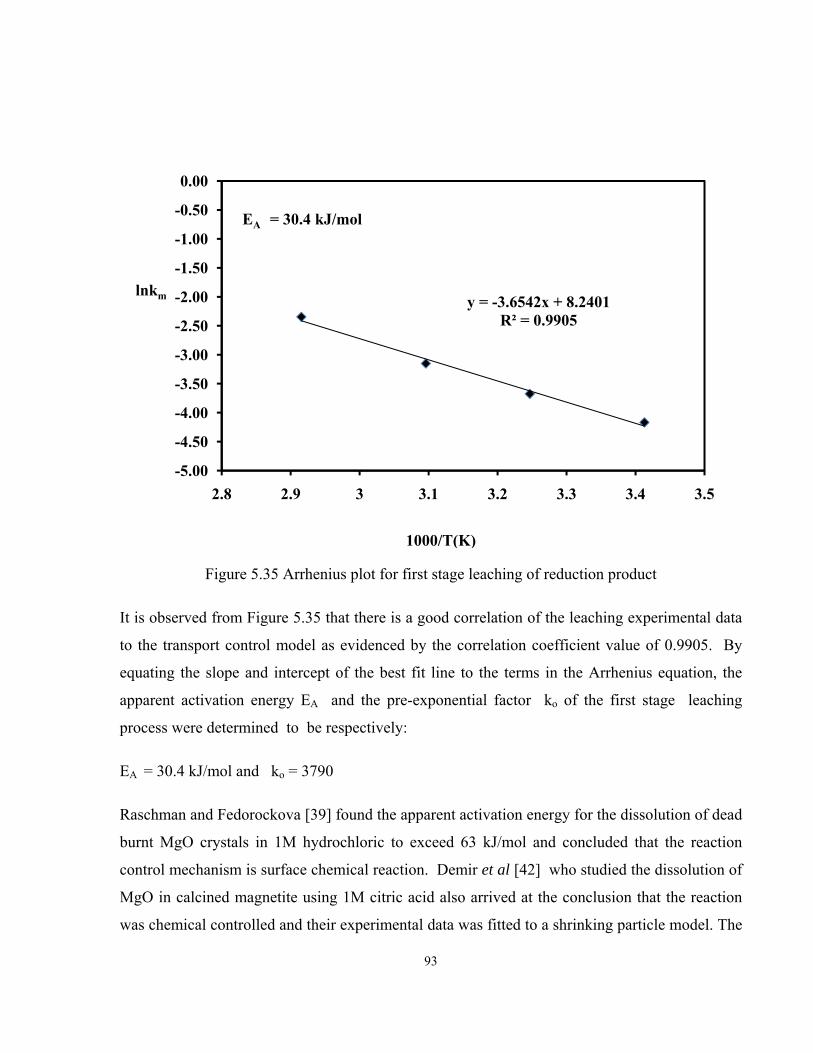
93
Figure 5.35 Arrhenius plot for first stage leaching of reduction product
It is observed from Figure 5.35 that there is a good correlation of the leaching experimental data
to the transport control model as evidenced by the correlation coefficient value of 0.9905. By
equating the slope and intercept of the best fit line to the terms in the Arrhenius equation, the
apparent activation energy EA and the pre-exponential factor ko of the first stage leaching
process were determined to be respectively:
EA = 30.4 kJ/mol and ko = 3790
Raschman and Fedorockova [39] found the apparent activation energy for the dissolution of dead
burnt MgO crystals in 1M hydrochloric to exceed 63 kJ/mol and concluded that the reaction
control mechanism is surface chemical reaction. Demir et al [42] who studied the dissolution of
MgO in calcined magnetite using 1M citric acid also arrived at the conclusion that the reaction
was chemical controlled and their experimental data was fitted to a shrinking particle model. The
y = -3.6542x + 8.2401R² = 0.9905
-5.00
-4.50
-4.00
-3.50
-3.00
-2.50
-2.00
-1.50
-1.00
-0.50
0.00
2.8 2.9 3 3.1 3.2 3.3 3.4 3.5
lnkm
1000/T(K)
EA = 30.4 kJ/mol
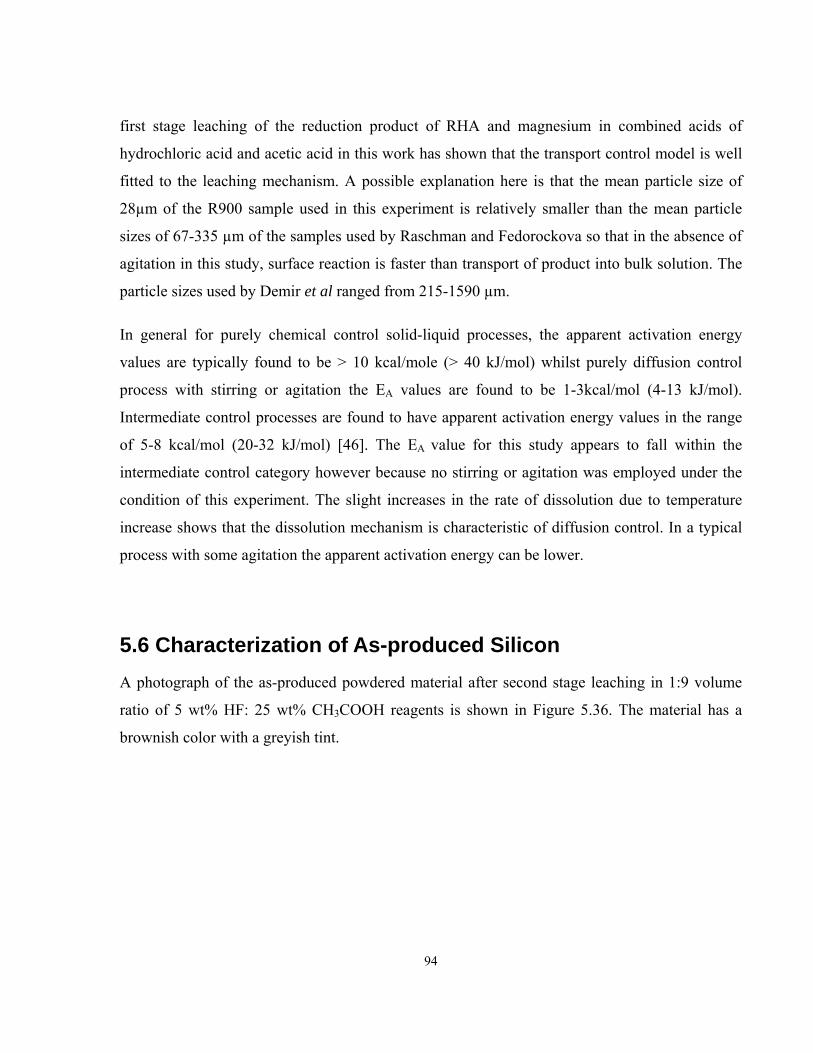
94
first stage leaching of the reduction product of RHA and magnesium in combined acids of
hydrochloric acid and acetic acid in this work has shown that the transport control model is well
fitted to the leaching mechanism. A possible explanation here is that the mean particle size of
28µm of the R900 sample used in this experiment is relatively smaller than the mean particle
sizes of 67-335 µm of the samples used by Raschman and Fedorockova so that in the absence of
agitation in this study, surface reaction is faster than transport of product into bulk solution. The
particle sizes used by Demir et al ranged from 215-1590 µm.
In general for purely chemical control solid-liquid processes, the apparent activation energy
values are typically found to be > 10 kcal/mole (> 40 kJ/mol) whilst purely diffusion control
process with stirring or agitation the EA values are found to be 1-3kcal/mol (4-13 kJ/mol).
Intermediate control processes are found to have apparent activation energy values in the range
of 5-8 kcal/mol (20-32 kJ/mol) [46]. The EA value for this study appears to fall within the
intermediate control category however because no stirring or agitation was employed under the
condition of this experiment. The slight increases in the rate of dissolution due to temperature
increase shows that the dissolution mechanism is characteristic of diffusion control. In a typical
process with some agitation the apparent activation energy can be lower.
5.6 Characterization of As-produced Silicon A photograph of the as-produced powdered material after second stage leaching in 1:9 volume
ratio of 5 wt% HF: 25 wt% CH3COOH reagents is shown in Figure 5.36. The material has a
brownish color with a greyish tint.
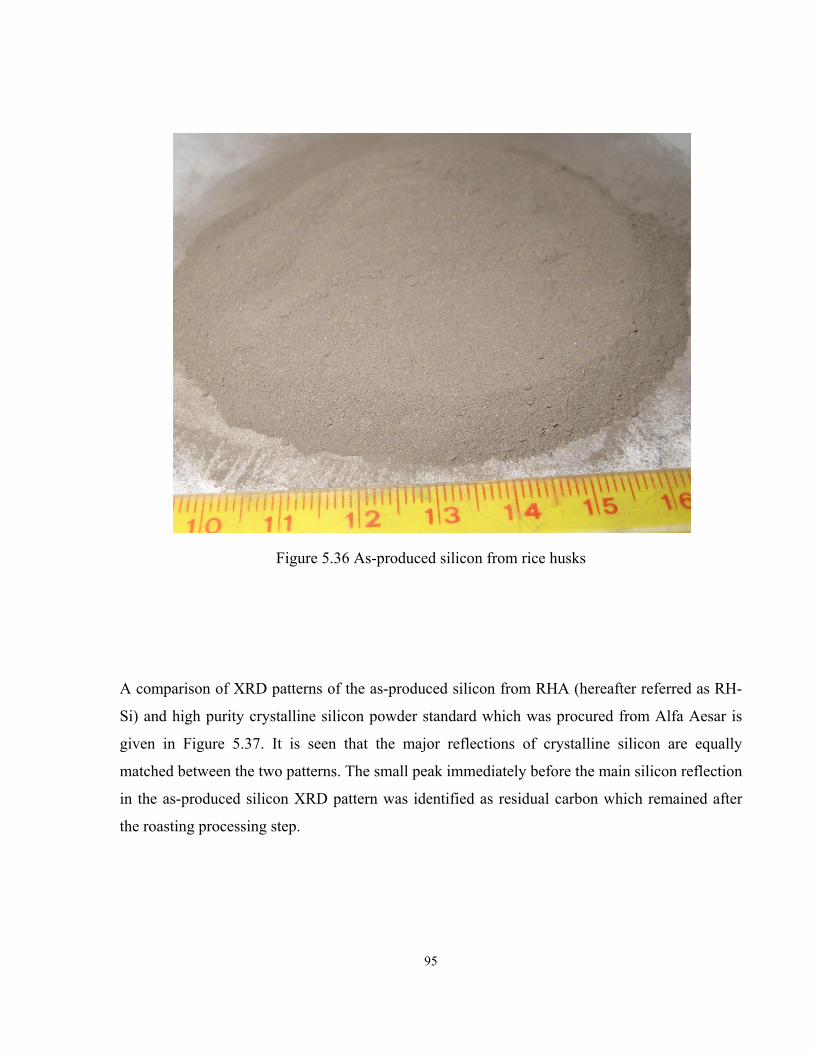
95
Figure 5.36 As-produced silicon from rice husks
A comparison of XRD patterns of the as-produced silicon from RHA (hereafter referred as RH-
Si) and high purity crystalline silicon powder standard which was procured from Alfa Aesar is
given in Figure 5.37. It is seen that the major reflections of crystalline silicon are equally
matched between the two patterns. The small peak immediately before the main silicon reflection
in the as-produced silicon XRD pattern was identified as residual carbon which remained after
the roasting processing step.
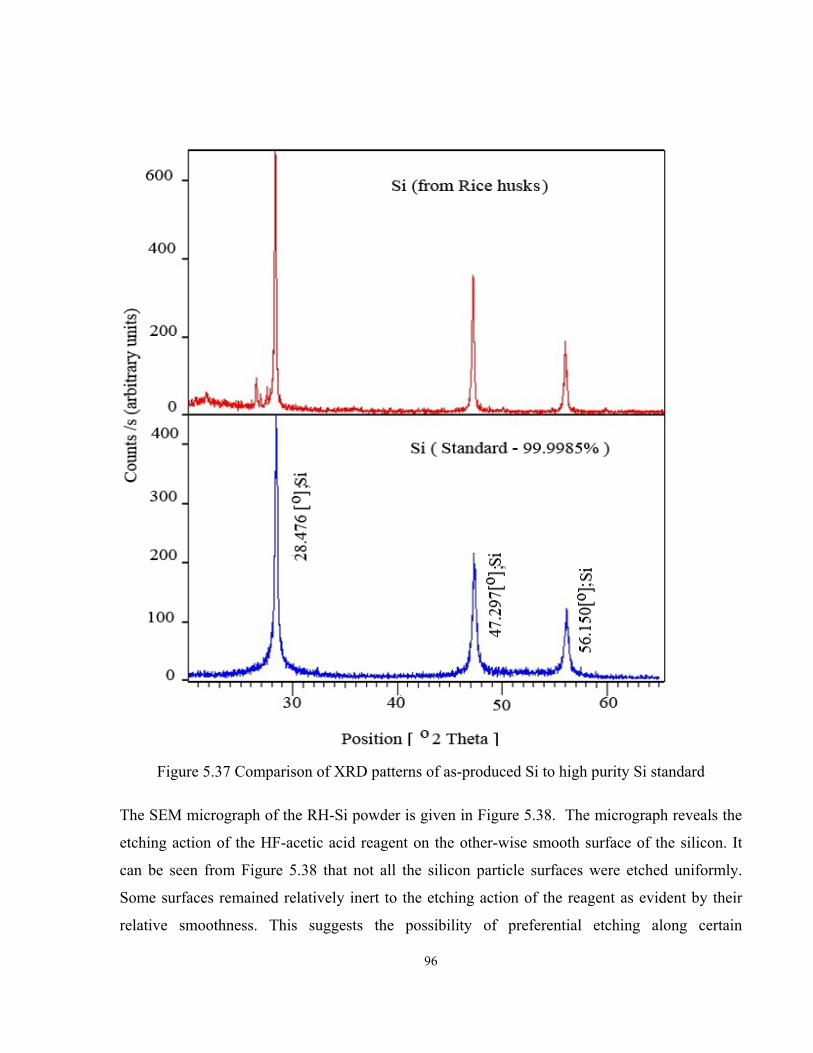
96
Figure 5.37 Comparison of XRD patterns of as-produced Si to high purity Si standard
The SEM micrograph of the RH-Si powder is given in Figure 5.38. The micrograph reveals the
etching action of the HF-acetic acid reagent on the other-wise smooth surface of the silicon. It
can be seen from Figure 5.38 that not all the silicon particle surfaces were etched uniformly.
Some surfaces remained relatively inert to the etching action of the reagent as evident by their
relative smoothness. This suggests the possibility of preferential etching along certain
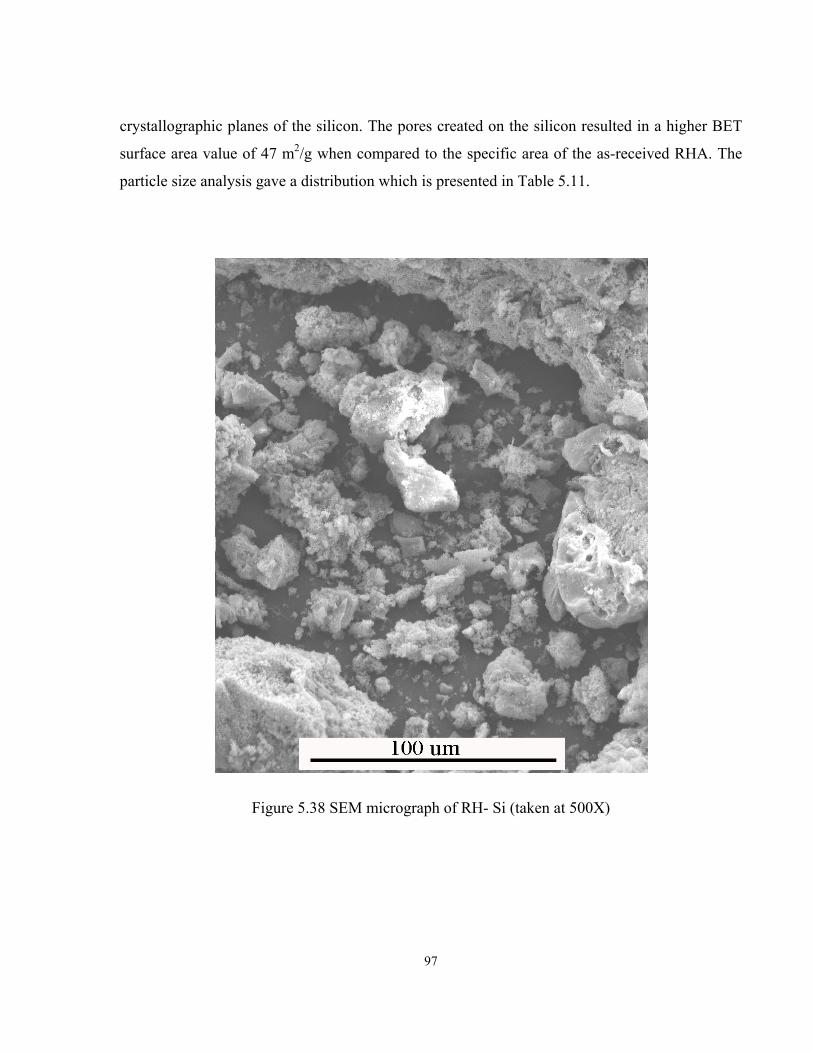
97
crystallographic planes of the silicon. The pores created on the silicon resulted in a higher BET
surface area value of 47 m2/g when compared to the specific area of the as-received RHA. The
particle size analysis gave a distribution which is presented in Table 5.11.
Figure 5.38 SEM micrograph of RH- Si (taken at 500X)
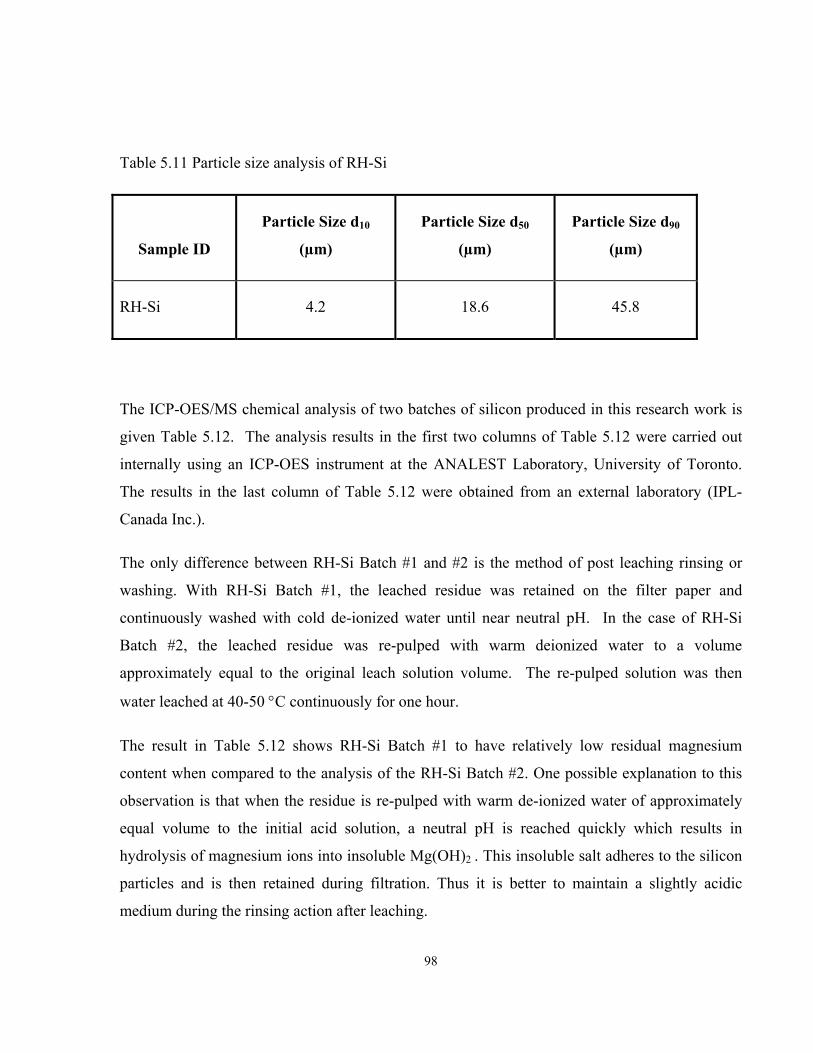
98
Sample ID
Particle Size d10
(µm)
Particle Size d50
(µm)
Particle Size d90
(µm)
RH-Si 4.2 18.6 45.8
The ICP-OES/MS chemical analysis of two batches of silicon produced in this research work is
given Table 5.12. The analysis results in the first two columns of Table 5.12 were carried out
internally using an ICP-OES instrument at the ANALEST Laboratory, University of Toronto.
The results in the last column of Table 5.12 were obtained from an external laboratory (IPL-
Canada Inc.).
The only difference between RH-Si Batch #1 and #2 is the method of post leaching rinsing or
washing. With RH-Si Batch #1, the leached residue was retained on the filter paper and
continuously washed with cold de-ionized water until near neutral pH. In the case of RH-Si
Batch #2, the leached residue was re-pulped with warm deionized water to a volume
approximately equal to the original leach solution volume. The re-pulped solution was then
water leached at 40-50 °C continuously for one hour.
The result in Table 5.12 shows RH-Si Batch #1 to have relatively low residual magnesium
content when compared to the analysis of the RH-Si Batch #2. One possible explanation to this
observation is that when the residue is re-pulped with warm de-ionized water of approximately
equal volume to the initial acid solution, a neutral pH is reached quickly which results in
hydrolysis of magnesium ions into insoluble Mg(OH)2 . This insoluble salt adheres to the silicon
particles and is then retained during filtration. Thus it is better to maintain a slightly acidic
medium during the rinsing action after leaching.
Table 5.11 Particle size analysis of RH-Si
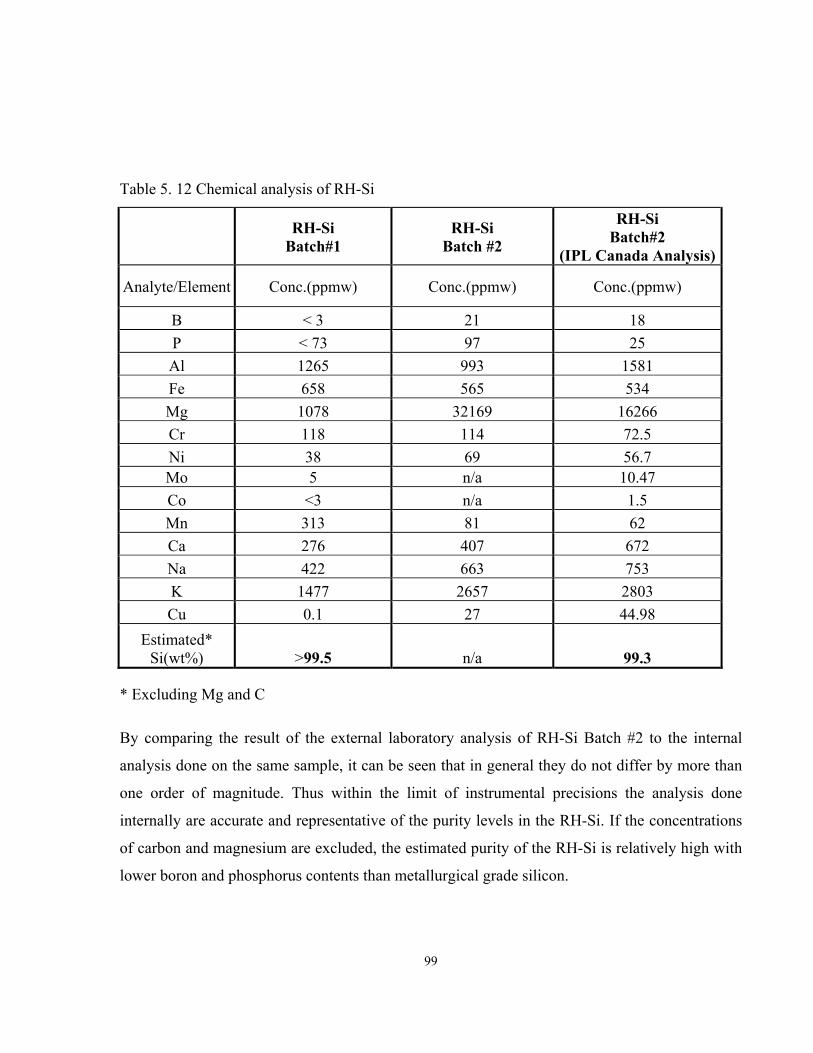
99
* Excluding Mg and C
By comparing the result of the external laboratory analysis of RH-Si Batch #2 to the internal
analysis done on the same sample, it can be seen that in general they do not differ by more than
one order of magnitude. Thus within the limit of instrumental precisions the analysis done
internally are accurate and representative of the purity levels in the RH-Si. If the concentrations
of carbon and magnesium are excluded, the estimated purity of the RH-Si is relatively high with
lower boron and phosphorus contents than metallurgical grade silicon.
Table 5. 12 Chemical analysis of RH-Si
RH-Si
Batch#1 RH-Si
Batch #2
RH-Si Batch#2
(IPL Canada Analysis)
Analyte/Element Conc.(ppmw) Conc.(ppmw) Conc.(ppmw)
B < 3 21 18 P < 73 97 25 Al 1265 993 1581 Fe 658 565 534 Mg 1078 32169 16266 Cr 118 114 72.5 Ni 38 69 56.7 Mo 5 n/a 10.47 Co <3 n/a 1.5 Mn 313 81 62 Ca 276 407 672 Na 422 663 753 K 1477 2657 2803 Cu 0.1 27 44.98
Estimated* Si(wt%) >99.5 n/a 99.3
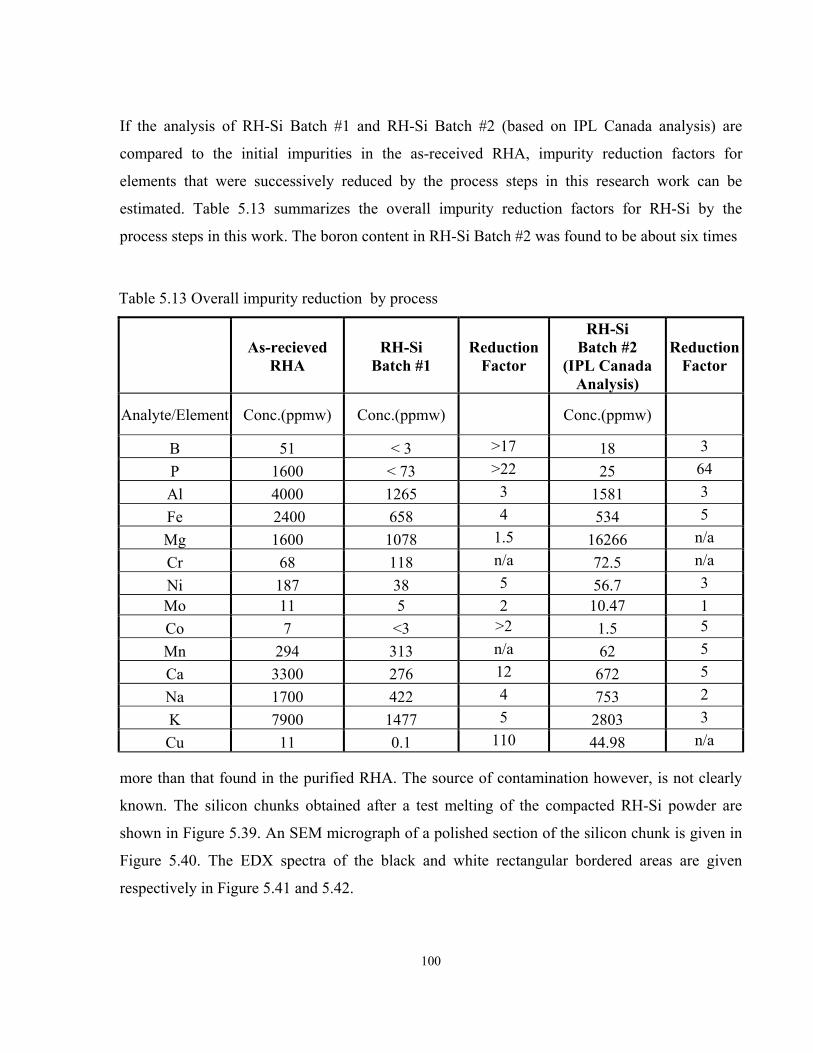
100
If the analysis of RH-Si Batch #1 and RH-Si Batch #2 (based on IPL Canada analysis) are
compared to the initial impurities in the as-received RHA, impurity reduction factors for
elements that were successively reduced by the process steps in this research work can be
estimated. Table 5.13 summarizes the overall impurity reduction factors for RH-Si by the
process steps in this work. The boron content in RH-Si Batch #2 was found to be about six times
more than that found in the purified RHA. The source of contamination however, is not clearly
known. The silicon chunks obtained after a test melting of the compacted RH-Si powder are
shown in Figure 5.39. An SEM micrograph of a polished section of the silicon chunk is given in
Figure 5.40. The EDX spectra of the black and white rectangular bordered areas are given
respectively in Figure 5.41 and 5.42.
Table 5.13 Overall impurity reduction by process
As-recieved
RHA RH-Si
Batch #1 Reduction
Factor
RH-Si Batch #2
(IPL Canada Analysis)
ReductionFactor
Analyte/Element Conc.(ppmw) Conc.(ppmw)
Conc.(ppmw)
B 51 < 3 >17 18 3 P 1600 < 73 >22 25 64 Al 4000 1265 3 1581 3 Fe 2400 658 4 534 5 Mg 1600 1078 1.5 16266 n/a Cr 68 118 n/a 72.5 n/a Ni 187 38 5 56.7 3 Mo 11 5 2 10.47 1 Co 7 <3 >2 1.5 5 Mn 294 313 n/a 62 5 Ca 3300 276 12 672 5 Na 1700 422 4 753 2 K 7900 1477 5 2803 3 Cu 11 0.1 110 44.98 n/a
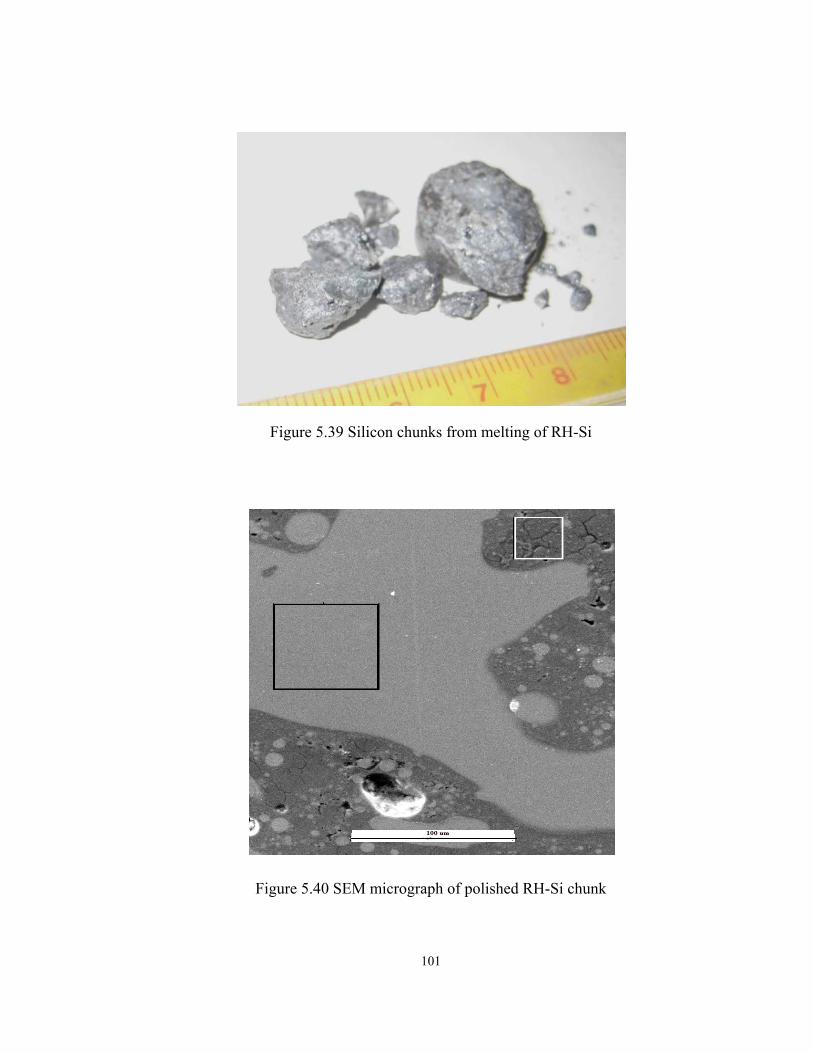
101
Figure 5.39 Silicon chunks from melting of RH-Si
Figure 5.40 SEM micrograph of polished RH-Si chunk
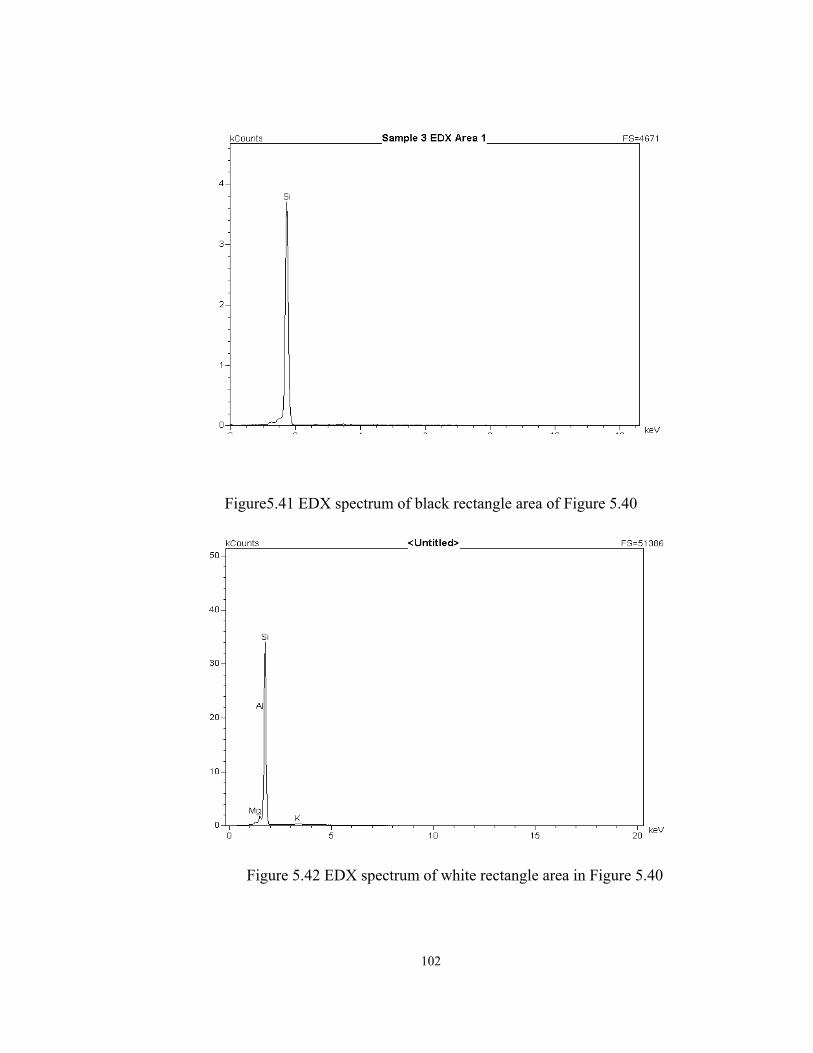
102
Figure5.41 EDX spectrum of black rectangle area of Figure 5.40
Figure 5.42 EDX spectrum of white rectangle area in Figure 5.40
103
CHAPTER SIX: Summary, Conclusions and Future Works
6.1 Summary and Conclusions The feasibility of producing high purity silicon from rice husks has been studied in this work.
The rice husk originally from India was combusted in a Torbed™ reactor to yield a black
coloured rice husk ash (RHA). The RHA after initial characterization was subjected to a
purification treatment of leaching followed by roasting. The purified RHA was blended with
magnesium granules/turnings and polyvinyl alcohol solution in predetermined weight ratios. The
wet blended material was briefly oven dried under argon atmosphere before compacting into disc
pellets. The pelletized reactants were reduced in tube furnace under flowing argon atmosphere.
The effect of initial charge composition in terms of percent excess magnesium and the effect of
reduction hold temperature were investigated both theoretically by FactSage thermodynamics
calculations and experimentally. Post-reduction leaching was investigated to determine the
effects of reagents type and temperature on mechanism of dissolution of reduction by-products to
yield silicon. It has been found based on the studies carried out in this research that:
1. It is feasible to synthesize silicon of high purity from rice husks. The processing steps
followed in this study have constituted an integrated process for producing silicon from rice
husks with reasonably high purity. The boron and phosphorus content in particular were
reduced by factors greater than 10 and 20 respectively when compared to their initial content
in the rice husk ash.
2. The purity of rice husk ash in terms of silica content can be improved by leaching in 10 wt%
hydrochloric acid followed by roasting in air to a temperature of 700 °C for time period of 1-
2 hours.
3. Initial charge composition in terms of percent excess magnesium and reduction hold
temperature were found to influence the yield of silicon upon reduction in argon atmosphere.
A charge of 5 wt% excess magnesium and reduction temperature of 900 °C in argon
atmosphere gave maximum silicon yield.
4. The reduction reaction mechanism of magnesium and rice husk ash silica was proposed to
proceed via gas-solid reaction. The reduction in magnesium silicide (Mg2Si) formation with
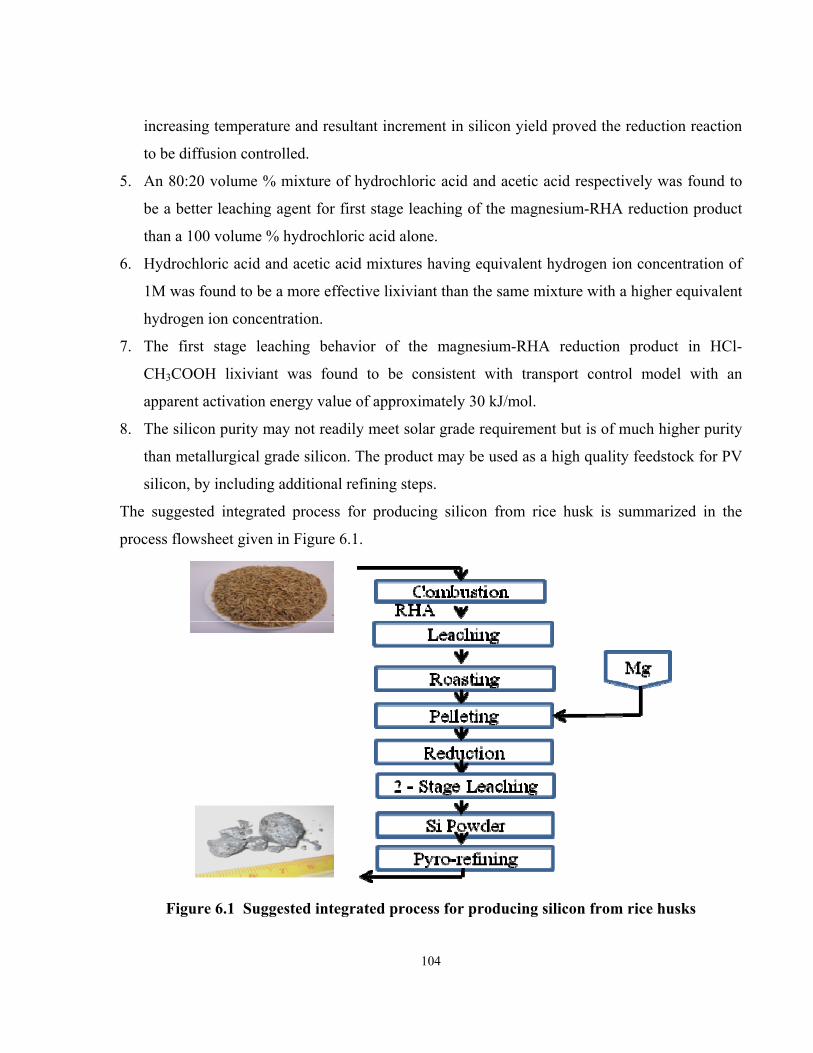
104
increasing temperature and resultant increment in silicon yield proved the reduction reaction
to be diffusion controlled.
5. An 80:20 volume % mixture of hydrochloric acid and acetic acid respectively was found to
be a better leaching agent for first stage leaching of the magnesium-RHA reduction product
than a 100 volume % hydrochloric acid alone.
6. Hydrochloric acid and acetic acid mixtures having equivalent hydrogen ion concentration of
1M was found to be a more effective lixiviant than the same mixture with a higher equivalent
hydrogen ion concentration.
7. The first stage leaching behavior of the magnesium-RHA reduction product in HCl-
CH3COOH lixiviant was found to be consistent with transport control model with an
apparent activation energy value of approximately 30 kJ/mol.
8. The silicon purity may not readily meet solar grade requirement but is of much higher purity
than metallurgical grade silicon. The product may be used as a high quality feedstock for PV
silicon, by including additional refining steps.
The suggested integrated process for producing silicon from rice husk is summarized in the
process flowsheet given in Figure 6.1.
Figure 6.1 Suggested integrated process for producing silicon from rice husks
105
6.2 Future Works 1. The findings of this research work may be comprehensive but certainly not exhaustive.
Further bench work using the suggested integrated process flowsheet as a platform will
be needed to establish the range of attainable RH-Si purities from relatively large batch
samples. Such future work may provide useful information as to whether or not there is a
correlation between the size of charge to the process and the purity of the RH-Si
obtained. This will prove useful information when considering scalability of the process.
2. Future work will also be needed to establish the smelting and refining of the RH-Si
powder using known or novel techniques that take advantage of the relatively low dopant
group impurities and the more reactive impurities contained in the RH-Si
3. Advance future works on characterizing the electrical properties of the refined RH-Si
ingot will eventually add value to the RH-Si product and make it more attractive not only
to the PV-industry but also other industries that require high purity silicon at reasonable
cost.
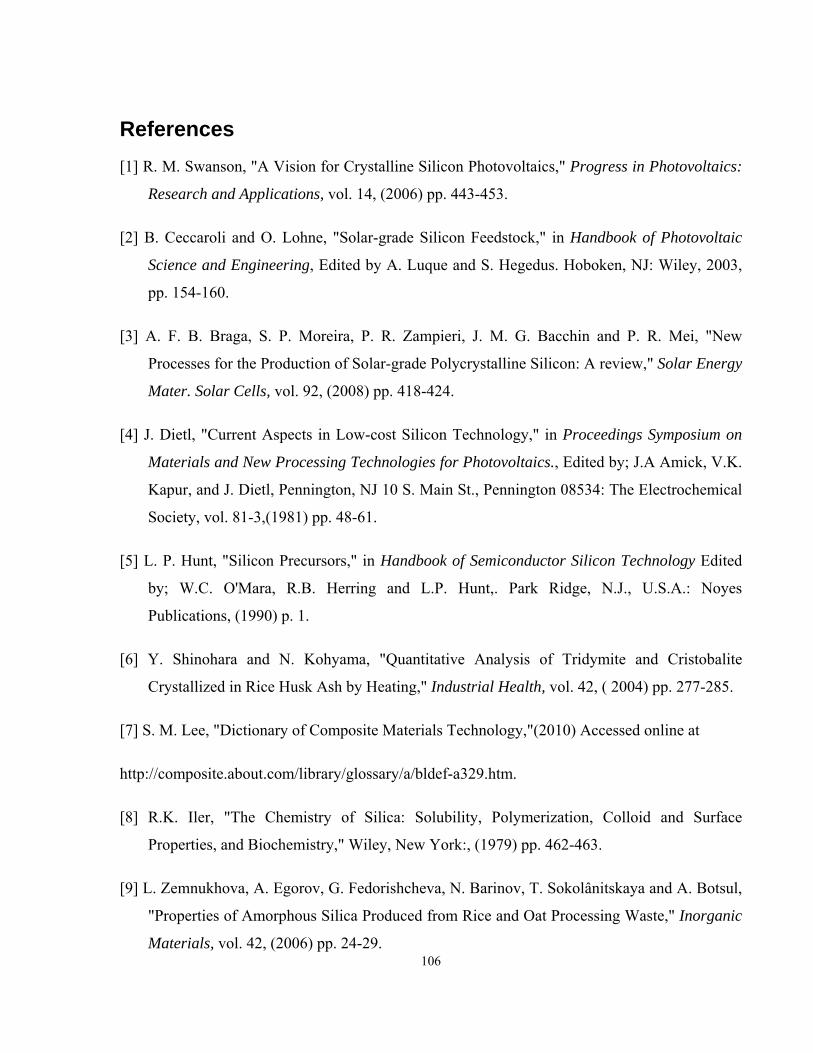
106
References [1] R. M. Swanson, "A Vision for Crystalline Silicon Photovoltaics," Progress in Photovoltaics:
Research and Applications, vol. 14, (2006) pp. 443-453.
[2] B. Ceccaroli and O. Lohne, "Solar-grade Silicon Feedstock," in Handbook of Photovoltaic
Science and Engineering, Edited by A. Luque and S. Hegedus. Hoboken, NJ: Wiley, 2003,
pp. 154-160.
[3] A. F. B. Braga, S. P. Moreira, P. R. Zampieri, J. M. G. Bacchin and P. R. Mei, "New
Processes for the Production of Solar-grade Polycrystalline Silicon: A review," Solar Energy
Mater. Solar Cells, vol. 92, (2008) pp. 418-424.
[4] J. Dietl, "Current Aspects in Low-cost Silicon Technology," in Proceedings Symposium on
Materials and New Processing Technologies for Photovoltaics., Edited by; J.A Amick, V.K.
Kapur, and J. Dietl, Pennington, NJ 10 S. Main St., Pennington 08534: The Electrochemical
Society, vol. 81-3,(1981) pp. 48-61.
[5] L. P. Hunt, "Silicon Precursors," in Handbook of Semiconductor Silicon Technology Edited
by; W.C. O'Mara, R.B. Herring and L.P. Hunt,. Park Ridge, N.J., U.S.A.: Noyes
Publications, (1990) p. 1.
[6] Y. Shinohara and N. Kohyama, "Quantitative Analysis of Tridymite and Cristobalite
Crystallized in Rice Husk Ash by Heating," Industrial Health, vol. 42, ( 2004) pp. 277-285.
[7] S. M. Lee, "Dictionary of Composite Materials Technology,"(2010) Accessed online at
http://composite.about.com/library/glossary/a/bldef-a329.htm.
[8] R.K. Iler, "The Chemistry of Silica: Solubility, Polymerization, Colloid and Surface
Properties, and Biochemistry," Wiley, New York:, (1979) pp. 462-463.
[9] L. Zemnukhova, A. Egorov, G. Fedorishcheva, N. Barinov, T. Sokolânitskaya and A. Botsul,
"Properties of Amorphous Silica Produced from Rice and Oat Processing Waste," Inorganic
Materials, vol. 42, (2006) pp. 24-29.
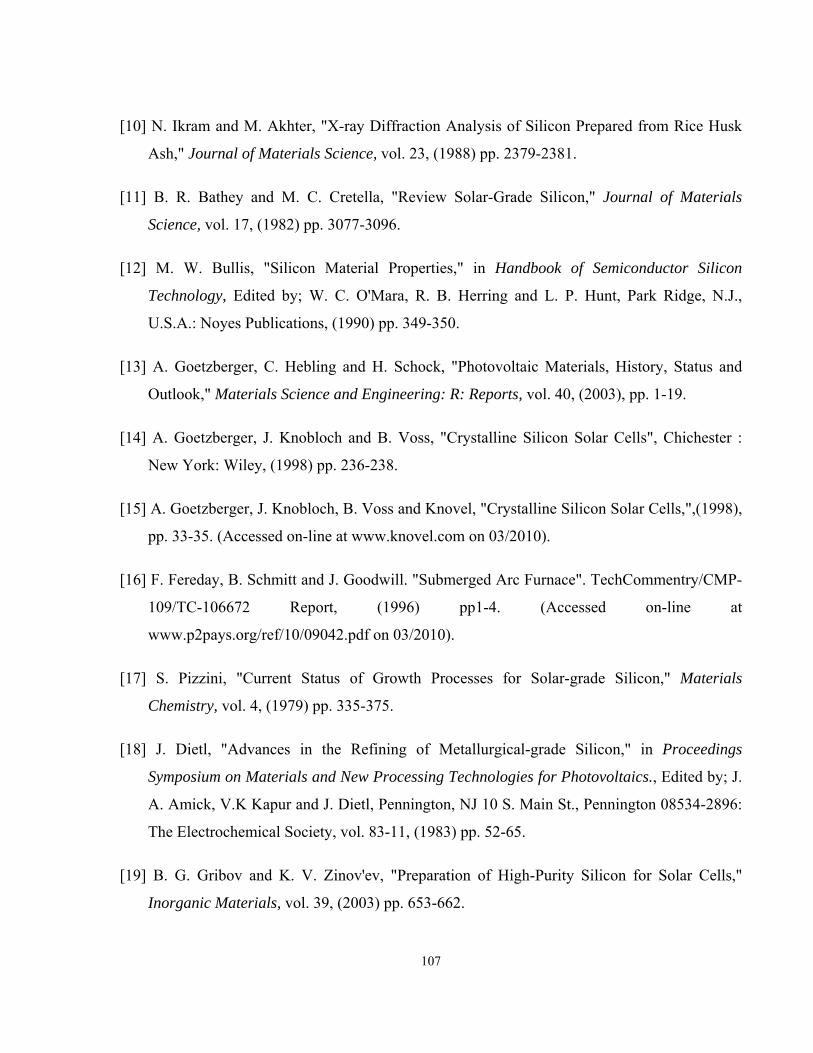
107
[10] N. Ikram and M. Akhter, "X-ray Diffraction Analysis of Silicon Prepared from Rice Husk
Ash," Journal of Materials Science, vol. 23, (1988) pp. 2379-2381.
[11] B. R. Bathey and M. C. Cretella, "Review Solar-Grade Silicon," Journal of Materials
Science, vol. 17, (1982) pp. 3077-3096.
[12] M. W. Bullis, "Silicon Material Properties," in Handbook of Semiconductor Silicon
Technology, Edited by; W. C. O'Mara, R. B. Herring and L. P. Hunt, Park Ridge, N.J.,
U.S.A.: Noyes Publications, (1990) pp. 349-350.
[13] A. Goetzberger, C. Hebling and H. Schock, "Photovoltaic Materials, History, Status and
Outlook," Materials Science and Engineering: R: Reports, vol. 40, (2003), pp. 1-19.
[14] A. Goetzberger, J. Knobloch and B. Voss, "Crystalline Silicon Solar Cells", Chichester :
New York: Wiley, (1998) pp. 236-238.
[15] A. Goetzberger, J. Knobloch, B. Voss and Knovel, "Crystalline Silicon Solar Cells,",(1998),
pp. 33-35. (Accessed on-line at www.knovel.com on 03/2010).
[16] F. Fereday, B. Schmitt and J. Goodwill. "Submerged Arc Furnace". TechCommentry/CMP-
109/TC-106672 Report, (1996) pp1-4. (Accessed on-line at
www.p2pays.org/ref/10/09042.pdf on 03/2010).
[17] S. Pizzini, "Current Status of Growth Processes for Solar-grade Silicon," Materials
Chemistry, vol. 4, (1979) pp. 335-375.
[18] J. Dietl, "Advances in the Refining of Metallurgical-grade Silicon," in Proceedings
Symposium on Materials and New Processing Technologies for Photovoltaics., Edited by; J.
A. Amick, V.K Kapur and J. Dietl, Pennington, NJ 10 S. Main St., Pennington 08534-2896:
The Electrochemical Society, vol. 83-11, (1983) pp. 52-65.
[19] B. G. Gribov and K. V. Zinov'ev, "Preparation of High-Purity Silicon for Solar Cells,"
Inorganic Materials, vol. 39, (2003) pp. 653-662.
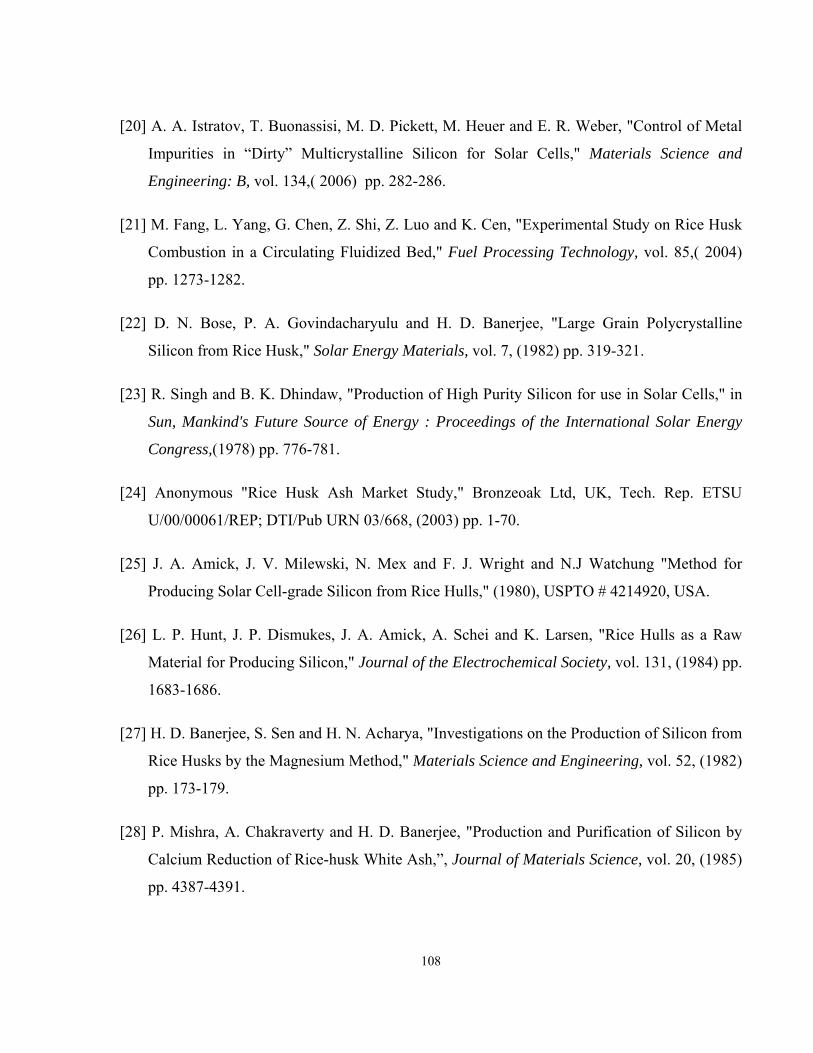
108
[20] A. A. Istratov, T. Buonassisi, M. D. Pickett, M. Heuer and E. R. Weber, "Control of Metal
Impurities in “Dirty” Multicrystalline Silicon for Solar Cells," Materials Science and
Engineering: B, vol. 134,( 2006) pp. 282-286.
[21] M. Fang, L. Yang, G. Chen, Z. Shi, Z. Luo and K. Cen, "Experimental Study on Rice Husk
Combustion in a Circulating Fluidized Bed," Fuel Processing Technology, vol. 85,( 2004)
pp. 1273-1282.
[22] D. N. Bose, P. A. Govindacharyulu and H. D. Banerjee, "Large Grain Polycrystalline
Silicon from Rice Husk," Solar Energy Materials, vol. 7, (1982) pp. 319-321.
[23] R. Singh and B. K. Dhindaw, "Production of High Purity Silicon for use in Solar Cells," in
Sun, Mankind's Future Source of Energy : Proceedings of the International Solar Energy
Congress,(1978) pp. 776-781.
[24] Anonymous "Rice Husk Ash Market Study," Bronzeoak Ltd, UK, Tech. Rep. ETSU
U/00/00061/REP; DTI/Pub URN 03/668, (2003) pp. 1-70.
[25] J. A. Amick, J. V. Milewski, N. Mex and F. J. Wright and N.J Watchung "Method for
Producing Solar Cell-grade Silicon from Rice Hulls," (1980), USPTO # 4214920, USA.
[26] L. P. Hunt, J. P. Dismukes, J. A. Amick, A. Schei and K. Larsen, "Rice Hulls as a Raw
Material for Producing Silicon," Journal of the Electrochemical Society, vol. 131, (1984) pp.
1683-1686.
[27] H. D. Banerjee, S. Sen and H. N. Acharya, "Investigations on the Production of Silicon from
Rice Husks by the Magnesium Method," Materials Science and Engineering, vol. 52, (1982)
pp. 173-179.
[28] P. Mishra, A. Chakraverty and H. D. Banerjee, "Production and Purification of Silicon by
Calcium Reduction of Rice-husk White Ash,”, Journal of Materials Science, vol. 20, (1985)
pp. 4387-4391.
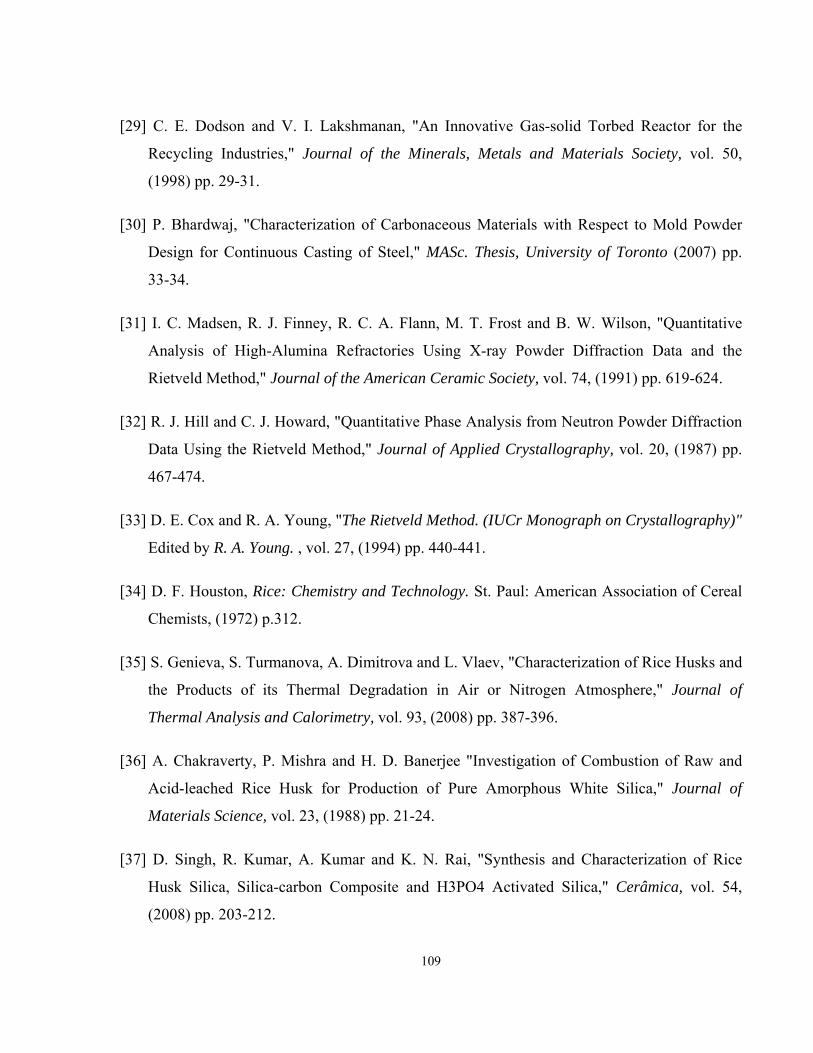
109
[29] C. E. Dodson and V. I. Lakshmanan, "An Innovative Gas-solid Torbed Reactor for the
Recycling Industries," Journal of the Minerals, Metals and Materials Society, vol. 50,
(1998) pp. 29-31.
[30] P. Bhardwaj, "Characterization of Carbonaceous Materials with Respect to Mold Powder
Design for Continuous Casting of Steel," MASc. Thesis, University of Toronto (2007) pp.
33-34.
[31] I. C. Madsen, R. J. Finney, R. C. A. Flann, M. T. Frost and B. W. Wilson, "Quantitative
Analysis of High-Alumina Refractories Using X-ray Powder Diffraction Data and the
Rietveld Method," Journal of the American Ceramic Society, vol. 74, (1991) pp. 619-624.
[32] R. J. Hill and C. J. Howard, "Quantitative Phase Analysis from Neutron Powder Diffraction
Data Using the Rietveld Method," Journal of Applied Crystallography, vol. 20, (1987) pp.
467-474.
[33] D. E. Cox and R. A. Young, "The Rietveld Method. (IUCr Monograph on Crystallography)"
Edited by R. A. Young. , vol. 27, (1994) pp. 440-441.
[34] D. F. Houston, Rice: Chemistry and Technology. St. Paul: American Association of Cereal
Chemists, (1972) p.312.
[35] S. Genieva, S. Turmanova, A. Dimitrova and L. Vlaev, "Characterization of Rice Husks and
the Products of its Thermal Degradation in Air or Nitrogen Atmosphere," Journal of
Thermal Analysis and Calorimetry, vol. 93, (2008) pp. 387-396.
[36] A. Chakraverty, P. Mishra and H. D. Banerjee "Investigation of Combustion of Raw and
Acid-leached Rice Husk for Production of Pure Amorphous White Silica," Journal of
Materials Science, vol. 23, (1988) pp. 21-24.
[37] D. Singh, R. Kumar, A. Kumar and K. N. Rai, "Synthesis and Characterization of Rice
Husk Silica, Silica-carbon Composite and H3PO4 Activated Silica," Cerâmica, vol. 54,
(2008) pp. 203-212.

110
[38] S. Brunauer, P. H. Emmett and E. Teller, "Adsorption of Gases in Multimolecular Layers,"
Journal of American Chemical Society., vol. 60, (1938) pp. 309-319.
[39] P. l. Raschman and A. Fedorocková, "Study of Inhibiting Effect of Acid Concentration on
the Dissolution Rate of Magnesium Oxide during the Leaching of Dead-burned Magnesite,"
Hydrometallurgy, vol. 71, (2004) pp. 403-412.
[40] A. R. Burkin, "Chemical Hydrometallurgy : Theory and Principles". London; River Edge,
NJ: Imperial College Press; distributed by World Scientific Pub. Co., (2001) pp. 220-221.
[41] W. L. Choo, M. I. Jeffrey and S. G. Robertson, "Analysis of Leaching and Cementation
Reaction Kinetics: Correcting for Volume Changes in Laboratory Studies,"
Hydrometallurgy, vol. 82, (2006) pp. 110-116.
[42] F. Demir, O. Lacin and B. Donmez, "Leaching Kinetics of Calcined Magnesite in Citric
Acid Solutions," Industrial & Engineering Chemistry Research, vol. 45, pp. 1307-1311,
2006.
[43] F. Habashi, "Principles of Extractive Metallurgy," vol.1 Gordon and Breach, New York:,
(1969) pp. 130-137.
[44] F. Habashi, "Principles of Extractive Metallurgy," vol.1, Gordon and Breach, New York:,
(1969) pp. 244-248.
[45] A. R. Burkin, "Chemical Hydrometallurgy : Theory and Principles". London; River Edge,
NJ: Imperial College Press; distributed by World Scientific Pub. Co., (2001), pp. 174-177.
[46] F. Habashi, "Principles of Extractive Metallurgy," vol.1 Gordon and Breach, New York:,
(1969) pp. 143-145.
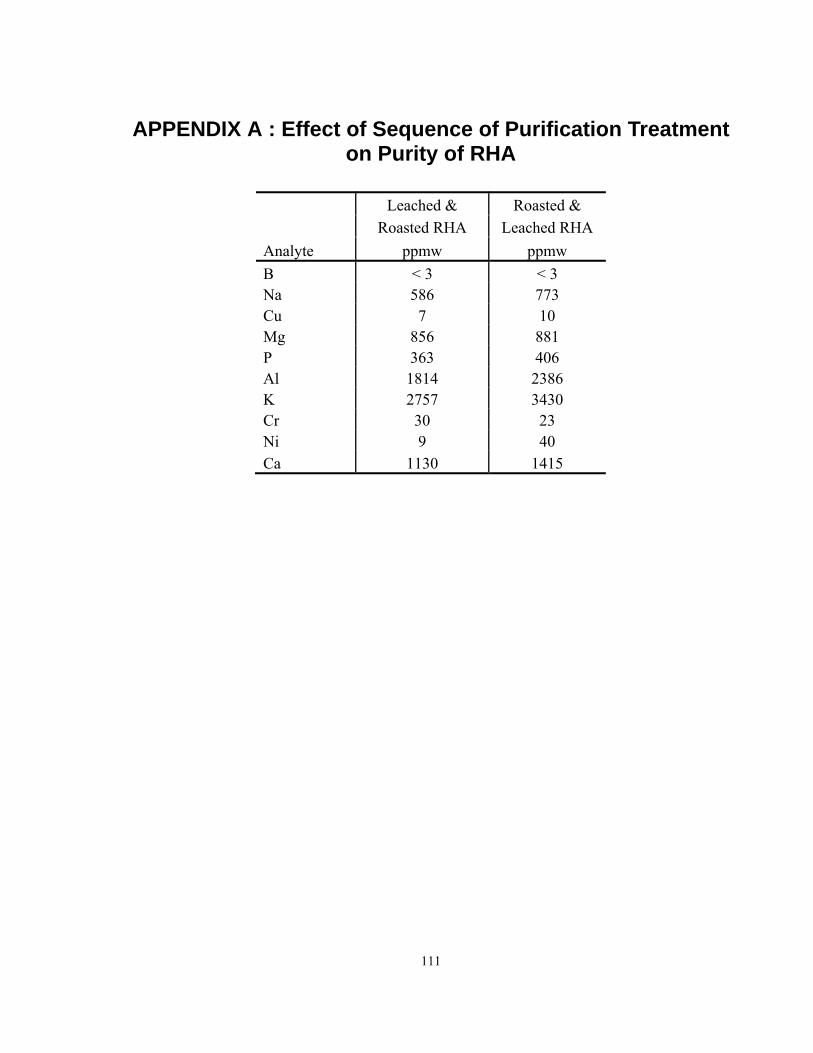
111
APPENDIX A : Effect of Sequence of Purification Treatment on Purity of RHA
Analyte
Leached & Roasted & Roasted RHA Leached RHA
ppmw ppmw B < 3 < 3 Na 586 773 Cu 7 10 Mg 856 881 P 363 406 Al 1814 2386 K 2757 3430 Cr 30 23 Ni 9 40 Ca 1130 1415
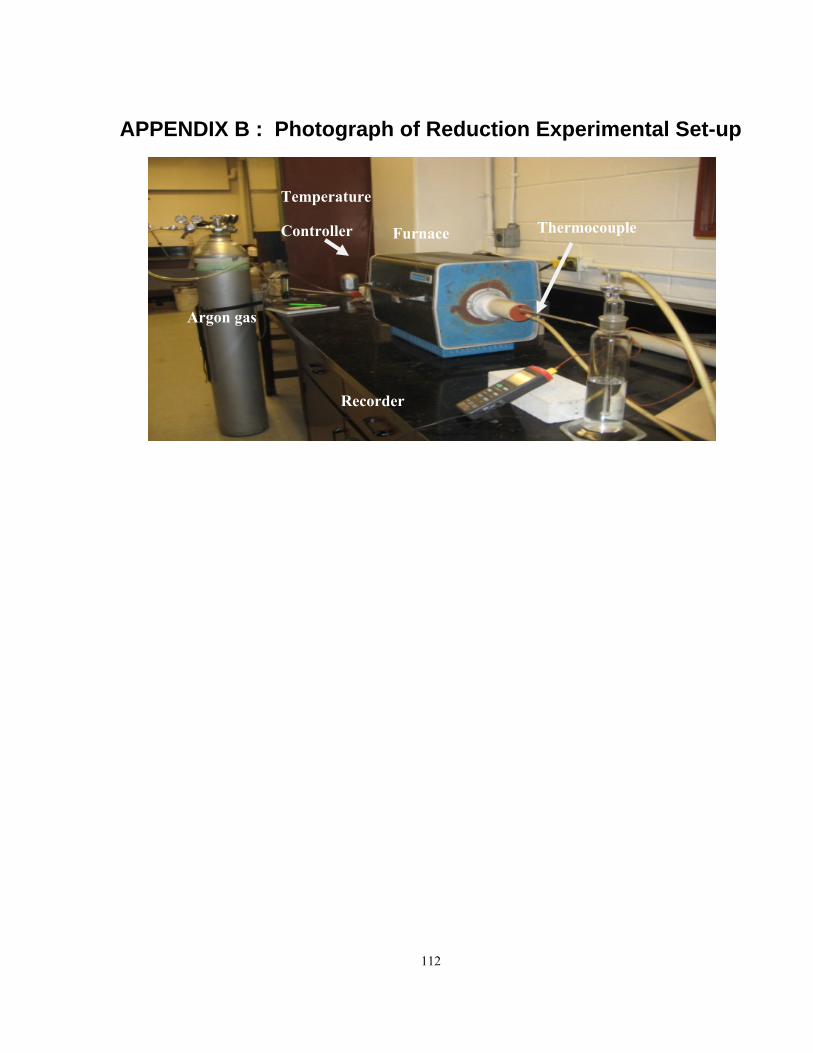
112
APPENDIX B : Photograph of Reduction Experimental Set-up
Argon gas
Furnace
Recorder
Thermocouple
Temperature
Controller
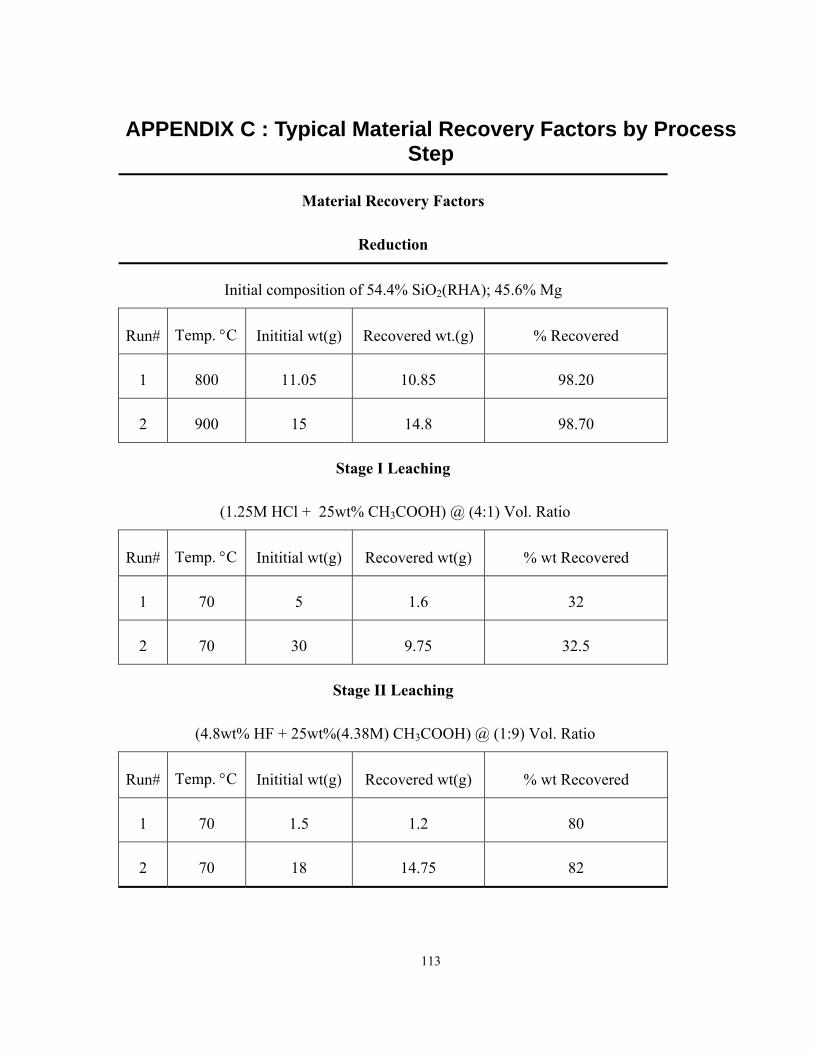
113
APPENDIX C : Typical Material Recovery Factors by Process Step
Material Recovery Factors
Reduction
Initial composition of 54.4% SiO2(RHA); 45.6% Mg
Run# Temp. °C Inititial wt(g) Recovered wt.(g) % Recovered
1 800 11.05 10.85 98.20
2 900 15 14.8 98.70
Stage I Leaching
(1.25M HCl + 25wt% CH3COOH) @ (4:1) Vol. Ratio
Run# Temp. °C Inititial wt(g) Recovered wt(g) % wt Recovered
1 70 5 1.6 32
2 70 30 9.75 32.5
Stage II Leaching
(4.8wt% HF + 25wt%(4.38M) CH3COOH) @ (1:9) Vol. Ratio
Run# Temp. °C Inititial wt(g) Recovered wt(g) % wt Recovered
1 70 1.5 1.2 80
2 70 18 14.75 82
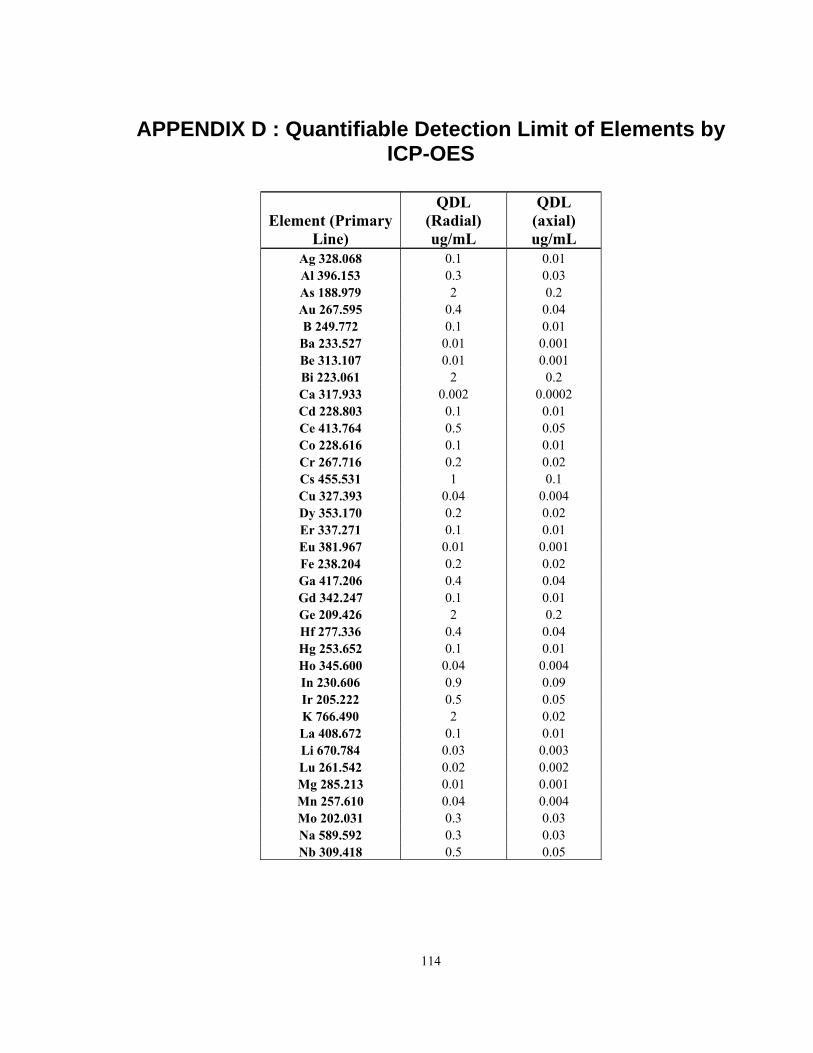
114
APPENDIX D : Quantifiable Detection Limit of Elements by ICP-OES
Element (Primary Line)
QDL (Radial) ug/mL
QDL (axial) ug/mL
Ag 328.068 0.1 0.01 Al 396.153 0.3 0.03 As 188.979 2 0.2 Au 267.595 0.4 0.04 B 249.772 0.1 0.01
Ba 233.527 0.01 0.001 Be 313.107 0.01 0.001 Bi 223.061 2 0.2 Ca 317.933 0.002 0.0002 Cd 228.803 0.1 0.01 Ce 413.764 0.5 0.05 Co 228.616 0.1 0.01 Cr 267.716 0.2 0.02 Cs 455.531 1 0.1 Cu 327.393 0.04 0.004 Dy 353.170 0.2 0.02 Er 337.271 0.1 0.01 Eu 381.967 0.01 0.001 Fe 238.204 0.2 0.02 Ga 417.206 0.4 0.04 Gd 342.247 0.1 0.01 Ge 209.426 2 0.2 Hf 277.336 0.4 0.04 Hg 253.652 0.1 0.01 Ho 345.600 0.04 0.004 In 230.606 0.9 0.09 Ir 205.222 0.5 0.05 K 766.490 2 0.02 La 408.672 0.1 0.01 Li 670.784 0.03 0.003 Lu 261.542 0.02 0.002 Mg 285.213 0.01 0.001 Mn 257.610 0.04 0.004 Mo 202.031 0.3 0.03 Na 589.592 0.3 0.03 Nb 309.418 0.5 0.05
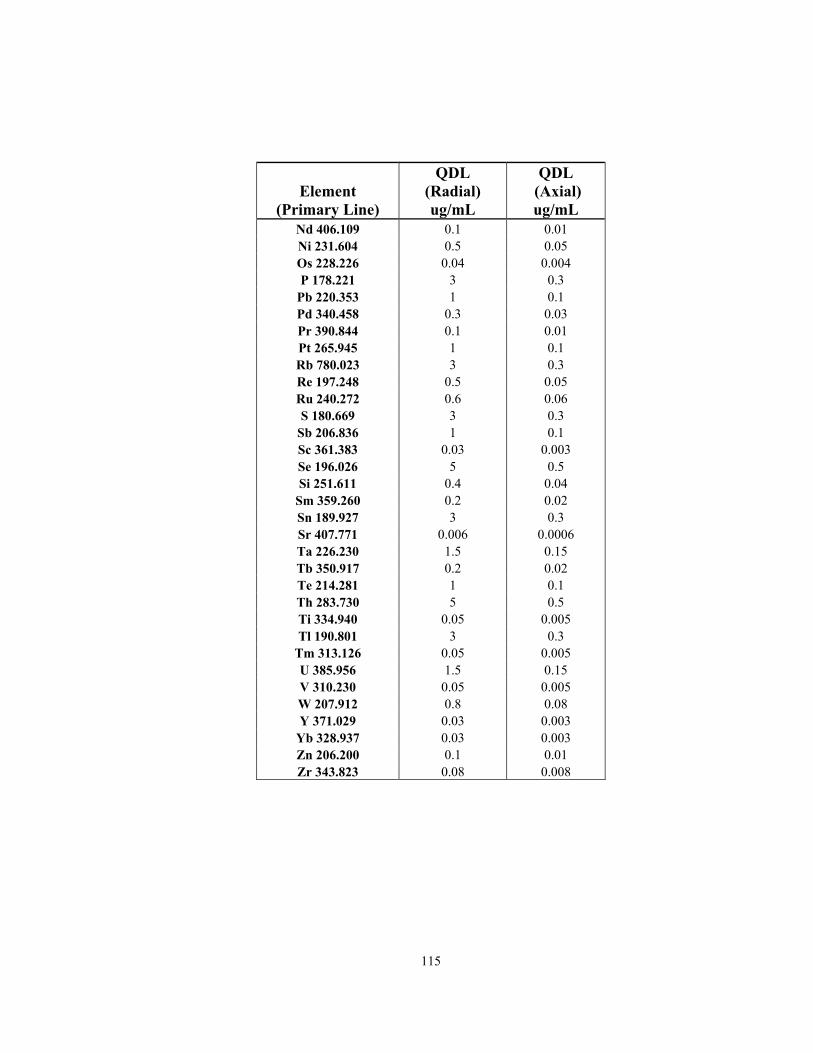
115
Element (Primary Line)
QDL (Radial) ug/mL
QDL (Axial) ug/mL
Nd 406.109 0.1 0.01 Ni 231.604 0.5 0.05 Os 228.226 0.04 0.004 P 178.221 3 0.3
Pb 220.353 1 0.1 Pd 340.458 0.3 0.03 Pr 390.844 0.1 0.01 Pt 265.945 1 0.1 Rb 780.023 3 0.3 Re 197.248 0.5 0.05 Ru 240.272 0.6 0.06 S 180.669 3 0.3
Sb 206.836 1 0.1 Sc 361.383 0.03 0.003 Se 196.026 5 0.5 Si 251.611 0.4 0.04
Sm 359.260 0.2 0.02 Sn 189.927 3 0.3 Sr 407.771 0.006 0.0006 Ta 226.230 1.5 0.15 Tb 350.917 0.2 0.02 Te 214.281 1 0.1 Th 283.730 5 0.5 Ti 334.940 0.05 0.005 Tl 190.801 3 0.3
Tm 313.126 0.05 0.005 U 385.956 1.5 0.15 V 310.230 0.05 0.005 W 207.912 0.8 0.08 Y 371.029 0.03 0.003
Yb 328.937 0.03 0.003 Zn 206.200 0.1 0.01 Zr 343.823 0.08 0.008
116
APPENDIX E: Author’s Presentations and Publications 1. Graduate Research Seminar, Department of Materials Science and Engineering,
University of Toronto, Ontario, Canada.
Presentation Title: “Synthesis of High Purity Silicon from Rice Husks” -January 14, 2010
2. Materials Challenges in Alternative and Renewable Energy Conference, Cocoa-Beach,
Florida, USA. February 21-25, 2010
Presentation Title: “Synthesis of Solar grade Silicon from Rice Husk Ash- An Integrated
Process” – February 23, 2010.
3. ASM Ontario Chapter Poster Presentations, McMaster University, Hamilton, Ontario,
Canada.
Poster Presentation Title: “Synthesis of High Purity Silicon from Rice Husks” -March 14,
2010.
4. Materials Challenges in Alternative and Renewable Energy Conference Proceedings; to
be published by The American Ceramics Society.
Accepted Publication Title: “Synthesis of Solar grade Silicon from Rice Husk Ash- An
Integrated Process” – March 22, 2010.
Co-Authors: M. Barati, A. Mclean and R. Roy


![Mechanical Properties of Reinforced Epoxy Composite Using ... · sisal epoxy composite. [10]. Study Akindapo, mechanical behavior of rice husks carbon fiber and groundnut shell carbon](https://img.pdfslide.us/doc/110x75/5e7390b8a23510133c749c77/mechanical-properties-of-reinforced-epoxy-composite-using-sisal-epoxy-composite.jpg)


![Effects of Rice husks ash addition on alumina layers ... · Rice husk is one of the most abundant by-products produced in the paddy field. ... silica powder [12]. The surface](https://img.pdfslide.us/doc/110x75/5b1b8e307f8b9a3c258ec324/effects-of-rice-husks-ash-addition-on-alumina-layers-rice-husk-is-one-of.jpg)