Embed Size (px)
Citation preview

Characterization of local rainwater lenses in agricultural areas with upward saline seepage.
Monitoring results Zeeland
Perry de LouwGualbert Oude EssinkSara Eeman (WUR)Bart Goes
Tomasso Letterio Bastiaan de VeenCorne PrevoSjors Stevens Valentina Marconi Franceso SergiPiet Maljaars
21 april 2008
Saline groundwater
Max. Holocene Transgression

21 april 2008
Factors controlling fresh-salt interface(base for 27 representative monitoring sites)
Salinity of groundwater
Seepage intensity
Surface water level
Comp. Cover
Layer (k,d,S)
Drainage
Dynamics

21 april 2008
Surface level and position of 27 field sites

21 april 2008
Field measurements at 27 sites
In-situ, 1D: Temperature and EC with depth with TEC-probe
Ex-situ,2D: Continuous Vertical Electrical Sounding (CVES)Ex-situ,2D: Continuous Vertical Electrical Sounding (CVES)
In-situ,1D: Groundwater sampling at different depth (filters)In-situ,1D: Groundwater sampling at different depth (filters)
Indirect: formation factor
21 april 2008
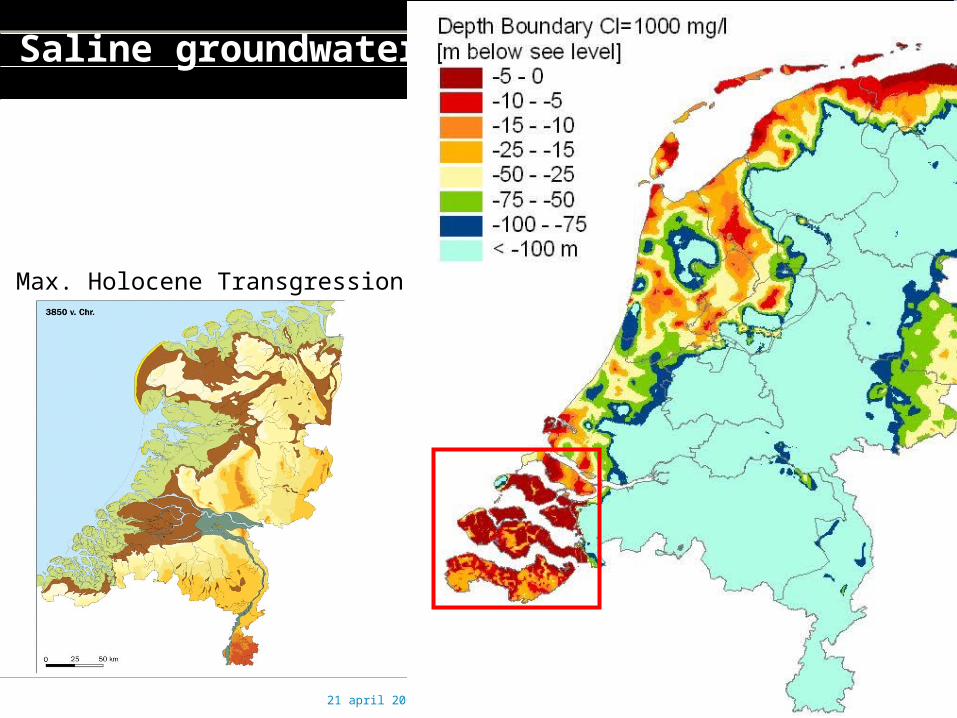
TEC-probe results
0
2000
4000
6000
8000
10000
12000
-150 -100 -50 0 50 100 150
surface level (cm above sea level)
max
imum
CL-
CO
NC
(mg/
l)
R^2=0.76
Max
. C
l-con
c (m
g/l)
Surface Level (cm relative to sea level)

21 april 2008
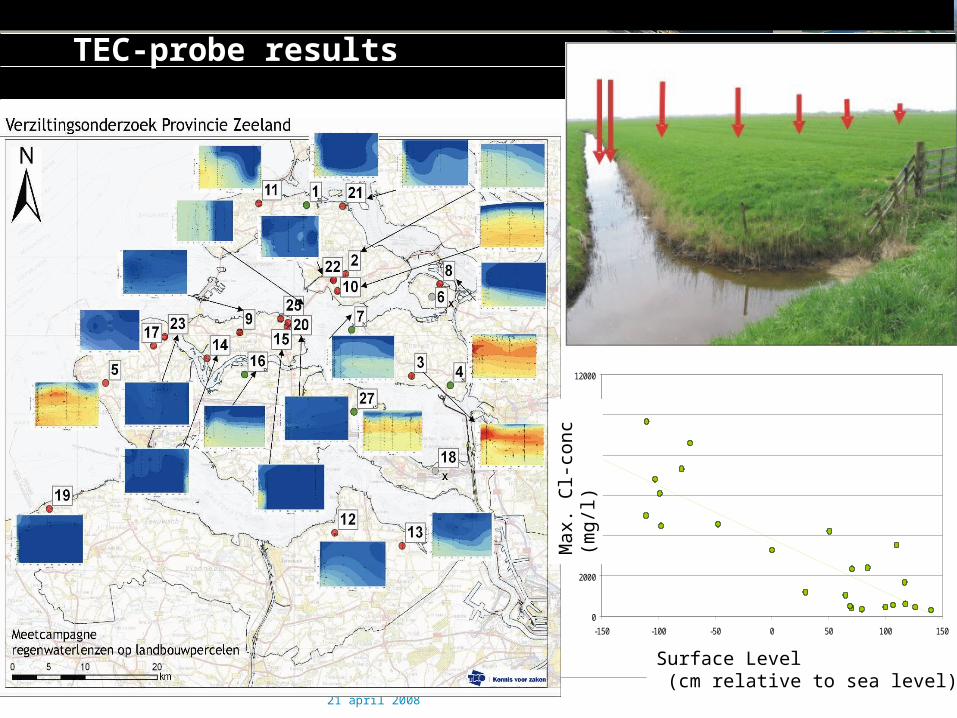
Site 11 Center ditchBorder ditch1m
7.5m 15m
30m
50m
100m
200m
300m
Ditch
Fossil Creek ridge
CVES line

21 april 2008
21 april 2008
Site 11 Center ditchBorder ditch1m
7.5m 15m
30m
50m
100m
200m
300m
Ditch
Fossil Creek ridge
CVES line

21 april 2008
ECa – depth profiles (TEC-probe)
-400
-350
-300
-250
-200
-150
-100
-50
0
0.0 5.0 10.0 15.0 20.0 25.0
ECa (mS/cm)
dep
th (
cm)
1m
7.5m
15m
30m
50m-2
100m
150m
200m
300m
Mixing zone

21 april 2008
Characterization using statistical moments (1st, 2th)
-400
-350
-300
-250
-200
-150
-100
-50
0
0 1000 2000 3000 4000 5000
cl-conc (mg/l)
dept
h (m
)
widthcenter
Cl-min
Cl-max
0
50
10
0
15
0
20
0
25
0
30
0
35
0
40
0
45
0
50
0
05
01
00
15
02
00
25
03
00
35
04
00
45
05
00
de
pth
(cm
)
Cl-gradient (Cl/dm)
norm
al d
istributio
n
Cl-g
rad
(ma
x)
wid
th (~
5S
)
(µ, 1st mom.)
(5S, 2th)
(µ, 1st mom.)
(5S, 2th)
21 april 2008
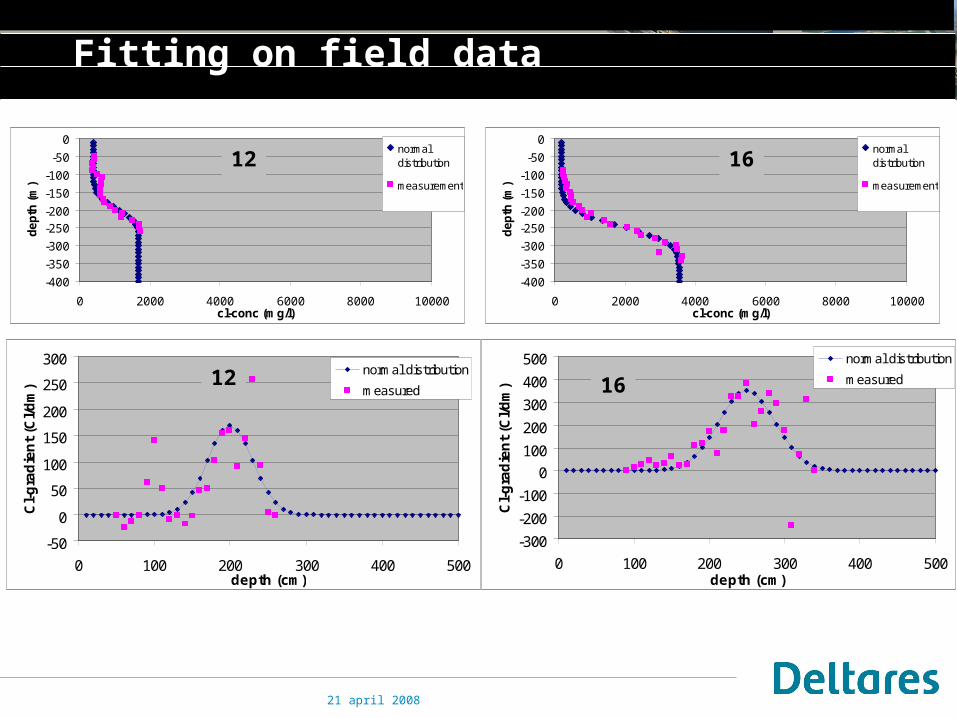
Fitting on field data
-300
-200
-100
0
100
200
300
400
500
0 100 200 300 400 500depth (cm)
Cl-
gra
die
nt
(Cl/
dm
)
normal distribution
measured
-400
-350
-300
-250
-200
-150
-100
-50
0
0 2000 4000 6000 8000 10000cl-conc (mg/l)
de
pth
(m
)
normaldistribution
measurement
16
-50
0
50
100
150
200
250
300
0 100 200 300 400 500depth (cm)
Cl-
gra
die
nt
(Cl/
dm
)
normal distribution
measured
12
-400
-350
-300
-250
-200
-150
-100
-50
0
0 2000 4000 6000 8000 10000cl-conc (mg/l)
de
pth
(m
)
normaldistribution
measurement
1212 16
1612

21 april 2008
Measured and calculated cl-depth profiles
-400
-350
-300
-250
-200
-150
-100
-50
0
0 2000 4000 6000 8000 10000cl-conc (mg/l)
de
pth
(m
)
normaldistribution
measurement
-400
-350
-300
-250
-200
-150
-100
-50
0
0 2000 4000 6000 8000 10000cl-conc (mg/l)
de
pth
(m
)
normaldistribution
measurement
-400
-350
-300
-250
-200
-150
-100
-50
0
0 2000 4000 6000 8000 10000cl-conc (mg/l)
de
pth
(m
)
normaldistribution
measurement
-400
-350
-300
-250
-200
-150
-100
-50
0
0 2000 4000 6000 8000 10000cl-conc (mg/l)
de
pth
(m
)
normaldistribution
measurement
-400
-350
-300
-250
-200
-150
-100
-50
0
0 2000 4000 6000 8000 10000cl-conc (mg/l)
de
pth
(m
)normaldistribution
measurement2
5
11
9
-400
-350
-300
-250
-200
-150
-100
-50
0
0 2000 4000 6000 8000 10000cl-conc (mg/l)
de
pth
(m
)
normaldistribution
measurement
10
13

21 april 2008
Cl-MIN CENTER Cl-MAX WIDTHsite depth cl-conc M cl-conc depth cl-conc cl-grad max depth cl-conc 5*S S
cm mg/l mg/l cm mg/l mg/l/dm cm mg/l cm cm2 40 300 500 190 1900 280 350 4500 300 603 38 200 960 90 5000 1800 130 9700 105 214 46 400 600 90 3300 1300 130 6100 88 185 55 500 900 140 3800 800 230 7300 170 349 116 200 300 200 750 100 280 1000 168 34
10 81 100 170 150 2200 650 210 4600 138 2811 71 300 550 190 4000 700 310 8600 238 4812 154 400 400 200 1000 170 270 1700 150 3013 203 500 500 240 2000 600 290 3300 95 1916 155 200 250 250 2100 350 350 3500 190 3821 93 200 370 130 1500 570 170 2300 75 1522 146 400 470 190 900 180 230 1200 88 1824 89 1500 1400 120 3000 900 160 4200 63 1326 70 2000 550 170 5000 550 270 7500 200 4027 54 100 700 150 3800 700 250 6800 193 39
1 600 -6 250 4007 470 24008 350 450
15 250 35017 350 50018 250 30019 350 55020 350 45023 450 600
Results: characteristics of fresh-saline interface
-400
-350
-300
-250
-200
-150
-100
-50
0
0 1000 2000 3000 4000 5000
cl-conc (mg/l)
dep
th (m
)
widthcenter
Cl-min
Cl-max
21 april 2008
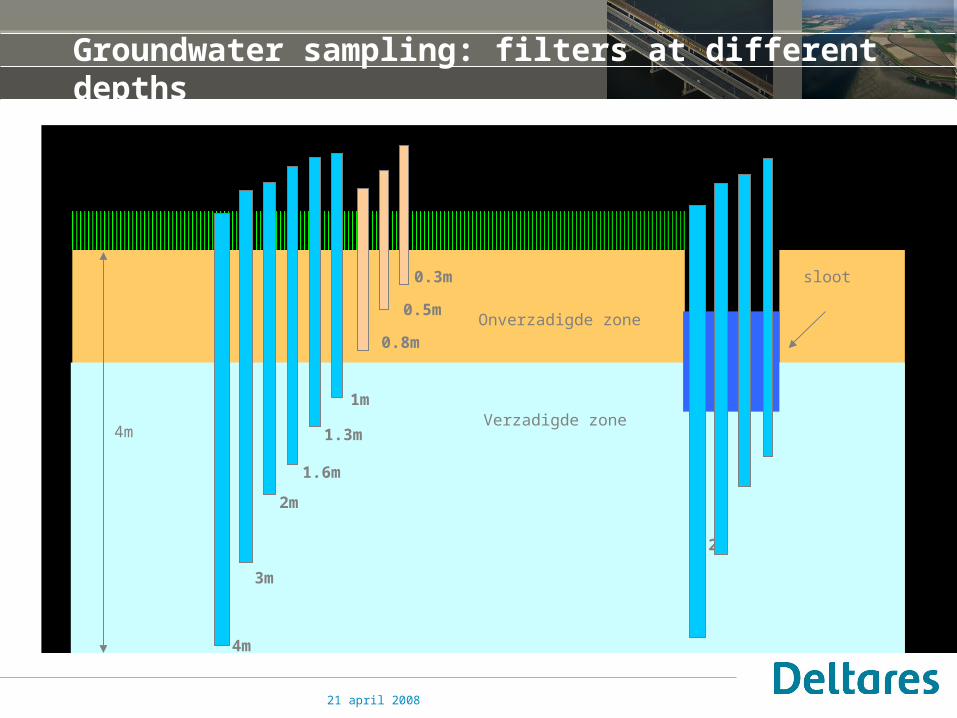
Groundwater sampling: filters at different depths
3m
1.3m
1m
1.6m
2m
0.3m
0.5m
0.8m
Verzadigde zone
Onverzadigde zone
2m
sloot
4m
4m
21 april 2008
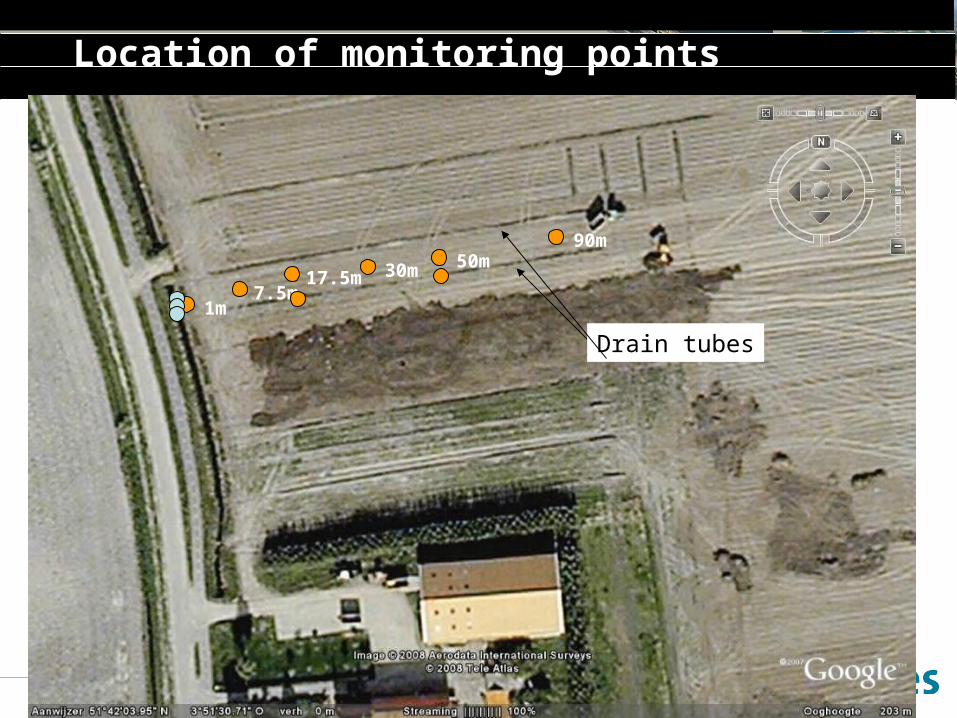
Location of monitoring points
90m50m30m17.5m
7.5m1m
Drain tubes

21 april 2008
-4.5
-4
-3.5
-3
-2.5
-2
-1.5
-1
-0.5
0
0 1000 2000 3000 4000 5000 6000 7000 8000 9000 10000
Cl-conc (mg/l)
de
pth
(m
be
low
su
rfa
ce
le
ve
l)
1m
7.5m
17.5m
border ditch
center ditch
Cl-conc in parcel and in ditch (sampling)
21 april 2008
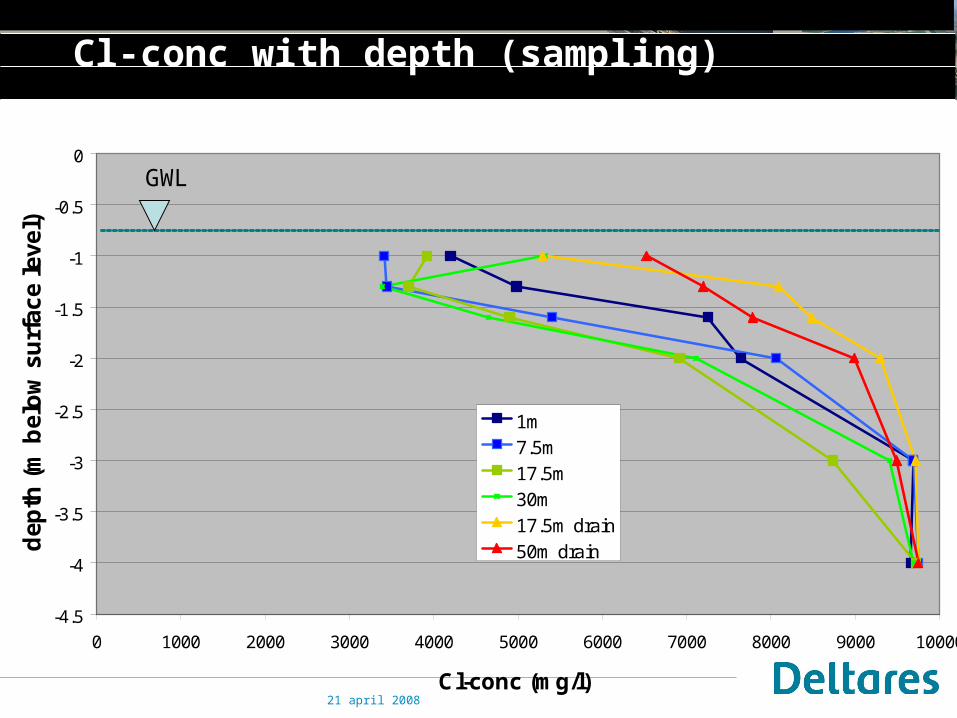
Cl-conc with depth (sampling)
-4.5
-4
-3.5
-3
-2.5
-2
-1.5
-1
-0.5
0
0 1000 2000 3000 4000 5000 6000 7000 8000 9000 10000
Cl-conc (mg/l)
dep
th (
m b
elo
w s
urf
ace
leve
l)
1m
7.5m
17.5m
30m
17.5m drain
50m drain
GWL

21 april 2008
Unsaturated zone?
-4.5
-4
-3.5
-3
-2.5
-2
-1.5
-1
-0.5
0
0 1000 2000 3000 4000 5000 6000 7000 8000 9000 10000
Cl-conc (mg/l)
dep
th (
m b
elo
w s
urf
ace
leve
l)
1m
7.5m
17.5m
30m
17.5m drain
50m drain
? ? ?

21 april 2008
Dynamics of Cl-profiles
-5
-4.5
-4
-3.5
-3
-2.5
-2
-1.5
-1
-0.5
0
0 1000 2000 3000 4000 5000 6000 7000 8000 9000 10000
Cl-conc (mg/l)
dep
th (
m b
elo
w s
urf
ace
lev
el)

21 april 2008
Dynamics of Cl-profiles
-5
-4.5
-4
-3.5
-3
-2.5
-2
-1.5
-1
-0.5
0
0 1000 2000 3000 4000 5000 6000 7000 8000 9000 10000
Cl-conc (mg/l)
dep
th (
m b
elo
w s
urf
ace
lev
el) T=1
T=2T=3
T=0

21 april 2008
Dynamics of Cl-profiles
-5
-4.5
-4
-3.5
-3
-2.5
-2
-1.5
-1
-0.5
0
0 1000 2000 3000 4000 5000 6000 7000 8000 9000 10000
Cl-conc (mg/l)
dep
th (
m b
elo
w s
urf
ace
lev
el)

21 april 2008
Conclusions monitoring results
• No sharp interface fresh rainwater-saline groundwater is found; • Mixing zone is found at shallow depth;• Characterization of mixing zone is relevant;• Statistical moments can be used for characterization interface
• At seepage sites no fresh groundwater was found (while P-ET >> seepage)• - What happens in the unsaturated zone?• - What is the dynamic of the mixing zone/cl-profile?

21 april 2008
THANK YOU
21 april 2008
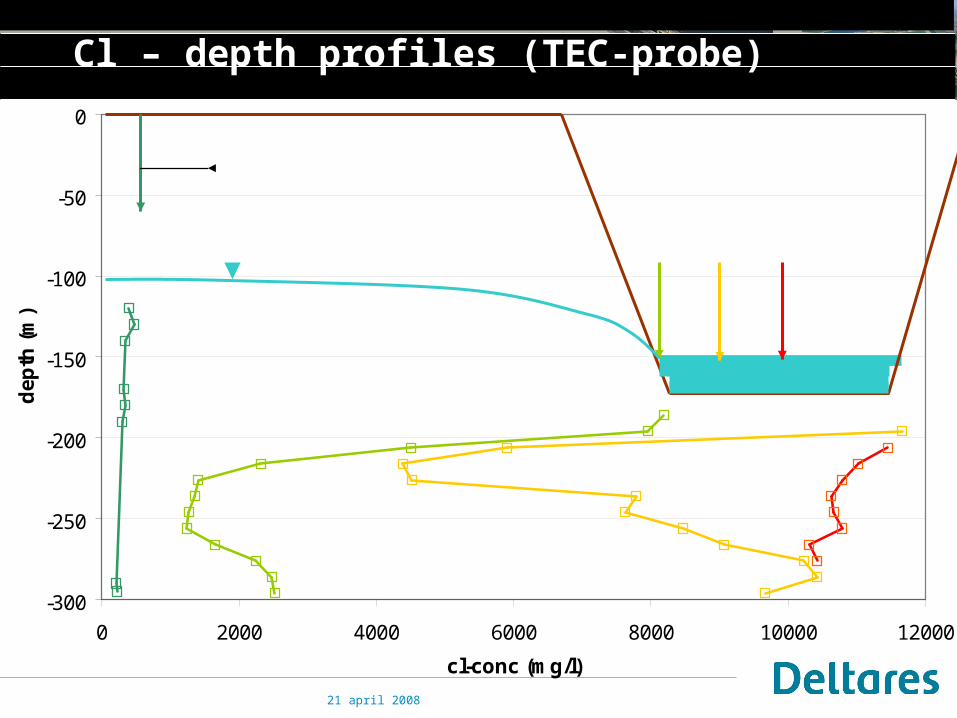
Cl – depth profiles (TEC-probe)
-300
-250
-200
-150
-100
-50
0
0 2000 4000 6000 8000 10000 12000
cl-conc (mg/l)
dep
th (
m)
Ditch
17m from ditch

21 april 2008
-300
-250
-200
-150
-100
-50
0
0 2000 4000 6000 8000 10000 12000
cl-conc (mg/l)
dep
th (
m)
Ditch
Infiltration and seepage near ditch
21 april 2008
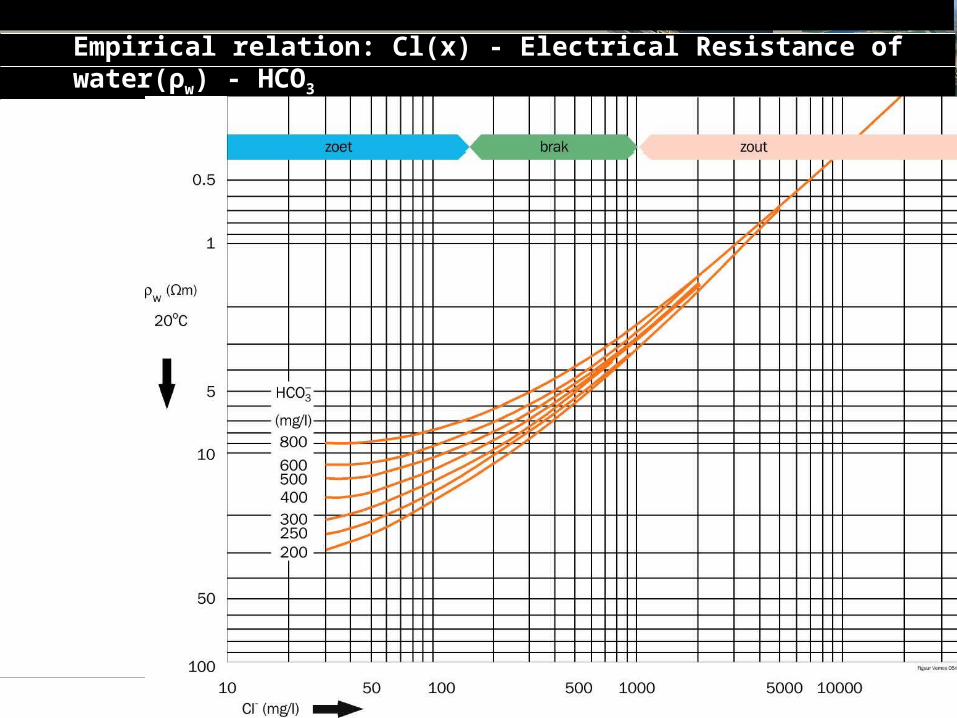
Empirical relation: Cl(x) - Electrical Resistance of water(ρw) - HCO3

21 april 2008
21 april 2008
21 april 2008
21 april 2008
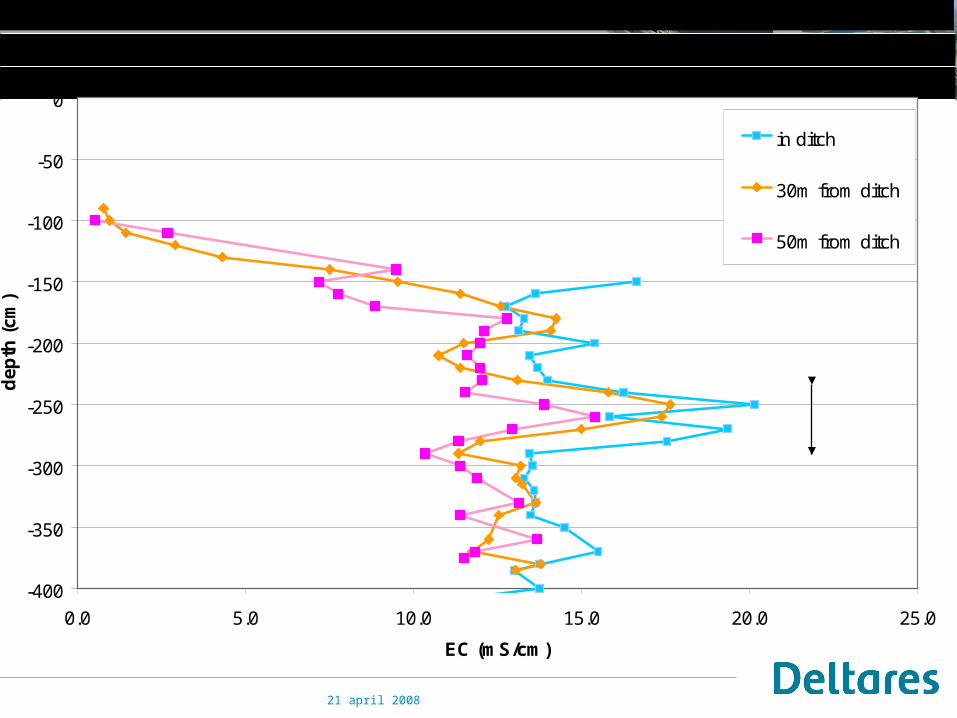
-400
-350
-300
-250
-200
-150
-100
-50
0
0.0 5.0 10.0 15.0 20.0 25.0
EC (mS/cm)
dep
th (
cm)
in ditch
30m from ditch
50m from ditch
PEAT
site 11

21 april 2008
TEC-probe measurements in parcel (red) and ditch (blue)
Dep
th (
m b
elo
w s
urf
ace)
Cl-conc (mg/l)

21 april 2008
0
0.5
1
1.5
2
2.5
3
3.5
2025 2026 2027 2028 2029 2030 2031 2032 2033 2034 2035
Time [years AD]
Th
ickn
ess o
f t
he len
s [
m]
case 1
Fresh rainwater lens on saline groundwater

21 april 2008
Cross section: groundwater systems Zeeland

21 april 2008
Composition of cover layer
clay peat
sand

21 april 2008
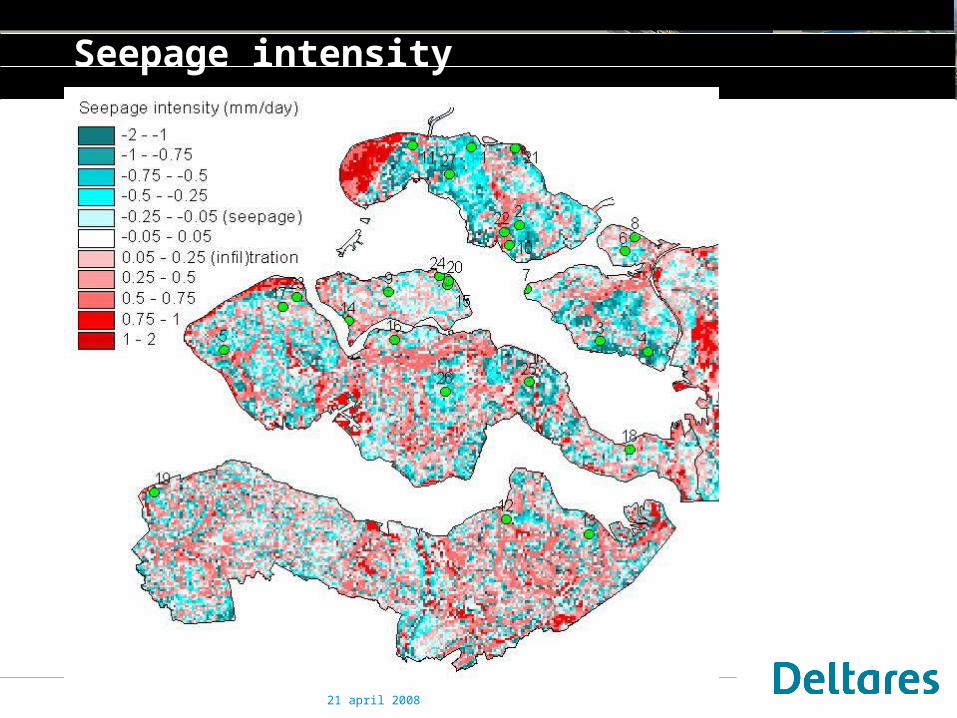
Seepage intensity: Qs=Δh/c
_
= Seepage intensity(Qs)
Δh
C
21 april 2008
Seepage intensity

21 april 2008
CVES
G eo-elektrische m eetapparaat
4 kabels m et ieder 21 e lektrodes
160 m
40 m
Principal Continuous Vertical Electrical Sounding (CVES)Principal Continuous Vertical Electrical Sounding (CVES)>80 electrodes at surface2D elektrical resistance in subsoilMaximum depth (~30 m)

21 april 2008
Compensation for soil type: Formation factor FF
ECw = FF * ECa
Soil type
FF
peat 1-1.5
clay 1.5-3.5
silt 2-3.5
sand 3.5-5
ECa = EC of water and soilECw = EC of water
Clay% Stan. Err. p-value m (=FF) FF dev.st. FF var. FF mean
Sand <20 3.94 < 2.2e-16 3.24 0.430 0.185 3.285
Clay >20 3.19 < 2.2e-16 2.08 0.404 0.163 1.987

21 april 2008
Correlation:Char. rainwater lens - factors
75
100
125
150
175
200
225
250
275
-0.60 -0.40 -0.20 0.00 0.20 0.40 0.60 0.80 1.00 1.20 1.40 1.60
seepage intensity (mm/d)
DE
PT
H o
f c
en
ter
of
mix
ing
zo
ne
(m
be
low
su
rf.
l) seepageinfiltrationR^2=0.41
Dep
th c
ente
r of
mix
ing
zone
(cm
be
low
sur
afec
)Seepage intensity (mm/d)
0
2000
4000
6000
8000
10000
12000
-150 -100 -50 0 50 100 150
surface level (cm above sea level)
ma
xim
um C
L-C
ON
C (
mg
/l)
R^2=0.76
Max
. C
l-con
c (m
g/l)
Surface Level (cm relative to sea level)

21 april 2008
Site 11
-2.5
-2.0
-1.5
-1.0
-0.5
0.0
0.5
1.0
1.5
2.0
-25 0 25 50 75 100 125 150 175 200 225 250 275 300distance (m)
Re
lati
ve
he
igh
t (m
)
11.3
11.6
11.411.5 11.7
cl= 5000 mg/l
cl= 2500 mg/l
cl= 1000 mg/l
cl= 500 mg/lditc
h
ditc
h

21 april 2008
Lithostratigraphy of Holocene cover layer
Lithostratigraphy (Formation) Layer Facies/ Lithology
Naaldwijk Schoorl Eolian sand (dunes)
Zandvoort Marine sand (beach)
Walcheren Tidal flats and creeks
Wormer Tidal flats and creeks
Nieuwkoop Hollandveen Marsh (peat)
Basisveen Marsh (peat)
First aquifer
Hol. cover layer

21 april 2008
Creek (sand) and reclaimed salt marches (clay-peat)