Embed Size (px)
Citation preview
Characterization of damage mechanisms in glass fibre reinforced polymers
using X-ray computed tomography
D. SALABERGER1, M.ARIKAN
1, T. PAIER
2, T., J. KASTNER
1*
1University of Applied Sciences Upper Austria, Wels Campus, Stelzhamerstrasse 23, 4600 Wels, Austria
2Zizala Lichtsysteme GmbH, Scheibbser Str. 17, 3250 Wieselburg, Austria
Abstract
A laboratory X-ray computed tomography (CT) device with cone beam geometry and an in-situ tensile test stage
was used for the quantitative 3D characterization of damage mechanisms in short glass fibre reinforced
polymers. Test specimen geometry was developed that allows for high resolution and tensile testing within the
CT device. Interrupted in-situ tensile tests on specimens with perpendicular main fibre orientations were
performed. Fibre orientation and damage mechanisms were analysed on single fibre basis using CT data analysis
tools. Damage mechanisms that were identified are fibre pull-out, fibre fracture, detachment and matrix cracks.
Depending on the main fibre orientation pull-out or detachment is predominant. The determined fibre
orientations for different regions showed a correlation to the region of final fracture.
Keywords: Short fibre reinforced polymers, fibre orientation, damage characterization.
1. Introduction
Mechanical properties of injection molded filled polymeric materials are mainly influenced by
filler content and filler arrangement [1]. For fibers, orientation and length distribution are the
most important factors. Both are determined by the production procedure as well as by the
kind of material and fiber content. Due to inhomogeneous solidification within the mold,
different fiber orientations develop across the walls. Fiber orientation is also influenced by the
geometry of the component. To be able to produce fail safe components, knowledge about
fiber orientation in the final components is necessary [1, 2, 3]. Simulation tools for injection
molding are available and work well for simple geometries. At positions with high shear rates
or turbulences the prediction of orientation is difficult and the accordance of simulation with
reality is sometimes limited [4].
Measurement of fiber orientation is standardly done by grinding and optical measuring of the
elliptical shape of the fibers. This is destructive and time consuming and usually only a small
volume can be analyzed. A powerful tool to determine fiber orientation and length
distribution is X-ray computed tomography (CT) [5, 6]. Parts of a specimen can be analyzed
non- destructively and three dimensionally. Laboratory CT systems are available that allow
for reasonable high resolution to characterize single fibers. Using commercially available
software tools it is possible to determine fiber orientation on voxel level. More effort has to be
made for the characterization of single fibers and to determine the fibre length accurately [7].
Another advantage of XCT compared to optical methods is the very good statistics. One
analysis can contain several 100.000 fibers while optical analysis is usually done for a few
hundred fibers.
In this study both quantitative as well as qualitative analysis is performed on high resolution
CT-data of in-situ tensile tested glass fibre reinforced polymers. For quantitative analysis of
damage mechanisms no automatic tool was available which made visual analysis necessary [9].
11th European Conference on Non-Destructive Testing (ECNDT 2014), October 6-10, 2014, Prague, Czech RepublicM
ore
Info
at O
pen
Acc
ess
Dat
abas
e w
ww
.ndt
.net
/?id
=16
410
2. Materials & Methods
2.1 Materials
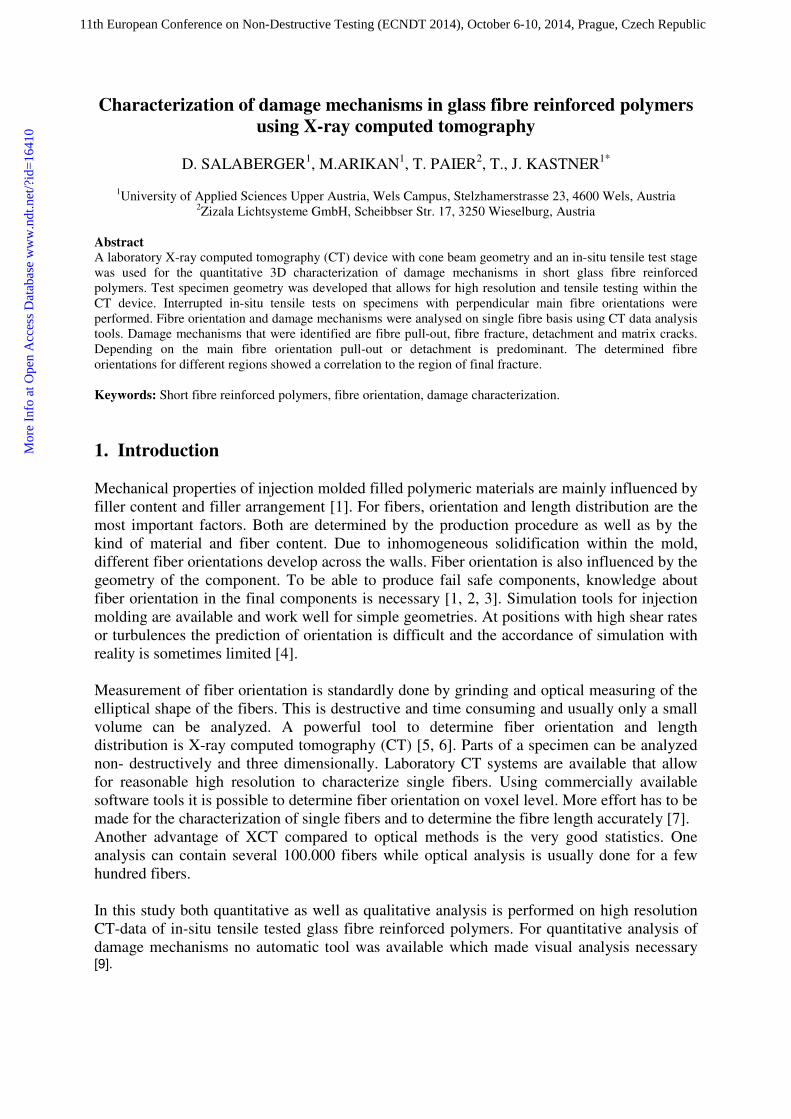
As model material system polypropylene filled with 30 weight % glass fibers (PP-GF30) was
tested. The nominal mean fiber diameter was 12 µm. From a sheet that was produced by
injection molding by the industrial partner Zizala, small test specimens were milled. An inset
ensured that a highly oriented meld flow developed. This led to a high degree of orientation
for defined regions. Figure 1 shows the geometry and the positions where the specimens were
milled. Main fiber orientations of 0 ° and 90 ° could be realized by this approach. 0° implies
fiber orientations in tensile direction.
Figure 1. Sketch of the injection molded sheet with regions where test specimens were milled out of the sheet
(left), miniaturized tensile test specimen geometry with position of three regions for data analysis (center,
dimensions in mm). The sheet thickness was 2.5 mm. On the right picture a the in-situ tensile/compression stage
mounted on the turntable of the Nanotom-CT device is shown.
2.2 CT Scans and interrupted tensile tests
The XCT scans were performed at a laboratory system Nanotom 180 NF (GE Phoenix|x-ray,
Wunstorf, Germany). Since a matrix detector (Hamamatsu 2300 x 2300 pixels) was used, the
system works in cone beam geometry. Together with the fact that the specimen has to be
projected completely onto the detector in horizontal direction the consequence is that the
resolution is depending on the size of the specimen.
To be able to scan a bigger volume containing 6 specimens, the resolution was reduced to 5
µm voxel edge length. One single specimen was scanned at a resolution of 2 µm voxel edge
length, mounted on the tensile testing device. The in situ tensile test stage is mounted on
turntable of the Nanotom-CT as it shown on the left picture of Figure 1.
The scan parameters are listed in Table1. The source parameters voltage (V), current (I) and
Mode were optimized for the material system to achieve optimal contrast and resolution.
Mode 0 means that the focal spot of the X-ray tube was depending on the tube power. The
readout time for one image at the detector was set to Tint. To reduce noise and motion artifacts
6 images at each angular position were read out with the first image to be skipped and the
other 5 images to be averaged and saved to disc. ZD denotes to the distance between source
and detector.
Table 1. CT scan parameters
V
[kV]
I
[µA]
Tint
[ms]
Projections Scantime
[min]
Voxel-
size
[µm]
Target Mode Average Skip ZD
[mm]
80 200 500 1700 88 5 Molybdenum 0 5 1 330
80 130 1200 1900 230 2 Molybdenum 0 5 1 400
Within the XCT device a tensile testing device was mounted onto the rotation table. The
maximal load that can be applied is 500 N. The tensile tests were performed at a movement
speed of 0.2 mm/min. After mounting the specimen between the clamps without applying any
load, the first XCT scan was performed to document the initial condition of the specimen.
Three additional XCT scans were performed after increasing the load. The load levels were
determined by applying tensile tests until break outside the XCT device. Since the material
behavior is brittle and detectible damage occurs only shortly before break the levels were
chosen such as 90 % and 95 % of tensile strength. The final scan was performed after break
and after a time delay to reduce remaining relaxation movements within the specimen.
The maximum load for 0° specimens was approx. 400 N and for 90° specimens 190 N.
2.3 3D data analysis
For the determination of fiber orientation an in house software-development was used that
allows for the characterization of every single fiber [7]. The approach uses the information of
local orientation and the fact that the gray value in the center of the fiber is a maximum to
extract the medial axes. After thinning the lines of voxel describe fiber segments which can be
connected. To split up the connections into single fibers, local angles and angles between
segments are analyzed. The final result is the start and endpoint of each fiber. For predefined
sub-volumes the second order orientation tensor was calculated. The diagonal elements of the
tensor are indicated as a11, a22 and a33. The degree of orientation OD can be calculated by
analyzing eigenvalues λn of the orientation tensor according to equation (1).
(1)
The parallel length of the miniaturized tensile test specimen was divided into three regions as
shown in Figure 1 along the Z-axis. Each region was analyzed separately and orientation
tensor and degree of orientation were calculated. Along the X-axis, which corresponds to the
thickness of the sheet, each region was divided into 20 sub-regions to show the variation of
orientation over sheet thickness.
Damage was analyzed qualitatively by visual inspection of slice images in initial state and
after fracture.
3. Results
3.1 Fiber characterization
The chosen regions that were cut out of the sheet were pre-characterized by CT scans with
lower resolution of 5 µm voxel edge length. These results were used to select specimens with
best homogeneity with respect to fiber orientation.
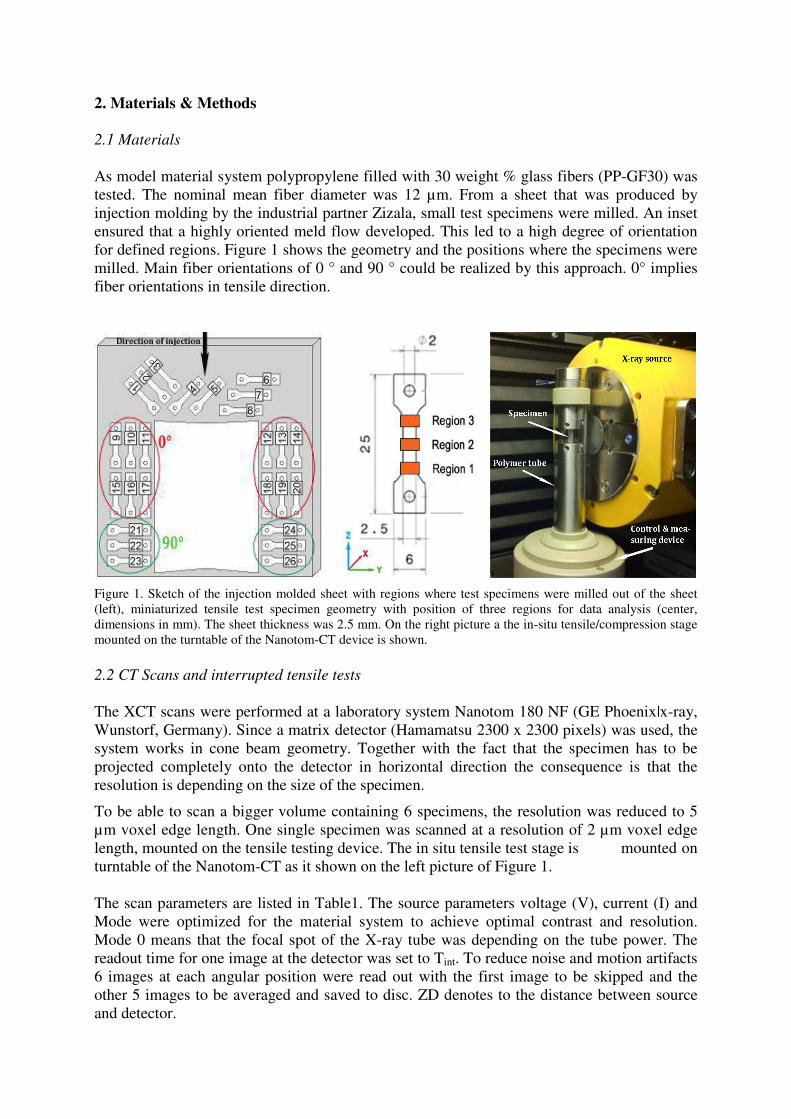
Three specimens for each orientation were analyzed. The tensor elements with highest values
are shown in Figure 2.
Figure 2. Orientation tensor elements for each of the 3 regions for 3 specimens at the same sheet position; 0°
(left) and 90° (right)
The following results were realized for specimen number 11 (0° orientation) and number 24
(90° orientation). The specimen numbers are shown in Figure 1.
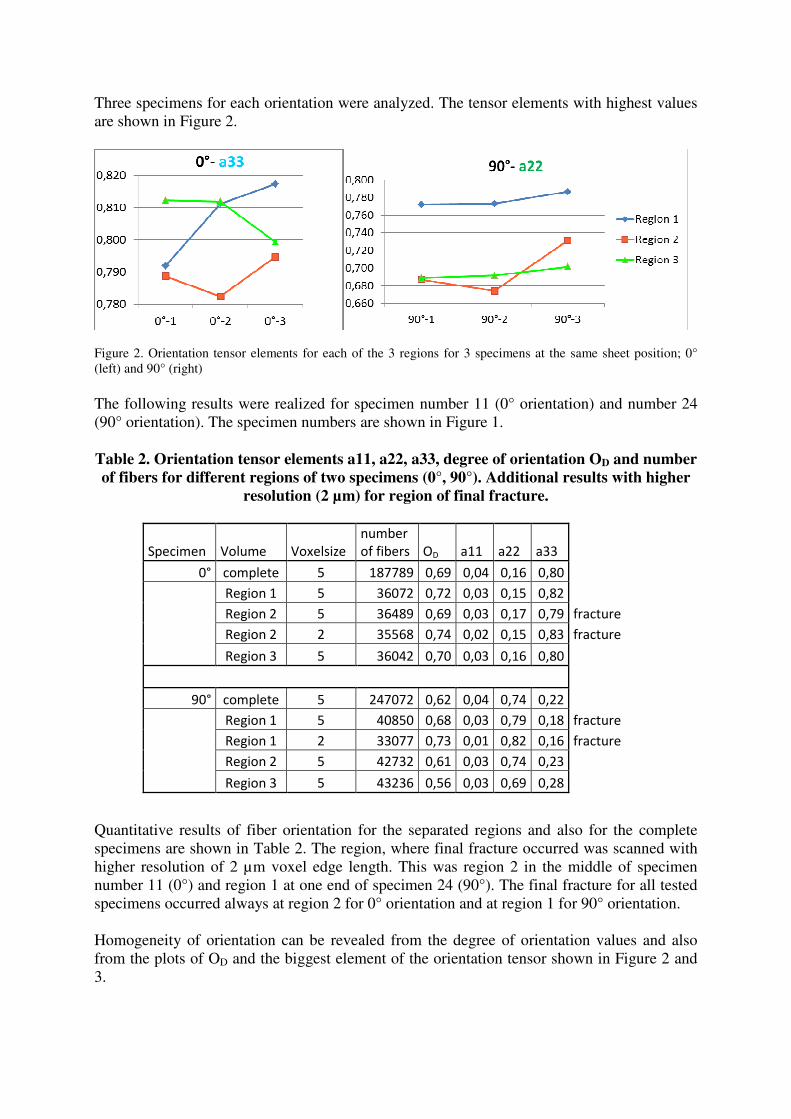
Table 2. Orientation tensor elements a11, a22, a33, degree of orientation OD and number
of fibers for different regions of two specimens (0°, 90°). Additional results with higher
resolution (2 µm) for region of final fracture.
Specimen Volume Voxelsize
number
of fibers OD a11 a22 a33
0° complete 5 187789 0,69 0,04 0,16 0,80
Region 1 5 36072 0,72 0,03 0,15 0,82
Region 2 5 36489 0,69 0,03 0,17 0,79 fracture
Region 2 2 35568 0,74 0,02 0,15 0,83 fracture
Region 3 5 36042 0,70 0,03 0,16 0,80
90° complete 5 247072 0,62 0,04 0,74 0,22
Region 1 5 40850 0,68 0,03 0,79 0,18 fracture
Region 1 2 33077 0,73 0,01 0,82 0,16 fracture
Region 2 5 42732 0,61 0,03 0,74 0,23
Region 3 5 43236 0,56 0,03 0,69 0,28
Quantitative results of fiber orientation for the separated regions and also for the complete
specimens are shown in Table 2. The region, where final fracture occurred was scanned with
higher resolution of 2 µm voxel edge length. This was region 2 in the middle of specimen
number 11 (0°) and region 1 at one end of specimen 24 (90°). The final fracture for all tested
specimens occurred always at region 2 for 0° orientation and at region 1 for 90° orientation.
Homogeneity of orientation can be revealed from the degree of orientation values and also
from the plots of OD and the biggest element of the orientation tensor shown in Figure 2 and
3.
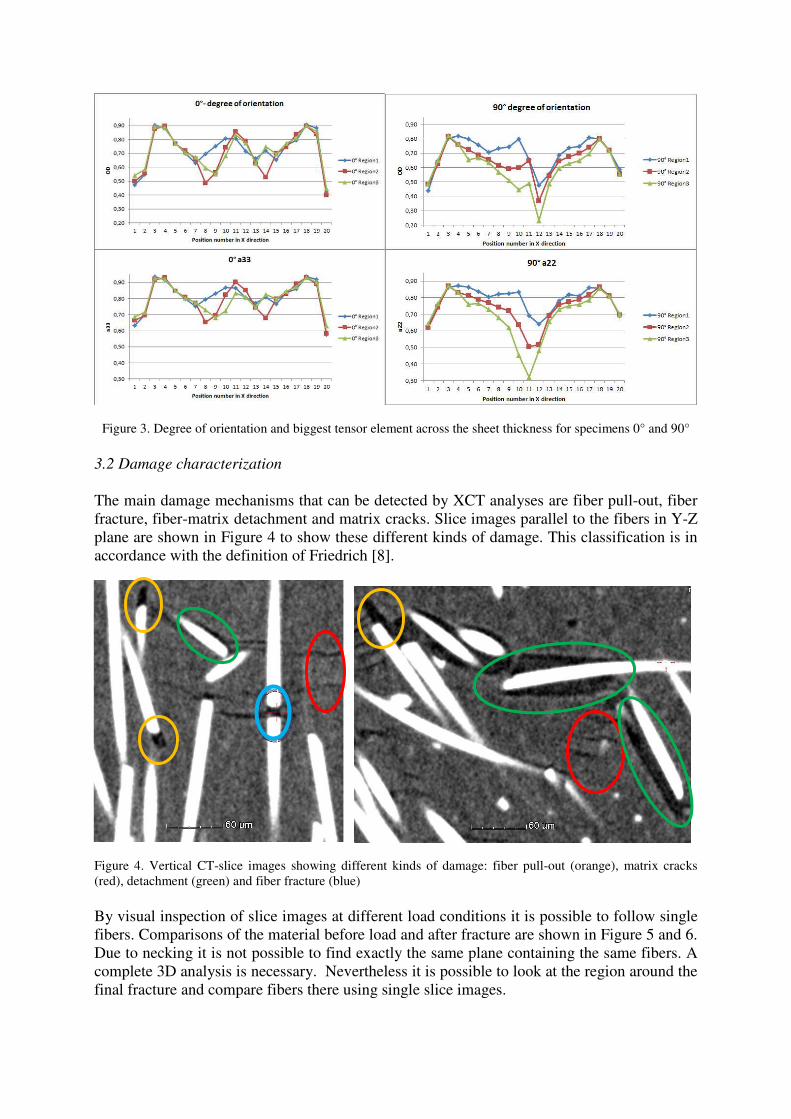
Figure 3. Degree of orientation and biggest tensor element across the sheet thickness for specimens 0° and 90°
3.2 Damage characterization
The main damage mechanisms that can be detected by XCT analyses are fiber pull-out, fiber
fracture, fiber-matrix detachment and matrix cracks. Slice images parallel to the fibers in Y-Z
plane are shown in Figure 4 to show these different kinds of damage. This classification is in
accordance with the definition of Friedrich [8].
Figure 4. Vertical CT-slice images showing different kinds of damage: fiber pull-out (orange), matrix cracks
(red), detachment (green) and fiber fracture (blue)
By visual inspection of slice images at different load conditions it is possible to follow single
fibers. Comparisons of the material before load and after fracture are shown in Figure 5 and 6.
Due to necking it is not possible to find exactly the same plane containing the same fibers. A
complete 3D analysis is necessary. Nevertheless it is possible to look at the region around the
final fracture and compare fibers there using single slice images.
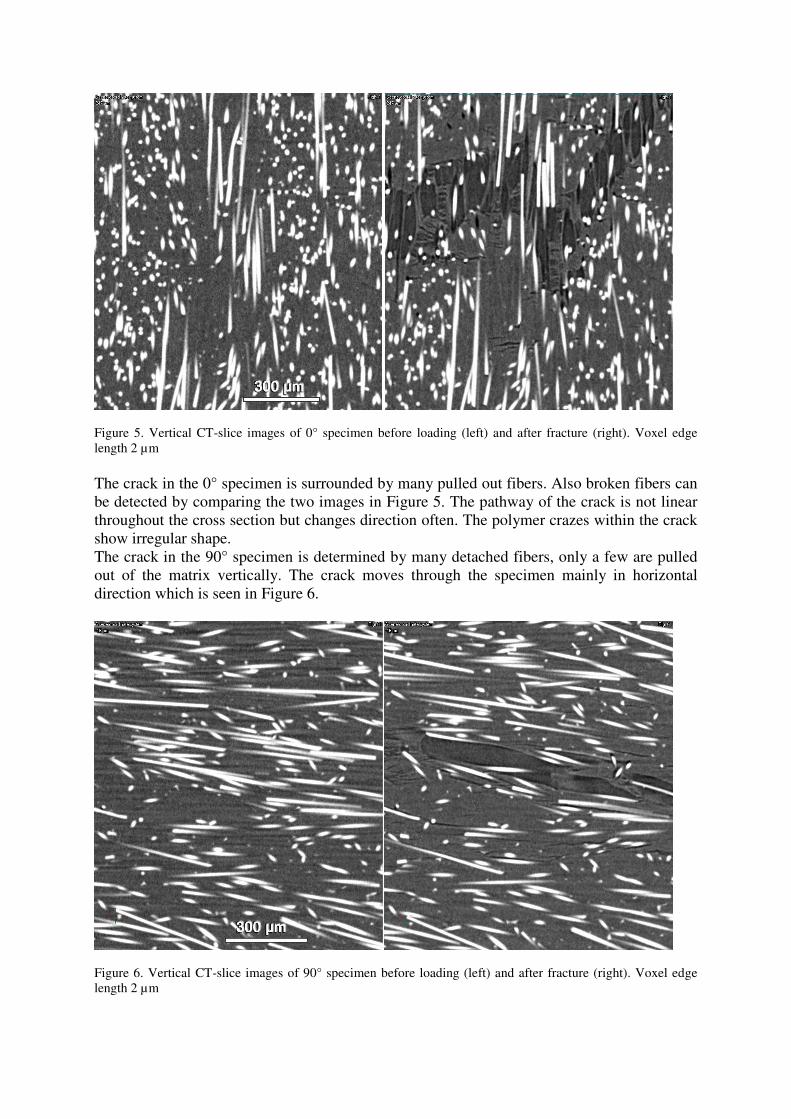
Figure 5. Vertical CT-slice images of 0° specimen before loading (left) and after fracture (right). Voxel edge
length 2 µm
The crack in the 0° specimen is surrounded by many pulled out fibers. Also broken fibers can
be detected by comparing the two images in Figure 5. The pathway of the crack is not linear
throughout the cross section but changes direction often. The polymer crazes within the crack
show irregular shape.
The crack in the 90° specimen is determined by many detached fibers, only a few are pulled
out of the matrix vertically. The crack moves through the specimen mainly in horizontal
direction which is seen in Figure 6.
Figure 6. Vertical CT-slice images of 90° specimen before loading (left) and after fracture (right). Voxel edge
length 2 µm
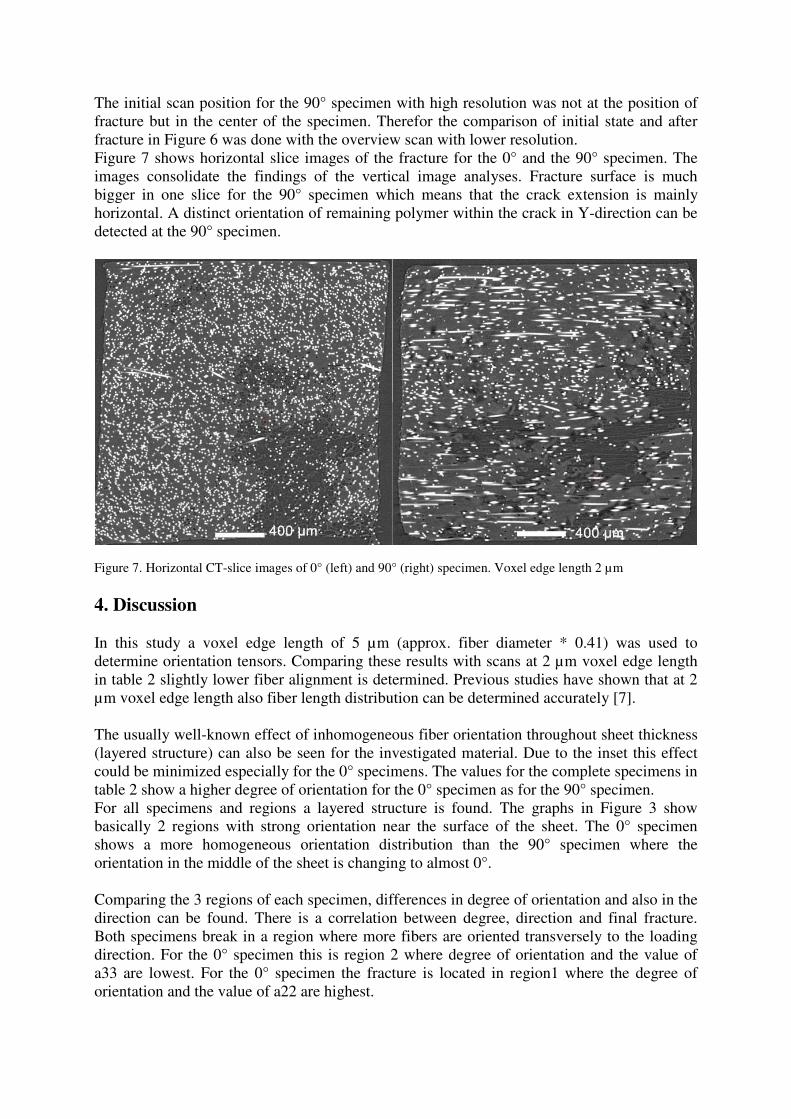
The initial scan position for the 90° specimen with high resolution was not at the position of
fracture but in the center of the specimen. Therefor the comparison of initial state and after
fracture in Figure 6 was done with the overview scan with lower resolution.
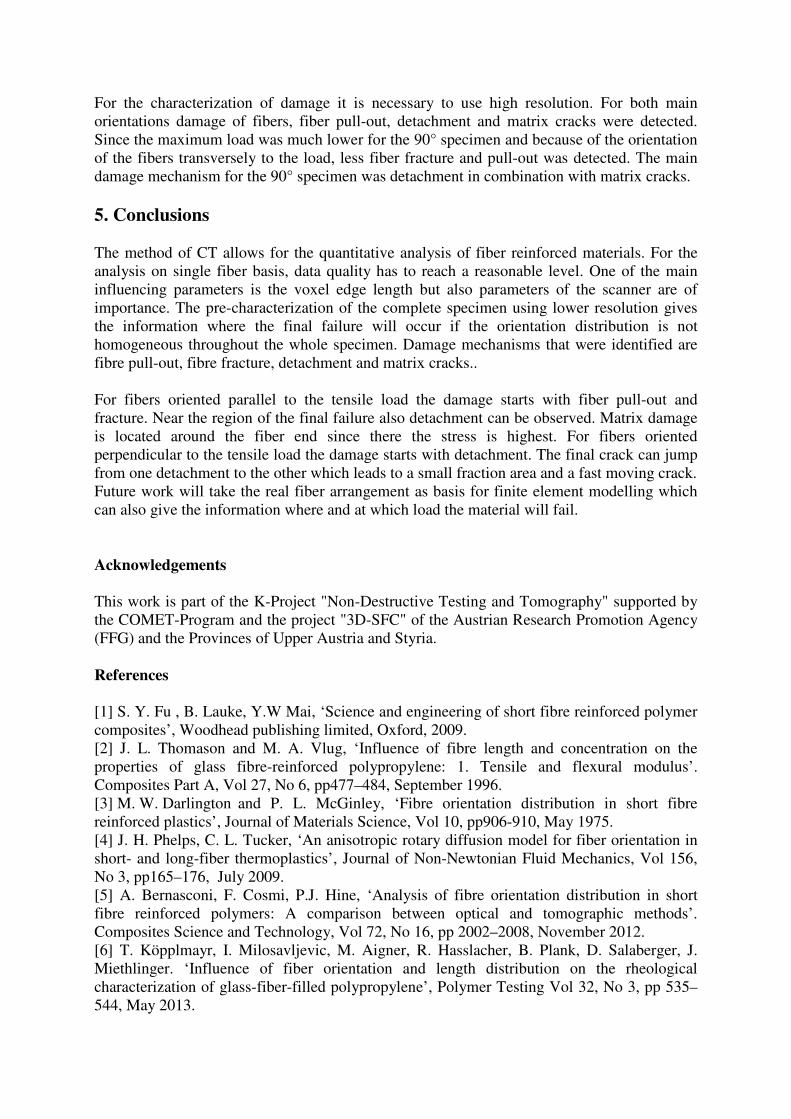
Figure 7 shows horizontal slice images of the fracture for the 0° and the 90° specimen. The
images consolidate the findings of the vertical image analyses. Fracture surface is much
bigger in one slice for the 90° specimen which means that the crack extension is mainly
horizontal. A distinct orientation of remaining polymer within the crack in Y-direction can be
detected at the 90° specimen.
Figure 7. Horizontal CT-slice images of 0° (left) and 90° (right) specimen. Voxel edge length 2 µm
4. Discussion
In this study a voxel edge length of 5 µm (approx. fiber diameter * 0.41) was used to
determine orientation tensors. Comparing these results with scans at 2 µm voxel edge length
in table 2 slightly lower fiber alignment is determined. Previous studies have shown that at 2
µm voxel edge length also fiber length distribution can be determined accurately [7].
The usually well-known effect of inhomogeneous fiber orientation throughout sheet thickness
(layered structure) can also be seen for the investigated material. Due to the inset this effect
could be minimized especially for the 0° specimens. The values for the complete specimens in
table 2 show a higher degree of orientation for the 0° specimen as for the 90° specimen.
For all specimens and regions a layered structure is found. The graphs in Figure 3 show
basically 2 regions with strong orientation near the surface of the sheet. The 0° specimen
shows a more homogeneous orientation distribution than the 90° specimen where the
orientation in the middle of the sheet is changing to almost 0°.
Comparing the 3 regions of each specimen, differences in degree of orientation and also in the
direction can be found. There is a correlation between degree, direction and final fracture.
Both specimens break in a region where more fibers are oriented transversely to the loading
direction. For the 0° specimen this is region 2 where degree of orientation and the value of
a33 are lowest. For the 0° specimen the fracture is located in region1 where the degree of
orientation and the value of a22 are highest.
For the characterization of damage it is necessary to use high resolution. For both main
orientations damage of fibers, fiber pull-out, detachment and matrix cracks were detected.
Since the maximum load was much lower for the 90° specimen and because of the orientation
of the fibers transversely to the load, less fiber fracture and pull-out was detected. The main
damage mechanism for the 90° specimen was detachment in combination with matrix cracks.
5. Conclusions
The method of CT allows for the quantitative analysis of fiber reinforced materials. For the
analysis on single fiber basis, data quality has to reach a reasonable level. One of the main
influencing parameters is the voxel edge length but also parameters of the scanner are of
importance. The pre-characterization of the complete specimen using lower resolution gives
the information where the final failure will occur if the orientation distribution is not
homogeneous throughout the whole specimen. Damage mechanisms that were identified are
fibre pull-out, fibre fracture, detachment and matrix cracks..
For fibers oriented parallel to the tensile load the damage starts with fiber pull-out and
fracture. Near the region of the final failure also detachment can be observed. Matrix damage
is located around the fiber end since there the stress is highest. For fibers oriented
perpendicular to the tensile load the damage starts with detachment. The final crack can jump
from one detachment to the other which leads to a small fraction area and a fast moving crack.
Future work will take the real fiber arrangement as basis for finite element modelling which
can also give the information where and at which load the material will fail.
Acknowledgements
This work is part of the K-Project "Non-Destructive Testing and Tomography" supported by
the COMET-Program and the project "3D-SFC" of the Austrian Research Promotion Agency
(FFG) and the Provinces of Upper Austria and Styria.
References
[1] S. Y. Fu , B. Lauke, Y.W Mai, ‘Science and engineering of short fibre reinforced polymer
composites’, Woodhead publishing limited, Oxford, 2009.
[2] J. L. Thomason and M. A. Vlug, ‘Influence of fibre length and concentration on the
properties of glass fibre-reinforced polypropylene: 1. Tensile and flexural modulus’.
Composites Part A, Vol 27, No 6, pp477–484, September 1996.
[3] M. W. Darlington and P. L. McGinley, ‘Fibre orientation distribution in short fibre
reinforced plastics’, Journal of Materials Science, Vol 10, pp906-910, May 1975.
[4] J. H. Phelps, C. L. Tucker, ‘An anisotropic rotary diffusion model for fiber orientation in
short- and long-fiber thermoplastics’, Journal of Non-Newtonian Fluid Mechanics, Vol 156,
No 3, pp165–176, July 2009.
[5] A. Bernasconi, F. Cosmi, P.J. Hine, ‘Analysis of fibre orientation distribution in short
fibre reinforced polymers: A comparison between optical and tomographic methods’.
Composites Science and Technology, Vol 72, No 16, pp 2002–2008, November 2012.
[6] T. Köpplmayr, I. Milosavljevic, M. Aigner, R. Hasslacher, B. Plank, D. Salaberger, J.
Miethlinger. ‘Influence of fiber orientation and length distribution on the rheological
characterization of glass-fiber-filled polypropylene’, Polymer Testing Vol 32, No 3, pp 535–
544, May 2013.

[7] D. Salaberger, K. A. Kannappan, J. Kastner, J. Reussner, and T. Auinger, ‘Evaluation of
Computed Tomography Data from Fibre Reinforced Polymers to Determine Fibre Length
Distribution’, International Polymer Processing Vol 27, No 3, pp 283-291, July 2011.
[8] K. Friedrich, ‘Fractographic analysis of polymer composites’, in Application of fracture
mechanics to composite material, Vol 6, Elsevier, 1989.
[9] D. Salaberger, et al.: Characterization of damage mechanisms in glass fibre reinforced
polymers using X-ray computed tomography, Proceedings ECCM16, 23.6.-26.6.2014,
Sevilla, Spain


![SES Refinery Damage Mechanisms Symposium AUG2004[1]](https://img.pdfslide.us/doc/110x75/5571fc48497959916996e6eb/ses-refinery-damage-mechanisms-symposium-aug20041.jpg)