Embed Size (px)
Citation preview

12
Characterization of a Spray in the Combustion Chamber of a Low Emission Gas Turbine
Georges Descombes Laboratoire de génie des procédés pour l’environnement, l’énergie et la santé
France
1. Introduction
The use of a turbo-alternator in Lean Premixed Prevaporized combustion (LPP) for hybrid vehicles is beneficial in reducing pollutant emissions at the nominal operating point. The electric thermal hybrid demonstrator studied here consists of a low-emission gas turbine and an alternator which provides the electric power to an electric propulsion motor and a storage battery. The combustion chamber of the gas turbine is adapted to the nominal operating point so as to function in pre-vaporized combustion, premixed and lean mixtures. A problematic point, however, is the emission of smoke and unburnt hydrocarbons during start-up because the geometry of the combustion chamber is not adapted to moderate air flows. In the transitional stages of start, an air-assisted pilot injector vaporizes the fuel in the combustion chamber. The jet is ignited by a spark, the alternator being used as an electric starter. This starting phase causes, however, the formation of a fuel film on the walls which can be observed as locally rich pockets.
1 2 3 4 5 6
Exchanger Fuel Ignition Turbine Compressor Alternator
Fig. 1. Diagram of the turbo alternator
www.intechopen.com

Advances in Gas Turbine Technology
268
2. The turbo alternator
The turbo alternator has a single-shaft architecture on which the wheels of the compressor and turbine, as well as the high speed alternator, are fixed. The turbine is a single-stage compression/expansion, radial machine with a heat exchanger, as shown in Figure 1. At the nominal operating point, the supercharging air is preheated upstream of the combustion chamber by recovering heat from exhaust gases, thus improving the output of the cycle while decreasing the compression ratio. The exchanger consists of a ceramic heat storage matrix rotated around its axis by a hydraulic engine. The turbo-alternator delivers an electric output of 38 kW at full load at 90000 rpm. The acceptance tests provide the cartography of the stabilized performance of the turbo-alternator from the turbine inlet temperature and the number of revolutions. The power and the output increase naturally with the temperature, and the optimal operating range is between 70000 and 85000 rpm; the temperature is between 975°C and 1025°C.
3. The combustion chamber
The Lean Premixed Pre-vaporized (LPP) combustion chamber is divided into three zones (Figure 2). First of all, the fuel is injected and vaporized in a flow of hot air with which it mixes. In this zone, complete evaporation and a homogeneous mixture must be achieved before the reaction zone preferably just above the low extinction limit in order to limit the formation of NOx emissions (Leonard and Stegmaïer, 1993, Ripplinger et al., 1998). The flame is then stabilized with the creation of re-circulation zones, and combustion proceeds with a maximum flame temperature generally lower than 2000K (Poeschl et al., 1994, Ohkubo et al., 1994). The third area is the dilution zone which lowers the temperature below the threshold imposed by the temperature limit of the turbine blades (Turrell et al., 2004).
1 2 3 4 5 6 7
Pilot injector
Main injectors
Lean mixture
Lean combustion
Dilution zone
Pilot flame Mixture
pipe
Fig. 2. Diagram of the LPP combustion chamber
The geometry of this combustion chamber is optimised for nominal operation. As modification of the aero-thermodynamic characteristics of the air flow at partial load and at start-up is not conducive to flame stability (Schmidt, 1995), a pilot injector is therefore used; this also serves as a two-phase flame whose fuel spray does not burn in premixed flame.
www.intechopen.com

Characterization of a Spray in the Combustion Chamber of a Low Emission Gas Turbine
269
4. The pilot injector
During the starting phase, the low compression ratio and thermal inertia of the exchanger means that the inlet air cannot be preheated, making LPP operation impossible. The main injectors do not intervene during this phase and are used only when a temperature above 800°C is reached at the turbine inlet. A pilot injector is used to vaporize the fuel during start-up. The jet is ignited by the spark and a turbulent two-phase flame ensures the temperature increase of the machine. Additional fuel is also provided by the pilot injector to stabilize the flame in weak combustion modes and at low power. The coaxial injector is characterized by a central fuel jet surrounded by a peripheral high-
speed gas flow. The system provides the injector with predetermined and adjustable
quantities of liquid fuel and air flow. It is composed of two parts, an air-assisted circuit and
a pressurized fuel circuit.
It is observed that the maximum fuel flow, which is about 8 kg/h of fuel for a pressure of 12
bar, remains insufficient to obtain correct vaporization of the fuel. A complementary air-
assisted circuit is therefore necessary to interact with the fuel swirl of the pilot injector
where atomisation begins. Fuel atomisation is intensified by the counter-rotating movement
of the two fluids (Figure 3).
Fig. 3. Formation of the fuel-air mixture
The tests carried out in the laboratory on a turbo-alternator test bench also showed the need
for a variable air flow in the pilot injector because the fuel jet of the pilot injector does not
always ignite correctly. When a significant increase in temperature is detected in the
exhaust, smoke is emitted and its concentration varies significantly depending on the
injection parameters . The evolution of the air flow acts directly on the ignition timing and
the temperature, as shown by the curves on figure 4.
The ignition timing increases with the increase in the air pressure and the temperature
increases more rapidly when the air pressure rises. It is observed that smoke appears
approximately thirty seconds after the start-up of the turbine, but vanishes more quickly
when the air pressure is higher. Increasing the temperature velocity setting of the turbine
made it possible to optimise the burnt fuel fraction and to reduce smoke emissions
(Pichouron, 2001).
www.intechopen.com

Advances in Gas Turbine Technology
270
TiT (°C) Speed (rpm)
0
100
200
300
400
500
600
700
800
900
0 20 40 60 80 100 120 Tim e (s)
0
10000
20000
30000
40000
50000
60000
TIT (P=0.4 bar) TIT (P=0.5 bar) TIT (P=0,25 bar)
TIT (P=0,6 bar) Speed (
Fig. 4. Evolution of the turbine inlet temperature (TiT) and turbine speed (rpm) at start up of the gas turbine as a function of time and air pressure
5. Experimental study of the non-reactive jet
The preliminary start tests and the analytical study revealed the existence of a correlation
between the ignition and the combustion of a fuel spray as a function of its physical
characteristics (Pichouron, 2001). The vaporization dynamics of the pilot injector were first
studied in the starting phase. The influence of the injection parameters were controlled as
was the quality of the jet in terms of drop size, law of distribution as well as jet angle and
mass fuel distribution. This cartography aimed to define the optimised operating points as
well as the boundary conditions which were then used in the numerical study of the jet.
The air flow of the pilot injector significantly modifies the structure of the jet which is
characterized by the spray angle, the fragmentation length, the size distribution of the
droplets inside the spray and the penetration. Photographs of the jet taken on the injection
bench in the laboratory show the effect of the air flow on the structure of the jet (Figure 5).
(a) without air flow (b) with an air flow of 10 l/min
Fig. 5. Cartography of the spray (liquid flow: 7.3 kg/h)
Inle
t te
mp
erat
ure
tu
rbin
e (°
C)
Sp
eed
tu
rbin
e (r
pm
)
www.intechopen.com
Characterization of a Spray in the Combustion Chamber of a Low Emission Gas Turbine
271
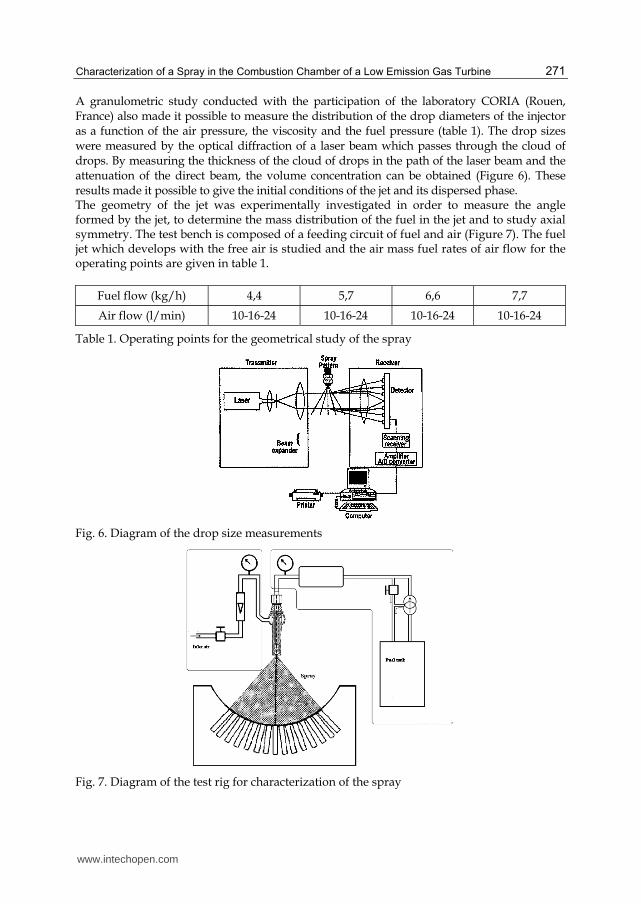
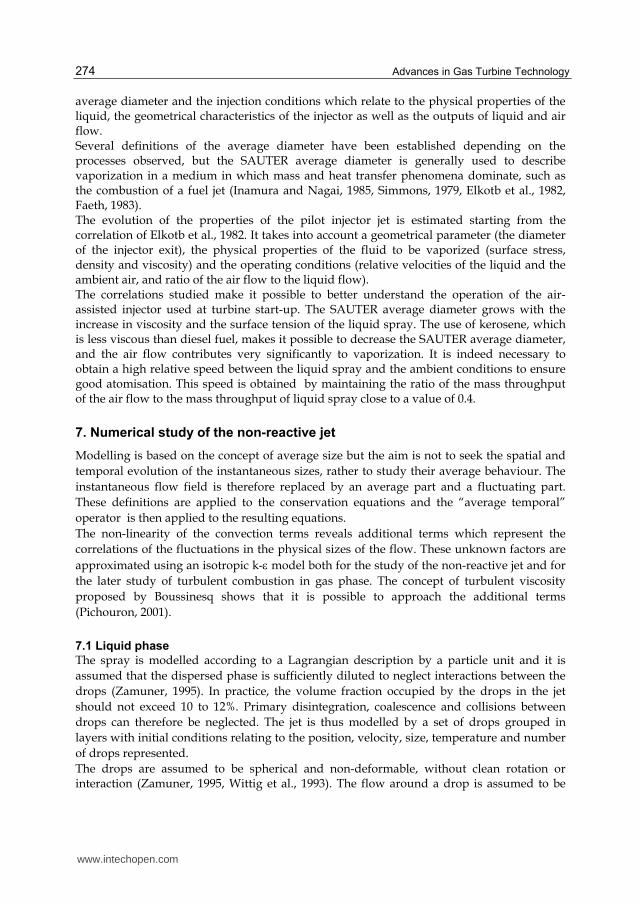
A granulometric study conducted with the participation of the laboratory CORIA (Rouen, France) also made it possible to measure the distribution of the drop diameters of the injector as a function of the air pressure, the viscosity and the fuel pressure (table 1). The drop sizes were measured by the optical diffraction of a laser beam which passes through the cloud of drops. By measuring the thickness of the cloud of drops in the path of the laser beam and the attenuation of the direct beam, the volume concentration can be obtained (Figure 6). These results made it possible to give the initial conditions of the jet and its dispersed phase. The geometry of the jet was experimentally investigated in order to measure the angle formed by the jet, to determine the mass distribution of the fuel in the jet and to study axial symmetry. The test bench is composed of a feeding circuit of fuel and air (Figure 7). The fuel jet which develops with the free air is studied and the air mass fuel rates of air flow for the operating points are given in table 1.
Fuel flow (kg/h) 4,4 5,7 6,6 7,7
Air flow (l/min) 10-16-24 10-16-24 10-16-24 10-16-24
Table 1. Operating points for the geometrical study of the spray
Fig. 6. Diagram of the drop size measurements
Fig. 7. Diagram of the test rig for characterization of the spray
www.intechopen.com

Advances in Gas Turbine Technology
272
6. Modelling of the jet
6.1 Identification of a volume law of distribution
The most widely used expression is that originally developed for powders by Rosin and Rammler, where Q is the fraction of total volume contained in drops with a diameter lower than D, X and Q are two parameters which characterize the drops composing the jet (Eq. 1).
q
X
D
Q
exp1 (1)
By identifying X and Q using the experimental results of the granulometric study (Ohkubo
and Idota, 1994), the distribution of the drop sizes of the injector must be checked by the
Rosin-Rammler law where X is the diameter when 63.2% of the liquid volume is dispersed
in drops smaller than X, Q being calculated starting from the Rosin-Rammler law (Eq. 2).
XD
/ln
1lnln
(2)
Figure 8 shows the experimental distribution curve and the associated Rosin Rammler law.
The measurements were made at the centre of the spray. The air and fuel mass flows are
respectively 16 l/min and 7.7 kg/h. The curves are cumulative distributions of the drop
sizes and represent the fraction of the total spray volume in drops larger than the diameter
considered. Each measurement corresponds to an operating point of the injector to which
corresponds a calculation of the coefficients X and Q of the Rosin-Rammler law.
0
0.1
0.2
0.3
0.4
0.5
0.6
0.7
0.8
0.9
1
0 100 200 300 400 500 600
Rosin Rammler Exp.
diameter of drops ()
Fig. 8. Experimental distribution of the drop sizes and of the associated Rosin-Rammler law
The Rosin-Rammler law correctly describes the drop size distribution at the centre and the
periphery of the jet, in particular when the air flow is low. The validity of the law was then
checked for all the injector operating points and for the two fuels: diesel fuel and kerosene.
The modeling of the fuel jet in terms of drop size and volume distribution was thus
validated by the Rosin-Rammler law in which coefficients are given starting from the
granulometry results.
Fra
ctio
n o
f to
tal
vo
lum
e
www.intechopen.com

Characterization of a Spray in the Combustion Chamber of a Low Emission Gas Turbine
273
6.2 Cartography of the jet
The effect of the air flow can be very clearly observed on figure 9 when the mass fuel rate of flow is maintained constant. For an air flow of 24 l/min, 50% of the volume of fuel injected is vaporized in drops with a diameter less than 50 microns. If the air flow is reduced to 3.5 l/min, the maximum drop size required to vaporize the same volume of fuel reaches 150 microns.
0
0.1
0.2
0.3
0.4
0.5
0.6
0.7
0.8
0.9
1
0 100 200 300 400 500 600
Air:3,5l/mn
Air:6l/mn
Air:16l/mn
Air:24l/mn
diameter of drops ()
Fig. 9. Evolution of the spray granulometry as a function of the air flow (measurements made 10 mm from the spray centre, mass fuel flow 7.7 kg/h)
The study also shows that the increase in the mass fuel flow rate makes the jet less uniform by
producing a significant number of large drops. The increase in the mass fuel flow rate from 4.4
to 7.7 kg/h causes an increase in the maximum drop size from 150 to 250 microns in the centre
of the jet. The effects related to the increase of the mass fuel flow rate are also greater at the
periphery than in the centre of the jet. These results confirm that the level of atomisation in the
jet can be estimated by calculating the mass ratio of the mass fuel flow rate and the air flow.
6.3 Angle of the spray
The jet angle has a value ranging between 30 and 35° on both sides of the longitudinal axis
of the injector when the air flow is 24 l/min and it is the same for a flow for 10 l/min. This
shows that the geometry of the jet is independent of the mass fuel flow rate when the air
flow is 24 l/min. Finally, in agreement with Lefebvre (1989), it can be concluded that the jet
angle is only slightly influenced by the air flow.
6.4 Mass distribution of the fuel in the jet
The air flow strongly influences the mass distribution of the fuel in the jet, since increasing
the air flow concentrates a high proportion of the fuel in the centre of the jet. Only a small
quantity of fuel is then located beyond 30° from the injector axis. The tests show
conclusively that the axial symmetry of the jet is respected for the operating conditions, in
particular with air flows above 20 l/min.
6.5 Correlations of the SAUTER average diameter
The lack of a consolidated theory on vaporization processes meant that empirical correlations had to be used to evaluate the relation between a representative diameter, the
Fra
ctio
n o
f to
tal
vo
lum
e
www.intechopen.com
Advances in Gas Turbine Technology
274
average diameter and the injection conditions which relate to the physical properties of the liquid, the geometrical characteristics of the injector as well as the outputs of liquid and air flow. Several definitions of the average diameter have been established depending on the processes observed, but the SAUTER average diameter is generally used to describe vaporization in a medium in which mass and heat transfer phenomena dominate, such as the combustion of a fuel jet (Inamura and Nagai, 1985, Simmons, 1979, Elkotb et al., 1982, Faeth, 1983). The evolution of the properties of the pilot injector jet is estimated starting from the correlation of Elkotb et al., 1982. It takes into account a geometrical parameter (the diameter of the injector exit), the physical properties of the fluid to be vaporized (surface stress, density and viscosity) and the operating conditions (relative velocities of the liquid and the ambient air, and ratio of the air flow to the liquid flow). The correlations studied make it possible to better understand the operation of the air-assisted injector used at turbine start-up. The SAUTER average diameter grows with the increase in viscosity and the surface tension of the liquid spray. The use of kerosene, which is less viscous than diesel fuel, makes it possible to decrease the SAUTER average diameter, and the air flow contributes very significantly to vaporization. It is indeed necessary to obtain a high relative speed between the liquid spray and the ambient conditions to ensure good atomisation. This speed is obtained by maintaining the ratio of the mass throughput of the air flow to the mass throughput of liquid spray close to a value of 0.4.
7. Numerical study of the non-reactive jet
Modelling is based on the concept of average size but the aim is not to seek the spatial and
temporal evolution of the instantaneous sizes, rather to study their average behaviour. The
instantaneous flow field is therefore replaced by an average part and a fluctuating part.
These definitions are applied to the conservation equations and the “average temporal”
operator is then applied to the resulting equations.
The non-linearity of the convection terms reveals additional terms which represent the
correlations of the fluctuations in the physical sizes of the flow. These unknown factors are
approximated using an isotropic k- model both for the study of the non-reactive jet and for
the later study of turbulent combustion in gas phase. The concept of turbulent viscosity
proposed by Boussinesq shows that it is possible to approach the additional terms
(Pichouron, 2001).
7.1 Liquid phase
The spray is modelled according to a Lagrangian description by a particle unit and it is
assumed that the dispersed phase is sufficiently diluted to neglect interactions between the
drops (Zamuner, 1995). In practice, the volume fraction occupied by the drops in the jet
should not exceed 10 to 12%. Primary disintegration, coalescence and collisions between
drops can therefore be neglected. The jet is thus modelled by a set of drops grouped in
layers with initial conditions relating to the position, velocity, size, temperature and number
of drops represented.
The drops are assumed to be spherical and non-deformable, without clean rotation or interaction (Zamuner, 1995, Wittig et al., 1993). The flow around a drop is assumed to be
www.intechopen.com

Characterization of a Spray in the Combustion Chamber of a Low Emission Gas Turbine
275
homogeneous and the particle density much higher than that of gas. Gravity, the Archimedes force, the added mass term, the force due to the pressure gradient , the Basset force and the Saffman force, are neglected. The initial conditions of the calculation of the drop trajectories in the dispersed phase result from the experimental study of the jet. The initial drop diameters were determined by the value of the diameters measured 30 mm downstream from the injector nozzle and it was verified that the droplets did not undergo secondary vaporization outside the path of the laser beam. With low relative speeds, the spherical shape of the droplets is preserved by the combined
action of surface stress and the viscous forces of the fuel. When the speed increases, the
aerodynamic loads acting on the surface of the drop cause deformation, oscillation, and
finally disintegration of the liquid particle.
Two groups of parameters make it possible to distinguish the various modes from
secondary disintegration (Schmel et al., 1999, Yule and Salters, 1995), namely Weber
numbers We, and Ohnesorge numbers On (Eqs. 3 and 4) which respectively determine the
relationship between the aerodynamic loads exerted on the drop and the surface stress, and
the relationship between viscous friction in the drop and surface stress (Krzecskowski, 1995,
Pilch and Erdman, 1987). is the density of surrounding gas, urel is relative speed between
gas and the particle, and D, g, g, g are respectively the diameter, surface stress, viscosity
and density of the fuel.
g
2
rel DuWe
(3)
gg
g
DOn
(4)
No deformation, or oscillation is observed when the Weber number is lower than a breaking
value Wec. Beyond this breaking value, three different mechanisms are observed which
control the disintegration of the droplets in the case of typical Weber numbers of the flows
in a gas turbine combustion chamber. For an Onhesorge number higher than 0.1, a
significant influence of viscosity is observed and the transition between the various modes is
given by the Weber number. Correlation (5) can then be used to assess the degree of
vaporization in the two-phase flows measured. For the relative speeds studied, the drops
must have a minimum diameter of 100 m to undergo secondary vaporization.
Wec=12 (1+1.077 On1.6) (5)
The characterization of the jet shows that for an air flow of 24 l/min, the pilot injector emits
a jet made up mainly of drops with a diameter lower than 70 m. In this configuration, only
a very small quantity of the drops is subjected to secondary vaporization. On the other
hand, when the air flow is 10 l/min, a maximum diameter of drops of about 180 m is
reached.
Taking into account the ejection speeds estimated for the drops, it can be noted that only the
drops with diameters larger than 100 m are likely to reach the disintegration mode. This indicates that secondary vaporization may therefore occur only over 1.5% in mass of the total fuel flow. Lastly, even if the relative speed increase between the drops and gas favours
www.intechopen.com

Advances in Gas Turbine Technology
276
secondary vaporization, this physical phenomenon will never be very important within the present framework. Secondary vaporization was therefore be neglected, as was the behaviour of the drops after rebound from the walls.
7.2 Gas phase
The fuel drops warm up and evaporate during their trajectory in the gas phase. The evaporation process of a drop composed of a mixture of hydrocarbons can be divided into three fields for modelling mass and heat transfer (Prommersberger et al., 1999, Aggarwal and Peng, 1994). The most fully developed approaches (model DLM, Diffusion Limit Model) take account of the heterogeneous temperature field in the droplet, of the influence of the drop and the multi-component composition of the hydrocarbon (Hallmann et al., 1995, Li, 1995). Certain models treat drop heating and vaporization simultaneously, while others assume that the droplet warms up initially without evaporating, and that when it reaches a sufficient temperature, it vaporizes (Schmehl et al., 1999). It is the latter approach which is adopted here, following three successive behavior laws (Pichouron, 2001). This involves calculating reheating of the droplet without exchange of mass with the surrounding medium from the ejection temperature until the vaporization temperature. Beyond the vaporization temperature, the mass and heat transfer between the drop and the surrounding medium is calculated, up to a boiling point. The convective boiling of the drop at iso-temperature is then predicted. Calculation proceeds in a fixed geometry with motionless walls, entries for the dilution and air for combustion and an exit for the combustion products. For the entries and the exit, the boundary conditions are imposed in flow in the study of the non-reactive jet and in pressure in the later study of the turbulent combustion of the jet. The limiting conditions of flow and pressure resulting from the experiment are obtained on the test bench.
7.3 Coupling of the liquid and gas phases The drops act on gas by the source terms introduced into the equations. The source terms are determined by summing the exchanges along the trajectory of the particles which pass through the control volume. The momentum transfer from the continuous phase to the dispersed phase is obtained by calculating the variation in momentum of the particle traversing the control volume. The heat exchanged between the continuous and dispersed phases is deduced from the thermal variation in energy of the drop which passes through the control volume. The mass transfer of the dispersed phase towards the continuous phase is obtained by calculating the mass variation of the drop traversing the control volume (Reitz and Bracco, 1982).
8. Limiting conditions of calculation
8.1 Space distribution of the drops at the injector outlet
For the 3D representation, the jet is described by a hollow cone. By defining several hollow
cones of identical origin and axis, but with a different ray R and angle , it is possible to represent the jet of the pilot injector. The fuel drops initially form crowns, and taking into account the secondary assumption of non-disintegration, the origin of the crowns is located at the injector nozzle (Litchford and Jeng, 1991).
www.intechopen.com

Characterization of a Spray in the Combustion Chamber of a Low Emission Gas Turbine
277
Initially, the fuel drops are thus divided regularly and into an identical number on concentric crowns (Figure 10). Many numerical tests were carried out to determine the optimal number of crowns. The best representation is obtained with ten crowns for vaporization with an air flow of 24 l/min, and with five crowns for 14 l/min, the crown having a constant external diameter of 2 mm.
Fig. 10. Example of space distribution of the drops on the injector outlet
8.2 Jet angle
The jet is represented by five or ten hollow cones for which it is necessary to define an angle corresponding to the initial direction of the drops distributed on the crowns. From
experimental measurements of the jet angle, the external taper angleext, was defined; the hollow taper angle ith is then given by Equation (6), where N is the number of crowns.
ni extn
i .
(6)
8.3 Initial diameters
To determine the initial Lagrangian diameters, two series of diameters were selected, based on the granulometry measurements. It was observed that when the air flow in the injector was 24 l/min, the drop sizes are less widely dispersed and that drops with a diameter above
100 m are rare. Similar observations were made for an air flow of 14l/min, with a
maximum diameter of 200 m. Five (respectively 10) classes of drops were therefore defined for an air flow of 24 l/min (respectively 14 l/min). Each class corresponds to an initial diameter in the calculation of the droplet trajectory.
8.4 Mass flow by trajectory
As the liquid phase flow has to be respected whatever the number of drops injected into the calculation field, it is assumed that a fraction of this flow is allocated with each calculated trajectory and the summation of the flows for each trajectory is equal to the fuel flow in the injector. To attribute a flow to each trajectory, the Rosin-Rammler law was used, as it satisfactorily characterizes the drop size distribution in the pilot injector jet . This representation assumes that several identical drops forward per unit of time on each trajectory (Zamuner, 1995).
www.intechopen.com
Advances in Gas Turbine Technology
278
8.5 Initial particle speed
It is difficult to determine the initial particle speed given that the fuel is injected via the tube into the injector envelope and that the action of the air flow on the liquid jet takes effect at the very end of the injector envelope, in a zone very close to the section considered as the modelling injection surface. Lay (1997) suggests choosing the initial speed of the drops randomly in a range which evolves by 0 m/s at the local speed of the gas phase. It is further assumed that the initial speed of the drops is constant whatever the diameter and the spatial position of the particle. The estimated speed is based on the speed characteristics of the liquid exiting the injector channel. Knowing that the effective bypass section at the nozzle of the tube is 96.3.10-3 mm2, a speed Vl was determined for the liquid phase. The initial speed of the drops Vg is given by applying a corrective factor whose value depends on the air flow.
8.6 Grid of the geometry
The geometry selected to validate the injection model is a cylinder 300 mm in diameter and
200 mm in length; the medium is composed of air at rest under atmospheric pressure. At
one extremity of the cylinder, a centred disc with a diameter of 2.35 mm represents the
injector nozzle exit where the initial jet conditions and boundary conditions are imposed to
model the air flow. The other end of the cylinder is the simulation exit.
The grid of the geometry consists of 68000 hexahedral cells with a total of 70520 nodes; the
quality of the cells and nodes is monitored by a tracer. In the zone downstream from the
injector nozzle, the mesh size was fixed at a value ranging between 0.2 and 0.5 mm, based
on the results of Sugiyama et al., (1994) cited by Levy (1997), which indicate care should be
taken that the mesh does not exceed 1 mm on side in the delicate zones. The modelled field
is the top of the combustion chamber made up of the premixing tube and the air inlet ducts.
The fuel is vaporized in the premixing tube by the injector, the extremity of which is placed
in inlet duct.
8.7 Dispersed phase
Three reference test cases were used to compare the results, and the initial conditions of the dispersed phase are defined following description given previously (table 2).
Case n°1 Air flow =0.285g/s (14l/min) Fuel flow 1=1.84g/s (6,6 kg/h)
Case n°2 Air flow =0.5g/s (24l/min) Fuel flow=1.22g/s (4,4 kg/h)
Case n°3 Air flow =05g/s (24l/min) Fuel flow=1.84g/s
Table 2. Operating points for the study of the spray
8.8 Gas phase
A speed condition is imposed for the injector air flow which makes it possible to combine
the requirements of flow (experimental measurement of 14 l/min or 24 l/min) and of flow
direction (imposed by the geometry of the injector nozzle). A fraction of the total flow
measured on the test bench is imposed on the inlet ducts, based on the division of the
discharge between the air intake according to their effective surface.
www.intechopen.com

Characterization of a Spray in the Combustion Chamber of a Low Emission Gas Turbine
279
9. Validation of calculations
9.1 Concentration
The calculated volume concentration of the liquid phase is compared with the experimental results. In the post-processing phase, the concentration value calculated along lines registered on a fictitious cylinder representing the laser beam and located 30 mm downstream from the origin of the injection was recorded (Figure 11).
Fig. 11. Calculation of the average concentration of the liquid phase
Figure 12 represents the instantaneous concentrations of the liquid phase along the 5 radial lines (C1 to C5) and the configurations of the concentrations remain similar to those described in the literature for the three cases tested. A deficit in fuel drops on the axis of the injector can be observed, followed by a very clear increase while moving away from the axis, before a second deficit which corresponds to the physical limit of the jet. Note that this same tendency was observed in the experimental study of the jet angle.
0
0,1
0,2
0,3
0,4
0,5
0,6
0,7
0,8
25 20 15 10 5 0 -5 -10 -15 -20
Transversal distance (mm)
Co
ncen
trati
on
(kg
/m3)
C1
C2
C3
C4
C5
Fig. 12. Instantaneous concentration of the liquid phase as a function of the transverse position. (mass fuel flow rate: 1.22 g/s and air flow: 0.5 g/s)
The numerical and experimental average concentrations for the three studied cases were compared. The agreement is very good in the case of the lowest air flow (0.285g/s). For the air flow of 0.5 g/s, the difference between the numerical and experimental results shows the
www.intechopen.com

Advances in Gas Turbine Technology
280
limits of the injection model used here: the experimental study revealed the very strong impact of the air flow on the disintegration of the jet and correlatively on the initial particle speed, which significantly influences the trajectory and thus the concentration of the droplets. The injection model however is kept to study the evolution of the two-phase flow in the ignition zone.
9.2 Simulation of the ignition zone
The experiment shows that the explosion limits depend on the average diameter of the
droplets, and that an optimal drop size minimizes the ignition energy required. It was as
highlighted as in fact the smallest droplets govern the behavior of the spray to the ignition.
The injection model is thus used to numerically study the particle behavior in the ignition
zone as a function of their diameter, their initial position in relation to the injector nozzle,
and the air flow in the inlet ducts. In the simulation field, the end of the spark which
penetrates the ignition zone was not reproduced.
9.3 Aerodynamic field of the jet
Figure 13 shows the field rate of the gas flow for test case n°3. It is observed (13A) that the
gas has a high speed at the beginning of the jet due to the air flow, confirming the influence
of the air flow on the droplet trajectory that was observed in experiments. Downstream,
inside the premixing tube, it can be seen that the field speed is characterized by an intense
zone on the injector axis (again evidencing the influence of the air flow) and a calmer area
when deviating from the axis. Along the wall of the premixing tube, a return flow is
observed (13B), though the speeds reached locally (less than 7m/s) remain low compared to
the speeds reached on the injector axis.
m/s
m/s
(A) (B)
Fig. 13. Gas flow rate in a diametrical plane Field speed (A) and negative axial speed along the walls (B)
The evolution of the radial profiles of the components speed is shown on Figure 14 for 4
positions on the axis of the premixing tube geometry. A strong decrease in axial speed can
be observed when the flow deviates from the axis, as along the axis. Observation of the
evolution of the radial and tangential components highlights the axi-symmetry of the flow
(14A and 14B). It can be seen that the maximum intensity of each component is reached in a
zone located 5-6 mm from the axis of the geometry, the dimensions of this corridor being
www.intechopen.com

Characterization of a Spray in the Combustion Chamber of a Low Emission Gas Turbine
281
conditioned by the throttling diameter (12 mm) at the end of the convergent one. Beyond
this corridor, marginal recirculation zones with weak kinetic energy are formed under the
action of the central flow shearing forces.
(A) (B)
Fig. 14. Evolution of the profiles of the radial (A) and tangential (B) velocity components for 4 positions on the axis of the geometry
The simulation results for two positions on the axis (3 mm and 15 mm) and for each
component speed (Figure 15) were also compared. These test cases differ by their air flows.
The variation in the air flow significantly modifies the axial speed in the zone of the axis of
geometry (15A and 15B), has a more moderate influence on radial speed (15C and 15D), and
has no impact on tangential speed (15E and F).
(A) (B)
(C) (D)
www.intechopen.com

Advances in Gas Turbine Technology
282
(E) (F)
(left-hand column: calculation with the position 3mm, right-hand column: calculation with the position 15mm)
Fig. 15. Comparison of the axial (A and B), radial (C and D) and tangential (E and F) velocity components of gas for test cases 1 and 3.
The field velocity simulated close to the spark is shown on Figure 16. The mean velocity in this zone is influenced primarily by the air flow entering the inlet ducts. It can be seen that the re-circulation zone increases upstream with the increase in the air flow of combustion (16A and B), and that the tangential component is significantly increased (16C and D). The studies by Snyder et al., 1994, and Yamada et al., 1995 showed that the increased mean velocity increases the minimal ignition energy and this effect will have to be taken into account to define the ignition delay in the combustion chamber.
(A) (B)
(C) (D)
Fig. 16. Comparison of the field velocity in the ignition zone for two rotation speeds: 5000 rpm (A) and (C) and 40000 rpm (B) and (D)
www.intechopen.com
Characterization of a Spray in the Combustion Chamber of a Low Emission Gas Turbine
283
9.4 Trajectory of the fuel drops
The trajectory of the drops is studied according to three principal parameters. The injector
air flow determines the granulometry of the jet and influences the aerodynamics along the
simulation axis. The rotation speed of the turbine determines the air flow entering the inlet
ducts and influences the swirl intensity in the premixing tube . The penetration depth of the
injector nozzle modifies the geometry of the simulation field.
The numerical study of the trajectories shows that drops with a diameter equal to or higher
than 40 m traverse the field, do not impact the walls and that their trajectories are
helicoidal. This effect is imposed by the swirl movement in the premixing tube. The increase
in the air flow (14 l/min to 24 l/min), by increasing the initial speed of the drops and the
axial speed of the gas phase along the axis of symmetry, decreases their residence time in
the ignition zone. For lower diameters, the drop-gas interaction has a stronger effect.
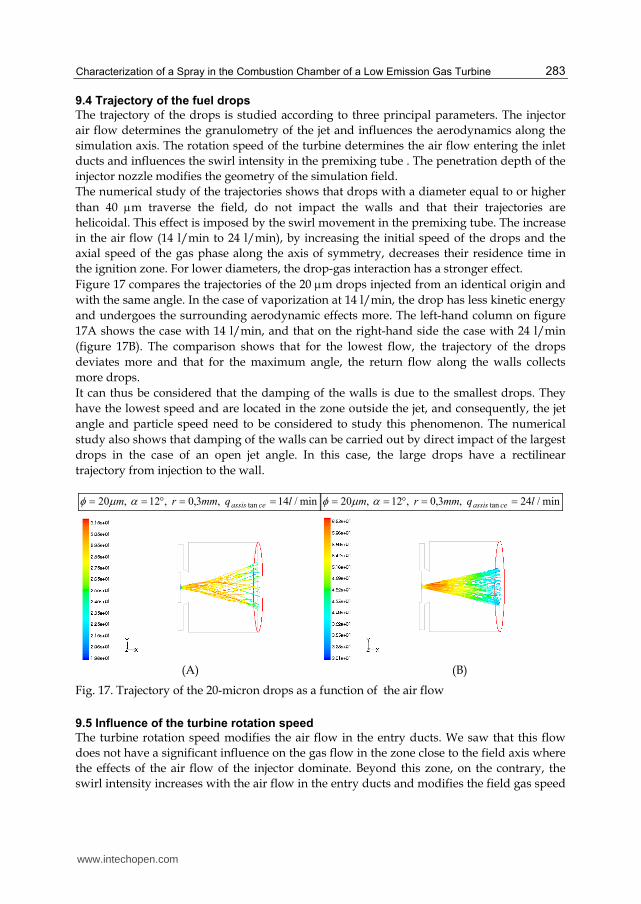
Figure 17 compares the trajectories of the 20 m drops injected from an identical origin and
with the same angle. In the case of vaporization at 14 l/min, the drop has less kinetic energy
and undergoes the surrounding aerodynamic effects more. The left-hand column on figure
17A shows the case with 14 l/min, and that on the right-hand side the case with 24 l/min
(figure 17B). The comparison shows that for the lowest flow, the trajectory of the drops
deviates more and that for the maximum angle, the return flow along the walls collects
more drops.
It can thus be considered that the damping of the walls is due to the smallest drops. They
have the lowest speed and are located in the zone outside the jet, and consequently, the jet
angle and particle speed need to be considered to study this phenomenon. The numerical
study also shows that damping of the walls can be carried out by direct impact of the largest
drops in the case of an open jet angle. In this case, the large drops have a rectilinear
trajectory from injection to the wall.
min/14 ,3,0 ,12 ,20 tan lqmmrm ceassis min/24 ,3,0 ,12 ,20 tan lqmmrm ceassis
(A) (B)
Fig. 17. Trajectory of the 20-micron drops as a function of the air flow
9.5 Influence of the turbine rotation speed
The turbine rotation speed modifies the air flow in the entry ducts. We saw that this flow
does not have a significant influence on the gas flow in the zone close to the field axis where
the effects of the air flow of the injector dominate. Beyond this zone, on the contrary, the
swirl intensity increases with the air flow in the entry ducts and modifies the field gas speed
www.intechopen.com

Advances in Gas Turbine Technology
284
and the trajectory of the drops. Figure 18 shows that the increase in the swirl of the flow
increases the jet angle and contributes to its ventilation. We tracked the trajectories of 20 m
and 40 m drops, launched with same initial speed, and for two air flows in the inlet ducts,
1.25g/s (15000 rpm) and 3g/s (40000 rpm, 18A and 18B). The results show the influence of
the air flow on the particle trajectory and the jet angle. This is true for the small-sized drops,
but the larger the drops, the less they are deviated. Drops with an initial diameter above 60
m have a practically identical trajectory for the two air flows.
(A) (B)
Fig. 18. Trajectories of the fuel drops as a function of the air flow in the entry ducts for the same batch of drops (20 and 40 microns)
9.6 Influence of the injector position
The position of the injector modifies the gas flow along the walls of the premixing tube
(Figure 19). It can be seen that the return flow zone is wider and it is the negative axial
speed of stronger intensity close to the wall which develops as a function of the penetration
depth of the injector (19A). This phenomenon influences especially the trajectory of drops
with a diameter below 40m located at the periphery of the jet. Figure 19B shows the
evolution of a batch of drops (20m) for the three injector positions and identical injection
conditions. It can be observed that for the most advanced injector position, drops interact
with the return flow and undergo a change of trajectory.
( min/40000 - min/24 - /6,6 tan trNlqhkgm ceassisairl ).
(A) (B)
Fig. 19. Influence of the injector position on the two-phase flow in the premixing tube
www.intechopen.com

Characterization of a Spray in the Combustion Chamber of a Low Emission Gas Turbine
285
9.7 2D Simplification of the geometry
In order to reduce the grid size and the computing time, the digital simulation of
combustion is restricted to a 2D approach, which requires simplifications of the geometry
and a new definition of the boundary conditions on the air inlet in the combustion chamber.
Simplifications consist in making the geometry axisymmetric by removing the entry ducts
which induce the overall swirl movement in the flow, then redefining new boundary
conditions on the entry surfaces of the air. This operation reveals a new surface located at
the base of the inlet ducts which have just been removed and where it is necessary to define
entry conditions for the air.
The post-processing of calculations on the unsimplified geometry makes it possible to define
the boundary conditions to apply to the entry surface of the simplified geometry. The sizes
necessary are measured at the base of the inlet ducts, and are then applied to the simplified
geometry. The computation results of the field speed of the gas phase and the particle
trajectory make it possible to validate the simplification.
The three components of the aerodynamic field obtained with the two geometries are then
compared. On Figure 20, the axial component is calculated along the axis of the geometry
and at a transversal distance of 10 mm downstream from the air flow intake. It can be seen
that there is a variation along the axis (20B). This variation is also observed in the results
calculated along the axis (20A). This phenomenon results from the fact that a uniform
field velocity is imposed as boundary condition for the air intake in the simplified
geometry, whereas the corresponding field in the complete geometry presents space
variations.
(A) (B)
Fig. 20. Gas flow axial velocity for the two geometries
www.intechopen.com
Advances in Gas Turbine Technology
286
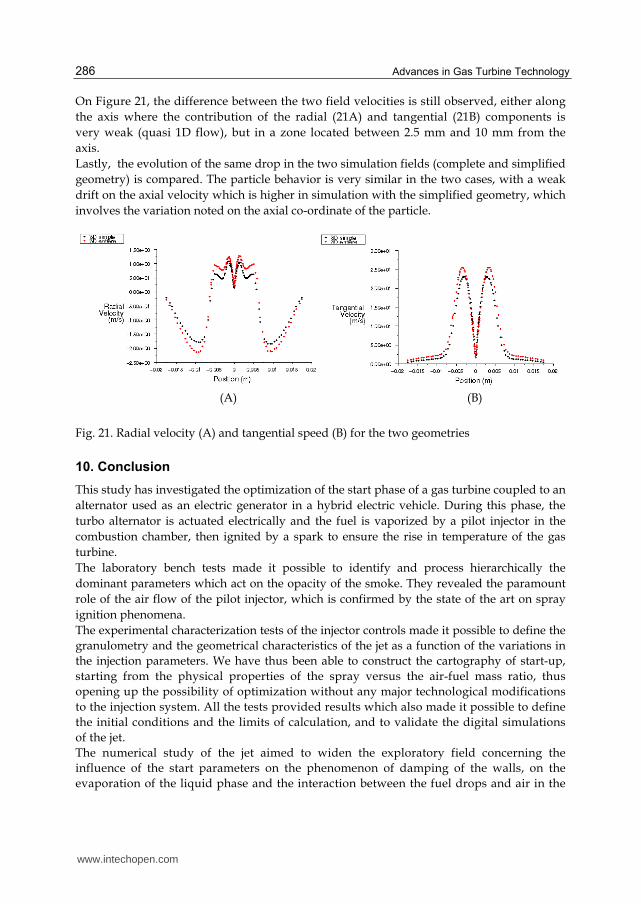
On Figure 21, the difference between the two field velocities is still observed, either along
the axis where the contribution of the radial (21A) and tangential (21B) components is
very weak (quasi 1D flow), but in a zone located between 2.5 mm and 10 mm from the
axis.
Lastly, the evolution of the same drop in the two simulation fields (complete and simplified
geometry) is compared. The particle behavior is very similar in the two cases, with a weak
drift on the axial velocity which is higher in simulation with the simplified geometry, which
involves the variation noted on the axial co-ordinate of the particle.
(A) (B)
Fig. 21. Radial velocity (A) and tangential speed (B) for the two geometries
10. Conclusion
This study has investigated the optimization of the start phase of a gas turbine coupled to an
alternator used as an electric generator in a hybrid electric vehicle. During this phase, the
turbo alternator is actuated electrically and the fuel is vaporized by a pilot injector in the
combustion chamber, then ignited by a spark to ensure the rise in temperature of the gas
turbine.
The laboratory bench tests made it possible to identify and process hierarchically the
dominant parameters which act on the opacity of the smoke. They revealed the paramount
role of the air flow of the pilot injector, which is confirmed by the state of the art on spray
ignition phenomena.
The experimental characterization tests of the injector controls made it possible to define the
granulometry and the geometrical characteristics of the jet as a function of the variations in
the injection parameters. We have thus been able to construct the cartography of start-up,
starting from the physical properties of the spray versus the air-fuel mass ratio, thus
opening up the possibility of optimization without any major technological modifications
to the injection system. All the tests provided results which also made it possible to define
the initial conditions and the limits of calculation, and to validate the digital simulations
of the jet.
The numerical study of the jet aimed to widen the exploratory field concerning the
influence of the start parameters on the phenomenon of damping of the walls, on the
evaporation of the liquid phase and the interaction between the fuel drops and air in the
www.intechopen.com

Characterization of a Spray in the Combustion Chamber of a Low Emission Gas Turbine
287
combustion chamber. Having observed, in preliminary tests, occurrences of start failure,
either by complete absence of ignition of the jet, or by a very slow rate of temperature
increase at the turbine inlet, we decided to study the jet under non-reactive conditions
initially.
The digital simulation of the non-reactive jet focused on in the ignition zone located inside
the premixing tube with a view to defining very precisely the initial conditions of the fuel
jet. In agreement with many authors, we assumed that the jet was completely atomized at
the injector outlet. The model selected was validated by comparing the measured and
calculated liquid phase concentration downstream from the point of injection. Confronted
with the difficulty which modeling the atomization of the jet represented, and without
precise information on the initial particle speed, we performed more numerical tests to
evaluate it while being guided by the experimental results. In this way, we validated our
model in experiments by acknowledging in advance that it was not completely exportable to
other configurations.
The experimental data relating to the concentration of the liquid phase of a spray vaporized in atmosphere made it possible to validate an injection model which correctly describes the initial conditions of the dispersed phase. This model shows that the gas flow consists of two distinct zones in the premixing tube . The first zone is located along the axis of the tube and is dominated by the effects of the air flow with a high axial component velocity. In the second zone, located at the periphery, it is the velocity of the tangential component
which dominates because it is influenced by the air flow entering the inlet ducts depending
on the rotation speed of the turbine. in the trajectory of the droplets whose diameter is lower
or equal to 40 m, when the air flow in the conduits of admission corresponds to a minimal
mode of turbine of 15000 rpm.
This modeling was based on simplifications of representation of the jet such as the
possibility of various drops occupying the same space, uniform initial speed for the drops,
and the nonrandom variation in the jet angles. It is noted that it is necessary to define a high
number of injections for the wide distribution of the drop diameters.
The results of this work show that increasing the injector air flow contributes to the
formation of a better ventilated jet. The field rate of the flow in the ignition zone was also
studied to evaluate the convective effects ; an experimental study of the influence of spark
length on ignition remains to be done. The injection model finally made it possible to
validate the assumption of axisymmetry of the geometry in order to reduce the calculation
of the trajectories to a 2D approach and to thus limit the computation time.
An improvement in the model could be obtained by adopting a surface injection model
instead of the conical model, and by introducing a probability function for the initial droplet
velocity and jet angle. Estimating the distribution of the diameters and initial speeds of the
drops with a model of jet disintegration could also be considered.
A later stage will relate to the choice and the development of a model of turbulent
combustion using a semi-detailed chemical mechanism in a multi-phase medium. We will
show that it is possible to reproduce the experimental observation of the temperature
levels at the entry of the turbine as well as the evolution of the unburnt residues. A
parametric analysis will also be conducted to evaluate the influence of the injection
parameters and the rotation speed of the turbine on the trajectory of the dispersed phase,
www.intechopen.com

Advances in Gas Turbine Technology
288
these observations being directly applicable to optimize the cartography of the start phase
of gas turbines.
11. Acknowledgements
The author is grateful to the grant-in-aid from RENAULT SA research program for providing support for this research project and the PhD of J.F. Pichouron.
12. References
Aggarwal S.K. and Peng F., 1994, A Review of Droplet Dynamics and Vaporization
Modeling for Engineering Calculation, ASME 94-WP-215, 1994.
Elkotb, Mr., Mahdy Mr. A., Montaser, Mr. E., 1982, Investigation off external mixing air
assist atomizer, International Proceeding off the 2nd conferences one liquid
atomization and sprays, pp. 107-115, Madison, 1982.
Faeth, G., 1983, Evaporation and combustion off sprays, Program Energy combustion
Sciences, Vol.9, pp. 1-76, 1983.
Hallmann, Mr. Scheurlen, Mr., Wittig, S., 1995, Computation off turbulent evaporating
sprays, Eulerian versus lagrangian approach, Transactions off the ASME, vol. 117,
pp. 112-119, 1995.
Inamura T. and Nagai NR., 1985, The relative performance off externally and internally-
mixed twin fluid atomizers, Proceedings off the 3rd International conference one
liquid atomization and sprays, London, July 1985.
Krzecskowski, S.A., 1995, Atomization and sprays, Shorts race 1995, Institute für
Thermische Strömungsmaschinen, Universität Karlsruhe, 1995.
Lay, Mr. K., 1997, CFD analysis off have liquid spray combustion in gas turbine combuster,
International gas turbine and aeroengine congress, Orlando, Florida, june 2-5, 1997,
ASME Paper 97-WP-309, 1997.
Lefèbvre, H.A., 1989, Atomization and sprays, Hemisphere publishing corporation,
1989.
Leonard G. and Stegmaier J., 1993, Development off year aero-derivative gas turbine dry
low emissions combustion system, ASME 93-WP-288, 1993.
Levy, NR., 1997, numerical Study of a reactive Diesel jet, Thesis of the central School of
Lyon, 1997.
Li X., 1995, Mechanism off atomization off liquid jet, Atomization and Sprays, 5:89-105,
1995.
Litchford, R.J. and Jeng, S.J., 1991, Efficient statistical turbulent transport model for particle
dispersion in spray, AIAA Newspaper, Vol.29, n°9, 1991.
Ohkubo, Y. and Idota, Y., 1994, Evaporation Characteristics off Spray in Lean-Premixed-
Prevaporisation Combuster for has 100 kw automotive Ceramic Turbine, ASME
Paper n°94-WP-401, 1994.
Pichouron J.F., 2001, Contribution to the study of the performances of a gas turbine low
emissions in launching phase, thesis of doctorate of the University Paris 6,
supported on March 28, 2001.
www.intechopen.com

Characterization of a Spray in the Combustion Chamber of a Low Emission Gas Turbine
289
Pilch, Mr. and Erdman, A.C., 1987, Use off station-wagon-up time dated and velocity history
dated to predict the off maximum size stable fragments for acceleration induced
station-wagon-up off has liquid drop, International newspaper off multiphase flow
13 (6), pp. 741-757, 1987.
Poeschl G., Ruhkamp W., Pfost H., 1994, Combustion with low pollutant emissions off liquid
fuels in gas turbines by premixing and prevaporization, ASME, 94-WP-43, 1994.
Prommersberger, K., Maier, G., Wittig, S., 1999, Validation and application off droplet
evaporation model for real aviation fuel, Research and technology organization
meeting Proceedings, vol. 14, 1999.
Reitz R.D. and Bracco, F.V., 1982, Mechanism off atomization off has liquid jet, Physics off
fluids, Vol.25, pages 1730-1742, 1982.
Ripplinger Th., Zarzalis NR., Meikis G., Hassa C., 1998, Nox Reduction by Lean Premixed
Prevaporized Combustion, Applied Vehicle Technology Panel Symposium, Lisbon,
Portugal, 12-16 October 1998.
Schmehl, R., Klose, G., Maier, G., Wittig, S., 1999, Efficient numerical calculation off
evaporating sprays in combustion chamber flows, Research and technology
organization meeting proceedings, vol. 14, 1999.
Schmel, R., Klose, G., Maier, G., Wittig, S., 1999, Efficient numerical calculation off
evaporating sprays in combustion chamber flows, Research and technology
organization meeting proceedings-14, 1999.
Schmidt S.E., 1995, Bus temperature and LDA velocity measurements in A turbulent
swirling premixed propane/air fuel model gas turbine combuster, ASME 95-WP-
64, 1995.
Simmons H.C., 1979, The prediction off To jump mean diameter for gas turbine fuel nozzles
off different types, ASME Paper 79-WA/GT-5, 1979.
Snyder T.S., Rosfjord T.J., Mc Vey J.B., 1994, Emissions and performances off has lean-
premixed gas fuel aeroderivative injection system for gas turbine engine, ASME 94-
WP-234, 1994.
Sugiyama, G., Ryu, H., Kobayashi, S., 1994, Computational simulation off Diesel combustion
with high presses fuel injection, International symposium COMODIA, pp. 391-396,
Yokohama, 11-14 july 1994.
Turrell, Mr., Stopford, P., Syed, K., Buchanan, E., 2004, CFD simulation off the flow within
and downstream off has high-swirl lean premixed gas turbine combuster,
Proceedings off ASME Turbo Expo 2004, Power for Land, sea and air, June 14-17,
2004, Vienna, Austria, ASME Paper GT2004-53112.
Wittig, S., Hallmann, Mr., Scheurlen, Mr., Schmehl, S., 1993, A new eulerian model for
turbulent evaporating sprays in recirculating flows, AGARD-CP-536, 1993.
Yamada H, Shimodaira K., Hayashi S., 1995, There engine evaluation off emissions
characteristics off is variable geometry lean-premixed combuster, ASME 95-WP-48,
1995.
Yule A.J. and Salters D.G., 1995, One the diesel distance required to atomize sprays injected
from nozzles opening-type, Volume 209, pages 217-226, Proceeding off ImechE:
Newspaper off Automobile Engineering, 1995.
www.intechopen.com

Advances in Gas Turbine Technology
290
Zamuner, B., 1995, Experimental and numerical Study of a spray in combustion resulting
from a coaxial injector liquid-gas, Thesis of the central School of Paris, 1995.
www.intechopen.com

Advances in Gas Turbine TechnologyEdited by Dr. Ernesto Benini
ISBN 978-953-307-611-9Hard cover, 526 pagesPublisher InTechPublished online 04, November, 2011Published in print edition November, 2011
InTech EuropeUniversity Campus STeP Ri Slavka Krautzeka 83/A 51000 Rijeka, Croatia Phone: +385 (51) 770 447 Fax: +385 (51) 686 166www.intechopen.com
InTech ChinaUnit 405, Office Block, Hotel Equatorial Shanghai No.65, Yan An Road (West), Shanghai, 200040, China
Phone: +86-21-62489820 Fax: +86-21-62489821
Gas turbine engines will still represent a key technology in the next 20-year energy scenarios, either in stand-alone applications or in combination with other power generation equipment. This book intends in fact toprovide an updated picture as well as a perspective vision of some of the major improvements thatcharacterize the gas turbine technology in different applications, from marine and aircraft propulsion toindustrial and stationary power generation. Therefore, the target audience for it involves design, analyst,materials and maintenance engineers. Also manufacturers, researchers and scientists will benefit from thetimely and accurate information provided in this volume. The book is organized into five main sectionsincluding 21 chapters overall: (I) Aero and Marine Gas Turbines, (II) Gas Turbine Systems, (III) Heat Transfer,(IV) Combustion and (V) Materials and Fabrication.
How to referenceIn order to correctly reference this scholarly work, feel free to copy and paste the following:
Georges Descombes (2011). Characterization of a Spray in the Combustion Chamber of a Low Emission GasTurbine, Advances in Gas Turbine Technology, Dr. Ernesto Benini (Ed.), ISBN: 978-953-307-611-9, InTech,Available from: http://www.intechopen.com/books/advances-in-gas-turbine-technology/characterization-of-a-spray-in-the-combustion-chamber-of-a-low-emission-gas-turbine

© 2011 The Author(s). Licensee IntechOpen. This is an open access articledistributed under the terms of the Creative Commons Attribution 3.0License, which permits unrestricted use, distribution, and reproduction inany medium, provided the original work is properly cited.