Embed Size (px)
Citation preview

Characterization of the Kinetics of the Passive
and Active Transport Mechanisms for Bile Acid
Absorption in the Small Intestine and Colon of the Rat
EUGENER. SCHIFF, NEAL C. SMALL, and JOHNM. DiETSCHY
From the Department of Internal Medicine, The University of TexasSouthwestern Medical School at Dallas, Dallas, Texas 75235
A B S T R A C T Bile acid uptake occurs via passive dif-fusion in all regions of the intestine and via active ab-sorption in the ileum. Determination of the passive per-meability coefficient for ionized monomers (*P-) dem-onstrated that permeability decreased by a factor of 3.4,6.8, and 8.1 for the addition of a hydroxyl, glycine, ortaurine group, respectively, to the steroid nucleus.Removal of the negative charge increased permeation bya factor of 4.4; however, permeability coefficients forthe protonated monomers showed the same relative de-crease with addition of a hydroxyl group. The calcu-lated incremental free energies of solution (85AF-.1) as-sociated with these additions equaled + 757 (hydroxyl),+ 1178 (glycine), and + 1291 (taurine) cal/mole.Passive permeability coefficients for the transverse colonshowed the same relative relationships among the vari-ous bile acids. After making appropriate corrections forpassive permeability across the ileum, apparent valuesfor the maximal transport velocity (*VVmna) and Michaelisconstant (*Km) of the active transport system were mea-sured. *V.ax depended upon the number of hydroxylgroups on the steroid nucleus; values for the trihydroxybile acids were high (1543-1906 pmoles/min per cm)while those for the dihydroxy (114-512 pmoles/min percm) and monohydroxy (45-57 pmoles/min per cm)acids were lower. In contrast, *Km values were relatedto whether the bile acid was conjugated; unconjugatedbile acids had values ranging from 0.37 to 0.49 mm,
Dr. Schiff was a trainee in Gastroenterology duringthese studies and was supported by U. S. Public HealthService Training Grant No. T01-AM-5490. His currentaddress is the Department of Internal Medicine, VeteransAdministration Hospital, 1201 NW 16th Street, Miami,Fla. 33125.
Dr. Dietschy is a Markle Scholar in Academic Medicine.Received for publication 9 August 1971 and in revised
form 4 January 1972.
while values for the conjugated bile acids were approxi-mately half as high (0.12-0.23 mM).
INTRODUCTIONIt is now well established that bile acids are absorbedat all levels of the gastrointestinal tract, yet even earlystudies suggested regional differences in relative ratesof uptake (1, 2). In addition, the transport mechanismsoperative in this absorptive process have been shown tovary in different areas of the bowel. Lack and Weiner,for example, demonstrated that everted intestinal seg-ments from the ileum, but not from jejunum, were ableto transport taurocholic acid and glycocholic acidagainst a concentration gradient (3). This finding sug-gested the presence of an active transport system lo-calized to the distal half of the small intestine; absorp-tion observed in vivo across the jejunum presumably rep-resented passive movement of bile acid down the chemi-cal gradient that exists between the intestinal contentsand portal blood (4, 5)..
Still more recent studies have characterized these twotransport systems in considerably more detail. The ilealsystem has been shown (a) to move bile acid againstan electrochemical gradient; (b) to manifest saturationkinetics when uptake rats are measured as a function ofbile acid concentration in the mucosal perfusate; (c) toexhibit competitive inhibition of uptake of one bile acidby another structurally related bile acid; and (d) to beinhibited by anaerobiosis or metabolic inhibitors (6-10). Hence, on the basis of these characteristics it ap-pears that the terminal small bowel contains transportsites capable of active bile acid absorption. In contrast,absorption across the jejunum appears to be passive inthat such movement has been shown (a) to occur onlydown existing activity gradients; (b) to have a linear
The Journal of Clinical Investigation Volume 51 1972 1351

relationship to the concentration of bile acid in the mu-cosal perfusate; (c) not to manifest competitive phe-nomenon; and (d) to be uninfluenced by anaerobiosis ormetabolic inhibition (6, 11).
Since under physiological conditions bile acids ofvarious chemical structures are absorbed across the in-testine, these systems are ideal for studying the rela-tionship between chemical structure and kinetic charac-teristics of the active and passive transport processes.Such information is important not only as it relates togeneral problems of transport and cell permeability, but,in addition, it is of significance in better understandingthe enterohepatic circulation under normal conditionsand in disease states. Yet, essentially no data currentlyare available that allow precise comparisons of thekinetics of these two transport processes.
For this reason the present studies were undertaken.In this paper data are presented that allow a compari-son of the passive apparent permeability coefficients(*P)l for both ionized and protonated bile acid monomersacross the small and large intestine of the rat. In addi-tion, experimental results are provided that illustrate theeffects of altering the micellar characteristics of the bulkwater phase on such passive uptake rates. Apparent val-ues for the maximal transport velocity (*Vm..) andMichaelis constant (*Km) for the active transport ofvarious bile acids have been determined are related to thespecific molecular structure of the major classes of bileacids. Finally, the implication of these findings withrespect to the nornial enterohepatic circulation of bileacid is discussed.
METHODSChemicals and reagents. Radiolabeled bile acids, both tri-
tiated and '4C-labeled, were obtained from a variety ofcommercial sources.2 In addition, in earlier experimentssome bile acids were labeled with tritium by catalytic ex-change.8 In all cases the bile acids were purified by re-crystallization and/or by repeated preparative thin-layerchromatography on 20 X 40 cm plates using three differentsolvent systems (12, 13) until > 98% of the radioactivityran in a single area that co-chromatographed with appro-priate, authenticated bile acid standards. In a number ofinstances it was possible to measure absorption rates usingboth a 'H-labeled and "C-labeled bile acid; in such experi-ments identical rates of uptake were obtained. In addition,samples of the serosal fluid in a number of studies wereconcentrated and subjected to thin-layer chromatography.The radioactivity was found to run with the appropriatebile acid indicating that flux rates reflected movement of
1Abbreviations used in this paper: CMC, critical micelleconcentration; J, flux rates; *Km, apparent Michaelis con-stant; *P, passive apparent permeability coefficients; *Vmax,apparent maximal transport velocity.
'Mallinckrodt Chemical Works, St. Louis, Mo.; NewEngland Nuclear Corp., Boston, Mass.; Nuclear-ChicagoCorporation, Des Plaines, Ill.; Tracerlab, Richmond, Calif.
'New England Nuclear Corp., Boston, Mass.
bile acid and not movement of labeled trace contaminants.Unlabeled bile acids obtained from two sources' werechecked for purity using thin-layer chromatography afterspotting approximately 100 ltg. Where significant contami-nation was present purification was accomplished by re-crystallization (unconjugated bile acids) or by preparativethin-layer chromatography. Mixed egg lecithin (14), mono-oleate,5 and oleic acid' were used as supplied withoutfurther purification.
In the in vivo experiments bile acids were dissolved ineither Krebs' bicarbonate buffer equilibrated with 95%oxygen: 5% C02 or in a phosphate-Tris buffer (dibasic so-dium phosphate, 5 mM; Tris-[2-amino-2-hydroxymethyl-1,3-propanediol], 5 mm; sodium chloride, 140 mM). In invitro studies only Krebs' bicarbonate buffer was used. Thephosphate-Tris buffer usually was titrated with HCl orNaOH to pH values varying from 6.0 to 8.0 as noted inspecific experiments. Preliminary experiments indicated nodifference in rates of absorption from Krebs' bicarbonatebuffer and the phosphate-Tris buffer.
Incubation techniques. For in vitro experiments unidirec-tional flux rates for bile acids were determined using apreviously described apparatus that allows perfusion of themucosal and serosal surfaces of an intestinal segment withoxygenated buffer under conditions where the transmuralpotential difference essentially is zero (6). The small in-testine of female Sprague-Dawley rats weighing 200-240 gwas divided into 10 segments of equal length, numberedf rom 1 to 10, proximal to distal. The second and ninthsegments usually were used for the study of jejunal andileal bile acid transport, respectively. The volumes of theperfusate in this system were such that the concentrationof bile acid in the mucosal solution decreased less than 2%(and in most cases, less than 1%o) during the experimentalperiod when measurements of mucosal-to-serosal flux rateswere performed. In addition, after an equilibration periodof 20-35 min, the appearance of bile acid in the serosalfluid became linear with respect to time and remained sofor 2-3 hr; all measurement of flux rates, however, weremade during the linear period from 40 to 70 min. Thus,using this system bile acid flux rates could be measuredunder circumstances where the appearance of the probemolecule in the serosal compartment was linear with respectto time, where the concentration of the molecule in themucosal solution remained essentially constant during theexperimental period and where the transmural potential dif-ference essentially equaled zero. These flux rates, J, areexpressed as the picomoles of bile acid moving across thebowel wall per minute per centimeter length of intestine(pmoles/min per cm).
In order to quantitate the flux rates of bile acids in vivo,rats were anesthetized with phenobarbital and the commonbile duct was cannulated. Small bowel segment number 2or number 9 or the transverse colon was isolated betweenligatures, and proximal and distal catheters were implanted(6). After flushing clear, the test segment was returned tothe abdominal cavity, and the abdomen was closed withseveral clips. With the animal maintained under anesthesiathe segment was perfused with phosphate-Tris buffer solu-tions containing radiolabeled bile acids at a constant rateof 0.50 ml/min. At this flow rate there was essentially nochange in either the pH or the concentration of bile acidduring the passage of the buffer solution through the test
'Calbiochem, Los Angeles, Calif.; Steraloids, Inc., Pawl-ing, N. Y.
'Applied Science Laboratories, Inc., State College, Pa.
1352 E. R. Schiff, N. C. Small, and J. M. Dietschy

segment. Body temperatures of the anesthetized animalswere maintained at 370C during the perfusion by means ofa heat lamp. Bile samples were collected directly into count-ing vials at 3-min intervals. The rate of appearance of thelabeled bile acids in the bile usually became linear withrespect to time after 10-14 min; the rate constant wascalculated from the linear portion of the curve. As demon-strated previously (6, 10), we also have shown by directperfusion of radiolabeled bile acids into the portal bloodsystem that liver transport of bile acids into the bile is notrate-limiting in these experiments; indeed, the liver has beenshown to clear bile acids in a linear fashion at over 10times the maximal rates seen for intestinal transport. Thus,under the conditions of these experiments the rate ofappearance of radiolabeled bile acid in the biliary drainageis an accurate measure of the rate of intestinal absorption.At the end of the perfusion, the intestinal segment wasremoved and its length determined. Flux rates, J, fromthese studies also are expressed as the picomoles of bileacid absorbed per minute per centimeter length of intestine(pmoles/min per cm).
Counting techniques. Samples of the perfusate from thein vitro experiments as well as the bile specimens werecounted in Bray's solution using appropriate internal stan-dards for quench correction (15).
Statistical methods. Most data are presented as meanvalues ±SEM for n determinations. The data that relaterates of active absorption of bile acids to their concentra-tions in the perfusate generally fit a hyperbolic function.Rather than utilize one of the standard procedures forlinear transformation, a computer program was devised'that allows direct fitting of these kinetic data to a hyper-bolic function assuming that the rate of absorption, J,equals zero when the concentration of bile acid in the per-fusate also equals zero. An analysis of these curves, asdescribed in the Appendix, gives mean values and variancefor the apparent maximal transport velocity, *Vma., andthe apparent Michaelis constant, *Km, as well as a coef-ficient of dependency that has values from 0 to 1.0 anddescribes the relative fit of the data to a hyperbolic curve(1.0 represents a perfect fit).
RESULTSThese experiments were undertaken to characterize thetransport processes involved in active and passive bileacid absorption, and both in vivo and in vitro techniqueswere utilized. However, since it was important to char-acterize passive absorption from bile acid solutions ofhigh concentration and since in vitro intestine toleratessuch concentrations poorly (16-18), data on passiveabsorption were obtained primarily using the in vivo per-fusion technique. On the other hand, kinetic data on theactive transport system could be measured at low con-centrations of bile acid, and further, it was desirable toobtain such information under conditions where precisecontrol of the electrochemical gradient across the bowelwall was possible; for these reasons data on the activesystem was obtained primarily in the in vitro perfusionsystem. In both cases, however, measurements also were
6 Dr. Wanzer Drane, Biostatistics Department, The Uni-versity of Texas Southwestern Medical School, Dallas,Tex. (see Appendix).
obtained in the alternate system for comparativepurposes.
Characterization of passive monomer absorption acrossthe jejunum. It is well established that bile absorptionacross the jejunum is passive (11). Using the in vivoperfusion technique, measurements of the relative ratesof absorption of various bile acids across the second in-testinal segment were first undertaken. Since bile acidsolutions contain molecules present in three species-ionized monomers, protonated monomers, and micelles-it was necessary to characterize passive permeabilitycharacteristics of the jejunal mucosa for each of thesespecies separately. In a very dilute solution of bile acidbelow its critical micelle concentration (CMC) therelative amounts of ionized and protonated monomers isdetermined by the pH of the medium and the pK. of thebile acid. The rate of passive absorption from such solu-tions necessarily must equal the sum of the passive ratesof absorption of the two species across the rate-limitingmembrane-presumably the luminal membrane of thecolumnar absorptive cell-of the intestine. Hence, therate of uptake, J, from dilute solutions is given by theexpression:
J = (* p) (Cm) + (* P) (Cm'), (1)where *P- and *P0 are the apparent permeability coeffi-cients for the ionized and protonated bile acid monomers,respectively, and C.- and Cm. are the respective con-centrations of these two species. Permeability coefficientsin this study are expressed as the picomoles of bile acidabsorbed per minute per 1-cm length of intestine whenthe concentration of bile acid in the mucosal perfusate isnormalized to 1 mm, i.e., pmoles/min per cm per mm.Since J can be determined experimentally and [Cm-] and[Cm'] can be calculated from the Henderson-Hassel-bach equation using appropriate published values forthe pKa of each bile acid (19), the equation contains twounknowns, *P- and *P'. However, by determining J attwo different values of the pH of the buffered perfusate,a pair of simultaneous equations can be solved for the twounknowns. In practice, such experiments usually wereundertaken using one solution at a pH that varied from7.0 to 8.0 and another at a pH value that approached thepK. for a particular bile acid; thus, permeability coeffi-cients for each bile acid were calculated using pairs ofperfusates at varying pH values. By this means it wasdetermined that the values of *P- and *P° for the ionizedand protonated forms for a given bile acid were con-stant at all concentrations of the molecules in the per-fusate that were less than the CMC. That is, uptake, J,was linear with respect to concentration of bile acid inthe rnucosal perfusate (Cm) so that AJ/ACm (whichequals *P) was constant; hence, the kinetics of thisprocess are consistent with passive absorption.
Bile Acid Transport Mechanisms 1353
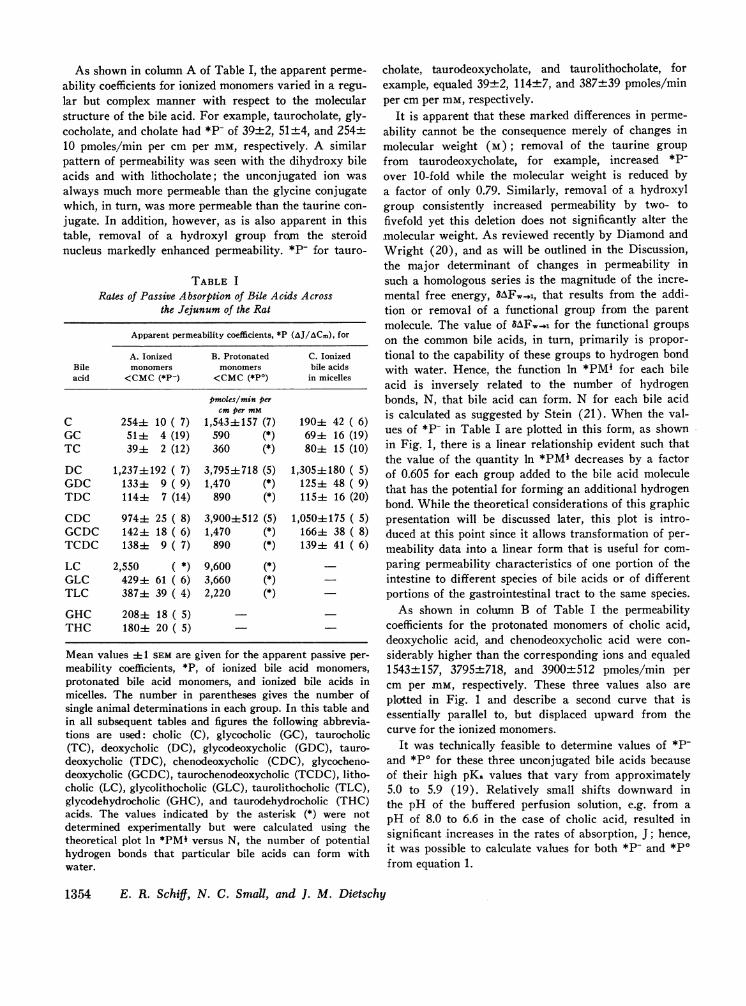
As shown in column A of Table I, the apparent perme-ability coefficients for ionized monomers varied in a regu-lar but complex manner with respect to the molecularstructure of the bile acid. For example, taurocholate, gly-cocholate, and cholate had *P- of 39+2, 51+4, and 254±10 pmoles/min per cm per mm, respectively. A similarpattern of permeability was seen with the dihydroxy bileacids and with lithocholate; the unconjugated ion wasalways much more permeable than the glycine conjugatewhich, in turn, was more permeable than the taurine con-jugate. In addition, however, as is also apparent in thistable, removal of a hydroxyl group from the steroidnucleus markedly enhanced permeability. *P- for tauro-
TABLE IRates of Passive Absorption of Bile Acids Across
the Jejunum of the Rat
Apparent permeability coefficients, *P (AJ/ACm), for
A. Ionized B. Protonated C. IonizedBile monomers monomers bile acidsacid <CMC(*P-) <CMC(*P.) in micelles
pmoles/min percm per mM
C 254± 10 ( 7) 1,543±157 (7) 190± 42 ( 6)GC 51± 4 (19) 590 (*) 69± 16 (19)TC 39± 2 (12) 360 (*) 80±t 15 (10)
DC 1,237+192 ( 7) 3,795±718 (5) 1,305±180 ( 5)GDC 133± 9 ( 9) 1,470 (*) 125+ 48 ( 9)TDC 114± 7 (14) 890 (*) 115± 16 (20)
CDC 974+ 25 ( 8) 3,900±512 (5) 1,050±175 ( 5)GCDC 142+ 18 ( 6) 1,470 (*) 166+ 38 ( 8)TCDC 138± 9 ( 7) 890 (*) 139± 41 ( 6)
LC 2,550 ( *) 9,600 (*)GLC 429± 61 ( 6) 3,660 (*) -TLC 387+ 39 ( 4) 2,220 (*)
GHC 208+ 18 ( 5) -THC 180+ 20 ( 5) -
Mean values ±1 SEMare given for the apparent passive per-meability coefficients, *P, of ionized bile acid monomers,protonated bile acid monomers, and ionized bile acids inmicelles. The number in parentheses gives the number ofsingle animal determinations in each group. In this table andin all subsequent tables and figures the following abbrevia-tions are used: cholic (C), glycocholic (GC), taurocholic(TC), deoxycholic (DC), glycodeoxycholic (GDC), tauro-deoxycholic (TDC), chenodeoxycholic (CDC), glycocheno-deoxycholic (GCDC), taurochenodeoxycholic (TCDC), litho-cholic (LC), glycolithocholic (GLC), taurolithocholic (TLC),glycodehydrocholic (GHC), and taurodehydrocholic (THC)acids. The values indicated by the asterisk (*) were notdetermined experimentally but were calculated using thetheoretical plot In *PMi versus N, the number of potentialhydrogen bonds that particular bile acids can form withwater.
cholate, taurodeoxycholate, and taurolithocholate, forexample, equaled 39+2, 114+7, and 387+39 pmoles/minper cm per mm, respectively.
It is apparent that these marked differences in perme-ability cannot be the consequence merely of changes inmolecular weight (M); removal of the taurine groupfrom taurodeoxycholate, for example, increased *P-over 10-fold while the molecular weight is reduced bya factor of only 0.79. Similarly, removal of a hydroxylgroup consistently increased permeability by two- tofivefold yet this deletion does not significantly alter themolecular weight. As reviewed recently by Diamond andWright (20), and as will be outlined in the Discussion,the major determinant of changes in permeability insuch a homologous series is the magnitude of the incre-mental free energy, BAFw- 1, that results from the addi-tion or removal of a functional group from the parentmolecule. The value of 8AF, -, for the functional groupson the common bile acids, in turn, primarily is propor-tional to the capability of these groups to hydrogen bondwith water. Hence, the function ln *PMI for each bileacid is inversely related to the number of hydrogenbonds, N, that bile acid can form. N for each bile acidis calculated as suggested by Stein (21). When the val-ues of *P- in Table I are plotted in this form, as shownin Fig. 1, there is a linear relationship evident such thatthe value of the quantity In *PMi decreases by a factorof 0.605 for each group added to the bile acid moleculethat has the potential for forming an additional hydrogenbond. While the theoretical considerations of this graphicpresentation will be discussed later, this plot is intro-duced at this point since it allows transformation of per-meability data into a linear form that is useful for com-paring permeability characteristics of one portion of theintestine to different species of bile acids or of differentportions of the gastrointestinal tract to the same species.
As shown in column B of Table I the permeabilitycoefficients for the protonated monomers of cholic acid,deoxycholic acid, and chenodeoxycholic acid were con-siderably higher than the corresponding ions and equaled1543+157, 3795+718, and 3900±512 pmoles/min percm per mm, respectively. These three values also areplotted in Fig. 1 and describe a second curve that isessentially parallel to, but displaced upward from thecurve for the ionized monomers.
It was technically feasible to determine values of *P-and *P° for these three unconjugated bile acids becauseof their high pKa values that vary from approximately5.0 to 5.9 (19). Relatively small shifts downward inthe pH of the buffered perfusion solution, e.g. from apH of 8.0 to 6.6 in the case of cholic acid, resulted insignificant increases in the rates of absorption, J; hence,it was possible to calculate values for both *P- and *P°from equation 1.
1354 E. R. Schiff, N. C. Small, and J. M. Dietschy

The pKa values for the glycine conjugates (3.9 to4.2 [19]) and taurine conjugates (1.8 to 1.9 [19]) areso low, however, that shifts in the pH of the bufferedperfusing solution in the range of 8.0 to 6.0 did not alterJ for these bile acids. The rate of absorption from a 1mMsolution of taurocholic acid, for example, averaged414-3, 38-+-7, and 40±8 pmoles/min per cm for perfu-sates with pH values of 8.0, 7.0, and 6.0, respectively.When the pH of the incubation media was lowered fur-ther in an attempt to determine directly the values of*PO for these substances, there clearly was an alterationin the permeability characteristics of the mucosal mem-brane. Uptake rates, J, from a 1 mmglycocholic acidsolution, for example, equaled 50±)6, 40+3, and 23±6pmoles/min per cm at perfusate pH values of 6.0, 5.5,and 4.5, respectively. Because of these difficulties thevalues of *P° given for the conjugated bile acids incolumn B of Table I are derived from the upper curve inFig. 1 and not from direct experimental determinations.
Effects of micelles in the perfusing media on passivebile acid absorption across the jejunum. The effect ofmicelles in the perfusing buffer on passive bile acid ab-sorption was next undertaken. Since these studies in-volved the infusion of relatively high concentrations ofbile acid, it was necessary to establish that under theconditions of these in vivo experiments such solutions
12-
III
10-
a.*
9-
8-
7-
6-I
\ CDC
DC- \\
\ .DC Ec\ .,*- 1
\ > Protonated Bile Acids% (y= 14.370-0.447x)
, Ionized Bile Acids(y-l3.835-0.605x)
--Vv ,--T6 8 10 12 14
N (number of H bonds)
FIGURE 1 Relationship of apparent permeability coefficients,*P, for ionized and protonated bile acids to their hydrogenbinding capability. In this diagram *P (columns A and Bof Table I) has been multiplied by the square root of themolecular weight (Mi) for each bile acid and the ln ofthis product has been plotted against N, the number ofhydrogen bonds that a particular bile acid monomer canform in water. Values of N were assigned as suggested byStein (21).
o EC. 0
_ E
U) a 200U) ---4) E
_o 0n
-a. E I
T
Fe
0 10 20 30 40
Concentration of GDC, (mM)
T1
50
FIGURE 2 Effect of increasing concentrations of GDC onthe passive absorption of TC. In this study the concentra-tion of the probe molecule, TC, was constant at 1 mMwhile the concentration of GDCwas varied from 5 to 50mM.
did not alter the morphology or inherent permeabilitycharacteristics of the jejunal mucosa. Two types ofstudies were performed. First, histological sections wereprepared from the test segments at times correspondingto the midpoint of the experimental infusion; these werecoded and read independently by a pathologist. No sig-nificant differences in histology were found in thosesegments perfused with buffer alone or with micellarsolutions (including those with other lipid constituents)of all bile acids except deoxycholate. At concentrationsin the range of 4-10 mMthis latter bile acid caused lossof surface epithelium from the tips and for variable dis-tances down the lateral surfaces of the villi. Second,the permeability of the jejunal membrane was testedwith a labeled probe molecule in the presence of micellarsolutions of varying concentration. As shown in Fig. 2,using taurocholate as the probe molecule, AJ/ACm didnot change significantly in the presence of micellar solu-tions of glycodeoxycholate up to 50 mm. Similar resultswere found with other bile acids and indicated that thepresence of micelles in the perfusate under these in vivoconditions did not alter the permeability of the rate-limiting membrane.
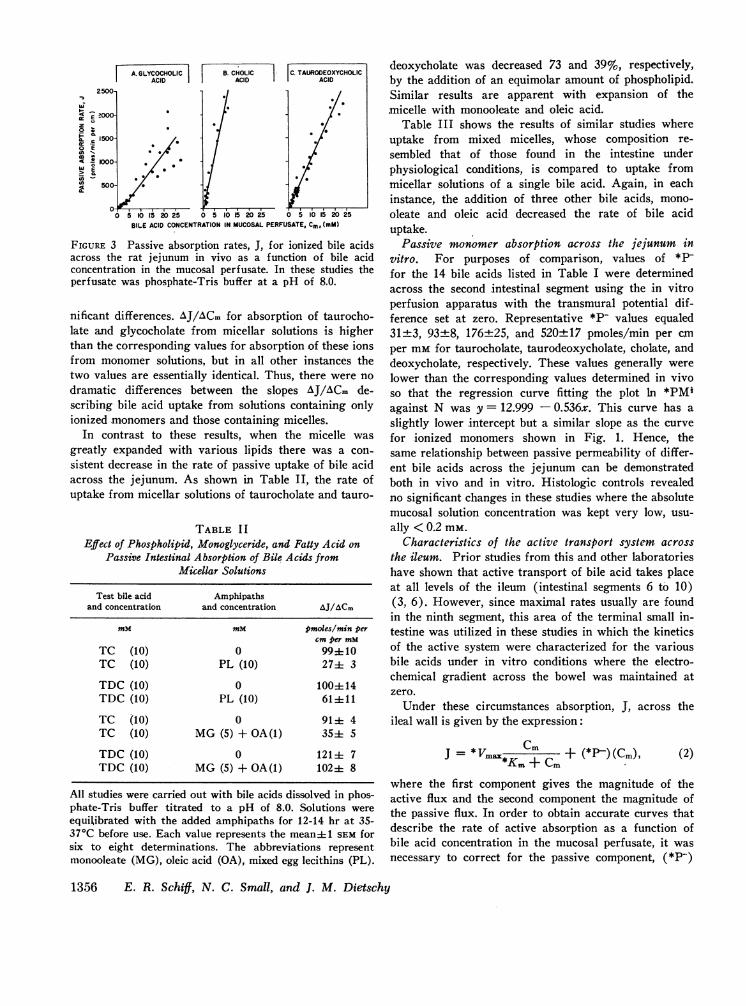
The rates of absorption of three representative bileacids as a function of the concentration of bile acid inthe perfusing media are shown in Fig. 3. For simplicity,these studies were all undertaken at a pH of 8.0 whereessentially only the ionized species was present, andnonionic diffusion could be disregarded. As is apparent,the rate of absorption did not change markedly as theconcentration of bile acid in the buffered perfusion mediawas increased above the CMC. A linear curve was fitted(by the method of least squares) to the points above theCMCfor each bile acid, and the slope of this line (AJ/ACm) is given in column C of Table I. Comparison ofthese values with those in column A reveals few sig-
7Dr. Edward Eigenbrodt, Department of Pathology, TheUniversity of Texas Southwestern Medical Schoolat Dallas.
Bile Acid Transport Mechanisms 1355
A. GLYCOCHOLICACID
25001
!a-
zO
cc-0
IOOC
CL
c 150CT11 loooE
-C-
50C)__
O 5 10 15 20 25
B. CHOLICACID
0 5 10 I5 20 25
C. TAURODEOXYCHOLICACID
0 5 10 15 20 25
BILE ACID CONCENTRATIONIN MUCOSALPERFUSATE, Cm, (mM)
FIGURE 3 Passive absorption rates, J, for ionized bile acidsacross the rat jejunum in vivo as a function of bile acidconcentration in the mucosal perfusate. In these studies theperfusate was phosphate-Tris buffer at a pH of 8.0.
nificant differences. AJ/ACm for absorption of taurocho-late and glycocholate from micellar solutions is higherthan the corresponding values for absorption of these ionsfrom monomer solutions, but in all other instances thetwo values are essentially identical. Thus, there were nodramatic differences between the slopes AJ/ACm de-scribing bile acid uptake from solutions containing onlyionized monomers and those containing micelles.
In contrast to these results, when the micelle wasgreatly expanded with various lipids there was a con-sistent decrease in the rate of passive uptake of bile acidacross the jejunum. As shown in Table II, the rate ofuptake from micellar solutions of taurocholate and tauro-
TABLE IIEffect of Phospholipid, Monoglyceride, and Fatty Acid on
Passive Intestinal Absorption of Bile Acids fromMicellar Solutions
Test bile acid Amphipathsand concentration and concentration AJ/ACm
mM mM Pmoles/min percm per mm
TC (10) 0 99±10TC (10) PL (10) 27± 3
TDC (10) 0 100±14TDC (10) PL (10) 61±11TC (10) 0 91±4 4TC (10) MG(5) + OA(1) 35± 5
TDC (10) 0 121± 7TDC (10) MG(5) + OA(1) 102± 8
All studies were carried out with bile acids dissolved in phos-phate-Tris buffer titrated to a pH of 8.0. Solutions wereequilibrated with the added amphipaths for 12-14 hr at 35-37°C before use. Each value represents the mean± 1 SEM forsix to eight determinations. The abbreviations representmonooleate (MG), oleic acid (OA), mixed egg lecithins (PL).
deoxycholate was decreased 73 and 39%, respectively,by the addition of an equimolar amount of phospholipid.Similar results are apparent with expansion of themicelle with monooleate and oleic acid.
Table III shows the results of similar studies whereuptake from mixed micelles, whose composition re-sembled that of those found in the intestine underphysiological conditions, is compared to uptake frommicellar solutions of a single bile acid. Again, in eachinstance, the addition of three other bile acids, mono-oleate and oleic acid decreased the rate of bile aciduptake.
Passive monomer absorption across the jejunum invitro. For purposes of comparison, values of *P-for the 14 bile acids listed in Table I were determinedacross the second intestinal segment using the in vitroperfusion apparatus with the transmural potential dif-ference set at zero. Representative *P- values equaled31±3, 93±8, 176+25, and 520±17 pmoles/min per cmper mmfor taurocholate, taurodeoxycholate, cholate, anddeoxycholate, respectively. These values generally werelower than the corresponding values determined in vivoso that the regression curve fitting the plot ln *PMIagainst N was y = 12.999 - 0.536x. This curve has aslightly lower intercept but a similar slope as the curvefor ionized monomers shown in Fig. 1. Hence, thesame relationship between passive permeability of differ-ent bile acids across the jejunum can be demonstratedboth in vivo and in vitro. Histologic controls revealedno significant changes in these studies where the absolutemucosal solution concentration was kept very low, usu-ally < 0.2 mM.
Characteristics of the active transport system acrossthe ileum. Prior studies from this and other laboratorieshave shown that active transport of bile acid takes placeat all levels of the ileum (intestinal segments 6 to 10)(3, 6). However, since maximal rates usually are foundin the ninth segment, this area of the terminal small in-testine was utilized in these studies in which the kineticsof the active system were characterized for the variousbile acids under in vitro conditions where the electro-chemical gradient across the bowel was maintained atzero.
Under these circumstances absorption, J, across theileal wall is given by the expression:
J = *V Cmx+( P)(M*Km + Cm+ (*)(Cm), (2)
where the first component gives the magnitude of theactive flux and the second component the magnitude ofthe passive flux. In order to obtain accurate curves thatdescribe the rate of active absorption as a function ofbile acid concentration in the mucosal perfusate, it wasnecessary to correct for the passive component, (*P-)
1356 E. R. Schiff, N. C. Small, and J. M. Dietschy
C
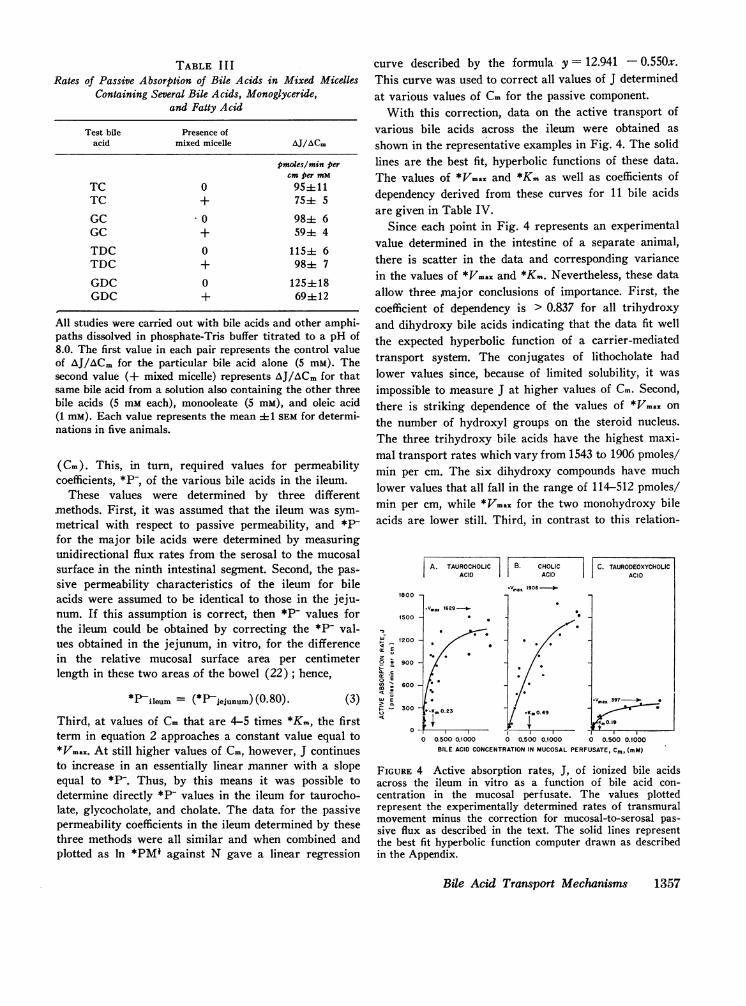
TABLE I I IRates of Passive Absorption of Bile Acids in Mixed Micelles
Containing Several Bile Acids, Monoglyceride,and Fatty Acid
Test bile Presence ofacid mixed micelle AJ/ACm
pmoles/min percm per mM
TC 0 95:411TC + 75±4 5
GC 0 98± 6GC + 59± 4
TDC 0 115± 6TDC + 98± 7
GDC 0 125±18GDC + 69412
All studies were carried out with bile acids and other amphi-paths dissolved in phosphate-Tris buffer titrated to a pH of8.0. The first value in each pair represents the control valueof AJ/ACm for the particular bile acid alone (5 mM). Thesecond value (+ mixed micelle) represents AJ/ACm for thatsame bile acid from a solution also containing the other threebile acids (5 mmeach), monooleate (5 mM), and oleic acid(1 mM). Each value represents the mean ±41 SEMfor determi-nations in five animals.
(Cm). This, in turn, required values for permeabilitycoefficients, *P-, of the various bile acids in the ileum.
These values were determined by three differentmethods. First, it was assumed that the ileum was sym-metrical with respect to passive permeability, and *P-for the major bile acids were determined by measuringunidirectional flux rates from the serosal to the mucosalsurface in the ninth intestinal segment. Second, the pas-sive permeability characteristics of the ileum for bileacids were assumed to be identical to those in the jeju-num. If this assumption is correct, then *P- values forthe ileum could be obtained by correcting the *P- val-ues obtained in the jejunum, in vitro, for the differencein the relative mucosal surface area per centimeterlength in these two areas of the bowel (22); hence,
*P-ileum = (*P jejunum) (0.80). (3)
Third, at values of C. that are 4-5 times *Km, the firstterm in equation 2 approaches a constant value equal to*V.a.. At still higher values of Cm, however, J continuesto increase in an essentially linear manner with a slopeequal to *P-. Thus, by this means it was possible todetermine directly *P- values in the ileum for taurocho-late, glycocholate, and cholate. The data for the passivepermeability coefficients in the ileum determined by thesethree methods were all similar and when combined andplotted as In *PMi against N gave a linear regression
curve described by the formula y = 12.941 - 0.550x.This curve was used to correct all values of J determinedat various values of Cm for the passive component.
With this correction, data on the active transport ofvarious bile acids across the ileum were obtained asshown in the representative examples in Fig. 4. The solidlines are the best fit, hyperbolic functions of these data.The values of *VVmna and *Km as well as coefficients ofdependency derived from these curves for 11 bile acidsare given in Table IV.
Since each point in Fig. 4 represents an experimentalvalue determined in the intestine of a separate animal,there is scatter in the data and corresponding variancein the values of *Vmax and *Km. Nevertheless, these dataallow three major conclusions of importance. First, thecoefficient of dependency is > 0.837 for all trihydroxyand dihydroxy bile acids indicating that the data fit wellthe expected hyperbolic function of a carrier-mediatedtransport system. The conjugates of lithocholate hadlower values since, because of limited solubility, it was
impossible to measure J at higher values of Cm. Second,there is striking dependence of the values of *V.a. on
the number of hydroxyl groups on the steroid nucleus.The three trihydroxy bile acids have the highest maxi-mal transport rates which vary from 1543 to 1906 pmoles/min per cm. The six dihydroxy compounds have muchlower values that all fall in the range of 114-512 pmoles/min per cm, while *Vmax for the two monohydroxy bileacids are lower still. Third, in contrast to this relation-
A. TAUROCHOLIC |B. CHOLIC C. TAURODEOXYCHOLICACID ACID ACID
,Vmox 1906 10
0i_iz E
0 0W- E
a: e
m "co:
wJ E?
180U-_
'Vmax 1629 _
1500 0
1200
900
30 .K. 0.23 / KMO.49
0 0.500 0.1000 0 0.500 0.1000 0 0. 500 0.1i000BILE ACID CONCENTRATIONIN MUCOSALPERFUSATE, Cmn, (mM)
FIGURE 4 Active absorption rates, J, of ionized bile acidsacross the ileum in vitro as a function of bile acid con-centration in the mucosal perfusate. The values plottedrepresent the experimentally determined rates of transmuralmovement minus the correction for mucosal-to-serosal pas-sive flux as described in the text. The solid lines representthe best fit hyperbolic function computer drawn as describedin the Appendix.
Bile Acid Transport Mechanisms 1357

TABLE IVApparent Kinetic Characteristics of the Active Transport System
for Bile Acids Across the Ileum of the Rat
Bile Coefficient ofacid dependency *Vmax *Km
pmoles/min mmper cm
C 0.909 1906±462 0.49±0.26GC 0.853 1543±326 0.18±0.10TC 0.897 1629±236 0.23±0.07
DC 0.861 224±169 0.37±0.16GDC 0.837 114± 32 0.16±0.20TDC 0.985 397±4 27 0.19±0.04
CDC 0.850 512±i150 0.38±0.08GCDC 0.890 173± 40 0.21±0.06TCDC 0.994 337i 13 0.12±0.01
GLC 0.500 454 8 0.09±0.04TLC 0.550 57± 21 0.09±0.07
Mean values ±-1 SEM for apparent values for * V and *Kmfor the active transport of various bile acids. The coefficientof dependency describes the fit of the experimental data toa hyperbolic curve assuming that the rate of transport equalszero where the bile acid concentration is zero.
ship between nuclear hydroxyl groups and *V.a., thevalues of *Km are independent of the number of hydroxylgroups but are apparently related to the presence or ab-sence of a conjugated group at the C24 position. *Kmfor the three unconjugated bile acids cholate, deoxy-cholate, and chenodeoxycholate, for example, were highand in the range of 0.37-0.49 mm. All conjugated bileacids, on the other hand, had values < 0.23 mm.
Histologic controls also were performed in these stud-ies and showed no differences between segments incu-bated with bile acids and those incubated in buffer aloneexcept for deoxycholate at concentrations > 0.75 mm.With this bile acid there again was spotty loss of somesurface epithelium.
Since data in everted gut sacs have shown a gradientof increasing apparent active transport down the lengthof the ileum (3, 6), it was of interest to determinewhether this was due to a difference in *Vm.. or *Kmfor bile acid transport at different levels of the terminalsmall intestine. Using the seventh intestinal segment*V... and *Km for taurocholate was determined to equal405±72 pmoles/min per cm and 0.21±0.05 mM, respec-tively. Hence, the higher rate of transport in the ninth in-testinal segment clearly was a manifestation of a highermaximal transport rate and not a difference in apparentaffinity of the carrier for the molecule.
A limited number of observations were carried outin vivo to quantitate values of *Vmax; for taurocholateand taurodeoxycholate maximal transport rates averaged
1450 (n = 3) and 425 (n = 3) pmoles/min per cm, re-spectively. Thus, as in the case of passive absorption,there is reasonably good agreement between the valuesobtained in vitro and in vivo.
Characterization of passive monomer absorption acrossthe transverse colon. Experiments performed in thislaboratory both in the everted gut sac and in the in vitroperfusion apparatus have shown the colon is unable totransport bile acids against an electrochemical gradient ;8these findings confirm earlier reports that colon doesnot contain an active transport mechanism (8). In vivoexperiments, therefore, were undertaken to quantify thepassive permeability coefficients of bile acids in thecolon. In the representative bile acids taurocholate, tauro-deoxycholate, glycodeoxycholate, and cholate, for ex-ample, mean values of 12+2, 40+8, 75±14, and 180±9pmoles/min per cm per mm, respectively, were found.When values for the nine common tri- and dihydroxybile acids were plotted as In *PMI against N a linearregression curve was obtained that equaled y = 12.912-0.612x.
DISCUSSION
In previous publications from this laboratory the spe-cific transport mechanisms operative in the absorptionof bile acids from the small and large bowel have beenreviewed (6, 1 1); these mechanisms include passiveionic and nonionic absorption, which takes place at alllevels of the gastrointestinal tract, and active absorption,which occurs only in the ileum. The study of bile acidtransport is more complex than the study of many otherwater soluble compounds that exist in solution as asingle species where molecular activity can be approxi-mately equated to simple concentration. Since bile acidsmay exist in solution as ionized and protonated monomersor in complex micells, it is important to quantitate thetransport characteristics of each of these species and todifferentiate events in the bulk water phase from thosein the lipid cell membrane that may cause alterations inrates of transport.
Using paired experiments in which absorption of bileacid was measured from perfusates of two different pHvalues, apparent passive permeability coefficients, *P,were determined for the ionized and protonated mono-mers of the major conjugated and unconjugated bileacids. Use of such a technique obviates the possibilitythat the observed uptake actually represented exclusiveabsorption of the protonated species present in verysmall amounts even in relatively alkaline perfusates. Thevalues of *P- and *P° in Table I vary in a regularmanner with respect to three alterations in molecularstructure: (a) the presence of a negative charge reduces
8Unpublished observations from this laboratory.
1358 E. R. Schiff, N. C. Small, and J. M. Dietschy

permeability by a factor of approximately 4.4; (b) con-jugation of bile acids with glycine or taurine lowers per-meability on the average by a factor of 6.8 and 8.1, re-spectively; and (c) addition of a nuclear hydroxyl groupdecreases permeability by a mean factor of 3.4.
Theoretically, passive absorption of bile acids mighttake place by diffusion through polar regions of thecell surface, by diffusion across the lipid phase of thecell membrane or by some type of passive, facilitateddiffusion. However, we previously have shown that thereis no evidence of carrier-mediated diffusion and thatosmotically induced water flow does not significantlyalter the rate of passive bile acid absorption across thejejunum (6); hence, absorption of these molecules musttake place by diffusion through the lipid cell membrane.If this is the case, then the variations in permeabilityrates among the different bile acids noted above mustbe explicable in terms of the intramolecular forces thatdetermine solute: water and solute: lipid interactions.
Under conditions where membrane penetration islimited by the rate of diffusion through the membraneinterior (20),
p ( AFw-*1/RT (4)
where P is the permeability coefficient, D the diffusionconstant, d the thickness of the cell membrane, AFw-1 thefree energy change in transferring 1 mole of bile acidfrom the perfusate to the lipid cell membrane, R thegas constant, and T the absolute temperature. Assumingthat in these studies d remains constant and D is in-versely proportional to MI (21) then the quantity ln*PMI will be proportional to AFw.1. In the bile acidseries alterations in AFwT 1 caused by the addition ofvarious functional groups to the molecule primarily arerelated to the number of hydrogen bonds that these re-spective groups can form with water. Hence, as shownin Fig. 1, in the case of ionized monomers there is alinear inverse relationship between the quantity ln *PMiand N. For the addition of each potential hydrogen bondln *PMI is reduced by a factor of 0.605; thus, for ex-ample, the addition of each hydroxyl group (N = 2) toa bile acid, decreases *PMI by 3.35.
It is of interest that the regression curves (ln *PMiagainst N) that describe passive permeability of theileum and colon, y = 12.941 - 0.550x and y = 12.912- 0.612x, respectively, are similar to the one for thejejunum (y = 13.835 - 0.605x). The decrease in y in-tercepts between the jejunum and the ileum and colonvery likely represents only a decrease in relative mucosalsurface area per unit length of intestine in these areasof the bowel. The similar slopes, however, indicate thatthe permeability characteristics of these regions with
respect to passive bile acid absorption are essentiallyidentical.
As also shown in Fig. 1, removal of the negativecharge results in a second curve that is displaced upwardbut is parallel to the curve for ionized bile acid. Thus, a
protonated bile acid is more permeable than the corre-
sponding ion but the pattern of relative permeabilityamong the various protonated bile acids is the same as
that for the ionized species. It can be predicted fromthese two curves that a series of bile acids with twonegative charges would have very low permeability coeffi-cients that would describe a third curve with the approxi-mate formula, y = 13.3 - 0.60x.
As outlined by Diamond and Wright in their compre-hensive analysis of the determinants of cell membranepermeation, the change in AFT..1, i.e. the incrementalfree energy of solution, 5AFF..1, caused by the addition ofa functional group to a molecule can be calculated fromthe permeability coefficients of the two species using theequation (20):
6AFWol = - (RT)(lnp) (5)
where P+ and P0 are the permeability coefficients forthe molecule with and without the substituent group,respectively. Using the *P from this study, mean valuesof 8AP, 1 for the hydroxyl, glycine, and taurine groupsequal + 757, + 1178, and + 1291 cal/mole, respectively.Hence, these results are in general agreement with thosereported by Diamond and Wright in that the additionof any substituent group (except for -CH2-in theirseries) is associated with a positive value of &AFw-l anda corresponding decrease in permeability through the cellmembrane.
The effect of micelles in the mucosal perfusate on therate of bile acid absorption is particularly relevant tothe physiological situation that exists in vivo during di-gestion. From the data presented in Tables I (column C),II, and III, two generalizations are possible: first, AJ/AC does not abruptly fall as the concentration of bileacid in the bulk perfusate is raised above the CMC, andsecond, expansion of micelle size by the addition of non-
bile acid constituents decreases the rate of bile acid ab-sorption. If one assumes that only the bile acid monomer
penetrates the cell membrane then the first result is sur-
prising since J should equal the product of *P times theconcentration of monomer in the perfusate. Since theconcentration of monomer approaches a constant valuein solutions above the CMC, J also should plateau at aconstant value. This finding could be explained by as-suming either that the mucosal cell is capable of absorb-ing the intact mricelle or that there is a diffusion barrierpresent between the bulk water phase of the perfusate
Bile Acid Transport Mechanisms 1359

and the cell membrane. While the current snot designed to answer this important questi(published preliminary data indicating thatexplanation is the correct one (23-25).
One other feature of passive penetrationtestine also deserves emphasis. When theperfusate was decreased from 6.0 to 4.5, appa
ability coefficients decreased significantly. '
vation is similar to that described previouslyLeaf, and Schwartz (26) in the toad bladWright and Diamond (27) in the gall bladdecell membrane was shown to become less pvarious probe molecules as the pH of the pc
lowered to near 4.0. It is apparent, thereforein pH may alter rates of passive absorptionducing changes in the bulk phase solution,the relative concentration of the ionized anc
forms of weak acids and bases, and by effectmeability characteristics of the membrane its
The kinetics of the ileal active transportthose of passive absorption, are strikingly dmolecular structure. This is best shown in Fithe value of *V.a. for each bile acid has Iagainst its respective *Km. Statistical analscribed -in the Appendix, reveals a significarof values as indicated by the dashed lines.show two major relationships. First, *Vmis determined by the number of hydroxyl grsteroid nucleus but is independent of whet]acid is conjugated or not; hence, *Vmax fodroxy acids > > dihydroxy > monohydroxy.contrast, *Km values primarily depend on whoposition is conjugated, but are independentber of nuclear hydroxyl groups, thus the *JX
0.5
0.4
E0.2
40 60 100 200 400 600 1000
*Vmax(pmoles/min per cm)2000
FIGURE 5 Relationship between *Km and *Vmthe active transport of bile acid across thedashed lines delineate clusters of data that are
different from one another according to the staods outlined in the Appendix. *Vma. was plotscale to compress the x axis.
studies were the conjugated bile acids are about half the value of theon, we have unconjugated bile acids. Hence, it is of interest thatt the latter this active ileal transport system apparently absorbs most
avidly those bile acids that are least absorbed by passiveof the in- mechanisms so that the active and passive systems com-
pH of the plement one another and bring about nearly complete ab-Lrent perme- sorption of bile acid from the small intestinal contents.This obser- Having defined in detail the characteristics of they by Rosen, several absorptive mechanisms for bile acid it is pos-lder and by sible to define, in general terms, the interaction of these!r where the mechanisms in the intact animal and, presumably, in man.)ermeable to First, bile acid absorption across the jejunum is passiveerfusate was and due to a combination of ionic and nonionic diffusion.-, that shifts The quantitative importance of these two processes forboth by pro- any bile acid depends upon the pH of the luminal con-i.e. altering tents and upon the relative values of *P, *P0, and the
I protonated pKa for that bile acid. To simplify these comparisons,ming the per- the latter three values may be used to calculate a single
self. term, the pH', that gives the pH for a particular bilesystem, like acid at which the passive ionic and nonionic absorption[ependent on rates will be exactly equal. The approximate values ofrig. 5 where pH` for the common bile acids in dilute solutions arebeen plotted taurocholic acid, 2.8; taurodeoxycholic acid, 2.8; tauro-
lysis, as de- chenodeoxycholic acid, 2.7; glycocholic acid, 5.0; glyco-nt clustering deoxycholic acid, 5.7; glycochenodeoxycholic acid, 5.2;These data cholic acid, 5.8; deoxycholic acid, 5.8; and chenodeoxy-
as primarily cholic acid, 6.5. At pH values < pH' nonionic absorp-roups on the tion becomes the dominant process. The pH in the je-her the bile junum would have to drop below 2.7-2.8 before signifi-,r the trihy- cant nonionic absorption of the taurine conjugates could
Second, in take place; hence, absorption of these conjugated bileether the C2 acids must be exclusively via passive ionic diffusion. Onof the num- the other hand, the pH' values for the glycine conju-
for all of gates are within the pH range encountered physiologi-cally, at least in the proximal portion of the jejunum,so that nonionic absorption of these bile acids is possible;however, more distally in the jejunum the pH is abovethe pH' values for even the glycine conjugates so that
UNCONJUGATEL ionic diffusion again becomes the dominant process inthis area of the bowel.
Second, the presence of mixed micelles containingvarious lipids markedly reduces the rate of absorptionof bile acids (Tables II and III). Thus, permeability co-
efficients determined in simple, dilute solutions cannot beCONJUGATED extrapolated to estimate the quantity of bile acids ab-
sorbed across the jejunum under physiological conditionsas we previously have attempted to do (6). The factsthat the jejunum normally contains only conjugated bileacids, that conditions are such that only passive ionic
ax values for diffusion (and a limited amount of nonionic diffusion inileum. The the case of the glycine conjugates) takes place, and thatsignificantly large mixed micelles containing lipid are present readily
Lteidton alothg explains the comparatively low rate of bile acid absorp-tion in the proximal small intestine. Yet, it should be
1360 E. R. Schiff, N. C. Small, and J. M. Dietschy
MONO- DIHYDROXY TRIHYDROXYHYDROXY
50 _ CD
40
CD
20 - GADO1
Aoe
0.

emphasized that currently there are no quantitative dataon the extent of bile acid absorption across the jejunumunder physiological conditions.
Third, in the ileum passive ionic, passive nonionic, andactive absorption all take place. Passive ionic absorptionpresumably would increase with the removal of lipidfrom the mixed micelle. Unconjugated bile acids areformed at this level of bowel and because of their higherpH' values their presence provides a means for somenonionic bile acid absorption to occur despite the rela-tively high pH in this region. Active absorption alsotakes place with the highest maximal transport velocities(V.a.) being for the conjugated trihydroxy bile acids.It should be emphasized that the *Km of this system isso low (approximately 0.2 mmfor the conjugated bileacids) that essentially *V.a. velocities will continue evenwhen the intraluminal concentration of bile acid hasdropped to levels as low as 0.5-1.0 mm.
Fourth, within the colon presumably only passive ionicabsorption takes place. Nevertheless, since the predomi-nant bile acids in the colonic contents (deoxycholateand lithocholate) have relatively high *P- values it istheoretically possible that the rate of such passive ab-sorption might be considerable. However, if the bile acidsare precipitated (e.g. lithocholate) or bound to par-ticulate matter in the stool then only small amounts ofbile acid would be present in stool water and the rate ofabsorption would be correspondingly low.
One final point regarding these studies requires em-phasis. The values of the apparent permeability coeffi-cients and those of *Vmax and *Km reported here ac-curately describe the passive and active permeabilitycharacteristics of the intestinal membrane of the rat asit exists in vitro and in vivo. Accordingly, these valuesare useful in understanding the various transport phe-nomena operative in maintenance of the enterohepaticcirculation of bile acid. Recently, however, we haveshown that the resistance encountered by a moleculeas it is absorbed into the mucosal cell is composed of twocomponents: a resistance that is engendered by the lipidcell membrane and another resistance that is the resultof an unstirred layer adjacent to the membrane (23-25).Hence, the data reported here represent the kineticcharacteristics of the "resisting membrane," i.e. lipidmembrane plus unstirred water layer, and therefore,they cannot be construed as the kinetic parameters ofthe lipid cell membrane itself. Because of this situationit is to be anticipated that the *P values are lower thanthe permeability coefficients of the lipid membrane, thatthe calculated values of 8AFw 1 are underestimates of theactual values, and that the values of *Km are higher thanthe Michaelis constants of the carrier in the membrane.
APPENDIX
The following method, formulated by Dr. Wanzer Drane (theBiostatistics Department, University of Texas SouthwesternMedical School, Dallas, Tex.), was used for a statistical analy-sis of the curves describing the active absorption of bile acidin the ileum.
The formula for an equilateral hyperbola (the inverse law)which when plotted includes the origins (0,0) is
*V [S]V *Km + [S]
where J is the rate of absorption (picomoles/minute percentimeter), * V,,, the apparent maximal transport rate(picomoles/minute per centimeter), *Km the apparentMichaelis constant (millimolars), and [S] the concentrationof bile acid in the perfusate (millimolars). This is the wellknown Michaelis-Menten equation. It can be seen that when[S] = *Km then
-*= V *Kmma*Km+ *Km
*= ma12X
and when [S] increases without limit [S]/(*K + [S]) ap-proaches unity and J approaches * Va.
Of several methods fitting this equation to data the onechosen is the method of least squares. That is, if Ji is the ithresponse to a corresponding substrate concentration [S]i,then over a set of n such response-substrate pairs, the function
SSE(V,K) = - VKV ]ES )
is evaluated for different (V,K) pairs until the smallest valueSSE(VK) is found. The (V,K) pair corresponding to theminimum of SSE(V,K) are * Vma. and *Km, respectively.Since Ji - *Vma[S]i/(*Km + [S]D is a deviation ofthe actual response Ji from the theoretical response*Vmax[S]i/(*Km + [Sli), SSE(*Km,*Vmx) is the sum ofsquared deviations and to make SSE(V,K) a minimum is tofind the "least squares" value of the pair (*Vm,,~*Km). Fora more detailed exposition see Mounter and Turner (28) andDraper and Smith (29).
Plotting (*Vmax,*Km) as indicated in Fig. 5, indicates abilateral separation of the points into five groups as denotedby the dashed lines. Making use of the large sample statisticalproperties of the least square estimates (* Vmax,*Km), Duncan'snew multiple range test was twice employed firstly on theseveral * Vmax and secondly on the corresponding *Km (30-32).The dashed lines separate those points which are significantlyseparated. We have taken this to be evidence of clusteringor grouping as indicated.
ACKNOWLEDGMENTSThe authors wish to acknowledge with appreciation thatDr. Donald M. Small, Boston, Mass., made available manu-scripts containing recently determined values of bile acidpKa's, CMC's, etc. before these were published.
This work was supported by research grant HE-09610and training grant T01-AM-5490. Dr. Neal C. Small, whowas a medical student at The University of Texas South-western Medical School during these studies, was supportedby funds from a grant from the John and Mary MarkleFoundation.
Bile Acid Transport Mechanisms 1361

REFERENCES
1. Searle, G. W., and R. D. Baker. 1956. Bile salt absorp-tion in the small intestine. Fed. Proc. 15: 166.
2. Webling, D. D'A. 1966. The site of absorption of tauro-cholate in chicks, using polyethylene glycol as a refer-ence substance. Aust. J. Exp. Biol. Med. Sci. 44: 101.
3. Lack, L., and I. M. Weiner. 1961. In vitro absorption ofbile salts by small intestine of rats and guinea pigs.Amer. J. Physiol. 200: 313.
4. Tidball, C. S. 1964. Intestinal and hepatic transport ofcholate and organic dyes. Amer. J. Physiol. 206: 239.
5. Sullivan, M. F. 1965. Bile salt absorption in the ir-radiated rat. Amer. J. Physiol. 209: 158.
6. Dietschy, J. M., H. S. Salomon, and M. D. Siperstein.1966. Bile acid metabolism. I. Studies on the mechanismsof intestinal transport. J. Clin. Invest. 45: 832.
7. Playoust, M. R., and K. J. Isselbacher. 1964. Studies onthe transport and metabolism of conjugated bile salts byintestinal mucosa. J. Clin. Invest. 43: 467.
8. Holt, P. R. 1964. Intestinal absorption of bile salts inthe rat. Amer. J. Physiol. 207: 1.
9. Lack, L., and I. M. Weiner. 1966. Intestinal bile salttransport: structure-activity relationships and otherproperties. Amer. J. Physiol. 210: 1142.
10. Heaton, K. W., and L. Lack. 1968. Ileal bile salt trans-port: mutual inhibition in an in vivo system. Amer. J.Physiol. 214: 585.
11. Dietschy, J. M. 1968. Mechanisms for the intestinalabsorption of bile acids. J. Lipid Res. 9: 297.
12. Hofmann, A. F. 1962. Thin-layer adsorption chroma-tography of free and conjugated bile acids and silicicacid. J. Lipid Res. 3: 127.
13. Gregg, J. A. 1966. New solvent systems for thin-layerchromatography of bile acids. J. Lipid Res. 7: 579.
14. Vogel, A. I. 1956. Practical Organic Chemistry. Long-mans, Green and Company, New York. 3rd edition.
15. Bray, G. A. 1960. A simple efficient liquid scintillatorfor counting aqueous solutions in a liquid scintillationcounter. Anal. Biochem. 1: 279.
16. Parkinson, T. M., and J. A. Olson. 1963. Inhibitoryeffects of bile acids on the uptake, metabolism, andtransport of water-soluble substances in the small in-testine. Life Sci. 2: 393.
17. Dietschy, J. M. 1967. Effects of bile salts on intermedi-ate metabolism of the intestinal mucosa. Fed. Proc. 26:1589.
18. Low-Beer, T. S., R. E. Schenider, and W. 0. Dobbins.1970. Morphological changes of the small-intestinalmucosa of guinea pig and hamster following incubationin vitro and perfusion in vivo with unconjugated bilesalts. Gut. 11: 486.
19. Small, D. M. 1971. The physical chemistry of cholanicacids. In The Bile Acids. D. P. Nair, and D. Kritchev-sky, editors. Plenum Publishing Corporation, New York.1: 247.
20. Diamond, J. M., and E. M. Wright. 1969. Biologicalmembranes: the physical basis of ion and nonelectrolyteselectivity. Annu. Rev. Physiol. 31: 581.
21. Stein, W. D. 1967. The Movement of Molecules AcrossCell Membranes. Academic Press Inc., New York.
22. Boyne, R., B. F. Fell, and I. Robb. 1966. The surfacearea of the intestinal mucosa in the lactating rat. J.Physiol. 183: 570.
23. Wilson, F. A., and J. M. Dietschy. 1971. The role ofmicelle uptake during bile acid and fat absorption bythe intestinal mucosa. Clin. Res. 19: 406.
24. Sallee, V. L., and J. M. Dietschy. 1971. The role of bileacid micelles in absorption of fatty acids across theintestinal brush border. J. Clin. Invest. 50: 80a. (Abstr.)
25. Wilson, F. A., V. L. Sallee, and J. M. Dietschy. 1971.Unstirred water layers in intestine: rate determinant offatty acid absorption from micellar solutions. Science(Washington). 174: 1031.
26. Rosen, H., A. Leaf, and W. B. Schwartz. 1964. Diffu-sion of weak acids across the toad bladder. J. Gen.Physiol. 48: 37/9.
27. Wright, E. M., and J. M. Diamond. 1969. Patterns ofnon-electrolyte permeability. Proc. Roy. Soc. Ser. B.Biol. Sci. 172: 227.
28. Mounter, L. A., and M. E. Turner. 1963. The evaluationof Michaelis constants and maximal velocity kineticstudies of enzymic reactions. Enzymol. Acta Biocatal.25: 225.
29. Draper, N. R., and H. Smith. 1967. Applied RegressionAnalysis. John Wiley & Sons, Inc., New York.
30. Duncan, D. B. 1951. A significance test for differencesbetween ranked treatments in an analysis of variance.Va. J. Sci. 2: 171.
31. Duncan, D. B. 1955. Multiple range and multiple Ftests. Biometrics. 11: 1.
32. Harter, H. L. 1960. Critical values for Duncan's newmultiple range test. Biometrics. 16: 671.
1362 E. R. Schiff, N. C. Small, and J. M. Dietschy