Embed Size (px)
Citation preview
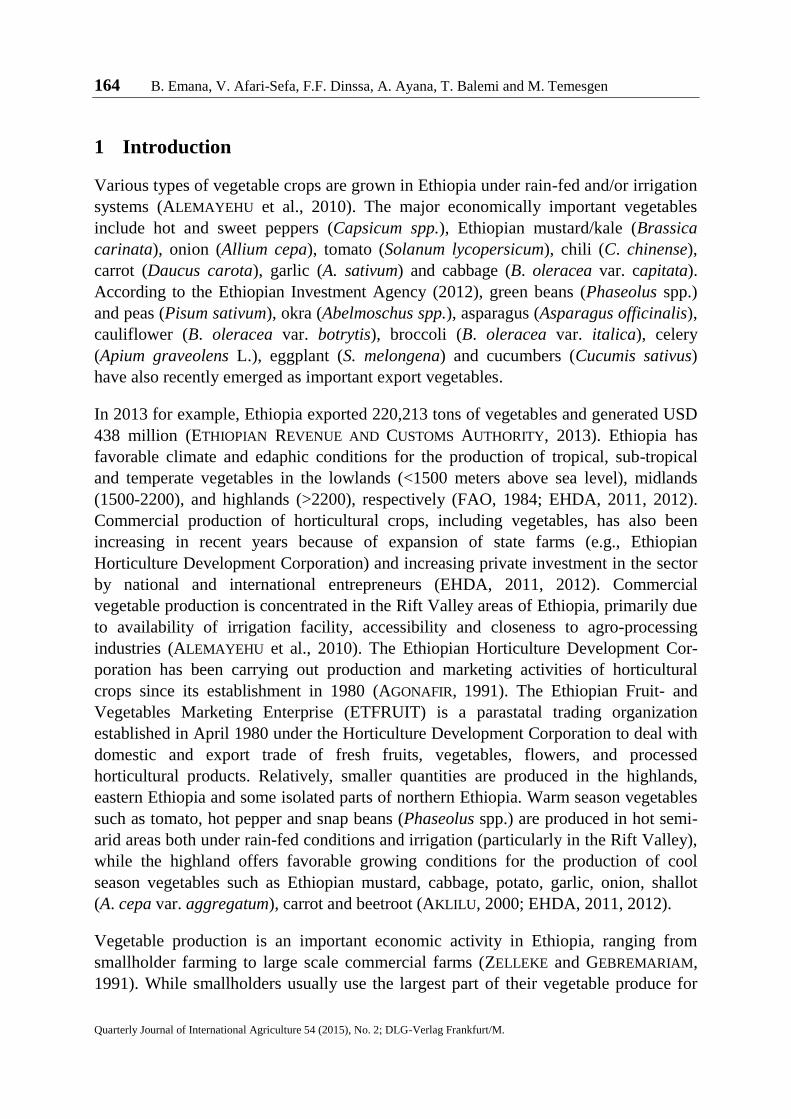
Quarterly Journal of International Agriculture 54 (2015), No. 2: 163-187
Quarterly Journal of International Agriculture 54 (2015), No. 2; DLG-Verlag Frankfurt/M.
Characterization and Assessment of
Vegetable Production and Marketing Systems
in the Humid Tropics of Ethiopia
Bezabih Emana
HEDBEZ Business & Consultancy PLC, Addis Ababa, Ethiopia
Victor Afari-Sefa and Fekadu F. Dinssa
The World Vegetable Center (AVRDC), Eastern and Southern Africa,
Arusha, Tanzania
Amsalu Ayana, Tesfaye Balemi and Milkessa Temesgen
HEDBEZ Business & Consultancy PLC, Addis Ababa, Ethiopia
Abstract
Vegetables are sources of vitamins, minerals and income for those involved in
production and marketing. Having first-hand information about vegetable production
and marketing system is essential to devise appropriate strategies aimed at enhancing
vegetable value chain development. It was in line with this view that a study was
conducted to characterize vegetable production and marketing systems at selected sites
in the humid tropics of Ethiopia. Data were collected using participatory primary
survey techniques augmented with secondary data. While the area cultivated to
vegetables has been increasing over the years due to increasing consumer demand,
average yields are far below potential. Major vegetable production and marketing
constraints include: lack of access to improved variety seeds, high postharvest losses,
lack of reliable market information systems, low bargaining power of farmers, low
technological know-how for value chain development and upgrading, all indicating
critical areas of intervention. Increasing public awareness the nutritional importance of
vegetables will critically help in reducing malnutrition while increasing smallholder
household income.
Keywords: vegetable value chains, integrated farming system, farming systems
diversification, vegetable productivity, vegetable marketing, Ethiopia
JEL: D01, D13, Q10, Q11, Q12, Q13, Q15
164 B. Emana, V. Afari-Sefa, F.F. Dinssa, A. Ayana, T. Balemi and M. Temesgen
Quarterly Journal of International Agriculture 54 (2015), No. 2; DLG-Verlag Frankfurt/M.
1 Introduction
Various types of vegetable crops are grown in Ethiopia under rain-fed and/or irrigation
systems (ALEMAYEHU et al., 2010). The major economically important vegetables
include hot and sweet peppers (Capsicum spp.), Ethiopian mustard/kale (Brassica
carinata), onion (Allium cepa), tomato (Solanum lycopersicum), chili (C. chinense),
carrot (Daucus carota), garlic (A. sativum) and cabbage (B. oleracea var. capitata).
According to the Ethiopian Investment Agency (2012), green beans (Phaseolus spp.)
and peas (Pisum sativum), okra (Abelmoschus spp.), asparagus (Asparagus officinalis),
cauliflower (B. oleracea var. botrytis), broccoli (B. oleracea var. italica), celery
(Apium graveolens L.), eggplant (S. melongena) and cucumbers (Cucumis sativus)
have also recently emerged as important export vegetables.
In 2013 for example, Ethiopia exported 220,213 tons of vegetables and generated USD
438 million (ETHIOPIAN REVENUE AND CUSTOMS AUTHORITY, 2013). Ethiopia has
favorable climate and edaphic conditions for the production of tropical, sub-tropical
and temperate vegetables in the lowlands (<1500 meters above sea level), midlands
(1500-2200), and highlands (>2200), respectively (FAO, 1984; EHDA, 2011, 2012).
Commercial production of horticultural crops, including vegetables, has also been
increasing in recent years because of expansion of state farms (e.g., Ethiopian
Horticulture Development Corporation) and increasing private investment in the sector
by national and international entrepreneurs (EHDA, 2011, 2012). Commercial
vegetable production is concentrated in the Rift Valley areas of Ethiopia, primarily due
to availability of irrigation facility, accessibility and closeness to agro-processing
industries (ALEMAYEHU et al., 2010). The Ethiopian Horticulture Development Cor-
poration has been carrying out production and marketing activities of horticultural
crops since its establishment in 1980 (AGONAFIR, 1991). The Ethiopian Fruit- and
Vegetables Marketing Enterprise (ETFRUIT) is a parastatal trading organization
established in April 1980 under the Horticulture Development Corporation to deal with
domestic and export trade of fresh fruits, vegetables, flowers, and processed
horticultural products. Relatively, smaller quantities are produced in the highlands,
eastern Ethiopia and some isolated parts of northern Ethiopia. Warm season vegetables
such as tomato, hot pepper and snap beans (Phaseolus spp.) are produced in hot semi-
arid areas both under rain-fed conditions and irrigation (particularly in the Rift Valley),
while the highland offers favorable growing conditions for the production of cool
season vegetables such as Ethiopian mustard, cabbage, potato, garlic, onion, shallot
(A. cepa var. aggregatum), carrot and beetroot (AKLILU, 2000; EHDA, 2011, 2012).
Vegetable production is an important economic activity in Ethiopia, ranging from
smallholder farming to large scale commercial farms (ZELLEKE and GEBREMARIAM,
1991). While smallholders usually use the largest part of their vegetable produce for

Characterization and Assessment of Vegetable Production and Marketing Systems 165
Quarterly Journal of International Agriculture 54 (2015), No. 2; DLG-Verlag Frankfurt/M.
home consumption and sell the surplus, the commercial state and private farms produce
solely for market. According to CSA (2012), about 2,710 million tons of vegetables,
root and tubers were produced on 541,000 ha, creating means of livelihood for more
than 1 million households in 2010/2011. The cultivated crop production area increased
by 26%, while the production volume increased by 73% between 2011 and 2013
(CSA, 2013).
In recent years, awareness of the nutritional and health benefits of vegetables in
Ethiopia has been increasing due to public health advocacy on the role of vegetables in
human nutrition and health through its provision of antioxidants such as vitamin A, C
and E that are important in neutralizing free radicals (oxidants) known to cause cancer,
cataracts, heart disease, hypertension, stroke and diabetes (DEMISSIE et al., 2009;
TABOR and YESUF, 2012) and partly because of the rising prices of livestock products
such as meat, milk and eggs, which traditionally forms a major component of most
Ethiopian diets. As such the increasing consumption of vegetables helps to fight
hidden hunger, malnutrition. Vegetables are also used as a source of raw material for
the local processing industry. Processed products such as tomato paste, tomato juice,
oleoresin and ground spice of hot pepper/chili (Capsicumspp.) are produced for
exports making a significant contribution to the national economy (AKLILU, 2000;
BAREDO, 2013).
Increased national and growing regional demand for vegetables has triggered
commercial production and boosted private investment in the sector by both national
and international entrepreneurs (EHDA, 2011, 2012), increased exports to Djibouti,
Somalia, South Sudan, the Sudan, the Middle East and European markets (TABOR and
YESUF, 2012). This partially affirms government’s policy of increasing productivity of
high value crops with the aim of increasing household income and improving
nutrition. It has been noted that, increasing consumption of vegetables and fruits
contributes to reducing hidden hunger (i.e. micronutrient deficiency), which is related
to health problem caused by a lack of essential vitamins and minerals such as vitamin
A, zinc, iron, and iodine in the diet (ADISH, 2012).
Despite the increasing importance of vegetables in Ethiopia, there is inadequate
knowledge on improved production systems and marketing, especially in the humid
tropics that was the target area of the present study. With increasing population and
declining land size, a better understanding of the production system, marketing
channels and endowed opportunities for growth will go a long way to contribute to
improve return on investment for value chain actors in the sub-sector. Against this
backdrop, the specific objectives of this paper are to: (i) characterize vegetable
production system and assess productivity in the study zones; (ii) analyze the structure,
conduct and performance of vegetables marketing systems in the study area; and
166 B. Emana, V. Afari-Sefa, F.F. Dinssa, A. Ayana, T. Balemi and M. Temesgen
Quarterly Journal of International Agriculture 54 (2015), No. 2; DLG-Verlag Frankfurt/M.
(iii) identify vegetable production and marketing constraints and opportunities and
suggest entry points for future interventions and investment in the sector. The study is
part of the CGIAR research program on integrated systems for the humid tropics, which
aims at reducing poverty, increasing food security, improving nutrition and health and
sustainable management of natural resources. In Ethiopia the study is implemented in
the southwestern highlands, having humid tropics climate (ALEMAYEHU et al., 2010).
2 Methods
2.1 The Study Sites
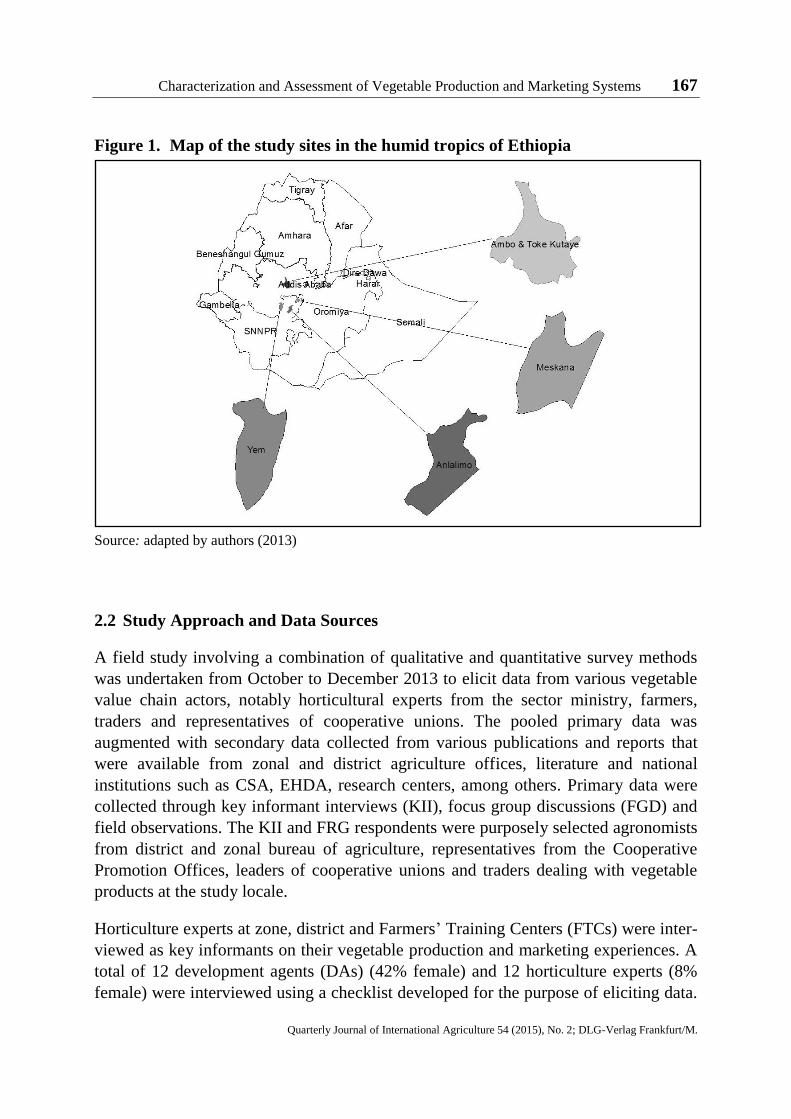
The study was conducted in three zones and one special district1 which are among the
major vegetable producing baskets in Ethiopia. According to CSA (2012), about 702,
201 smallholder farmers produced 99,368 tons of vegetables on 50,846 ha of land.
West Shewa zone is located in Oromia National Regional State while Gurage and
Hadiya zones and Yem-Special district are located in the Southern Nations,
Nationalities and Peoples Region (SNNPR) (Figure 1). Table 1 shows the list of
districts and kebeles (kebele is the lowest administrative unit in the government
administrative structure) in each of the selected zones. About 90% of the kebeles in the
sample districts grow vegetables. A total of seven kebeles from five districts were
surveyed. The districts and kebeles were selected in a participatory manner through
discussions with zonal and district vegetable experts to ensure that the samples were
fairly representative with respect to the vegetable production potential while addressing
the study objectives.
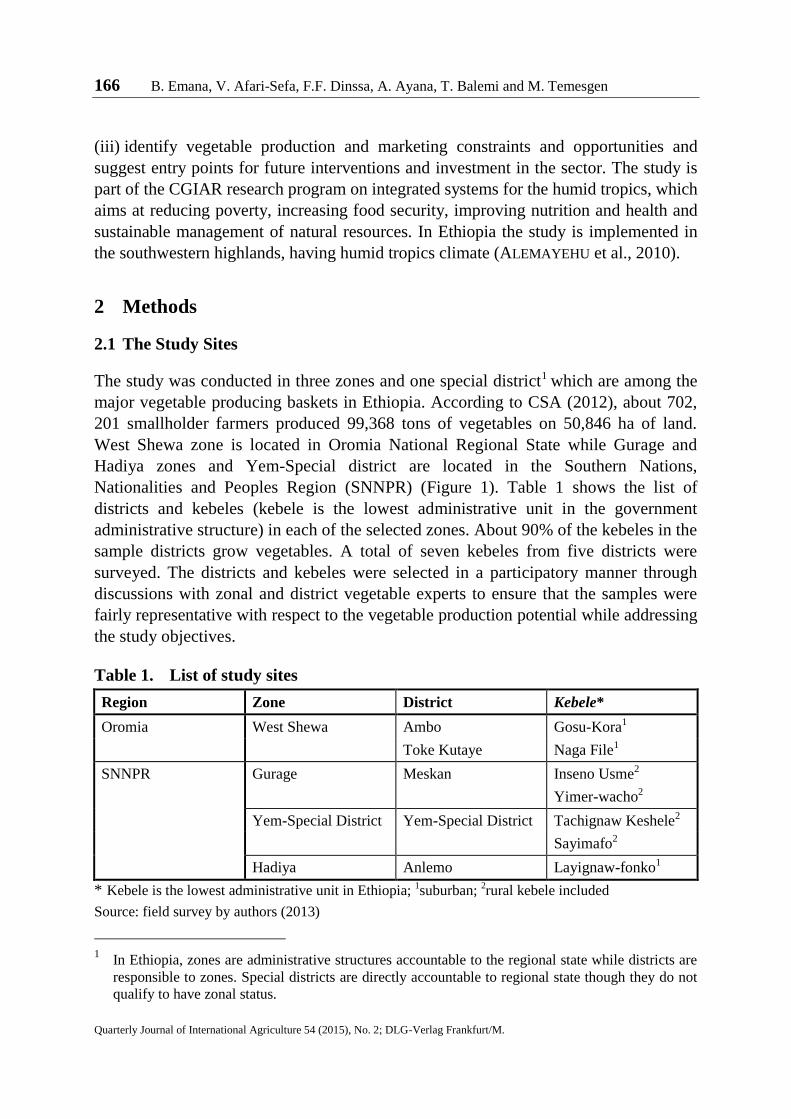
Table 1. List of study sites
Region Zone District Kebele*
Oromia West Shewa Ambo Gosu-Kora1
Toke Kutaye Naga File1
SNNPR Gurage Meskan Inseno Usme2
Yimer-wacho2
Yem-Special District Yem-Special District Tachignaw Keshele2
Sayimafo2
Hadiya Anlemo Layignaw-fonko1
* Kebele is the lowest administrative unit in Ethiopia; 1suburban;
2rural kebele included
Source: field survey by authors (2013)
1 In Ethiopia, zones are administrative structures accountable to the regional state while districts are
responsible to zones. Special districts are directly accountable to regional state though they do not
qualify to have zonal status.
Characterization and Assessment of Vegetable Production and Marketing Systems 167
Quarterly Journal of International Agriculture 54 (2015), No. 2; DLG-Verlag Frankfurt/M.
Figure 1. Map of the study sites in the humid tropics of Ethiopia
Source: adapted by authors (2013)
2.2 Study Approach and Data Sources
A field study involving a combination of qualitative and quantitative survey methods
was undertaken from October to December 2013 to elicit data from various vegetable
value chain actors, notably horticultural experts from the sector ministry, farmers,
traders and representatives of cooperative unions. The pooled primary data was
augmented with secondary data collected from various publications and reports that
were available from zonal and district agriculture offices, literature and national
institutions such as CSA, EHDA, research centers, among others. Primary data were
collected through key informant interviews (KII), focus group discussions (FGD) and
field observations. The KII and FRG respondents were purposely selected agronomists
from district and zonal bureau of agriculture, representatives from the Cooperative
Promotion Offices, leaders of cooperative unions and traders dealing with vegetable
products at the study locale.
Horticulture experts at zone, district and Farmers’ Training Centers (FTCs) were inter-
viewed as key informants on their vegetable production and marketing experiences. A
total of 12 development agents (DAs) (42% female) and 12 horticulture experts (8%
female) were interviewed using a checklist developed for the purpose of eliciting data.
168 B. Emana, V. Afari-Sefa, F.F. Dinssa, A. Ayana, T. Balemi and M. Temesgen
Quarterly Journal of International Agriculture 54 (2015), No. 2; DLG-Verlag Frankfurt/M.
Development agents are kebele level extension agents with diploma level qualification
in agriculture, including horticulture. In each of the selected districts, 2 FGDs were
conducted. In each village of the selected district one-women and one men’s-group
participated in separate discussion sessions. In total, 118 farmers (45% female) parti-
cipated in the FGD. The data collected included: type of vegetables produced, ranking
of vegetables in order of importance, area under production, nature of production
system, volumes produced, types and sources of inputs, purpose of production, amount
of vegetables marketed, mapping of vegetable value chains and actors, marketing
channels and costs, sales prices, and constraints and opportunities in the value chain.
The data collected were coded and entered into Excel spreadsheets and SPSS Version
20 statistical software package. Data obtained from various sources were also triangu-
lated, checked for consistency and analyzed. Descriptive statistics were used to
analyze and present the data.
3 Results and Discussion
3.1 Vegetable Farming System and Variety Preference
In the study local, vegetable production is integrated into mixed farming system where
different types of crops are produced on the same plot of land or in sequence with
other crops in rotation. Depending on availability of land and crop suitability for
intercropping, some vegetables are grown either as sole or intercropped with other
vegetables or cereals. Vegetables such as tomato, beetroot, Swiss-chard, lettuce, carrot,
cabbage, onion, garlic, kale, sweet potato and hot pepper are dominantly grown as sole
crop whereas Ethiopian mustard and pumpkin are dominantly intercropped with maize
and other annual or perennial crops, and with Irish potato especially in homesteads.
Integrating vegetable production in a farming system has contributes substancially to
food and nutrition security as the vegetables complement stable foods for a balanced
diet by providing vitamins and minerals. Due to such benefits, some projects such as
“better potato for better life” project are supported by USAID and implemented by the
International Potato Center (CIP) in Ethiopia.
Vegetables are usually grown in two seasons, namely in the wet season (locally known
as meher season) using rainfall with supplemental irrigation or under full irrigation
during the dry season. Vegetables such as pumpkin, Ethiopian mustard, hot pepper,
sweet potato, and some others are predominantly grown under rain-fed conditions.
Irrigated farming is considered costly due to the intensive use and high cost of diesel
fuel for pumping water, agro-chemicals and hired labour costs. Thus, choice of crop
selected for irrigation is critical. Results from the focus group discussions indicate that
green beans, Irish potato, kale, cabbage, tomato and onion have high market value to

Characterization and Assessment of Vegetable Production and Marketing Systems 169
Quarterly Journal of International Agriculture 54 (2015), No. 2; DLG-Verlag Frankfurt/M.
offset high cost of production under irrigated farming systems. Irrigated farming also
enables the farmers to align harvest time to meet off-season higher market demand,
when farm-gate prices are much higher. During the rainy season, farmers follow a
similar strategy by ensuring that the timing of planting and harvesting coincides with
periods of higher consumer demand and competitive farm-gate prices, thereby avoiding
periods of peak market gluts. In Ethiopia vegetable consumption often increases
during the Christian fasting period, when livestock products are not consumed and the
demand for pulses and vegetables are high. Vegetable growers often align their plant-
ing time so that harvesting will coincide with the fasting period. Producing under
irrigation also enables the farmers schedule production pattern to avoid periods of high
pest and disease infestation.
Depending on the agro-ecology and resource availability, the type of vegetables grown
in the different districts of Ethiopia varies. The results of the study are thus consistent
with the findings of other authors (see for example, HAJI, 2007) and confirm that there
is both vegetable integration as well as diversification in the study districts. Certain
vegetable types are dominant in specific districts. To this end, results from the
subjective ranking assessment of the dominance of vegetable types by respondents
from the various farm households and expert opinions were consistent. In terms of
geographic distribution, tomato, onion, cabbage and Irish potato are among the top
ranking vegetables while kale is dominant in Gurage and Hadiya zones in general, and
in Meskan and Anlemo districts in particular (Table 2).
Table 2. Rank of vegetables by relative dominance in the farming system
Vegetable production dominance rank by district*
Vegetables Guder Ambo Yem-Special District Mesken Anlemo
Tomato 1 2 1 1 3
Sweet potato 4
Cabbage 3 3 4 4 2
Onion 2 1 2 4
Hot pepper 5 3
Beet root 4 3 5 5
Irish potato 5 2 3 1
Garlic 2 5
Carrot 4
Ethiopian mustard 1 2 1
*,1 indicates most widely grown vegetable
Source: field survey by authors (2013)
170 B. Emana, V. Afari-Sefa, F.F. Dinssa, A. Ayana, T. Balemi and M. Temesgen
Quarterly Journal of International Agriculture 54 (2015), No. 2; DLG-Verlag Frankfurt/M.
A preference assessment for varieties indicated that, there is preference for specific
varieties due to differences in key identified attributes. The major attributes for tomato
include low perishability, high yield, taste and ability to attract a premium price.
Although head size and head compactness are important attributes in selecting cabbage
varieties, availability of seed is the overall governing factor for preferring a variety
such as ‘Copenhagen’ as the sole variety for production in some areas. Fast growth
and tolerance to diseases are important attributes for preferring different local varieties
of Ethiopian mustard. However, in most cases availability of seed dictates the type of
varieties selected for production. Color, early maturity and market demand are the key
attributes of best onion varieties. Availability of planting materials and clove size
govern selection of garlic cultivars, which is quite logical in the sense that there are no
formal sources of garlic planting materials in Ethiopia. Yield, color, pod size and
market demand are on the other hand the most important criteria in selecting hot
pepper varieties. Notwithstanding the role of the specific attributes determining varietal
selection, availability of seed/planting materials dictates what type of vegetable variety
to grow in most cases, implying the critical shortage of improved seed and/or planting
material supply at required time and space.
3.2 Production Area and Yield Estimates of Vegetables
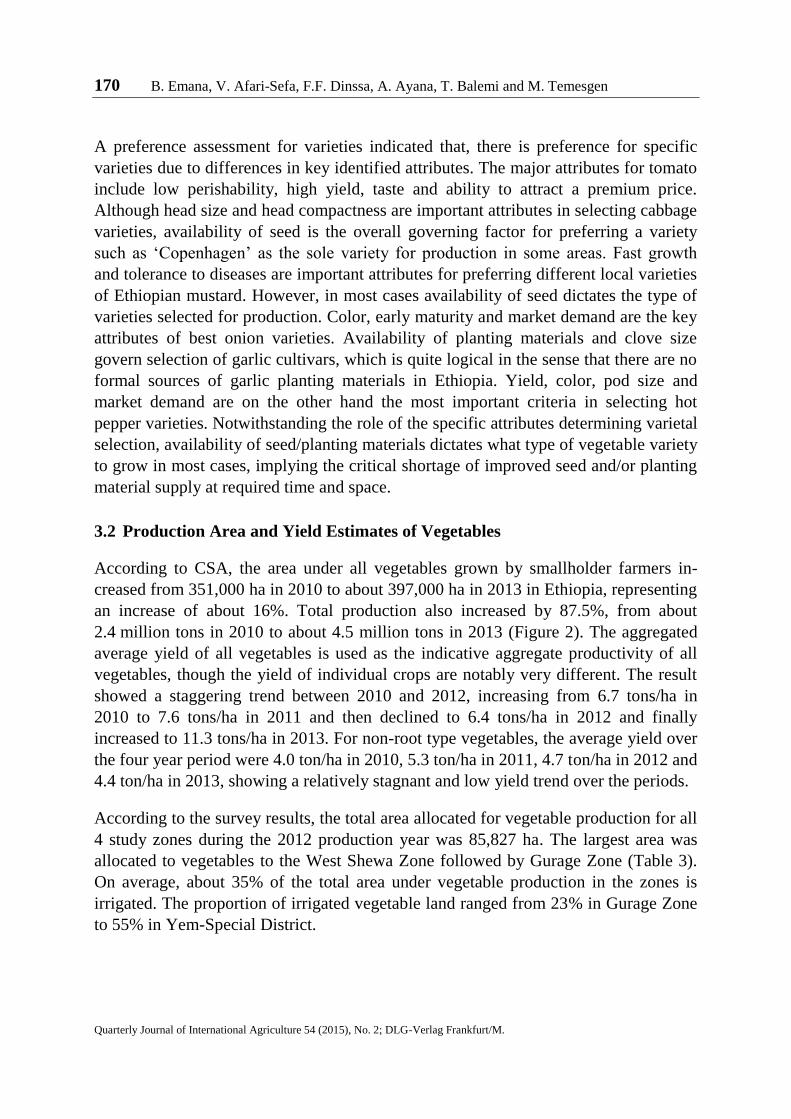
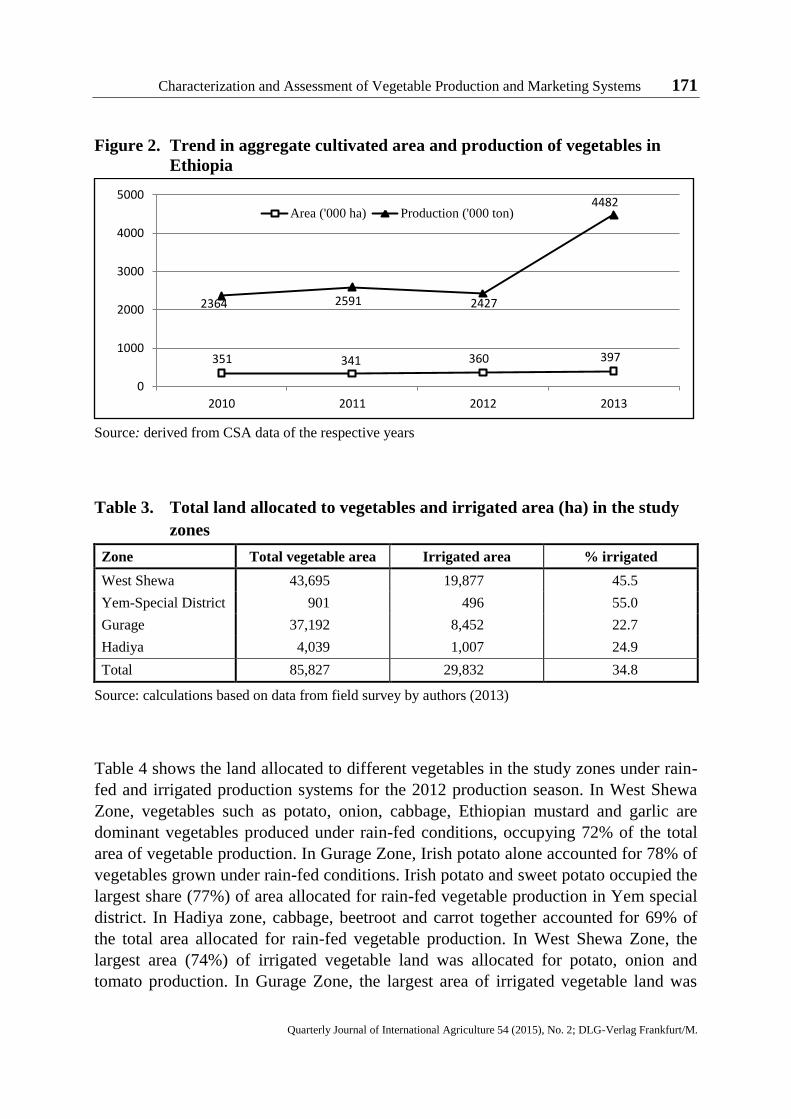
According to CSA, the area under all vegetables grown by smallholder farmers in-
creased from 351,000 ha in 2010 to about 397,000 ha in 2013 in Ethiopia, representing
an increase of about 16%. Total production also increased by 87.5%, from about
2.4 million tons in 2010 to about 4.5 million tons in 2013 (Figure 2). The aggregated
average yield of all vegetables is used as the indicative aggregate productivity of all
vegetables, though the yield of individual crops are notably very different. The result
showed a staggering trend between 2010 and 2012, increasing from 6.7 tons/ha in
2010 to 7.6 tons/ha in 2011 and then declined to 6.4 tons/ha in 2012 and finally
increased to 11.3 tons/ha in 2013. For non-root type vegetables, the average yield over
the four year period were 4.0 ton/ha in 2010, 5.3 ton/ha in 2011, 4.7 ton/ha in 2012 and
4.4 ton/ha in 2013, showing a relatively stagnant and low yield trend over the periods.
According to the survey results, the total area allocated for vegetable production for all
4 study zones during the 2012 production year was 85,827 ha. The largest area was
allocated to vegetables to the West Shewa Zone followed by Gurage Zone (Table 3).
On average, about 35% of the total area under vegetable production in the zones is
irrigated. The proportion of irrigated vegetable land ranged from 23% in Gurage Zone
to 55% in Yem-Special District.
Characterization and Assessment of Vegetable Production and Marketing Systems 171
Quarterly Journal of International Agriculture 54 (2015), No. 2; DLG-Verlag Frankfurt/M.
Figure 2. Trend in aggregate cultivated area and production of vegetables in
Ethiopia
Source: derived from CSA data of the respective years
Table 3. Total land allocated to vegetables and irrigated area (ha) in the study
zones
Zone Total vegetable area Irrigated area % irrigated
West Shewa 43,695 19,877 45.5
Yem-Special District 901 496 55.0
Gurage 37,192 8,452 22.7
Hadiya 4,039 1,007 24.9
Total 85,827 29,832 34.8
Source: calculations based on data from field survey by authors (2013)
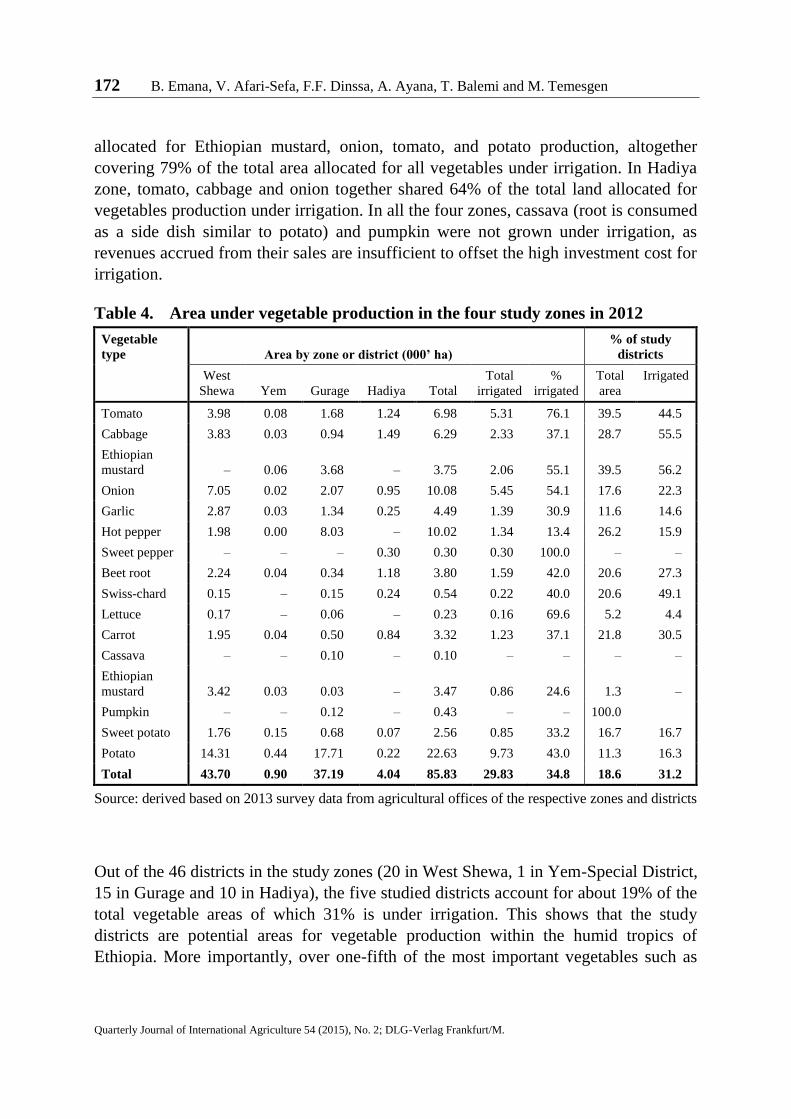
Table 4 shows the land allocated to different vegetables in the study zones under rain-
fed and irrigated production systems for the 2012 production season. In West Shewa
Zone, vegetables such as potato, onion, cabbage, Ethiopian mustard and garlic are
dominant vegetables produced under rain-fed conditions, occupying 72% of the total
area of vegetable production. In Gurage Zone, Irish potato alone accounted for 78% of
vegetables grown under rain-fed conditions. Irish potato and sweet potato occupied the
largest share (77%) of area allocated for rain-fed vegetable production in Yem special
district. In Hadiya zone, cabbage, beetroot and carrot together accounted for 69% of
the total area allocated for rain-fed vegetable production. In West Shewa Zone, the
largest area (74%) of irrigated vegetable land was allocated for potato, onion and
tomato production. In Gurage Zone, the largest area of irrigated vegetable land was
351 341 360 397
2364 2591 2427
4482
0
1000
2000
3000
4000
5000
2010 2011 2012 2013
Area ('000 ha) Production ('000 ton)
172 B. Emana, V. Afari-Sefa, F.F. Dinssa, A. Ayana, T. Balemi and M. Temesgen
Quarterly Journal of International Agriculture 54 (2015), No. 2; DLG-Verlag Frankfurt/M.
allocated for Ethiopian mustard, onion, tomato, and potato production, altogether
covering 79% of the total area allocated for all vegetables under irrigation. In Hadiya
zone, tomato, cabbage and onion together shared 64% of the total land allocated for
vegetables production under irrigation. In all the four zones, cassava (root is consumed
as a side dish similar to potato) and pumpkin were not grown under irrigation, as
revenues accrued from their sales are insufficient to offset the high investment cost for
irrigation.
Table 4. Area under vegetable production in the four study zones in 2012
Vegetable
type Area by zone or district (000’ ha)
% of study
districts
West
Shewa Yem Gurage Hadiya Total
Total
irrigated
%
irrigated
Total
area
Irrigated
Tomato 3.98 0.08 1.68 1.24 6.98 5.31 76.1 39.5 44.5
Cabbage 3.83 0.03 0.94 1.49 6.29 2.33 37.1 28.7 55.5
Ethiopian
mustard – 0.06 3.68 – 3.75 2.06 55.1 39.5 56.2
Onion 7.05 0.02 2.07 0.95 10.08 5.45 54.1 17.6 22.3
Garlic 2.87 0.03 1.34 0.25 4.49 1.39 30.9 11.6 14.6
Hot pepper 1.98 0.00 8.03 – 10.02 1.34 13.4 26.2 15.9
Sweet pepper – – – 0.30 0.30 0.30 100.0 – –
Beet root 2.24 0.04 0.34 1.18 3.80 1.59 42.0 20.6 27.3
Swiss-chard 0.15 – 0.15 0.24 0.54 0.22 40.0 20.6 49.1
Lettuce 0.17 – 0.06 – 0.23 0.16 69.6 5.2 4.4
Carrot 1.95 0.04 0.50 0.84 3.32 1.23 37.1 21.8 30.5
Cassava – – 0.10 – 0.10 – – – –
Ethiopian
mustard 3.42 0.03 0.03 – 3.47 0.86 24.6 1.3 –
Pumpkin – – 0.12 – 0.43 – – 100.0
Sweet potato 1.76 0.15 0.68 0.07 2.56 0.85 33.2 16.7 16.7
Potato 14.31 0.44 17.71 0.22 22.63 9.73 43.0 11.3 16.3
Total 43.70 0.90 37.19 4.04 85.83 29.83 34.8 18.6 31.2
Source: derived based on 2013 survey data from agricultural offices of the respective zones and districts
Out of the 46 districts in the study zones (20 in West Shewa, 1 in Yem-Special District,
15 in Gurage and 10 in Hadiya), the five studied districts account for about 19% of the
total vegetable areas of which 31% is under irrigation. This shows that the study
districts are potential areas for vegetable production within the humid tropics of
Ethiopia. More importantly, over one-fifth of the most important vegetables such as
Characterization and Assessment of Vegetable Production and Marketing Systems 173
Quarterly Journal of International Agriculture 54 (2015), No. 2; DLG-Verlag Frankfurt/M.
tomato, cabbage, Ethiopian mustard, hot pepper, beetroots and Swiss-chard largely
produced for market are supplied from the study districts (Table 4).
Analysis of FGDs indicates that almost all farmers in all the study districts are engaged
in the production of major vegetables of economic importance. The area allocated by
households for the production of these crops varies and is often very small. The
average household level area allocated for vegetable production in the five districts
ranges from 0.11 ha in Meskan to 0.19 ha in Ambo. For example, in Toke Kutaye
district, an average of 0.38 ha of land was allocated for tomato production per house-
hold, which is much higher than the area allocated to other vegetables. Similarly, only
a very small land size is allocated for production of beetroot as well as hot pepper. In
Ambo district, onion production is most common, occupying an average of 0.5 ha of
land per household whereas only 0.25 ha was allocated for each of tomato, cabbage
and garlic.
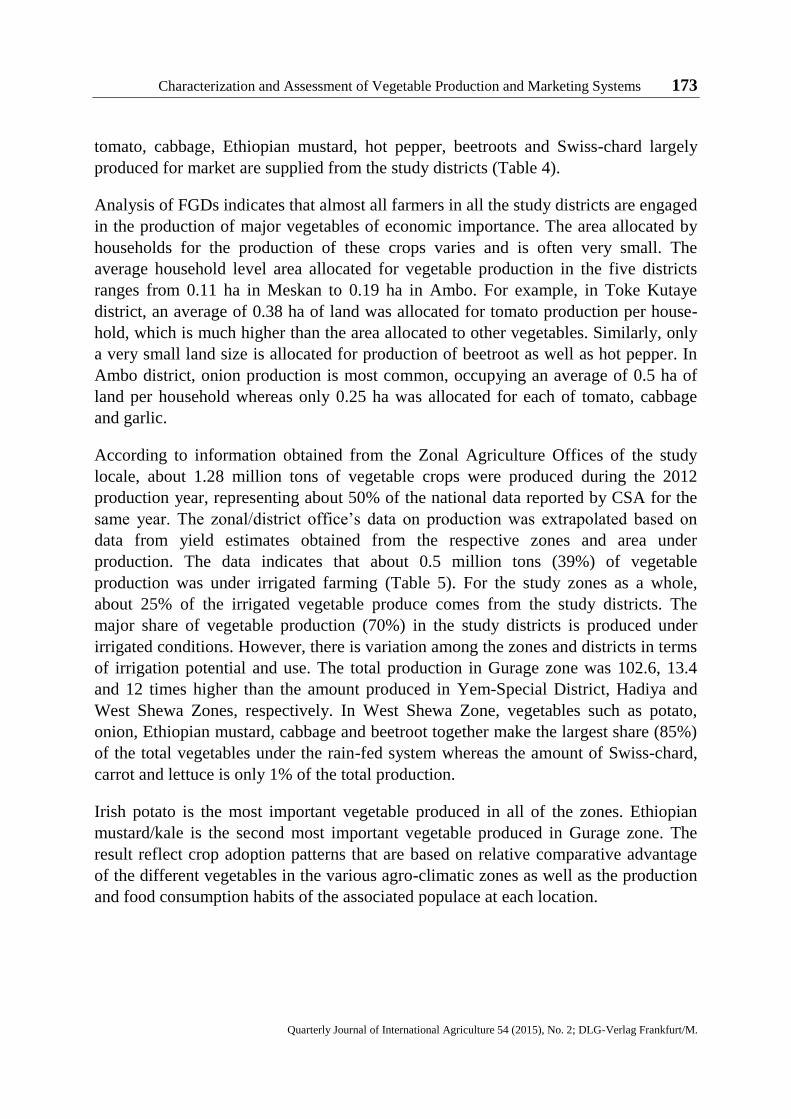
According to information obtained from the Zonal Agriculture Offices of the study
locale, about 1.28 million tons of vegetable crops were produced during the 2012
production year, representing about 50% of the national data reported by CSA for the
same year. The zonal/district office’s data on production was extrapolated based on
data from yield estimates obtained from the respective zones and area under
production. The data indicates that about 0.5 million tons (39%) of vegetable
production was under irrigated farming (Table 5). For the study zones as a whole,
about 25% of the irrigated vegetable produce comes from the study districts. The
major share of vegetable production (70%) in the study districts is produced under
irrigated conditions. However, there is variation among the zones and districts in terms
of irrigation potential and use. The total production in Gurage zone was 102.6, 13.4
and 12 times higher than the amount produced in Yem-Special District, Hadiya and
West Shewa Zones, respectively. In West Shewa Zone, vegetables such as potato,
onion, Ethiopian mustard, cabbage and beetroot together make the largest share (85%)
of the total vegetables under the rain-fed system whereas the amount of Swiss-chard,
carrot and lettuce is only 1% of the total production.
Irish potato is the most important vegetable produced in all of the zones. Ethiopian
mustard/kale is the second most important vegetable produced in Gurage zone. The
result reflect crop adoption patterns that are based on relative comparative advantage
of the different vegetables in the various agro-climatic zones as well as the production
and food consumption habits of the associated populace at each location.
174 B. Emana, V. Afari-Sefa, F.F. Dinssa, A. Ayana, T. Balemi and M. Temesgen
Quarterly Journal of International Agriculture 54 (2015), No. 2; DLG-Verlag Frankfurt/M.
Table 5. Vegetable production in the study zones and relative share of the
sampled districts in 2012
Vegetable
type
Total vegetable production by zone or district(000’ ton) % of study districts
West
Shewa
Yem Gurage Hadiya Total Total
irrigated
%
irrigated
Total
production
Production from
irrigated area
Tomato 17.57 0.96 51.72 27.36 97.61 83.00 85 36 36
Cabbage 13.40 0.33 22.59 30.05 66.36 34.14 51 37 52
Kale - 0.48 116.59 - 117.06 53.18 45 25 43
Onion 40.10 0.23 53.62 14.29 108.26 88.79 82 20 18
Garlic 5.49 0.36 20.59 3.47 29.91 12.47 42 10 12
Hot pepper 3.19 - 14.95 - 18.14 9.05 50 26 27
Sweet
Pepper - - - 0.28 0.28 0.28 100 - -
Beet root 6.85 0.37 7.23 22.01 36.46 14.34 39 27 42
Swiss-chard 0.24 - 2.90 4.49 7.63 1.79 23 24 98
Lettuce 0.87 - 1.18 - 2.05 1.02 50 10 10
Carrot 2.64 0.34 12.63 16.03 31.64 16.81 53 26 29
Cassava - - 1.73 - 1.73 - - - -
Ethiopian
mustard 9.29 0.01 0.03 - 9.33 2.76 30 - -
Pumpkin - - 1.68 - 1.68 - - 1
Sweet
potato 1.49 0.76 18.10 1.61 21.97 5.81 26 11 12
Potato 155.24 5.45 572.13 5.15 737.97 178.86 24 4 12
Total 256.36 9.31 897.68 124.74 1,288.08 502.29 39 14 25
Source: agricultural offices of the respective zones and district
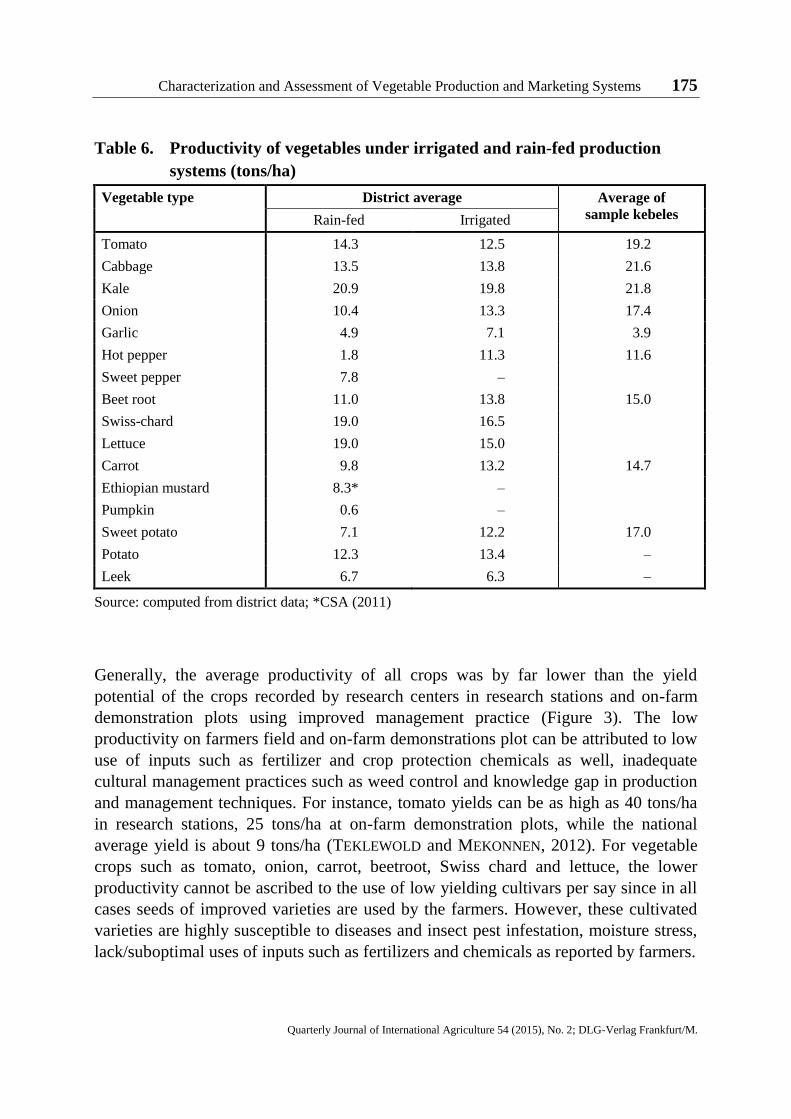
The yields under rain-fed and irrigated conditions of the most common vegetables
were estimated (Table 6) by the farming communities involved in the focus group
discussions. The yield depends on the production season and the vegetable type. For
example, onion, garlic, hot pepper, beetroot, carrot, sweet potato and potato registered
higher yields under irrigation production compared to rain-fed production. On the
other hand, tomato, Swiss chard and lettuce registered lower yield under irrigation than
under rain-fed in similar farming system. According to the respondent farmers, the
divergent results could be attributed to the differences in susceptibility to diseases
during the rainy season and to insect pests and heat during the dry season. The average
yield of the vegetables in the study districts is more skewed to the right as compared to
average yields reported by the district offices. This could be attributed to either the
relatively good potential of the study kebeles or perhaps estimation bias by horti-
cultural experts at the district level.
Characterization and Assessment of Vegetable Production and Marketing Systems 175
Quarterly Journal of International Agriculture 54 (2015), No. 2; DLG-Verlag Frankfurt/M.
Table 6. Productivity of vegetables under irrigated and rain-fed production
systems (tons/ha)
Vegetable type District average Average of
sample kebeles Rain-fed Irrigated
Tomato 14.3 12.5 19.2
Cabbage 13.5 13.8 21.6
Kale 20.9 19.8 21.8
Onion 10.4 13.3 17.4
Garlic 4.9 7.1 3.9
Hot pepper 1.8 11.3 11.6
Sweet pepper 7.8 –
Beet root 11.0 13.8 15.0
Swiss-chard 19.0 16.5
Lettuce 19.0 15.0
Carrot 9.8 13.2 14.7
Ethiopian mustard 8.3* –
Pumpkin 0.6 –
Sweet potato 7.1 12.2 17.0
Potato 12.3 13.4 –
Leek 6.7 6.3 –
Source: computed from district data; *CSA (2011)
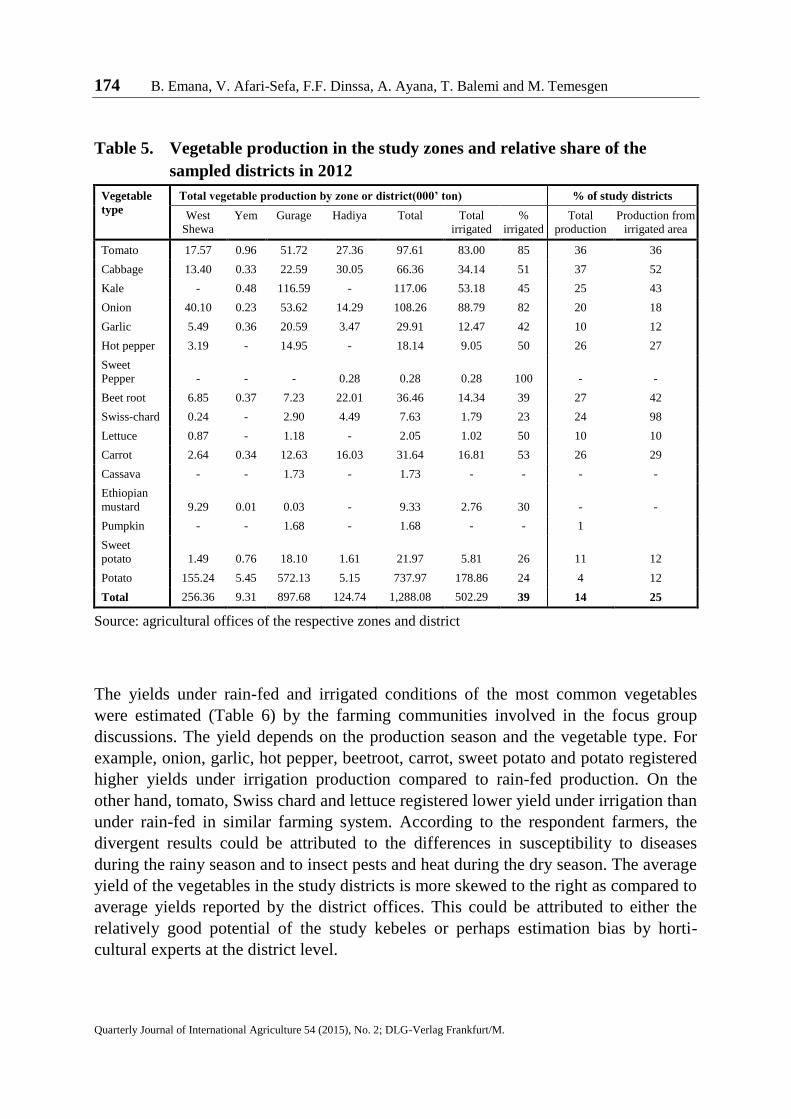
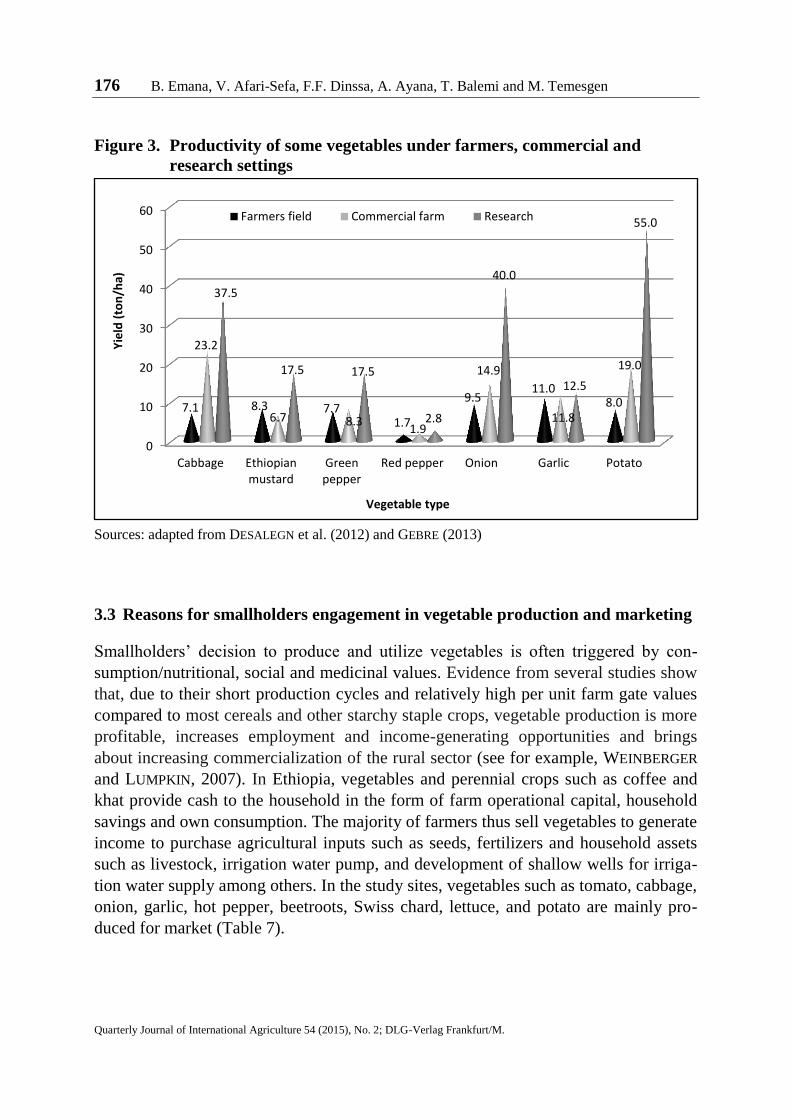
Generally, the average productivity of all crops was by far lower than the yield
potential of the crops recorded by research centers in research stations and on-farm
demonstration plots using improved management practice (Figure 3). The low
productivity on farmers field and on-farm demonstrations plot can be attributed to low
use of inputs such as fertilizer and crop protection chemicals as well, inadequate
cultural management practices such as weed control and knowledge gap in production
and management techniques. For instance, tomato yields can be as high as 40 tons/ha
in research stations, 25 tons/ha at on-farm demonstration plots, while the national
average yield is about 9 tons/ha (TEKLEWOLD and MEKONNEN, 2012). For vegetable
crops such as tomato, onion, carrot, beetroot, Swiss chard and lettuce, the lower
productivity cannot be ascribed to the use of low yielding cultivars per say since in all
cases seeds of improved varieties are used by the farmers. However, these cultivated
varieties are highly susceptible to diseases and insect pest infestation, moisture stress,
lack/suboptimal uses of inputs such as fertilizers and chemicals as reported by farmers.
176 B. Emana, V. Afari-Sefa, F.F. Dinssa, A. Ayana, T. Balemi and M. Temesgen
Quarterly Journal of International Agriculture 54 (2015), No. 2; DLG-Verlag Frankfurt/M.
Figure 3. Productivity of some vegetables under farmers, commercial and
research settings
Sources: adapted from DESALEGN et al. (2012) and GEBRE (2013)
3.3 Reasons for smallholders engagement in vegetable production and marketing
Smallholders’ decision to produce and utilize vegetables is often triggered by con-
sumption/nutritional, social and medicinal values. Evidence from several studies show
that, due to their short production cycles and relatively high per unit farm gate values
compared to most cereals and other starchy staple crops, vegetable production is more
profitable, increases employment and income-generating opportunities and brings
about increasing commercialization of the rural sector (see for example, WEINBERGER
and LUMPKIN, 2007). In Ethiopia, vegetables and perennial crops such as coffee and
khat provide cash to the household in the form of farm operational capital, household
savings and own consumption. The majority of farmers thus sell vegetables to generate
income to purchase agricultural inputs such as seeds, fertilizers and household assets
such as livestock, irrigation water pump, and development of shallow wells for irriga-
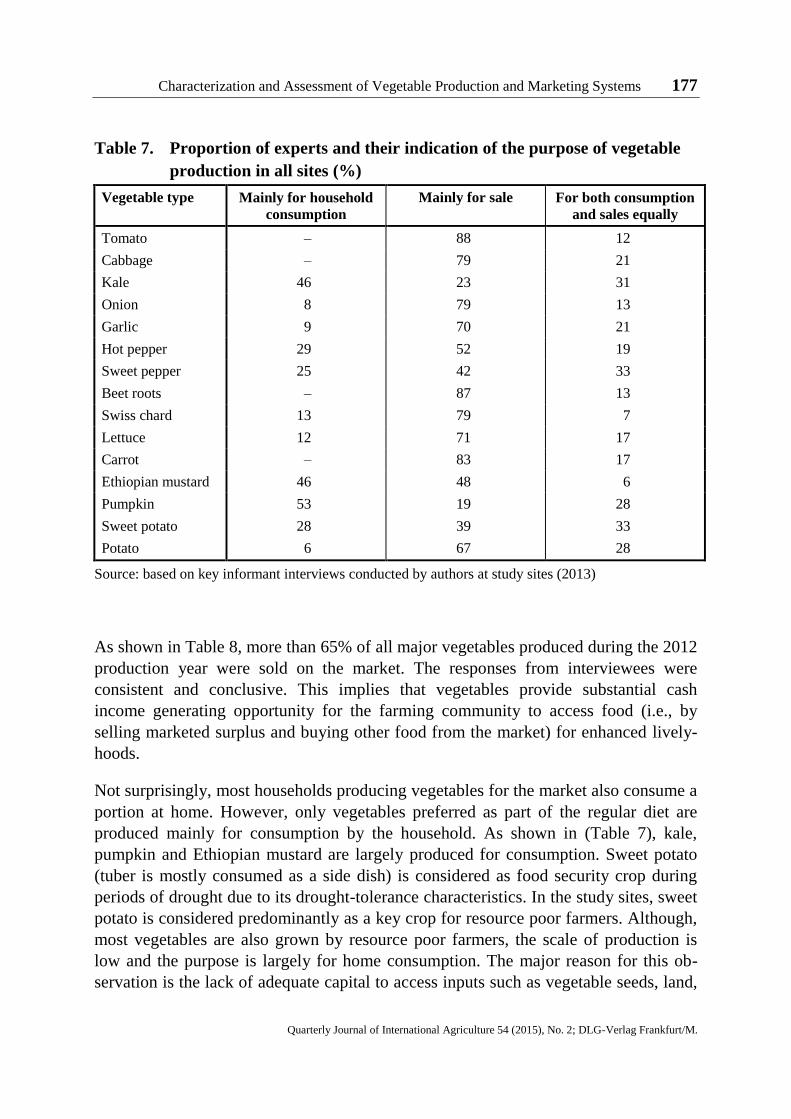
tion water supply among others. In the study sites, vegetables such as tomato, cabbage,
onion, garlic, hot pepper, beetroots, Swiss chard, lettuce, and potato are mainly pro-
duced for market (Table 7).
0
10
20
30
40
50
60
Cabbage Ethiopianmustard
Greenpepper
Red pepper Onion Garlic Potato
7.1 8.3 7.7 1.7
9.5 11.0
8.0
23.2
6.7 8.3 1.9
14.9
11.8
19.0
37.5
17.5 17.5
2.8
40.0
12.5
55.0
Yie
ld (
ton
/ha)
Vegetable type
Farmers field Commercial farm Research
Characterization and Assessment of Vegetable Production and Marketing Systems 177
Quarterly Journal of International Agriculture 54 (2015), No. 2; DLG-Verlag Frankfurt/M.
Table 7. Proportion of experts and their indication of the purpose of vegetable
production in all sites (%)
Vegetable type Mainly for household
consumption
Mainly for sale For both consumption
and sales equally
Tomato – 88 12
Cabbage – 79 21
Kale 46 23 31
Onion 8 79 13
Garlic 9 70 21
Hot pepper 29 52 19
Sweet pepper 25 42 33
Beet roots – 87 13
Swiss chard 13 79 7
Lettuce 12 71 17
Carrot – 83 17
Ethiopian mustard 46 48 6
Pumpkin 53 19 28
Sweet potato 28 39 33
Potato 6 67 28
Source: based on key informant interviews conducted by authors at study sites (2013)
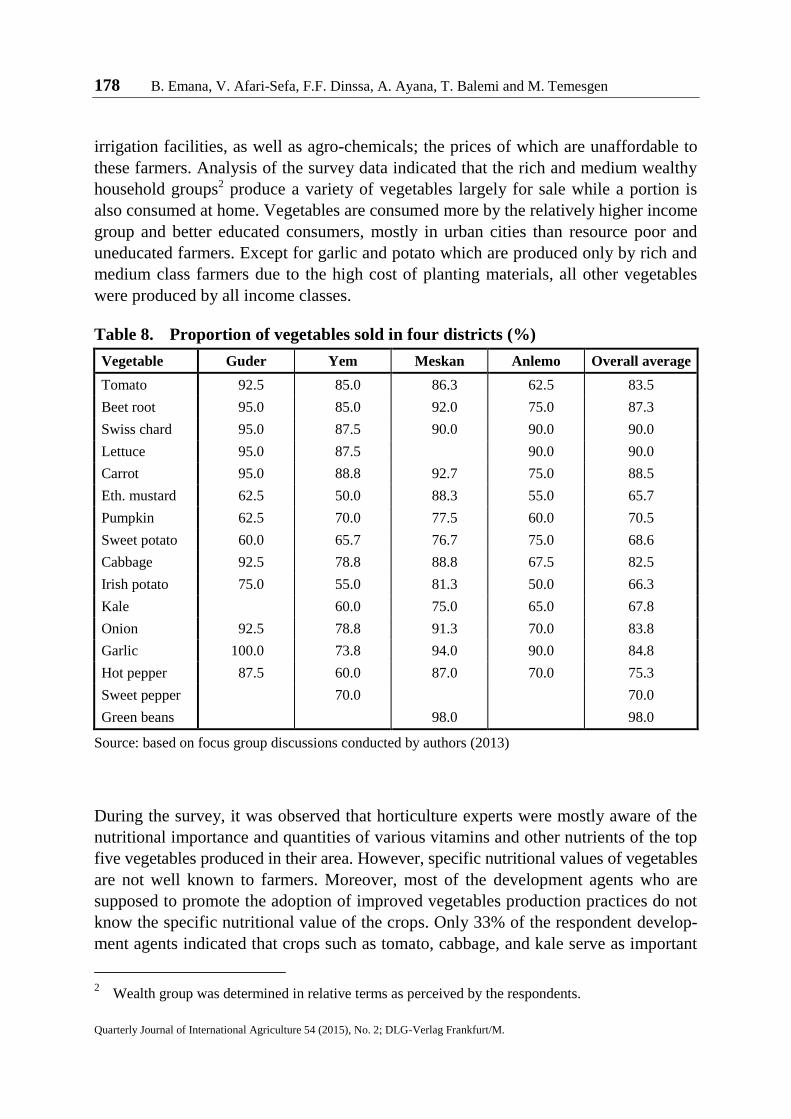
As shown in Table 8, more than 65% of all major vegetables produced during the 2012
production year were sold on the market. The responses from interviewees were
consistent and conclusive. This implies that vegetables provide substantial cash
income generating opportunity for the farming community to access food (i.e., by
selling marketed surplus and buying other food from the market) for enhanced lively-
hoods.
Not surprisingly, most households producing vegetables for the market also consume a
portion at home. However, only vegetables preferred as part of the regular diet are
produced mainly for consumption by the household. As shown in (Table 7), kale,
pumpkin and Ethiopian mustard are largely produced for consumption. Sweet potato
(tuber is mostly consumed as a side dish) is considered as food security crop during
periods of drought due to its drought-tolerance characteristics. In the study sites, sweet
potato is considered predominantly as a key crop for resource poor farmers. Although,
most vegetables are also grown by resource poor farmers, the scale of production is
low and the purpose is largely for home consumption. The major reason for this ob-
servation is the lack of adequate capital to access inputs such as vegetable seeds, land,
178 B. Emana, V. Afari-Sefa, F.F. Dinssa, A. Ayana, T. Balemi and M. Temesgen
Quarterly Journal of International Agriculture 54 (2015), No. 2; DLG-Verlag Frankfurt/M.
irrigation facilities, as well as agro-chemicals; the prices of which are unaffordable to
these farmers. Analysis of the survey data indicated that the rich and medium wealthy
household groups2 produce a variety of vegetables largely for sale while a portion is
also consumed at home. Vegetables are consumed more by the relatively higher income
group and better educated consumers, mostly in urban cities than resource poor and
uneducated farmers. Except for garlic and potato which are produced only by rich and
medium class farmers due to the high cost of planting materials, all other vegetables
were produced by all income classes.
Table 8. Proportion of vegetables sold in four districts (%)
Vegetable Guder Yem Meskan Anlemo Overall average
Tomato 92.5 85.0 86.3 62.5 83.5
Beet root 95.0 85.0 92.0 75.0 87.3
Swiss chard 95.0 87.5 90.0 90.0 90.0
Lettuce 95.0 87.5
90.0 90.0
Carrot 95.0 88.8 92.7 75.0 88.5
Eth. mustard 62.5 50.0 88.3 55.0 65.7
Pumpkin 62.5 70.0 77.5 60.0 70.5
Sweet potato 60.0 65.7 76.7 75.0 68.6
Cabbage 92.5 78.8 88.8 67.5 82.5
Irish potato 75.0 55.0 81.3 50.0 66.3
Kale
60.0 75.0 65.0 67.8
Onion 92.5 78.8 91.3 70.0 83.8
Garlic 100.0 73.8 94.0 90.0 84.8
Hot pepper 87.5 60.0 87.0 70.0 75.3
Sweet pepper
70.0
70.0
Green beans
98.0
98.0
Source: based on focus group discussions conducted by authors (2013)
During the survey, it was observed that horticulture experts were mostly aware of the
nutritional importance and quantities of various vitamins and other nutrients of the top
five vegetables produced in their area. However, specific nutritional values of vegetables
are not well known to farmers. Moreover, most of the development agents who are
supposed to promote the adoption of improved vegetables production practices do not
know the specific nutritional value of the crops. Only 33% of the respondent develop-
ment agents indicated that crops such as tomato, cabbage, and kale serve as important
2 Wealth group was determined in relative terms as perceived by the respondents.

Characterization and Assessment of Vegetable Production and Marketing Systems 179
Quarterly Journal of International Agriculture 54 (2015), No. 2; DLG-Verlag Frankfurt/M.
sources of vitamins, 8% indicated that onion, hot pepper and carrot are rich sources of
vitamins. On the other hand, 8-25% of the development agents respondents do not
have a fair knowledge of the nutritional values of most vegetables. About 33% of the
development agents indicated that potato is an important source of carbohydrate. This
reveals a knowledge gap to persuade farmers to produce vegetables which is part of
the extension packages outlined by the official agricultural extension program in the
country.
In addition to their economic and nutritional importance, vegetables also possess social
and medicinal values. Consequently, development agents and farmers (through FGD)
were asked whether they were aware of the social value and medicinal values of
vegetable crops commonly produced in their area. About 42-50% of development
agents responded that vegetables such as tomato, cabbage, kale, onion and potato are
usually offered as gifts to relatives or neighbors as a means of social support. This
occurs mainly when the relatives or neighbors do not have own access to such
vegetables. About 25% and 8.3% of the respondents stated that kale and cabbage play
key roles in preventing constipation, respectively. Another 8.3% of the respondents
also stated that onion, garlic and sweet pepper have medicinal value although they do
not know exactly what it is. Carrot has medicinal value for 25% of the respondents
while garlic is considered as medicine for preventing various diseases such as common
cold.
Production Constraints
Despite the immense merits of vegetables to farmers, their production has been
constrained by a myriad of biotic (i. e., diseases, insect pests and weeds) and abiotic
factors (i.e., soil acidity and low soil fertility) as well as institutional (e.g. policy,
market, and infrastructure). The constraints could thus be categorized under 3 factors
viz: (i) natural factors, (ii) institutional and policy factors, (iii) market factors.
The natural production constraints identified include the perishable nature of vegetables,
pests and diseases infestation, and extreme moisture levels (i.e., high during rainy
season, and shortage during the dry season). The results from the key informants and
FGDs stress the critical importance of postharvest losses which occur due to the
perishable nature of vegetables and lack of appropriate postharvest handling practices
and processing technologies. The high incidence of insect pest and diseases infestation
further accentuates high pre-harvest and postharvest losses. In adequate or erratic
rainfall or lack of irrigation water was also found to result in low moisture stress,
causing yield reduction. As indicated in Table 9, tomato was among the most signifi-
cantly affected crops by diseases (97%), postharvest loss (82%) and low moisture
stress (68%) as the pooled data from all respondent categories. Cabbage and onion
180 B. Emana, V. Afari-Sefa, F.F. Dinssa, A. Ayana, T. Balemi and M. Temesgen
Quarterly Journal of International Agriculture 54 (2015), No. 2; DLG-Verlag Frankfurt/M.
come after tomato in terms of susceptibility to low moisture stress (55%) and
postharvest loss (44%). Late blight caused by Phytophthora infestans and bacterial
wilt caused Ralstonia solanacearum were reported as the important diseases that affect
potato and tomato in the study areas. There was no reported disease affecting Ethiopian
mustard production in the study area, although aphids were reported to cause heavy
damage. Only 8% of the experts interviewed mentioned carrot to have been suffering
from diseases and pests. Powdery mildew was among the most important diseases of
carrot. Garlic, beetroot, carrot and Ethiopian mustard were among the crops having no
specific reported problems of postharvest losses, as far as transportation distance is not
too long.
The major institutional constraints affecting vegetable production relates to the lack of
access to improved and pest and disease resistant vegetable varieties, especially for
potato, sweet potato, hot pepper and tomato and lack of a functional vegetable seed
certification/regulatory system, ultimately resulting in the use of uncertified poor
quality seeds by farmers. This partly as a result of the lack of private seed companies
involvement in the vegetable seed supply and distribution channel. Almost all vegetable
seeds are imported with their quality and sources hardly known. This has an impact on
the overall production and lack of institutionally coordinated (e.g., as through coopera-
tives/union, MoA) seed supply system in some districts such as Guder and Ambo in
the study areas. Other factors include the fragmented nature of vegetable farms creating
inconvenience for coordinated market linkages and lack of policy initiatives to address
the issue. Despite the fact that government planned to develop small scale irrigation,
which is often used for vegetable production, there is inadequate irrigation water in
some districts (Guder, Ambo, Yem), resulting in conflict among farmers associated
with periodic rationing of irrigation water use.
Vegetables are also sold at local markets in villages and district capitals. Lack of a
reliable market in all the zones appears to be another critical bottleneck of vegetable
farming. Discussions particularly with producers and traders revealed that the existing
market infrastructure and poor transport and warehouse facilities do not suit the
perishable nature of vegetables as a result of which the quality of vegetables such as
tomato and onion deteriorates. During the peak vegetable production season, farmers
are forced to sell the products at extremely low prices particularly for tomato, and
onion (because of lack of appropriate storage structure to avoid sprouting) thereby
discouraging farmers from producing in the immediate subsequent season. Producers
and local traders lack reliable market information and support systems. Brokers and
wholesalers in the terminal market determine prices and even sometimes refuse buying
harvested produce. Due to the perishable nature of vegetables, producers are forced to
become price takers and accept low prices offered by brokers and wholesalers and
even in some cases abandon their produce in market. The largest proportion of respond-
Characterization and Assessment of Vegetable Production and Marketing Systems 181
Quarterly Journal of International Agriculture 54 (2015), No. 2; DLG-Verlag Frankfurt/M.
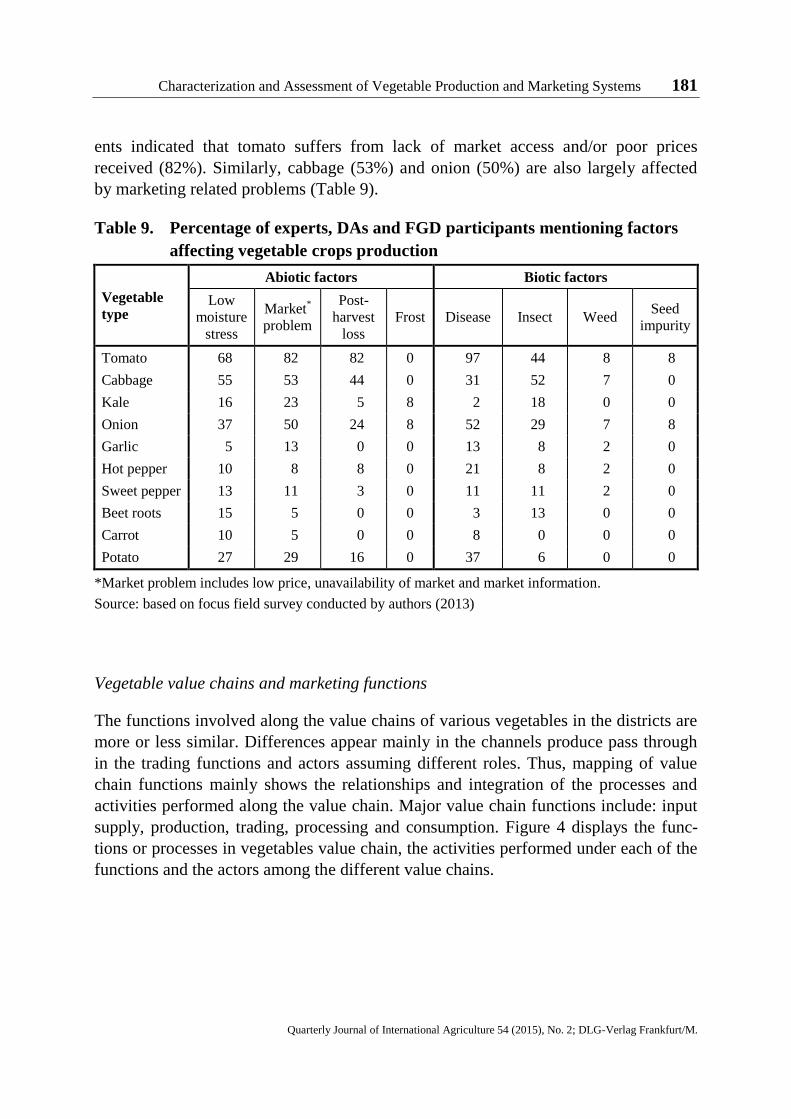
ents indicated that tomato suffers from lack of market access and/or poor prices
received (82%). Similarly, cabbage (53%) and onion (50%) are also largely affected
by marketing related problems (Table 9).
Table 9. Percentage of experts, DAs and FGD participants mentioning factors
affecting vegetable crops production
Vegetable
type
Abiotic factors Biotic factors
Low
moisture
stress
Market*
problem
Post-
harvest
loss
Frost Disease Insect Weed Seed
impurity
Tomato 68 82 82 0 97 44 8 8
Cabbage 55 53 44 0 31 52 7 0
Kale 16 23 5 8 2 18 0 0
Onion 37 50 24 8 52 29 7 8
Garlic 5 13 0 0 13 8 2 0
Hot pepper 10 8 8 0 21 8 2 0
Sweet pepper 13 11 3 0 11 11 2 0
Beet roots 15 5 0 0 3 13 0 0
Carrot 10 5 0 0 8 0 0 0
Potato 27 29 16 0 37 6 0 0
*Market problem includes low price, unavailability of market and market information.
Source: based on focus field survey conducted by authors (2013)
Vegetable value chains and marketing functions
The functions involved along the value chains of various vegetables in the districts are
more or less similar. Differences appear mainly in the channels produce pass through
in the trading functions and actors assuming different roles. Thus, mapping of value
chain functions mainly shows the relationships and integration of the processes and
activities performed along the value chain. Major value chain functions include: input
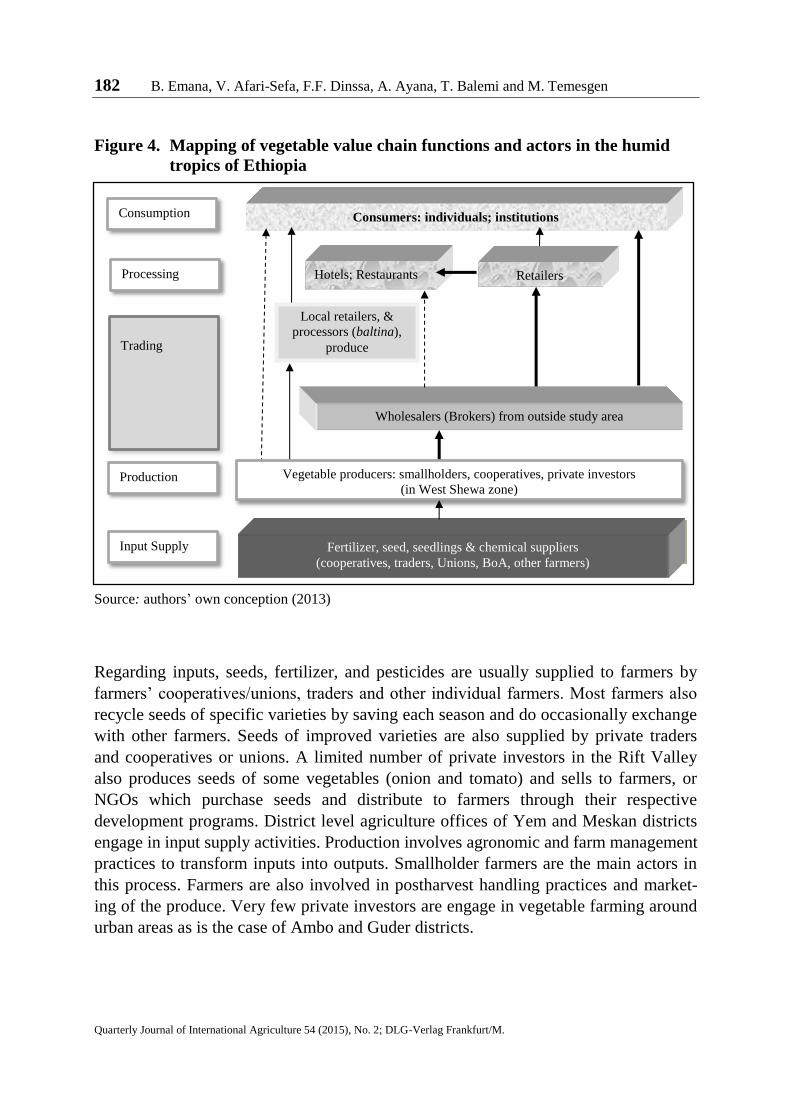
supply, production, trading, processing and consumption. Figure 4 displays the func-
tions or processes in vegetables value chain, the activities performed under each of the
functions and the actors among the different value chains.
182 B. Emana, V. Afari-Sefa, F.F. Dinssa, A. Ayana, T. Balemi and M. Temesgen
Quarterly Journal of International Agriculture 54 (2015), No. 2; DLG-Verlag Frankfurt/M.
Figure 4. Mapping of vegetable value chain functions and actors in the humid
tropics of Ethiopia
Source: authors’ own conception (2013)
Regarding inputs, seeds, fertilizer, and pesticides are usually supplied to farmers by
farmers’ cooperatives/unions, traders and other individual farmers. Most farmers also
recycle seeds of specific varieties by saving each season and do occasionally exchange
with other farmers. Seeds of improved varieties are also supplied by private traders
and cooperatives or unions. A limited number of private investors in the Rift Valley
also produces seeds of some vegetables (onion and tomato) and sells to farmers, or
NGOs which purchase seeds and distribute to farmers through their respective
development programs. District level agriculture offices of Yem and Meskan districts
engage in input supply activities. Production involves agronomic and farm management
practices to transform inputs into outputs. Smallholder farmers are the main actors in
this process. Farmers are also involved in postharvest handling practices and market-
ing of the produce. Very few private investors are engage in vegetable farming around
urban areas as is the case of Ambo and Guder districts.
Retailers
Production
Wholesalers (Brokers) from outside study area
Trading
Local retailers, &
processors (baltina),
produce
Consumers: individuals; institutions Consumption
Processing
Vegetable producers: smallholders, cooperatives, private investors
(in West Shewa zone)
Input Supply Fertilizer, seed, seedlings & chemical suppliers
(cooperatives, traders, Unions, BoA, other farmers)
Hotels; Restaurants
Characterization and Assessment of Vegetable Production and Marketing Systems 183
Quarterly Journal of International Agriculture 54 (2015), No. 2; DLG-Verlag Frankfurt/M.
Marketing functions are mostly carried out by producers, retailers and whole sellers
from outside the study areas. For commodities produced within the study areas, how-
ever, all marketing activities are handled either by retail shops mixing vegetables with
fruits or farmers who sell the products in open markets. At Anlemo and Yem-Special
districts there are no retailers in the value chain performing standard marketing
functions. Wholesaler participation is only for limited commodities (onion, potato and
garlic). In both Ambo and Butajira towns there are also retailers selling vegetables to
urban consumers. Processing of vegetables, in the sense of preserving and value addi-
tion, is not practiced as such in the study areas. Processing is undertaken mainly by
hotels or restaurants in which case fresh and cooked vegetables are sold to consumers.
In major towns of the study areas, very few individuals process potato into chips and
sell by the roadside.
The consumer base includes urban, per-urban and rural dwellers, who buy and con-
sume a wide range of vegetables. Village market consumers and farmers themselves
absorb a substantial volume of the produces. In terms of consumers groups, FGD
participants in Anlemo district were of the opinion that vegetables are mainly pro-
duced for urban consumers with little for their communities.
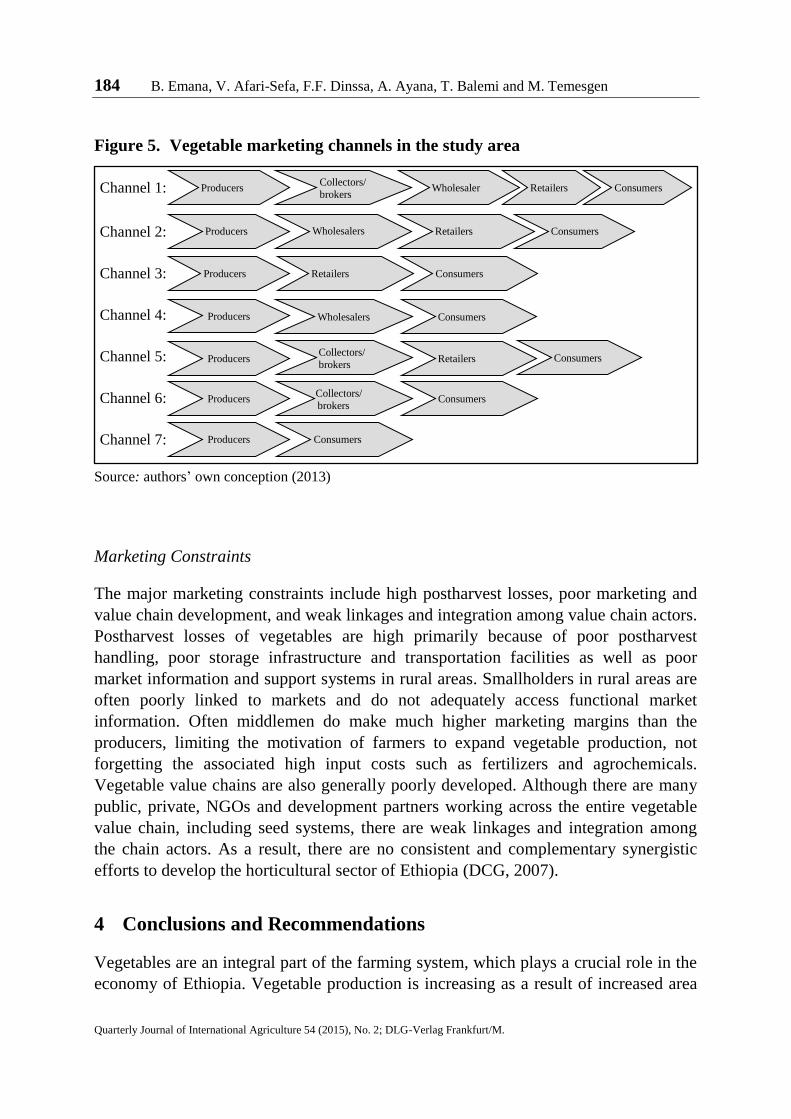
Marketing Channels
Producers sell vegetables through different channels. The shortest channel is direct
sales to consumers as shown in Figure 5 (Channel 4). Producers also sell to local
collectors or wholesalers or retailers. At Yem and Anlemo districts, the marketing
channels were found to be much shorter with produce sold mainly at village markets or
district markets. Retailers are not typically involved in marketing related activities in
these districts. In Meskan district, produce are sent to urban centres and sold in open
markets although few retailers operate. In this case, producers sell the produce to
consumers and retailers as well as to wholesalers based in markets outside the district.
There are approximately 12 vegetable traders at Buta Jira, the capital of Meskan
district. These traders transport the product to other markets including Addis Ababa at
peak supply periods. At Ambo district, about four wholesalers take part in vegetable
marketing serving as major providers to retail shops and hotels in the town.
184 B. Emana, V. Afari-Sefa, F.F. Dinssa, A. Ayana, T. Balemi and M. Temesgen
Quarterly Journal of International Agriculture 54 (2015), No. 2; DLG-Verlag Frankfurt/M.
Figure 5. Vegetable marketing channels in the study area
Channel 1:
Channel 2:
Channel 3:
Channel 4:
Channel 5:
Channel 6:
Channel 7:
Source: authors’ own conception (2013)
Marketing Constraints
The major marketing constraints include high postharvest losses, poor marketing and
value chain development, and weak linkages and integration among value chain actors.
Postharvest losses of vegetables are high primarily because of poor postharvest
handling, poor storage infrastructure and transportation facilities as well as poor
market information and support systems in rural areas. Smallholders in rural areas are
often poorly linked to markets and do not adequately access functional market
information. Often middlemen do make much higher marketing margins than the
producers, limiting the motivation of farmers to expand vegetable production, not
forgetting the associated high input costs such as fertilizers and agrochemicals.
Vegetable value chains are also generally poorly developed. Although there are many
public, private, NGOs and development partners working across the entire vegetable
value chain, including seed systems, there are weak linkages and integration among
the chain actors. As a result, there are no consistent and complementary synergistic
efforts to develop the horticultural sector of Ethiopia (DCG, 2007).
4 Conclusions and Recommendations
Vegetables are an integral part of the farming system, which plays a crucial role in the
economy of Ethiopia. Vegetable production is increasing as a result of increased area
Consumers Retailers Wholesalers
(outside
Producers
Producers Retailers Consumers
Producers
Producers Collectors/
brokers Wholesaler Retailers Consumers
Consumers
Producers Wholesalers Consumers
Producers Collectors/
brokers
Producers Collectors/
brokers
Retailers Consumers
Consumers
Characterization and Assessment of Vegetable Production and Marketing Systems 185
Quarterly Journal of International Agriculture 54 (2015), No. 2; DLG-Verlag Frankfurt/M.
allocation as well as increased yield per unit area as well as area put under production.
Much of the increase in production comes from area expansion and increase in small-
scale irrigation activities, enabling two or more production cycles per year. However,
productivity at smallholders' level is very low compared to yields obtained at research
centers. Production is constrained by diverse abiotic and biotic factors. Lack or limited
access to improved seeds, diseases and insect pests, high postharvest losses and poor
marketing system are the major challenges of the sub-sector with tomato suffering the
most from these challenges. Vegetable marketing is also constrained by lack of market
information systems, poor market linkages, low institutional support, lack of value
chain development to ensure participation and benefit to the smallholders. This neces-
sitates looking into the whole vegetable system development via a value chain
upgrading/development approach.
Based on the findings of the study, the following recommendations are proffered:
i. Improve the technical knowledge and skill of farmers and development agents
in vegetable production and crop protection measures by providing training in
improved production and crop husbandry practices and use of quality inputs so
has to provide effective extension service to increase vegetable yield.
ii. Expand irrigation facilities and improve cost efficiency of irrigation water use
by improving the irrigation system for example by shifting from flood and
furrow irrigation to drip and sprinkler irrigation methods.
iii. Increase public and private sector investment in irrigated vegetable production
to increase the supply of vegetables since analysis of data from commercial
farms revealed higher yield of vegetables compared to smallholder farms due to
increased use improved inputs, particularly irrigation.
iv. Strength research-farmer-extension linkages to develop improved varieties
adapted to diverse biotic and a biotic stresses, and improved management prac-
tices so as to overcome the current production pitfalls to address the wider
observed yield gaps.
v. Develop improved and affordable postharvest handling and storage structures to
prolong shelf life and minimize postharvest losses.
vi. Build the capacity of farmer’s cooperatives/unions so as to provide cooperatives
with much better opportunities for integrating smallholders into vegetable value
chains so that the profit margins of the farmers could be improve.
vii. Engage government and policy makers in frequent dialogues to increase their
awareness so as to enhance widespread implementation of vegetable seed certi-
fication policy/regulations to support vegetable value chain development so that
farmers get sustainable incentive to increase production.
186 B. Emana, V. Afari-Sefa, F.F. Dinssa, A. Ayana, T. Balemi and M. Temesgen
Quarterly Journal of International Agriculture 54 (2015), No. 2; DLG-Verlag Frankfurt/M.
References
ADISH, A. (2012): Micronutrient deficiencies in Ethiopia: Present situation and way forward.
Downloadable at: http://www.epseth.org/a/files/Micronutrient%20Deficiencies%20in%
20Ethiopia.pdf, accessed 11 Nov 2014.
AGONAFIR, Y. (1991): Economics of horticultural production in Ethiopia. ISHS Acta
Horticulturae 270: I International Symposium on Horticultural Economics in
Developing Countries, Acta Hort. (ISHS) 270: 15-20. URL: http://www.actahort.org/
books/270/270_1.htm (referred to 31 March 2015).
AKLILU, S. (2000): Research achievement on variety development and seed production of
vegetable crops in Ethiopia. In: Chadha, M.L., E.C. Altoveros, R. Nono-Womdim and
H. Mndiga (eds.): AVRDC Africa Regional Program 2000. Varietal evaluation and
seed production of vegetable crops. Proceedings of workshop held at AVRDC Africa
Regional Program, Arusha, Tanzania from 29 September to 05 October 1997.
AVRDC ARP Publication No. 2000-2. Asian Vegetable Research and Development
Center – Africa Regional Program, Arusha, Tanzania: 6-11.
ALEMAYEHU, N., D. HOEKSTRA, K. BERHE and M. JALETA (2010): Irrigated vegetable
promotion and expansion: The case of Ada’a District, Oromia Region, Ethiopia.
Improving the productivity and market success of Ethiopian Farmers (IPMS) Case
Study Report, International Livestock Research Institute (ILRI), Addis Ababa,
Ethiopia. Downloadable at: http://cgspace.cgiar.org/handle/10568/1422, accessed on
February 11, 2014.
BAREDO, Y. (2013): Gamo Gofazone diagnosis and planning document. Livestock and
irrigation value chains for Ethiopian smallholders (LIVES) project research report,
Addis Ababa, Ethiopia. Downloadable at: http://www.lives-ethiopia.wikispaces.com/
file/view/Gamo%20Gofa%20, accessed March 10, 2014.
CSA (Central Statistical Agency) (2011; 2013): Large and medium scale commercial farms
sample survey 2010/11. Statistical Abstract Report, Volume VIII and Area and Pro-
duction of Crops and Farm Management Practices, Statistical Bulletin 505, Addis
Ababa, Ethiopia.
– (2012): http://www.csa.gov.et (referred to Crop Production statistics of respective years)
(referred to 19/4/2014).
DCG (Drylands Coordination Group) (2007): Constraints and opportunities of horticulture
production and marketing in eastern Ethiopia. DCG Report # 46 (February), Oslo,
Norway. Downloadable at: http://www.everythingharar.com/publication/Report%20
46.pdf, accessed March 10, 2014.
DEMISSIE, T., A. ALI and D. ZERFU (2009): Availability and consumption of fruits and
vegetables in nine regions of Ethiopia with special emphasis to vitamin A deficiency.
In: Ethiopian Journal of Health Development 23 (3): 216-222.
DESALEGN, L., S. AKLILU, G. TABOR, S. KETEMA and K. ABEBE (2012): Progress, success,
and challenges in Ethiopian vegetable seed system. In: Wold, A.T., A. Fikre, D.
Alemu, L. Desalegn and A. Kirub (eds.): The Defining Moments in Ethiopian Seed
System. Ethiopian Institute of Agricultural Research, Addis Ababa, Ethiopia: 461-476.
EHDA (Ethiopian Horticulture Development Agency) (2011, 2012): Exporting Fruit and
Vegetables from Ethiopia: Assessment of development potentials and investment options
Characterization and Assessment of Vegetable Production and Marketing Systems 187
Quarterly Journal of International Agriculture 54 (2015), No. 2; DLG-Verlag Frankfurt/M.
in the export-oriented fruit and vegetable sector. Addis Ababa, Ethiopia. Down-
loadable at: http://www.diversityabroad.com/administrator/userpics/userimage9194.pdf,
accessed November 19, 2013: 51.
ETHIOPIAN INVESTMENT AGENCY (2008): Investment opportunity profile for tomato pro-
cessing in Ethiopia. Ethiopian Privatization Agency, Addis Ababa, Ethiopia. Down-
loadable at http://www.eap.gov.et/?q=node/817, accessed March 10, 2014.
– (2012): Investment opportunity profile for production of fruits and vegetables in Ethiopia.
Ethiopian Privatization Agency, Addis Ababa, Ethiopia. Downloadable at
http://www.ehpea.org.et/vege%201.htm, accessed March 10, 2014.
ETHIOPIAN REVENUE AND CUSTOMS AUTHORITY (2013): Export of 2013. Addis Ababa.
Downloadable at http://www.erca.go.et, accessed on April 19, 2014.
FAO (Food and Agriculture Organization) (1984): Agroclimatic resource inventory for land
use planning in Ethiopia. Technical Report 2. AG: DP/ETH/78/003. Rome, Italy.
HAJI, J. (2007): Production efficiency of smallholders’ vegetable-dominated mixed farming
System in Eastern Ethiopia: A non-parametric approach. In: Journal of African
Economies 16 (1): 1-27.
TABOR, G. and M. YESUF (2012): Mapping the current knowledge of carrot cultivation in
Ethiopia. Research Report Submitted to Carrot Aid (August), Denmark. Downloadable
at http://www.carrotaid.org/reports/taboryesuf2012.pdf, accessed on April 19, 2014.
TEKLEWOLD, A. and D. MEKONNEN (2012): The Role and Performance of the Formal Seed
System. In: Teklewold, A., A. Fikre, D. Alemu, L. Desalegn and A. Kiruti (eds.): The
Defining Moments in Ethiopia Seed System. Ethiopian Institute for Agricultural
Research, Addis Ababa, Ethiopia.
WEINBERGER, K., and T.A. LUMPKIN (2007): Diversification into horticulture and poverty
reduction: A research agenda. In: World Development 35 (8): 1464-1480.
ZELLEKE, A. and S. GEBREMARIAM (1991): Role of research for horticultural development in
Ethiopia. ISHS Acta Horticulturae 270, International Symposium on Horticultural
Economics in Developing Countries, Acta Hort. (ISHS) 270: 189-196. URL:
http://www.actahort.org/books/270/270_22.htm (referred to 31 March 2015).
Acknowledgements
The financial support of the Integrated Agricultural Systems of the Humid tropics pro-
gram, a CGIAR Research Program for this research study is gratefully acknowledged.
Contact author:
Victor Afari-Sefa
AVRDC - The World Vegetable Center (AVRDC), Eastern and Southern Africa, P.O. Box 10 Duluti,
Arusha, Tanzania
e-mail: [email protected]