Embed Size (px)
Citation preview


:c,hCUUs^,
Of r%P


Digitized by the Internet Archive
in 2011 with funding from
Boston Library Consortium Member Libraries
http://www.archive.org/details/characteristicsoOOelli

1hB31
.M415
working paper
department
of economics
CHARACTERISTICS OF DEMAND FORPHARMACEUTICAL PRODUCTS: AN
EXAMINATION OF FOUR CEPHALOSPORINS
Sarah Ellison, Iain Cockburn,
Avi Griliches, Jerry Hausman
96-24 August, 1996
massachusetts
institute of
technology
50 memorial drive
Cambridge, mass. 02139


CHARACTERISTICS OFDEMAND FORPHARMACEUTICAL PRODUCTS: AN
EXAMINATION OF FOUR CEPHALOSPORINS
Sarah Ellison, Iain Cockburn,
Avi Griliches, Jerry Hausman
96-24 August, 1996

FLp ioa.

Characteristics of Demand for Pharmaceutical Products:
An Examination of Four Cephalosporins
Sara Fisher Ellison, Iain Cockburn, Zvi Griliches, and Jerry Hausman^
August, 1996
^MIT, UBC and NBER, Harvard and NBER, and MIT and NBER, respectively. We would like
to thank Ernst Berndt, Glenn Ellison, Judith Hellerstein, Greg Leonard, Kathryn MacFarlane, and
Frank Wolak, for helpful comments and information, and Fiona Scott Morton and Rachel Vicedo
for research assistance. We would also like to thank those persons at IMS America and Merck
Pharmaceuticals who helped us obtain these data. Finally, we gratefully acknowledge financial
support from the Sloan Foundation grant to the NBER.

Abstract
In this paper we model demand for four cephalosporins and compute own- and cross-
price elasticities between branded and generic versions of the four drugs. We model demand
as a multistage budgeting problem, and argue that such a model is appropriate to the
multistage nature of the purchase of pharmaceutical products, in particular, the prescribing
and dispensing stages. We find quite high elasticities between generic substitutes and also
significant elasticities between some therapeutic substitutes.
Sara Fisher Ellison
MIT Department of Economics
50 Memorial Drive
Cambridge, MA 02139

1 Introduction
Tlie pharmaceutical industry has always been of interest to economists as a large and inter-
nationally competitive industry. It has domestic revenues around 1% of GDP and worldwide
sales from U.S. companies in 1993 of around $85 biUioh (Boston Consulting Group (1993)).
It has also, over the years, been the focus of several spurts of regulatory reform, prompted
by concerns of quality of the products, price of the products, anticompetitive practices,
and so forth. Most recently, the industry has come under policy scrutiny as a component
of a much-debated health care system, with proposals ranging from preserving the current
status of the industry to full price controls on pharmaceuticals. In order to understand
the implications of various proposals, it is important first to understand the market envi-
ronment in which the industry operates. In particular, the degree of price sensitivity, as
measured by own- and cross-price elasticities, in pharmaceuticals is of great importance.
In order to study this issue, we focus on a particular segment of the market for pharmaceu-
ticals, cephalosporins, a type of antiinfective drug, during the late 1980's. We look at four
particular compounds which are close therapeutic substitutes, i.e., they can be prescribed
for many of the same conditions. Three of these drugs lost patent protection and expe-
rienced generic entry during the period in which we study them. We, therefore, are able
to observe patterns of substitution between branded and generic versions of the same drug
(generic substitutes) in addition to those among similar drugs (therapeutic substitutes).^
While the practical and policy motivations for studying the pharmaceutical industry
are strong, the stucture of demand for pharmaceuticals also holds great interest for the
academic researcher. Pharmaceuticals are unusual in that the comsumer of the product is
typically not the one deciding which product to consume and often not the one paying for
the product. This situation contrasts with the standard consumer paradigm in economic
modeling—a single consumer under full information maximizes a utility function subject
Several studies focus more directly on issues surrounding generic entry in pharmaceuticals, such as
determinants of entry, strategic pricing at the time of entry, changes in demand induced by entry, and so
forth. See Caves, Whinston, and Hurwitz (1991), Frank and Salkever (1991,1995), Grabowski and Vernon
(1992), Scott Morton (1995), Stern (1996), and Wiggins and Maness (1995).
to a budget constraint—and raises interesting agency and informational issues. We will
now discuss the typical process of prescribing and dispensing prescription pharmaceuticals
to highlight some of the more interesting academic issues, but also to inform our modeling
strategy and our interpretation of the results.
The process is begun, of course, with a prescription from a physician for a specific drug
for a patient. By "drug" we mean chemical entity, but the prescription may also specify
the form and administration of the drug, the dosage, frequency, and duration at which it
will be administered, and, perhaps, the packaging. The prescription may be written for
the generic name of the drug, or chemical entity, or it may be written for any brand name
under which the drug is sold. Depending on the therapeutic class, physicians may have
quite a bit of scope in the drug they choose to prescribe for a given condition.^
Regarding whether the physician is aware of relative prices, over the years researchers
have found direct evidence that informational limitations might be important {e.g., Steele
(1962), Walker (1971), Temin (1980)). Anecdotal evidence also supports this belief. The
standard reference on pharamaceuticals used by physicians Physicians' Desk Reference has
no information on relative prices. Another reference Drug Facts and Comparisons has
incomplete information about relative prices for some presentations, but comparison across
different drugs is difficult.
Although changes in the last few years in the market for pharmaceuticals will not
be directly relevant to the results in this paper, it is worth mentioning that anecdotal
evidence suggests that physicians are becoming better aware of relative prices. First, Medco,
a managed care drug company, is reported to convince 25% to 50% of the physicians
it contacts to switch (Boston Consulting Group (1993)). Also, Hellerstein (1994) finds
the "physicians who treat many patients who belong to an HMO or other Pre-Paid Plan
prescribe generics more frequently to all their patients [emphasis added]." These findings
^For example, several chemically distinct but similarly working H2 antagonists are available and used in
the treatment of duodenal ulcers. Several angiotensin converting enzyme (ACE) inhibitors, again chemically
distinct but with similar working mechanisms, are used in the treatment of hypertension. Also, many types
of bacterial infections are susceptible to numerous chemically distinct antibiotics, some number of which
could be used to effectively treat them. (See Drug Facts and Comparisons.)

suggest that physicians contacted by managed care drug companies or affiliated with HMO's
have a greater awareness of relative prices."* As more physicians are joining these ranks {New
York Times (1994), Boston Consulting Group (1993))), the state of knowledge of physicians
about prices should continue to improve, on average. Finally, pharmaceutical marketing
aimed at physicians is becoming a source of information on prices of some drugs, in sharp
contrast to pharmaceutical marketing of the past."*
Next we discuss the question of physicians' incentives. Incentives to and constraints
on physicians are supplied by HMO's and managed care programs to which the physician
might belong as well as formulary lists and rules of other organizations. For instance,
a physician affiliated with an HMO might be told to try to prescribe a particular H2
antagonist, for instance, whenever possible, with the threat of losing his affiliation with
the HMO should he prescribe a more expensive H2 antagonist in too many cases, or when
he cannot medically justify his choice. This source of constraints, relatively rare ten years
ago, is becoming increasingly important, due to the recent growth in managed care health
insurance (see above references). Another possible (but undoubtedly less important) source
of incentives is a price-sensitive patient's threat to switch to a physician who prescribes lower
cost pharmaceuticals. For the purposes of our study, estimating a demand system before the
most significant managed care penetration, it is quite possible that whatever incentives and
constraints a physician encounters in prescription writing are not strong. While later on in
this paper we will estimate models which will allow us to directly observe price sensitivity,
'Managed care drug companies simply contact physicians on the phone and inform them of price and
characteristic differences, trying to persuade them to switch prescriptions. They have no authority over the
physicians, so it would be difficult to attribute change in behavior to something other than an informational
eflfect. While this different behavior by physicians who treat many HMO patients could be attributed to the
HMO's incentives to or restrictions on the physician, the fact the behavior extends to all patients treated
at least suggests that there is an informational effect.
^Advertising for ACE inhibitors is an example: price guarantees and rebates are an important compo-
nent of the marketing, even that targeted to physicians. For example, Parke Davis offers a "single agent
guarantee," a pledge to pay for any other hypertension medications a patient needs to take, with their ACE
inhibitor Accupril. Ciba Geigy offers a "lifetime price guarantee," a promise to rebate any subsequent price
increases to the payor, with their ACE inhibitor Lotensin. Both of these offers play an important role in
the marketing aimed at physicians.

we have already identified potential reasons why the degree of price sensitivity might be
less than optimal {i.e., less than a fully informed single agent might have).
After the physician writes the prescription, the second stage in the process begins,
dispensing of the product. Just as the physician often has choice in prescription-writing,
there is often some scope for choice in what product to dispense, typically only in the
CcLse of "multisource" drugs, i.e., drugs which have lost patent protection and are, as a
result, supplied by a number of manufacturers.^ As of 1989, all states had laws which at
least allow pharmacists to substitute cheaper generic versions when dispensing, assuming
the physician does not explicitly prohibit such substitution on the prescription. Again,
analogous questions arise at this second stage of the process: are dispensing pharmacists
aware of relative prices, and under what incentives and constraints do they operate in
choosing what product to dispense. First, it is clear that for the most part, a dispensing
pharmacist is aware of relative prices. Second, in addressing the question of incentives and
constraints, we note that pharmacies have higher relative markups on generics and will
often have an incentive to dispense the cheaper generic version (Grabowski and Vernon
(1992)). Constraints on their behavior include state mandatory substitution laws^ and
rules and constraints placed on pharmacists who are affiliated with or being reimbursed by
insurance companies, HMO's, government agencies, or other oganizations. For instance, an
HMO might run its own pharmacy and require substitution of cheaper generic versions even
if the substitution law in that state did not require it. In sum, these potential information
and agency problems seem more serious at the first stage of the pharmaceutical buying
process, the prescription stage, than at the second stage, the dispensing stage.
The technique we use is modeling the demand for these drugs as a two-stage budgeting
problem. The problem facing the decision maker is the following: It is first decided which of
the drugs to use. Then it is decided whether to purchase the branded or generic version of
^All of these products would be certified by the FDA to liave chemically identical active ingredients and
to be "bioequivalent," so-called "generic" versions of the diug.
*TweIve states require substitution of a cheaper generic version unless explicitly prohibited by the physi-
cian according to the Pharmaceutical Manufacturers Association.

the drug, if the generic exists. Using data on prices and quantities of the various drugs, we
estimate this decision tree, or demand system. We think that the approach of multistage
budgeting is particularly appropriate for modeling the demand for pharmaceuticals, due to
the multistage nature of the process itself. The stages we use correspond roughly to the
different decision makers in the process of choosing a pharamaceutical product, as discussed
above. First, the chemical compound is chosen. Typically, the prescribing physician makes
this decision. Second, the branded or generic version of that particular drug is chosen,
typically by the dispensing pharmacist, sometimes in conjunction with the patient and
often constrained by laws, insurance company policies, or both. Modeling this process by
multiple stages allows us to isolate and focus on one stage or the other, thereby gaining clues
to the behavior of the two different groups of decision makers. We can also estimate the
matrix of cross-price elasticities for the pharmaceutical products in both their branded and
generic forms. Upon estimation of the demand system, we find evidence of substantial price
sensitivity in the choice between generic substitutes and less evidence of price sensitivity
in the choice among therapeutic substitutes. This basic result is borne out in subsequent
elasticity estimates: high cross-price elasticities between generic substitutes and lower, often
insignificant, cross-price elasticities between pairs of therapeutic substitutes.
The structure of the paper is as follows: In Section 2 we introduce the model of demand.
In Section 3 we describe the four drugs we study in the paper and our data set on them. In
Section 4, Estimation and Results, we discuss the empirical implementation of the model
and estimation techniques and, in Subsections 4.2 and 4.3, the results from our base model
and variations on it. In Subsection 4.4 we discuss the computation of a therapeutic group
price index based on our demand system estimates. We conclude in Section 5.
2 The Model
The models of demand we will use are variants of a model of multistage budgeting due to
Gorman (1971). (See Hausman, Leonard, Zona (1992) and Hausman, Leonard, McFadden
(1993) for examples of empirical implementation of these models.) Commodities can be
partitioned into groups so that a choice within a group is made conditional on choice of

that group. We essentially construct a tree to represent the structure of choice, where the
bottom level of the (inverted) tree has a node for each commodity, and each level of the
tree represents an ever-coarser partition of the commodities. Conceptually, a consumer
moves down the tree toward an eventual purchase by considering the attributes of the
commodities which could be reached by each branch and a price index of the commodities
of each branch. In estimating such a model, we place some structure on the cross-price
elasticities of all of the commodities—enough to allow us to estimate systems with even a
large number of commodities—but still allow free estimation of elasticities between every
pair of commodities in a group and between every commodity and every other group. We
think this feature of the model is particularly important because the most similar products,
products in the same group, will have higher cross-price elasticities and benefit more from
free estimation of them.
Although multistage budgeting is often used to make constrained estimation of a large
number of cross-price elasticities possible, we employ it here for an additional reason, men-
tioned in the introduction. Parsimony in parameters is always desirable, but perhaps as
strong a motivation for us is that the two stages correspond, at least roughly, to the two
different decision makers in the purchase of a drug, prescribing physicians and dispensing
pharmacists, and, therefore, afford us the ability to focus on either one of those decisions
separately. In other words, whereas structure is often placed on the pattern of cross-price
elasticities in a system in order to just be able to estimate them, we feel imposing this
structure is particularly easy to justify because the two stages are a natural way to mod-
el demand for pharmaceuticals. Also, normal concerns about the utility consistency of
a demand system are of less importance in our empirical setting, due to the different a-
gents operating.^ The natural grouping of technologically similar products in this empirical
setting is an argument for our approach over, say, a nested logit model. In addition, an
important theoretical advantage of a nested logit, aggregability, seems less important in
an empirical setting with a multitude of purchasing agents such as ours. Finally, while
^One could actually think of performing a direct test of agency in this market by testing parameter
restrictions implied by utility theory; however, since these restrictions are often rejected in empirical work
where no agency issues exist, the value of such a test is questionable.

a discrete choice model has an advantage over ours in accomodating new goods at upper
levels of the tree, that advantage is not crucial in our setting because we see no entry above
the branded/generic level during our time period. See Stern (1995) for an interesting ap-
plication of the nested logit methodology to pharmaceutical products and a discussion of
its advantages, and see Anderson, de Palma, and Thisse (1992) for a general discussion of
such models.
The diagram below shows the structure of the tree for our specific case.
The Four Cephalosporins
cephalexin cefadroxil cephradine cefaclor
branded generic branded generic branded generic branded
The model we use has two levels,^ the top level representing demand for the four drugs
of interest separately and the bottom level representing demand for the generic or branded
versions of each drug. A "group" in the more general discussion is, therefore, a "drug"
here, and group members would be the branded and generic versions of that drug.
We model the choices at both levels similarly to Hausman, Leonard, and Zona (1992).
We begin at the bottom level. We describe the consumer's choice between a branded and
*In the estimation section we mention one specification with an extra equation on top for the demand
of cephalosporins relative to the demand for penicillin and cephalosporins.

generic version with the following equation:
bottom : spb = "OD + Pd log(r£)/pD) + fDb log(pDi) + fOg iog{pDg)
The left side of each equation, S£)b, is the revenue share of the branded version of drug D
{D = 1 (cephalexin), 2 (cefadroxil), 3 (cephradine)). The right side variables are r£)/pp,
the revenue of drug D over the weighted price of drug D, and pDb and p^g, the prices of
the branded and generic versions of drug D. We think of T£)/p£, as playing the role of
quantity. It is the dependant variable in the top level. We do not have a share equation
for the cefaclor group, of course, because branded share = 1. This equation is essentially
the Almost Ideal Demand System of Deaton and Muellbauer (1980). Also, it is natural to
constrain fob = —iDg, thus making the assumption that consumers only care about the
relative prices of branded and generic versions once they have decided on a particular drug.
We can calculate conditional elasticities, i.e., elasticities conditional on expenditure on
a particular drug, using only parameters and variable values from these equations. We
differentiate, holding r^, constant, and obtain
D d\og qi 1 f dlogpD \^ dlogpj SDb [ dlogpj
J^
^J
for the case when product i is the branded version. The expression for the case when
product i is generic is similar. Note that this conditional elasticity is only defined for
products i and j in the same group, here just denoted group D. Here we use 1[.] for the
indicator function for condition [•]. We use a Stone weighted price, logpD = II,Silogp,,
where 5, is the revenue share of the drug within group D; therefore, gj°^^" = s-j (= s^i,
for product j being the branded version of drug D).
For the top level we describe a consumer's choice among the four drugs with the following
equation:
top : log(gD) = T]oD + ^D log(fi) + ^1 log(pi ) + 62 log(p2) + <53 log(p3) + ^4 log(p4)
The left side of each equation (we have four equations) is the log of the quantity of drug D.
The right side has the logs of R, total revenue for all cephalosporins, and pp, D = 1,2,3,4,
weighted prices of the four drugs. The quantity consumed of each drug, then, is described as
8
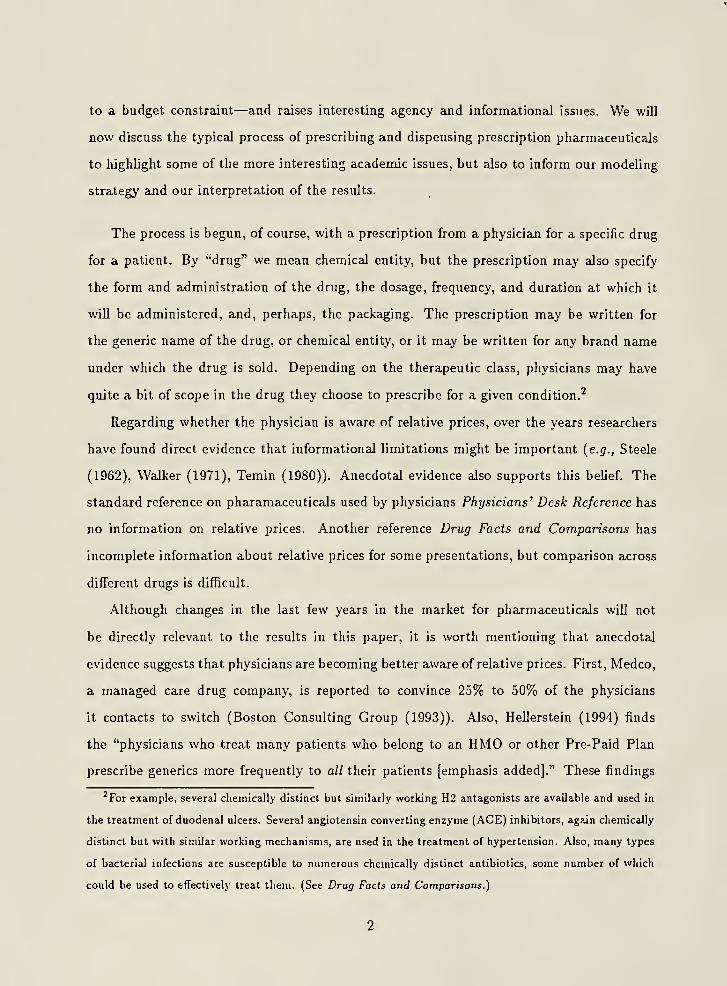
a function of the total revenue and the weighted prices of each of the four drugs. Note that
our specification does not impose adding up at the top level because the revenue measure
is total revenue for all cephalosporins.
We can also compute "unconditional" elasticities (elasticities conditional on total ex-
penditure on cephalosporins). We substitute the top level equation into the bottom level
equation for log(r£)/pjD) = log{q£)) and differentiate. We obtain
e;,- =a c 91o6(pr>;)
, ^ 1
'J ~ „ 1/3 V^3QOD. + Pd. Et=l 4 log(Pfc) + iD.b log(pD.6) + iDig logCpD.a)
glog(7-D.)
^ 51og(p,)''=^1
Using the chain rule and properties of the Stone weighted price, we then calculate
e.-j = — [Pd.SdjSj + iDb^UeD.]} + «il[3€^.] + ^^j^^ ~ h=j]
These elasticities are defined for all pairs of products.
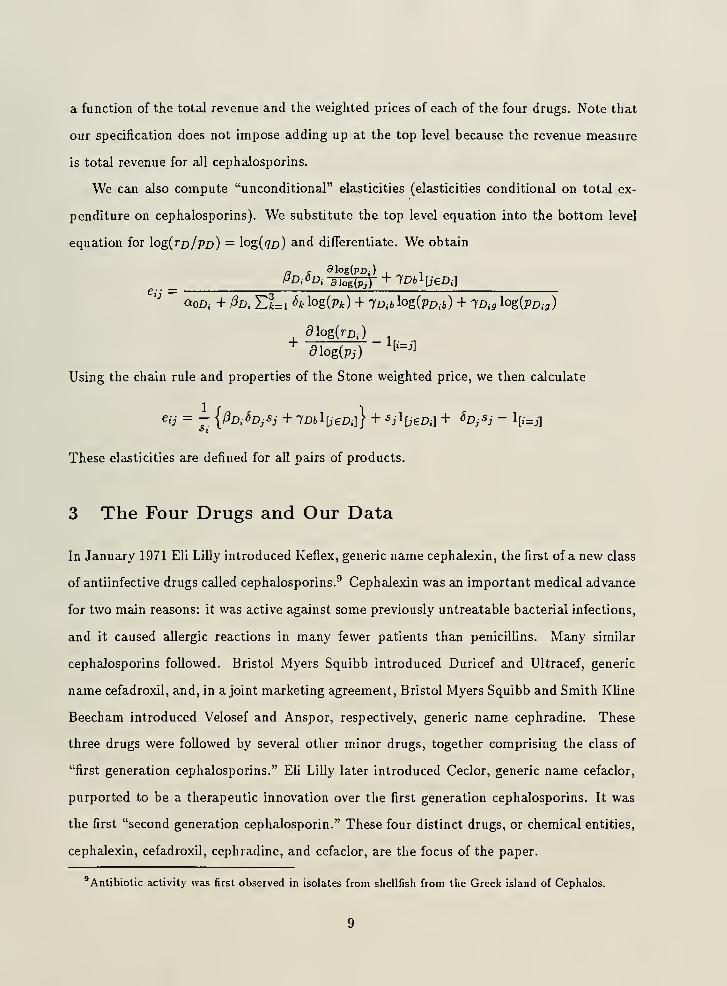
3 The Four Drugs and Our Data
In January 1971 Eli Lilly introduced Keflex, generic name cephalexin, the first of a new class
of antiinfective drugs called cephalosporins.^ Cephalexin was an important medical advance
for two main reasons: it was active against some previously untreatable bacterial infections,
and it caused allergic reactions in many fewer patients than penicillins. Many similar
cephalosporins followed. Bristol Myers Squibb introduced Duricef and Ultracef, generic
name cefadroxil, and, in a joint marketing agreement, Bristol Myers Squibb and Smith Kline
Beecham introduced Velosef and Anspor, respectively, generic name cephradine. These
three drugs were followed by several other minor drugs, together comprising the class of
"first generation cephalosporins." Eli Lilly later introduced Ceclor, generic name cefaclor,
purported to be a therapeutic innovation over the first generation cephalosporins. It was
the first "second generation cephalosporin." These four distinct drugs, or chemical entities,
cephalexin, cefadroxil, cephradine, and cefaclor, are the focus of the paper.
'Antibiotic activity was first observed in isolates from sliellfish from the Greek island of Cephalos.

A number of characteristics of these drugs suggest that the four, or at least three, are
close substitutes in a technological sense. The first three molecules are very similar in
chemical structure. Cefaclor's chemical structure is less similar to the other three than
they axe to each other, and chemical structure may be a proxy for unmeasured attributes.
All four drugs are active against much the same types of organisms. See Table 1. Table 2
lists approved indications, i.e., disease states or conditions for which the FDA has approved
use of a drug.^° While there is less overlap than in Table 1, it should be noted that drugs
can be, and often are, prescribed for conditions other than their labeled indications. The
degree of overlap of indications here may underrepresent the degree to which these products
can be safely and effectively substituted. Finally, all four drugs are sold primarily in oral
dosage forms, an important clinical consideration. In contrast, many other cephalosporins
are, for the most part, administered intravenously, in a rather different clinical setting.
We chose to examine this group of drugs for several reasons: Firstly, as we discussed
above, three of the drugs have similar treatment and side effect profiles and can be substi-
tuted in many situations. The fourth may be a therapeutic improvement over the first three
in some circumstances. We can, therefore, study therapeutic substitution in this setting.
Secondly, three of the compounds lost patent protection^^ within a 26-month period and
experienced significant generic entry. Cephradine lost patent protection in January 1987,
cephalexin in April 1987, and cefadroxil in March 1989. This significant generic entry allows
us to study generic substitution in this setting. Thirdly, these are widely prescribed drugs,
and they constitute a substantial segment of the pharmaceutical market. Over the time
period October, 1985, to December, 1991, total wholesale sales to drugstores and hospitals
in the US of the four drugs was $2,529,000,000.
Finally, we should mention that the generic entrants for the drug cefadroxil experienced
some legal problems during the period of time of our data. The incumbent argued that
'"The information from both Tables 1 and 2 comes from Drug Facts and Comparisons.
We use the term "patent protection" somewhat loosely here as any type of protection that would have
precluded generic entry until a specific date. The exclusive right to sell the drug in the US enjoyed by the
incumbent could be the result of the FDA withholding or delaying ANDA approval to new manufacturers,
for instance, rather than the normal protection from entry conferred by a patent.
10

generic entrants had infringed upon a relevant patent, and the entrants eventually had
to withdraw their products (after our data period). This pending litigation quite possibly
affected consumer choices between the branded and generic versions of the drug—drugstores
might not have wanted to buy and stock large quantities of a drug that they would then
be prevented from selling. This eifect could be exacerbated by the fact that our data are
at the wholesale level.
The data for this project come initially from IMS America, a firm which does marketing
research for the pharmaceutical industry.^'^ Merck Pharmaceuticals was also helpful in
allowing us access to their library of IMS data. We have data on all antiinfective drugs,
but we wiU be concentrating attention on the four previously mentioned. The data are
in the form of a monthly time series from October 1985 to March 1991 of quantity and
revenue of wholesale sales at the level of manufacturer/drug presentation, ^"^ separated by
hospital and drugstore sales. The IMS information on presentation was coded to allow
consistent comparison across drugs, manufacturers, and presentations, using Drug Facts
and Comparisons and Physicians ' Desk Reference. Almost all of the presentations for all
four drugs are orally administered. Of the total sales over our data period for the four
drugs we study, 93% was sold to drugstores and 7% to hospitals. See the table below
for the respective revenue shares of these three drugs in the drugstore, hospital, and total
markets.
^"'This data set is similar to the one used in Griliches and Cockburn (1994), and much of the groundwork
they established in constructing that data set was useful to us.
*^A presentation is a particular choice of packaging and doseform for a product, for example, 150 mg
coated tablets in bottles of 100, or 25 ml of 5% aqueous solution in a vial for intravenous injection. A drug
will often be sold in many presentations simultaneously.
11

Revenue Shares
drugstore hospital
cephalexin 28% 2% 30%
cefadroxil 14% 1% 15%
cephradine 3% 1% 4%
cefaclor 48% 3% 51%
93% 7% 100%
The model is estimated using derivative, or aggregate, data of these data. For exam-
ple, for cephalexin, the branded manufacturer sold 29 different presentations, and there
were 341 different generic^'* manufacturer/presentation combinations. (It is sometimes dif-
ficult to identify particular generic manufacturers, so we will stick with this cruder count
of combinations.) The branded manufacturers sold 30 presentations each of cefadroxil and
cephradine, and there were 78 and 97 different generic manufacturer/presentation combi-
nations, respectively. The branded manufacturer sold 16 presentations of cefaclor. The
derivative data are obtained by first classifying each record three ways: as drugstore or
hospital sales, by drug, and as branded or generic manufacturer, thus producing fourteen
classes. We then aggregate monthly revenues by class and compute Divisia price indices
by class. ^^ Note that these price indices reflect only price changes in existing presentations
within each class. A new presentation of a drug will only affect the price index, there-
fore, if its price changes at a different rate than the other presentations after its entry. Its
price changes are, of course, weighted by revenue. The seven "products" we obtain are
then cephalexin, cefadroxil, and cephradine, all three in branded and generic versions, and
branded cefaclor. We have each of these products in both markets, hospitals and drug-
stores. We then link the price indices for the four (or two) classes within each drug using
^*We use the term "branded manufacturer" as a synonym for incumbent, or holder of exclusivity or patent
rights, and "generic manufacturer" as a synonym for entrant. Some "generic manufacturers" are actually
large drug companies with well-known names.
'^VVe aggregate over presentation for two reasons. First, the large number of presentations of each drug
which come into and out of the market would pose serious computational problems. Second and more
important, we want to abstract away from the less economically interesting issue of choice of presentation.
12

weighted price ratios of common presentations in the first or entering month. (The Stone
weighted price which appears in the top level of our demand system will, therefore, reflect a
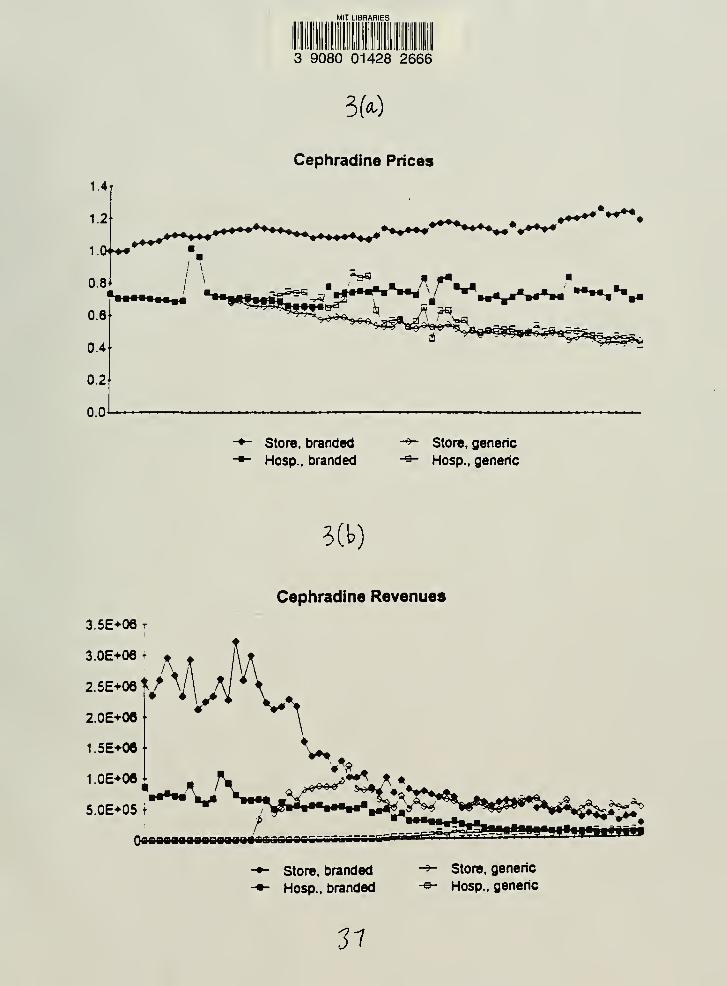
large price decrease when generics enter.) Figures l(a)-4(a) show all fourteen of these price
indices. ^^ In Figures l(b)-4(b) we show all fourteen revenue series. Finally, we compute a
quantity index by dividing revenue by the price index for each of the fourteen series.^^
It should be noted that an implicit assumption in the creation of this data set is that
generic manufacturers are equivalent, or that their products are perfect substitutes. This
assumption could be problematic in some classes of drugs. For instance, in drugs used for
chronic conditions, patients often form loyalties to one particular generic because of tablet
shape or color, perhaps. In addition, some "generic" manufacturers try to induce product
differentiation by promoting their own brand names, such as the name Advil being given
to generic Motrin, ibuprofen. Neither situation occurs with our set of drugs, so we feel
more justified in our assumption. Also, it should be noted that our revenues and prices
are wholesale measures. Unfortunately, retail revenues and prices were not available to us.
We are primarily interested in the general pattern of elasticities, though, and that pattern
which we estimate from the wholesale data should be fairly robust to reasonable markup
policies. Finally, we should point out that while IMS gathers data on detailing and other
advertising in the pharmaceutical industry, we do not have those data for the drugs we
study here.
^^Figure 3(a), Cephradine Prices, reflects a stange two-month spike in prices near the beginning of our
data period. While we are not sure what might have caused the spike, we are fairly sure it was an actual
price increase rather than a mistake in the data: it appears in several presentations of the drug and lasts
for two months instead of just one.
* There were other methods of aggregation over presentations available to us. For instance, we could have
computed quantity by adding up number of doses or number of milligrams of active ingredient, say, for each
presentation. Number of doses, however, is not necessarily a well-defined object, especially if different doses
are recommended for different indications and certain presentations are used disproportionately for those
indications. Number of milligrams of active ingredient is problematic for similar reasons. Also note that
since aggregation is done within a drug, quantity never has to be compared between drugs.
13

4 Estimation and Results
4.1 Estimation
In discussing the empirical implementation of the model presented in Section 3, two main
issues arise, what econometric techniques to use in estimating the system and which, if any,
instruments to use at each level of the system. First note that the basic equations we will
be estimating are those of the model presented earlier with additive errors. We use the data
discussed in Section 3, essentially monthly time series of price and revenue for the seven
drug products, by drugstore and hospital sales separately. We add additional explanatory
variables in certain specifications, which we discuss later. We estimate the model both
equation by equation (using OLS or 2SLS) and as a system (using SUR or SURIV). Note
that the equations will not, in general, have the same number of observations due to generic
entry during our data period. We, therefore, estimate the bottom level equations, the
branded budget share equations for each drug, using only data after generic entry for each
drug, but estimate top level equations, the quantity equations for each drug, using data for
the whole time period. The top level estimates, then, reflect the reactions to generic entry
in each of the drugs.
Another issue is the treatment of endogenously determined variables. In particular, we
would like to find supply-shifting instruments for endogenous prices in order to identify
demand. The first question is which prices, if any, are endogenous. If the prices for
individual drugs are predetermined and hard to change—we have reasons to believe they
might be^^—the necessity of instrumenting is lessened. It is also possible that the nature of
competition might give us some insight into the question of identification. If, for instance, a
generic fringe with two or more firms is perfectly competitive, then generic prices, at least,
are not endogenous and no instrument is necessary. These arguments assume consistent
pricing strategies, an assumption perhaps more palatable for our relatively short time series
and during a period before managed care effected important changes.
'*We also feel somewhat justified in this belief by inspection of the branded price series. While branded
price movements are not inconsistent with short run strategic behavior, some of the series very much resemble
a predetermined pricing strategy.
14

Not being willing to assume exogeneity ex ante, we turn to the issue of suitable instru-
ments. Typical cost-shifting instruments are unavailable at the level of individual drug.
One possibility is exploiting a changing competitive environment to identify demand. The
idea is that if demand is fairly stable over time but prices are changing due to different s-
trategic responses by the firms in the market, we should be able to trace out demand curves.
Following Stern (1996) and Feenstra (1995), the number of firms in the market could be
such an indicator of a changing competitive environment.^^ The power of the instrument
depends on the equilibrium being a function of the number of firms. A competitive fringe,
mentioned above, would be an example where this instrument would have little or no pow-
er. The validity of the instrument depends on demand not shifting either as the result of
or the cause of a changing competitive environment, and in general it might be suspect.
For instance, firms could be entering or exiting a market in response to changing demand
characteristics. Such a concern might be relatively less important in new markets created
by patent expiration. New generic firms could simply be entering over time exogenously
because they have different lead times to start manufacturing a new product.
Finally, one possible source of instruments is the drugstore/hospital split in the data.
The two markets are almost entirely independent in the sense that it would be difficult for
a consumer to substitute between them. Also, the two markets would experience the same
manufacturing cost shocks to a great extent, if any existed or were important. It might be
possible, therefore, to use drugstore prices as instruments for hospital prices, and vice versa.
The two markets could also experience the same demand shocks, though, an epidemic of
ear infections or favorable news about the efficacy of the drug, for instance, thus making
the instruments invalid. We touch on this problem in the next subsection. This approach
is similar in flavor to Hausman, Leonard, and Zona (1992), who use prices in different cities
as instruments for each other.
'^Actually we use the number of different presentations produced by different manufacturers because
linking up generic manufacturers across presentations is not always possible in our data set. This variable
would also be an indicator of competitive environment using the reasoning above.
15
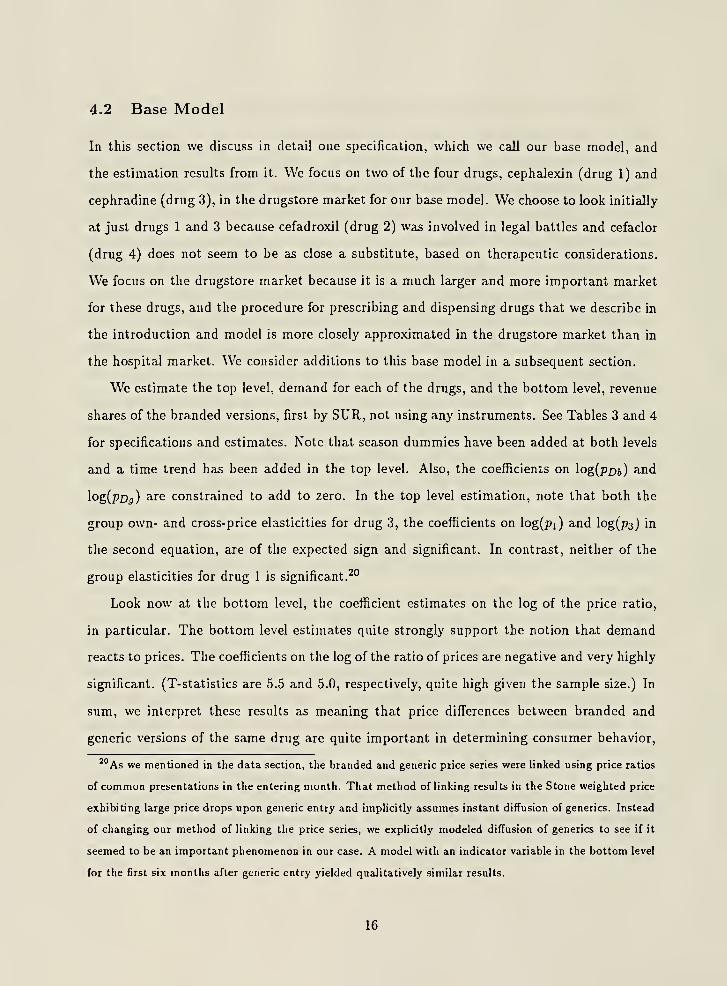
4.2 Base Model
In this section we discuss in detail one specification, which we call our base model, and
the estimation results from it. We focus on two of the four drugs, cephalexin (drug 1) and
cephradine (drug 3), in the drugstore market for our base model. We choose to look initially
at just drugs 1 and 3 because cefadroxil (drug 2) was involved in legal battles and cefaclor
(drug 4) does not seem to be as close a substitute, based on therapeutic considerations.
We focus on the drugstore market because it is a much larger and more important market
for these drugs, and the procedure for prescribing and dispensing drugs that we describe in
the introduction and model is more closely approximated in the drugstore market than in
the hospital market. We consider additions to this base model in a subsequent section.
We estimate the top level, demand for each of the drugs, and the bottom level, revenue
shares of the branded versions, first by SUR, not using any instruments. See Tables 3 and 4
for specifications and estimates. Note that season dummies have been added at both levels
and a time trend has been added in the top level. Also, the coefficients on log(p£)(,) and
log(pDg) are constrained to add to zero. In the top level estimation, note that both the
group own- and cross-price elasticities for drug 3, the coefficients on log(pi) and log(;j3) in
the second equation, are of the expected sign and significant. In contrast, neither of the
group elasticities for drug 1 is significant.^°
Look now at the bottom level, the coefficient estimates on the log of the price ratio,
in particular. The bottom level estimates quite strongly support the notion that demand
reacts to prices. The coefficients on the log of the ratio of prices are negative and very highly
significant. (T-statistics are 5.5 and 5.0, respectively, quite high given the sample size.) In
sum, we interpret these results as meaning that price differences between branded and
generic versions of the same drug are quite important in determining consumer behavior,
^"As we mentioned in the data section, the branded and generic price series were linked using price ratios
of common presentations in the entering month. That method of linking results in the Stone weighted price
exhibiting large price drops upon generic entry and implicitly assumes instant diffusion of generics. Instead
of changing our method of linking the price series, we explicitly modeled diffusion of generics to see if it
seemed to be an important phenomenon in our case. A model with an indicator variable in the bottom level
for the first six months after generic entry yielded qualitatively similar results.
16

but differences in the prices between different drugs seem to be less important, or perhaps
harder to identify, although still relevant.
The conditional elasticities appear in Table 5 and the four by four matrix of uncon-
ditional elasticities appears in Table 6. We use the delta method to compute standard
errors. We compute elasticities at the mean values for all of the variables computed over
the relevant sample period for each equation.
Look first at Table 5, the conditional elasticities. Recall that the only coefficient esti-
mates used to calculate these elasticity estimates are from the bottom level. These elasticites
are price elasticities between branded and generic versions of a drug holding expenditure
on that drug constant. (Since expenditure, not quantity, is held constant, it is possible
to obtain the unusual looking result that both quantities can decrease when a price is in-
creased even though expenditure is held constant.) Note that for both drugs 1 and 3,
own-price elasticities are negative and less than -1. Cross-price elasticities are positive. Al-
so, generic own-price elasticities are always larger (in magnitude) than branded own-price
elasticities—we might expect generic consumers to be more price sensitive than branded
consumers.
We now look at Table 6, unconditional elasticities, and find that our interpretation
of the coefficient estimates is borne out by the elasticity estimates. Note fairly large and
significant elasticities, in patterns similar to the conditional elasticities, in a block diagonal
pattern, i.e., between products and their generic substitutes. In addition the elasticities
of drug 3 with respect to the prices of drug 1 are mostly significant (both statistically
and economically). Our main conclusion is that demand for a branded (generic) drug
seems to respond to price changes in the generic (branded) form of it, and sometimes to
changes in price levels of close therapeutic substitutes in this particular segment of the
pharmaceutical market. In other words, as a consumer moves down the decision tree,
his choice seems to be somewhat affected by price differences when choosing between the
two drugs which are fairly close therapeutic substitutes. Once that decision is made, price
differences seem to be quite important in deciding between the branded and generic versions
of the drug. Such a conclusion is an important piece to understanding the nature of demand
17

for pharmaceuticals.
Stern (1996) estimates a demand system for pharmaceuticals and obtains results at
variance with ours. Specifically, he finds low cross-price elasticities between branded and
generic versions of the same drug and high cross price elasticities between therapeutic
substitutes. Both his data set—he examines drugs in several therapeutic categories—and
his estimation technique—he estimates a nested logit model—are different from ours, so it
would be difficult to determine the source of the divergence. We do, however, think that
an advantage of our approach over his is the free estimation of the cross-price elasticities of
branded and generic versions of the same drug and would, therefore, place more confidence
in those conditional elasticity estimates of our model. Certainly, further comparison of
these two estimation techniques would be of interest.
In addition to just estimating our base model with SUR, we tried different estimation
techniques, SURIV and OLS equation by equation. We are interested in part in comparing
these estimates to the SUR estimates and in checking the robustness of our general result.
The parameter estimates for these two estimations appear in Tables 7 and 8. The instru-
ments we use for SURIV are the previously mentioned ones based on the drugstore/hospital
split and on the number of manufacturers.
Look first at the SURIV estimates. Using hospital instruments, the top level estimates
no longer exhibit any significant group elasticities. The bottom level estimates for drug 1,
though, exhibit the same pattern as the SUR bottom level estimates, although the price
coefficient is smaller in magnitude. The coefficient for drug 3 is no longer significant. While
differences might be expected given we are instrumenting for prices in this estimation, the
instrumenting is making the price coefficients smaller in magnitude, not larger as we would
expect. The instruments may, in fact, be picking up demand shocks, such as cefadroxil's
patent litigation. Using the number of manufacturers as an instrument, we produce results
very similar to the SUR estimates. All of the same estimates are significant and they each
have the same sign except for one. With the manufacturer instruments, we are not only
concerned about the validity of them, but we practically reproduce the SUR estimates.
Using hospital instruments, the SURIV estimates are less decisive than the SUR estimates.
18

We will, therefore, focus on the SUR estimates.
Look now at the OLS estimates. We do have some strong correlations between residuals
from different drugs, and such strong correlations could be the result of a shock common
across drugs on which we do not have data or some non-price effect that the drugs are
having on each other. In any case, it is advisable for us to estimate these equations as
a system using SUR given the correlations. Such high residual correlations might be an
argument for considering including the other two drugs in our estimation, since there are
also high residual correlations between cefadroxil equations and equations from the other
drugs.
4.3 Models with Different Sets of Drugs
We now consider alternative models with different sets of drugs. We estimate a model
including cefadroxil, i.e., a model with the three first generation cephalosporins we consider,
and also a full model with all four drugs. We originally omitted cefadroxil (drug 2) from
the analysis because its legal battles probably affected consumers' choices in a manner that
we did not capture in our model. There are, however, arguments for at least considering a
model with cefadroxil. Even if its coefficient estimates are not important or interpretable,
its presence may affect other coefficient estimates. As mentioned before, residuals from some
of the equations are fairly highly correlated. Also, it is, we believe, the closest substitute to
cephalexin and cephradine, based on therapeutic characteristics. We add the caveat that
since generic cefadroxil entered almost two years later than the other two generic drugs,
the sample size used to estimate the bottom level equation for cefadroxil is much smaller
than the other two, resulting in less precisely estimated coefficients. We also estimate a
model with the three original drugs plus cefaclor (drug 4), a potential substitute. We chose
to include it in one specification of our model because, outside the other three, it seemed
to be one drug which might be a fairly close substitute. Including it in the analysis will let
us know if its presence affects demand for the other three drugs.
Tables 9 and 10 have the top and bottom level estimates for these two models. In
both of the models, drug 3 estimates at the top level are significant and reasonable. Drug 2
19

estimates are significant but difficult to interpret. Others are not significant. At the bottom
level, estimates change very little for drugs 1 and 3 from the base model. The bottom level
price coefficient for drug 2 is not significant. Again, we find in both of these models that
price effects at the bottom level are fairly strong and at the top level are somewhat weaker.
Drug 2 results, as we said, are hard to interpret.
Table 11 is the seven by seven matrix of elasticities from the model with aU four drugs.
Elasticities for drug 2 are problematic, but, despite that, our main qualitative conclusion
remains: demand reacts fairly strongly to price changes in generic substitutes and somewhat
to price changes in therapeutic substitutes in this particular segment of the pharmaceutical
market.
In an earlier version of this paper we estimated a fuU four-stage decision tree to de-
termine the extent to which substitution to goods outside this smaller system might be
affecting our results. (See Goldberg (1995) for a discussion of the bias associated with the
omission of outside goods.) We estimated two additional layers of the demand system, one
representing the choice of the class of drugs, cephalosporins, among all antibiotics, and the
second representing the choice of our drugs among all cephalosporins.'^^ The qualitative
result—high own- and cross-price elasticities within a drug and low cross-price elasticities
between drugs—was actually more pronounced in this model.
4.4 A Price Index Calculation
The estimated demand system and elaticities that we present here are of interest themselves,
of course, but they can also lead to interesting post-estimation calculations, such as a calcu-
lation of consumer surplus derived from the demand system, or conjectural variation-type
calculations based on either the assumption of a monopolistic incumbent or a competitive
generic fringe. We offer another such example here, the calculation of a therapeutic group
price index, based on estimated parameters in the demand system.
Generics are an interesting instance of the "new goods problem" in price index construc-
^'The bottom two levels of the demand system remain the same, except that revenue in the "top" equation
is now total revenue for our drugs, not for all cephalosporins. We instrumented for prices in the top two
levels with cost-shifting instruments, wages in the chemical industry and the PPI for chemicals.
20

tion, a topic receiving renewed attention as the potential biases inherent in procedures used
by official statistical agencies have come under scrutiny. When new products appear in the
marketplace, standard practice in the US and most other countries has been is to make no
direct comparison between new products and old products: once identified, new products
are included in the basket of goods used to calculate a price index, but only movements
in their prices after the date of entry contribute to changes in the aggregate index. Any
absolute price differential between new goods and comparable existing goods is entirely
ignored. This may be a reasonable procedure for truly new goods, for which there are no
comparable existing products, but may not be appropriate for many products for which
close substitutes are available. Generic versions of existing drugs are a case in point: the
FDA certifies them to be perfect substitutes for the existing branded version (in the sense
of being "therapeutically equivalent"), while until very recently the principal producer of
price statistics, the BLS, has treated them as completely unrelated products.
The theoretical solution to the new goods problem is well known (see Hicks (1940)
and Fisher and Shell (1972)): products appearing in period 1 should be "linked in" to
the aggregate index using a period reservation price at which the quantity demanded is
just equal to zero. To compute the implicit price decline for the new good at the moment
of entry requires, of course, an estimate of this reservation price. In this section we use
the estimated demand equations to compute these prices for the new generic versions of
cephalexin, cefadroxil, and cephradine, and compare the resulting price indices with those
that would be obtained using alternate methods. See Hausman (1994) for a similar exercise
involving breakfast cereal.
Table 12 presents results. As a basis for comparison, we first compute a price index for
the four drugs using a procedure which attempts to replicate the way in which the BLS
computes the PPI: this is a Laspeyres index with a fixed basket of goods and fixed weights
based on revenue shares from the base period. ^^ We update the basket of goods and their
item weights in the index twice: once in 1986Q4 and then again in 1989Q4, which is twice
^^The rather serious problems with this procedure and resulting large upward biases in price indices for
pharmaceutical products have been documented elsewhere (Berndt, Griliches, and Rosett (1993), Griliches
and Cockburn (1994)). The BLS is revising its treatment of pharmaceutical products in the CPI and PPI.
21

as fast as the BLS revises its samples. Nonetheless the resulting price index captures the
appearance of generics only with long lags and with relatively small weights: despite the
much lower prices for generics and their rapid gains in market share, over the sample period
this fixed-weights Laspeyres index grows at an annualized rate of 8.65 percent. The size
of the bias generated by the fixed weights approach can be inferred from the growth rate
of a chained Paasche index which makes no direct comparisons between brand and generic
versions of the same drug, but continuously updates the item weights (line 2 of Table 12).
The difference between the two is large: the chained Paasche index grows at 6.69 percent
per year, implying an upward bias imparted by the fixed weights approach of 2 percent per
year.
Most importantly, however, this procedure "links out" the very substantial price declines
experienced by purchasers who switch to generics once they become available. Taking the
FDA at its word, sales of generics are just lower-priced transactions in existing products.
Under this assumption, which will be used in future by the BLS in computing the PPI for
pharmaceuticals, generics can be "linked in" simply by averaging prices over brand and
generic versions of each drug. A chained Paasche index across the four drugs using this
assumption grows at 4.35 percent per year, which is less than half of the annual growth
rate of the fixed weights Laspeyres index. The fact that not all purchasers switch to the
generic version makes the "FDA" assumption somewhat problematic, however, and a better
alternative may be to use the demand estimates computed above which treat brand and
generic versions of the drug as differentiated products. In the last line of Table 12 we give
the results of computing a chained Paasche index where generics are linked in using the
implicit price declines computed from the demand estimates above. This index rises at an
annual rate of 5.37 percent, which we believe gives a better indication of the impact of
patent expirations on price changes and welfare.
5 Conclusion
The results from our model of demand as a multistage budgeting problem lead us to our
basic conclusion that there is fairly high demand elasticity between generic substitutes,
22

products with chemically identical active ingredients produced by different companies, a-
mong the drugs we observed. Demand elasticity was smaller but often significant between
therapeutic substitutes, chemically distinct drugs that can be used to treat many of the
same conditions, in the drugs we observed. Taken in conjunction with our knowledge of
the structure of the prescribing and dispensing process, our results suggest some price
sensitivity at both the prescribing and dispensing stages.
We think these results are important for a number of reasons. First, these elasticity
estimates are of interest for the standard reasons: they could be used to determine firm
conduct in this industry, say, or help in the construction of price indices. But due to current
policy interest in the pharainceutical industry and academic interest in the pharmaceuti-
cal purchasing process, these elasticities take on additional interest and importance. Our
results suggest some price sensitivity at both stages of the purchasing process, but we see
stronger evidence at the dispensing stage than at the prescribing stage. Depending on the
degree to which health care policy makers believe these products are close substitutes in
a technological sense, our results could point to possible scope for policy reforms, such as
more effective dissemination of information on prices to physicians. Since we think there
have been major changes in the industry and the market for pharmaceuticals over the last
few years, it would be interesting to perform studies using more recent data to see what
effects these changes may have had.
23

References
[1] Anderson, S.P., A. de Palma, J. Tliisse (1992), Discrete Choice Theory of Product
Differentiation, Cambridge, MA: The MIT Press.
[2] Baye, M., R. Maness, S. Wiggins (1992), "Demand Systems and the 'True' Subindex
of the Cost-of-Living for Pharmaceuticals," mimeo.
[3] Berndt, E., Z. Griliches, J. Rosett (1993), "Auditing the Producer Price Index: Mi-
cro Evidence from Prescription Pharmaceutical Products," Journal of Business and
Economic Statistics, vol 11, no 3, 251-264.
[4] The Boston Consulting Group, Inc. (1993), "The Changing Environment for U.S.
Pharmaceuticals," mimeo.
[5] Caves, R., M. Whinston, M. Hurwitz (1991), "Patent Expiration, Entry and Compe-
tition in the U.S. Pharmaceutical Industry," Brookings Papers on Economic Activity:
Microeconomics, 1-66.
[6] Deaton, A. and J. Muellbauer (1980), Economics and Consumer Behavior, Cambridge,
UK: Cambridge University Press.
[7] Drug Facts and Comparisons (1991), St. Louis: J. P. Lippincott Company.
[8] Feenstra, R. (1995), "Generics and New Goods in Pharmaceutical Price Indexes: Com-
ment," mimeo.
[9] Fisher, F. and K. Shell (1972), The Economic Theory of Price Indices, New York:
Academic Press.
[10] Frank, R. and D. Salkever (1992), "Pricing, Patent Loss and the Market for Pharma-
ceuticals," NBER Working Paper.
[11] Frank, R. and D. Salkever (1995), "Generic Entry and the Pricing of Pharmaceuticals,"
NBER Working Paper.
24

[12] Goldberg, P.K. (1995), "Product Differentiation and Oligopoly in International Mar-
kets: The Case of the US Automobile Industry," Econometrica, vol 63, no 4, 891-951.
[13] Gorman, W. (1971), "Two Stage Budgeting,", luimeo.
[14] Grabowski, H. and J. Vernon (1992), "Brand Loyalty, Entry and Price Competition
in Pharmaceuticals after the 1984 Drug Act," Journal of Law and Economics, vol 35,
no 2, 331-350.
[15] Griliches, Z. and I. Cockburn (1994), "Generics and New Goods in Pharmaceutical
Price Indexes," American Economic Review, vol 84, no 5, 1213-1232.
[16] Hausman, J. (1994), "Valuation of New Goods Under Perfect and Imperfect Compe-
tition," MIT Working Paper.
[17] Hausman, J., G. Leonard, D. McFadden (1995), "A Utility- Consistent Combined Dis-
crete Choice and Count Data Model: Assessing Recreational Use Losses Due to Natural
Resource Damage," Journal of Public Economics, vol 56, no 1, 1-30.
[18] Hausman, J., G. Leonard, D. Zona (1994), "Competitive Analysis with Differentiated
Products," Annales, D'Economie et De Statistique, vol 34, no 1, 159-180.
[19] Hellerstein, J. (1996), "The Importance of the Physician in the Generic versus Trade-
name Decision," mimeo.
[20] Hicks, J. (1940), "The Valuation of Social Income," Economica, vol 7, no 26, 105-124.
[21] Physicians Desk Reference (1993), New York: Medical Economics Data.
[22] Steele, H. (1962), "Monopoly and Competition in the Ethical Drug Market," Journal
of Law and Economics, vol 5, 142-43.
[23] Scott Morton, F. (1995), "Barriers to Entry, Brand Advertising and Generic Entry in
the U.S. Pharmaceutical Industry," Stanford GSB Working Paper.
[24] Stern, S. (1996), "Product Demand in Pharmaceutical Markets, " mimeo.
25

[25] Temin, P. (1980), Taking Your Medicine, Cambridge: Harvard University Press.
[26] New York Times (1994), "A Shift of Power in Pharmaceuticals," May 9.
[27] Walker, H. (1971), Market Power and Price Levels in the Ethical Drug Industry,
Bloomington: Indiana University Press.
[28] Wiggins, S. and R. Maness (1995), "Price Competition in Pharmaceuticals: The Case
of Antiinfectives," mimeo.
26

Table 1: SUSCEPTIBLE ORGANISMS
cephalexin cefadroxil cephradine cefaclor
(Keflex) (Duricef, Ultracef) (Velosef, Anspor) (Ceclor)
Staphylococci + * + *
Streptococci, beta-hemolytic * + *
Streptococcus pneumoniae * * * *
Escherichia coli+ * * +
Hemophilus influenzae + * +
Klebsiella sp + + *
Moraxella catarrhalis t*
Neisseria gonorrhoeae t
Proteus mirabilis * * * *
Bacteroides sp +
Peptococcus sp t
Peptostreptococcus sp t
* generally susceptible, | demonstrated in vitro activity
27

Table 2: INDICATIONS
cephalexin
(Keflex)
cefadroxil
(Duricef, Ultracef)
cephradine
(Velosef, Anspor)
cefaclor
(Ceclor)
lower respiratory
tract infections + + +
upper respiratory
tract infections + + + +
otitis media * * *
skin infections + * +
urinary tract
infections * * +
bone infections +
GU infections +
perioperative
prophylaxis +
28

Table 3: TOP LEVEL ESTIMATES, base model
log(9D) = VOD + moS + Tj2Dt + ^£»log(r)+
^ilog(pi) + (53log(p3) + ei
estimates (standard errors)'
1
log(r)
log(pi)
log(p3)
0.2604 (0.1020)
0.2076 (0.1845)
-0.3291 (0.3552)
3
log(r)
log(pi)
logCpa)
0.4073 (0.1070)
0.7910 (0.1948)
-0.8952 (0.3774)
'These standard errors, along with those in
subsequent tables, are not robust.
Table 4: BOTTOM LEVEL ESTIMATES, base model
SDb = QOD -f QiD^" -f /3d ^Og{rD IPd) + lDb{^Og{pDblVDg)) + ^2
estimates (standard errors)
log(ri/pi)
Iog(pifc/pi5)
-0.0339 (0.0739)
-0.1328 (0.0242)
log(7-3/p3)
I0g(p36/P35)
-0.0274 (0.0685)
-0.6689 (0.1327)
29

Table 5: CONDITIONAL ELASTICITIESt, base model
brand generic
1 brand
generic
-1.16* 0.21*
0.35 -1.45*
3 brand
generic
-1.99* 1.04*
1.88* -2.96*
'The elasticity in the i''^ row and j"' column is the
demand elasticity of product i with respect to the
price of product j conditional on drug expenditure.
*'s denote significance at the 5% level.
Table 6: UNCONDITIONAL ELASTICITIESt, base model
1 brand 1 generic 3 brand 3 generic
1 brand -0.38* 1.01* -0.20 -0.21
1 generic 0.79* -1.04* -0.09 -0.10
3 brand 0.52* 0.53* -1.93* 1.12*
3 generic 0.21 0.23* 2.00* -2.87*
'The elasticity in the i'*' row and j"^ column is the demand elasticity of product
i with respect to the price of product j . *'s denote significance at the 5% level.
30
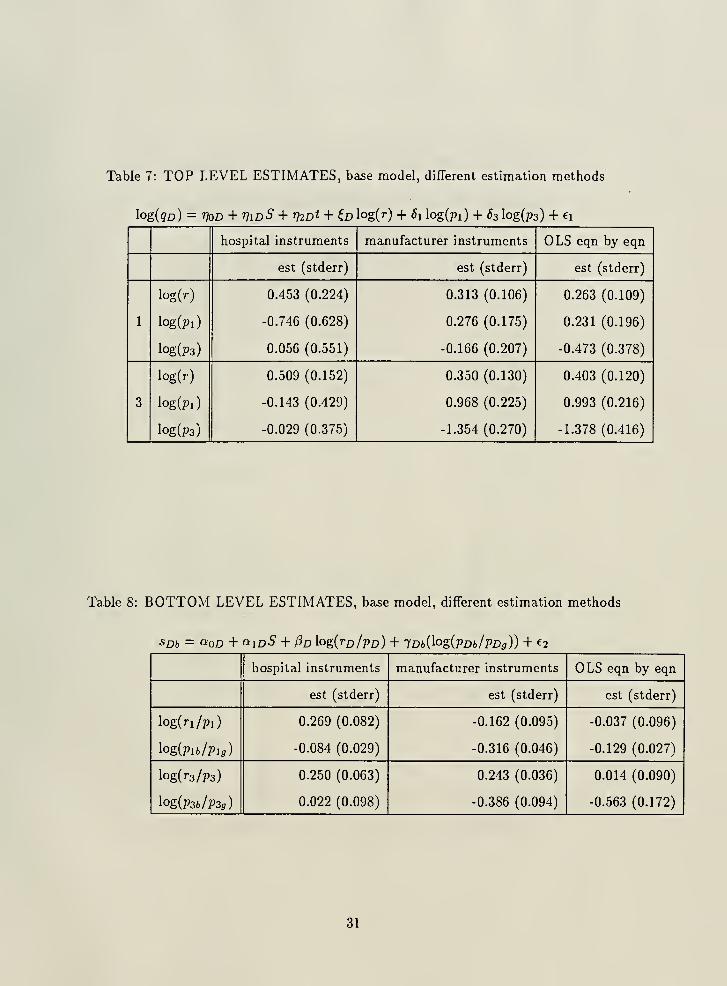
Table 7: TOP LEVEL ESTIMATES, base model, different estimation methods
log(gD) = VoD + r]iDS + mot + iD log(7-) + ^1 log(pi) + ^3 log(p3) + ei
hospital instruments manufacturer instruments OLS eqn by eqn
est (stderr) est (stderr) est (stderr)
1
log(r)
log(pi)
log(P3)
0.453 (0.224)
-0.746 (0.628)
0.056 (0.551)
0.313 (0.106)
0.276 (0.175)
-0.166 (0.207)
0.263 (0.109)
0.231 (0.196)
-0.473 (0.378)
3
log(r)
log(pi)
log(p3)
0.509 (0.152)
-0.143 (0.429)
-0.029 (0.375)
0.350 (0.130)
0.968 (0.225)
-1.354 (0.270)
0.403 (0.120)
0.993 (0.216)
-1.378 (0.416)
Table 8: BOTTOM LEVEL ESTIMATES, base model, different estimation methods
SDb = OiQD + OiidS -\- /3d log{ro/pD) + lDb{^Og{pDblPDg)) + ^2
hospital instruments manufacturer instruments OLS eqn by eqn
est (stderr) est (stderr) est (stderr)
log(ri/pi)
log(pifc/pi3)
0.269 (0.082)
-0.084 (0.029)
-0.162 (0.095)
-0.316 (0.046)
-0.037 (0.096)
-0.129 (0.027)
log(r3/p3)
log(P36/P3g)
0.250 (0.063)
0.022 (0.098)
0.243 (0.036)
-0.386 (0.094)
0.014 (0.090)
-0.563 (0.172)
31

Table 9: TOP LEVEL ESTIMATES, models with different drugs
Jog(9D) = VoD + VwS + V2Dt + Tfyoh + io log(r) + 6i log(pi
h log(p2) + ^3 log(p3) + ^4 log(p4) + ei
)+
drugs 1, 2, 3 drugs 1, 2, 3, 4
estimates (std errors) estimates (std errors)
log(r) 0.278 (0.108) 0.283 (0.109)
log(Pi) 0.197 (0.188) 0.213 (0.189)
1 log(P2) -0.074 (0.168) -0.067 (0.168)
log(7>3) -0.321 (0.355) -0.356 (0.355)
log(p4) -0.326 (0.660)
log(r) 0.131 (0.138) 0.174 (0.130)
log(pi) 0.875 (0.240) 0.966 (0.225)
2 log(P2) 0.987 (0.215) 1.045 (0.202)
log(P3) -0.854 (0.454) -1.037 (0.427)
log(p4) -2.461 (0.790)
log(r) 0.312 (0.107) 0.307 (0.107)
log(pi
)
0.839 (0.190) 0.809 (0.188)
3 log(p-2) 0.472 (0.169) 0.443 (0.168)
log(p3) -0.912 (0.360) -0.865 (0.358)
log(p4) 0.744 (0.655)
log(r) 1.144 (0.053)
log(pi) 0.165 (0.092)
4 log(7'2) 0.075 (0.082)
log(p3) 0.043 (0.174)
log(p4) -0.487 (0.323)
32

Table 10: BOTTOM LEVEL ESTIMATES, models with different drugs
SDb = OioD + QidS + Pd \og{TDlpD) + iDbi^O^iVDblPDg)) + ^2
drugs 1, 2, 3 drugs 1, 2, 3, 4
estimates (std errors) estimates (std errors)
log(ri/pi)
log(Pib/Pis)
-0.042 (0.072)
-0.140 (0.024)
-0.043 (0.071)
-0.140 (0.024)
Iog(r2/p2)
log(P26/P25)
0.203 (0.059)
-0.058 (0.141)
0.194 (0.058)
-0.117(0.135)
log(7-3/p3)
^Og{PZblPZg)
-0.029 (0.068)
-0.671 (0.132)
-0.044 (0.067)
-0.712 (0.129)
Table 11: UNCONDITIONAL ELASTICITIESt, model with all drugs
1 brand 1 generic 2 brand 2 generic 3 brand 3 generic 4 brand
1 brand -0.39* 1.02* -0.06 -0.06 -0.22 -0.23 -0.22
1 generic 0.82* -1.07* 0.01 0.00 -0.09 -0.11 -0.10
2 brand 0.79* 0.72* 1.06* 2.30* -0.81* -0.75* -2.38*
2 generic 4.25* 2.14* 3.88 -4.34 -4.41* -2.50* -0.08*
3 brand -0.28 -0.26 0.40* 0.43* -1.96* 1.12* 0.49
3 generic -0.18 -0.15 -0.04 0.01* 2.14* -2.97* 0.26
4 brand 0.34* 0.08* 0.09 0.00 0.14 0.06* -0.49
TThe elasticity in the f'^ row and j^^ column is the demand elasticity of product i with
respect to the price of product j. *'s denote significance at the 5% leveL
33

Table 12: PRICE INDICES
index average annual growth rate
fixed weights Laspeyres 8.65
chained Paasche
no link 6.69
"FDA" link 4.35
reservation price link 5.37
34

iw
1.8
1.6
1.4
1.2
1.0"
0.8
0.6'
0.4}
0.2
0.0
Cephalexin Prices
^^ >»*> »'
store, branded
Hosp., branded
Store, generic
Hosp., generic
Itb)
3.0E+07y
2.5E+07t *
2.0E+07?/ A1.5E+07
1.0E+07
5.0E+06
Cephalexin Revenues
J^/
Os?
-•- Store, branded
-^ Hosp.. branded
Store, generic
Hosp., generic
?r

wCefadroxii Prices
Store, branded
Hosp., branded
Store, generic
Hosp., generic
Z(t)
1.6E+07I
1.4E+07
1.2E+07
1.0E+07f
8.0E+06
6.0E+0fl
4.0E+06
Cefadroxii Revenues
../.^y^^^-^^''"'^ ^
V
2.0E+06 I
oettssttsti n C* »-» I 1. Irf..»^^—"''»"M''*i"***ltB"l !!!***iJ^?5fS
store, branded
Hosp., branded
Store, generic
Hosp., generic
^6
MIT LIBRARIES
3 9080 01428 2666
3W
Cephradine Prices
Store, branded
Hosp., branded
Store, generic
Hosp., generic
..^^.
mCephradine Revenues
3.5E+06 T
3.0E+06 r
2.5E+06 tf\l
2.0E+06
1.5E+06
5.0E*05 "''"^'^rS^^^^^ll^^^
-•- Store, branded-^ Hosp., branded
Store, generic
Hosp., generic
31

oU»«««i«»««*«*««"*^
4WCefaclor Prices
Mi iiiil
^ ^******
1.2
1.
0.8
0.6}
0.4
0.2
0.0
Store, branded -^ Hosp., branded
Cefaclor Revenues
store, branded -^ Hosp., branded
5232 i25 3^