Embed Size (px)
Citation preview
Park and ride: Characteristics and demand forecasting September 2007 Land Transport New Zealand Research Report 328

Park and ride: Characteristics and demand forecasting
Mike Vincent Booz Allen Hamilton
Land Transport New Zealand Research Report 328
ISBN 0−478−28741−0
ISSN 1177–0600
© 2007, Land Transport New Zealand PO Box 2840, Waterloo Quay, Wellington, New Zealand Telephone 64-4 931 8700; Facsimile 64-4 931 8701 Email: [email protected] Website: www.landtransport.govt.nz
Vincent, Mike. 2007. Park and ride: Characteristics and demand forecasting.
Land Transport NZ Research Report 328. 131 pp.
Booz Allen Hamilton, PO Box 10926, Wellington
Keywords: Park and ride, P&R, public transport, travel, forecasts, model,
alternative, usage, international, review, objectives, data
An important note for the reader
Land Transport New Zealand is a Crown entity established under the Land Transport New Zealand Amendment Act 2004. The objective of Land Transport New Zealand is to allocate resources in a way that contributes to an integrated, safe, responsive and sustainable land transport system. Each year, Land Transport New Zealand invests a portion of its funds on research that contributes to this objective.
The research detailed in this report was commissioned by Land Transport New Zealand.
While this report is believed to be correct at the time of its preparation, Land Transport New Zealand, and its employees and agents involved in its preparation and publication, cannot accept any liability for its contents or for any consequences arising from its use. People using the contents of the document, whether directly or indirectly, should apply and rely on their own skill and judgement. They should not rely on its contents in isolation from other sources of advice and information. If necessary, they should seek appropriate legal or other expert advice in relation to their own circumstances, and to the use of this report.
The material contained in this report is the output of research and should not be construed in any way as policy adopted by Land Transport New Zealand but may be used in the formulation of future policy.

Acknowledgements
The author would like to thank the following for their assistance with this project.
Dick Bullock − Peer review
Nick Manson − Greater Wellington Regional Council
Pete Clark − Auckland Regional Transport Authority
Stuart Woods − Christchurch City Council
5
Contents
Executive summary................................................................................... 7
Abstract ...................................................................................................11 PART 1: KEY CHARACTERISTICS OF PARK AND RIDE (P&R)..............................13
1. Introduction ....................................................................................15 1.1 Scope and structure of paper.......................................................15
2. Part 1 overview ...............................................................................15 2.1 What is P&R? ............................................................................15 2.2 Scope of section ........................................................................16
3. Objectives, policy context and success factors.................................16 3.1 General policy objectives and target markets .................................16 3.2 New Zealand policies and experience ............................................17
4. P&R usage.......................................................................................20 4.1 Usage indicators ........................................................................20 4.2 P&R usage as a proportion of public transport trips .........................20 4.3 P&R usage as a proportion of commuter trips.................................21 4.4 New Zealand facilities and usage..................................................22
5. Alternative modes and influencing factors .......................................24 5.1 Alternative means of travel .........................................................24 5.2 Service characteristics ................................................................26 5.3 Site catchments.........................................................................29 5.4 Reasons for use and non-use.......................................................30
6. Overall transport system impacts ....................................................35 6.1 Effects on public transport use.....................................................35 6.2 Effects on road traffic levels ........................................................36
7. Key success factors .........................................................................38 PART 2: REVIEW OF INTERNATIONAL MODELLING PRACTICES ........................43
1. Part 2 overview ...............................................................................45 2. P&R modelling overview..................................................................45
2.1 Background ..............................................................................45 2.2 Forecasting approaches ..............................................................46
3. P&R model development..................................................................48 3.1 Post-modelling techniques...........................................................48 3.2 Regional modelling.....................................................................49 3.3 Site-specific modelling................................................................54 3.4 Stated/revealed preference studies ..............................................56
4. Summary.........................................................................................62 PART 3: ANALYSIS AND MODEL DEVELOPMENT FOR WELLINGTON ...................65
1. Part 3 overview ...............................................................................67 2. Modelling frameworks adopted........................................................67 3. Development of a P&R site catchment model ...................................68
3.1 Overview..................................................................................68 3.2 Observed access characteristics ...................................................68 3.3 Catchment model estimation .......................................................72
4. Regional modelling approach...........................................................76
6
4.1 Overview ................................................................................. 76 4.2 Data ....................................................................................... 76 4.3 Model estimation....................................................................... 79 4.4 Scenario testing........................................................................ 84
5. Site-specific modelling approach..................................................... 87 5.1 Overview ................................................................................. 87 5.2 Context and dataset .................................................................. 88 5.3 Model estimation....................................................................... 93 5.4 Scenario testing........................................................................ 96
6. Summary .......................................................................................102 Appendix A References ..........................................................................104 Appendix B P&R policies in New Zealand urban transport strategies ......107 Appendix C Detailed usage of P&R facilities ...........................................110 Appendix D NZ market research related to P&R .....................................119 Appendix E Trial stated preference survey of P&R usage........................126 Abbreviations and acronyms ..................................................................131
7
Executive summary
This report was developed by Booz Allen Hamilton as part of the Land Transport New
Zealand Research Programme 2004–2005, primarily to examine the modelling of park and
ride (P&R) public transport usage in a New Zealand context. The report provides an
overview of the concept of P&R, as well as local and international evidence on the usage
and support of P&R schemes. International modelling methodologies are summarised and
approaches are then applied to a New Zealand situation.
Key characteristics
P&R attempts to combine the benefits of both car and public transport (PT) use into an
efficient and effective system by providing car parking facilities well outside the central
area of the city and linking the facilities to the central city by public transport services.
Rail station car parks are a ‘classic’ example of P&R and have been used for many years
in both Auckland and Wellington and in many other cities internationally. More recently,
there has been a surge of interest in and development of bus-based P&R schemes,
particularly in Auckland with the success of the Northern Busway.
The main objective of P&R policies is to transfer parking demand from the central
business district (CBD) to suburban/urban fringe locations to achieve the following
benefits:
• reducing traffic and congestion levels on urban radial routes and in the CBD itself
• correspondingly reducing the need/pressure for increased road capacity and reducing
emission levels, energy use and other environmental impacts
• reducing the amount of parking required in the CBD (where land is scarce and expensive
and large car parks may be out of scale with the CBD townscape) and replacing it with
parking in other locations (where land is cheaper and more readily available).
P&R may also help to increase the level of service and cost-effectiveness of PT provision,
by concentrating PT demand on the major line haul routes (between the P&R site and the
CBD) and reducing the need for PT services in low-density suburban areas, which are
difficult to serve cost effectively.
The evidence indicates that the most essential and almost universally applicable criterion
for the success of P&R schemes is a shortage of reasonably priced central area parking.
Where this criterion does not apply, then P&R is only likely to succeed if there is an
exceptionally high level and quality of PT service linking the parking site with the CBD.
Other key features required for the success of P&R schemes are:
• appropriate car park sites, in terms of location and facilities/design
• separate PT corridor/lane and/or PT priority measures
PARK AND RIDE: CHARACTERISTICS AND DEMAND FORECASTING
8
• appropriate information and marketing of the scheme
• adequate personal and car security at the P&R site.
In essence, the basic requirement for success is that access to the CBD via P&R needs to
be competitive with the use of the car for the whole trip in terms of perceived generalised
costs (quality, reliability, comfort, travel time, out-of-pocket costs etc).
In the United Kingdom, rail-based P&R is very well established and plays a major role for
movements to inner London, while bus-based P&R has been developed mainly over the
last 20 years in a number of cities, and there has been a resurgence of interest in such
policies over the last few years. In the United States, P&R plays a major role in
association with a number of rail and bus-based line haul services. In Australia, rail-based
P&R plays a major role in the larger eastern states cities; while bus-based P&R plays a
major role with the Adelaide O-Bahn.
P&R is presently operational (in a formal way) in two New Zealand cities, Auckland and
Wellington. P&R is being further pursued in these regions through inclusion in regional
transport strategies and other localised studies.
There is general support for P&R in Auckland, particularly as a result of the recently
developed Bus Rapid Transport (BRT) system, where P&R sites have been consistently
over-utilised. P&R studies are currently taking place in the Rodney District to examine
potential station parking sites around Orewa. Also, the regional public transport model
includes specialised modelling of access to public transport via P&R sites.
Wellington already has a developed P&R system for the rail network, and the Greater
Wellington Regional Council (GWRC) sees improvements and increases in capacity over
the short to medium term. In particular, there are plans to improve lighting and security
at existing sites, as well as the introduction of new sites to coincide with new rail stations
on the western line. Other opportunities are being explored to expand existing P&R
facilities in line with increasing demand, including the potential for integrating parking
capacity around stations with other activities such as Johnsonville station which is
adjacent to the Johnsonville Mall.
Christchurch currently has no formal P&R system. However, there is interest from city and
regional councillors, with P&R being seen as a relatively simple measure to help address
congestion. Some bus-based P&R ideas are currently being envisaged, with stations
positioned on northern, south-eastern and south-western corridors, as well as in a central
city location.
Modelling review
A literature review of P&R modelling methodologies has highlighted two primary methods
which are currently being used to estimate future P&R usage; namely regional models
and site-specific models. Each approach has strengths and weaknesses, and relies on
common sense by the planner and a certain amount of local knowledge. A general theme
Executive summary
9
is that as computing power and software has improved, so has the complexity of the
demand forecasting models.
Regional-modelling approaches include P&R as a distinct mode within a multi-modal
model. They use existing car and PT costs within a multi-modal context, provide a higher
level of standardisation between site estimates and have the ability to include site-choice
modelling. They do, however, require a higher degree of modelling sophistication and the
success of their implementation is only as good as the regional model in which they sit.
Regional models concentrate on the relative costs of P&R against other modes and use
these costs to develop mode split functions that can be applied to the catchment
population of a site. Regional techniques are responsive to changes in measurable cost
attributes of transport (such as frequency, travel time and fares), but do not usually
include some of the more local (and perceived) factors such as safety and the local
accessibility of site. Regional approaches can also be used to determine abstraction from
other modes (such as car or PT all the way) as well as competition between sites (when
catchments overlap) through a site-choice logit model.
Parameters for mode-split models rely on stated or revealed preference data. Revealed
preference data is the easiest source of model parameters, but requires P&R to be an
existing and statistically significant mode. Stated preference data for P&R is difficult to
collect as P&R is normally a small proportion of the total PT market but provides an
additional source of people’s attitudes to P&R as a mode from both users and non-users.
However, stated preference scenarios generally need to include extreme changes in costs
to encourage mode switching behaviour and even then a significant proportion of
respondents will not change. As such P&R stated preference surveys can be an expensive
exercise and the results of limited value. This was demonstrated by a stated preference
survey conducted as part of the modelling project which was designed to provide data
that could be compared with revealed preference analyses for the Wellington region. It
became apparent after the survey pilot that conducting a statistically reliable survey
would be extremely expensive and the survey was terminated at the pilot stage.
Site-specific models relate the usage at a P&R site to a number of variables associated
with the location, catchment size and characteristics, transport costs from the site and
facilities. These models can be developed using more localised data and do not require
detailed transport modelling. However, data requirements may cause difficulty (as
existing sites are desirable to calibrate a model), site-choice modelling is usually not
included and the method does not explicitly forecast PT demand. The models differ from
regional approaches in that they ignore other modes and are based purely on
characteristics relating to the site (through the use of linear regression equations). These
can give better estimates for individual sites as the calibration (to existing usage) can be
more exact and more of the local site facility attributes can be included. However,
because other modes are ignored, there is no indication of abstraction from say car or PT
only users. It is difficult to estimate the impact of other sites in close proximity and, as
many variables are often highly correlated, a robust model may not include transport-
related variables such as travel time or fares.
PARK AND RIDE: CHARACTERISTICS AND DEMAND FORECASTING
10
Model development
Both regional and site-specific models were developed for the Wellington Region.
The regional model took the defined catchments, revealed preference demand data
from surveys conducted in 2001/02, and transport costs from the Wellington Transport
Strategy Model (WTSM), and estimated a mode-split model that could be applied within a
regional modelling context. There were inconsistencies in the revealed preference data
from differences in definitions between surveys. Further, the Wellington model did not
have P&R explicitly represented within the network skims, and as such P&R costs were a
combination of car access cost to and PT cost from a station zone (rather than the
station), and the zone sizes could be considered large for P&R modelling purposes, with a
significant proportion of car access trips within the same zone as the station.
In spite of these shortcomings, a nested-logit model with car access and non-car access
to PT at the lower level and car all the way vs PT at the upper level was estimated
successfully. This nested-logit formulation was then applied within an Emme/2 procedure,
which also included capacity constraints at station car parks. A number of scenarios were
run to test the model behaviour against industry-standard elasticities. The model
performed adequately, both in terms of car and PT elasticities. Other tests were
undertaken relating to site capacity increases, with results also looking sensible.
The site-specific model was developed by regressing usage data against demographic,
service and facility-related variables to derive a model for car access to rail stations.
There were high levels of co-linearity between distance/time/fare variables, but adequate
relationships were still obtained. The final model included catchment population, number
of express services, fare, safety, P&R information and a line-specific indicator. In addition,
a variable was included which looked at competing population (where catchments
overlapped).
Sensitivity tests for the site approach were undertaken which looked at the impact of
changes to an existing station and the inclusion of a new station. The results of these two
tests were reasonable. A test relating to an increase in PT fares was undertaken; the
model proved to be too sensitive to fares, at least partly because of the exclusion of PT
captive trips. Further tests were undertaken looking at future year population impacts.
Summary
This report reviewed and applied methodologies for modelling car access/P&R demand.
These approaches should not be seen as substitutes and should be used in conjunction
with one another to give a wider range of information for decision makers. These
methodologies were applied to the Wellington Region but similar models could be
developed for other regions for which adequate input data is available.
Abstract
11
Abstract
This report examines the characteristics of park and ride (P&R) useage and suggests
demand modelling methodologies based on these characteristics for changes in demand
at existing sites, and estimation of demand at new sites. It reviews New Zealand and
international evidence on the nature of P&R usage and the factors that influence it. The
report then examines potential P&R modelling methodologies and identifies the most
appropriate within a New Zealand context. Emphasis is given to the development of P&R
catchments and resulting regional and site-specific modelling approaches. Finally
methodologies are applied to a New Zealand situation and conclusions drawn.

12

Part 1: Key characteristics of park and ride (P&R)

Part 1: Key characteristics of park and ride (P&R)
15
1. Introduction
This report was developed by Booz Allen Hamilton as part of the Land Transport
New Zealand (Land Transport NZ) Research Programme 2004–2005, primarily to examine
the characteristics and modelling of park and ride (P&R) public transport demand with
specific reference to New Zealand.
1.1 Scope and structure of paper
The report provides an overview of the main characteristics of P&R, as well as local and
international evidence on the usage of P&R facilities. International demand modelling
methodologies are reviewed and then applied to a New Zealand situation.
The report has three main parts:
• Part 1: Key characteristics of park and ride (P&R)
• Part 2: Review of international demand modelling practices
• Part 3: P&R model development for Wellington
Appendices provide detailed statistical data on P&R usage in New Zealand as well as
documentation of a trial stated preference survey undertaken as part of the project.
2. Part 1 overview
2.1 What is P&R?
P&R essentially involves the provision of:
• car parking facilities well outside the central area of the city, and
• public transport services linking these car parks with the central city area.
P&R may be regarded as an extension of central area parking provision – with the parking
facility being outside the central area rather than within it and linked to the central area
with a good public transport service.
P&R attempts to combine the benefits of both car use and PT use into an efficient and
effective system:
The essence of P&R lies in overcoming the idea that the private car and the public
transport system are in competition, and seeks to create an interface between the
two (Moran 1990).
Rail station car parks are the ‘classic’ example of P&R and have been used for many years
in both Auckland and Wellington and in many other cities internationally. More recently,
PARK AND RIDE: CHARACTERISTICS AND DEMAND FORECASTING
16
there has been a surge of interest in and development of bus-based P&R schemes,
particularly in the United Kingdom.
For the purposes of this report, P&R is taken as also including ‘kiss and ride’ (K&R), ie
trips in which the traveller is dropped off by car at the P&R site. However, while both P&R
and K&R have the common effect of reducing linehaul trips by car, P&R has far greater
significance for physical planning as it requires specific infrastructure (eg station car
parks) as volumes increase.
While the main focus of the project is on ‘formal’ P&R/K&R, the existence of a significant
amount of ‘informal’ P&R/K&R also needs to be recognised (eg people driving their car
and parking near a convenient bus stop, before continuing their trip by bus).
2.2 Scope of section
This section summarises evidence from New Zealand and from four overseas countries:
• United Kingdom: Rail-based P&R is very well established and plays a major role in travel
to inner London. Bus-based P&R has been developed mainly over the last 20 years in a
number of medium-sized cities and there has been a resurgence of interest in such
policies over the last few years.
• United States and Canada: P&R plays a major role feeding a number of rail and bus-
based line haul services.
• Australia: Rail-based P&R plays a major role in the larger eastern states cities; while bus-
based P&R plays a major role with the Adelaide O-Bahn.
P&R also plays a significant role in urban transport in a number of other countries, in
Europe and elsewhere, but this experience appears to be less well documented (certainly
in the English language sources).
3. Objectives, policy context and success factors
3.1 General policy objectives and target markets
The main objective of P&R policies is to transfer parking demand from the central
business district (CBD) to suburban/urban fringe locations, with a view to achieving the
following benefits:
• reducing traffic levels and congestion levels on urban radial routes and in the CBD itself
• correspondingly reducing the need/pressure for increased road capacity as well as
reducing emission levels, energy use and other environmental impacts
• reducing the amount of parking required in the CBD (where land is scarce and expensive
and large car parks may be out of scale with the CBD townscape) and replacing it with
parking in other locations (where land is cheaper and more readily available).
Part 1: Key characteristics of park and ride (P&R)
17
P&R may also help to increase the level of service and cost-effectiveness of public
transport (PT) provision, by concentrating PT demand on the major line haul routes
(between the P&R site and CBD) and reducing the need for PT services in low-density
suburban areas, which are difficult to serve cost-effectively.
P&R schemes are almost always designed to serve trips to areas of concentrated demand,
because:
• parking is likely to be scarce/expensive in such areas
• concentrated passenger flows are necessary to provide effective and economic PT
services.
Most schemes are oriented to serving town centres. However, some schemes are
designed to serve other locations, such as airports, sport stadiums and amusement parks.
Schemes oriented to town centre movements may be targeted at various segments. While
most schemes internationally are targeted principally at commuters (typified by rail
station car parks), other schemes are targeted principally at off-peak CBD travellers,
particularly shoppers. Many of the United Kingdom bus-based schemes started off (and in
some cases continue) to serve shoppers in the pre-Christmas period, when there was
insufficient CBD parking to meet the seasonal demand.
There are good arguments in favour of targeting each of these markets and no single
‘right’ answer for all situations:
What is not yet clear is whether an authority should try to encourage P&R use by
commuters to free up central parking for shoppers – who might make more
productive use of the space – or if shoppers who represent a greater number of
journeys per parking space should be the principal market for P&R in order to
reduce overall traffic levels (Huntley 1993).
3.2 New Zealand policies and experience
In New Zealand, P&R is primarily targeted at and used by commuters working in the CBD.
This primarily reflects the relative price and availability of parking in the CBD and
suburban areas (plus the fact that public transport is most competitive in time and cost
with private car use for such trips). Few shoppers use P&R, reflecting the large proportion
of shopping undertaken outside CBD areas and the relatively low price of parking (relative
to other trip cost components) for shorter-duration trips: indeed, some councils
encourage car-based shoppers through free/cheap parking facilities.
Section 591 (1) of the Local Government Act states that:
The Council may provide parking places and buildings and stations, and for that
purpose may –
(a) Take, purchase, or otherwise acquire any land or buildings or erect any
buildings in or near to the district; …
PARK AND RIDE: CHARACTERISTICS AND DEMAND FORECASTING
18
(d) Authorise the use as a parking place or transport station of any part of a road.
In this section ‘parking place’ means a place (including a building) where vehicles, or any
class of vehicles, may wait. Thus, local authorities are enabled to construct parking places
adjacent to public transport services – P&R sites.
Funding for P&R sites in Wellington and Auckland is presently provided by a combination
of regional council rates and Land Transport NZ funding. Discussions with Land Transport
NZ found the following approach to the funding of projects:
• if the project is within the road reserve it is treated as a roading project
• if it is outside the road reserve it is treated as an alternative to roading (ATR) project.
However, public car parks within the road reserve and associated with public transport
services are also evaluated using the ATR evaluation procedures, on the basis that there
may be some benefits arising from people switching from cars to public transport.
ATR capital projects have a cap of $400,000. Where P&R projects will cost more than this
amount, the Land Transport NZ share of the project cost can be funded on an outputs basis
as a service. The Auckland Regional Council has taken this approach for some projects with
capital costs over the cap. In these cases the operator can lease the car park and Land
Transport NZ will fund on the basis of an 'optimum charge' for the car park.
P&R is presently operational (in a formal way) in two New Zealand cities, Auckland and
Wellington. P&R is being further pursued in these regions through inclusion in regional
transport strategies and other localised studies.
Woods (2006) interviewed transport strategy practitioners in Auckland, Wellington and
Christchurch in 2005–2006 to explore current plans/policies and issues relating to P&R.
He found general support and enthusiasm for P&R. He also highlighted a desire by
practitioners to better understand the size and nature of the P&R market, particularly with
regards to origins of users and previous modes used.
The following regional councils have developed P&R policies, which are contained in their
respective regional land transport strategies (RLTS), regional passenger transport plans
(RPTP), and travel demand management (TDM) strategies (Appendix A). All of these
strategies have the support of territorial authorities (TAs) and transport operators.
Findings from these interviews and a summary of policies relating to P&R in New Zealand
are discussed below.
3.2.1 Auckland
There is general support for P&R in Auckland, particularly as a result of the recently
developed Bus Rapid Transport (BRT) system, where P&R sites have been continuously
over-utilised. P&R studies are currently taking place in the Rodney District to examine
potential parking station sites around Orewa. The regional public transport model also
includes sophisticated modelling of access to public transport via P&R sites. This model
was used to give indicative site usage numbers for the BRT system during project
feasibility studies.
Part 1: Key characteristics of park and ride (P&R)
19
The Auckland Regional Council (ARC) in conjunction with other stakeholders developed a
regional transport strategy (2005), a regional passenger transport plan (2003), and a travel
demand management strategy (2000). In general, Auckland authorities are encouraging
the further development of P&R facilities in the region with particular reference to
accessibility to PT services and the use of more sustainable transport modes.
The key issue for ARC planners is to gain a better understanding of the nature of P&R
usage including catchment areas and previous modes used.
3.2.2 Wellington
Wellington already has a developed P&R system for the rail network and the Greater
Wellington Regional Council (GWRC) sees improvements and increases in capacity over
the short to medium term. In particular, there are plans to improve lighting and security
at existing sites, as well as the introduction of new sites to coincide with new rail stations
on the western line. Other opportunities are being explored to expand existing P&R
facilities in line with increasing demand, including the potential for integrating parking
capacity around stations with other activities, such as at Johnsonville station which is
adjacent to the Johnsonville Mall. The regional transport model includes a representation
of car access to public transport, but it is not as sophisticated as that employed in the
Auckland Passenger Transport (APT) model.
The GWRC in conjunction with other stakeholders developed a draft regional land
transport strategy (2006), a regional passenger transport plan (2006) and a travel
demand management strategy (2005).
One of the issues facing the GWRC is the development of P&R monitoring regimes to aid
in evaluating against particularly strategic objectives.
3.2.3 Christchurch
Christchurch currently has no formal P&R system. However, there is political interest from
city and regional councillors, with P&R being seen as a relatively simple measure to help
address congestion. Woods (2006) outlines some of the bus-based P&R ideas that are
currently being envisaged, with stations positioned on northern, south-eastern and south-
western corridors, as well as a central city location.
Some of the issues that face Christchurch in terms of successful implementation of P&R
include Christchurch’s strong car culture, issues of rural rate-payer funding (particularly
when P&R is seen as solving city problems) and concerns about the competitive nature of
P&R with the wider public transport system.
PARK AND RIDE: CHARACTERISTICS AND DEMAND FORECASTING
20
4. P&R usage
4.1 Usage indicators
Market share for P&R can be considered in two ways:
A. Proportion of PT passengers using P&R
This can be measured as either the proportion of passengers boarding at each stop who
have used P&R or by P&R as a proportion of all PT mode passengers on the service or
corridor. Little data is generally kept in regard to PT boardings by individual stop and this
can also be a misleading indicator given that P&R users can often access several stops
with similar cost and time. The most useful indicator is thus P&R as a proportion of all PT
mode users.
B. P&R usage as a proportion of commuter trips
In many cities, P&R facilities are almost exclusively used by commuters travelling to the
CBD. A relevant indicator in such cases is, therefore, P&R usage as a proportion of
commuter trips to the CBD.
4.2 P&R usage as a proportion of public transport trips
Table C1 in Appendix C summarises access mode shares for public transport travel in
major radial corridors in Australasian cities.
The following general conclusions may be drawn:
• P&R and K&R proportions are greater at peak than off-peak periods.
• For rail services, the P&R peak proportion is typically around 15% of users, with a further
15% by K&R (Adelaide, Sydney and Melbourne).
• In the case of Perth’s Northern Suburbs Railway, which runs through a relatively low
density area with limited walk-in catchments, the P&R proportion is significantly higher
(28% peak/off-peak combined), with the walk proportion very much lower than for other
rail systems.
• For typical on-street (all stops) bus services, P&R proportions are much lower than for
rail. Typical peak figures (for Adelaide, Brisbane and Perth) are for the P&R proportion
being 1–5%, with K&R accounting for approximately a further 5%.
• For express/busway bus services, proportions are more comparable with those for
rail-based services. The Adelaide O-Bahn (peak) has about 12.5% P&R plus 11.5% K&R.
In Sydney, the Warringah Peninsula express bus services to the CBD (which use an
extensive length of transit lane) achieve about 14% car access (P&R/K&R together), while
for longer distance passengers the car access proportion increases to 32% (all periods).
Part 1: Key characteristics of park and ride (P&R)
21
In other countries: London data (for Network South East (NSE) rail services) indicates
that approximately 21% of NSE passengers to central London use station car parks (ie
P&R). A 1993 survey (Parkhurst 1995) of weekday users of bus-based P&R in Oxford and
York found the main access modes were:
• car driver (75% Oxford, 58% York)
• car passenger (16% Oxford, 15% York)
• walk (5% Oxford, 19% York)
• K&R (2% Oxford, 4% York).
United States data averaged from multiple metropolitan areas gives the following:
• car driver – alone 73%
• car – shared ride 11%
• K&R 11%
• walk 4%
• bus 1%.
Various United States studies into access modes of express bus users (often travelling on
reserved freeway lanes) found that:
• for routes with the highest level of P&R facilities, between 60% and 95% of bus users
gained access by car: the car driver share was between 45% and 69%
• for routes with a ‘moderate’ level of P&R facilities, between 30% and 60% of bus users
gained access by car
• for routes with a ‘limited’ level of P&R facilities, between 4% and 40% of bus users gained
access by car (Barton-Aschman Associates et al. 1981).
4.3 P&R usage as a proportion of commuter trips
P&R data for United Kingdom cities with bus-based P&R schemes indicates typical usage
data in the range of 5–30 return trips/day per 1000 population (or 10–60 one-way
trips/day). With typical total trip rates of three one-way trips per person per day, this
indicates that P&R accounts for up to 2% of all trips.
P&R would of course account for a considerably higher proportion of CBD trips, typically
up to 10%. Taking a typical P&R proportion of 15% and a public transport mode share for
CBD travel of say 50% (typical of Melbourne), P&R typically accounts for 7.5% of all CBD
trips, with K&R perhaps accounting for a similar proportion.
PARK AND RIDE: CHARACTERISTICS AND DEMAND FORECASTING
22
4.4 New Zealand facilities and usage
4.4.1 Auckland
Several P&R facilities are provided in Auckland for rail, ferry and bus services:
• four bus P&R sites on the North Shore, four in West Auckland and one in East Auckland
(Pakuranga), typically between 10 and 40 spaces
• two BRT P&R sites on the Northern Busway with a combined capacity of around 700
spaces (typically fully utilised)
• four rail P&R sites in West Auckland and six in South Auckland, with a significant range in
capacity between 15 and 200
• four ferry P&R sites on the North Shore, one on the Whangaparoa Peninsula, one at Half
Moon Bay, and one on Waiheke Island, ranging in size from 30 to more than 150.
Table C2 in Appendix C lists the Auckland P&R sites with their capacity and utilisation in
1999, the most recent comprehensive information available on P&R usage. Since this
table was collated, the Northern Busway has opened including two stations with P&R
facilities. These stations (Albany and Constellation Drive) collectively have around 700
spaces dedicated to P&R, with usage consistently exceeding demand since opening in
November 2005 (Woods 2006) and with overflow onto local streets. On the rail network,
additional formal P&R sites are now located on the western line at Sunnyvale and on the
southern line at Glen Innes, Panmure and Manurewa.
In 1999, there was high utilisation of rail and ferry P&R sites but much lower utilisation of bus
P&R – although the level of signage and overall marketing at these much smaller sites would
have contributed to the relative under-utilisation. Overall, utilisation in 1999 was around 70%.
P&R is seen as an important complement to Auckland’s development of a quality rapid
public transport network. Current plans include the development of bus P&R in the north
and west of the region. In particular, there are plans for express bus P&R facilities located
at Westgate and Hobsonville Village. Rodney District is currently undertaking a study to
examine potential P&R sites in areas such as Silverdale North, driven primarily by the
success of the Northern Busway and the potential for latent demand for P&R services.
These sites could be developed in conjunction with an extension of the Northern Busway
northwards. An informal ferry P&R site currently exists at Clearwater Cove in Waitakere
City and there are plans to formalise this site as part of a marina development. P&R has
also been successfully used in Auckland in conjunction with bus services to special events.
Surveys undertaken in 1997 and 2003 of access modes in the am peak (see Table C5 in
Appendix C) show that:
• P&R accounted for 9% of rail access/egress movements in 2003 compared with 5% in the
1997 survey
• K&R accounted for a further 11% of rail access/egress movements in 2003 (12% in 1997)
Part 1: Key characteristics of park and ride (P&R)
23
• P&R accounted for 10% of ferry access/egress movements in 1997 (no comparable
survey was undertaken in 2003)
• P&R access to bus services was negligible (0.7% in 1997).
As these figures cover both access and egress, the P&R proportion would be substantially
higher, approaching twice these figures at the suburban (production) end of the trip and
close to zero at the city (attraction) end. This is confimed by 1996 journey-to-work data,
which gave market shares for car access to public transport (ie P&R and K&R combined)
of 3.3% for bus, 44% for rail and 33% for ferry.
4.4.2 Wellington
P&R facilities are currently provided predominantly for rail services, with one ferry P&R
site and only a single bus P&R site. Table C3 in Appendix C lists the existing Wellington
rail P&R sites with their capacity and utilisation based on surveys undertaken in 2002–
2004. Nearly all the Wellington sites have high utilisation rates. Overall, around 4000
spaces are provided through rail P&R sites, with an average utilisation of approximately
85%. Demand has continually exceeded supply at many stations. Waterloo and
Paraparaumu in particular have seen new spaces being filled almost immediately upon
construction. There are also large amounts of P&R demand overfill onto the local streets
around stations as informal P&R.
The GWRC has a P&R development programme which it is implementing as funding
becomes available. This primarily involves extensions and enhancements to existing P&R
facilities. Several new rail stations are presently being evaluated and if proceeded with,
these stations will have P&R car parks. Other P&R opportunities being explored include the
potential sharing of parking capacity with private developers (such as Johnsonville Mall).
Survey data (given in detail in Tables C4 and C6 in Appendix C) shows around 20% of am
peak rail passengers use P&R. This increases to 35% for all rail commuters to the CBD,
which represents 9% of all CBD commuters from zones in the rail catchment area.
4.4.3 Christchurch
Although Christchurch currently has no formal P&R systems in place, informal P&R users
are parking their cars at key locations on the transport network. These include:
• Diamond Harbour ferry, with locals driving to the south side of Lyttelton Harbour and
catching a ferry and then bus to the city centre
• Church Corner, with people driving from outer townships and catching buses to the city
centre
• south end of Papanui Road
• Tai Tapu Drive.
While P&R is mentioned as a concept in regional strategies, there is no mention of the
development of specific formal P&R sites.
PARK AND RIDE: CHARACTERISTICS AND DEMAND FORECASTING
24
5. Alternative modes and influencing factors
5.1 Alternative means of travel
A United Kingdom survey of bus-based P&R users in the historic towns of Oxford and
York found that:
• prior to the P&R introduction, 60%/51% of York/Oxford weekday users said they would
have travelled to the city as car drivers, 6%/4% as car passengers, 26%/36% by public
transport (all the way) and 7%/9% would have travelled by other means
• when asked about their alternative travel behaviour if P&R were to become unavailable,
55% of the York weekday respondents said they would travel to the city by car, 24% by
bus, 11% would travel elsewhere or not that day, while 10% gave other responses. The
Oxford responses were very similar
• alternative travel behaviour differed dramatically according to trip purpose. People
travelling on work/education trips were much more likely to travel by public transport or
cycle, while those on shopping trips were very likely to travel elsewhere or not make the
trip (Parkhurst 1995).
A United Kingdom survey of bus-based P&R in four towns indicated that between 59%
and 78% of P&R users would have driven into town if the facility had not been available.
Of those who would not have driven (19%–40% of the total), the largest proportion
(11%–25% of the total) would have made the same trip by bus; the second largest would
have not travelled at all (4%–9% of the total); while 2%–8% would have visited another
location (Pickett and Gray 1994).
An important issue in interpreting these surveys is whether the experience of using P&R
makes people more favourably disposed than previously towards use of ‘conventional’ PT
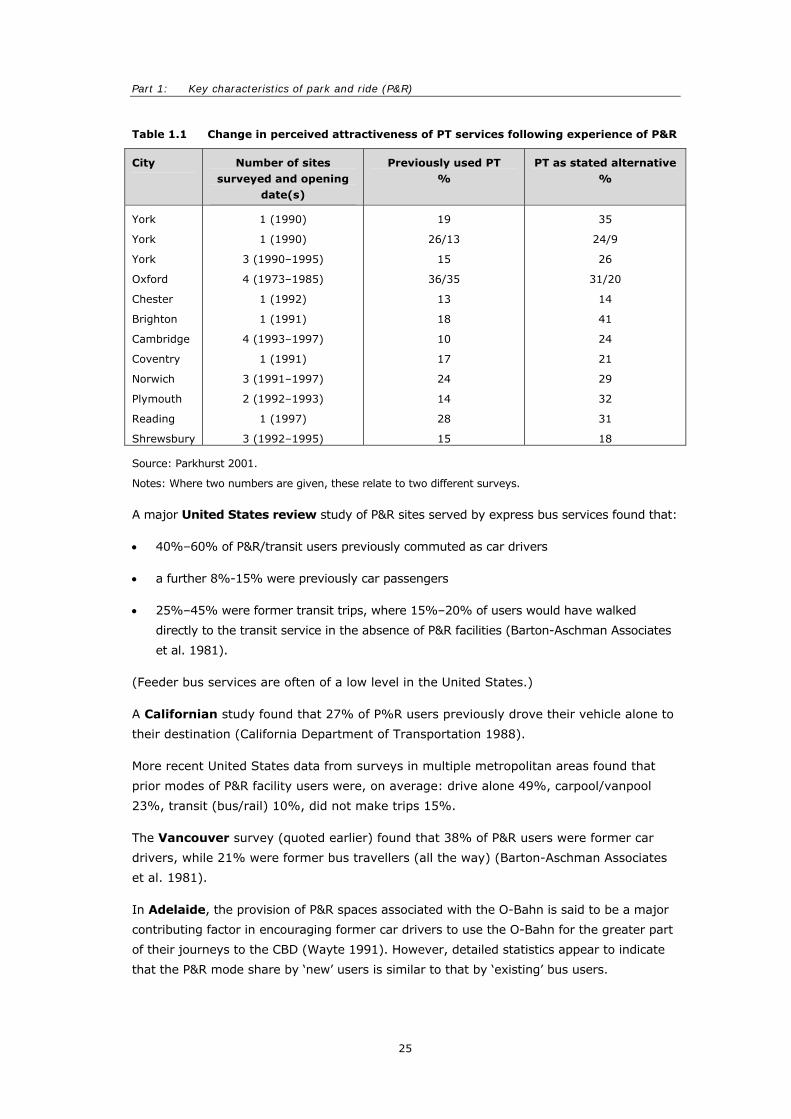
services. Table 1.1 summarises the results of United Kingdom surveys of bus-based P&R
sites which compare the prior use of PT with stated alternative use of PT if the P&R option
were not available. While the evidence is rather mixed, on balance use of P&R appears to
make users more favourably inclined to PT (Parkhurst 2001).
Part 1: Key characteristics of park and ride (P&R)
25
Table 1.1 Change in perceived attractiveness of PT services following experience of P&R
City Number of sites surveyed and opening
date(s)
Previously used PT %
PT as stated alternative %
York
York
York
Oxford
Chester
Brighton
Cambridge
Coventry
Norwich
Plymouth
Reading
Shrewsbury
1 (1990)
1 (1990)
3 (1990–1995)
4 (1973–1985)
1 (1992)
1 (1991)
4 (1993–1997)
1 (1991)
3 (1991–1997)
2 (1992–1993)
1 (1997)
3 (1992–1995)
19
26/13
15
36/35
13
18
10
17
24
14
28
15
35
24/9
26
31/20
14
41
24
21
29
32
31
18
Source: Parkhurst 2001.
Notes: Where two numbers are given, these relate to two different surveys.
A major United States review study of P&R sites served by express bus services found that:
• 40%–60% of P&R/transit users previously commuted as car drivers
• a further 8%-15% were previously car passengers
• 25%–45% were former transit trips, where 15%–20% of users would have walked
directly to the transit service in the absence of P&R facilities (Barton-Aschman Associates
et al. 1981).
(Feeder bus services are often of a low level in the United States.)
A Californian study found that 27% of P%R users previously drove their vehicle alone to
their destination (California Department of Transportation 1988).
More recent United States data from surveys in multiple metropolitan areas found that
prior modes of P&R facility users were, on average: drive alone 49%, carpool/vanpool
23%, transit (bus/rail) 10%, did not make trips 15%.
The Vancouver survey (quoted earlier) found that 38% of P&R users were former car
drivers, while 21% were former bus travellers (all the way) (Barton-Aschman Associates
et al. 1981).
In Adelaide, the provision of P&R spaces associated with the O-Bahn is said to be a major
contributing factor in encouraging former car drivers to use the O-Bahn for the greater part
of their journeys to the CBD (Wayte 1991). However, detailed statistics appear to indicate
that the P&R mode share by ‘new’ users is similar to that by ‘existing’ bus users.
PARK AND RIDE: CHARACTERISTICS AND DEMAND FORECASTING
26
In Wellington, a series of research studies into the characteristics and attitudes of P&R
users (described in Appendix D) have found:
• nearly all rail P&R users are commuters travelling to Wellington CBD
• most rail P&R users make use of the P&R car park 3–5 days a week
• the level of rail service at a station affects the number of P&R users at that station
• only a very small proportion (1–3%) of motor vehicle users would be likely to switch to
P&R if additional P&R car parks were available, or improvements were made to the car
parks
• some informal bus P&R is currently occurring in Wellington City (a 1995 survey found 7%
of bus users were P&R)
• 34% of bus users who had a car at home took the bus because of no parking at their
destination.
• 43% of motor vehicle users in the 1995 survey parked in employer-provided parking; and
64% of these users indicated they would switch to bus if a car park was not available
• 8% of current P&R users would drive all the way to their destination if their current P&R
car park was not available (rather than park on the street or park at another station).
In Auckland a survey was conducted around five months after the opening of the Northern
Busway at the two principal stations (Albany and Constellation). P&R users of the busway
comprised around 57% of people surveyed at Albany (52% drove alone, 5% drove with a
passenger) and 35% of people surveyed at Constellation (33% drove alone, 2% drove with
a passenger). The P&R catchment of Albany (further away from the CBD) was much larger
than for Constellation, with 16% of P&R users travelling from as far north as the Hibiscus
Coast and Kauakapaka (Tables D1 and D2 in Appendix D). A similar pattern is seen at
Constellation station, demonstrating that people will drive significant distances to access PT
services when quality services are provided. There is also evidence of some passengers
driving against the direction of travel over shorter distances to access the site.
5.2 Service characteristics
5.2.1 Travel time, frequency and service hours
Travel time is one of the most important considerations when choosing whether to use a
P&R facility. Facility access time, transit service headways and in-vehicle travel times are
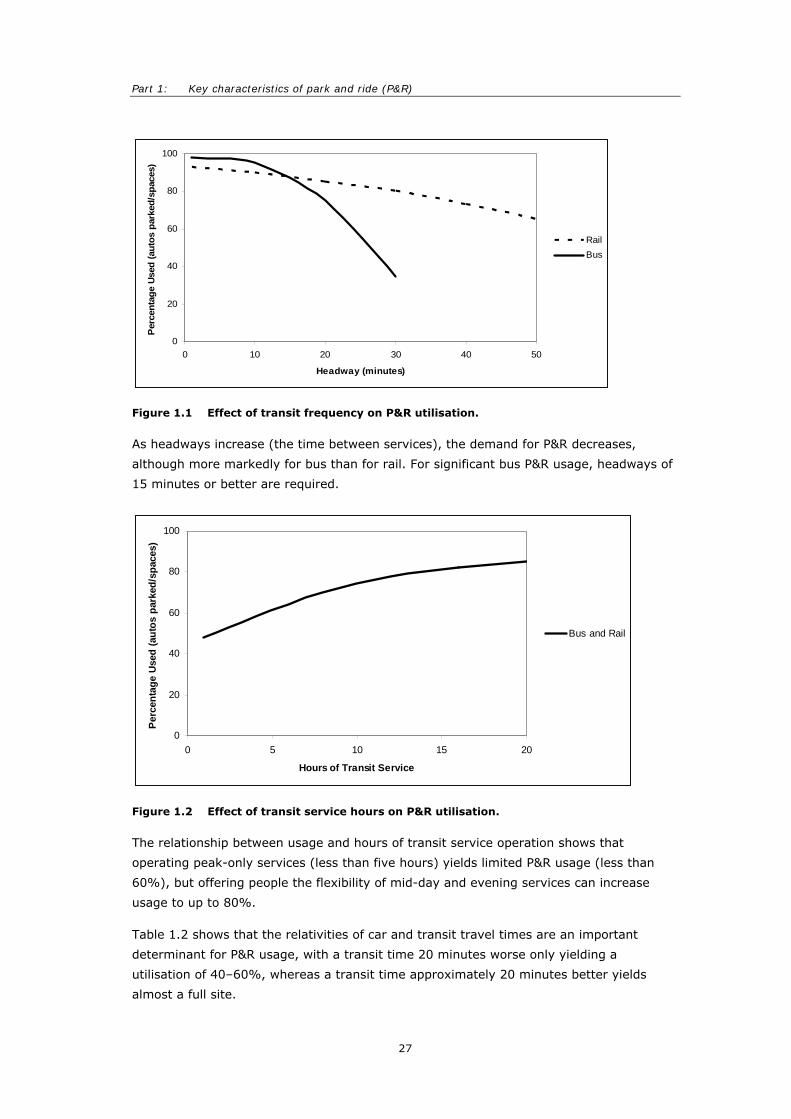
the three main components of P&R travel time. Figures 1.1 and 1.2 below show the
results from 37 bus and 139 rail P&R sites in USA (Turnbull 2004). These relate site
utilisation (average number of users per space) to PT headways and service hours.
Part 1: Key characteristics of park and ride (P&R)
27
Figure 1.1 Effect of transit frequency on P&R utilisation.
As headways increase (the time between services), the demand for P&R decreases,
although more markedly for bus than for rail. For significant bus P&R usage, headways of
15 minutes or better are required.
Figure 1.2 Effect of transit service hours on P&R utilisation.
The relationship between usage and hours of transit service operation shows that
operating peak-only services (less than five hours) yields limited P&R usage (less than
60%), but offering people the flexibility of mid-day and evening services can increase
usage to up to 80%.
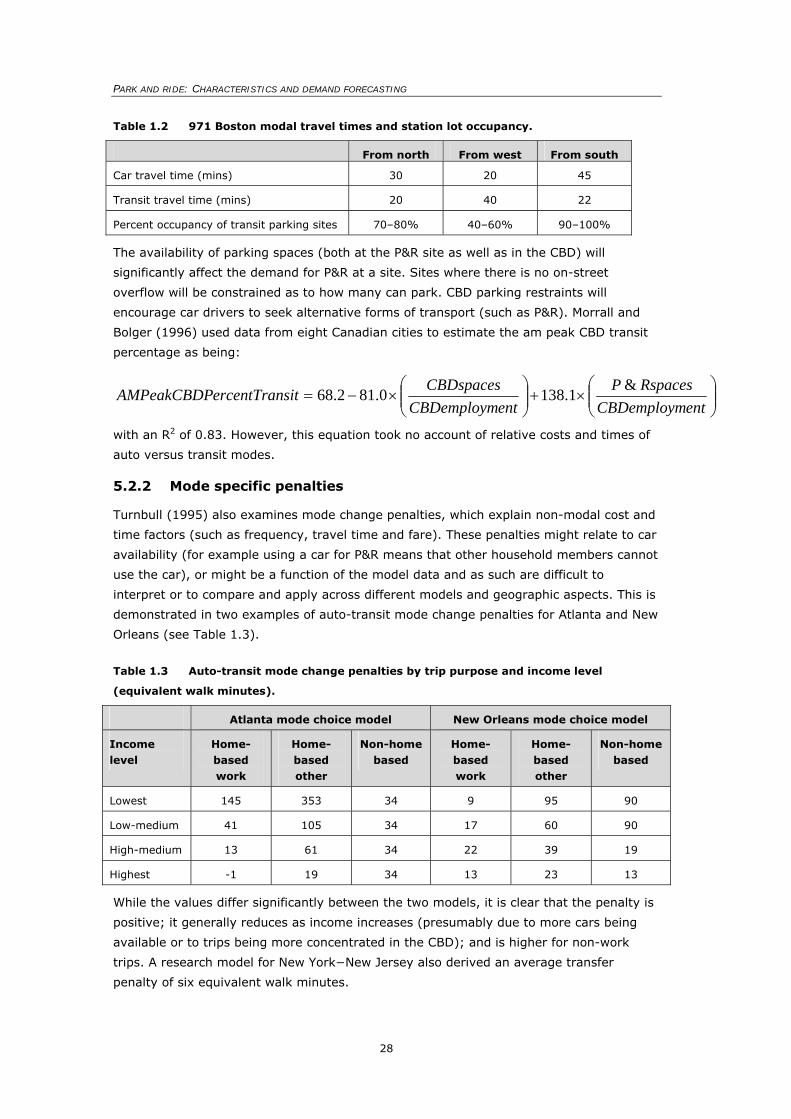
Table 1.2 shows that the relativities of car and transit travel times are an important
determinant for P&R usage, with a transit time 20 minutes worse only yielding a
utilisation of 40–60%, whereas a transit time approximately 20 minutes better yields
almost a full site.
0
20
40
60
80
100
0 10 20 30 40 50
Headway (minutes)
Per
cent
age
Used
(aut
os p
arke
d/sp
aces
)
RailBus
0
20
40
60
80
100
0 5 10 15 20
Hours of Transit Service
Perc
enta
ge U
sed
(aut
os p
arke
d/sp
aces
)
Bus and Rail
PARK AND RIDE: CHARACTERISTICS AND DEMAND FORECASTING
28
Table 1.2 971 Boston modal travel times and station lot occupancy.
From north From west From south
Car travel time (mins) 30 20 45
Transit travel time (mins) 20 40 22
Percent occupancy of transit parking sites 70–80% 40–60% 90–100%
The availability of parking spaces (both at the P&R site as well as in the CBD) will
significantly affect the demand for P&R at a site. Sites where there is no on-street
overflow will be constrained as to how many can park. CBD parking restraints will
encourage car drivers to seek alternative forms of transport (such as P&R). Morrall and
Bolger (1996) used data from eight Canadian cities to estimate the am peak CBD transit
percentage as being:
⎟⎟⎠
⎞⎜⎜⎝
⎛×+⎟⎟
⎠
⎞⎜⎜⎝
⎛×−=
entCBDemploymRspacesP
entCBDemploymCBDspacessitercentTranAMPeakCBDP &1.1380.812.68
with an R2 of 0.83. However, this equation took no account of relative costs and times of
auto versus transit modes.
5.2.2 Mode specific penalties
Turnbull (1995) also examines mode change penalties, which explain non-modal cost and
time factors (such as frequency, travel time and fare). These penalties might relate to car
availability (for example using a car for P&R means that other household members cannot
use the car), or might be a function of the model data and as such are difficult to
interpret or to compare and apply across different models and geographic aspects. This is
demonstrated in two examples of auto-transit mode change penalties for Atlanta and New
Orleans (see Table 1.3).
Table 1.3 Auto-transit mode change penalties by trip purpose and income level
(equivalent walk minutes).
Atlanta mode choice model New Orleans mode choice model
Income level
Home-based work
Home-based other
Non-home based
Home-based work
Home-based other
Non-home based
Lowest 145 353 34 9 95 90
Low-medium 41 105 34 17 60 90
High-medium 13 61 34 22 39 19
Highest -1 19 34 13 23 13
While the values differ significantly between the two models, it is clear that the penalty is
positive; it generally reduces as income increases (presumably due to more cars being
available or to trips being more concentrated in the CBD); and is higher for non-work
trips. A research model for New York−New Jersey also derived an average transfer
penalty of six equivalent walk minutes.
Part 1: Key characteristics of park and ride (P&R)
29
5.3 Site catchments
The catchment is the area around a P&R site that includes potential P&R users and is a
key factor in estimating P&R usage. There have been a number of studies undertaken in
North America looking at the shape and size of the catchment area; these are
summarised by Turnbull et al. (2004).
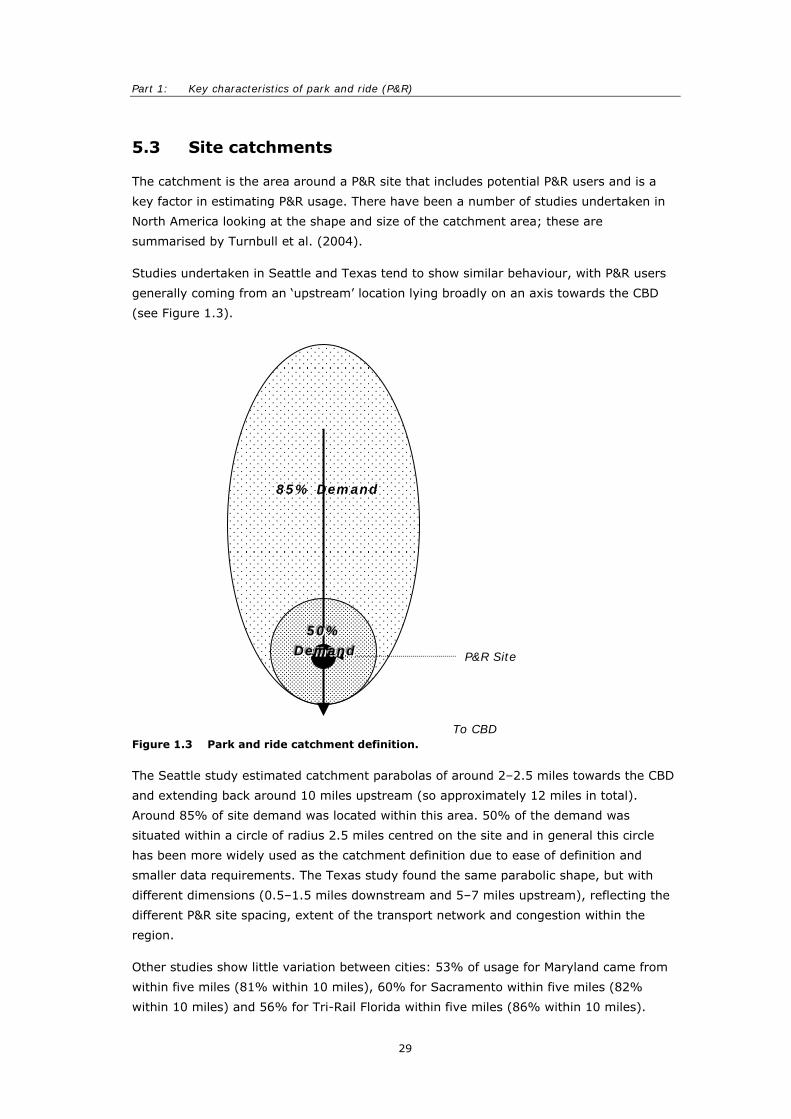
Studies undertaken in Seattle and Texas tend to show similar behaviour, with P&R users
generally coming from an ‘upstream’ location lying broadly on an axis towards the CBD
(see Figure 1.3).
Figure 1.3 Park and ride catchment definition.
The Seattle study estimated catchment parabolas of around 2–2.5 miles towards the CBD
and extending back around 10 miles upstream (so approximately 12 miles in total).
Around 85% of site demand was located within this area. 50% of the demand was
situated within a circle of radius 2.5 miles centred on the site and in general this circle
has been more widely used as the catchment definition due to ease of definition and
smaller data requirements. The Texas study found the same parabolic shape, but with
different dimensions (0.5–1.5 miles downstream and 5–7 miles upstream), reflecting the
different P&R site spacing, extent of the transport network and congestion within the
region.
Other studies show little variation between cities: 53% of usage for Maryland came from
within five miles (81% within 10 miles), 60% for Sacramento within five miles (82%
within 10 miles) and 56% for Tri-Rail Florida within five miles (86% within 10 miles).
P&R Site
85% Demand
555000%%%
DDDeeemmmaaannnddd
To CBD
PARK AND RIDE: CHARACTERISTICS AND DEMAND FORECASTING
30
5.4 Reasons for use and non-use
5.4.1 United Kingdom market research
A 1993 survey of weekday users of bus-based P&R in the medium-sized cities of Oxford
and York found that the reasons given in both cities for use of P&R were, in descending
order of importance:
• cheaper than parking in CBD (42% Oxford, 31% York)
• CBD parking shortage/difficulty (22%, 27%)
• easier access to ultimate destination (13%, 19%)
• reduced stress on person and vehicle (10%, 13%).
Thus it is evident that the ‘stick’ of parking restraint is a dominant factor influencing use
of P&R (Parkhurst 1995).
Speyer et al. (1996) discuss a 1995 Swansea self-completion survey at two P&R sites and
two city-centre car parks. Response rates for P&R users were higher (59%) than for car
parkers (30%) (possibly because the P&R users had more time to complete the survey
while waiting for or travelling on their service), with an overall rate of 43%. Distance to
travel to the site played a significant role on whether to P&R or not, with 63% of users
travelling less than five miles. Conversely drivers travelling from a distance of greater
than 10 miles chose to use the city-centre car parks. Tentative linkages between price
and P&R demand were also found, with 37% of users choosing P&R due to city centre car
parks being too expensive. Concern about road congestion and environmental issues were
also examined and 66 per cent of P&R users stated this as their prime reason for using
P&R. In summary, the survey found that:
• P&R attracted predominately older male users
• price was important
• younger drivers were fairly inelastic in travel patterns and behaviour, and road congestion
and environmental problems alone would not attract this group into the P&R market
• every effort should be made to give the transfer mode (bus, rail) a speed advantage over
the private car in urban areas.
A United Kingdom report into the effectiveness of bus P&R (Picket and Gray 1994)
commented on a 1978 survey of Oxford P&R users, which found that the reasons given
for using the scheme were:
• speed
• no parking problems
• no congestion
Part 1: Key characteristics of park and ride (P&R)
31
• no parking costs
• direct to centre.
This report also cited a 1987 survey as to reasons given by motorists for choosing not to
P&R:
• inconvenient in time terms
• expensive
• driver ‘car loving’
• awkward when carrying a load
• need to have car available for work
• not aware of service
• access to free or private parking
• location of town-centre bus stop inconvenient
• problems of children on bus.
5.4.2 North American market research
Several North American studies investigated the reasons for use of P&R facilities. Barton-
Aschman Associates et al. (1981) concluded that the relative costs of car-all-the-way
versus P&R were important. The point at which P&R suffered compared with car was when
the transit time was approximately 10 minutes longer. At 25 minutes longer, P&R usage
would be minimal. A significant factor in low P&R usage was when bus transit headways
exceeded 15 minutes (resulting in an average access plus waiting time of 10 minutes or
more).
Stevens and Homburger (1985) examined the use of P&R sites by bus commuters and
concluded that passengers were concerned about safety at P&R sites and placed a high
value on shelters. Passengers wanted improved bus services including longer hours of
service and adequate capacity. Typical P&R users had the following characteristics:
• began their trip at home
• drove to a P&R lot and parked there
• boarded an express transit line bound for the largest CBD in the region
• walked less than 800 metres to work from the place where they left the bus
• the pattern reversed for the PM commute
• made the same trip, using the P&R lot, at least four times per week.
A 1981 United States survey (Barton-Aschman Associates et al 1981) found the following
reasons for use, in descending order of importance:
PARK AND RIDE: CHARACTERISTICS AND DEMAND FORECASTING
32
• traffic congestion
• parking costs at destination
• trip costs
• parking shortage at destination
• trip length
• companionship.
In May 1989 a survey of P&R site users in the Sacramento region was conducted, as a
first step to improve site location and size techniques (Al-Kazily 1991). Sites that were
highly used were on clearly definable commuting corridors and had relatively high
population densities for the service area of the site. Sites that performed less well lacked
these characteristics and were relatively poorly located. Drive distances to the sites were
asked as part of the survey, with 60% of respondents living within five miles and 71%
within 7.5 miles – although there were large variations between sites. Most of the highly
used sites drew between 60–75% of their users from within five miles.
A Vancouver survey of P&R users found the following reasons for changing to P&R by
former car drivers, in descending order of importance:
• parking costs
• driving strain
• traffic congestion
• trip time
• more frequent buses
• less walking.
A survey of car commuters in a corridor not served by P&R indicated that a shift to P&R
would require frequent bus services and minor travel time savings (Barton-Aschman
Associates et al 1981).
Turnbull (1995) identified location factors (other than distance to the site) that could be
influential in site usage:
• distance to destination – sites located very close to primary destinations experienced
different responses to sites that were further away, with people less likely to switch to PT
(with an interchange) for shorter distances
• heavy congestion – sites located in corridors with high levels of congestion (level of
service (LOS) E or higher) typically had stronger demand
• high visibility – sites should be highly visible from approach roads, as this built awareness
and also gave a better perception of security
Part 1: Key characteristics of park and ride (P&R)
33
• easy access – sites adjacent to main arterials generally experienced higher demand,
particularly when users did not need to backtrack
• site spacing – sites close to each other generally behaved as being combined rather than
separate facilities, and so a level of competition was developed which was likely to reduce
the effectiveness of each individual site
• surrounding density – higher densities provided more population within given catchments
and so was a larger market to tap.
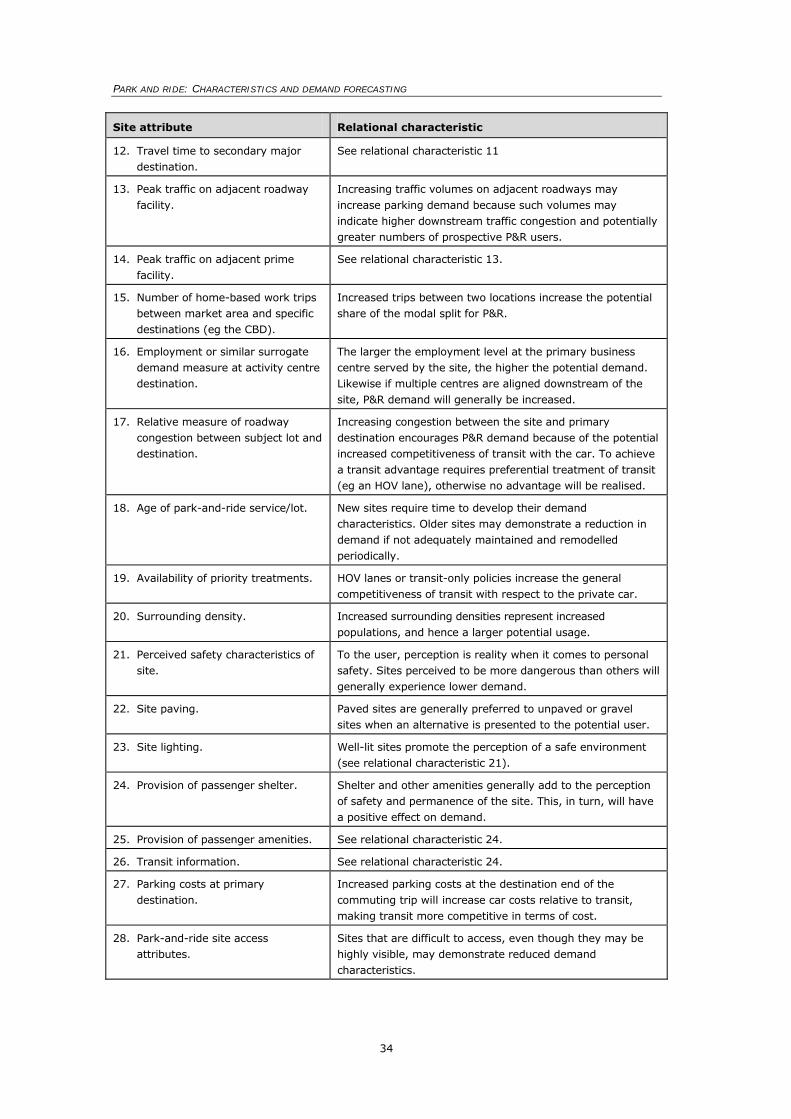
Spillar (1997) included a much larger and encompassing list of contributing factors that
might affect P&R demand (see Table 1.4).
Table 1.4 Contributing factors to park and ride demand.
Site attribute Relational characteristic
1. Number of am peak-period express bus trips to CBD.
As the number of am express trips to the primary CBD increases, so does demand. Some sources have recommended a minimum of four express buses per peak hour at park-and-ride lots, to be effective.
2. Number of am peak-period express
bus trips to major employment centres other than the CBD.
See relational characteristic 1.
3. Ratio of out-of-pocket car costs to
transit costs.
As car costs increase relative to transit costs, transit demand
tends to increase.
4. Distance between P&R site and primary business centre or CBD (measured as either the straight-line or road distance).
Within the Seattle Metro region, it has been observed that, as the distance between the P&R site and CBD increases, demand also tends to increase. However, there is likely a limiting factor with respect to this relationship.
5. Proximity to regional freeway system.
Sites immediately adjacent to a regional freeway have been found to demonstrate higher park-and-ride demand.
6. Availability of midday access between primary business centre (CBD) and the site.
Availability of midday access from the CBD to the P&R site increases potential demand.
7. Total population within the 50 percent service area of site.
Population within a 4 km radius of a site has been found to supply approximately 50 percent of the total demand for the site—the denser the population within the 4 km radius, the larger the potential P&R market.
8. Location within the region (for
Puget Sound, the South Corridor demonstrated higher average demands)
Lots located within productive transit corridors will tend to
generate higher P&R demand.
9. Percent multifamily within the
service area of the P&R site.
The higher the multifamily concentration within the service
area of the P&R site, the higher the potential market.
10. Percent of lower middle and lower income households within the service area of the P&R site.
Lower income populations tend to rely more frequently on transit: however, with P&R sites this relationship between income and transit usage may not be as strong as expected.
11. The average best scheduled transit time between the P&R site and primary CBD.
Shorter schedule times with respect to increasing distances increase P&R demand and provide a measure of service speed.
PARK AND RIDE: CHARACTERISTICS AND DEMAND FORECASTING
34
Site attribute Relational characteristic
12. Travel time to secondary major destination.
See relational characteristic 11
13. Peak traffic on adjacent roadway
facility.
Increasing traffic volumes on adjacent roadways may
increase parking demand because such volumes may indicate higher downstream traffic congestion and potentially greater numbers of prospective P&R users.
14. Peak traffic on adjacent prime
facility.
See relational characteristic 13.
15. Number of home-based work trips between market area and specific destinations (eg the CBD).
Increased trips between two locations increase the potential share of the modal split for P&R.
16. Employment or similar surrogate demand measure at activity centre destination.
The larger the employment level at the primary business centre served by the site, the higher the potential demand. Likewise if multiple centres are aligned downstream of the site, P&R demand will generally be increased.
17. Relative measure of roadway congestion between subject lot and destination.
Increasing congestion between the site and primary destination encourages P&R demand because of the potential increased competitiveness of transit with the car. To achieve a transit advantage requires preferential treatment of transit (eg an HOV lane), otherwise no advantage will be realised.
18. Age of park-and-ride service/lot. New sites require time to develop their demand characteristics. Older sites may demonstrate a reduction in demand if not adequately maintained and remodelled periodically.
19. Availability of priority treatments. HOV lanes or transit-only policies increase the general
competitiveness of transit with respect to the private car.
20. Surrounding density. Increased surrounding densities represent increased
populations, and hence a larger potential usage.
21. Perceived safety characteristics of site.
To the user, perception is reality when it comes to personal safety. Sites perceived to be more dangerous than others will generally experience lower demand.
22. Site paving. Paved sites are generally preferred to unpaved or gravel sites when an alternative is presented to the potential user.
23. Site lighting. Well-lit sites promote the perception of a safe environment (see relational characteristic 21).
24. Provision of passenger shelter. Shelter and other amenities generally add to the perception of safety and permanence of the site. This, in turn, will have a positive effect on demand.
25. Provision of passenger amenities. See relational characteristic 24.
26. Transit information. See relational characteristic 24.
27. Parking costs at primary destination.
Increased parking costs at the destination end of the commuting trip will increase car costs relative to transit, making transit more competitive in terms of cost.
28. Park-and-ride site access attributes.
Sites that are difficult to access, even though they may be highly visible, may demonstrate reduced demand characteristics.
Part 1: Key characteristics of park and ride (P&R)
35
5.4.3 New Zealand market research
In a 1994 study of P&R in the Hutt Valley for the WRC, Travers Morgan (1994) identified a
similar set of factors:
• Demand for P&R facilities is related to the availability and price of car parking at both the
destination and the P&R facility, as well as the cost of the train fare.
• The LOS on the PT mode must be competitive with the car in terms of critical LOS
features, particularly trip frequency.
• The level of road congestion and the effect on journey time have an effect on the
attractiveness of the P&R package.
In addition, evidence in Wellington over the last few years points to the importance of car
park security for potential users.
6. Overall transport system impacts
6.1 Effects on public transport use
There is no doubt that P&R policies result in increases in the total numbers of trips
(boardings) made on public transport in almost all circumstances. This is evident from the
previous section, which indicates that a significant proportion of P&R users were
previously car users.
London data (for Network South East (NSE) rail services) indicates that each person using
P&R facilities generates, on average, 0.16 new daily return rail trips.
Similar United States (Connecticut) studies indicate approximately 0.2 new transit riders
(daily return trips) per additional parking space provided in capacity-constrained
situations.
However, one of the effects of P&R is typically to replace some longer public transport
trips (with walk access or feeder buses) by shorter public transport trips (with car
access). Thus it is possible that the total passenger kms travelled on public transport
might reduce. This is more likely to be the case where P&R sites are provided relatively
close to the CBD or other final destination: the PT passenger kms lost by passengers that
now drive part of the way could exceed the passenger kms gain associated with
intercepted car users.
Analysis for bus-based P&R schemes in eight United Kingdom cities showed that PT
passenger kms increased significantly as a result of the scheme in seven out of the eight
cases. However, in all these cases additional bus service were introduced to serve the P&R
sites and there were reductions in use of the ‘conventional’ bus services (Parkhurst 2001).
PARK AND RIDE: CHARACTERISTICS AND DEMAND FORECASTING
36
6.2 Effects on road traffic levels
6.2.1 ‘Intercept rates’
One measure of the effect of P&R schemes on road traffic is the ‘intercept rate’, which is
the proportion of all car travellers on the relevant radial route or corridor passing the P&R
site that transfer to P&R. Typical intercept rates in UK cities which are oriented to bus P&R
are in the range 10–20%:
P&R could attract up to 20% of traffic past the site which is travelling into a town
centre (Davidson 1992).
(In Oxford) 17% of car-based journeys from outside the urban area now transfer
to P&R, but this contribution is helping to absorb growth, rather than displacing
existing demand (Huntley 1993).
In York, the P+R scheme intercepts 12% of car trips on the adjacent radial route.
However, while Oxford has probably the most utilised bus-based P&R scheme in the
United Kingdom, the car park sites are near the outer edge of the city area. Thus the
proportion of overall CBD-oriented traffic affected is very much less than the 17% figure.
In addition, in the absence of P&R, not all the intercepted trips would necessarily have
gone by car all the way to the CBD.
6.2.2 P&R use by former car drivers
The United States and Canadian data quoted above indicates that broadly half (38%–
60%) of P&R users were former car drivers.
For United Kingdom bus-based schemes, the Oxford/York figures noted earlier were that
51%/60% of week-day P&R users would previously have driven by car to the city.
United Kingdom rail data tend to indicate smaller proportions of users transferring from
car driver. The London NSE assessment is as follows:
• approximately 20% of NSE passengers to Central London use P&R
• for each person using the P&R facilities, there are 0.16 new return rail trips
• assuming NSE accounts for 70% of travel to Central London in the relevant corridors and
each new return rail trip results in 0.7 fewer car trips, then closure of P&R facilities would
result in 2.2% of the total travel market in the corridors transferring from train to car
drivers.
This extreme scenario would have perceptible effects on the total travel market to/from
Central London, but its effect on overall road traffic levels in the area concerned would be
barely noticeable.
6.2.3 Generated road traffic
In some circumstances P&R schemes may generate additional road traffic:
Part 1: Key characteristics of park and ride (P&R)
37
• Some motorists may travel a greater distance to reach a P&R site rather than driving
directly into the town centre (although this does not necessarily mean extra congestion
and pollution, given that a short journey in a congested network may have a greater
adverse impact).
• P&R may encourage motorists to make additional journeys.
• Cars left at a P&R site that were previously driven into the town centre may be replaced
by other vehicles in the town centre.
• Some people who previously travelled all the way by bus now switch to driving to the P&R
site, then continuing by bus.
• Any additional bus services will contribute to overall road traffic.
A United Kingdom survey of P&R users in four towns found that 75% of users travelled
from/through the sector of town in which the P&R site was located; and most likely did
not travel further than if they drove into the town centre (Picket and Gray 1994). The
remainder would probably travel further ‘but part of the extra mileage covered would be
along less congested roads’. In addition, as noted earlier, a significant proportion of P&R
users indicated they visited the town more often since the introduction of the P&R
schemes, or would not have made the journey at all if the P&R scheme had not been not
available (Parkhurst 1994).
6.2.4 Overall effects on traffic levels and congestion
Picket and Grey’s report (1994) reviewed the relevant literature on bus P&R and found
that ‘none of the papers/articles reviewed demonstrated conclusively that P&R reduced
urban traffic congestion’. This does not necessarily mean that P&R has not affected traffic
volumes and congestion, but that any effects are relatively small and difficult to measure.
Analysis of survey data for bus-based P&R in eight United Kingdom towns/cities estimated
the average reduction in car kms/day per car parked at the P&R site and also the
corresponding additional bus passenger car unit (PCU) kms for the P&R bus services. It
was found that (Parkhurst 1996, quoted in Balcombe et al 2004):
• the car kms saved were in the range of 1.5–8.5 kms/car parked per weekday
• the additional bus kms were in the range 1.3–3.7 PCU kms/car parked (counting 1 bus
km = 3 PCU kms).
• overall there were net reductions in PCU kms in five of the centres, but net increases in
the other three centres.
United States studies developed a relationship between vehicle kilometres travelled (VKT)
savings per P&R parking space and the distance between the P&R site and the primary
destination. Savings varied from 18 car kms/day for a site-destination distance of 16 kms
up to 46 car kms/day for a distance of 64 kms. No account was taken of any increases in
public transport services.
PARK AND RIDE: CHARACTERISTICS AND DEMAND FORECASTING
38
As noted above, P&R appears to have had some success in ‘intercepting’ road traffic (eg
Oxford) and in attracting some former car users to public transport. However, analyses in
Oxford and Canterbury have failed to detect any absolute reduction in traffic levels as a
result of P&R, most likely because any road space freed up is filled by previously
suppressed demand. In Oxford, there has been very little traffic increase during the last
20 years, over a period of considerable national traffic growth. It appears that the
combination of P&R, other traffic measures (eg parking fees, increased enforcement) and
lack of road capacity have contributed to this result. Parkhurst suggests that, in both
Oxford and York, P&R has not directly reduced congestion, but that ‘congested
equilibrium’ has been maintained.
These conclusions on the effects of P&R on road traffic levels are consistent with the
finding of other commentators:
With only a few exceptions, (existing P&R services) have not been shown to have a
significant effect on volumes of traffic in the wider urban are. (Armstone 1992,
referring to United Kingdom experience).
In Milwaukee, 6 shopping centre P&R lots removed 400 peak cars from radial
routes, but these represented under 1% of car trips to the CBD. (Barton-Aschman
Associates et al. 1981).
6.2.5 Environmental and energy impacts
The effects of P&R policies on the environment (noise, emissions etc) and on energy use
are directly related to their effects on total car travel (as discussed above).
However, any benefits in terms of energy usage and emissions are likely to be
proportionally smaller than the reductions in car traffic levels. One effect of P&R will be to
change longer car trips (to the destination) to shorter trips (to the P&R site). The emission
reductions will be much less than pro rata to the distance saved, as emissions are much
greater in the warming-up stage. Similarly, any switch from PT travel all the way to travel
by car to P&R site followed by use of PT will cause significant extra emissions.
Another potential ‘environmental issue’ is the impact of the P&R site facility on the local
ground level environment. In Cambridge, the new P&R scheme was seen by some as
environmentally unacceptable as it was proposed to locate sites in green belt areas.
Consideration of this issue deflected debate away from the overall benefits of the P&R
scheme.
7. Key success factors
Although there have been many studies of individual schemes, international experience to
date has not resulted in any simple set of universal rules for when P&R will or will not be
successful and effective:
Part 1: Key characteristics of park and ride (P&R)
39
The wide variety of situations in which P&R has proved to be successful however
argues against the existence of any such criteria of universal applicability.
(Armstone 1992).
There don’t appear to be any….simple rules which would show whether or not P&R
would be successful. (Buchanan 1992).
However, some guidance can be given on the situations which generally favour P&R and
the desirable characteristics of P&R schemes.
P&R is most usefully regarded as a component of CBD traffic and parking restraint policies
and is most appropriate in situations where there is:
• a shortage of CBD parking spaces, whether as a result of geographic limitations or for
transport policy reasons
• limited traffic capacity on radial routes into the CBD
• good quality public transport services into the CBD.
In the United Kingdom, rail-based P&R is most prominent in London, which has both
parking and road capacity constraints. Bus-based P&R has been the most developed and
had the greatest success in historic medium-sized cities (eg Bath, Cambridge, Chester,
Chichester, Exeter, Oxford and York). These cities are all characterised by:
• very compact central areas, with high land values and a shortage of space for parking
• traffic problems due to the limited road space within the CBD and on radial routes
• a heavy emphasis on maintaining the fabric and integrity of the historic central areas.
There seems to be general agreement that CBD parking shortages are essential to the
success of P&R:
The one rule which the (UK) Department of Transport seem prepared to concede is
that … there needs to be a shortage of central area parking. (Buchanan 1992).
Central area parking capacity is therefore a crucial factor in where P&R is likely to
be seen most favourably … English historic towns, … where additional town centre
parking is either difficult to provide or seen as environmentally unwelcome typify
the circumstances in which P&R prospers. (Huntley 1993).
Thus the ‘stick’ of traffic restraint appears essential to the success of P&R schemes. The
evidence is also that this needs to be accompanied by the ‘carrot’ of a good quality PT
service linking the P&R sites with the CBD:
The experience of P&R schemes is very mixed and in general car drivers seem to be
willing to transfer to transit in mid-journey only if there is a considerable advantage
in doing so: P&R in connection with the successful freeway bus lanes in North
America or with the faster rail mode in to large cities, or for shopping at peak times
PARK AND RIDE: CHARACTERISTICS AND DEMAND FORECASTING
40
(e.g. Christmas) when city centre parking is difficult, seem to offer the most
successful examples. (TRRL 1980).
It is important that P&R schemes are market oriented. Generally their potential users will
have the option of making their complete trip by car, and hence for a scheme to be
successful it must offer a level of service comparable with that for making the full trip by
car, eg:
P&R passengers … are a different type of passenger to our normal bus user. They
are car oriented and expect a standard of service that is normally higher. They
want reliability, cleanliness and a good driver attitude. (Miller 1991).
United States research which has investigated the sensitivity of P&R usage to various
features and trip characteristics notes that:
The successful bus service/P&R facilities are in cities with downtown parking
charges over $2/day, are served with buses running at least every 15 minutes, and
are less than a 30 minute bus ride from the CBD.
If extra time by P&R is less than 10 minutes, daily out-of-pocket savings of at least
$0.30 are sufficient to attract P&R usage. If extra time is more than 10 minutes,
P&R usage drops substantially, and is minimal if extra time is over 25 minutes.
Successful schemes require PT headways no greater than every 10–15 minutes: for
greater headways, usage falls rapidly (Barton-Aschman Associates et al. 1981).
The same report comments that rail P&R schemes are generally better patronised than
bus P&R schemes:
• rail travel times are more reliable and more competitive with the car
• more intensive developments around rail stations restrict parking availability
• rail travel is more highly visible.
However, where bus P&R schemes are linked to high-occupancy vehicle (HOV) lanes and
other priority measures, the performance of P&R is much closer to that of rail-based
schemes. This is highlighted by the very strong P&R performance of the Adelaide O-Bahn.
P&R can also have a particular role in low density, high car ownership suburban areas,
where it is not cost-effective to provide attractive levels of PT service through these
areas, but where travellers may be attracted to a good quality of PT line haul service if
they can get convenient access to this. This is the case in many United States situations,
in the outer parts of the London conurbation and the Perth northern rail corridor.
In summary, the evidence indicates that the most essential and almost universally
applicable criterion for the success of P&R schemes is a shortage of reasonably priced
central area parking.
If this criterion does not apply, then P&R is only likely to succeed if there is an
exceptionally high level and quality of PT service linking the parking site with the CBD.

Part 1: Key characteristics of park and ride (P&R)
41
Other key features required for the success of P&R schemes are:
• well designed car park sites, in terms of location and facilities/design
• separate PT corridor/lane and/or PT priority measures
• good information and marketing of the scheme
• adequate personal and car security at the P&R site.
In essence, the basic requirement for success is that access to the CBD via P&R needs to
be competitive with the use of the car for the whole trip – in terms of perceived
generalised costs (quality, reliability, comfort, travel time, out-of-pocket costs etc).

42

Part 2: Review of international modelling practices

Part 2 Review of international modelling practices
45
1. Part 2 overview
This section discusses research undertaken, mostly through published material via the
internet, on general demand forecasting approaches to P&R. There has been renewed
interest in estimating demand for P&R, driven primarily by making better use of under-
utilised public transport corridors, through encouraging use from over-utilised road
networks. The literature review highlights two primary methods which are currently being
used to estimate future P&R usage, namely regional models and site-specific models. Each
approach has strengths and weaknesses, and requires common sense by the planner and a
certain amount of local knowledge. A general theme is that as computing power and
software has improved, so has the complexity of the demand forecasting models.
2. P&R modelling overview
2.1 Background
Interest in P&R as a mode expanded rapidly during the oil crisis of the 1970s. In the
United States, both state and regional transit agencies examined ways to make car-
pooling and public transport usage more accessible and convenient for suburban and rural
residents working in centralised cities and major employment areas. Initial approaches to
P&R site development were largely based on knowledge of the area and the constraints of
land available for development rather than the potential usage of a site. The major driver
behind P&R as a concept was that escalating oil prices would force drivers to seek more
economically efficient forms of transport, such as mass transit.
P&R modelling interest peaked in the 1970s and early 1980s to coincide with the move to
mass transit systems. A number of transportation agencies conducted extensive studies
to examine P&R demand, particularly in Texas, Seattle, Houston and Portland. Since the
mid-1980s, there has been little in the way of technique development. This has been due
mainly to the stabilising of oil prices and the implementation of many P&R strategies.
However, given recent increases in oil prices, P&R will again be a significant topic. Also,
many agencies have adopted an incremental approach where test sites are developed and
services and capacities enhanced where needed. Most agencies choosing this method still
rely on practical knowledge of the proposed service area and are faced with the
availability of multiple alternative sites.
In the United Kingdom, P&R began mainly in historic towns and cities as they suffered
from traffic congestion earlier than other ‘planned’ cities. Primarily this was due to their
spatial design, radial road network and limited scope for major traffic management and
investment. In the early 1970s P&R strategies were introduced in Oxford and Nottingham
and by 1996 P&R was a part of the transport strategy in 85% of local authorities, with
72% either expecting to expand or introduce new schemes. However, little was known
about the criteria for a successful site.
PARK AND RIDE: CHARACTERISTICS AND DEMAND FORECASTING
46
2.2 Forecasting approaches
The potential approaches to forecasting P&R demand in any given situation depend on the
particular aspects that are under consideration, such as whether it is a general strategy
for an urban area, a plan for a specific corridor or an extension of existing sites.
Spillar (1997) identifies three broad types of forecasting approaches:
• post-modelling techniques
• direct regional forecasting techniques
• site-level forecasting (based on site and service characteristics).
Post-modelling frameworks are the simplest approach and may give reasonable and
approximate figures. They are used in conjunction with either a multi-modal transport
model or observed travel mode split data. The process requires the definition of
catchment areas to a P&R site. Mode shares from the model or observed data are
obtained to give the number of car vs PT travellers and then adjustment factors are
applied to PT users to represent the proportion of passengers likely to use car access.
These adjustment factors may be based on international experience or observed data
where available. While this approach is easy to implement, it ignores implicit changes in
transport supply (such as fare or journey time changes) and does not address the issue of
station/site choice. Post-modelling frameworks are easy to implement and not particularly
data intensive but require base forecasts, either from a multi-modal model or from
observed data. Further, these techniques are relatively subjective, with much of the
modal distribution effect left to the experience of the team – results can therefore differ
widely when different approaches are used. These techniques cannot be used to examine
station/site choice aspects and are largely being superseded by the two approaches
discussed below.
Regional-modelling approaches include P&R as a distinct mode within a multi-modal
model. Multi-modal models normally include a mode-split function, which gives the
proportion of trips between an origin and destination by main mode. Functions are
normally represented by a ‘logit’ equation, which relates the proportion of trips by each
mode to mode-specific costs and parameters. These approaches allow P&R demand to
respond not only to changes in its costs, but also to those of other modes; they also give
the ability to include site-choice models and greater standardisation between site usage
estimates. However, they require a higher degree of modelling sophistication and a
significant level of commitment, often needing changes in the network and model
structure of existing regional models. Further, their success is only as good as the
regional model itself, particularly the mode-split structures and the quality of the base
data, and they are generally unable to reflect local factors affecting individual site usage.
Site-specific approaches relate the usage at a P&R site to variables describing the
location, catchment size and characteristics, transport costs from the site and facilities,
which are assumed to define the attractiveness of car access to the station/site.
Part 2 Review of international modelling practices
47
Regression equations are developed using data from existing sites, which may or may not
include information from transport models. As these approaches can be based on localised
data, they may give a better estimate of new site usage. However, although they do not
require detailed transport modelling or explicit forecasting of PT demand, data
requirements are significant with around 15 sites required to be able to deduce
reasonably robust statistical equations. Finally, site-choice modelling can be difficult
where site catchments overlap. It also requires careful examination of variables for
suitability and to eliminate collinearity (particularly between distance, time and cost),
which may then limit their future application.
Each of these approaches requires, to a greater or lesser extent, input from the analyst,
whether in the form of direct estimates of demand or as parameter values used in
particular methodologies. Davidson (1992) lists (in order of complexity) three main
methods to obtain such inputs:
• market research
• ad-hoc forecasting
• stated/revealed preference analysis.
Market research in the early days significantly overestimated demand, particularly for new
modes. Respondents were generally presented with a new mode and asked if they would
use it and many said they would. Forecasts developed from these methods were seldom
achieved, as what people said seldom carried through to their actual decisions. Davidson
portrays market research as a useful tool for determining people’s perceptions of problems
and issues, which can then be applied when schemes are marketed back to the public.
However, these approaches are not particularly useful for P&R demand forecasting.
Ad-hoc forecasting involves the use of model parameters from other studies to determine
coarse estimates of ridership and revenue and is particularly useful at an early stage of a
study. Many of these models involve the use of multinomial logit models (binomial models
are a special case involving only two modes), where the model output is the probability of
using the mode, based on a series of modal costs and associated parameters. However,
while these model forms can generally be applied universally, the parameters cannot as
many are a function of the local situation.
Stated/revealed preference methods extend the ad-hoc model to use locally
developed parameters. Where P&R sites currently exist, revealed preference (RP) data
(based on what people actually choose to do) can be used to determine model
parameters, although this approach may not be applicable for new sites whose
characteristics are vastly different from the existing ones. Stated preference (SP) data
can be used when the alternative does not exist, or to test people’s response under
hypothetical scenarios. Respondents are asked which choice they would make given a
series of alternatives with differing costs. This approach is really a more sophisticated
form of market research and has the same disadvantage in that a respondent’s choice
may not be the same as what they do in practice. To minimise this, Davidson
recommends using both RP and SP as complementary data sets.
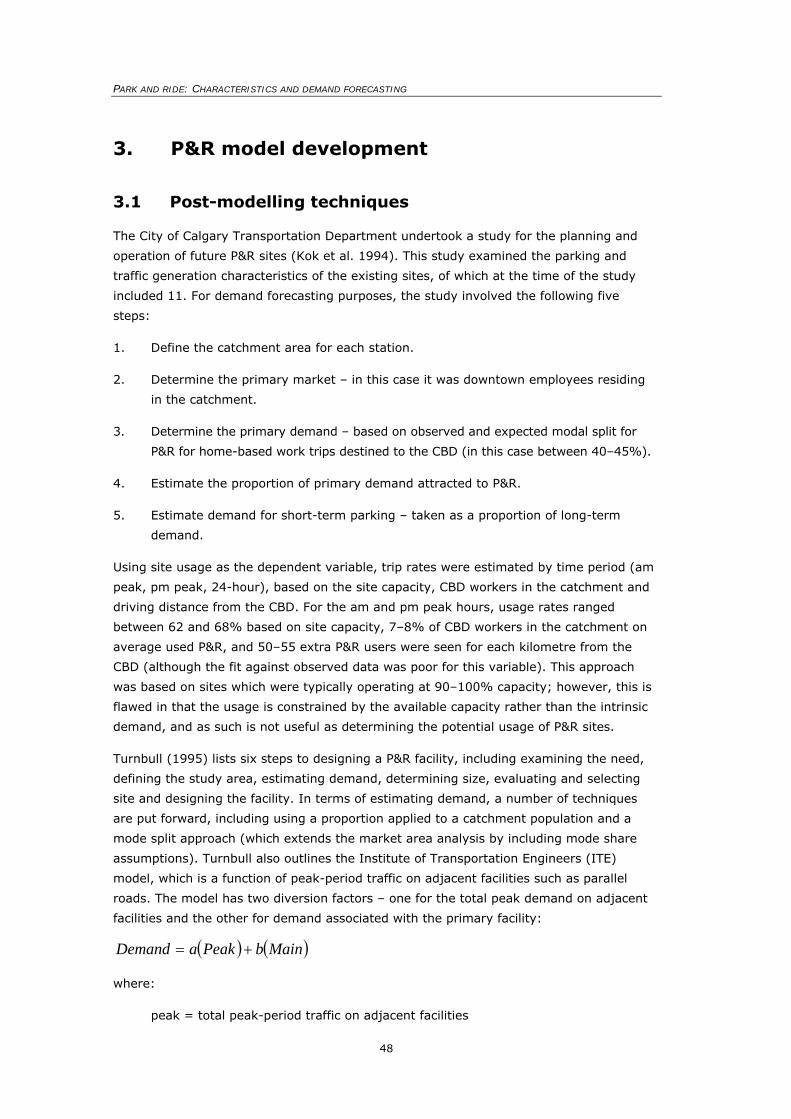
PARK AND RIDE: CHARACTERISTICS AND DEMAND FORECASTING
48
3. P&R model development
3.1 Post-modelling techniques
The City of Calgary Transportation Department undertook a study for the planning and
operation of future P&R sites (Kok et al. 1994). This study examined the parking and
traffic generation characteristics of the existing sites, of which at the time of the study
included 11. For demand forecasting purposes, the study involved the following five
steps:
1. Define the catchment area for each station.
2. Determine the primary market – in this case it was downtown employees residing
in the catchment.
3. Determine the primary demand – based on observed and expected modal split for
P&R for home-based work trips destined to the CBD (in this case between 40–45%).
4. Estimate the proportion of primary demand attracted to P&R.
5. Estimate demand for short-term parking – taken as a proportion of long-term
demand.
Using site usage as the dependent variable, trip rates were estimated by time period (am
peak, pm peak, 24-hour), based on the site capacity, CBD workers in the catchment and
driving distance from the CBD. For the am and pm peak hours, usage rates ranged
between 62 and 68% based on site capacity, 7–8% of CBD workers in the catchment on
average used P&R, and 50–55 extra P&R users were seen for each kilometre from the
CBD (although the fit against observed data was poor for this variable). This approach
was based on sites which were typically operating at 90–100% capacity; however, this is
flawed in that the usage is constrained by the available capacity rather than the intrinsic
demand, and as such is not useful as determining the potential usage of P&R sites.
Turnbull (1995) lists six steps to designing a P&R facility, including examining the need,
defining the study area, estimating demand, determining size, evaluating and selecting
site and designing the facility. In terms of estimating demand, a number of techniques
are put forward, including using a proportion applied to a catchment population and a
mode split approach (which extends the market area analysis by including mode share
assumptions). Turnbull also outlines the Institute of Transportation Engineers (ITE)
model, which is a function of peak-period traffic on adjacent facilities such as parallel
roads. The model has two diversion factors – one for the total peak demand on adjacent
facilities and the other for demand associated with the primary facility:
( ) ( )MainbPeakaDemand +=
where:
peak = total peak-period traffic on adjacent facilities
Part 2 Review of international modelling practices
49
main = peak-period traffic on the primary facility
a, b = diversion factors for total traffic and prime facility traffic respectively
(a = 1%, b = 3% recommended)
3.2 Regional modelling
P&R demand has been included in a number of regional models but most have used
comparatively unsophisticated structures which are relatively insensitive to changes in
network characteristics. The most comprehensive approaches have been developed within
the Emme/2 modelling framework. This is a transport modelling package developed by
INRO and is used extensively in New Zealand by local authorities, including the Wellington
Transport Strategy Model (WTSM), the Auckland Regional Transport (ART) and Auckland
Public Transport (APT) models.
Spiess (1996) wrote a paper outlining a procedure for modelling P&R within Emme/2. The
procedure involves the use of mixed-mode logit models, but can be extended to include
an intermediate station choice logit model. His procedure included the allowance of
parking capacities at the sites through the use of shadow prices (reflecting the cost
associated with the ‘last’ parking space in the site). A site that does not reach capacity
has a shadow cost of zero. Practically, this process in Emme/2 needs to split a P&R trip
into two legs, namely the access mode by car and the main mode by public transport.
This can be achieved through the use of the matrix convolution function within Emme/2,
which can give the split of access and main mode costs, as well as the number of people
using a particular site and Spiess shows that a stable solution is achieved. Using an
iterative approach, an additional car parking charge (shadow price) can be added where
P&R exceeds capacity, which is a function of the demand at the site. This will redistribute
P&R users to other sites where feasible and in combination with a full mode split model
would allocate users to other feasible and competing modes. Spiess has developed an
Emme/2 macro (parkride.mac) to undertake the P&R modelling, although this would need
to be adjusted for specific models and situations.
Xie and Wies (2001) also outline an Emme/2 approach for estimating the combined cost
of a P&R trip using matrix convolutions. Where this piece of work differs from Spiess is
that it focuses on determining a cost associated with parking at a site, with the purpose of
representing more accurate car-transit costs for mode split. As such, the authors claim
this approach to be more appropriate to a regional model methodology.
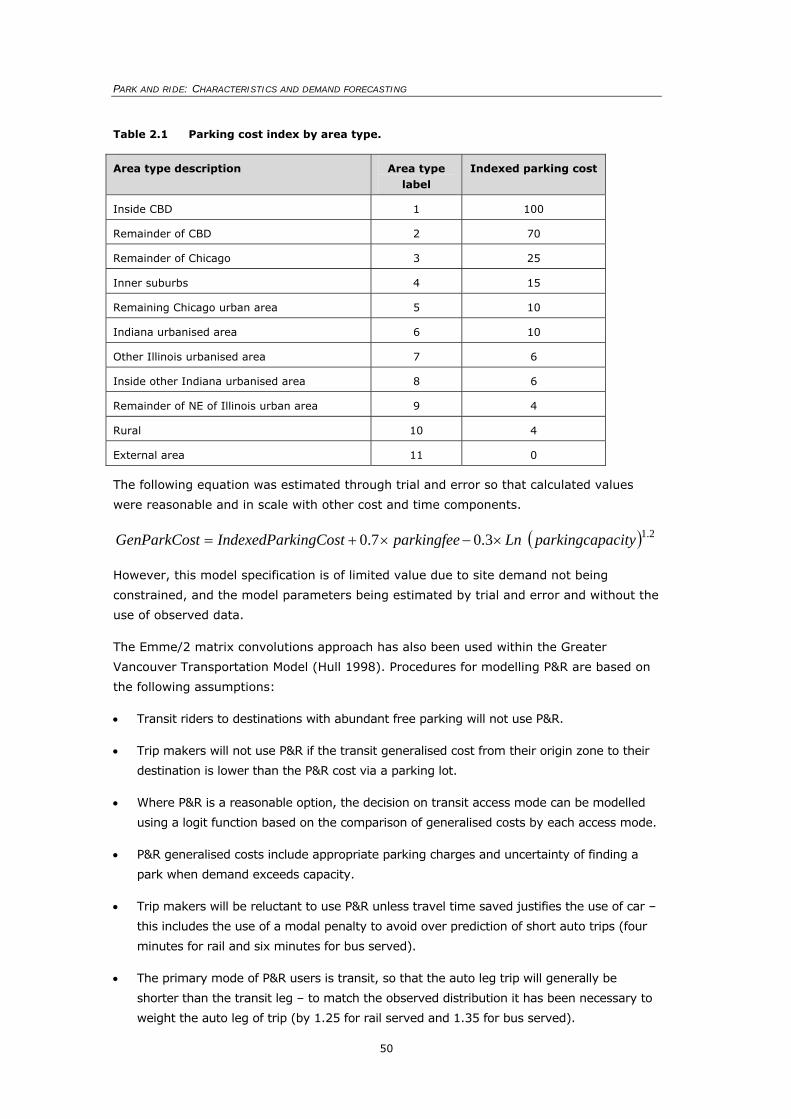
PARK AND RIDE: CHARACTERISTICS AND DEMAND FORECASTING
50
Table 2.1 Parking cost index by area type.
The following equation was estimated through trial and error so that calculated values
were reasonable and in scale with other cost and time components.
( ) 2.1 3.07.0 acityparkingcapLnparkingfeekingCostIndexedPartGenParkCos ×−×+=
However, this model specification is of limited value due to site demand not being
constrained, and the model parameters being estimated by trial and error and without the
use of observed data.
The Emme/2 matrix convolutions approach has also been used within the Greater
Vancouver Transportation Model (Hull 1998). Procedures for modelling P&R are based on
the following assumptions:
• Transit riders to destinations with abundant free parking will not use P&R.
• Trip makers will not use P&R if the transit generalised cost from their origin zone to their
destination is lower than the P&R cost via a parking lot.
• Where P&R is a reasonable option, the decision on transit access mode can be modelled
using a logit function based on the comparison of generalised costs by each access mode.
• P&R generalised costs include appropriate parking charges and uncertainty of finding a
park when demand exceeds capacity.
• Trip makers will be reluctant to use P&R unless travel time saved justifies the use of car –
this includes the use of a modal penalty to avoid over prediction of short auto trips (four
minutes for rail and six minutes for bus served).
• The primary mode of P&R users is transit, so that the auto leg trip will generally be
shorter than the transit leg – to match the observed distribution it has been necessary to
weight the auto leg of trip (by 1.25 for rail served and 1.35 for bus served).
Area type description Area type label
Indexed parking cost
Inside CBD 1 100
Remainder of CBD 2 70
Remainder of Chicago 3 25
Inner suburbs 4 15
Remaining Chicago urban area 5 10
Indiana urbanised area 6 10
Other Illinois urbanised area 7 6
Inside other Indiana urbanised area 8 6
Remainder of NE of Illinois urban area 9 4
Rural 10 4
External area 11 0
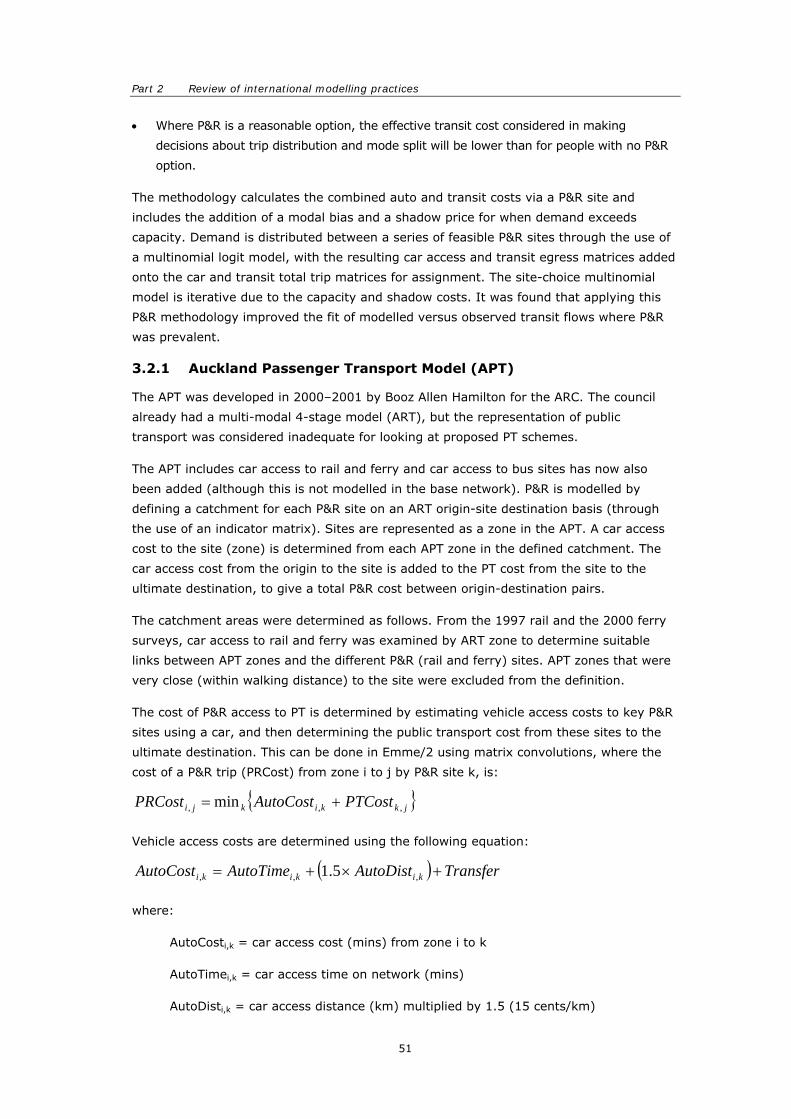
Part 2 Review of international modelling practices
51
• Where P&R is a reasonable option, the effective transit cost considered in making
decisions about trip distribution and mode split will be lower than for people with no P&R
option.
The methodology calculates the combined auto and transit costs via a P&R site and
includes the addition of a modal bias and a shadow price for when demand exceeds
capacity. Demand is distributed between a series of feasible P&R sites through the use of
a multinomial logit model, with the resulting car access and transit egress matrices added
onto the car and transit total trip matrices for assignment. The site-choice multinomial
model is iterative due to the capacity and shadow costs. It was found that applying this
P&R methodology improved the fit of modelled versus observed transit flows where P&R
was prevalent.
3.2.1 Auckland Passenger Transport Model (APT)
The APT was developed in 2000–2001 by Booz Allen Hamilton for the ARC. The council
already had a multi-modal 4-stage model (ART), but the representation of public
transport was considered inadequate for looking at proposed PT schemes.
The APT includes car access to rail and ferry and car access to bus sites has now also
been added (although this is not modelled in the base network). P&R is modelled by
defining a catchment for each P&R site on an ART origin-site destination basis (through
the use of an indicator matrix). Sites are represented as a zone in the APT. A car access
cost to the site (zone) is determined from each APT zone in the defined catchment. The
car access cost from the origin to the site is added to the PT cost from the site to the
ultimate destination, to give a total P&R cost between origin-destination pairs.
The catchment areas were determined as follows. From the 1997 rail and the 2000 ferry
surveys, car access to rail and ferry was examined by ART zone to determine suitable
links between APT zones and the different P&R (rail and ferry) sites. APT zones that were
very close (within walking distance) to the site were excluded from the definition.
The cost of P&R access to PT is determined by estimating vehicle access costs to key P&R
sites using a car, and then determining the public transport cost from these sites to the
ultimate destination. This can be done in Emme/2 using matrix convolutions, where the
cost of a P&R trip (PRCost) from zone i to j by P&R site k, is:
{ }jkkikji PTCostAutoCostPRCost ,,, min +=
Vehicle access costs are determined using the following equation:
( ) TransferAutoDistAutoTimeAutoCost kikiki +×+= ,,, 5.1
where:
AutoCosti,k = car access cost (mins) from zone i to k
AutoTimei,k = car access time on network (mins)
AutoDisti,k = car access distance (km) multiplied by 1.5 (15 cents/km)
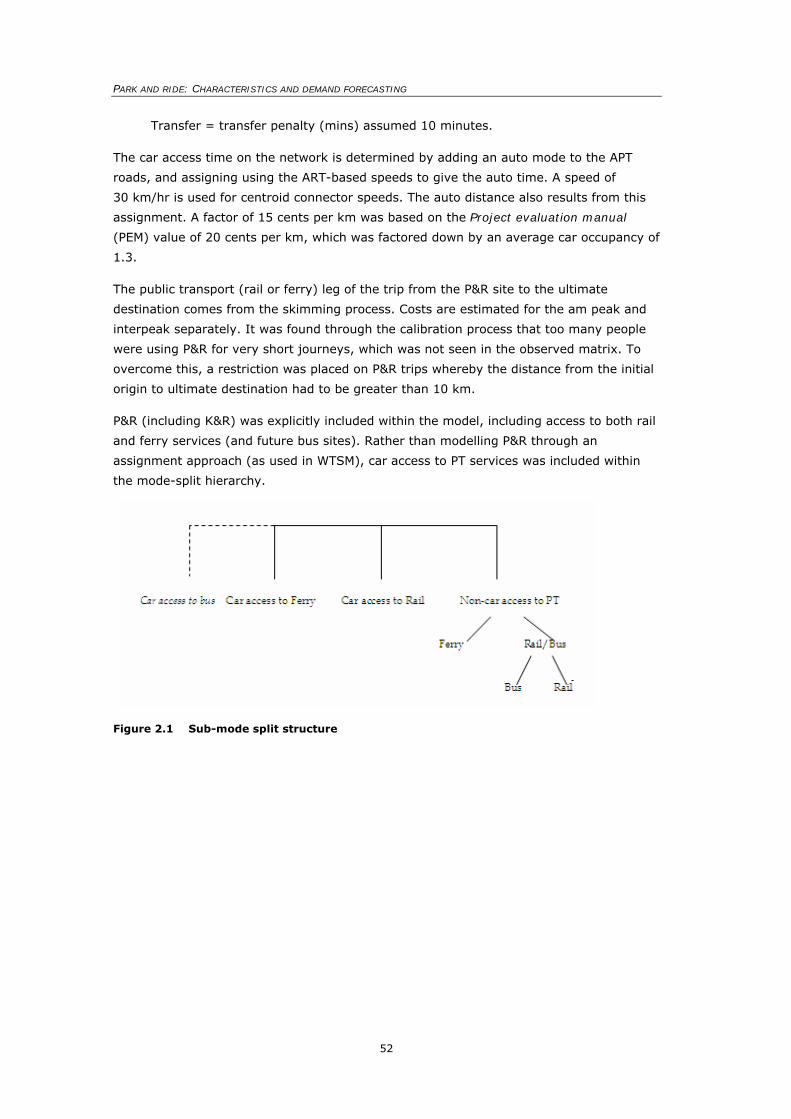
PARK AND RIDE: CHARACTERISTICS AND DEMAND FORECASTING
52
Transfer = transfer penalty (mins) assumed 10 minutes.
The car access time on the network is determined by adding an auto mode to the APT
roads, and assigning using the ART-based speeds to give the auto time. A speed of
30 km/hr is used for centroid connector speeds. The auto distance also results from this
assignment. A factor of 15 cents per km was based on the Project evaluation manual
(PEM) value of 20 cents per km, which was factored down by an average car occupancy of
1.3.
The public transport (rail or ferry) leg of the trip from the P&R site to the ultimate
destination comes from the skimming process. Costs are estimated for the am peak and
interpeak separately. It was found through the calibration process that too many people
were using P&R for very short journeys, which was not seen in the observed matrix. To
overcome this, a restriction was placed on P&R trips whereby the distance from the initial
origin to ultimate destination had to be greater than 10 km.
P&R (including K&R) was explicitly included within the model, including access to both rail
and ferry services (and future bus sites). Rather than modelling P&R through an
assignment approach (as used in WTSM), car access to PT services was included within
the mode-split hierarchy.
Figure 2.1 Sub-mode split structure
Part 2 Review of international modelling practices
53
Table 2.2 APT sub-mode split parameter estimates.
AM Rail IP Rail AM Ferry
IP Ferry AM Rail P&R
IP Rail P&R
AM Ferry P&R
IP Ferry P&R
Lambda λ -0.065 -0.049 -0.055 -0.048 -0.038 -0.0319 -0.040 -0.037
SE 0.00144 0.00120 0.00295 0.00205 0.00182 0.00276 0.00239 0.0041
SE’ 0.00242 0.00188 0.00505 0.00376 0.00254 0.00415 0.00494 0.0083
Constant (Bus=0) β
-0.1716 -0.1838 1.364 1.306 -1.485 -2.521 -0.873 -0.54
SE 0.0255 0.0253 0.105 0.0969 0.0530 0.101 0.050 0.168
SE’ 0.0429 0.0396 0.1797 0.1778 0.0740 0.1520 0.1033 0.341
MSC (mins) 2.64 3.75 -24.8 -27.2 39.4 79.0 22.0 14.5
R^2 .34 .25 .55 .60 .20 .22 .15 .24
Unweighted obs
4585 5081 506 708 2530 2296 1328 783
Weighted obs 12979 12471 1482 2383 4933 5197 5663 3224
Notes:
SE is the standard error
SE’ is an adjustment to the standard error due to the weighting of data. The adjustment is SE*sqrt
(average expansion factor)
R^2 is the correlation with respect to constants (directly from Alogit statistical package)
Values of lambda for both the am peak and interpeak are consistent with the structure
outlined in Figure 2.1, with the largest magnitude lambda for rail at the bottom of the
tree and the P&R lambdas at the top. Resulting lambdas for P&R were consistently around
-0.040 except for the interpeak rail P&R, and θ (the sensitivity of P&R to PT changes)
ranges from 0.58 for am peak P&R to 0.77 for interpeak (IP) ferry. For the P&R modes, an
average lambda was asserted and the constant modified until the total number of trips
matched the observed.
The results imply large penalties or mode-specific constants (MSCs) for the P&R modes
(from $1.40 for IP ferry to $7.90 for IP rail) and reflect the significant proportion of
people that are in practice captive to non-car access to PT.
3.2.2 Wellington Transport Strategy Model (WTSM)
The Wellington Transport Strategy Model (WTSM) is the multi-modal model of the
Wellington Region. The current version was developed by consultants Sinclair Knight Merz
and Beca between 2001 and 2003 and delivered to the Greater Wellington Regional
Council (GWRC) in late 2003. Since then it has been a source of transport data and the
main tool for forecasting the impacts of alterations to transport networks, public transport
services and land-use plans. It has been used in this capacity in all strategic and policy
studies initiated by the GWRC over the last 18 months including the CBD Corridor Study,
PARK AND RIDE: CHARACTERISTICS AND DEMAND FORECASTING
54
the re-evaluation of Transmission Gully Motorway, the Wellington Rail Review and the
Wellington Transport Project.
P&R is included within the model through a series of network connector links (called P-
connectors) from zones directly to stations. These P-connectors have a faster speed on
them than normal centroid or walk speeds. This speed is not fixed and is related to the
length of the connector, reflecting the further people travel the faster their average speed
will be. As a result, P&R is represented only in the assignment and not as an individual
mode in any mode choice model.
While this approach is adequate at successfully replicating existing behaviour (through the
calibration of link lengths and speeds), it is not as useful for looking at P&R policies such
as the development of new sites, increases in capacities, or site choice. Further, the
behaviour in future years is unclear as the P-connector will abstract more demand to P&R
(in a more congested network) without an increase in P&R capacity.
The suggested way for modelling increases in capacity is to shorten the P-connector link
lengths. However due to the nature of the network, it is impossible to restrict other local
trips from using the same links and so the additional demand generated by an
‘improvement’ in capacity will not necessarily be P&R demand (and may not even use the
rail network). Further, users of the P-connectors (who would be using the road network)
are not assigned on the road network and so do not impact on local congestion. Also the
scale of magnitude change is subjective and not related to anything tangible (such as
actual capacity assumptions).
3.3 Site-specific modelling
Spillar (1997) discusses a site-level P&R demand model estimated for the Seattle
metropolitan region. The model included demand and site characteristic data for 31 active
express-bus served sites. Five model equations were developed based on eight site-level
variables:
• service area population
• ratio of auto costs to transit costs
• distance from P&R facility to major employment centre
• number of express buses during the am peak
• best (not average) time between the P&R facility and the CBD of the metropolitan area
• proximity to the regional freeway system
• presence of nearby P&R facilities
• availability of midday services.
Adjusted R2 ranged from 0.40 (for an equation that included ratio of costs, number of
peak buses and proximity to freeway) to 0.68 (which included: proximity to freeway –
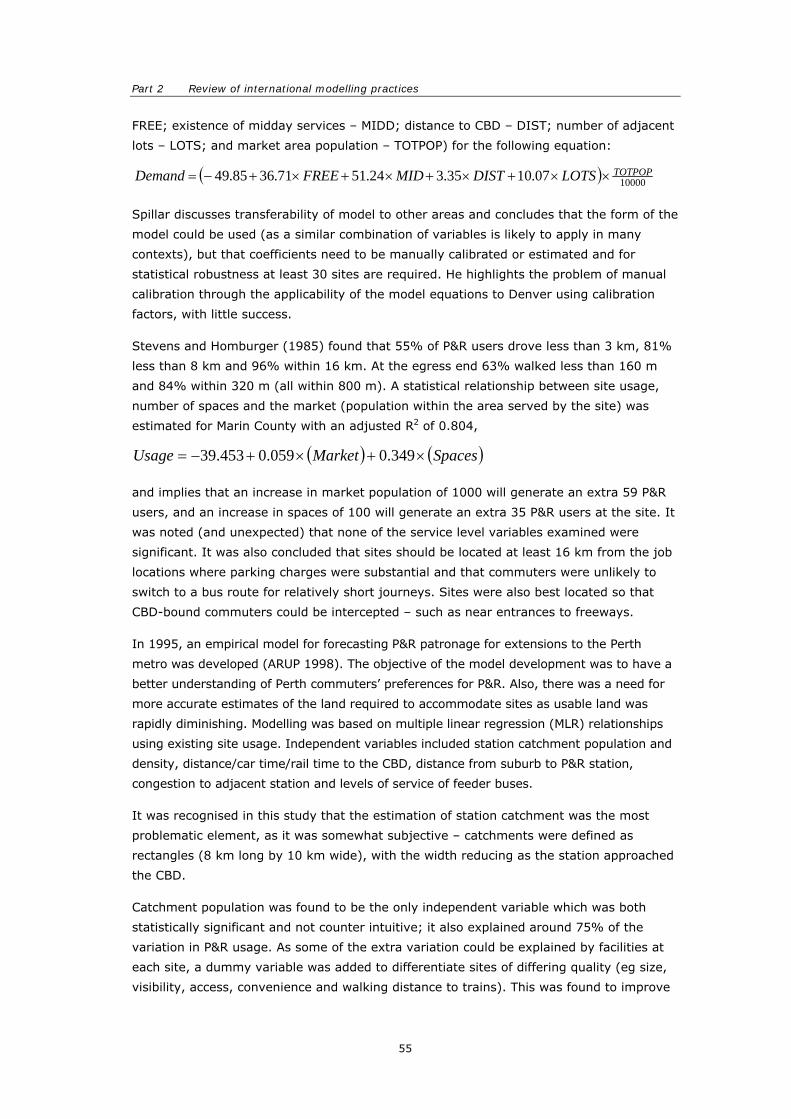
Part 2 Review of international modelling practices
55
FREE; existence of midday services – MIDD; distance to CBD – DIST; number of adjacent
lots – LOTS; and market area population – TOTPOP) for the following equation:
( ) 1000007.1035.324.5171.3685.49 TOTPOPLOTSDISTMIDFREEDemand ××+×+×+×+−=
Spillar discusses transferability of model to other areas and concludes that the form of the
model could be used (as a similar combination of variables is likely to apply in many
contexts), but that coefficients need to be manually calibrated or estimated and for
statistical robustness at least 30 sites are required. He highlights the problem of manual
calibration through the applicability of the model equations to Denver using calibration
factors, with little success.
Stevens and Homburger (1985) found that 55% of P&R users drove less than 3 km, 81%
less than 8 km and 96% within 16 km. At the egress end 63% walked less than 160 m
and 84% within 320 m (all within 800 m). A statistical relationship between site usage,
number of spaces and the market (population within the area served by the site) was
estimated for Marin County with an adjusted R2 of 0.804,
( ) ( )SpacesMarketUsage ×+×+−= 349.0059.0453.39
and implies that an increase in market population of 1000 will generate an extra 59 P&R
users, and an increase in spaces of 100 will generate an extra 35 P&R users at the site. It
was noted (and unexpected) that none of the service level variables examined were
significant. It was also concluded that sites should be located at least 16 km from the job
locations where parking charges were substantial and that commuters were unlikely to
switch to a bus route for relatively short journeys. Sites were also best located so that
CBD-bound commuters could be intercepted – such as near entrances to freeways.
In 1995, an empirical model for forecasting P&R patronage for extensions to the Perth
metro was developed (ARUP 1998). The objective of the model development was to have a
better understanding of Perth commuters’ preferences for P&R. Also, there was a need for
more accurate estimates of the land required to accommodate sites as usable land was
rapidly diminishing. Modelling was based on multiple linear regression (MLR) relationships
using existing site usage. Independent variables included station catchment population and
density, distance/car time/rail time to the CBD, distance from suburb to P&R station,
congestion to adjacent station and levels of service of feeder buses.
It was recognised in this study that the estimation of station catchment was the most
problematic element, as it was somewhat subjective – catchments were defined as
rectangles (8 km long by 10 km wide), with the width reducing as the station approached
the CBD.
Catchment population was found to be the only independent variable which was both
statistically significant and not counter intuitive; it also explained around 75% of the
variation in P&R usage. As some of the extra variation could be explained by facilities at
each site, a dummy variable was added to differentiate sites of differing quality (eg size,
visibility, access, convenience and walking distance to trains). This was found to improve
PARK AND RIDE: CHARACTERISTICS AND DEMAND FORECASTING
56
the explanation of the model to around 95%; however, there were still significant outliers.
The final equation was:
( ) ( )mystationdumatchmentopulationcestimatedpPatonage ×−×+= 1730127.0273
indicating that a high quality P&R station (dummy=0) would have a base usage of 273
plus 1.27% of the catchment population. However, an equation such as this does not
provide a useful indication of where to locate the site (unless to maximise population
catchment), or what happens when catchments overlap. Also, improvements to rail
services will have no impact on patronage unless the ‘facility’ (station dummy) is deemed
to improve.
3.4 Stated/revealed preference studies
These studies are the most structured method of obtaining model parameters for use in
the development of mode-share models and as such have specific applications to
developing regional modelling approaches. Stated preference (SP) data can be used when
P&R does not currently exist, or to test people’s response under hypothetical scenarios.
Respondents are asked which choice they would make given a series of alternatives with
differing costs. This approach has the disadvantage that their choice may not be the same
as what they might do in practice. Where existing P&R sites and usage occurs, revealed
preference (RP) data (based on what people actually choose to do) can be used to
determine model parameters. This approach can only be used where the alternative
currently exists and may not be applicable to new sites where characteristics may be
vastly different.
Hole (2004) discusses the merits of SP and RP, with emphasis on the sources of errors for
each. Under an SP approach where respondents are asked a series of ‘what if’ scenarios,
sources of error include model specification errors (wrong functional forms or variables)
and taste differences between respondents. Respondents also have a tendency to behave
differently in surveys than in practice. This may be due to learning effects (where answers
given later in the survey may be based on answers given previously), fatigue effects
(where options are not evaluated fully near the end of surveys), policy bias, or
justification bias (where a person using a current option is more likely to justify their
current choice).
RP analysis is based on observed behaviour and so errors relating to choice are excluded.
However an additional measurement error is included, due to costs of choices being
estimated (for a particular behaviour) rather than asserted as in an SP survey.
Because the sources of error are different between SP and RP, the two approaches
typically give different results. Hole (2004) recommends two common methods for
comparing SP and RP parameters. The first is to rescale the parameters in an SP survey
based on a known RP value (such as the value of time for a segment). The second is to
estimate parameters based on a combination of SP and RP data, although it is unlikely
that consistent data of both types would be available for a study. Davidson (1992) also
recommends using both RP and SP as complementary data sets.
Part 2 Review of international modelling practices
57
3.4.1 Stated preference studies
The Transport Department of the Polytechnic University of Madrid and the Madrid Public
Transport Authority carried out research intended to analyse present and potential P&R
demand in the Madrid metropolitan area (Monzon et al. 1998). The research included an
SP experiment. A computer-assisted telephone interview (CATI) was initially conducted
with more than 6000 households in order to get a sample of 300 people (5% response
rate) who, to qualify for inclusion, needed to:
• travel to the Madrid city centre
• use a private car
• travel three or more times a week
• be willing to participate in the SP experiment
• be able to provide base trip data such as origin, destination, and cost components.
A face-to-face interview was then conducted at each selected respondent’s residence. The
interview included three different questionnaires, including the SP experiment, household
socio-economic data and attitudes towards P&R, pricing policies and public transport.
For the SP experiment three modal alternatives (private car, public transport and P&R)
and two attributes (trip time and trip cost) were included. Ten different scenarios (based
on varying the attributes around their base choice values) were given so that each option
was relevant to the individual. The respondent was asked to rank each mode.
The survey found that 62% of respondents had never used P&R facilities. For people who
had used P&R, security, the number of car spaces and car access were the most
important aspects to be improved. It was also found that 39.6% of car drivers to the city
centre had a parking lot provided by their employer.
Conclusions from the SP survey identified the difficulty in generating competitive
scenarios between public transport and private car. Large changes in base trip values
were required, reducing the credibility of the survey to the respondents. More than 30%
of respondents did not change their current choice (private car) in any of the 10 scenarios
presented. Further, constants associated with public transport were consistently negative
(when segmented by distance, purpose and income level) and in every case lower than
the P&R constant. This represents more of a reluctance to use P&R than public transport
(all things being equal), which the study explains as fear of lack of security, or reluctance
to transfer between modes.
In 2004, the University of St Andrews (Scotland) undertook a study looking at forecasting
the demand for an employee P&R service (Hole 2004). The objective of the study was to
reduce the number of employees commuting alone by car to work by encouraging the use
of more environmentally friendly modes such as public transport, cycling and walking.
One of the measures identified as achieving this objective was employer-driven, through
the introduction of a P&R service via a large off-site parking space with a shuttle-bus
serving the workplace.
PARK AND RIDE: CHARACTERISTICS AND DEMAND FORECASTING
58
Because the P&R service was a new mode of access and there was no existing data,
stated rather than revealed preference estimation was the only option. All staff were
asked whether they would choose to travel to work as usual or use P&R if such a service
was provided by the University. There were three choices – ‘Park-on-site’, ‘P&R’, ‘Don’t
know’). P&R door-to-door travel time and costs were varied over three different levels
relative to the individual’s current commute. Of the 1661 questionnaires distributed, 642
were returned (38.7% response rate), with respondents categorised as academics (or
non-academics), and by income (low and high) based on their occupation.
A number of different forecasting approaches were examined; all were based on a binary
logit model where people chose between two modes (in this case car and P&R), but
differed in that parameters were corrected for respondent biases. The study identified
that stated and revealed preference models may not give the same parameter values,
primarily due to different sources of error.
It was found (assuming the same travel costs for both car and P&R) that estimates for the
P&R mode share ranged from 18.5% (without scaling) to 12.1% (when rescaled). An
alternative approach to the rescaling problem was suggested by Fowkes and Preston and
involved the averaging of the probabilistic (18.5% mode share) and deterministic (0.4%
mode share) parameters, which resulted in an estimate of 9.5%.
Ghali et al. (2000) report the results of travel behaviour research including road user
charging, PT fares/integrated ticketing, parking charges, P&R initiatives and HOV lanes.
Work was carried out at eight European cities (Athens, Como, Madrid, Leeds, York,
Helsinki, Göteborg and Graz), although the project was only half completed at the time
the paper was written.
As part of the project, a common SP survey was undertaken, concentrating on present car
users and their willingness to change to PT or P&R if the price of using a car was
substantially increased. The target sample size in each city was 300 interviews (split as
home-based work, shopping and other trips). Respondents were recruited at parking and
office buildings and basic information about their journeys collected to tailor the SP
survey to their current journey. In the SP questionnaire all the attributes had three levels;
for all travel times and costs for PT and P&R the levels were 80%, 100% and 120% of the
base value, and for car costs the levels were 100%, 150% and 200%. Ten questions were
then asked (including a reference question using existing status).
Unfortunately the paper only provides limited results and conclusions and little is
applicable to P&R. Modelling for York however included P&R as a mode, and a bus priority
measure (resulting in an 18% reduction in bus travel times) increased P&R usage by
around 3%.
3.4.2 Revealed preference studies
In 1996, London Transport (LT) commissioned consultants Oscar Faber to assess the
potential to develop car parks in the outer fare zones of London where land costs are
relatively low and generated fare revenues are potentially high. Central to developing
station car parks was the notion of ‘gateway’ stations, which would be highly accessible
Part 2 Review of international modelling practices
59
from the major road routes and incorporate a number of facilities that would be
potentially attractive to existing car users. The demand model developed was a simple
logit model where a diversion curve was used to estimate the proportion of trips switching
from one mode to another based on the differences in the mode’s generalised cost – in
this case from car all the way to P&R. Models for two time periods were estimated: am
peak (7 am to 10 am) and interpeak (10 am to 4 pm).
The P&R mode generalised cost of travel included:
• access time to the station
• cost of parking at the station
• walking from the car park to the platform
• cost of the ticket
• waiting for the service
• ride time on the service
• walking to final destination.
The car mode included:
• time spent driving the car
• time spent looking for a parking space
• cost of parking
• walk to final destination.
Vehicle operating costs were also included for the time spent in the car under both
modes. The study does not mention how the parameters were obtained or how successful
the methodology was for representing existing and future behaviour. However, potential
demand for P&R was then converted into space required through an assumption of 25 m2
per car parking space.
A University of Melbourne study (Joyce 1978) examining ‘The choice of access mode to a
suburban rail interchange’ looked at developing access mode models to rail services
through the use of binary mode (walk, bus, P&R and K&R) choice models. For Box Hill
station, a zonal (aggregated) analysis was undertaken to derive relationships to give the
proportion of passengers using each access mode based on distance, the level of bus
service in the zone (comparison of walk vs total bus time), and car availability (proportion
of zero, one and multi-car households). Equations for walk and bus gave the best validity
(relating to distance, bus service and zero car households), with P&R and K&R models
(relating to all variables) yielding poor results, with no significant parameters. The
conclusion from the Box Hill study was that the relationships developed were of limited
use for estimating car access proportions.
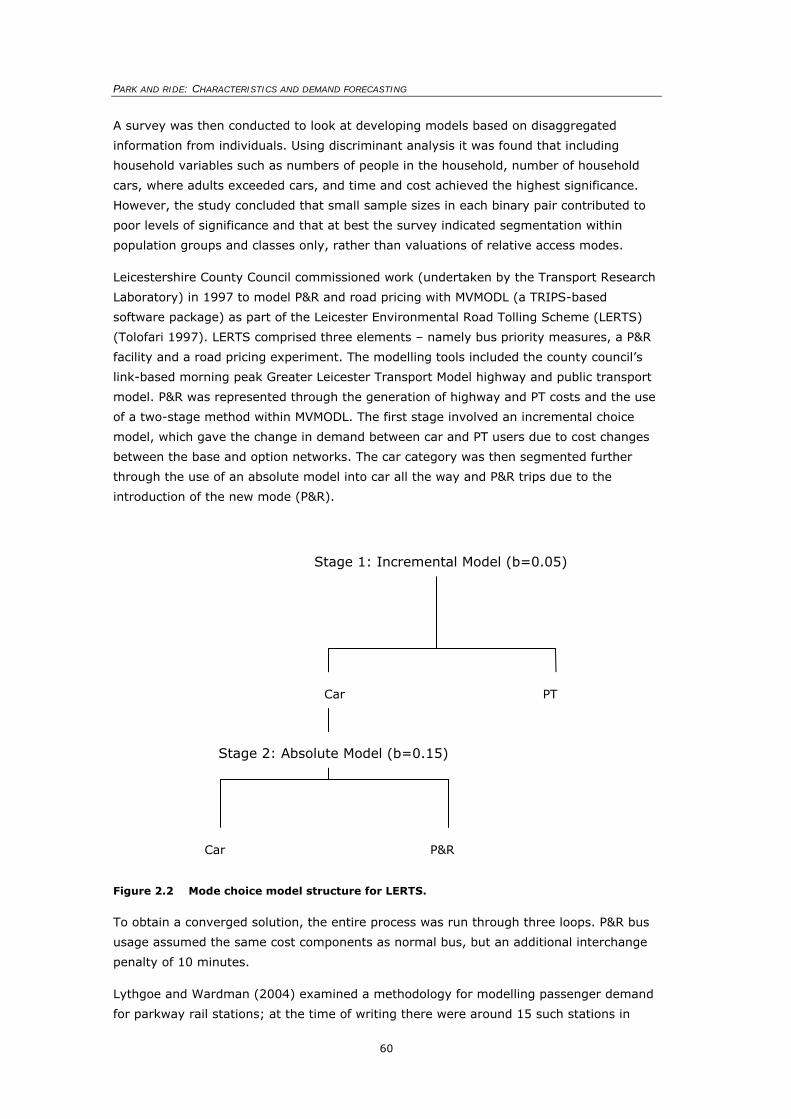
PARK AND RIDE: CHARACTERISTICS AND DEMAND FORECASTING
60
A survey was then conducted to look at developing models based on disaggregated
information from individuals. Using discriminant analysis it was found that including
household variables such as numbers of people in the household, number of household
cars, where adults exceeded cars, and time and cost achieved the highest significance.
However, the study concluded that small sample sizes in each binary pair contributed to
poor levels of significance and that at best the survey indicated segmentation within
population groups and classes only, rather than valuations of relative access modes.
Leicestershire County Council commissioned work (undertaken by the Transport Research
Laboratory) in 1997 to model P&R and road pricing with MVMODL (a TRIPS-based
software package) as part of the Leicester Environmental Road Tolling Scheme (LERTS)
(Tolofari 1997). LERTS comprised three elements – namely bus priority measures, a P&R
facility and a road pricing experiment. The modelling tools included the county council’s
link-based morning peak Greater Leicester Transport Model highway and public transport
model. P&R was represented through the generation of highway and PT costs and the use
of a two-stage method within MVMODL. The first stage involved an incremental choice
model, which gave the change in demand between car and PT users due to cost changes
between the base and option networks. The car category was then segmented further
through the use of an absolute model into car all the way and P&R trips due to the
introduction of the new mode (P&R).
Figure 2.2 Mode choice model structure for LERTS.
To obtain a converged solution, the entire process was run through three loops. P&R bus
usage assumed the same cost components as normal bus, but an additional interchange
penalty of 10 minutes.
Lythgoe and Wardman (2004) examined a methodology for modelling passenger demand
for parkway rail stations; at the time of writing there were around 15 such stations in
Car
Car P&R
PT
Stage 1: Incremental Model (b=0.05)
Stage 2: Absolute Model (b=0.15)
Part 2 Review of international modelling practices
61
Great Britain. The purpose of the research was to develop a framework (focusing solely
on inter-urban – longer than 80 km journeys) for modelling demand at parkway stations,
which have a level of competition (with each other). It was concluded that the inclusion of
a competition parameter improved the explanatory power of existing elasticity forecasting
techniques and resulted in a more plausible generalised cost elasticity.
Lythgoe and Wardman list four desirable features that the parkway model should include:
• station choice, as parkway stations are likely to have overlapping catchments, where
improvements at one site may abstract from others
• generation of new rail trips
• a procedure that is not too data intensive
• demand parameters that are suitable to parkway attracted travellers.
The model took the form of a hierarchical logit model, which included generalised cost
calculations for an origin zone to an intermediate (parkway) station, and then from the
station to the destination. Separate cost estimates were determined where an origin zone
was served by more than one parkway station (a station choice model). A function of
distance was also included in the model. The final parameters obtained were:
Table 2.3 Logit model parameters for a parkway station
Parameter Estimate T-Value
λ - spread -8.429 -49.82
θ - generation 0.498 37.07
ζ - distance constant -26.699 -18.45
η - distance factor -0.009 -16.72
Adjusted R2 0.5318
As Lythgoe and Wardman (2004) discuss in the text, λθ is the elasticity of rail demand
given a change in generalised cost and in this case is -4.2. Analysis of non-London inter-
urban flows gives a GC elasticity of -1.71 and a separate access time elasticity of -0.61,
or a combined impact of -2.32. The higher elasticity for parkway users may be explained
by the largely car-based market having distinctly different preferences for a stronger rail
service and an aversion to access time – given they have a car available for use. The
elasticity of -4.2 is converted to its constituent components by their proportion of total
generalised costs: GJT=-2.27, fare=-1.1, access time=-0.66, access cost=-0.17.
Elasticity to journey time (GJT) of -2.27 is significantly higher than the widely held
average of -0.9, indicating that it is the strong competition between rail service quality
and car that is the main contributor. The two terms ζ and η indicate that non-rail utility
decreases with distance, but is a relatively small effect.
PARK AND RIDE: CHARACTERISTICS AND DEMAND FORECASTING
62
4. Summary
This section has outlined the approaches adopted for modelling P&R demand.
Techniques have become more complex as computing power has increased, with P&R
multi-modal routines now being included in large regional models. Interest in P&R (and
subsequent demand estimation) is likely to increase as car operating costs (through fuel
increases) rise.
International modelling practices of P&R revolve around two main techniques; namely
direct regional and site-specific approaches. Direct regional approaches use the relative
costs of P&R against other modes to develop mode split functions that can be applied to
the catchment population of a site. They are responsive to changes in the measurable
cost attributes of transport (such as frequency, travel time and fares), but do not usually
include some of the more local (and perceived) measures such as safety and local
accessibility of site. Regional approaches can also be used to determine abstraction from
other modes (such as car or PT all the way) as well as competition between sites (when
catchments overlap) through a site-choice logit model.
Parameters for mode-split models rely on stated or revealed preference data. Stated
preference data for P&R is generally difficult to collect due to P&R being a small proportion
of the total PT market. SP scenarios also generally need to include extreme changes in
costs to encourage mode switching behaviour and even then a significant proportion of
respondents will not change. As such, P&R SP surveys can be an expensive exercise and
the results of limited value. RP data is the easiest source of model parameters but
requires P&R to be an existing and statistically significant mode.
Site-specific models differ from regional models in that they ignore other modes and are
based purely on characteristics relating to the site (through the use of linear regression
equations). These can give better estimates for individual sites as the calibration (to
existing usage) can be more exact and more of the local site facility attributes can be
included. However because other modes are ignored, there is no indication of abstraction
from other modes and it is difficult to estimate the impact on nearby sites. As many
attributes are often highly correlated, a robust model may not include transport-related
variables such as travel time or fares.
Both techniques require the definition of a catchment – the area around a P&R site where
potential users are located (See Part 1, Section 5.3). Catchment shapes and sizes have
been researched particularly in North America, with the shape being fairly constant
between studies: the 50-percentile demand can be approximated by a circle and the
85 percentile by a parabolic curve aligned towards the main direction of travel. The
dimensions of the circle and parabola are context specific and relate to local conditions
such as levels of congestion, and site closeness. Generally it has been found that
catchment definitions, site-specific and regional models can be universally applied, but
that parameter values vary significantly from application to application.

Part 2 Review of international modelling practices
63
In conclusion, both techniques have their own strengths and weaknesses and are
sensitive to differing transport attributes. The development of two models, namely a site
specific and a regional model (using circular catchments) is therefore probably the best
combination for modelling P&R demand for a transport network.

64
Part 3: Analysis and model development for Wellington

Part 3: Analysis and model development for Wellington
67
1. Part 3 overview
The section outlines the development and testing of two park and ride (P&R) forecasting
models for Wellington, for which current P&R usage is significant, data is readily available,
and a suitable regional transport model exists. The models developed here could be
applied (albeit with different parameters) to other locations.
The section examines two different approaches (regional and site-specific) to modelling
car access/P&R demand to rail stations. Both approaches require the definition of car
access catchments to each site. While this is easy to do when observed data exists,
defining a catchment for a new station is more difficult. Station catchments also depend
on the level of service offered. It was found that for Wellington stations, catchment size
could be related to the number of express and total services serving the station, the time
and distance to the central business district (CBD), whether the parking site was lit and
whether it was at the end of a line.
2. Modelling frameworks adopted
Part 2 of this report ‘Review of international modelling practices’, outlined three main
approaches undertaken when estimating P&R usage; namely ‘post-modelling’, ‘regional’,
and ‘site-specific’ frameworks. While each approach has its own level of sophistication and
its own advantages and disadvantages, they are essentially complementary and provide a
sense-check of each other.
While post-modelling is the simplest approach, it ignores changes in level-of-service (such
as fare, frequency or journey time changes) and does not address the issue of station/site
choice. It has, therefore, not been considered further. Instead, a regional model and a
site-specific model have been developed and a series of scenario tests undertaken.
A stated preference (SP) survey was also conducted as part of the modelling project to
provide parameters for comparison with those derived from revealed preference (RP)
analyses for the Wellington region. However, it became apparent after the survey pilot
that conducting a large and statistically meaningful SP survey would be very expensive,
and the survey was terminated at the pilot stage without parameter estimations. A
detailed description of the pilot SP survey is given in Appendix E.
An important first stage in modelling P&R demand is to define the catchment for each
potential P&R site. This is described in the next section, following which separate regional
and site-specific models are developed.
PARK AND RIDE: CHARACTERISTICS AND DEMAND FORECASTING
68
3. Development of a P&R site catchment model
3.1 Overview
A critical element of P&R usage estimation is the definition of a P&R site’s catchment area.
This area represents the potential market of population/travellers that would feasibly use
the site. These catchments are primarily used for the site-specific approach where inputs
into the model relating to population characteristics are required, although catchments can
also be defined within a regional model approach. The definition is particularly important in
estimating demand at new sites, where there is no relevant observed data to define the
potential market. Catchment areas may also change as characteristics of the site change
(for example a catchment increasing as express services begin to serve a station).
This part of the report outlines the current characteristics of car access catchments to
Wellington rail stations and derives models that can be used to define area sizes given
changes in site characteristics. These are also applicable to new site market definition
(similar models for other regions could be developed but with regional-specific parameters).
3.2 Observed access characteristics
A 2002 rail survey undertaken by the Greater Wellington Regional Council (GWRC) was
the primary data source used to define catchments. Distance as recorded in the survey is
straight-line distance rather than road-based. As such, all distances recorded here are
straight-line1. Based on the 2002 rail survey, approximately 50% of car access to all rail
stations in the Wellington Region is within 1.85 km, 75% within 3.5 km and 90% within
6.5 km. The maximum distance passengers are prepared to travel by car to access rail is
32 km and the minimum is around 250 m (this also includes car drop-off). Car passenger
distance ranges are 1.6 km for 50%, 3.1 km for 75% and 5.9 km for 90% of demand.
1 GWRC suggests a factor of 1.36 on average to convert to road-distance, although this will differ widely between zones as well as by distance; sample calculations give a factor of 1.68 for 1 km reducing to 1.18 for 50 km.
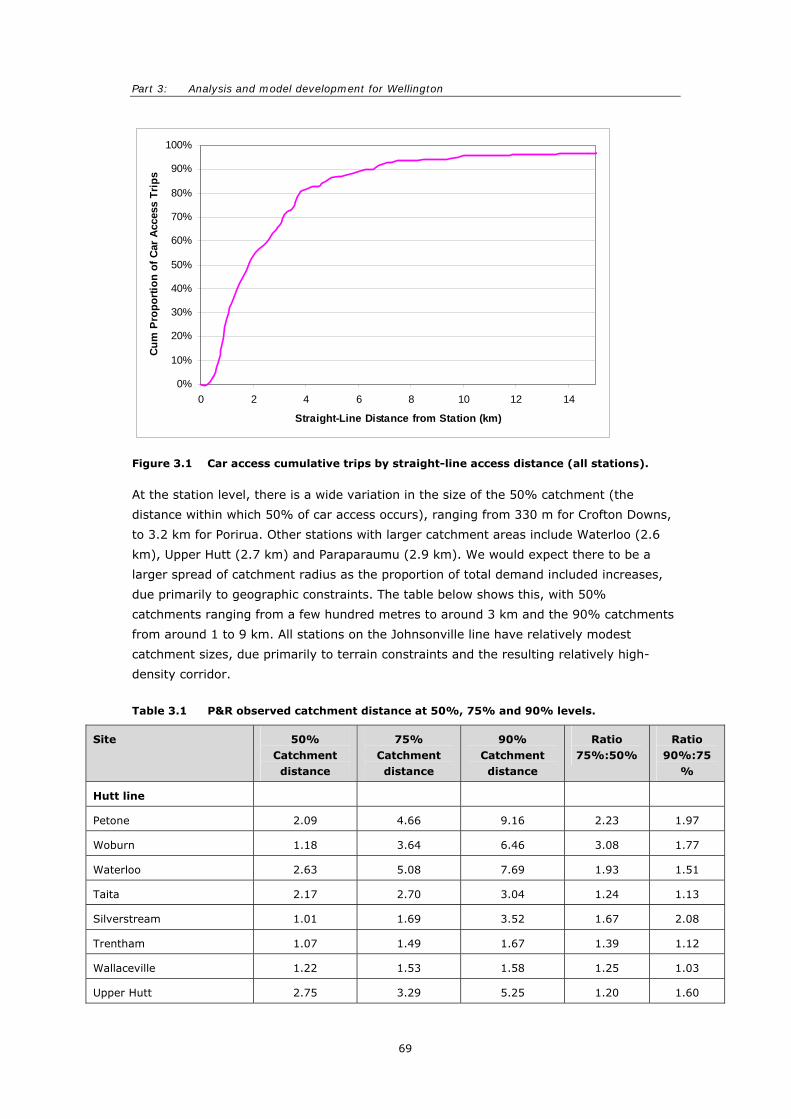
Part 3: Analysis and model development for Wellington
69
Figure 3.1 Car access cumulative trips by straight-line access distance (all stations).
At the station level, there is a wide variation in the size of the 50% catchment (the
distance within which 50% of car access occurs), ranging from 330 m for Crofton Downs,
to 3.2 km for Porirua. Other stations with larger catchment areas include Waterloo (2.6
km), Upper Hutt (2.7 km) and Paraparaumu (2.9 km). We would expect there to be a
larger spread of catchment radius as the proportion of total demand included increases,
due primarily to geographic constraints. The table below shows this, with 50%
catchments ranging from a few hundred metres to around 3 km and the 90% catchments
from around 1 to 9 km. All stations on the Johnsonville line have relatively modest
catchment sizes, due primarily to terrain constraints and the resulting relatively high-
density corridor.
Table 3.1 P&R observed catchment distance at 50%, 75% and 90% levels.
Site 50% Catchment distance
75% Catchment distance
90% Catchment distance
Ratio 75%:50%
Ratio 90%:75
%
Hutt line
Petone 2.09 4.66 9.16 2.23 1.97
Woburn 1.18 3.64 6.46 3.08 1.77
Waterloo 2.63 5.08 7.69 1.93 1.51
Taita 2.17 2.70 3.04 1.24 1.13
Silverstream 1.01 1.69 3.52 1.67 2.08
Trentham 1.07 1.49 1.67 1.39 1.12
Wallaceville 1.22 1.53 1.58 1.25 1.03
Upper Hutt 2.75 3.29 5.25 1.20 1.60
0%
10%
20%
30%
40%
50%
60%
70%
80%
90%
100%
0 2 4 6 8 10 12 14
Straight-Line Distance from Station (km)
Cum
Pro
porti
on o
f Car
Acc
ess
Trip
s
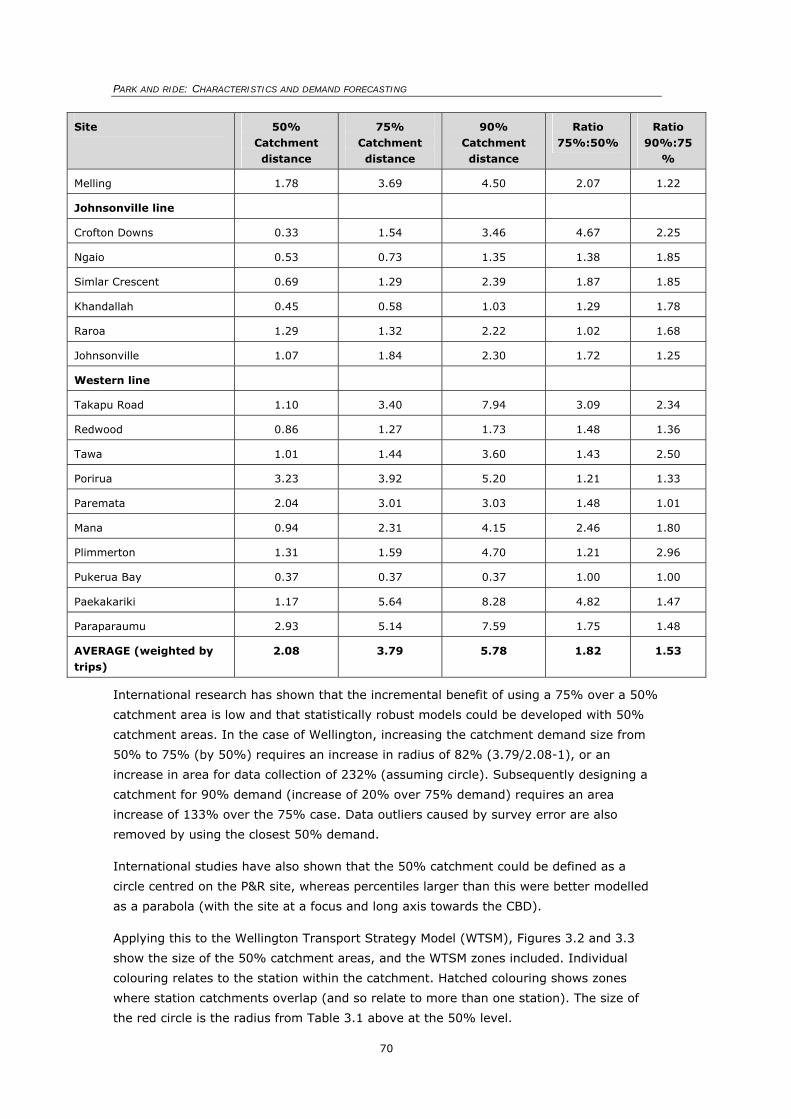
PARK AND RIDE: CHARACTERISTICS AND DEMAND FORECASTING
70
Site 50% Catchment distance
75% Catchment distance
90% Catchment distance
Ratio 75%:50%
Ratio 90%:75
%
Melling 1.78 3.69 4.50 2.07 1.22
Johnsonville line
Crofton Downs 0.33 1.54 3.46 4.67 2.25
Ngaio 0.53 0.73 1.35 1.38 1.85
Simlar Crescent 0.69 1.29 2.39 1.87 1.85
Khandallah 0.45 0.58 1.03 1.29 1.78
Raroa 1.29 1.32 2.22 1.02 1.68
Johnsonville 1.07 1.84 2.30 1.72 1.25
Western line
Takapu Road 1.10 3.40 7.94 3.09 2.34
Redwood 0.86 1.27 1.73 1.48 1.36
Tawa 1.01 1.44 3.60 1.43 2.50
Porirua 3.23 3.92 5.20 1.21 1.33
Paremata 2.04 3.01 3.03 1.48 1.01
Mana 0.94 2.31 4.15 2.46 1.80
Plimmerton 1.31 1.59 4.70 1.21 2.96
Pukerua Bay 0.37 0.37 0.37 1.00 1.00
Paekakariki 1.17 5.64 8.28 4.82 1.47
Paraparaumu 2.93 5.14 7.59 1.75 1.48
AVERAGE (weighted by trips)
2.08 3.79 5.78 1.82 1.53
International research has shown that the incremental benefit of using a 75% over a 50%
catchment area is low and that statistically robust models could be developed with 50%
catchment areas. In the case of Wellington, increasing the catchment demand size from
50% to 75% (by 50%) requires an increase in radius of 82% (3.79/2.08-1), or an
increase in area for data collection of 232% (assuming circle). Subsequently designing a
catchment for 90% demand (increase of 20% over 75% demand) requires an area
increase of 133% over the 75% case. Data outliers caused by survey error are also
removed by using the closest 50% demand.
International studies have also shown that the 50% catchment could be defined as a
circle centred on the P&R site, whereas percentiles larger than this were better modelled
as a parabola (with the site at a focus and long axis towards the CBD).
Applying this to the Wellington Transport Strategy Model (WTSM), Figures 3.2 and 3.3
show the size of the 50% catchment areas, and the WTSM zones included. Individual
colouring relates to the station within the catchment. Hatched colouring shows zones
where station catchments overlap (and so relate to more than one station). The size of
the red circle is the radius from Table 3.1 above at the 50% level.
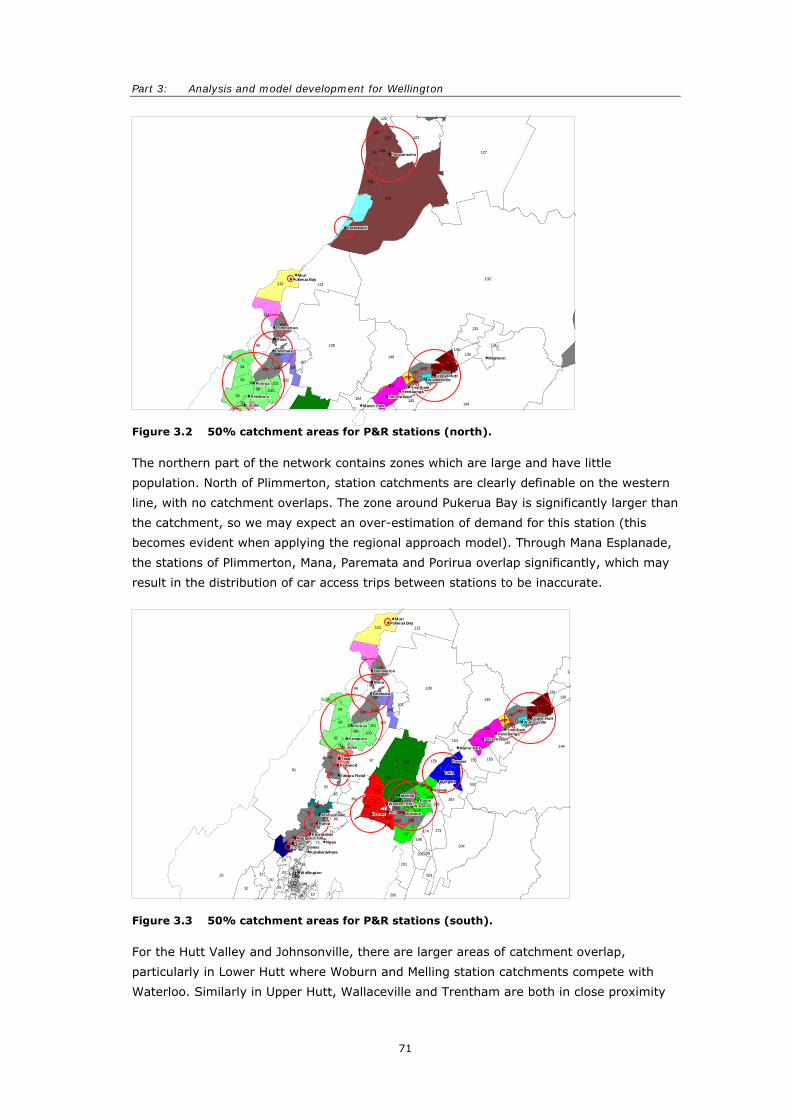
Part 3: Analysis and model development for Wellington
71
Figure 3.2 50% catchment areas for P&R stations (north).
The northern part of the network contains zones which are large and have little
population. North of Plimmerton, station catchments are clearly definable on the western
line, with no catchment overlaps. The zone around Pukerua Bay is significantly larger than
the catchment, so we may expect an over-estimation of demand for this station (this
becomes evident when applying the regional approach model). Through Mana Esplanade,
the stations of Plimmerton, Mana, Paremata and Porirua overlap significantly, which may
result in the distribution of car access trips between stations to be inaccurate.
Figure 3.3 50% catchment areas for P&R stations (south).
For the Hutt Valley and Johnsonville, there are larger areas of catchment overlap,
particularly in Lower Hutt where Woburn and Melling station catchments compete with
Waterloo. Similarly in Upper Hutt, Wallaceville and Trentham are both in close proximity
90
92
93
94
95
96
9798
99100
101102
103104
105
106107
108
109
110
111
112 113
114
115
116
117118
119
120121
122
123
127
132
133
134
135136
137
138
139140141142
143
144145
146
147148
149
150
151152
154
Manor ParkManor ParkManor ParkManor ParkManor ParkManor ParkManor ParkManor ParkManor Park
SilverstreamSilverstreamSilverstreamSilverstreamSilverstreamSilverstreamSilverstreamSilverstreamSilverstreamHeretaungaHeretaungaHeretaungaHeretaungaHeretaungaHeretaungaHeretaungaHeretaungaHeretaunga
TrenthamTrenthamTrenthamTrenthamTrenthamTrenthamTrenthamTrenthamTrentham
W allacevilleW allacevilleW allacevilleW allacevilleW allacevilleW allacevilleW allacevilleW allacevilleW allacevilleUpper HuttUpper HuttUpper HuttUpper HuttUpper HuttUpper HuttUpper HuttUpper HuttUpper Hutt
MaymornMaymornMaymornMaymornMaymornMaymornMaymornMaymornMaymorn
LindenLindenLindenLindenLindenLindenLindenLindenLinden
KenepuruKenepuruKenepuruKenepuruKenepuruKenepuruKenepuruKenepuruKenepuru
PoriruaPoriruaPoriruaPoriruaPoriruaPoriruaPoriruaPoriruaPorirua
ParemataParemataParemataParemataParemataParemataParemataParemataParemata
ManaManaManaManaManaManaManaManaMana
PlimmertonPlimmertonPlimmertonPlimmertonPlimmertonPlimmertonPlimmertonPlimmertonPlimmerton
Pukerua BayPukerua BayPukerua BayPukerua BayPukerua BayPukerua BayPukerua BayPukerua BayPukerua BayMuriMuriMuriMuriMuriMuriMuriMuriMuri
PaekakarikiPaekakarikiPaekakarikiPaekakarikiPaekakarikiPaekakarikiPaekakarikiPaekakarikiPaekakariki
ParaparaumuParaparaumuParaparaumuParaparaumuParaparaumuParaparaumuParaparaumuParaparaumuParaparaumu
13
10
12
21
2526
2728
29
3031
32
33
34
35
36373839
4041
424344 45
46474849
505152
53545556
5758596061626364
6566
676869
70
7172
73
74
75
76
7778 79
80
81
82
83
8485
86
8788 89
90
91
92
93
94
95
96
9798
99100
101102
103104
105
106107
108
109
110
111
112 113
13
135136
137
138
139140141142
143
144145
146
147148
149
150
151152
153
154
155156157158159
160161
162
163
164
165
166
167168
169
170171
172
173174
175176177
178179180181182183184
185 186187
188189190
191
192
193
194
195196
197198
199
200
201
202
203
204
W ellingtonW ellingtonW ellingtonW ellingtonW ellingtonW ellingtonW ellingtonW ellingtonW ellington
Crofton DownsCrofton DownsCrofton DownsCrofton DownsCrofton DownsCrofton DownsCrofton DownsCrofton DownsCrofton DownsNgaioNgaioNgaioNgaioNgaioNgaioNgaioNgaioNgaio
Awarua StAwarua StAwarua StAwarua StAwarua StAwarua StAwarua StAwarua StAwarua StSimlar CresSimlar CresSimlar CresSimlar CresSimlar CresSimlar CresSimlar CresSimlar CresSimlar CresBox HillBox HillBox HillBox HillBox HillBox HillBox HillBox HillBox HillKhandallahKhandallahKhandallahKhandallahKhandallahKhandallahKhandallahKhandallahKhandallah
RaroaRaroaRaroaRaroaRaroaRaroaRaroaRaroaRaroa
JohnsonvilleJohnsonvilleJohnsonvilleJohnsonvilleJohnsonvilleJohnsonvilleJohnsonvilleJohnsonvilleJohnsonville
KaiwharawharaKaiwharawharaKaiwharawharaKaiwharawharaKaiwharawharaKaiwharawharaKaiwharawharaKaiwharawharaKaiwharawhara
NgauNgauNgauNgauNgauNgauNgauNgauNgau
PetonePetonePetonePetonePetonePetonePetonePetonePetone
W estern HuttW estern HuttW estern HuttW estern HuttW estern HuttW estern HuttW estern HuttW estern HuttW estern Hutt
MellingMellingMellingMellingMellingMellingMellingMellingMelling
AvaAvaAvaAvaAvaAvaAvaAvaAva W oburnW oburnW oburnW oburnW oburnW oburnW oburnW oburnW oburn
W aterlooW aterlooW aterlooW aterlooW aterlooW aterlooW aterlooW aterlooW aterlooEpuniEpuniEpuniEpuniEpuniEpuniEpuniEpuniEpuni
NaenaeNaenaeNaenaeNaenaeNaenaeNaenaeNaenaeNaenaeNaenae
W ingateW ingateW ingateW ingateW ingateW ingateW ingateW ingateW ingate
TaitaTaitaTaitaTaitaTaitaTaitaTaitaTaitaTaita
PomarePomarePomarePomarePomarePomarePomarePomarePomare
Manor ParkManor ParkManor ParkManor ParkManor ParkManor ParkManor ParkManor ParkManor Park
SilverstreamSilverstreamSilverstreamSilverstreamSilverstreamSilverstreamSilverstreamSilverstreamSilverstreamHeretaungaHeretaungaHeretaungaHeretaungaHeretaungaHeretaungaHeretaungaHeretaungaHeretaunga
TrenthamTrenthamTrenthamTrenthamTrenthamTrenthamTrenthamTrenthamTrentham
W allacevilleW allacevilleW allacevilleW allacevilleW allacevilleW allacevilleW allacevilleW allacevilleW allacevilleUpper HuttUpper HuttUpper HuttUpper HuttUpper HuttUpper HuttUpper HuttUpper HuttUpper Hutt
Takapu RoadTakapu RoadTakapu RoadTakapu RoadTakapu RoadTakapu RoadTakapu RoadTakapu RoadTakapu Road
RedwoodRedwoodRedwoodRedwoodRedwoodRedwoodRedwoodRedwoodRedwood
TawaTawaTawaTawaTawaTawaTawaTawaTawa
LindenLindenLindenLindenLindenLindenLindenLindenLinden
KenepuruKenepuruKenepuruKenepuruKenepuruKenepuruKenepuruKenepuruKenepuru
PoriruaPoriruaPoriruaPoriruaPoriruaPoriruaPoriruaPoriruaPorirua
ParemataParemataParemataParemataParemataParemataParemataParemataParemata
ManaManaManaManaManaManaManaManaMana
PlimmertonPlimmertonPlimmertonPlimmertonPlimmertonPlimmertonPlimmertonPlimmertonPlimmerton
Pukerua BayPukerua BayPukerua BayPukerua BayPukerua BayPukerua BayPukerua BayPukerua BayPukerua BayMuriMuriMuriMuriMuriMuriMuriMuriMuri
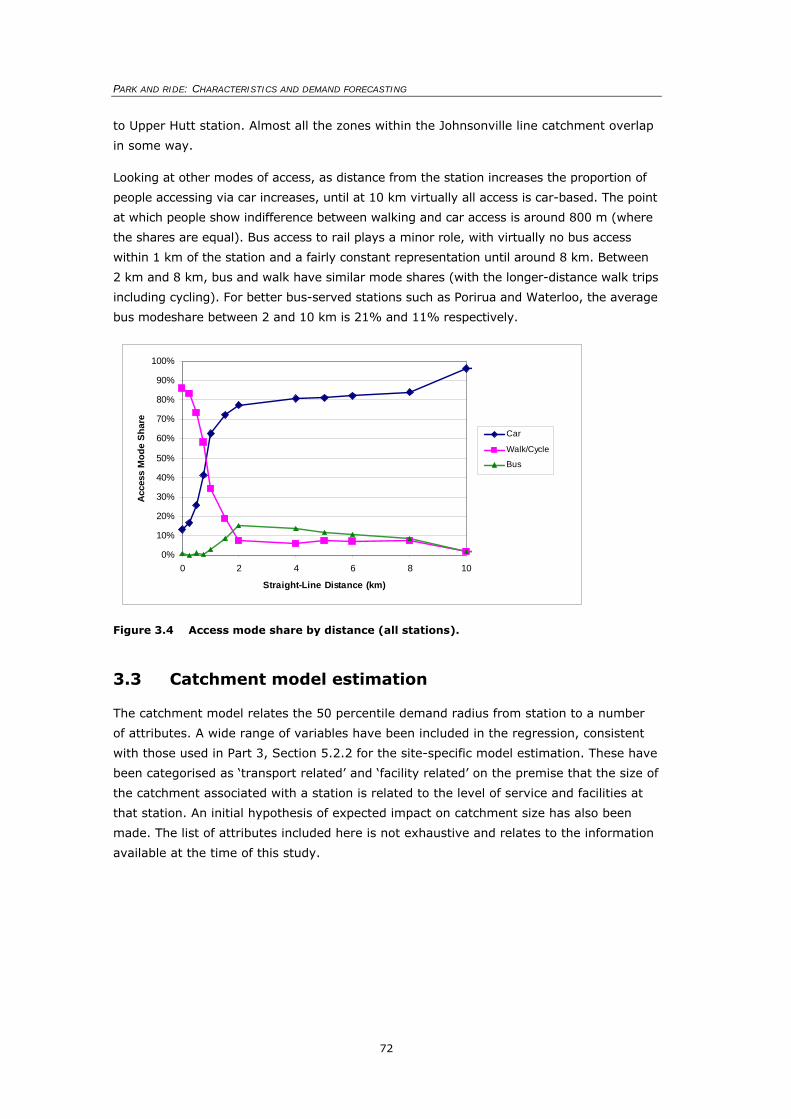
PARK AND RIDE: CHARACTERISTICS AND DEMAND FORECASTING
72
to Upper Hutt station. Almost all the zones within the Johnsonville line catchment overlap
in some way.
Looking at other modes of access, as distance from the station increases the proportion of
people accessing via car increases, until at 10 km virtually all access is car-based. The point
at which people show indifference between walking and car access is around 800 m (where
the shares are equal). Bus access to rail plays a minor role, with virtually no bus access
within 1 km of the station and a fairly constant representation until around 8 km. Between
2 km and 8 km, bus and walk have similar mode shares (with the longer-distance walk trips
including cycling). For better bus-served stations such as Porirua and Waterloo, the average
bus modeshare between 2 and 10 km is 21% and 11% respectively.
Figure 3.4 Access mode share by distance (all stations).
3.3 Catchment model estimation
The catchment model relates the 50 percentile demand radius from station to a number
of attributes. A wide range of variables have been included in the regression, consistent
with those used in Part 3, Section 5.2.2 for the site-specific model estimation. These have
been categorised as ‘transport related’ and ‘facility related’ on the premise that the size of
the catchment associated with a station is related to the level of service and facilities at
that station. An initial hypothesis of expected impact on catchment size has also been
made. The list of attributes included here is not exhaustive and relates to the information
available at the time of this study.
0%
10%
20%
30%
40%
50%
60%
70%
80%
90%
100%
0 2 4 6 8 10
Straight-Line Distance (km)
Acc
ess
Mod
e Sh
are
Car
Walk/Cycle
Bus
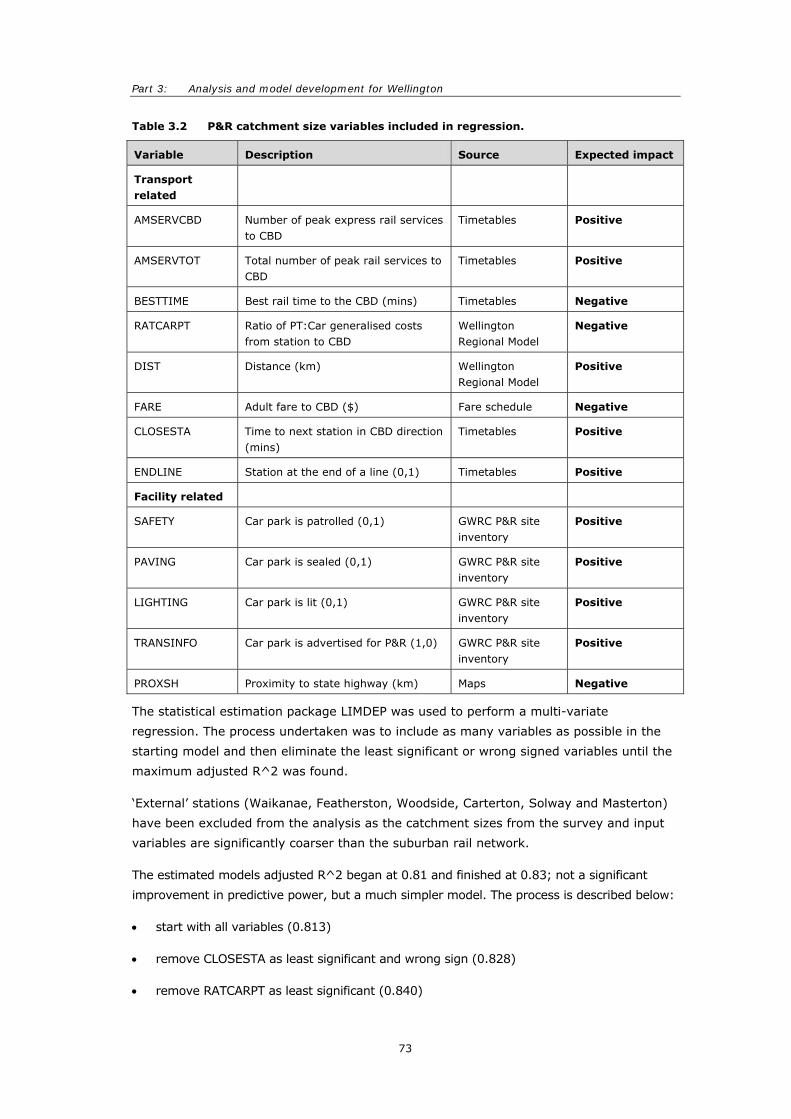
Part 3: Analysis and model development for Wellington
73
Table 3.2 P&R catchment size variables included in regression.
Variable Description Source Expected impact
Transport related
AMSERVCBD Number of peak express rail services to CBD
Timetables Positive
AMSERVTOT Total number of peak rail services to CBD
Timetables Positive
BESTTIME Best rail time to the CBD (mins) Timetables Negative
RATCARPT Ratio of PT:Car generalised costs from station to CBD
Wellington Regional Model
Negative
DIST Distance (km) Wellington Regional Model
Positive
FARE Adult fare to CBD ($) Fare schedule Negative
CLOSESTA Time to next station in CBD direction (mins)
Timetables Positive
ENDLINE Station at the end of a line (0,1) Timetables Positive
Facility related
SAFETY Car park is patrolled (0,1) GWRC P&R site inventory
Positive
PAVING Car park is sealed (0,1) GWRC P&R site inventory
Positive
LIGHTING Car park is lit (0,1) GWRC P&R site inventory
Positive
TRANSINFO Car park is advertised for P&R (1,0) GWRC P&R site inventory
Positive
PROXSH Proximity to state highway (km) Maps Negative
The statistical estimation package LIMDEP was used to perform a multi-variate
regression. The process undertaken was to include as many variables as possible in the
starting model and then eliminate the least significant or wrong signed variables until the
maximum adjusted R^2 was found.
‘External’ stations (Waikanae, Featherston, Woodside, Carterton, Solway and Masterton)
have been excluded from the analysis as the catchment sizes from the survey and input
variables are significantly coarser than the suburban rail network.
The estimated models adjusted R^2 began at 0.81 and finished at 0.83; not a significant
improvement in predictive power, but a much simpler model. The process is described below:
• start with all variables (0.813)
• remove CLOSESTA as least significant and wrong sign (0.828)
• remove RATCARPT as least significant (0.840)
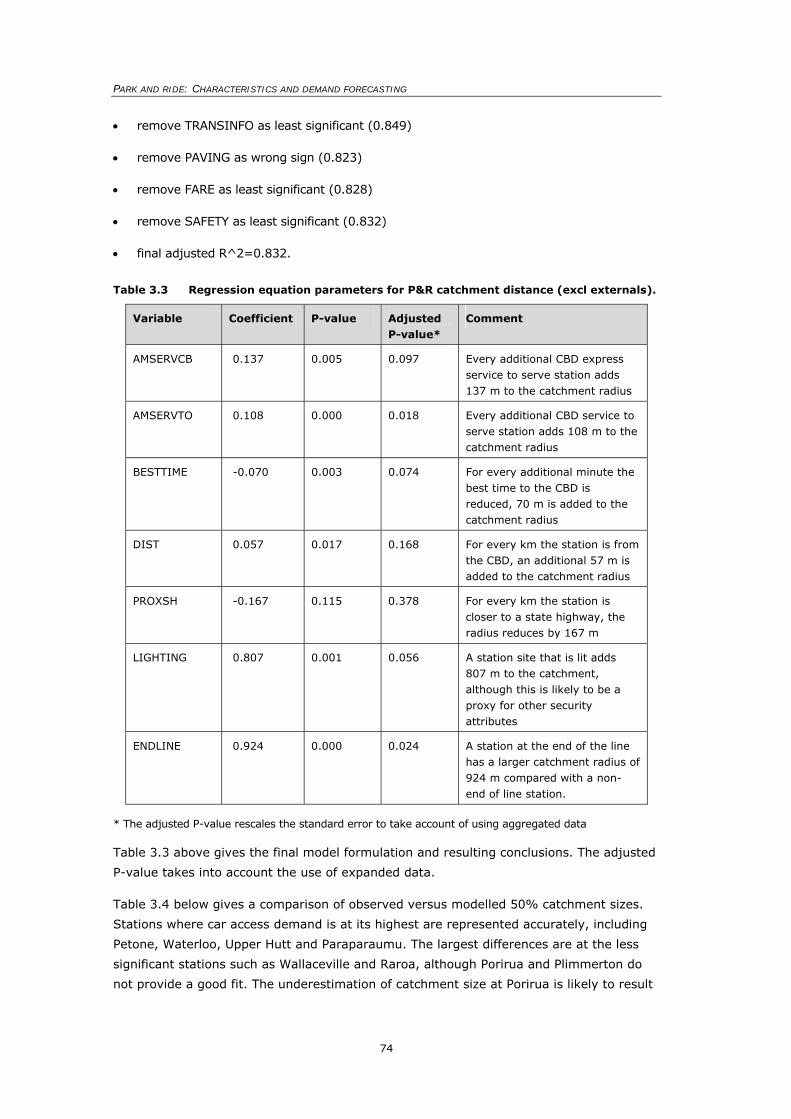
PARK AND RIDE: CHARACTERISTICS AND DEMAND FORECASTING
74
• remove TRANSINFO as least significant (0.849)
• remove PAVING as wrong sign (0.823)
• remove FARE as least significant (0.828)
• remove SAFETY as least significant (0.832)
• final adjusted R^2=0.832.
Table 3.3 Regression equation parameters for P&R catchment distance (excl externals).
Variable Coefficient P-value Adjusted P-value*
Comment
AMSERVCB 0.137 0.005 0.097 Every additional CBD express service to serve station adds 137 m to the catchment radius
AMSERVTO 0.108 0.000 0.018 Every additional CBD service to serve station adds 108 m to the catchment radius
BESTTIME -0.070 0.003 0.074 For every additional minute the best time to the CBD is reduced, 70 m is added to the catchment radius
DIST 0.057 0.017 0.168 For every km the station is from the CBD, an additional 57 m is added to the catchment radius
PROXSH -0.167 0.115 0.378 For every km the station is closer to a state highway, the radius reduces by 167 m
LIGHTING 0.807 0.001 0.056 A station site that is lit adds 807 m to the catchment, although this is likely to be a proxy for other security attributes
ENDLINE 0.924 0.000 0.024 A station at the end of the line has a larger catchment radius of 924 m compared with a non-end of line station.
* The adjusted P-value rescales the standard error to take account of using aggregated data
Table 3.3 above gives the final model formulation and resulting conclusions. The adjusted
P-value takes into account the use of expanded data.
Table 3.4 below gives a comparison of observed versus modelled 50% catchment sizes.
Stations where car access demand is at its highest are represented accurately, including
Petone, Waterloo, Upper Hutt and Paraparaumu. The largest differences are at the less
significant stations such as Wallaceville and Raroa, although Porirua and Plimmerton do
not provide a good fit. The underestimation of catchment size at Porirua is likely to result
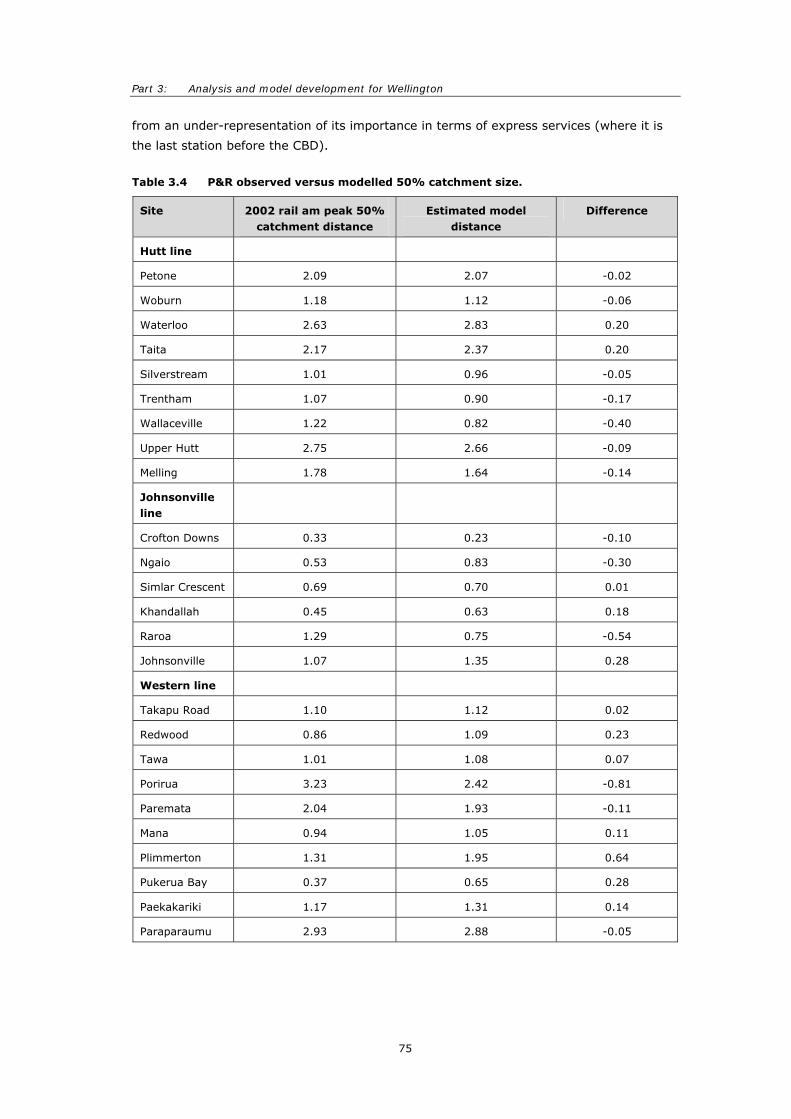
Part 3: Analysis and model development for Wellington
75
from an under-representation of its importance in terms of express services (where it is
the last station before the CBD).
Table 3.4 P&R observed versus modelled 50% catchment size.
Site 2002 rail am peak 50% catchment distance
Estimated model distance
Difference
Hutt line
Petone 2.09 2.07 -0.02
Woburn 1.18 1.12 -0.06
Waterloo 2.63 2.83 0.20
Taita 2.17 2.37 0.20
Silverstream 1.01 0.96 -0.05
Trentham 1.07 0.90 -0.17
Wallaceville 1.22 0.82 -0.40
Upper Hutt 2.75 2.66 -0.09
Melling 1.78 1.64 -0.14
Johnsonville line
Crofton Downs 0.33 0.23 -0.10
Ngaio 0.53 0.83 -0.30
Simlar Crescent 0.69 0.70 0.01
Khandallah 0.45 0.63 0.18
Raroa 1.29 0.75 -0.54
Johnsonville 1.07 1.35 0.28
Western line
Takapu Road 1.10 1.12 0.02
Redwood 0.86 1.09 0.23
Tawa 1.01 1.08 0.07
Porirua 3.23 2.42 -0.81
Paremata 2.04 1.93 -0.11
Mana 0.94 1.05 0.11
Plimmerton 1.31 1.95 0.64
Pukerua Bay 0.37 0.65 0.28
Paekakariki 1.17 1.31 0.14
Paraparaumu 2.93 2.88 -0.05
PARK AND RIDE: CHARACTERISTICS AND DEMAND FORECASTING
76
4. Regional modelling approach
4.1 Overview
The regional modelling approach includes P&R as a distinct mode within a multi-modal
model, through the use of a mode-split (logit) function. This allows changes in other
modal costs to be included and site-choice to be developed. However, the success of such
an approach is dictated by the quality of the survey/observed data and the accuracy of
the regional model.
4.2 Data
The regional modelling approach requires an extensive amount of data relating to
observed travel demand behaviour (revealed preference data) and corresponding travel
costs. Observed travel patterns are determined usually through the use of travel surveys:
for the Wellington region, the available surveys included a Household Interview Survey
(HIS) conducted in 2001, a rail survey conducted in 2002 and various P&R site surveys.
Travel cost components are usually obtained from a multi-modal model (in this case
WTSM), but can be determined through the use of public transport timetables and road-
based distances and parking costs; however, this is significantly more time-consuming.
GWRC supplied the raw survey output as well as car and PT generalised cost skims from
the regional model.
4.2.1 Travel demand data
The first task involved the creation of the observed travel demand data. Low sample rates
for rail users in the 2001 HIS meant that a subsequent 2002 rail survey was undertaken.
For this project, all rail main-mode data was deleted from the HIS dataset, with the rail
survey data replacing it (as was done in the WTSM redevelopment). The P&R survey data
was not used as it had not been expanded and the rail survey captured all the required
characteristics.
Segmentation of the datasets was required, based on:
• Main mode of travel, where three main modes of travel were included. ‘Car all the way’
includes both car driver or passenger and does not include a PT leg. ‘PT’ all the way
includes all PT (rail and bus grouped) main-mode trips that do not have a car access
component either as driver or passenger (so for rail will include bus feeder and walk
access trips). P&R includes all rail trips where the station has been accessed via a car
either by a driver or passenger. Slow mode (walk or cycle all the way) has been excluded
from the analysis.
• Car availability. There are significant issues when trying to split out (PT) captive,
competition and choice (which are distinguished in WTSM). Firstly, the two surveys did
not ask consistent questions on car availability. The rail survey asked whether there was a
car available (as driver, as passenger, or not at all) whereas the only definition that can
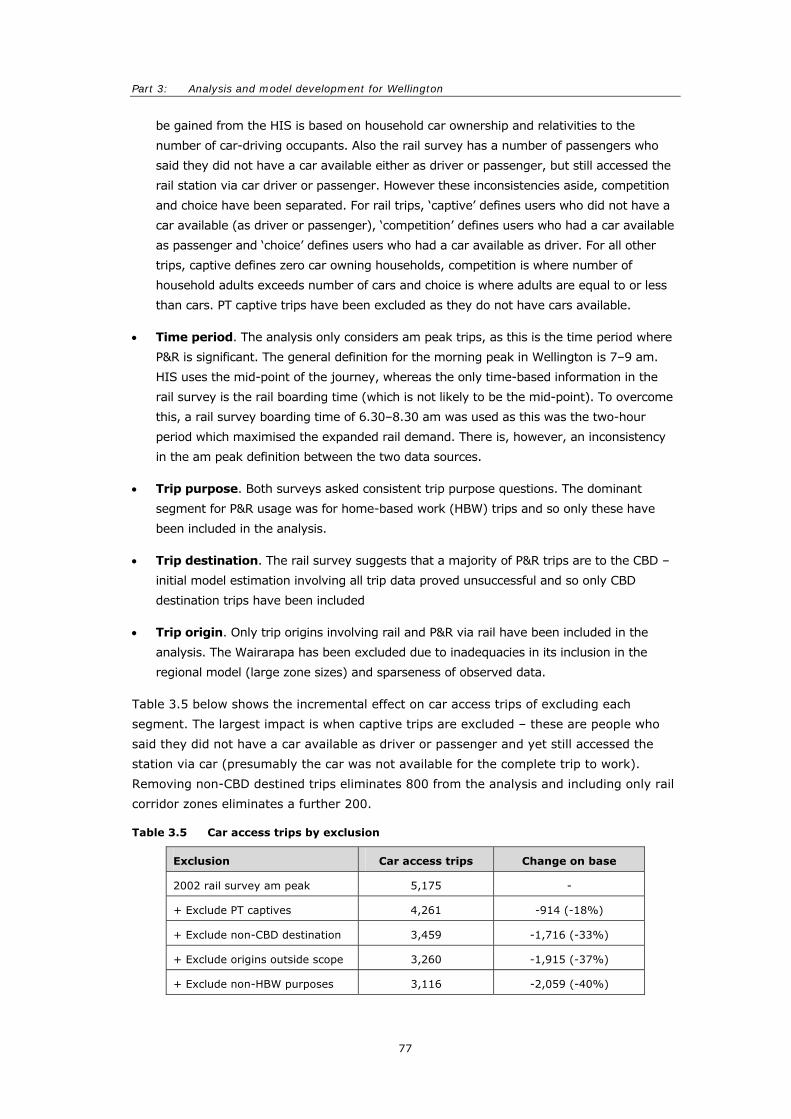
Part 3: Analysis and model development for Wellington
77
be gained from the HIS is based on household car ownership and relativities to the
number of car-driving occupants. Also the rail survey has a number of passengers who
said they did not have a car available either as driver or passenger, but still accessed the
rail station via car driver or passenger. However these inconsistencies aside, competition
and choice have been separated. For rail trips, ‘captive’ defines users who did not have a
car available (as driver or passenger), ‘competition’ defines users who had a car available
as passenger and ‘choice’ defines users who had a car available as driver. For all other
trips, captive defines zero car owning households, competition is where number of
household adults exceeds number of cars and choice is where adults are equal to or less
than cars. PT captive trips have been excluded as they do not have cars available.
• Time period. The analysis only considers am peak trips, as this is the time period where
P&R is significant. The general definition for the morning peak in Wellington is 7–9 am.
HIS uses the mid-point of the journey, whereas the only time-based information in the
rail survey is the rail boarding time (which is not likely to be the mid-point). To overcome
this, a rail survey boarding time of 6.30–8.30 am was used as this was the two-hour
period which maximised the expanded rail demand. There is, however, an inconsistency
in the am peak definition between the two data sources.
• Trip purpose. Both surveys asked consistent trip purpose questions. The dominant
segment for P&R usage was for home-based work (HBW) trips and so only these have
been included in the analysis.
• Trip destination. The rail survey suggests that a majority of P&R trips are to the CBD –
initial model estimation involving all trip data proved unsuccessful and so only CBD
destination trips have been included
• Trip origin. Only trip origins involving rail and P&R via rail have been included in the
analysis. The Wairarapa has been excluded due to inadequacies in its inclusion in the
regional model (large zone sizes) and sparseness of observed data.
Table 3.5 below shows the incremental effect on car access trips of excluding each
segment. The largest impact is when captive trips are excluded – these are people who
said they did not have a car available as driver or passenger and yet still accessed the
station via car (presumably the car was not available for the complete trip to work).
Removing non-CBD destined trips eliminates 800 from the analysis and including only rail
corridor zones eliminates a further 200.
Table 3.5 Car access trips by exclusion
Exclusion Car access trips Change on base
2002 rail survey am peak 5,175 -
+ Exclude PT captives 4,261 -914 (-18%)
+ Exclude non-CBD destination 3,459 -1,716 (-33%)
+ Exclude origins outside scope 3,260 -1,915 (-37%)
+ Exclude non-HBW purposes 3,116 -2,059 (-40%)
PARK AND RIDE: CHARACTERISTICS AND DEMAND FORECASTING
78
The market has, therefore, been defined as car all the way (as driver or passenger), PT all
the way, or P&R HBW trips in the morning peak to the Wellington CBD where a car was
available for the journey with base P&R trips of 3,116. Correction factors have been used
for site usage to account for excluded car access trips.
4.2.2 Cost skim data
Cost skims from the WTSM were used in the development of a regional-based model.
WTSM is a multi-modal strategic transport model, which has highway and PT-based
generalised cost matrices as an output. At the time of this study, only total costs were
available to the modelling team and so time and cost components could not be separated.
There are some issues with the cost skims that need to be recognised.
First, the PT cost skim includes an access cost to PT; however, the access cost is a
weighted average of walk and car access to PT. In other words, when connectors are
longer, the incremental time on the link is reduced. Having car access represented on
connector links is potentially a problem, although we would expect access within the same
zone as the station to be mostly walk, and so this will have little bearing on the combined
car and PT cost that would be required for the P&R mode.
Second, while there are cost skims for car and PT, there are no cost skims for P&R. P&R
costs can be thought of as the combination of car and PT costs. Splitting a P&R trip into
two legs, namely the car and then the PT (and assuming no car at the egress end), the
total cost is the car cost from the trip origin to the rail station of choice, plus the PT cost
from the station to the final destination. A rational traveller would choose the
intermediate rail site so that the combined cost would be minimised. In other words:
[ ]jkkikji PTCostCarCostMINPRCost ,,, +=
where:
PRCosti,j = P&R cost between origin i and destination j
CarCosti,k = Car cost between origin i and intermediate site k
PTCostk,j = PT cost between intermediate site k and destination j.
Emme/2 has a ‘matrix convolution’ function which can be used to undertake complex
matrix calculations such as this. For this project, a dummy Emme/2 network was built
containing the zone numbers from the WTSM model. The car and PT generalised cost
matrices were then input into the network and combined minimised P&R costs between
each zone pair was developed. If this process was being undertaken within the regional
model then a better approach would be to code P&R sites with their own individual zones,
so that more accurate costs to and from the intermediate (P&R) sites could be calculated
and represented. This approach is being done outside the model, but using the same
techniques and as such an approximation has been made whereby the site-related costs
are assumed to be the same as the zone it lies within.
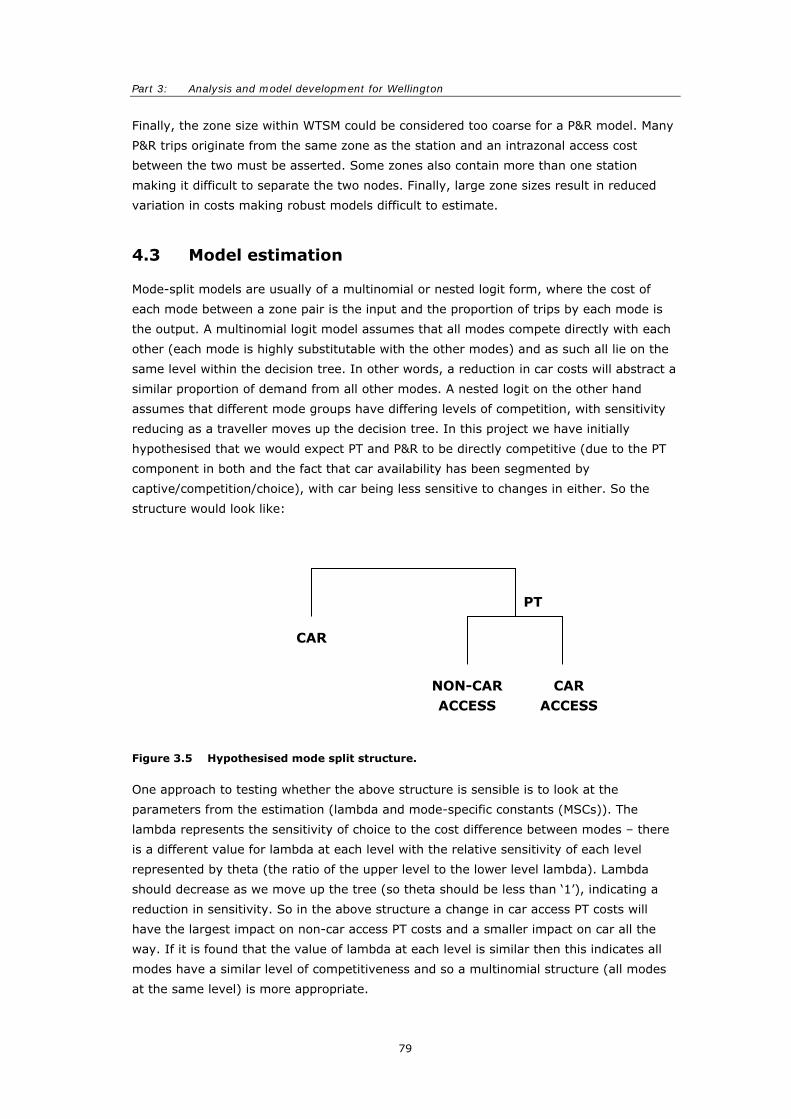
Part 3: Analysis and model development for Wellington
79
Finally, the zone size within WTSM could be considered too coarse for a P&R model. Many
P&R trips originate from the same zone as the station and an intrazonal access cost
between the two must be asserted. Some zones also contain more than one station
making it difficult to separate the two nodes. Finally, large zone sizes result in reduced
variation in costs making robust models difficult to estimate.
4.3 Model estimation
Mode-split models are usually of a multinomial or nested logit form, where the cost of
each mode between a zone pair is the input and the proportion of trips by each mode is
the output. A multinomial logit model assumes that all modes compete directly with each
other (each mode is highly substitutable with the other modes) and as such all lie on the
same level within the decision tree. In other words, a reduction in car costs will abstract a
similar proportion of demand from all other modes. A nested logit on the other hand
assumes that different mode groups have differing levels of competition, with sensitivity
reducing as a traveller moves up the decision tree. In this project we have initially
hypothesised that we would expect PT and P&R to be directly competitive (due to the PT
component in both and the fact that car availability has been segmented by
captive/competition/choice), with car being less sensitive to changes in either. So the
structure would look like:
Figure 3.5 Hypothesised mode split structure.
One approach to testing whether the above structure is sensible is to look at the
parameters from the estimation (lambda and mode-specific constants (MSCs)). The
lambda represents the sensitivity of choice to the cost difference between modes – there
is a different value for lambda at each level with the relative sensitivity of each level
represented by theta (the ratio of the upper level to the lower level lambda). Lambda
should decrease as we move up the tree (so theta should be less than ‘1’), indicating a
reduction in sensitivity. So in the above structure a change in car access PT costs will
have the largest impact on non-car access PT costs and a smaller impact on car all the
way. If it is found that the value of lambda at each level is similar then this indicates all
modes have a similar level of competitiveness and so a multinomial structure (all modes
at the same level) is more appropriate.
PT
CAR
NON-CAR ACCESS
CAR ACCESS
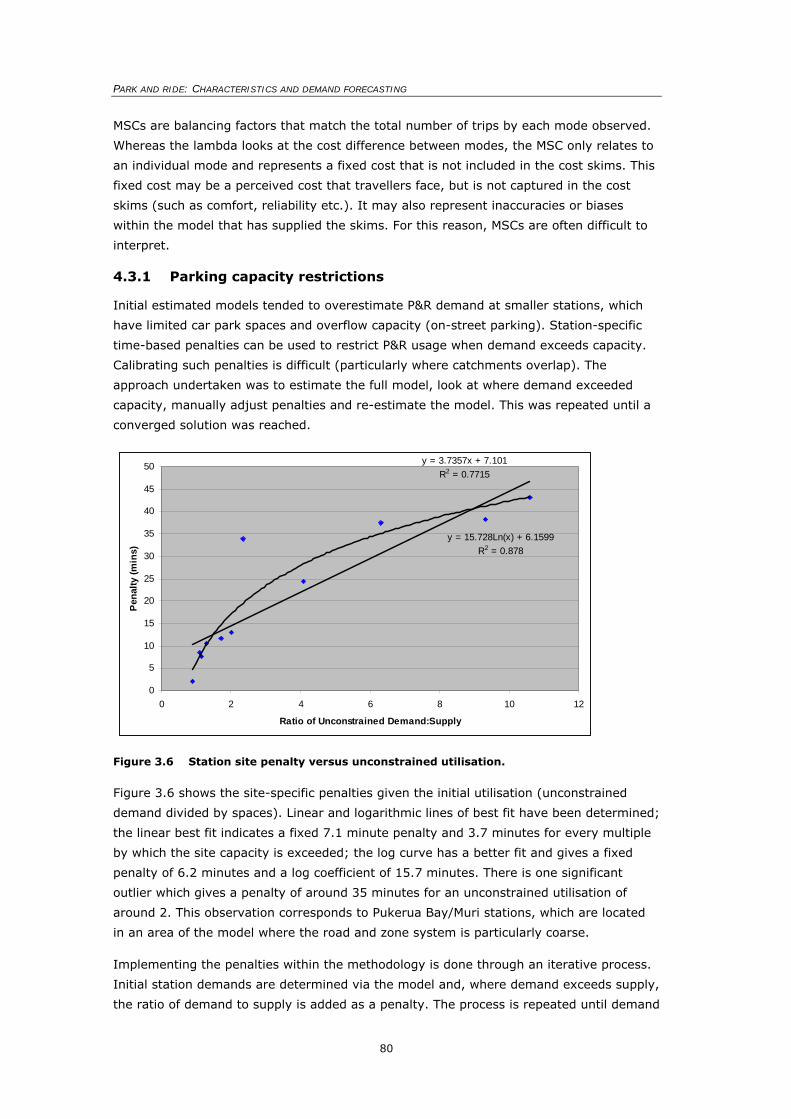
PARK AND RIDE: CHARACTERISTICS AND DEMAND FORECASTING
80
MSCs are balancing factors that match the total number of trips by each mode observed.
Whereas the lambda looks at the cost difference between modes, the MSC only relates to
an individual mode and represents a fixed cost that is not included in the cost skims. This
fixed cost may be a perceived cost that travellers face, but is not captured in the cost
skims (such as comfort, reliability etc.). It may also represent inaccuracies or biases
within the model that has supplied the skims. For this reason, MSCs are often difficult to
interpret.
4.3.1 Parking capacity restrictions
Initial estimated models tended to overestimate P&R demand at smaller stations, which
have limited car park spaces and overflow capacity (on-street parking). Station-specific
time-based penalties can be used to restrict P&R usage when demand exceeds capacity.
Calibrating such penalties is difficult (particularly where catchments overlap). The
approach undertaken was to estimate the full model, look at where demand exceeded
capacity, manually adjust penalties and re-estimate the model. This was repeated until a
converged solution was reached.
Figure 3.6 Station site penalty versus unconstrained utilisation.
Figure 3.6 shows the site-specific penalties given the initial utilisation (unconstrained
demand divided by spaces). Linear and logarithmic lines of best fit have been determined;
the linear best fit indicates a fixed 7.1 minute penalty and 3.7 minutes for every multiple
by which the site capacity is exceeded; the log curve has a better fit and gives a fixed
penalty of 6.2 minutes and a log coefficient of 15.7 minutes. There is one significant
outlier which gives a penalty of around 35 minutes for an unconstrained utilisation of
around 2. This observation corresponds to Pukerua Bay/Muri stations, which are located
in an area of the model where the road and zone system is particularly coarse.
Implementing the penalties within the methodology is done through an iterative process.
Initial station demands are determined via the model and, where demand exceeds supply,
the ratio of demand to supply is added as a penalty. The process is repeated until demand
y = 3.7357x + 7.101R2 = 0.7715
y = 15.728Ln(x) + 6.1599R2 = 0.878
0
5
10
15
20
25
30
35
40
45
50
0 2 4 6 8 10 12
Ratio of Unconstrained Demand:Supply
Pen
alty
(min
s)
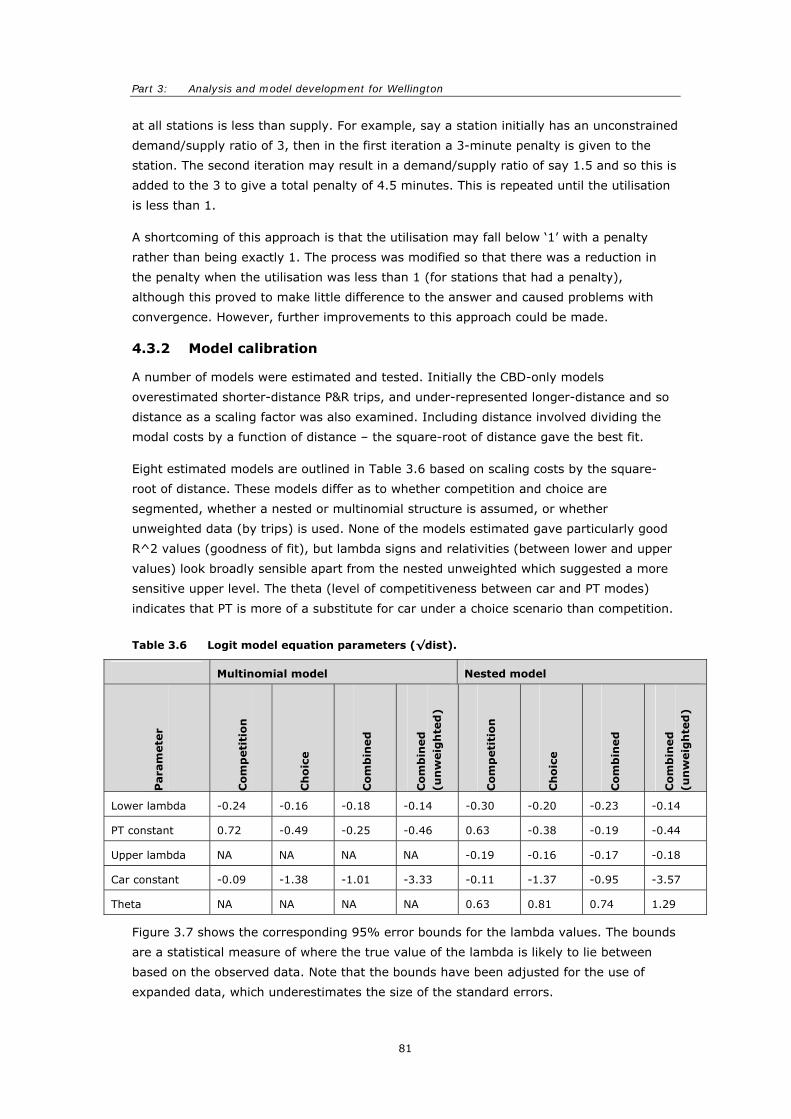
Part 3: Analysis and model development for Wellington
81
at all stations is less than supply. For example, say a station initially has an unconstrained
demand/supply ratio of 3, then in the first iteration a 3-minute penalty is given to the
station. The second iteration may result in a demand/supply ratio of say 1.5 and so this is
added to the 3 to give a total penalty of 4.5 minutes. This is repeated until the utilisation
is less than 1.
A shortcoming of this approach is that the utilisation may fall below ‘1’ with a penalty
rather than being exactly 1. The process was modified so that there was a reduction in
the penalty when the utilisation was less than 1 (for stations that had a penalty),
although this proved to make little difference to the answer and caused problems with
convergence. However, further improvements to this approach could be made.
4.3.2 Model calibration
A number of models were estimated and tested. Initially the CBD-only models
overestimated shorter-distance P&R trips, and under-represented longer-distance and so
distance as a scaling factor was also examined. Including distance involved dividing the
modal costs by a function of distance – the square-root of distance gave the best fit.
Eight estimated models are outlined in Table 3.6 based on scaling costs by the square-
root of distance. These models differ as to whether competition and choice are
segmented, whether a nested or multinomial structure is assumed, or whether
unweighted data (by trips) is used. None of the models estimated gave particularly good
R^2 values (goodness of fit), but lambda signs and relativities (between lower and upper
values) look broadly sensible apart from the nested unweighted which suggested a more
sensitive upper level. The theta (level of competitiveness between car and PT modes)
indicates that PT is more of a substitute for car under a choice scenario than competition.
Table 3.6 Logit model equation parameters (√dist).
Multinomial model Nested model
Para
mete
r
Co
mp
eti
tio
n
Ch
oic
e
Co
mb
ined
Co
mb
ined
(u
nw
eig
hte
d)
Co
mp
eti
tio
n
Ch
oic
e
Co
mb
ined
Co
mb
ined
(u
nw
eig
hte
d)
Lower lambda -0.24 -0.16 -0.18 -0.14 -0.30 -0.20 -0.23 -0.14
PT constant 0.72 -0.49 -0.25 -0.46 0.63 -0.38 -0.19 -0.44
Upper lambda NA NA NA NA -0.19 -0.16 -0.17 -0.18
Car constant -0.09 -1.38 -1.01 -3.33 -0.11 -1.37 -0.95 -3.57
Theta NA NA NA NA 0.63 0.81 0.74 1.29
Figure 3.7 shows the corresponding 95% error bounds for the lambda values. The bounds
are a statistical measure of where the true value of the lambda is likely to lie between
based on the observed data. Note that the bounds have been adjusted for the use of
expanded data, which underestimates the size of the standard errors.
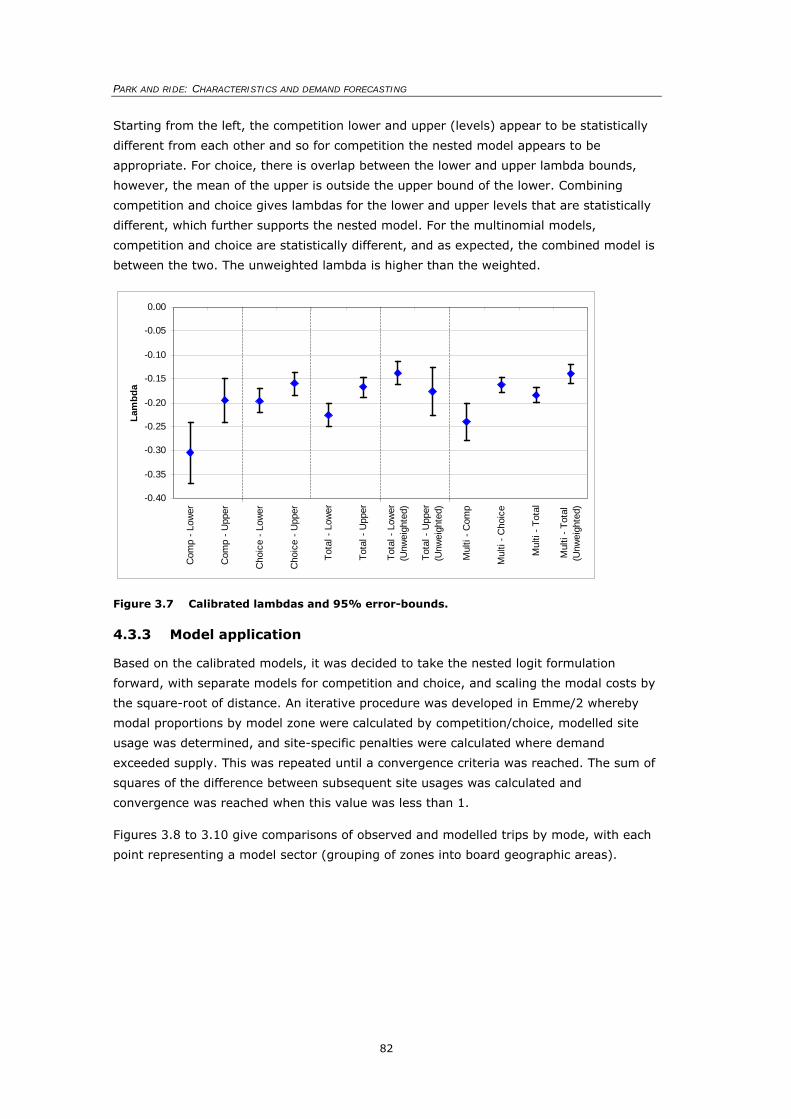
PARK AND RIDE: CHARACTERISTICS AND DEMAND FORECASTING
82
Starting from the left, the competition lower and upper (levels) appear to be statistically
different from each other and so for competition the nested model appears to be
appropriate. For choice, there is overlap between the lower and upper lambda bounds,
however, the mean of the upper is outside the upper bound of the lower. Combining
competition and choice gives lambdas for the lower and upper levels that are statistically
different, which further supports the nested model. For the multinomial models,
competition and choice are statistically different, and as expected, the combined model is
between the two. The unweighted lambda is higher than the weighted.
Figure 3.7 Calibrated lambdas and 95% error-bounds.
4.3.3 Model application
Based on the calibrated models, it was decided to take the nested logit formulation
forward, with separate models for competition and choice, and scaling the modal costs by
the square-root of distance. An iterative procedure was developed in Emme/2 whereby
modal proportions by model zone were calculated by competition/choice, modelled site
usage was determined, and site-specific penalties were calculated where demand
exceeded supply. This was repeated until a convergence criteria was reached. The sum of
squares of the difference between subsequent site usages was calculated and
convergence was reached when this value was less than 1.
Figures 3.8 to 3.10 give comparisons of observed and modelled trips by mode, with each
point representing a model sector (grouping of zones into board geographic areas).
-0.40
-0.35
-0.30
-0.25
-0.20
-0.15
-0.10
-0.05
0.00
Com
p - L
ower
Com
p - U
pper
Cho
ice
- Low
er
Cho
ice
- Upp
er
Tota
l - L
ower
Tota
l - U
pper
Tota
l - L
ower
(Unw
eigh
ted)
Tota
l - U
pper
(Unw
eigh
ted)
Mul
ti - C
omp
Mul
ti - C
hoic
e
Mul
ti - T
otal
Mul
ti - T
otal
(Unw
eigh
ted)
Lam
bda
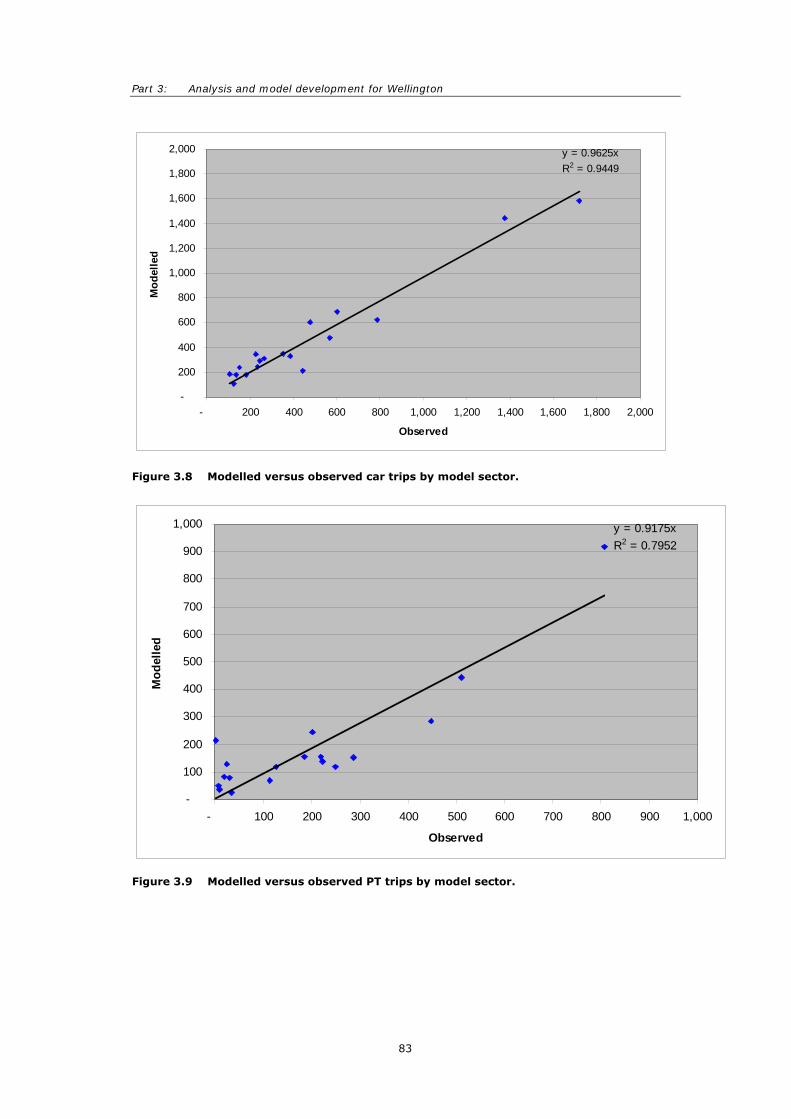
Part 3: Analysis and model development for Wellington
83
Figure 3.8 Modelled versus observed car trips by model sector.
Figure 3.9 Modelled versus observed PT trips by model sector.
y = 0.9625xR2 = 0.9449
-
200
400
600
800
1,000
1,200
1,400
1,600
1,800
2,000
- 200 400 600 800 1,000 1,200 1,400 1,600 1,800 2,000
Observed
Mod
elle
d
y = 0.9175xR2 = 0.7952
-
100
200
300
400
500
600
700
800
900
1,000
- 100 200 300 400 500 600 700 800 900 1,000
Observed
Mod
elle
d
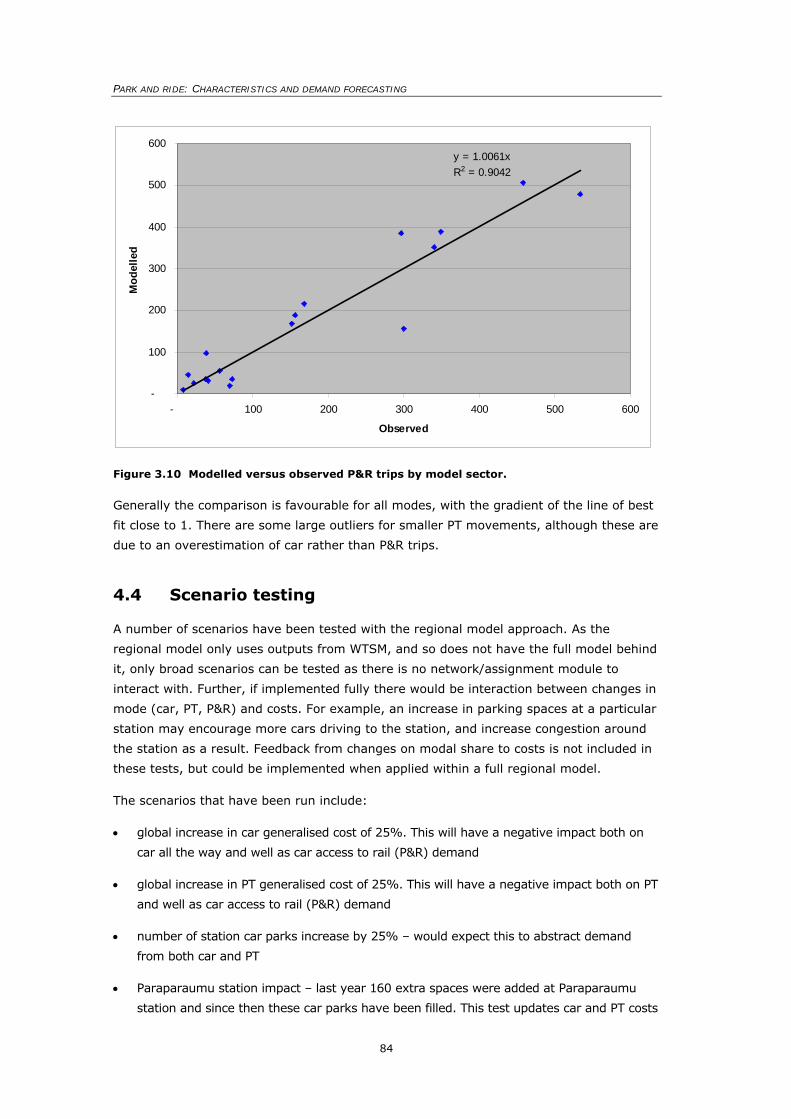
PARK AND RIDE: CHARACTERISTICS AND DEMAND FORECASTING
84
Figure 3.10 Modelled versus observed P&R trips by model sector.
Generally the comparison is favourable for all modes, with the gradient of the line of best
fit close to 1. There are some large outliers for smaller PT movements, although these are
due to an overestimation of car rather than P&R trips.
4.4 Scenario testing
A number of scenarios have been tested with the regional model approach. As the
regional model only uses outputs from WTSM, and so does not have the full model behind
it, only broad scenarios can be tested as there is no network/assignment module to
interact with. Further, if implemented fully there would be interaction between changes in
mode (car, PT, P&R) and costs. For example, an increase in parking spaces at a particular
station may encourage more cars driving to the station, and increase congestion around
the station as a result. Feedback from changes on modal share to costs is not included in
these tests, but could be implemented when applied within a full regional model.
The scenarios that have been run include:
• global increase in car generalised cost of 25%. This will have a negative impact both on
car all the way and well as car access to rail (P&R) demand
• global increase in PT generalised cost of 25%. This will have a negative impact both on PT
and well as car access to rail (P&R) demand
• number of station car parks increase by 25% – would expect this to abstract demand
from both car and PT
• Paraparaumu station impact – last year 160 extra spaces were added at Paraparaumu
station and since then these car parks have been filled. This test updates car and PT costs
y = 1.0061xR2 = 0.9042
-
100
200
300
400
500
600
- 100 200 300 400 500 600
Observed
Mod
elle
d
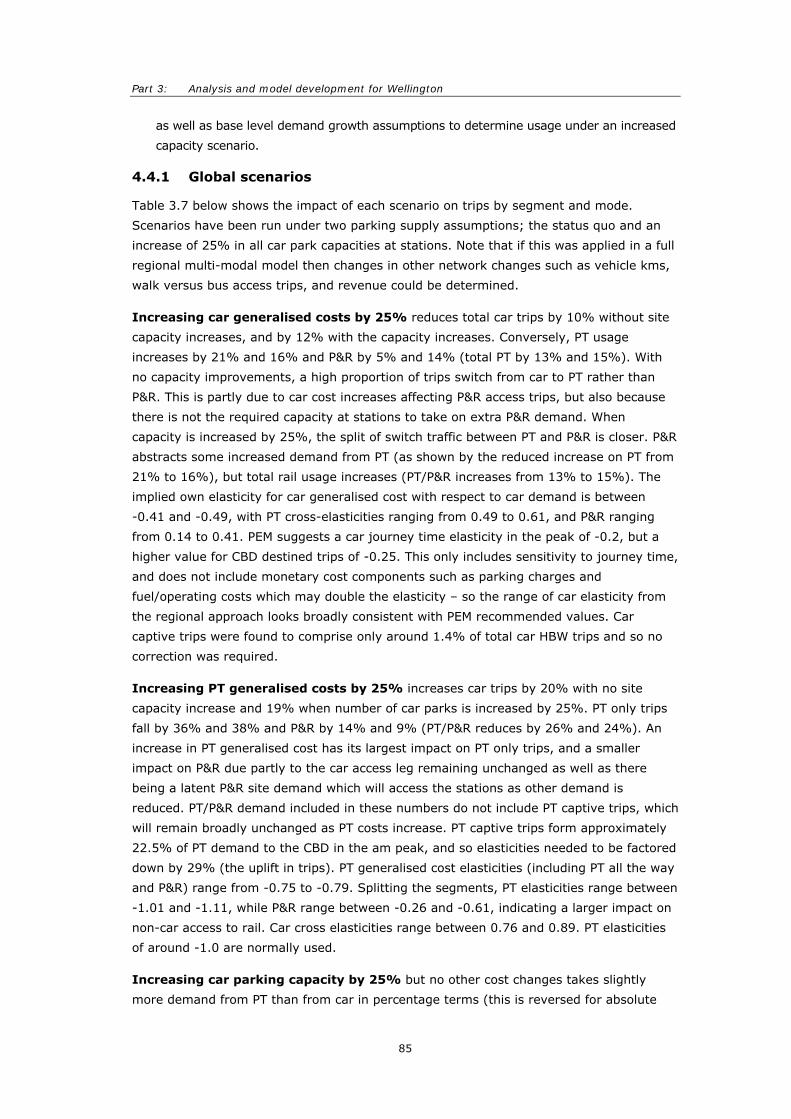
Part 3: Analysis and model development for Wellington
85
as well as base level demand growth assumptions to determine usage under an increased
capacity scenario.
4.4.1 Global scenarios
Table 3.7 below shows the impact of each scenario on trips by segment and mode.
Scenarios have been run under two parking supply assumptions; the status quo and an
increase of 25% in all car park capacities at stations. Note that if this was applied in a full
regional multi-modal model then changes in other network changes such as vehicle kms,
walk versus bus access trips, and revenue could be determined.
Increasing car generalised costs by 25% reduces total car trips by 10% without site
capacity increases, and by 12% with the capacity increases. Conversely, PT usage
increases by 21% and 16% and P&R by 5% and 14% (total PT by 13% and 15%). With
no capacity improvements, a high proportion of trips switch from car to PT rather than
P&R. This is partly due to car cost increases affecting P&R access trips, but also because
there is not the required capacity at stations to take on extra P&R demand. When
capacity is increased by 25%, the split of switch traffic between PT and P&R is closer. P&R
abstracts some increased demand from PT (as shown by the reduced increase on PT from
21% to 16%), but total rail usage increases (PT/P&R increases from 13% to 15%). The
implied own elasticity for car generalised cost with respect to car demand is between
-0.41 and -0.49, with PT cross-elasticities ranging from 0.49 to 0.61, and P&R ranging
from 0.14 to 0.41. PEM suggests a car journey time elasticity in the peak of -0.2, but a
higher value for CBD destined trips of -0.25. This only includes sensitivity to journey time,
and does not include monetary cost components such as parking charges and
fuel/operating costs which may double the elasticity – so the range of car elasticity from
the regional approach looks broadly consistent with PEM recommended values. Car
captive trips were found to comprise only around 1.4% of total car HBW trips and so no
correction was required.
Increasing PT generalised costs by 25% increases car trips by 20% with no site
capacity increase and 19% when number of car parks is increased by 25%. PT only trips
fall by 36% and 38% and P&R by 14% and 9% (PT/P&R reduces by 26% and 24%). An
increase in PT generalised cost has its largest impact on PT only trips, and a smaller
impact on P&R due partly to the car access leg remaining unchanged as well as there
being a latent P&R site demand which will access the stations as other demand is
reduced. PT/P&R demand included in these numbers do not include PT captive trips, which
will remain broadly unchanged as PT costs increase. PT captive trips form approximately
22.5% of PT demand to the CBD in the am peak, and so elasticities needed to be factored
down by 29% (the uplift in trips). PT generalised cost elasticities (including PT all the way
and P&R) range from -0.75 to -0.79. Splitting the segments, PT elasticities range between
-1.01 and -1.11, while P&R range between -0.26 and -0.61, indicating a larger impact on
non-car access to rail. Car cross elasticities range between 0.76 and 0.89. PT elasticities
of around -1.0 are normally used.
Increasing car parking capacity by 25% but no other cost changes takes slightly
more demand from PT than from car in percentage terms (this is reversed for absolute
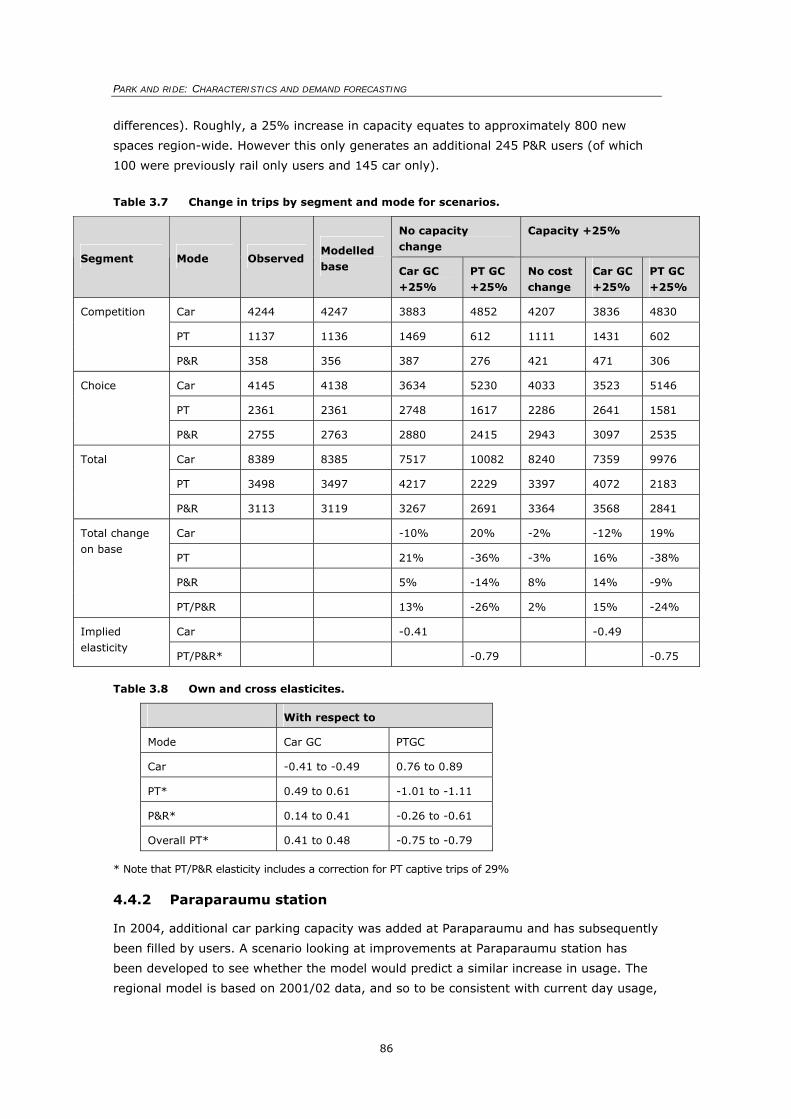
PARK AND RIDE: CHARACTERISTICS AND DEMAND FORECASTING
86
differences). Roughly, a 25% increase in capacity equates to approximately 800 new
spaces region-wide. However this only generates an additional 245 P&R users (of which
100 were previously rail only users and 145 car only).
Table 3.7 Change in trips by segment and mode for scenarios.
No capacity change
Capacity +25%
Segment Mode Observed Modelled base Car GC
+25% PT GC +25%
No cost change
Car GC +25%
PT GC +25%
Car 4244 4247 3883 4852 4207 3836 4830
PT 1137 1136 1469 612 1111 1431 602
Competition
P&R 358 356 387 276 421 471 306
Car 4145 4138 3634 5230 4033 3523 5146
PT 2361 2361 2748 1617 2286 2641 1581
Choice
P&R 2755 2763 2880 2415 2943 3097 2535
Car 8389 8385 7517 10082 8240 7359 9976
PT 3498 3497 4217 2229 3397 4072 2183
Total
P&R 3113 3119 3267 2691 3364 3568 2841
Car -10% 20% -2% -12% 19%
PT 21% -36% -3% 16% -38%
P&R 5% -14% 8% 14% -9%
Total change on base
PT/P&R 13% -26% 2% 15% -24%
Car -0.41 -0.49 Implied elasticity
PT/P&R* -0.79 -0.75
Table 3.8 Own and cross elasticites.
With respect to
Mode Car GC PTGC
Car -0.41 to -0.49 0.76 to 0.89
PT* 0.49 to 0.61 -1.01 to -1.11
P&R* 0.14 to 0.41 -0.26 to -0.61
Overall PT* 0.41 to 0.48 -0.75 to -0.79
* Note that PT/P&R elasticity includes a correction for PT captive trips of 29%
4.4.2 Paraparaumu station
In 2004, additional car parking capacity was added at Paraparaumu and has subsequently
been filled by users. A scenario looking at improvements at Paraparaumu station has
been developed to see whether the model would predict a similar increase in usage. The
regional model is based on 2001/02 data, and so to be consistent with current day usage,
Part 3: Analysis and model development for Wellington
87
changes in population, car and PT costs, as well as the increase in capacity was
developed.
Assumptions:
• Paraparaumu station number of car parks increase from 300 to 460.
• Total trips from Kapiti zones increase by 10% (based on population projection numbers
for Kapiti TLA).
• PT generalised costs decrease by 10% due to an increase from three to five trains in the
morning peak.
• Car generalised costs increase by 25% due to fuel increase of approximately 25%, car
time increase of 10%, and CBD parking charge increase of 50%.
In the base (no changes assumed) the total number of P&R users at Paraparaumu station
is the same as the capacity at 300, with a corresponding site penalty (due to more
demand than supply) of 8.5 minutes. Under the option (changes as above) the number of
P&R users increases to 420 (+120 on the base) and no site penalty (as demand is less
than the increased capacity of 460 spaces). This scenario suggests a lower increase in
demand than what has been seen in practice. This may be partly due to changes in other
factors outside the generalised cost such as improvements in frequency outside the peak
period (particularly in the evenings), which would affect P&R users more than bus access
(where buses do not meet these later trains).
5. Site-specific modelling approach
5.1 Overview
The site-specific methodology relies on collected information about an existing or
proposed site, as well as the surrounding area. These models are often based on the
theory that a site’s attributes relating to location and service characteristics largely define
the attractiveness of the site for potential users. Site-specific demand is heavily
influenced by a number of characteristics that cannot be represented accurately within a
regional model, such the site location, the facility’s characteristics, the availability of
competing sites, and perceived convenience. To develop design-level forecasts for P&R
sites, these specific characteristics need to be considered, and as such go beyond a
regional approach.
Site-specific forecasting tools generally include the definition of a given catchment (see
Section 3) for a number of individual P&R sites. Explanatory equations are developed
through the use of multiple-regression techniques based on observed usage. These
equations can then be used to test the impact of new sites, or changes in usage based on
service or facility characteristics. The equations developed are only applicable to the area in
which they are being applied (in this case the Wellington region); however, the structure of
the equations (variables included) may be appropriately transferred to other contexts.
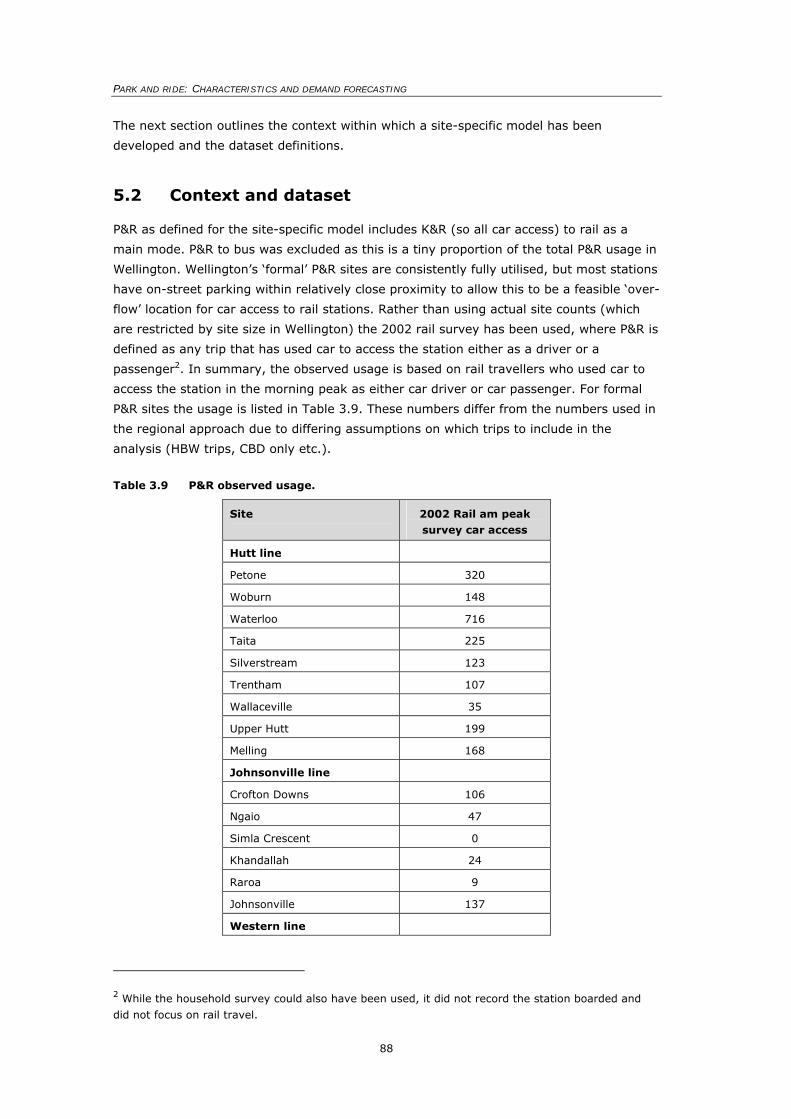
PARK AND RIDE: CHARACTERISTICS AND DEMAND FORECASTING
88
The next section outlines the context within which a site-specific model has been
developed and the dataset definitions.
5.2 Context and dataset
P&R as defined for the site-specific model includes K&R (so all car access) to rail as a
main mode. P&R to bus was excluded as this is a tiny proportion of the total P&R usage in
Wellington. Wellington’s ‘formal’ P&R sites are consistently fully utilised, but most stations
have on-street parking within relatively close proximity to allow this to be a feasible ‘over-
flow’ location for car access to rail stations. Rather than using actual site counts (which
are restricted by site size in Wellington) the 2002 rail survey has been used, where P&R is
defined as any trip that has used car to access the station either as a driver or a
passenger2. In summary, the observed usage is based on rail travellers who used car to
access the station in the morning peak as either car driver or car passenger. For formal
P&R sites the usage is listed in Table 3.9. These numbers differ from the numbers used in
the regional approach due to differing assumptions on which trips to include in the
analysis (HBW trips, CBD only etc.).
Table 3.9 P&R observed usage.
Site 2002 Rail am peak survey car access
Hutt line
Petone 320
Woburn 148
Waterloo 716
Taita 225
Silverstream 123
Trentham 107
Wallaceville 35
Upper Hutt 199
Melling 168
Johnsonville line
Crofton Downs 106
Ngaio 47
Simla Crescent 0
Khandallah 24
Raroa 9
Johnsonville 137
Western line
2 While the household survey could also have been used, it did not record the station boarded and
did not focus on rail travel.
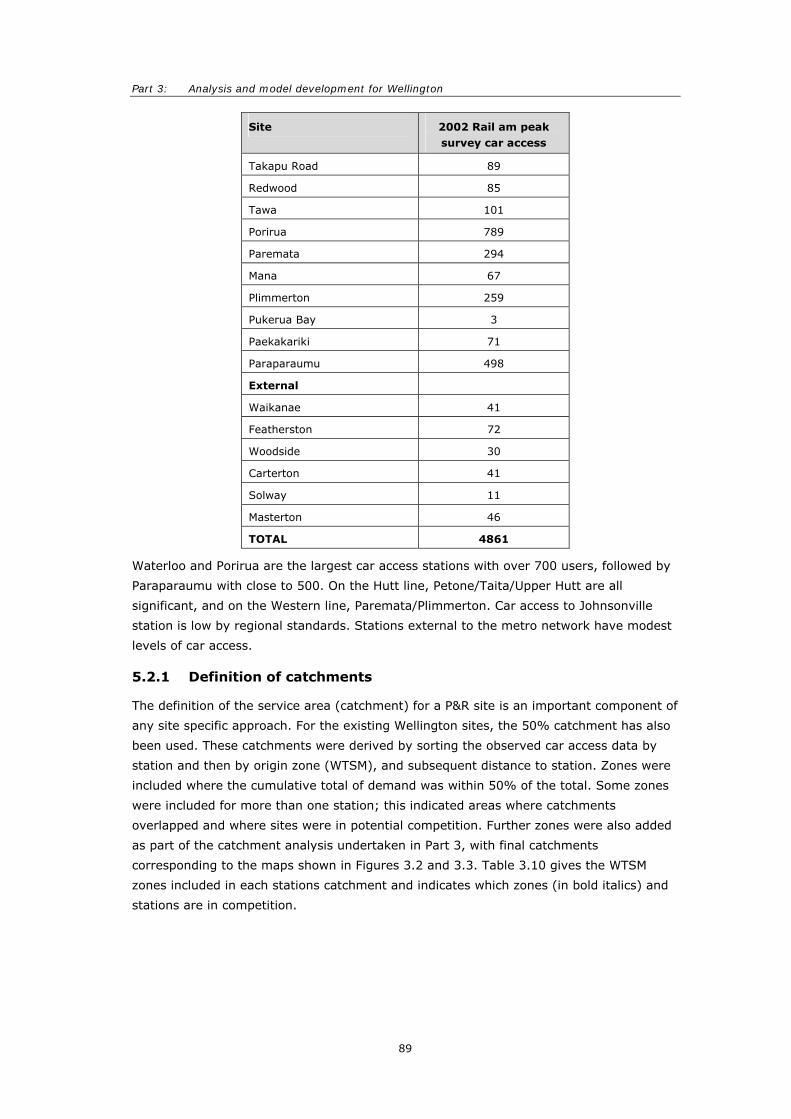
Part 3: Analysis and model development for Wellington
89
Site 2002 Rail am peak survey car access
Takapu Road 89
Redwood 85
Tawa 101
Porirua 789
Paremata 294
Mana 67
Plimmerton 259
Pukerua Bay 3
Paekakariki 71
Paraparaumu 498
External
Waikanae 41
Featherston 72
Woodside 30
Carterton 41
Solway 11
Masterton 46
TOTAL 4861
Waterloo and Porirua are the largest car access stations with over 700 users, followed by
Paraparaumu with close to 500. On the Hutt line, Petone/Taita/Upper Hutt are all
significant, and on the Western line, Paremata/Plimmerton. Car access to Johnsonville
station is low by regional standards. Stations external to the metro network have modest
levels of car access.
5.2.1 Definition of catchments
The definition of the service area (catchment) for a P&R site is an important component of
any site specific approach. For the existing Wellington sites, the 50% catchment has also
been used. These catchments were derived by sorting the observed car access data by
station and then by origin zone (WTSM), and subsequent distance to station. Zones were
included where the cumulative total of demand was within 50% of the total. Some zones
were included for more than one station; this indicated areas where catchments
overlapped and where sites were in potential competition. Further zones were also added
as part of the catchment analysis undertaken in Part 3, with final catchments
corresponding to the maps shown in Figures 3.2 and 3.3. Table 3.10 gives the WTSM
zones included in each stations catchment and indicates which zones (in bold italics) and
stations are in competition.
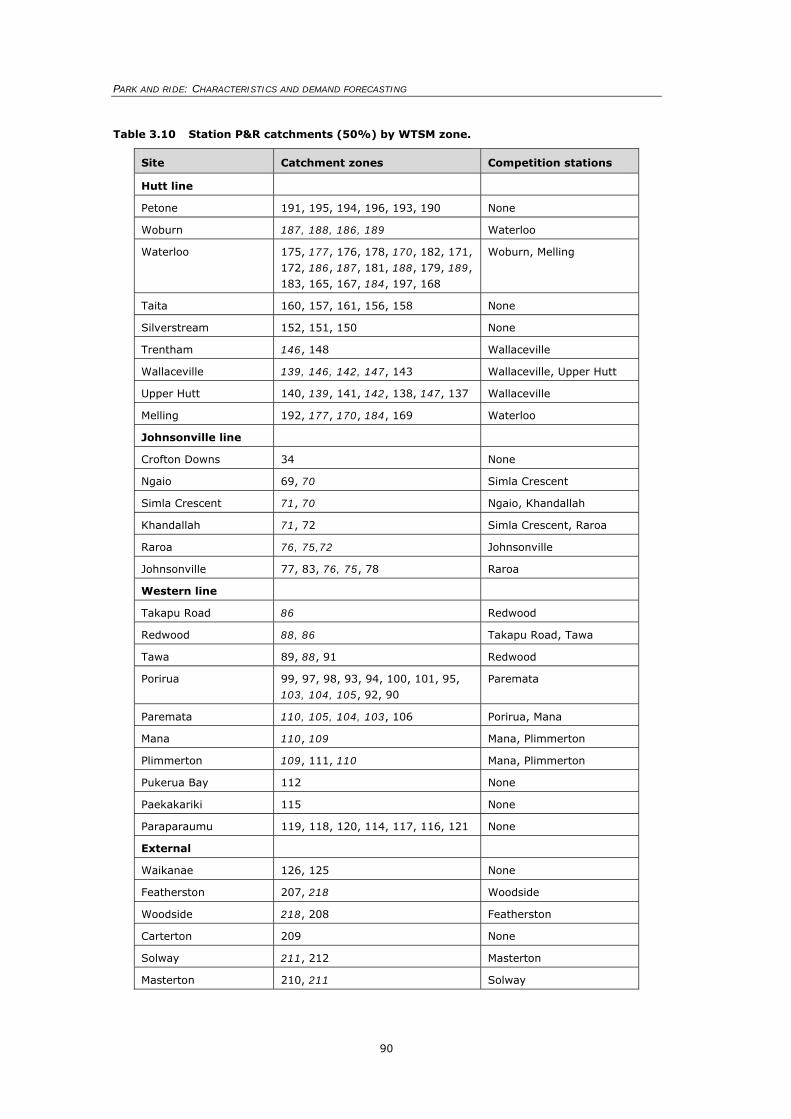
PARK AND RIDE: CHARACTERISTICS AND DEMAND FORECASTING
90
Table 3.10 Station P&R catchments (50%) by WTSM zone.
Site Catchment zones Competition stations
Hutt line
Petone 191, 195, 194, 196, 193, 190 None
Woburn 187, 188, 186, 189 Waterloo
Waterloo 175, 177, 176, 178, 170, 182, 171, 172, 186, 187, 181, 188, 179, 189, 183, 165, 167, 184, 197, 168
Woburn, Melling
Taita 160, 157, 161, 156, 158 None
Silverstream 152, 151, 150 None
Trentham 146, 148 Wallaceville
Wallaceville 139, 146, 142, 147, 143 Wallaceville, Upper Hutt
Upper Hutt 140, 139, 141, 142, 138, 147, 137 Wallaceville
Melling 192, 177, 170, 184, 169 Waterloo
Johnsonville line
Crofton Downs 34 None
Ngaio 69, 70 Simla Crescent
Simla Crescent 71, 70 Ngaio, Khandallah
Khandallah 71, 72 Simla Crescent, Raroa
Raroa 76, 75,72 Johnsonville
Johnsonville 77, 83, 76, 75, 78 Raroa
Western line
Takapu Road 86 Redwood
Redwood 88, 86 Takapu Road, Tawa
Tawa 89, 88, 91 Redwood
Porirua 99, 97, 98, 93, 94, 100, 101, 95, 103, 104, 105, 92, 90
Paremata
Paremata 110, 105, 104, 103, 106 Porirua, Mana
Mana 110, 109 Mana, Plimmerton
Plimmerton 109, 111, 110 Mana, Plimmerton
Pukerua Bay 112 None
Paekakariki 115 None
Paraparaumu 119, 118, 120, 114, 117, 116, 121 None
External
Waikanae 126, 125 None
Featherston 207, 218 Woodside
Woodside 218, 208 Featherston
Carterton 209 None
Solway 211, 212 Masterton
Masterton 210, 211 Solway
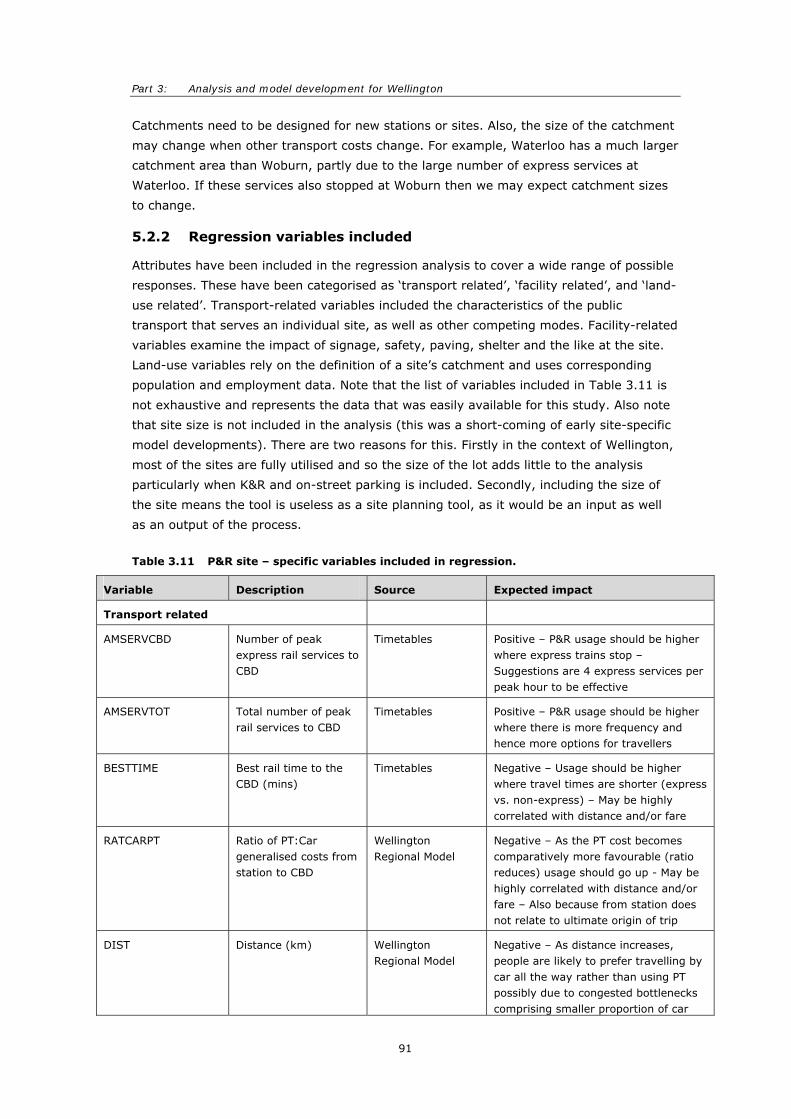
Part 3: Analysis and model development for Wellington
91
Catchments need to be designed for new stations or sites. Also, the size of the catchment
may change when other transport costs change. For example, Waterloo has a much larger
catchment area than Woburn, partly due to the large number of express services at
Waterloo. If these services also stopped at Woburn then we may expect catchment sizes
to change.
5.2.2 Regression variables included
Attributes have been included in the regression analysis to cover a wide range of possible
responses. These have been categorised as ‘transport related’, ‘facility related’, and ‘land-
use related’. Transport-related variables included the characteristics of the public
transport that serves an individual site, as well as other competing modes. Facility-related
variables examine the impact of signage, safety, paving, shelter and the like at the site.
Land-use variables rely on the definition of a site’s catchment and uses corresponding
population and employment data. Note that the list of variables included in Table 3.11 is
not exhaustive and represents the data that was easily available for this study. Also note
that site size is not included in the analysis (this was a short-coming of early site-specific
model developments). There are two reasons for this. Firstly in the context of Wellington,
most of the sites are fully utilised and so the size of the lot adds little to the analysis
particularly when K&R and on-street parking is included. Secondly, including the size of
the site means the tool is useless as a site planning tool, as it would be an input as well
as an output of the process.
Table 3.11 P&R site – specific variables included in regression.
Variable Description Source Expected impact
Transport related
AMSERVCBD Number of peak express rail services to CBD
Timetables Positive – P&R usage should be higher where express trains stop – Suggestions are 4 express services per peak hour to be effective
AMSERVTOT Total number of peak rail services to CBD
Timetables Positive – P&R usage should be higher where there is more frequency and hence more options for travellers
BESTTIME Best rail time to the CBD (mins)
Timetables Negative – Usage should be higher where travel times are shorter (express vs. non-express) – May be highly correlated with distance and/or fare
RATCARPT Ratio of PT:Car generalised costs from station to CBD
Wellington Regional Model
Negative – As the PT cost becomes comparatively more favourable (ratio reduces) usage should go up - May be highly correlated with distance and/or fare – Also because from station does not relate to ultimate origin of trip
DIST Distance (km) Wellington Regional Model
Negative – As distance increases, people are likely to prefer travelling by car all the way rather than using PT possibly due to congested bottlenecks comprising smaller proportion of car
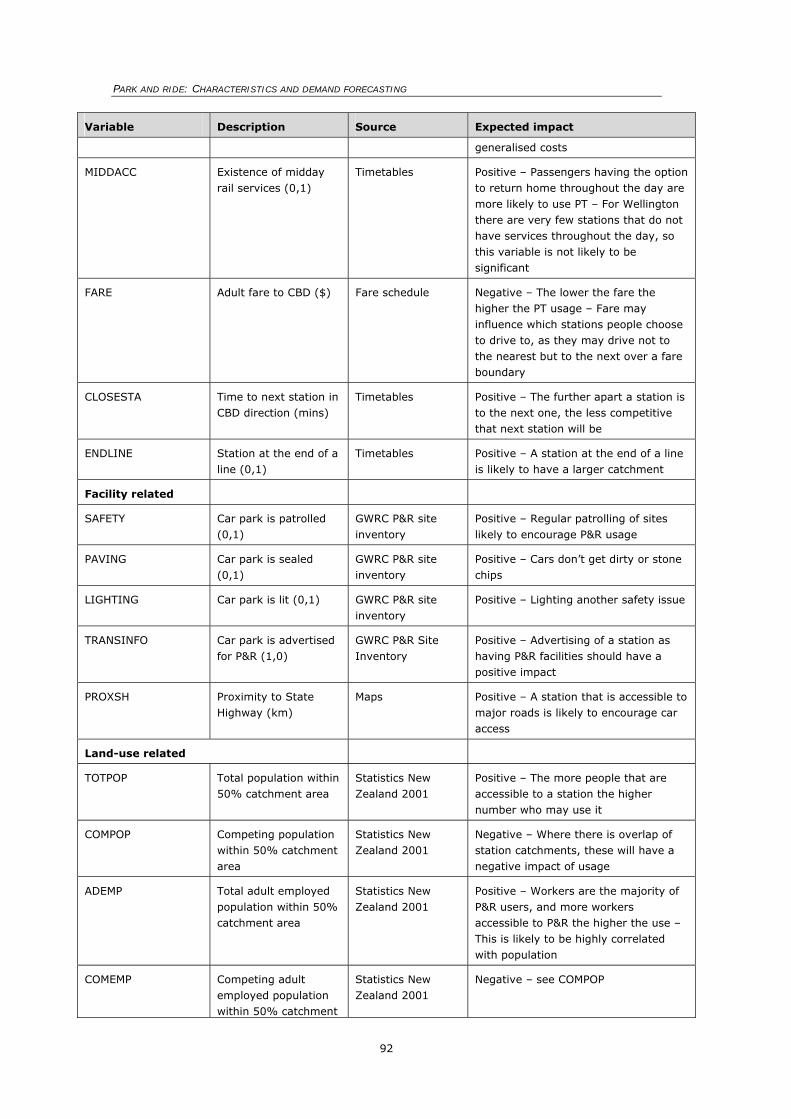
PARK AND RIDE: CHARACTERISTICS AND DEMAND FORECASTING
92
Variable Description Source Expected impact
generalised costs
MIDDACC Existence of midday rail services (0,1)
Timetables Positive – Passengers having the option to return home throughout the day are more likely to use PT – For Wellington there are very few stations that do not have services throughout the day, so this variable is not likely to be significant
FARE Adult fare to CBD ($) Fare schedule Negative – The lower the fare the higher the PT usage – Fare may influence which stations people choose to drive to, as they may drive not to the nearest but to the next over a fare boundary
CLOSESTA Time to next station in CBD direction (mins)
Timetables Positive – The further apart a station is to the next one, the less competitive that next station will be
ENDLINE Station at the end of a line (0,1)
Timetables Positive – A station at the end of a line is likely to have a larger catchment
Facility related
SAFETY Car park is patrolled (0,1)
GWRC P&R site inventory
Positive – Regular patrolling of sites likely to encourage P&R usage
PAVING Car park is sealed (0,1)
GWRC P&R site inventory
Positive – Cars don’t get dirty or stone chips
LIGHTING Car park is lit (0,1) GWRC P&R site inventory
Positive – Lighting another safety issue
TRANSINFO Car park is advertised for P&R (1,0)
GWRC P&R Site Inventory
Positive – Advertising of a station as having P&R facilities should have a positive impact
PROXSH Proximity to State Highway (km)
Maps Positive – A station that is accessible to major roads is likely to encourage car access
Land-use related
TOTPOP Total population within 50% catchment area
Statistics New Zealand 2001
Positive – The more people that are accessible to a station the higher number who may use it
COMPOP Competing population within 50% catchment area
Statistics New Zealand 2001
Negative – Where there is overlap of station catchments, these will have a negative impact of usage
ADEMP Total adult employed population within 50% catchment area
Statistics New Zealand 2001
Positive – Workers are the majority of P&R users, and more workers accessible to P&R the higher the use – This is likely to be highly correlated with population
COMEMP Competing adult employed population within 50% catchment
Statistics New Zealand 2001
Negative – see COMPOP
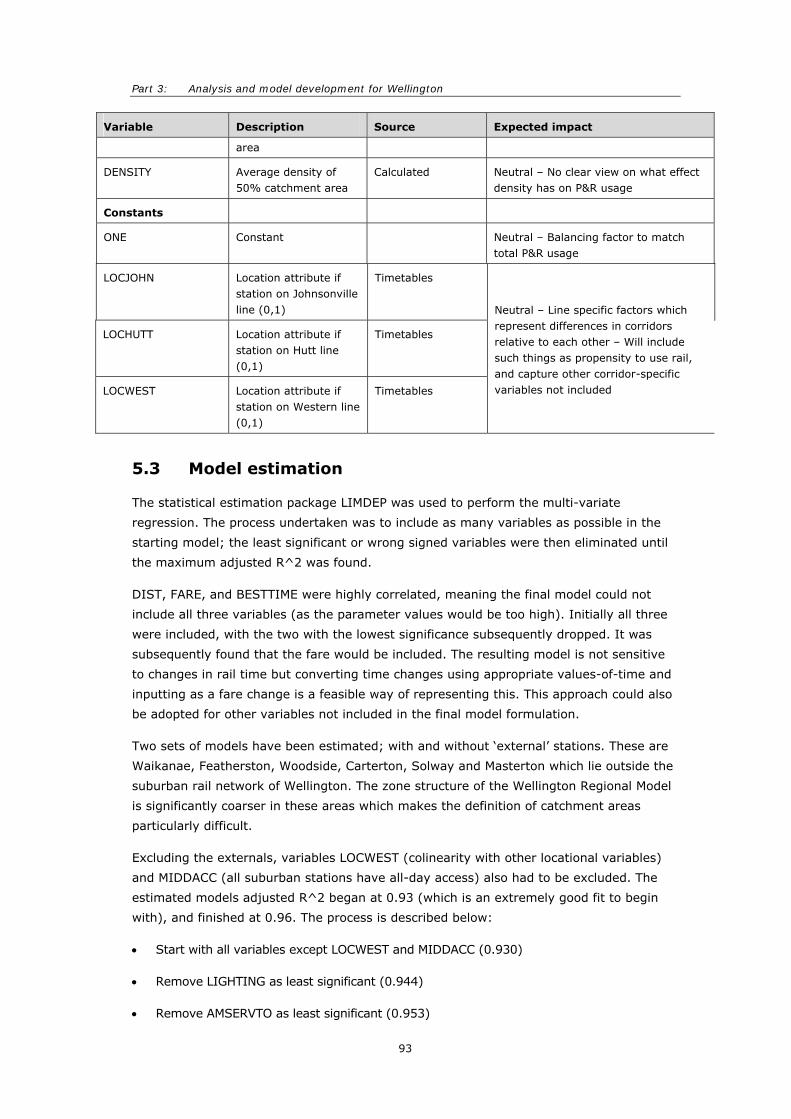
Part 3: Analysis and model development for Wellington
93
Variable Description Source Expected impact
area
DENSITY Average density of 50% catchment area
Calculated Neutral – No clear view on what effect density has on P&R usage
Constants
ONE Constant Neutral – Balancing factor to match total P&R usage
LOCJOHN Location attribute if station on Johnsonville line (0,1)
Timetables
LOCHUTT Location attribute if station on Hutt line (0,1)
Timetables
LOCWEST Location attribute if station on Western line (0,1)
Timetables
Neutral – Line specific factors which represent differences in corridors relative to each other – Will include such things as propensity to use rail, and capture other corridor-specific variables not included
5.3 Model estimation
The statistical estimation package LIMDEP was used to perform the multi-variate
regression. The process undertaken was to include as many variables as possible in the
starting model; the least significant or wrong signed variables were then eliminated until
the maximum adjusted R^2 was found.
DIST, FARE, and BESTTIME were highly correlated, meaning the final model could not
include all three variables (as the parameter values would be too high). Initially all three
were included, with the two with the lowest significance subsequently dropped. It was
subsequently found that the fare would be included. The resulting model is not sensitive
to changes in rail time but converting time changes using appropriate values-of-time and
inputting as a fare change is a feasible way of representing this. This approach could also
be adopted for other variables not included in the final model formulation.
Two sets of models have been estimated; with and without ‘external’ stations. These are
Waikanae, Featherston, Woodside, Carterton, Solway and Masterton which lie outside the
suburban rail network of Wellington. The zone structure of the Wellington Regional Model
is significantly coarser in these areas which makes the definition of catchment areas
particularly difficult.
Excluding the externals, variables LOCWEST (colinearity with other locational variables)
and MIDDACC (all suburban stations have all-day access) also had to be excluded. The
estimated models adjusted R^2 began at 0.93 (which is an extremely good fit to begin
with), and finished at 0.96. The process is described below:
• Start with all variables except LOCWEST and MIDDACC (0.930)
• Remove LIGHTING as least significant (0.944)
• Remove AMSERVTO as least significant (0.953)
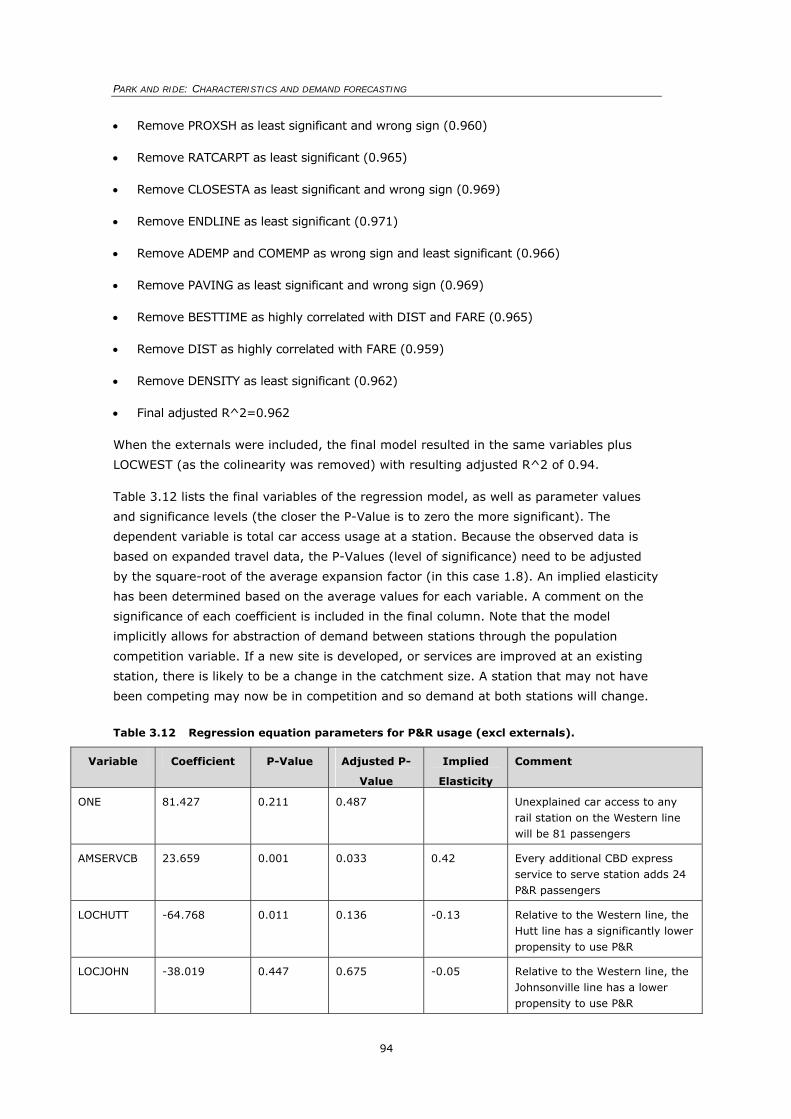
PARK AND RIDE: CHARACTERISTICS AND DEMAND FORECASTING
94
• Remove PROXSH as least significant and wrong sign (0.960)
• Remove RATCARPT as least significant (0.965)
• Remove CLOSESTA as least significant and wrong sign (0.969)
• Remove ENDLINE as least significant (0.971)
• Remove ADEMP and COMEMP as wrong sign and least significant (0.966)
• Remove PAVING as least significant and wrong sign (0.969)
• Remove BESTTIME as highly correlated with DIST and FARE (0.965)
• Remove DIST as highly correlated with FARE (0.959)
• Remove DENSITY as least significant (0.962)
• Final adjusted R^2=0.962
When the externals were included, the final model resulted in the same variables plus
LOCWEST (as the colinearity was removed) with resulting adjusted R^2 of 0.94.
Table 3.12 lists the final variables of the regression model, as well as parameter values
and significance levels (the closer the P-Value is to zero the more significant). The
dependent variable is total car access usage at a station. Because the observed data is
based on expanded travel data, the P-Values (level of significance) need to be adjusted
by the square-root of the average expansion factor (in this case 1.8). An implied elasticity
has been determined based on the average values for each variable. A comment on the
significance of each coefficient is included in the final column. Note that the model
implicitly allows for abstraction of demand between stations through the population
competition variable. If a new site is developed, or services are improved at an existing
station, there is likely to be a change in the catchment size. A station that may not have
been competing may now be in competition and so demand at both stations will change.
Table 3.12 Regression equation parameters for P&R usage (excl externals).
Variable Coefficient P-Value Adjusted P-
Value
Implied
Elasticity
Comment
ONE 81.427 0.211 0.487 Unexplained car access to any rail station on the Western line will be 81 passengers
AMSERVCB 23.659 0.001 0.033 0.42 Every additional CBD express service to serve station adds 24 P&R passengers
LOCHUTT -64.768 0.011 0.136 -0.13 Relative to the Western line, the Hutt line has a significantly lower propensity to use P&R
LOCJOHN -38.019 0.447 0.675 -0.05 Relative to the Western line, the Johnsonville line has a lower propensity to use P&R
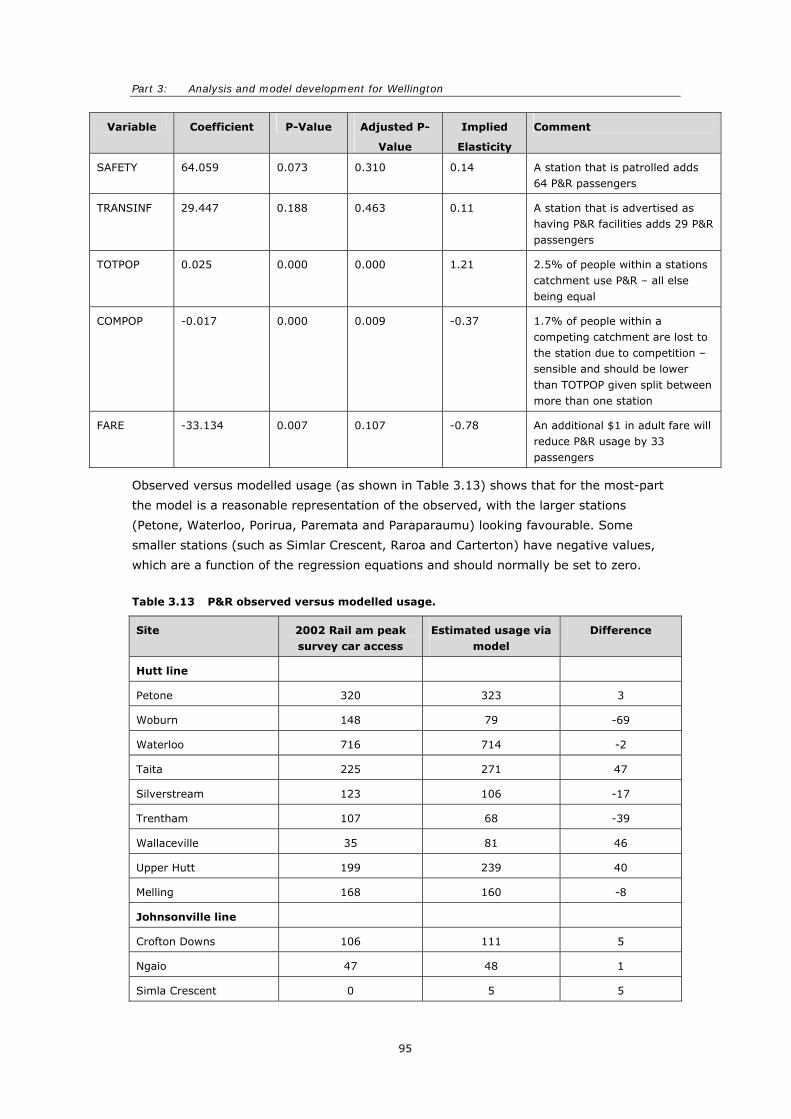
Part 3: Analysis and model development for Wellington
95
Variable Coefficient P-Value Adjusted P-
Value
Implied
Elasticity
Comment
SAFETY 64.059 0.073 0.310 0.14 A station that is patrolled adds 64 P&R passengers
TRANSINF 29.447 0.188 0.463 0.11 A station that is advertised as having P&R facilities adds 29 P&R passengers
TOTPOP 0.025 0.000 0.000 1.21 2.5% of people within a stations catchment use P&R – all else being equal
COMPOP -0.017 0.000 0.009 -0.37 1.7% of people within a competing catchment are lost to the station due to competition – sensible and should be lower than TOTPOP given split between more than one station
FARE -33.134 0.007 0.107 -0.78 An additional $1 in adult fare will reduce P&R usage by 33 passengers
Observed versus modelled usage (as shown in Table 3.13) shows that for the most-part
the model is a reasonable representation of the observed, with the larger stations
(Petone, Waterloo, Porirua, Paremata and Paraparaumu) looking favourable. Some
smaller stations (such as Simlar Crescent, Raroa and Carterton) have negative values,
which are a function of the regression equations and should normally be set to zero.
Table 3.13 P&R observed versus modelled usage.
Site 2002 Rail am peak survey car access
Estimated usage via model
Difference
Hutt line
Petone 320 323 3
Woburn 148 79 -69
Waterloo 716 714 -2
Taita 225 271 47
Silverstream 123 106 -17
Trentham 107 68 -39
Wallaceville 35 81 46
Upper Hutt 199 239 40
Melling 168 160 -8
Johnsonville line
Crofton Downs 106 111 5
Ngaio 47 48 1
Simla Crescent 0 5 5
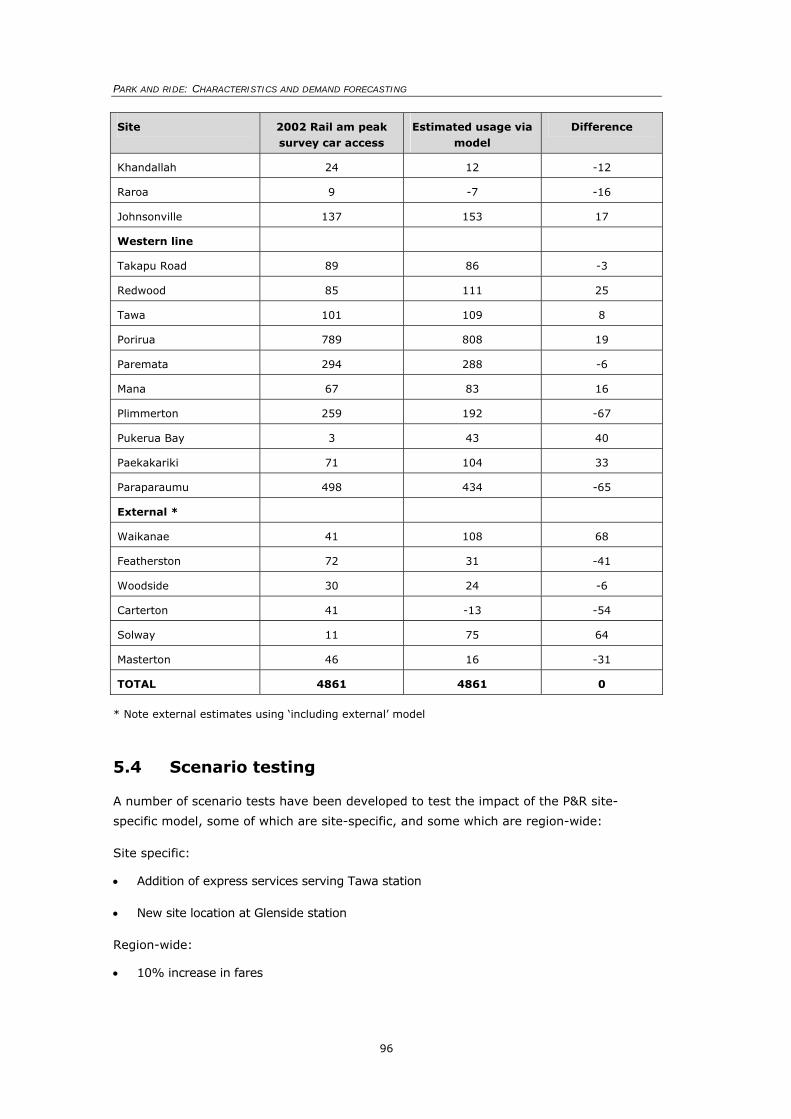
PARK AND RIDE: CHARACTERISTICS AND DEMAND FORECASTING
96
Site 2002 Rail am peak survey car access
Estimated usage via model
Difference
Khandallah 24 12 -12
Raroa 9 -7 -16
Johnsonville 137 153 17
Western line
Takapu Road 89 86 -3
Redwood 85 111 25
Tawa 101 109 8
Porirua 789 808 19
Paremata 294 288 -6
Mana 67 83 16
Plimmerton 259 192 -67
Pukerua Bay 3 43 40
Paekakariki 71 104 33
Paraparaumu 498 434 -65
External *
Waikanae 41 108 68
Featherston 72 31 -41
Woodside 30 24 -6
Carterton 41 -13 -54
Solway 11 75 64
Masterton 46 16 -31
TOTAL 4861 4861 0
* Note external estimates using ‘including external’ model
5.4 Scenario testing
A number of scenario tests have been developed to test the impact of the P&R site-
specific model, some of which are site-specific, and some which are region-wide:
Site specific:
• Addition of express services serving Tawa station
• New site location at Glenside station
Region-wide:
• 10% increase in fares
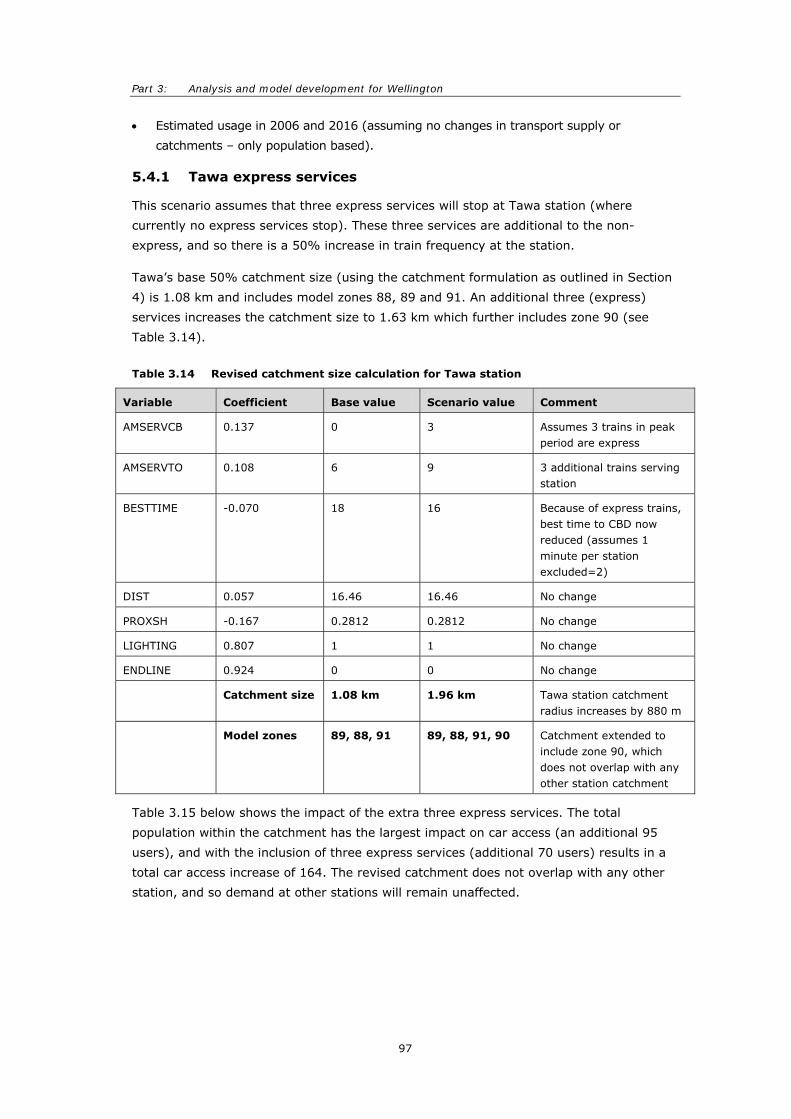
Part 3: Analysis and model development for Wellington
97
• Estimated usage in 2006 and 2016 (assuming no changes in transport supply or
catchments – only population based).
5.4.1 Tawa express services
This scenario assumes that three express services will stop at Tawa station (where
currently no express services stop). These three services are additional to the non-
express, and so there is a 50% increase in train frequency at the station.
Tawa’s base 50% catchment size (using the catchment formulation as outlined in Section
4) is 1.08 km and includes model zones 88, 89 and 91. An additional three (express)
services increases the catchment size to 1.63 km which further includes zone 90 (see
Table 3.14).
Table 3.14 Revised catchment size calculation for Tawa station
Variable Coefficient Base value Scenario value Comment
AMSERVCB 0.137 0 3 Assumes 3 trains in peak period are express
AMSERVTO 0.108 6 9 3 additional trains serving station
BESTTIME -0.070 18 16 Because of express trains, best time to CBD now reduced (assumes 1 minute per station excluded=2)
DIST 0.057 16.46 16.46 No change
PROXSH -0.167 0.2812 0.2812 No change
LIGHTING 0.807 1 1 No change
ENDLINE 0.924 0 0 No change
Catchment size 1.08 km 1.96 km Tawa station catchment radius increases by 880 m
Model zones 89, 88, 91 89, 88, 91, 90 Catchment extended to include zone 90, which does not overlap with any other station catchment
Table 3.15 below shows the impact of the extra three express services. The total
population within the catchment has the largest impact on car access (an additional 95
users), and with the inclusion of three express services (additional 70 users) results in a
total car access increase of 164. The revised catchment does not overlap with any other
station, and so demand at other stations will remain unaffected.
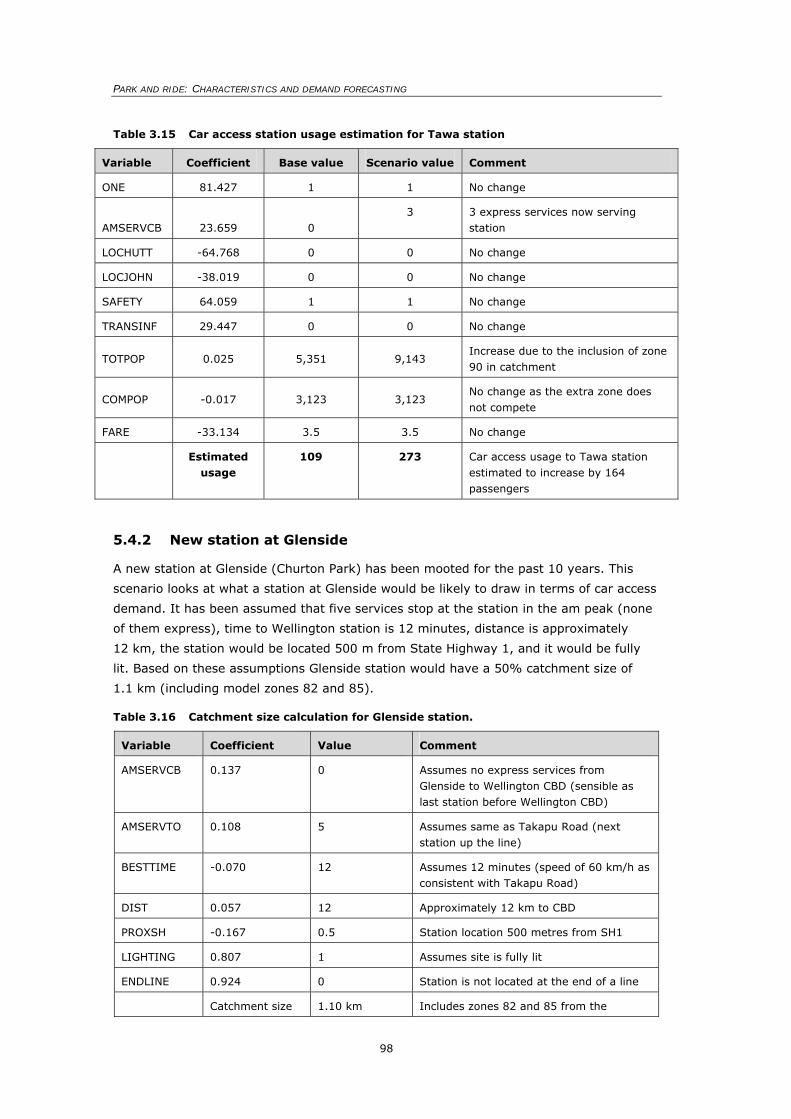
PARK AND RIDE: CHARACTERISTICS AND DEMAND FORECASTING
98
Table 3.15 Car access station usage estimation for Tawa station
Variable Coefficient Base value Scenario value Comment
ONE 81.427 1 1 No change
AMSERVCB 23.659 0 3 3 express services now serving
station
LOCHUTT -64.768 0 0 No change
LOCJOHN -38.019 0 0 No change
SAFETY 64.059 1 1 No change
TRANSINF 29.447 0 0 No change
TOTPOP 0.025 5,351 9,143 Increase due to the inclusion of zone 90 in catchment
COMPOP -0.017 3,123 3,123 No change as the extra zone does not compete
FARE -33.134 3.5 3.5 No change
Estimated usage
109 273 Car access usage to Tawa station estimated to increase by 164 passengers
5.4.2 New station at Glenside
A new station at Glenside (Churton Park) has been mooted for the past 10 years. This
scenario looks at what a station at Glenside would be likely to draw in terms of car access
demand. It has been assumed that five services stop at the station in the am peak (none
of them express), time to Wellington station is 12 minutes, distance is approximately
12 km, the station would be located 500 m from State Highway 1, and it would be fully
lit. Based on these assumptions Glenside station would have a 50% catchment size of
1.1 km (including model zones 82 and 85).
Table 3.16 Catchment size calculation for Glenside station.
Variable Coefficient Value Comment
AMSERVCB 0.137 0 Assumes no express services from Glenside to Wellington CBD (sensible as last station before Wellington CBD)
AMSERVTO 0.108 5 Assumes same as Takapu Road (next station up the line)
BESTTIME -0.070 12 Assumes 12 minutes (speed of 60 km/h as consistent with Takapu Road)
DIST 0.057 12 Approximately 12 km to CBD
PROXSH -0.167 0.5 Station location 500 metres from SH1
LIGHTING 0.807 1 Assumes site is fully lit
ENDLINE 0.924 0 Station is not located at the end of a line
Catchment size 1.10 km Includes zones 82 and 85 from the
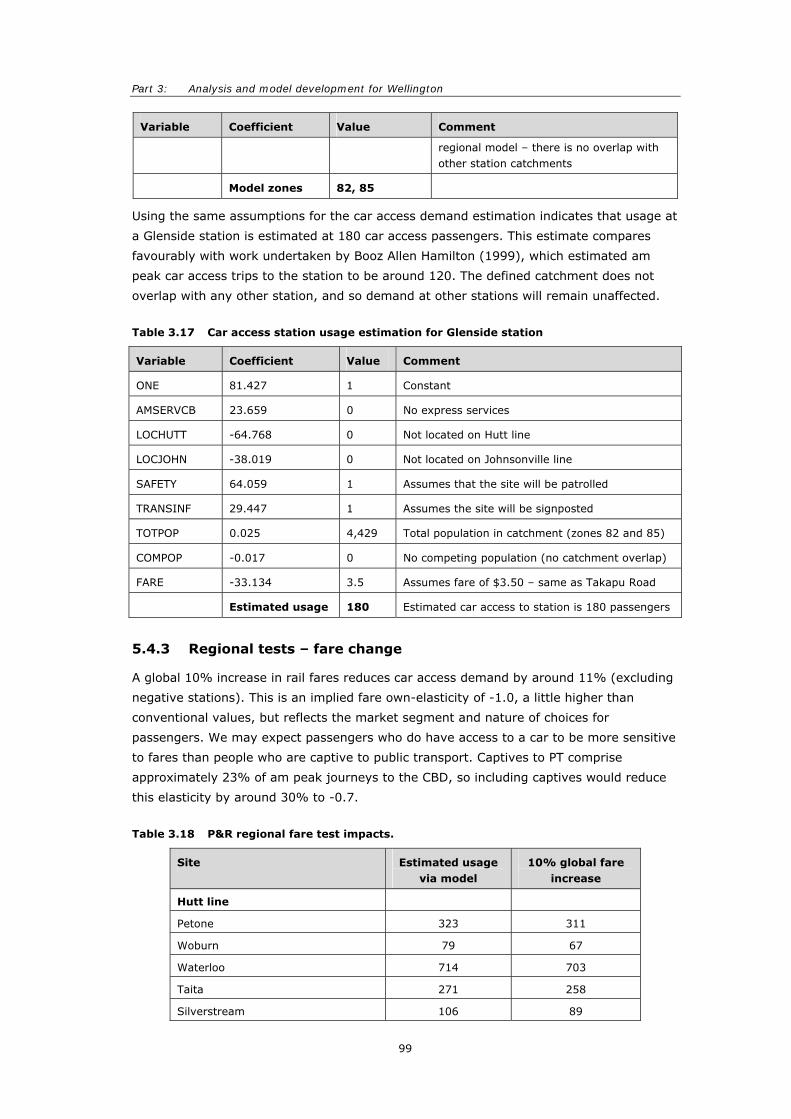
Part 3: Analysis and model development for Wellington
99
Variable Coefficient Value Comment
regional model – there is no overlap with other station catchments
Model zones 82, 85
Using the same assumptions for the car access demand estimation indicates that usage at
a Glenside station is estimated at 180 car access passengers. This estimate compares
favourably with work undertaken by Booz Allen Hamilton (1999), which estimated am
peak car access trips to the station to be around 120. The defined catchment does not
overlap with any other station, and so demand at other stations will remain unaffected.
Table 3.17 Car access station usage estimation for Glenside station
Variable Coefficient Value Comment
ONE 81.427 1 Constant
AMSERVCB 23.659 0 No express services
LOCHUTT -64.768 0 Not located on Hutt line
LOCJOHN -38.019 0 Not located on Johnsonville line
SAFETY 64.059 1 Assumes that the site will be patrolled
TRANSINF 29.447 1 Assumes the site will be signposted
TOTPOP 0.025 4,429 Total population in catchment (zones 82 and 85)
COMPOP -0.017 0 No competing population (no catchment overlap)
FARE -33.134 3.5 Assumes fare of $3.50 – same as Takapu Road
Estimated usage 180 Estimated car access to station is 180 passengers
5.4.3 Regional tests – fare change
A global 10% increase in rail fares reduces car access demand by around 11% (excluding
negative stations). This is an implied fare own-elasticity of -1.0, a little higher than
conventional values, but reflects the market segment and nature of choices for
passengers. We may expect passengers who do have access to a car to be more sensitive
to fares than people who are captive to public transport. Captives to PT comprise
approximately 23% of am peak journeys to the CBD, so including captives would reduce
this elasticity by around 30% to -0.7.
Table 3.18 P&R regional fare test impacts.
Site Estimated usage via model
10% global fare increase
Hutt line
Petone 323 311
Woburn 79 67
Waterloo 714 703
Taita 271 258
Silverstream 106 89
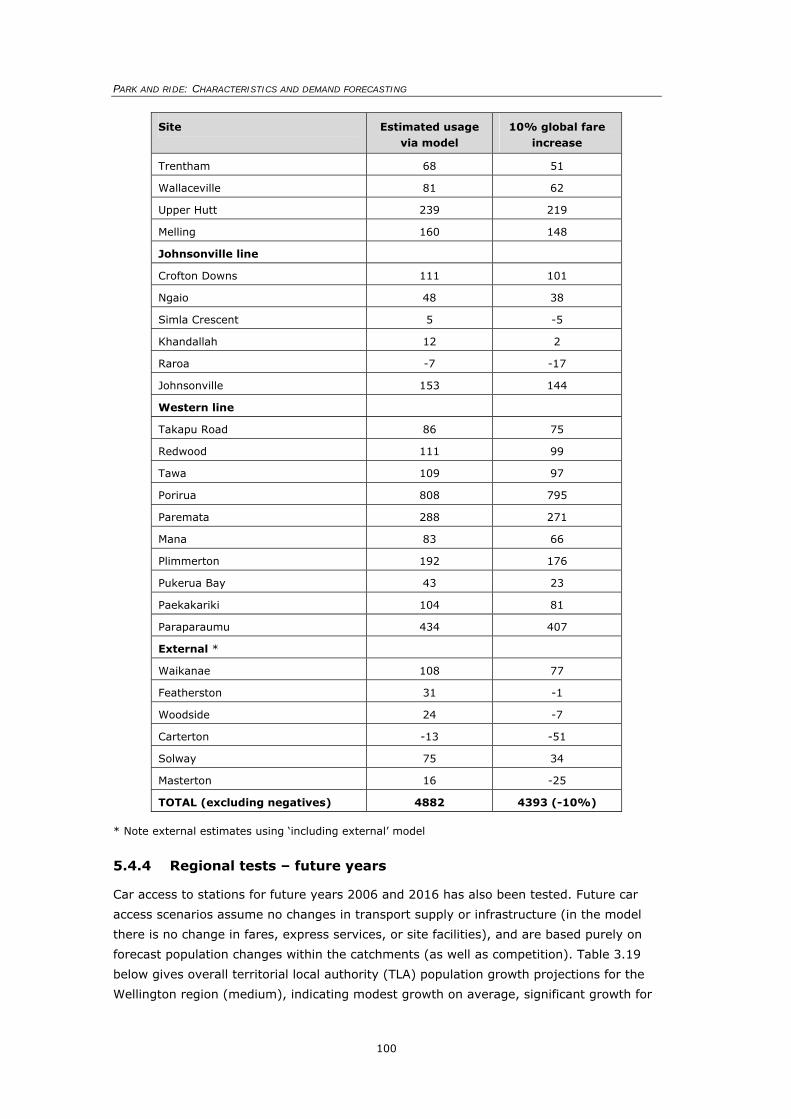
PARK AND RIDE: CHARACTERISTICS AND DEMAND FORECASTING
100
Site Estimated usage via model
10% global fare increase
Trentham 68 51
Wallaceville 81 62
Upper Hutt 239 219
Melling 160 148
Johnsonville line
Crofton Downs 111 101
Ngaio 48 38
Simla Crescent 5 -5
Khandallah 12 2
Raroa -7 -17
Johnsonville 153 144
Western line
Takapu Road 86 75
Redwood 111 99
Tawa 109 97
Porirua 808 795
Paremata 288 271
Mana 83 66
Plimmerton 192 176
Pukerua Bay 43 23
Paekakariki 104 81
Paraparaumu 434 407
External *
Waikanae 108 77
Featherston 31 -1
Woodside 24 -7
Carterton -13 -51
Solway 75 34
Masterton 16 -25
TOTAL (excluding negatives) 4882 4393 (-10%)
* Note external estimates using ‘including external’ model
5.4.4 Regional tests – future years
Car access to stations for future years 2006 and 2016 has also been tested. Future car
access scenarios assume no changes in transport supply or infrastructure (in the model
there is no change in fares, express services, or site facilities), and are based purely on
forecast population changes within the catchments (as well as competition). Table 3.19
below gives overall territorial local authority (TLA) population growth projections for the
Wellington region (medium), indicating modest growth on average, significant growth for
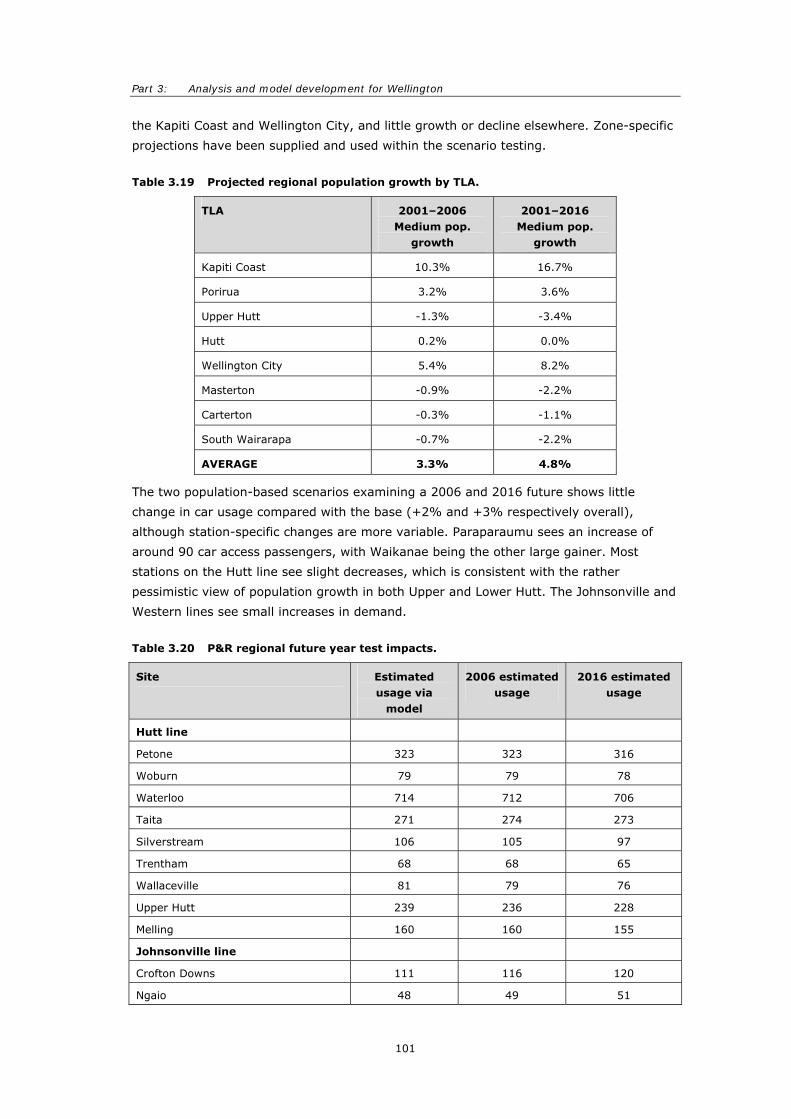
Part 3: Analysis and model development for Wellington
101
the Kapiti Coast and Wellington City, and little growth or decline elsewhere. Zone-specific
projections have been supplied and used within the scenario testing.
Table 3.19 Projected regional population growth by TLA.
TLA 2001–2006 Medium pop.
growth
2001–2016 Medium pop.
growth
Kapiti Coast 10.3% 16.7%
Porirua 3.2% 3.6%
Upper Hutt -1.3% -3.4%
Hutt 0.2% 0.0%
Wellington City 5.4% 8.2%
Masterton -0.9% -2.2%
Carterton -0.3% -1.1%
South Wairarapa -0.7% -2.2%
AVERAGE 3.3% 4.8%
The two population-based scenarios examining a 2006 and 2016 future shows little
change in car usage compared with the base (+2% and +3% respectively overall),
although station-specific changes are more variable. Paraparaumu sees an increase of
around 90 car access passengers, with Waikanae being the other large gainer. Most
stations on the Hutt line see slight decreases, which is consistent with the rather
pessimistic view of population growth in both Upper and Lower Hutt. The Johnsonville and
Western lines see small increases in demand.
Table 3.20 P&R regional future year test impacts.
Site Estimated usage via
model
2006 estimated usage
2016 estimated usage
Hutt line
Petone 323 323 316
Woburn 79 79 78
Waterloo 714 712 706
Taita 271 274 273
Silverstream 106 105 97
Trentham 68 68 65
Wallaceville 81 79 76
Upper Hutt 239 236 228
Melling 160 160 155
Johnsonville line
Crofton Downs 111 116 120
Ngaio 48 49 51
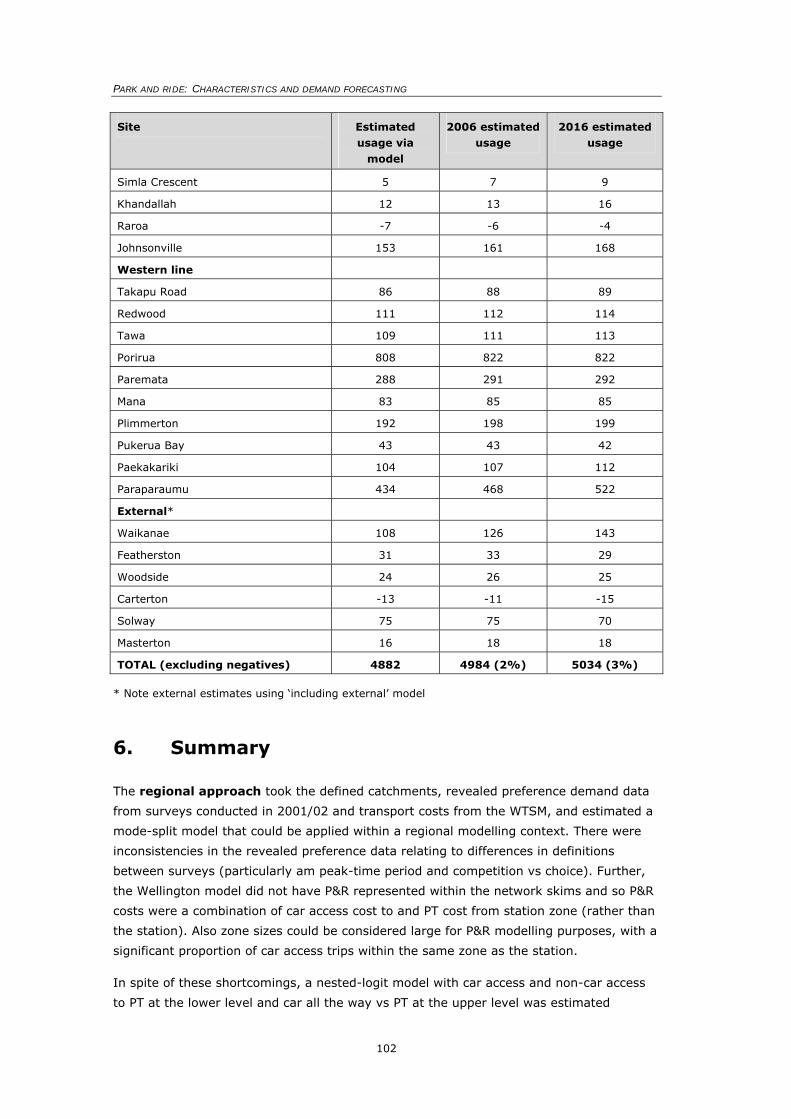
PARK AND RIDE: CHARACTERISTICS AND DEMAND FORECASTING
102
Site Estimated usage via
model
2006 estimated usage
2016 estimated usage
Simla Crescent 5 7 9
Khandallah 12 13 16
Raroa -7 -6 -4
Johnsonville 153 161 168
Western line
Takapu Road 86 88 89
Redwood 111 112 114
Tawa 109 111 113
Porirua 808 822 822
Paremata 288 291 292
Mana 83 85 85
Plimmerton 192 198 199
Pukerua Bay 43 43 42
Paekakariki 104 107 112
Paraparaumu 434 468 522
External*
Waikanae 108 126 143
Featherston 31 33 29
Woodside 24 26 25
Carterton -13 -11 -15
Solway 75 75 70
Masterton 16 18 18
TOTAL (excluding negatives) 4882 4984 (2%) 5034 (3%)
* Note external estimates using ‘including external’ model
6. Summary
The regional approach took the defined catchments, revealed preference demand data
from surveys conducted in 2001/02 and transport costs from the WTSM, and estimated a
mode-split model that could be applied within a regional modelling context. There were
inconsistencies in the revealed preference data relating to differences in definitions
between surveys (particularly am peak-time period and competition vs choice). Further,
the Wellington model did not have P&R represented within the network skims and so P&R
costs were a combination of car access cost to and PT cost from station zone (rather than
the station). Also zone sizes could be considered large for P&R modelling purposes, with a
significant proportion of car access trips within the same zone as the station.
In spite of these shortcomings, a nested-logit model with car access and non-car access
to PT at the lower level and car all the way vs PT at the upper level was estimated
Part 3: Analysis and model development for Wellington
103
successfully. This nested-logit formulation was then applied within an Emme/2 procedure,
which also included capacity constraints at station car parks. A number of scenarios were
run to test the model behaviour against industry-standard elasticities. The model was
found to be performing adequately, both in terms of car and PT elasticities. Other tests
were undertaken relating to site capacity increases, with results also looking sensible.
A site-specific approach was then developed. The advantage of such an approach over
the regional approach is that it is simpler to apply and less data intensive. Site usage was
regressed against demographic, service and facility-related variables to determine a
multivariate model for car access to rail stations. There were high levels of co-linearity
between distance/time/fare variables, but adequate relationships were still obtained. The
final model included catchment population, number of express services, fare, safety, P&R
information and a line-specific indicator. In addition, a variable was included which looked
at competing population (where catchments overlap). It was found that all things being
equal the population coefficient implied 2.5% of catchment population used car access to
the station and that where station catchments overlapped -1.7% of overlapping
population would be lost.
Sensitivity tests for the site-approach were undertaken, first looking at the impact of
changes to an existing station and then the inclusion of a new station. The results of
these two tests looked reasonable. A test relating to an increase in PT fares was
undertaken; the model proved to be too sensitive to fares but this was partly due to the
exclusion of PT captive trips. Further tests were undertaken looking at future year
population impacts.
The two approaches should not be seen as substitutes and should be used in conjunction
with one another to give a wider range of information for decision makers. While these
methodologies have been designed for the Wellington Region, similar models could be
developed for other regions. However, the quality and completeness of the input data will
always ultimately dictate how successful these models will be.
PARK AND RIDE: CHARACTERISTICS AND DEMAND FORECASTING
104
Appendix A References
Al-Kazily, J. 1991. Analysis of park-and-ride lot use in the Sacramento region.
Transportation Research Record 1321. pp. 1–6.
Arezki, B. 1991. Modeling park and ride.
Armstone, J. 1992. Park and ride: General principles. Paper to Park and Ride Seminar,
PTRC, 31 March 1992.
ARUP Transportation Planning (ARUP). 1998. A park-and-ride strategy for the Transperth
system: 10-year facilities plan. Report to WA Department of Transport, Perth, Australia.
Auckland Regional Council (ARC). 2000. Travel demand management strategy. Auckland.
Auckland Regional Council (ARC). 2003. Regional passenger transport plan. Auckland.
Auckland Regional Council (ARC). 2005. Auckland regional land transport strategy.
Auckland.
Auckland Regional Transport Authority (ARTA). 2006. Northern Busway Station Survey
Albany and Constellation Express Service. Auckland.
Balcombe, R., Mackett, R. L., Paulley, N., Preston, J., Wardman, M., Shires, J., Titheridge,
H., and White, P. 2004. The demand for public transport: A practical guide. TRL Report
593. Crowthorne: Transport Research Laboratory.
Barton-Aschman Associates and Richard H Pratt and Associates. 1981. Traveler response to
transportation system changes. Second edition. Washington: Transportation Research
Board.
Booz Allen Hamilton. 1999. Park and ride policies and criteria. Transfund New Zealand
Research Report 136.
Buchanan, M. 1992. Park and ride. Paper to 23rd Annual Public Transport Symposium, April
1992. University of Newcastle upon Tyne.
California Department of Transportation. 1988. Park and ride five year program report. San
Francisco, District 4.
Davidson. 1992. Park and Ride: public transport for the car user.
Environment Canterbury. 2005. Canterbury regional land transport strategy 2005–2015.
Christchurch, New Zealand.
Environment Canterbury. 2006. Canterbury Regional Passenger Transport Plan.
Christchurch, New Zealand.
Ghali, M. O., Pursula, M., Milne, D. S., Keranen, M., Daleno, M., and Vougioukas, M. 2000.
Assessing the impact of integrated trans modal urban transport pricing on modal split. In
J. Ortúzar (Ed.) Stated preference modelling techniques. Perspectives 4. London: PTRC.
pp. 259–274.
Appendix A References
105
Greater Wellington Regional Council (GWRC). 2005. Travel demand management strategy.
Wellington.
Greater Wellington Regional Council (GWRC). 2006. Draft regional passenger transport
plan. Wellington.
Greater Wellington Regional Council (GWRC). 2007. Wellington regional land transport
strategy 2007–2016. Wellington.
Hole, A. R. 2004. Forecasting the demand for an employee park and ride service using
commuters’ stated choices. http://129.3.20.41/eps/urb/papers/0312/0312002.pdf
Hull. 1998. Application of a park-and-ride forecasting procedure in the Greater Vancouver
Transportation Model. Paper presented at 13th Annual International Emme/2 Users’
Group Conference, Houston, Texas.
Huntley, P. 1993. Park and ride: Strategic modal shift or cheap overflow parking. Local
Transport Today, 22 July 1993.
Joyce. 1978. The choice of access mode to a suburban rail interchange. University of
Melbourne.
Kok, E. A., Morrall, J., and Toth, Z. 1994. Trip generation rates for light rail transit park-
and-ride lots. ITE Journal, June 1994. pp. 34–41.
Lythgoe, W. F., and Wardman, M. R. 2004. Modelling passenger demand for parkway rail
stations. Transportation 31(2): 125–151.
Monzon, A., Echeverria-Jadraque, D., Martinez-Sanchez, A. Cristobal-Pinto, C., and Garcia-
Pastor, A. 1998. Present and potential demand for park-and-ride in Madrid. Madrid.
Universidad Politécnica de Madrid.
Moran, M. 1990. Taking motorists for a ride. Parking Review, Sept/Oct 1990.
Morrall, J., and Bolger, D. 1996. Park-and-ride: Canada's most cost effective TDM strategy.
Transportation Association of Canada Annual Conference.
Oscar Faber. 1996. The gateway concept: Park-and-ride facilities to encourage the use of
London Underground.
Parkhurst, G. 1995. Park and ride – could it lead to an increase in car traffic? Transport
Policy 2(1): 15–23.
Parkhurst, G. 2001. Dedicated bus-based park and ride services and the demand for public
transport. Report 2001/5. University College London: ESRC Transport Studies Unit.
Pickett, M.W., and Gray, S. M. 1994. The effectiveness of bus-based park and ride. TRL
Report 207.
Speyer, R., Taylor, B., and Venn, P. 1996. Park and ride – the view of users and non-users.
In Proceedings of PTRC Summer Annual Meeting. Seminar F. 1996. Hammersmith:
PTRC.
Spiess, H. 1996. A logit parking choice model with explicit capacities. Working paper.
Aegertem. Switzerland: EMME/2 Support Center.
PARK AND RIDE: CHARACTERISTICS AND DEMAND FORECASTING
106
Spillar, R. 1997. Park and ride planning and design guidelines. New York: Parsons
Brinkerhoff.
Stevens, A. D., and Homburger, W. S. 1985. The use of park-and ride lots by bus
commuters. Berkeley: University of California.
Tolofari, S. 1997. Modelling Park and Ride and Road Pricing with MVMODL in Leicester.
Paper to UK TRIPS User Group Meeting, 8 October 1997.
Transport and Road Research Laboratory (TRRL). 1980. The demand for public transport.
Report of International Collaborative Study of Factors Affecting Public Transport
Patronage.
Travers Morgan (NZ) Ltd. 1994. Park and ride program development: Hutt Valley Corridor.
September 1994.
Travers Morgan (NZ) Ltd. 1995. Wellington City bus park and ride program.
Turnbull, K. F. 1995. Effective use of park-and-ride facilities. National Cooperative Highway
Research Program, Synthesis of Highway Practice 213.
Turnbull, K. F., Pratt, R. H., Evans IV, J. E., and Levinson, H. S. 2004. Park and ride/pool.
Chap. 3 in Traveler response to transportation system changes. Washington:
Transportation Research Board.
Wayte, A. 1991. Road demand management. Paper presented at Travel Demand
Management Seminar. Perth: PPK Consultants Pty. Ltd.
Woods, S. 2006. The implications of park and ride on urban development strategies in
major metropolitan areas in New Zealand. MET Research Report. Christchurch:
University of Canterbury.
Xie, B. J., and Wies, K. 2001. Integrated parking cost into transit generalized cost – an
application of using matrix convolution. Chicago Area Transportation Study. 16th
International Emme/2 Users’ Conference, Chicago.
Appendix B P&R policies in New Zealand urban transport strategies
107
APPENDIX B P&R policies in New Zealand urban transport strategies
Auckland
Auckland Regional Land Transport Strategy (ARC 2005)
The Auckland Regional Land Transport Strategy (RLTS) ‘details the way forward for the
region’s transport system for the next 10 years’. P&R is mentioned in Chapter 7 –
‘Achieving the Objectives: RLTS Policies’ of the latest RLTS update in 2005. With
particular reference to P&R, the RLTS strives to:
• support the efficient use of land for P&R facilities (S1.7.14)
• develop a regional parking strategy ‘including a regional policy position for the provision
of P&R facilities’– (S3.4.6)
• develop a regional passenger plan to provide standards and guidelines for P&R (S4.1.1)
• ensure that charges for ancillary services (such as P&R) are set to level as to encourage
patronage and development initiatives (S4.1.8).
Auckland Regional Passenger Transport Plan (ARC 2003)
The Regional Passenger Transport Plan describes how the strategies related to passenger
transport services contained in the RLTS will be implemented.
• It appears to have no general policy statements re P&R.
• North Shore Busway (Chapter 6.1). Notes P&R facilities to be provided at Albany
station (facilities for approximately 370 vehicles) and Constellation station (facilities for
approximately 200 vehicles) – stations have since opened (November 2005) and have
been full with excess informal parking on surrounding streets.
• Rail system (p 84). Notes the importance of P&R access to the rail system. Classifies
stations into two groups according to P&R potential: Major (over 100 spaces, access by
major arterial, and catchment of 2–5km or more in outlying areas), local (less than 100
spaces, and catchment of 2 km). Mentions the extension of services south to Drury and
the identification of an associated P&R site.
• Ferry services (p 95). Notes that P&R provision is essential to attract ferry patronage.
States that ‘Wherever practicable, any new ferry terminal facilities shall be provided with
an adjacent dedicated park-and-ride area within easy walking access to the wharf’.
Mentions new P&R site at Hobsonville Wharf.
• There appears to be no mention of P&R policies for the remainder (non-busway) parts of
the bus system.
PARK AND RIDE: CHARACTERISTICS AND DEMAND FORECASTING
108
Travel Demand Management Strategy (ARC 2000)
• P&R facilities identified as a TDM transport supply measure (Table 2)
• Shuttle buses from P&R sites put forward as an alternative mode TDM measure (Table 3).
Wellington
Regional Land Transport Strategy (GWRC 2007)
The vision as stated in the executive summary is ‘to deliver an integrated land transport
system that supports the region’s people and prosperity in a way that is economically,
environmentally and socially sustainable’. Support for P&R is seen as one way of attaining
this vision through:
• support for ongoing development of new and existing P&R facilities (p 57), which in turn
will support the RLTS objectives of assisting economic and regional development,
improving access/mobility/reliability, and ensuring environmental sustainability
• efficient integration of modes is seen as an important objective for the RLTS, including
safe and easy access between stations and P&R facilities
• short to medium term projects (2007–2016) include new and upgraded stations along the
Western rail corridor with associated P&R facilities. Continued improvement of P&R
facilities on the Hutt/Melling lines is also signalled.
There is no explicit mention of bus or ferry P&R.
Draft Regional Transport Passenger Plan (GWRC 2006)
• To pursue opportunities to secure ownership of long-term lease of current P&R sites to aid
in future increases in capacity and improved facilities (p 17)
• Creation of seamless bus-train transfers to reduce the need for major P&R capacity
expansion (p 18)
• Recognises the quality and usage of P&R facilities has grown significantly over the last five
years, and partnerships between the regional council and existing property owners are
key to ensuring future improvement (p 19)
• Reiterates short to medium term projects in the RLTS.
Travel Demand Management Strategy (GWRC 2005)
• Provides no mention of P&R as a TDM measure.
Appendix B P&R policies in New Zealand urban transport strategies
109
Christchurch
Canterbury Regional Land Transport Strategy 2005–2015 (Environment Canterbury 2005)
• Integrating ‘the passenger transport network with other modes though the provision of
appropriate facilities such as P&R’ (1.3.7)
• Planning for the future needs to the rail network, and protecting land close to stations for
such uses as P&R (1.5.2)
• Plan for interchange points - including P&R (4.2.2)
• No mention of specific P&R schemes.
Canterbury Regional Passenger Transport Plan (Environment Canterbury 2006)
Policy 1.4 states ‘regional connections shall be provided only where there is strong
community support’, and may include demand response services such as P&R
Policy 5.8 states ‘Environment Canterbury shall work with and encourage road controlling
authorities to support public transport’ through supportive land-use planning providing for
facilities such as P&R areas that are comfortable, safe, and well lit
No mention of specific P&R schemes.
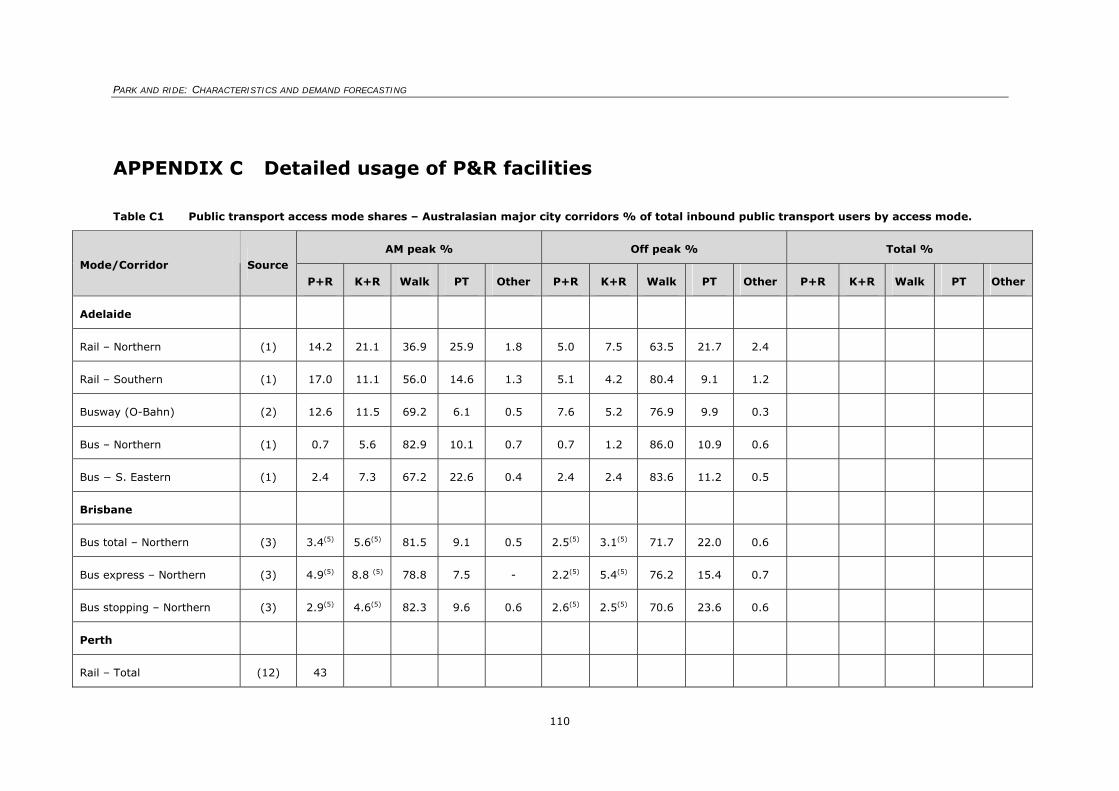
PARK AND RIDE: CHARACTERISTICS AND DEMAND FORECASTING
110
APPENDIX C Detailed usage of P&R facilities
Table C1 Public transport access mode shares – Australasian major city corridors % of total inbound public transport users by access mode.
AM peak % Off peak % Total % Mode/Corridor Source
P+R K+R Walk PT Other P+R K+R Walk PT Other P+R K+R Walk PT Other
Adelaide
Rail – Northern (1) 14.2 21.1 36.9 25.9 1.8 5.0 7.5 63.5 21.7 2.4
Rail – Southern (1) 17.0 11.1 56.0 14.6 1.3 5.1 4.2 80.4 9.1 1.2
Busway (O-Bahn) (2) 12.6 11.5 69.2 6.1 0.5 7.6 5.2 76.9 9.9 0.3
Bus – Northern (1) 0.7 5.6 82.9 10.1 0.7 0.7 1.2 86.0 10.9 0.6
Bus − S. Eastern (1) 2.4 7.3 67.2 22.6 0.4 2.4 2.4 83.6 11.2 0.5
Brisbane
Bus total – Northern (3) 3.4(5) 5.6(5) 81.5 9.1 0.5 2.5(5) 3.1(5) 71.7 22.0 0.6
Bus express – Northern (3) 4.9(5) 8.8 (5) 78.8 7.5 - 2.2(5) 5.4(5) 76.2 15.4 0.7
Bus stopping – Northern (3) 2.9(5) 4.6(5) 82.3 9.6 0.6 2.6(5) 2.5(5) 70.6 23.6 0.6
Perth
Rail – Total (12) 43
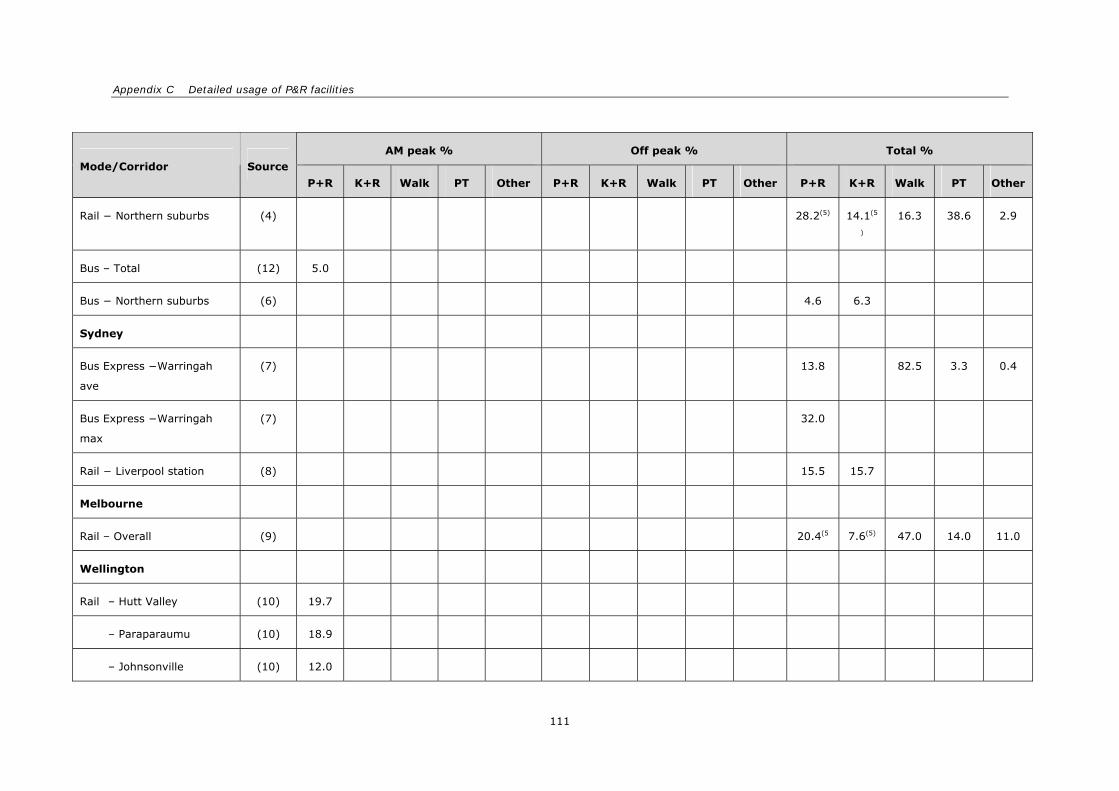
Appendix C Detailed usage of P&R facilities
111
AM peak % Off peak % Total % Mode/Corridor Source
P+R K+R Walk PT Other P+R K+R Walk PT Other P+R K+R Walk PT Other
Rail − Northern suburbs (4) 28.2(5) 14.1(5
)
16.3 38.6 2.9
Bus – Total (12) 5.0
Bus − Northern suburbs (6) 4.6 6.3
Sydney
Bus Express −Warringah
ave
(7) 13.8 82.5 3.3 0.4
Bus Express −Warringah
max
(7) 32.0
Rail − Liverpool station (8) 15.5 15.7
Melbourne
Rail – Overall (9) 20.4(5 7.6(5) 47.0 14.0 11.0
Wellington
Rail – Hutt Valley (10) 19.7
– Paraparaumu (10) 18.9
– Johnsonville (10) 12.0
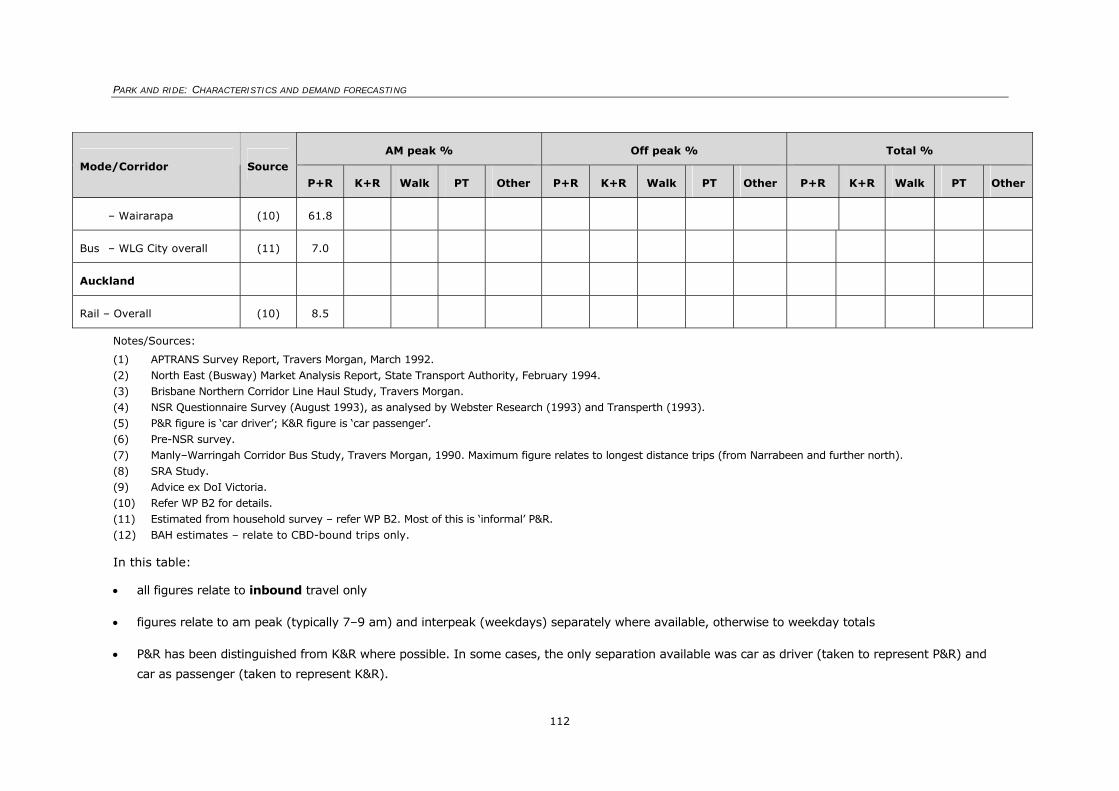
PARK AND RIDE: CHARACTERISTICS AND DEMAND FORECASTING
112
AM peak % Off peak % Total % Mode/Corridor Source
P+R K+R Walk PT Other P+R K+R Walk PT Other P+R K+R Walk PT Other
– Wairarapa (10) 61.8
Bus – WLG City overall (11) 7.0
Auckland
Rail – Overall (10) 8.5
Notes/Sources:
(1) APTRANS Survey Report, Travers Morgan, March 1992. (2) North East (Busway) Market Analysis Report, State Transport Authority, February 1994. (3) Brisbane Northern Corridor Line Haul Study, Travers Morgan. (4) NSR Questionnaire Survey (August 1993), as analysed by Webster Research (1993) and Transperth (1993). (5) P&R figure is ‘car driver’; K&R figure is ‘car passenger’. (6) Pre-NSR survey. (7) Manly–Warringah Corridor Bus Study, Travers Morgan, 1990. Maximum figure relates to longest distance trips (from Narrabeen and further north). (8) SRA Study. (9) Advice ex DoI Victoria. (10) Refer WP B2 for details. (11) Estimated from household survey – refer WP B2. Most of this is ‘informal’ P&R. (12) BAH estimates – relate to CBD-bound trips only.
In this table:
• all figures relate to inbound travel only
• figures relate to am peak (typically 7–9 am) and interpeak (weekdays) separately where available, otherwise to weekday totals
• P&R has been distinguished from K&R where possible. In some cases, the only separation available was car as driver (taken to represent P&R) and
car as passenger (taken to represent K&R).
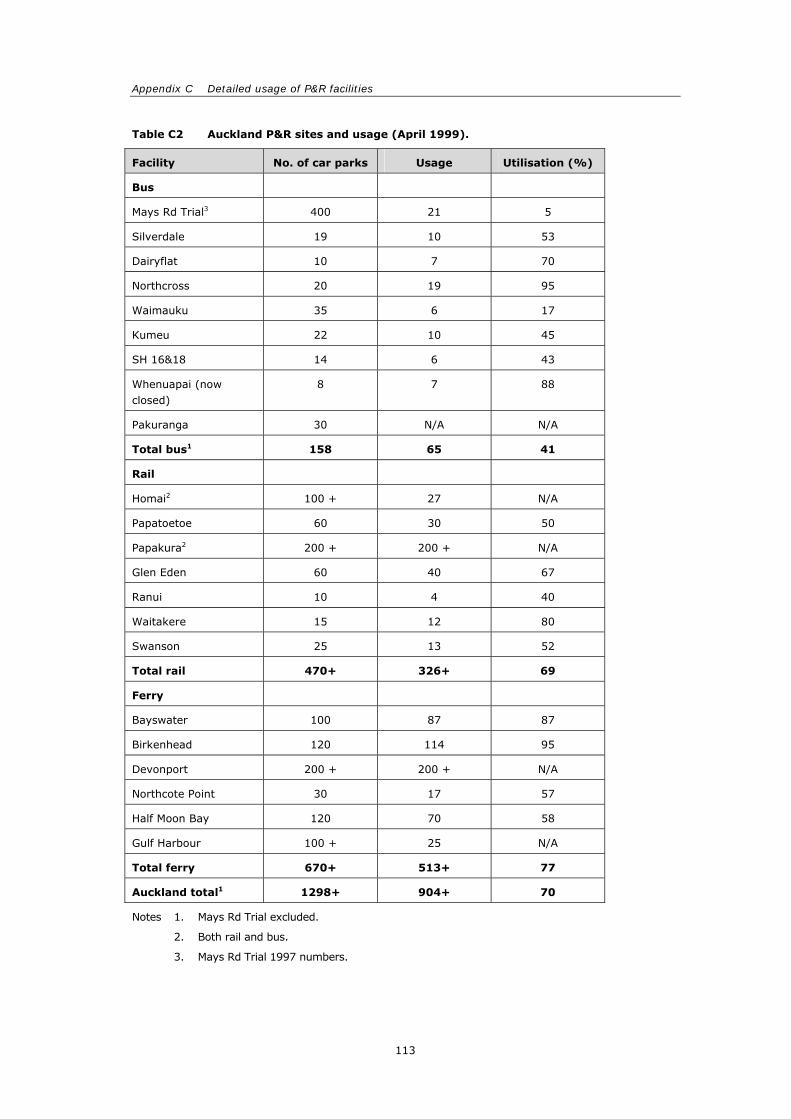
Appendix C Detailed usage of P&R facilities
113
Table C2 Auckland P&R sites and usage (April 1999).
Facility No. of car parks Usage Utilisation (%)
Bus
Mays Rd Trial3 400 21 5
Silverdale 19 10 53
Dairyflat 10 7 70
Northcross 20 19 95
Waimauku 35 6 17
Kumeu 22 10 45
SH 16&18 14 6 43
Whenuapai (now closed)
8 7 88
Pakuranga 30 N/A N/A
Total bus1 158 65 41
Rail
Homai2 100 + 27 N/A
Papatoetoe 60 30 50
Papakura2 200 + 200 + N/A
Glen Eden 60 40 67
Ranui 10 4 40
Waitakere 15 12 80
Swanson 25 13 52
Total rail 470+ 326+ 69
Ferry
Bayswater 100 87 87
Birkenhead 120 114 95
Devonport 200 + 200 + N/A
Northcote Point 30 17 57
Half Moon Bay 120 70 58
Gulf Harbour 100 + 25 N/A
Total ferry 670+ 513+ 77
Auckland total1 1298+ 904+ 70
Notes 1. Mays Rd Trial excluded.
2. Both rail and bus. 3. Mays Rd Trial 1997 numbers.
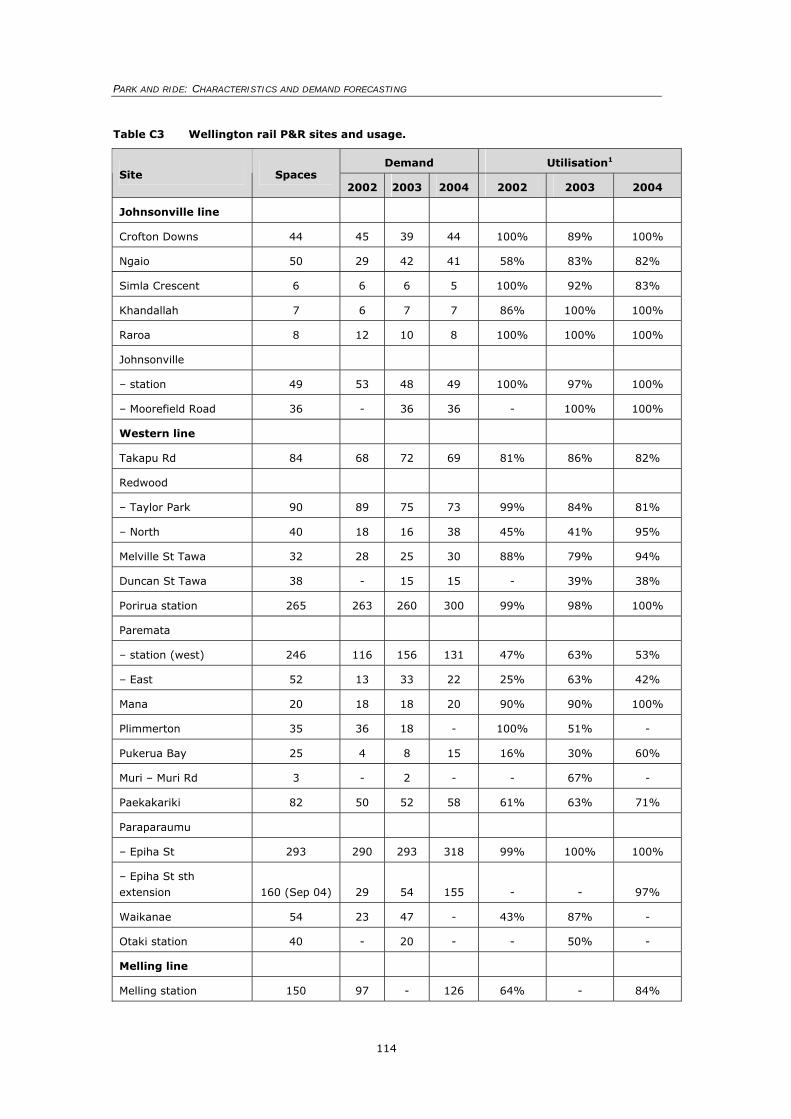
PARK AND RIDE: CHARACTERISTICS AND DEMAND FORECASTING
114
Table C3 Wellington rail P&R sites and usage.
Demand Utilisation1 Site Spaces
2002 2003 2004 2002 2003 2004
Johnsonville line
Crofton Downs 44 45 39 44 100% 89% 100%
Ngaio 50 29 42 41 58% 83% 82%
Simla Crescent 6 6 6 5 100% 92% 83%
Khandallah 7 6 7 7 86% 100% 100%
Raroa 8 12 10 8 100% 100% 100%
Johnsonville
– station 49 53 48 49 100% 97% 100%
– Moorefield Road 36 - 36 36 - 100% 100%
Western line
Takapu Rd 84 68 72 69 81% 86% 82%
Redwood
– Taylor Park 90 89 75 73 99% 84% 81%
– North 40 18 16 38 45% 41% 95%
Melville St Tawa 32 28 25 30 88% 79% 94%
Duncan St Tawa 38 - 15 15 - 39% 38%
Porirua station 265 263 260 300 99% 98% 100%
Paremata
– station (west) 246 116 156 131 47% 63% 53%
– East 52 13 33 22 25% 63% 42%
Mana 20 18 18 20 90% 90% 100%
Plimmerton 35 36 18 - 100% 51% -
Pukerua Bay 25 4 8 15 16% 30% 60%
Muri – Muri Rd 3 - 2 - - 67% -
Paekakariki 82 50 52 58 61% 63% 71%
Paraparaumu
– Epiha St 293 290 293 318 99% 100% 100%
– Epiha St sth extension 160 (Sep 04) 29 54 155 - - 97%
Waikanae 54 23 47 - 43% 87% -
Otaki station 40 - 20 - - 50% -
Melling line
Melling station 150 97 - 126 64% - 84%
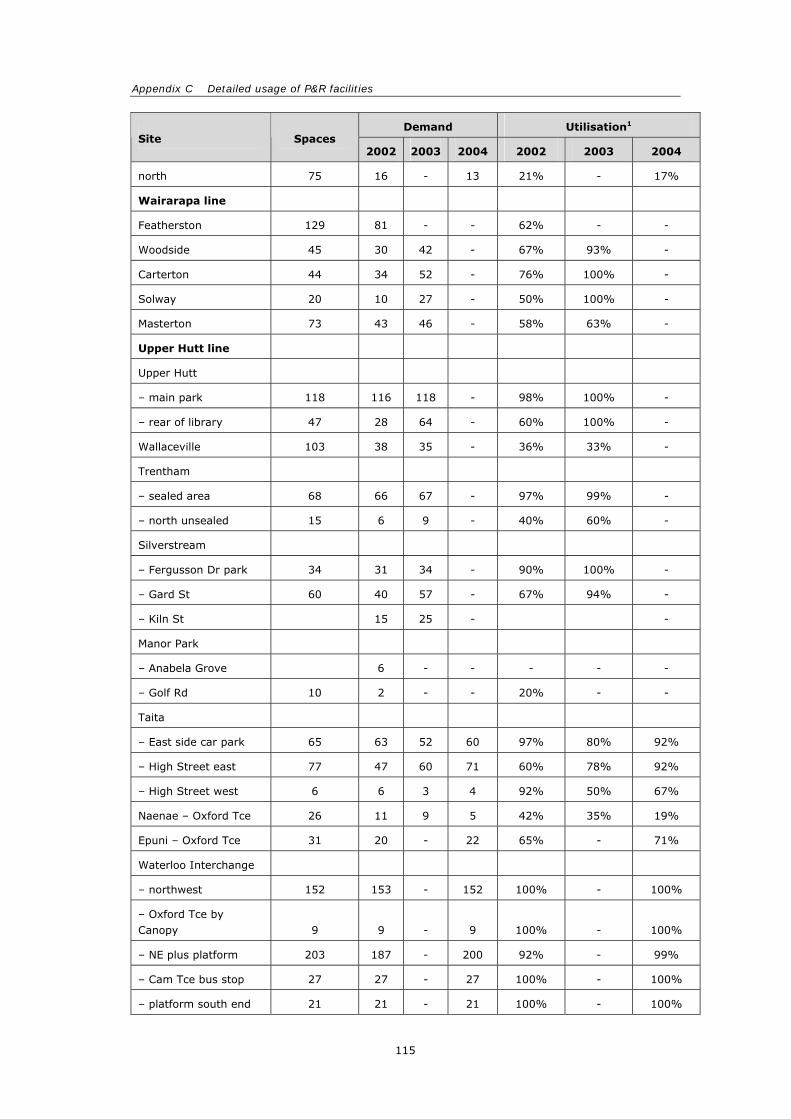
Appendix C Detailed usage of P&R facilities
115
Demand Utilisation1 Site Spaces
2002 2003 2004 2002 2003 2004
north 75 16 - 13 21% - 17%
Wairarapa line
Featherston 129 81 - - 62% - -
Woodside 45 30 42 - 67% 93% -
Carterton 44 34 52 - 76% 100% -
Solway 20 10 27 - 50% 100% -
Masterton 73 43 46 - 58% 63% -
Upper Hutt line
Upper Hutt
– main park 118 116 118 - 98% 100% -
– rear of library 47 28 64 - 60% 100% -
Wallaceville 103 38 35 - 36% 33% -
Trentham
– sealed area 68 66 67 - 97% 99% -
– north unsealed 15 6 9 - 40% 60% -
Silverstream
– Fergusson Dr park 34 31 34 - 90% 100% -
– Gard St 60 40 57 - 67% 94% -
– Kiln St 15 25 - -
Manor Park
– Anabela Grove 6 - - - - -
– Golf Rd 10 2 - - 20% - -
Taita
– East side car park 65 63 52 60 97% 80% 92%
– High Street east 77 47 60 71 60% 78% 92%
– High Street west 6 6 3 4 92% 50% 67%
Naenae – Oxford Tce 26 11 9 5 42% 35% 19%
Epuni – Oxford Tce 31 20 - 22 65% - 71%
Waterloo Interchange
– northwest 152 153 - 152 100% - 100%
– Oxford Tce by Canopy 9 9 - 9 100% - 100%
– NE plus platform 203 187 - 200 92% - 99%
– Cam Tce bus stop 27 27 - 27 100% - 100%
– platform south end 21 21 - 21 100% - 100%
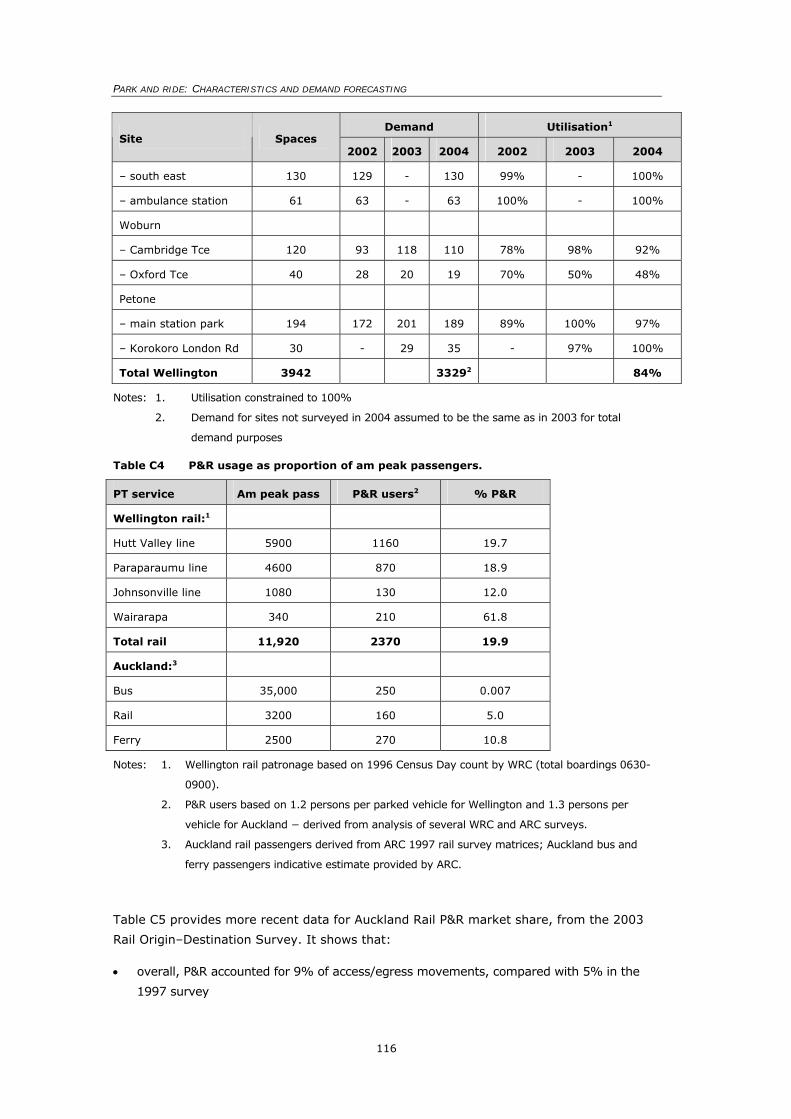
PARK AND RIDE: CHARACTERISTICS AND DEMAND FORECASTING
116
Demand Utilisation1 Site Spaces
2002 2003 2004 2002 2003 2004
– south east 130 129 - 130 99% - 100%
– ambulance station 61 63 - 63 100% - 100%
Woburn
– Cambridge Tce 120 93 118 110 78% 98% 92%
– Oxford Tce 40 28 20 19 70% 50% 48%
Petone
– main station park 194 172 201 189 89% 100% 97%
– Korokoro London Rd 30 - 29 35 - 97% 100%
Total Wellington 3942 33292 84%
Notes: 1. Utilisation constrained to 100%
2. Demand for sites not surveyed in 2004 assumed to be the same as in 2003 for total
demand purposes
Table C4 P&R usage as proportion of am peak passengers.
PT service Am peak pass P&R users2 % P&R
Wellington rail:1
Hutt Valley line 5900 1160 19.7
Paraparaumu line 4600 870 18.9
Johnsonville line 1080 130 12.0
Wairarapa 340 210 61.8
Total rail 11,920 2370 19.9
Auckland:3
Bus 35,000 250 0.007
Rail 3200 160 5.0
Ferry 2500 270 10.8
Notes: 1. Wellington rail patronage based on 1996 Census Day count by WRC (total boardings 0630-
0900).
2. P&R users based on 1.2 persons per parked vehicle for Wellington and 1.3 persons per
vehicle for Auckland − derived from analysis of several WRC and ARC surveys.
3. Auckland rail passengers derived from ARC 1997 rail survey matrices; Auckland bus and
ferry passengers indicative estimate provided by ARC.
Table C5 provides more recent data for Auckland Rail P&R market share, from the 2003
Rail Origin–Destination Survey. It shows that:
• overall, P&R accounted for 9% of access/egress movements, compared with 5% in the
1997 survey
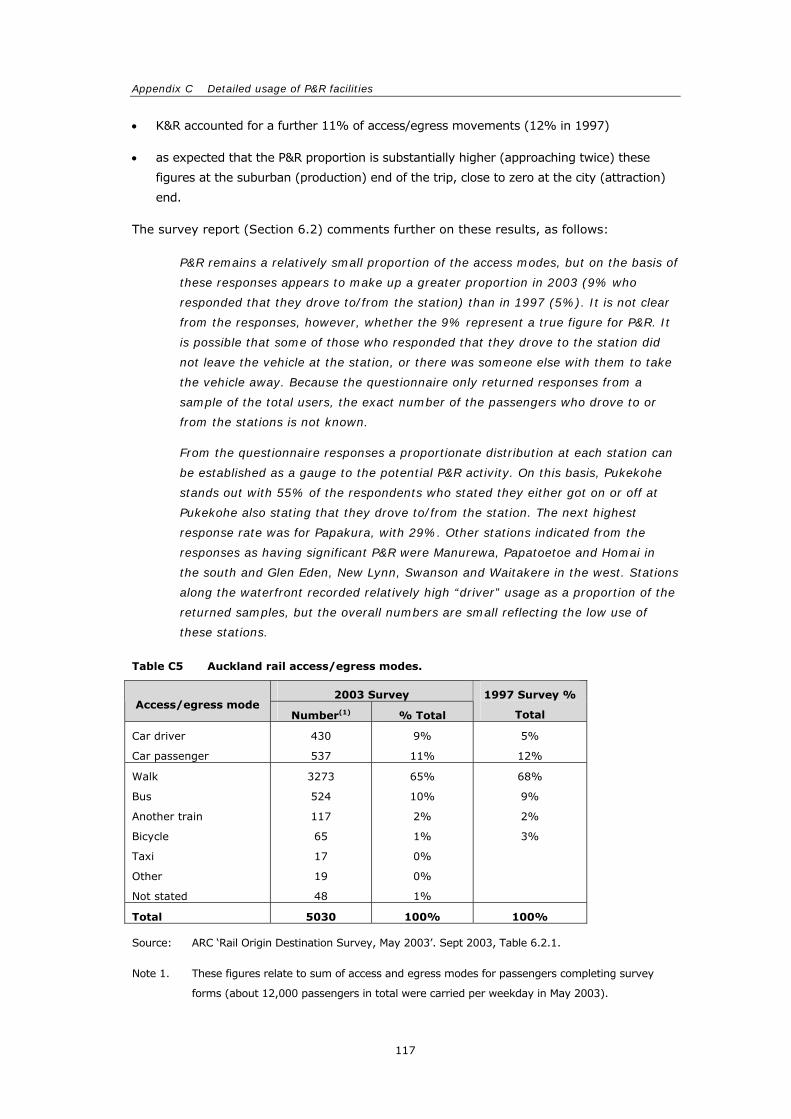
Appendix C Detailed usage of P&R facilities
117
• K&R accounted for a further 11% of access/egress movements (12% in 1997)
• as expected that the P&R proportion is substantially higher (approaching twice) these
figures at the suburban (production) end of the trip, close to zero at the city (attraction)
end.
The survey report (Section 6.2) comments further on these results, as follows:
P&R remains a relatively small proportion of the access modes, but on the basis of
these responses appears to make up a greater proportion in 2003 (9% who
responded that they drove to/from the station) than in 1997 (5%). It is not clear
from the responses, however, whether the 9% represent a true figure for P&R. It
is possible that some of those who responded that they drove to the station did
not leave the vehicle at the station, or there was someone else with them to take
the vehicle away. Because the questionnaire only returned responses from a
sample of the total users, the exact number of the passengers who drove to or
from the stations is not known.
From the questionnaire responses a proportionate distribution at each station can
be established as a gauge to the potential P&R activity. On this basis, Pukekohe
stands out with 55% of the respondents who stated they either got on or off at
Pukekohe also stating that they drove to/from the station. The next highest
response rate was for Papakura, with 29%. Other stations indicated from the
responses as having significant P&R were Manurewa, Papatoetoe and Homai in
the south and Glen Eden, New Lynn, Swanson and Waitakere in the west. Stations
along the waterfront recorded relatively high “driver” usage as a proportion of the
returned samples, but the overall numbers are small reflecting the low use of
these stations.
Table C5 Auckland rail access/egress modes.
2003 Survey Access/egress mode
Number(1) % Total
1997 Survey %
Total
Car driver
Car passenger
430
537
9%
11%
5%
12%
Walk
Bus
Another train
Bicycle
Taxi
Other
Not stated
3273
524
117
65
17
19
48
65%
10%
2%
1%
0%
0%
1%
68%
9%
2%
3%
Total 5030 100% 100%
Source: ARC ‘Rail Origin Destination Survey, May 2003’. Sept 2003, Table 6.2.1.
Note 1. These figures relate to sum of access and egress modes for passengers completing survey
forms (about 12,000 passengers in total were carried per weekday in May 2003).
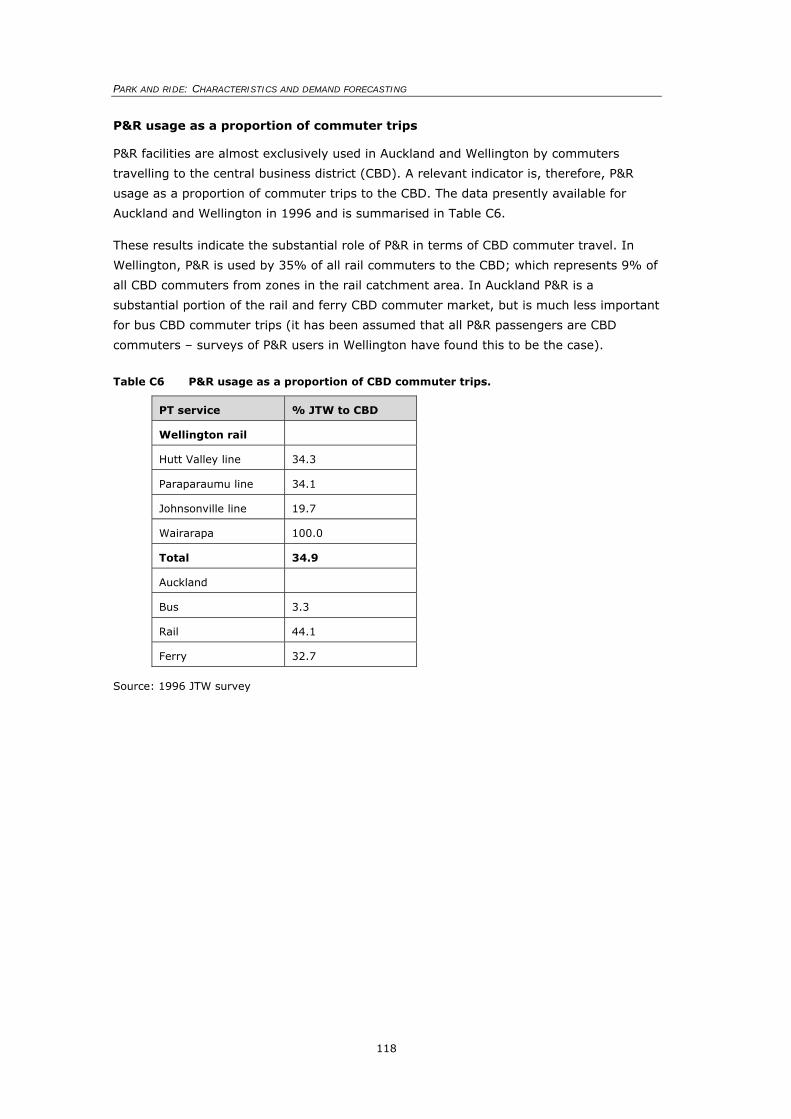
PARK AND RIDE: CHARACTERISTICS AND DEMAND FORECASTING
118
P&R usage as a proportion of commuter trips
P&R facilities are almost exclusively used in Auckland and Wellington by commuters
travelling to the central business district (CBD). A relevant indicator is, therefore, P&R
usage as a proportion of commuter trips to the CBD. The data presently available for
Auckland and Wellington in 1996 and is summarised in Table C6.
These results indicate the substantial role of P&R in terms of CBD commuter travel. In
Wellington, P&R is used by 35% of all rail commuters to the CBD; which represents 9% of
all CBD commuters from zones in the rail catchment area. In Auckland P&R is a
substantial portion of the rail and ferry CBD commuter market, but is much less important
for bus CBD commuter trips (it has been assumed that all P&R passengers are CBD
commuters – surveys of P&R users in Wellington have found this to be the case).
Table C6 P&R usage as a proportion of CBD commuter trips.
PT service % JTW to CBD
Wellington rail
Hutt Valley line 34.3
Paraparaumu line 34.1
Johnsonville line 19.7
Wairarapa 100.0
Total 34.9
Auckland
Bus 3.3
Rail 44.1
Ferry 32.7
Source: 1996 JTW survey
Appendix D New Zealand market research related to P&R
119
APPENDIX D New Zealand market research related to P&R
Wellington
Rather limited research into the characteristics and attitudes of P&R users in New Zealand
has been undertaken and most of this relates to Wellington. Travers Morgan carried out
(for WRC) two surveys of Hutt Valley rail P&R in 1994 and a survey of Wellington City
commuters in 1995. WRC has undertaken a more recent (2002) survey. The main
findings of these surveys relevant to this project are summarised below.
Hutt Valley P&R Survey (Travers Morgan NZ Ltd 1994)
In a 1994 study of P&R in the Hutt Valley for the WRC, Travers Morgan identified a similar
set of factors which impact on the demand for P&R facilities.
• Demand for P&R facilities is related to the availability and price of car parking at the
destination. Where parking is limited and expensive, demand for P&R facilities will be
higher. However, this will also depend on the availability and price of parking at the P&R
facility. In both Wellington and Auckland, P&R parking is free. In the Wellington CBD the
price of parking has been increasing over the last 10 years, particularly in regard to ‘fringe
parking’ (Wellington City Council introduced a coupon parking scheme in these areas in
1993). P&R usage has increased in Wellington over this period.
• To attract people making car-based trips to use P&R facilities, the level of service (LOS)
on the PT mode must be competitive with the car in terms of critical LOS features. One
important LOS feature is trip frequency. The effect of trip frequency on P&R usage has
been demonstrated in Wellington with the refocusing of Lower Hutt bus and train services
on the Waterloo interchange in 1989. Prior to this all the Wainuiomata bus services had
met the train at Woburn and all trains stopped there. With the advent of the Waterloo
interchange the Wainuiomata bus services were re-routed to Waterloo, and train services
were introduced from Upper Hutt which were express from Waterloo (ie did not stop at
Woburn). The service frequency at Waterloo, therefore, became nearly double that of
Woburn and the majority of the Woburn P&R users moved to Waterloo.
• The relative cost of the P&R/PT package against the cost of car travel and parking at the
destination affects the attractiveness of P&R to people making car-based trips. In both
Auckland and Wellington P&R users do not have to pay for parking and are only charged
the normal train fare. This should give P&R some cost advantage over private car travel to
the CBD (however, many workers have free or subsidised parking at/near their
workplace). Rail fare stages will also influence the relative usage of different P&R sites on
a rail line. This has been evident with the change in rail fares on the Hutt Valley line at
different times.
• The level of road congestion and the effect on journey time has an effect on the
attractiveness of the P&R package. This has been evident at Paraparaumu where P&R
PARK AND RIDE: CHARACTERISTICS AND DEMAND FORECASTING
120
usage has been increasing significantly over the last few years. Road congestion between
Paraparaumu and Wellington has gradually worsened, with roading developments planned
to alleviate it. As more P&R spaces are provided they are filled immediately, indicating a
latent demand which has not yet been satisfied (this increasing demand may also reflect
the increases in the commuter population living in the Kapiti area).
• Although not highlighted by Travers Morgan, evidence in Wellington over the last few
years points to the importance of car park security for potential users. For example,
usage at the Porirua facility had been running at around 100 vehicles for several years.
Security was not particularly good. Following several car break-ins the Police mounted a
surveillance program and apprehended the people responsible. Public perception of
security at Porirua has improved and usage has increased significantly.
Waterloo P&R Survey (1994)
A survey of users of the Waterloo Station car parks was carried out with the objectives of
gathering information about the characteristics of P&R users and determining the likely
response of Waterloo P&R users to different options for Waterloo P&R.
In terms of P&R user characteristics, nearly all users were travelling to work, made use of
the car parks three or more times a week and were predominantly in the 25 to 59 age
group. Convenience, quicker journey time and environmental reasons were the main
reasons for using the train.
Users were asked to indicate their likely action under four different options. The response
can be summarised as follows:
• Option 1 – $2/day parking charge at Waterloo. This option was strongly opposed,
with only 16% of respondents indicating they would continue to park at Waterloo. Most
people indicated they would either park at another station (31%), walk/cycle to the train
(18%), or travel to Wellington by car (15%).
• Option 2 – Extra 200 m walk to platform. This option would discourage a significant
number of present users from parking at Waterloo (69% would continue at Waterloo).
Most of those switching from Waterloo would park at another station.
• Option 3 – Improved bus service. A significant number of present users (14%)
indicated they would switch to the bus as their access mode to the train under this option.
• Option 4 – Express trains also stop at Woburn/Naenae. A large number of present
users indicated they would switch to park at another station under this option. The
majority would be likely to use Woburn rather than Naenae.
Waterloo Telephone Survey (1994)
A random telephone survey of people travelling from the 'wider Waterloo area' to the
Wellington central city area was carried out to assist in evaluating P&R alternatives for
Waterloo and to provide data for analysis of other Hutt Valley corridor P&R issues.
Appendix D New Zealand market research related to P&R
121
Respondents were asked to indicate what they would have done for their trip to Wellington
under several different scenarios. The main conclusions were:
• New P&R users at Waterloo attracted by the availability of extra car parks would primarily
be current train users. Around half of those parking at stations other than Waterloo would
switch to Waterloo if parking was assured and around 15% of train users with a car
available (half of all train passengers) would also become P&R users at Waterloo.
• The parking charge option would have the greatest effect in causing present P&R users to
transfer from Waterloo, with the majority parking at other stations. Both the improved
bus service options and express trains stopping at Woburn/Naenae would result in up to
15% of present users switching from P&R at Waterloo.
• Very few motor vehicle users (less than 1%) would switch to using the train if extra parks
were available at Waterloo or improvements were made to all station car parks.
These results are consistent with the understanding that most motor vehicle users do not
use the train for convenience-related reasons and significant improvements to the total PT
system are required to attract these people. Providing a P&R facility, even one of a high
quality, will on its own attract few motor vehicle users out of their cars on to PT.
Another aspect of this survey involved asking existing train users to rank different car
park features in terms of importance. Good security and good lighting received the
highest rankings, followed by a short walk to the platform.
Waterloo ‘After’ Survey (2000)
Following the extension of the Waterloo P&R facility, users of the new facility were surveyed
as to their previous travel behaviour. The findings were:
• 10% previously drove all the way into Wellington CBD
• 75% previously parked their car elsewhere in the vicinity of Waterloo
• the remainder either parked at another station or accessed the station by non-car mode.
Wellington City Bus P&R Survey (Travers Morgan NZ Ltd 1995)
In 1995, Travers Morgan carried out a random survey of people travelling from three
selected areas to work in the Wellington central city area before 9 am weekdays.
Respondents were asked a number of questions regarding their attitude towards P&R
facilities associated with bus services. They were also asked to indicate the likelihood of
using a specific P&R car park in their area. The response was gathered for both motor
vehicle users and bus users who normally have a car available for their trip to work. The
results are summarised below.
Existing bus users
• Nearly all bus users walk to the bus stop, with only a very small number taking their car
to the bus stop and parking at the stop (6.7%).
PARK AND RIDE: CHARACTERISTICS AND DEMAND FORECASTING
122
• The majority of bus users surveyed had a motor vehicle available for their most recent
trip to work (65% of bus users) and nearly all of these had it available to them as a driver
(90% of this group).
• The most common reasons for those people who had a motor vehicle available and chose
to travel by bus were no parking at their destination (34% of this group) and convenience
(33%).
• Only a very small number of those with a vehicle available indicated they would be
‘almost certain’ to use the proposed P&R facility in their area (3.7%), with the great
majority (84%) stating they would be ‘not likely’ to use it.
Non-bus users (ie all respondents who did not travel by bus on their most recent trip).
• Over half (55%) of the respondents who made their most recent trip to work by motor
vehicle indicated they did not use the bus at all for their travel to work. However, 9%
used the bus at least once a week and a further 10% used the bus at least once a month.
• The main reason for not using the bus was convenience which related primarily to the
need for the car during the day, the greater flexibility of the car, and the relative ease of
travel (eg don’t have to walk to bus, better in bad weather, less waiting time). The next
highest reason was travel time, which related to the shorter journey time of car versus
bus.
• A significant proportion (43%) of motor vehicle users parked in employer-provided
parking. This group would be very unlikely to switch to bus unless there was a change in
their personal circumstances. Such a change would be if the car park was not available.
In this case 64% of motor vehicle users indicated they would switch to bus for their trip to
work.
• Non-bus users were asked to indicate how likely it would be that they would use the bus
under six different bus service scenarios:
– existing fares halved
– more frequent bus service (every five minutes)
– bus stop very close to your house
– bus stop very close to your work
– express services to city centre
– P&R facility available (no other change)
– P&R facility available, bus frequency every five minutes, express service
available.
• The most attractive single improvement for non-bus users appeared to be instituting
express services. This reflected the importance of journey time for commuters. Simply
providing a P&R facility on its own was the least attractive improvement.
Appendix D New Zealand market research related to P&R
123
• Motor vehicle users were asked how likely they would be to use a specific proposed new
P&R facility. Only 2.7% indicated they would be almost certain to use the proposed new
car park. The majority (66%) stated that they would not be likely to use it at all.
Birdwood Street Bus P&R Survey (1999)
A survey of users of the Birdwood Street (Karori) car park was undertaken by Booz Allen
for the WCC in May 1999. 31 cars used the car park: 16 survey forms were handed out
and 13 returned (post-paid).
Relevant results include the following:
• Reasons for use of bus. Most common reasons for use of the bus rather than driving all
the way were: cheaper (33%), lack of parking at destination (31%).
• Reasons for use of facility. Main reasons given for use of the P&R facility rather than
parking elsewhere on the Karori bus route were the greater service frequency, and the
lack of car parks elsewhere. 12 of the 13 respondents had available a closer bus service
to their home; but preferred to catch the bus from the P&R facility because of higher
frequency, faster trip, more convenient times etc.
• Reasons for driving to site. People drove to the P&R site (rather than walk or be
dropped off) because it was too far or too long to walk and no one was available to drop
them off.
• Prior travel mode. Prior to the opening of the facility, about 30% of respondents drove
all the way and 30% walked to their nearest bus stop. For the 17 respondents, eight
made additional bus trips, with five making shorter bus trips; while five long (to CBD) car
trips were replaced by 13 short (local) car trips.
• Alternative travel mode. If the P&R facility were no longer available, 19% said they
would drive all the way, 31% would walk to their nearest bus stop and 50% would drive
to another location and take the bus.
• Desired facility improvements. The main suggested improvements to the P&R facility
were increased capacity and additional lighting.
WRC P&R Survey (2002)
A survey of P&R users was carried out by the WRC one morning in April 2002, covering
1362 P&R users and all rail P&R car parks throughout the region. Of the respondents,
95.4% were travelling from home to work, 1.3% going to education and 0.8% to
recreation. Thus, nearly all current P&R users are commuters.
Also, 97.4% of respondents were travelling to Wellington station, with 77.5% using the
P&R car park five times a week and 14.1% three or four times a week. The P&R users
came from high car-owning households with 51.8% having two cars in their household
and 15.6% with three or more cars.
Respondents were also asked what they would do if the P&R car park they were using on
that day was not available to them. Of those who replied, 62.1% indicated they would
PARK AND RIDE: CHARACTERISTICS AND DEMAND FORECASTING
124
park on the street nearby, 11.4% would park at another rail station and 8% would drive
all the way to their destination (18.5% did not answer this question).
Summary of Wellington market research studies
The main findings from the P&R studies summarised above were:
• nearly all rail P&R users are commuters travelling to Wellington CBD
• most rail P&R users make use of the P&R car park 3–5 days a week.
• the level of rail service at a station affects the number of P&R users at that station
• only a very small proportion of motor vehicle users would be likely to switch to P&R if
additional P&R car parks were available, or improvements were made to the car parks
(less than 1% of motor vehicle users in the 1994 Waterloo telephone survey and 2.7% of
motor vehicle users in the 1995 Bus P&R survey
• some informal bus P&R is currently occurring in Wellington City (1995 survey found 6.7%
of bus users were P&R; this proportion may have increased with the advent of coupon
parking)
• 34% of bus users who had a car at home took the bus because of no parking at their
destination
• 43% of motor vehicle users in the 1995 survey parked in employer-provided parking and
64% of these users indicated they would switch to bus if a car park was not available
• the WRC 2002 P&R survey found that 8% of current P&R users would drive all the way to
their destination if their current P&R car park was not available (rather than park on the
street or park at another station).
Auckland
The ‘Northern Busway Station Survey – Albany and Constellation Express Services’ was
conducted by the ARTA in April 2006, around five months after the opening of the
Northern Busway. The survey collected information on the catchment of the busway
stations, the CBD catchment area, the modal shift before and after the opening of the
busway and modes of access.
In terms of P&R users of the busway, it was found they comprised around 57% of people
surveyed at Albany station (52% drove alone, 5% drove with a passenger) and 35% of
people surveyed at Constellation station (33% drove alone, 2% drove with a passenger).
The catchment for P&R users of Albany station (further away from the CBD) was much
larger than Constellation, with 16% of P&R users travelling from as far north as the
Hibiscus Coast and Kauakapaka. A similar pattern is seen at Constellation station,
reinforcing the fact that people are prepared to drive a significant distance to access PT
services when quality services are provided. There is also evidence of some passengers
driving against the direction of travel over shorter distances to access the site.
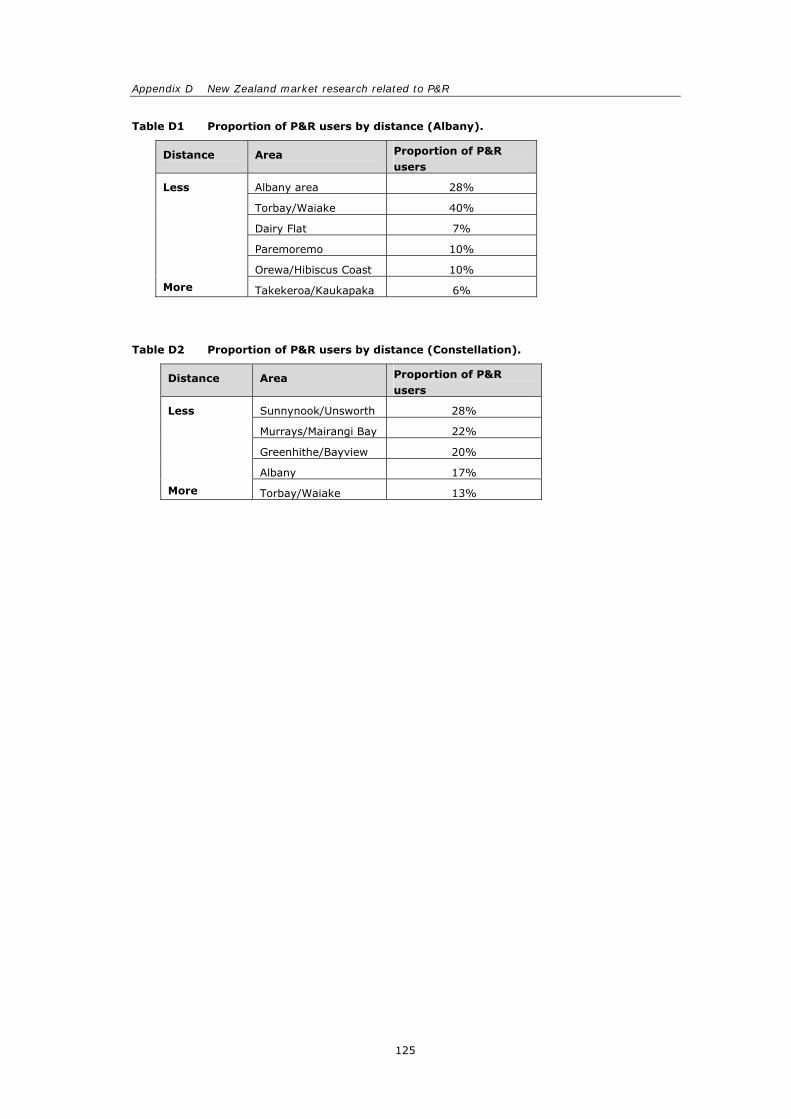
Appendix D New Zealand market research related to P&R
125
Table D1 Proportion of P&R users by distance (Albany).
Distance Area Proportion of P&R users
Albany area 28%
Torbay/Waiake 40%
Dairy Flat 7%
Paremoremo 10%
Orewa/Hibiscus Coast 10%
Less
More Takekeroa/Kaukapaka 6%
Table D2 Proportion of P&R users by distance (Constellation).
Distance Area Proportion of P&R users
Sunnynook/Unsworth 28%
Murrays/Mairangi Bay 22%
Greenhithe/Bayview 20%
Albany 17%
Less
More Torbay/Waiake 13%
PARK AND RIDE: CHARACTERISTICS AND DEMAND FORECASTING
126
APPENDIX E Trial stated preference survey of P&R usage
Survey methodology
The survey used software developed in Excel to examine peoples’ choices between their
current mode of travel and next best alternative (NBA) given a series of costs (time and
monetary), with the purpose of developing values of time for the cost components. The
modes considered for the study were ‘car all the way’ (car), ‘car then train’ (P&R) and
‘walk/bus then train’ (PT). Bus all the way users were excluded due to the lack of bus P&R
sites in Wellington. Component cost values were gathered on users’ current and NBA
mode of transport. These costs were then varied using a 9 or 16 showcard orthogonal
design (depending on the mode combination chosen), with the respondent choosing
between their current and NBA. The first showcard represented their current and NBA
situations as given.
Recruiting the interviewing was conducted by the TNS research company. Recruitment
was done via random telephone calls in areas of Wellington broadly served by the rail
network, with a series of filtering questions defining the market as people:
• leaving home between 7 am and 9 am
• travelling to the Wellington CBD
• living within areas that were rail accessible
• whose current mode or NBA was P&R
• who were not car or PT captive
• who paid for either their car fuel or parking costs (excluded where they paid for neither,
as unlikely to change).
Other demographic information was gathered of respondents to allow for rescaling of
survey results, although this was optional. Respondents were given the option of having
the survey conducted in their own home or at a central CBD location. An incentive in
terms of a prize draw was also offered.
Pilot survey recruitment
A pilot survey was conducted of 53 completed interviews. It became apparent through the
recruitment process that response rates were going to be extremely low. This was partly
due to some recruitment occurring during school holidays when families were more likely
to be away from their homes – this contributed to a large proportion of ‘no answer calls’.
Finding households that had a member who travelled to the Wellington CBD in the
morning peak was also a difficult task. The following table gives response rates of around
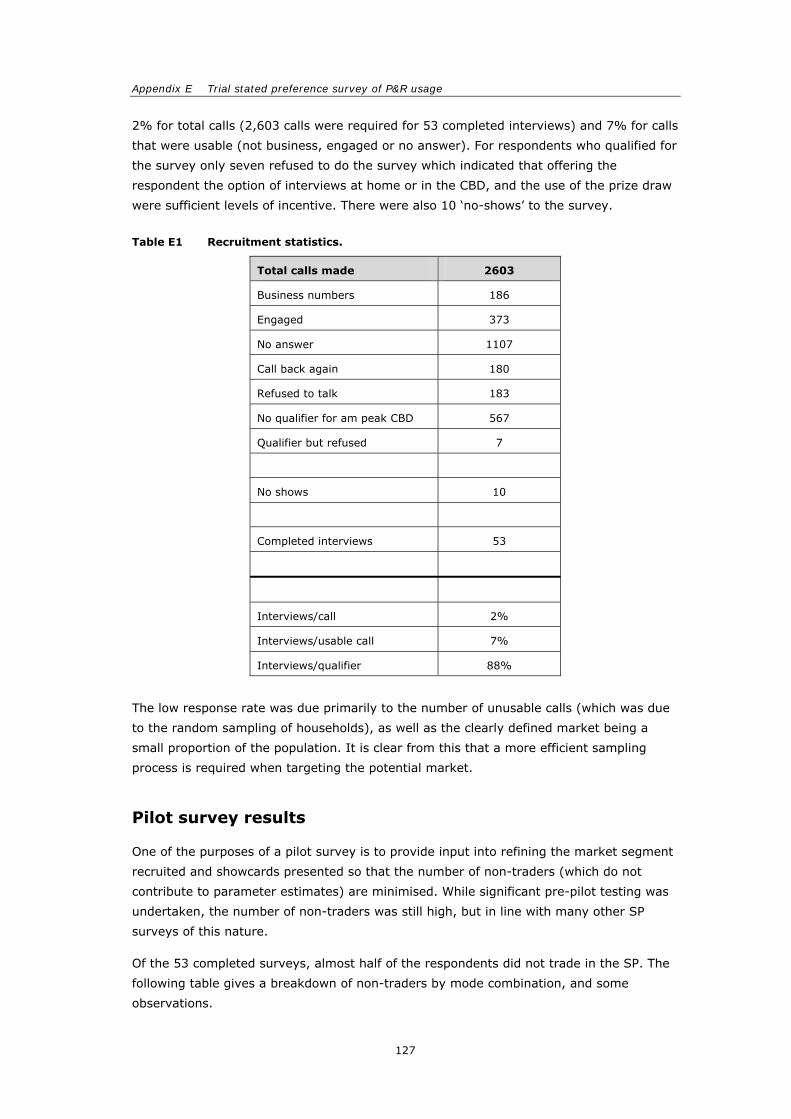
Appendix E Trial stated preference survey of P&R usage
127
2% for total calls (2,603 calls were required for 53 completed interviews) and 7% for calls
that were usable (not business, engaged or no answer). For respondents who qualified for
the survey only seven refused to do the survey which indicated that offering the
respondent the option of interviews at home or in the CBD, and the use of the prize draw
were sufficient levels of incentive. There were also 10 ‘no-shows’ to the survey.
Table E1 Recruitment statistics.
Total calls made 2603
Business numbers 186
Engaged 373
No answer 1107
Call back again 180
Refused to talk 183
No qualifier for am peak CBD 567
Qualifier but refused 7
No shows 10
Completed interviews 53
Interviews/call 2%
Interviews/usable call 7%
Interviews/qualifier 88%
The low response rate was due primarily to the number of unusable calls (which was due
to the random sampling of households), as well as the clearly defined market being a
small proportion of the population. It is clear from this that a more efficient sampling
process is required when targeting the potential market.
Pilot survey results
One of the purposes of a pilot survey is to provide input into refining the market segment
recruited and showcards presented so that the number of non-traders (which do not
contribute to parameter estimates) are minimised. While significant pre-pilot testing was
undertaken, the number of non-traders was still high, but in line with many other SP
surveys of this nature.
Of the 53 completed surveys, almost half of the respondents did not trade in the SP. The
following table gives a breakdown of non-traders by mode combination, and some
observations.
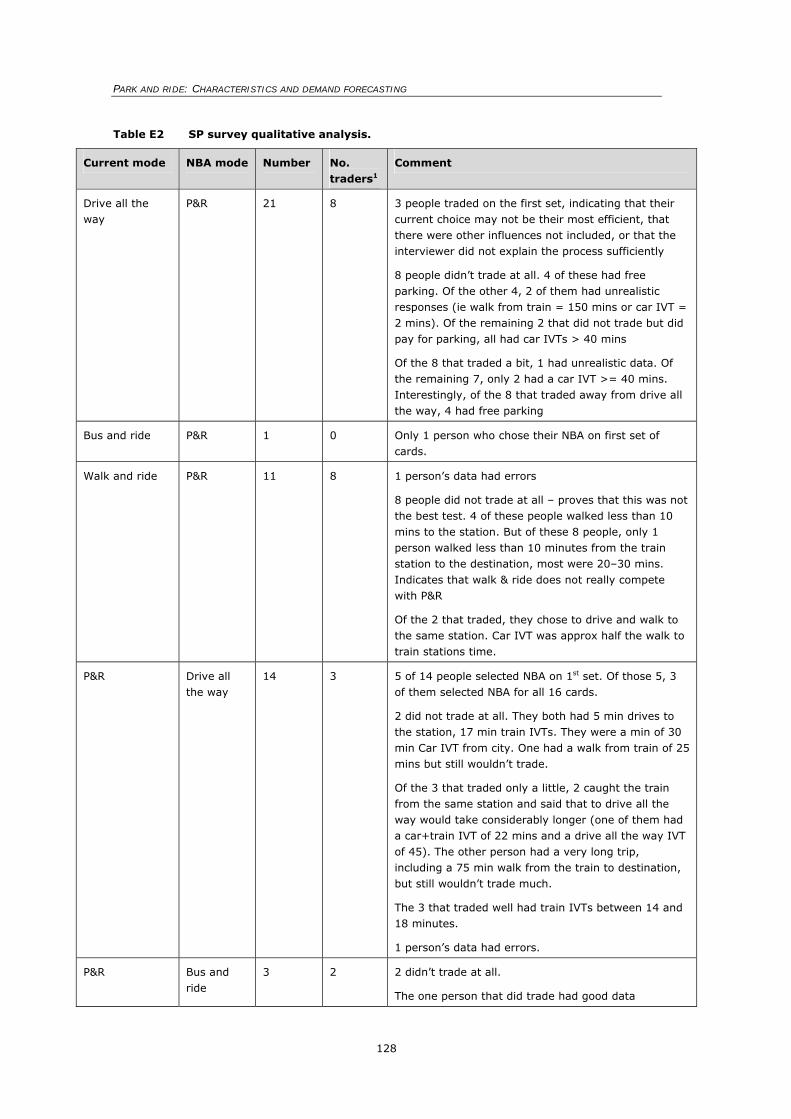
PARK AND RIDE: CHARACTERISTICS AND DEMAND FORECASTING
128
Table E2 SP survey qualitative analysis.
Current mode NBA mode Number No. traders1
Comment
Drive all the way
P&R 21 8 3 people traded on the first set, indicating that their current choice may not be their most efficient, that there were other influences not included, or that the interviewer did not explain the process sufficiently
8 people didn’t trade at all. 4 of these had free parking. Of the other 4, 2 of them had unrealistic responses (ie walk from train = 150 mins or car IVT = 2 mins). Of the remaining 2 that did not trade but did pay for parking, all had car IVTs > 40 mins
Of the 8 that traded a bit, 1 had unrealistic data. Of the remaining 7, only 2 had a car IVT >= 40 mins. Interestingly, of the 8 that traded away from drive all the way, 4 had free parking
Bus and ride P&R 1 0 Only 1 person who chose their NBA on first set of cards.
Walk and ride P&R 11 8 1 person’s data had errors
8 people did not trade at all – proves that this was not the best test. 4 of these people walked less than 10 mins to the station. But of these 8 people, only 1 person walked less than 10 minutes from the train station to the destination, most were 20–30 mins. Indicates that walk & ride does not really compete with P&R
Of the 2 that traded, they chose to drive and walk to the same station. Car IVT was approx half the walk to train stations time.
P&R Drive all the way
14 3 5 of 14 people selected NBA on 1st set. Of those 5, 3 of them selected NBA for all 16 cards.
2 did not trade at all. They both had 5 min drives to the station, 17 min train IVTs. They were a min of 30 min Car IVT from city. One had a walk from train of 25 mins but still wouldn’t trade.
Of the 3 that traded only a little, 2 caught the train from the same station and said that to drive all the way would take considerably longer (one of them had a car+train IVT of 22 mins and a drive all the way IVT of 45). The other person had a very long trip, including a 75 min walk from the train to destination, but still wouldn’t trade much.
The 3 that traded well had train IVTs between 14 and 18 minutes.
1 person’s data had errors.
P&R Bus and ride
3 2 2 didn’t trade at all.
The one person that did trade had good data
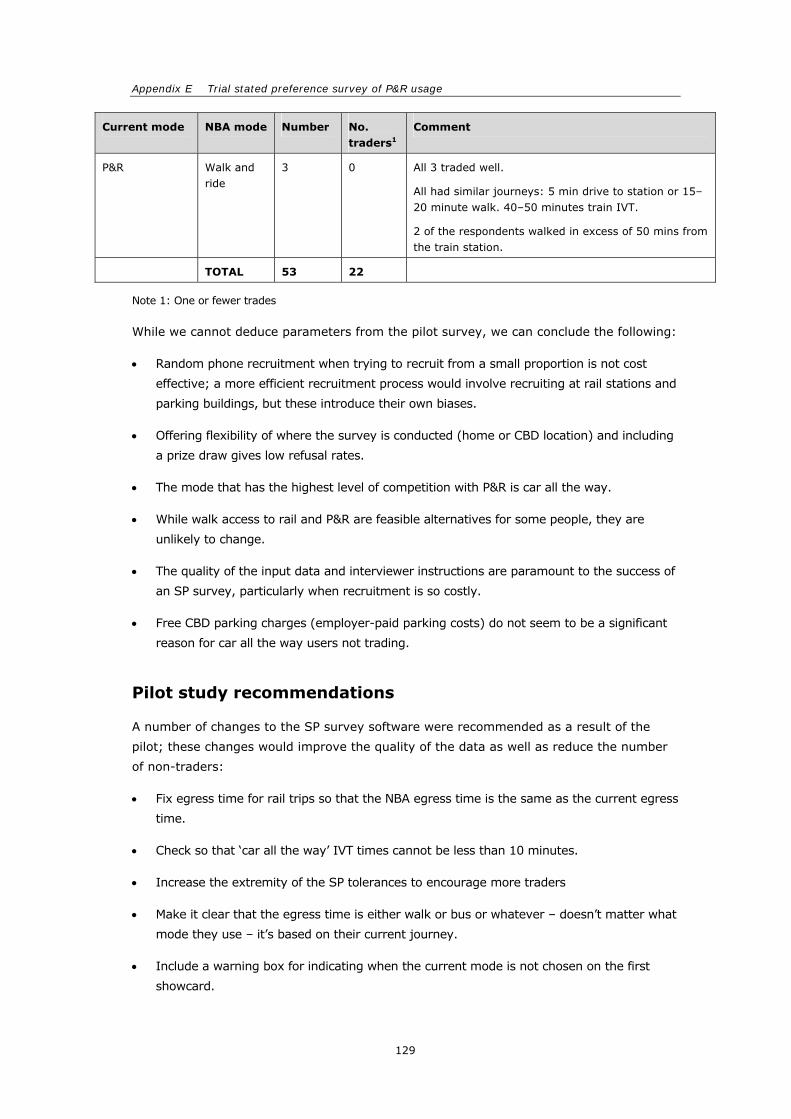
Appendix E Trial stated preference survey of P&R usage
129
Current mode NBA mode Number No. traders1
Comment
P&R Walk and ride
3 0 All 3 traded well.
All had similar journeys: 5 min drive to station or 15–20 minute walk. 40–50 minutes train IVT.
2 of the respondents walked in excess of 50 mins from the train station.
TOTAL 53 22
Note 1: One or fewer trades
While we cannot deduce parameters from the pilot survey, we can conclude the following:
• Random phone recruitment when trying to recruit from a small proportion is not cost
effective; a more efficient recruitment process would involve recruiting at rail stations and
parking buildings, but these introduce their own biases.
• Offering flexibility of where the survey is conducted (home or CBD location) and including
a prize draw gives low refusal rates.
• The mode that has the highest level of competition with P&R is car all the way.
• While walk access to rail and P&R are feasible alternatives for some people, they are
unlikely to change.
• The quality of the input data and interviewer instructions are paramount to the success of
an SP survey, particularly when recruitment is so costly.
• Free CBD parking charges (employer-paid parking costs) do not seem to be a significant
reason for car all the way users not trading.
Pilot study recommendations
A number of changes to the SP survey software were recommended as a result of the
pilot; these changes would improve the quality of the data as well as reduce the number
of non-traders:
• Fix egress time for rail trips so that the NBA egress time is the same as the current egress
time.
• Check so that ‘car all the way’ IVT times cannot be less than 10 minutes.
• Increase the extremity of the SP tolerances to encourage more traders
• Make it clear that the egress time is either walk or bus or whatever – doesn’t matter what
mode they use – it’s based on their current journey.
• Include a warning box for indicating when the current mode is not chosen on the first
showcard.
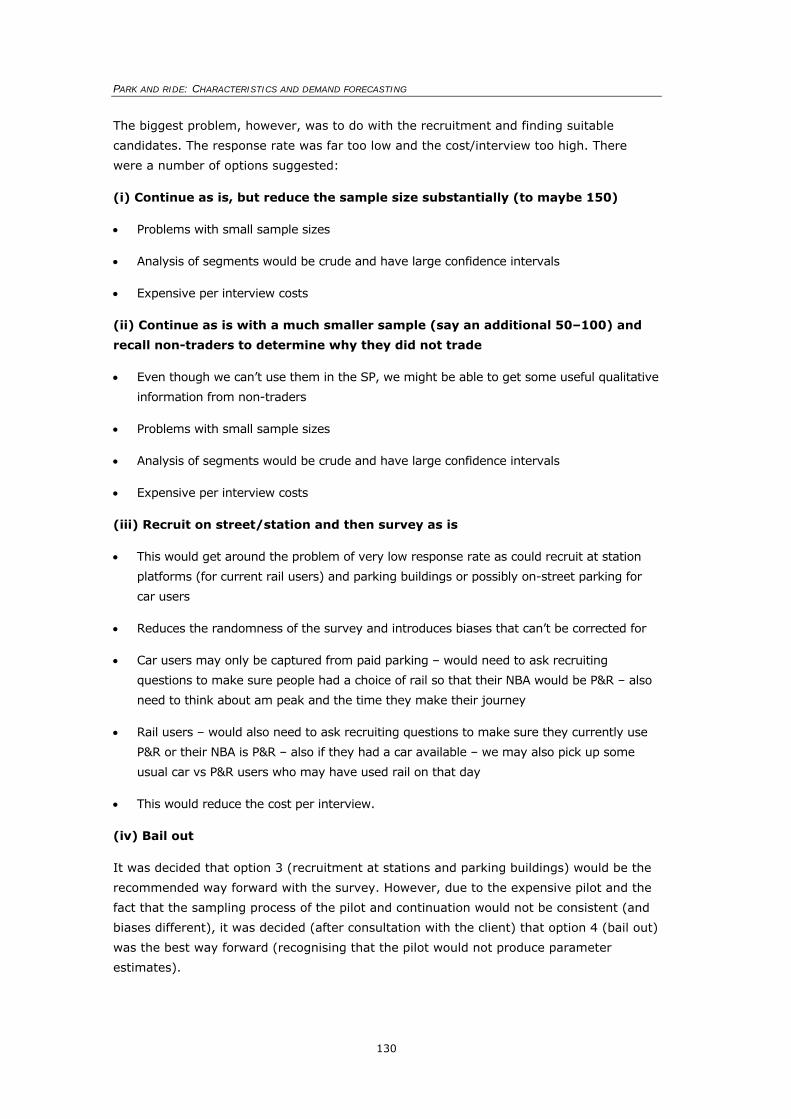
PARK AND RIDE: CHARACTERISTICS AND DEMAND FORECASTING
130
The biggest problem, however, was to do with the recruitment and finding suitable
candidates. The response rate was far too low and the cost/interview too high. There
were a number of options suggested:
(i) Continue as is, but reduce the sample size substantially (to maybe 150)
• Problems with small sample sizes
• Analysis of segments would be crude and have large confidence intervals
• Expensive per interview costs
(ii) Continue as is with a much smaller sample (say an additional 50–100) and
recall non-traders to determine why they did not trade
• Even though we can’t use them in the SP, we might be able to get some useful qualitative
information from non-traders
• Problems with small sample sizes
• Analysis of segments would be crude and have large confidence intervals
• Expensive per interview costs
(iii) Recruit on street/station and then survey as is
• This would get around the problem of very low response rate as could recruit at station
platforms (for current rail users) and parking buildings or possibly on-street parking for
car users
• Reduces the randomness of the survey and introduces biases that can’t be corrected for
• Car users may only be captured from paid parking – would need to ask recruiting
questions to make sure people had a choice of rail so that their NBA would be P&R – also
need to think about am peak and the time they make their journey
• Rail users – would also need to ask recruiting questions to make sure they currently use
P&R or their NBA is P&R – also if they had a car available – we may also pick up some
usual car vs P&R users who may have used rail on that day
• This would reduce the cost per interview.
(iv) Bail out
It was decided that option 3 (recruitment at stations and parking buildings) would be the
recommended way forward with the survey. However, due to the expensive pilot and the
fact that the sampling process of the pilot and continuation would not be consistent (and
biases different), it was decided (after consultation with the client) that option 4 (bail out)
was the best way forward (recognising that the pilot would not produce parameter
estimates).
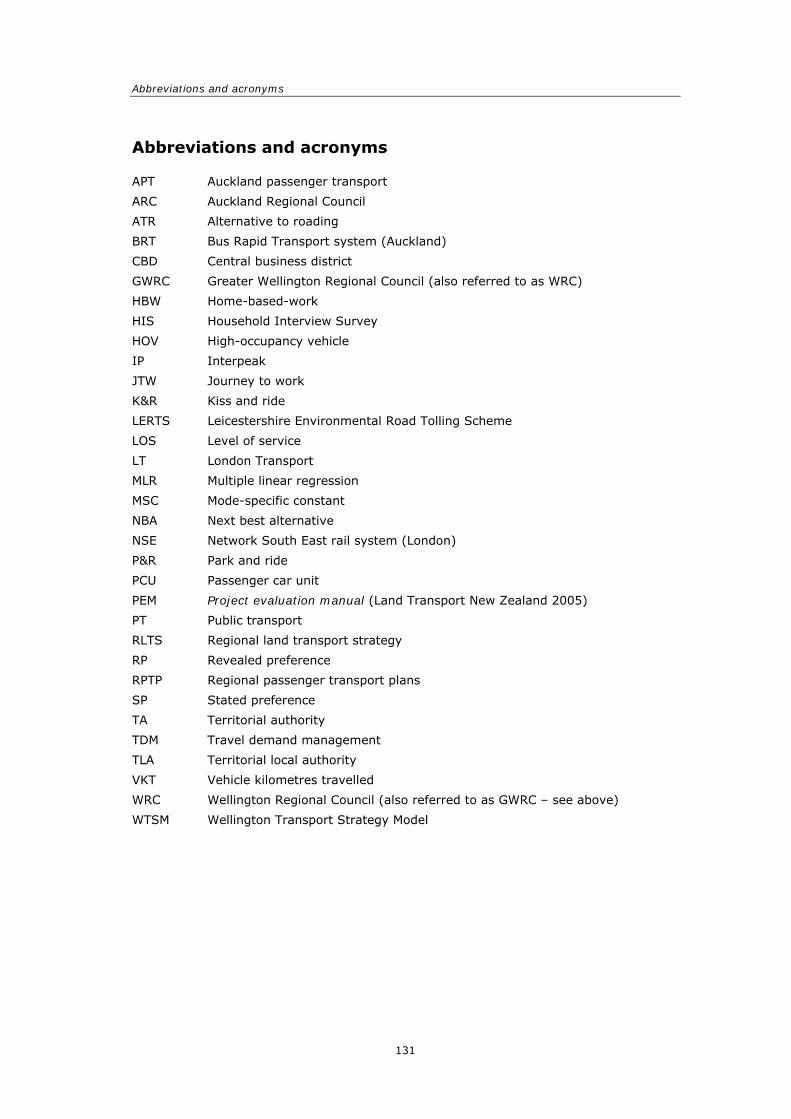
Abbreviations and acronyms
131
Abbreviations and acronyms
APT Auckland passenger transport
ARC Auckland Regional Council
ATR Alternative to roading
BRT Bus Rapid Transport system (Auckland)
CBD Central business district
GWRC Greater Wellington Regional Council (also referred to as WRC)
HBW Home-based-work
HIS Household Interview Survey
HOV High-occupancy vehicle
IP Interpeak
JTW Journey to work
K&R Kiss and ride
LERTS Leicestershire Environmental Road Tolling Scheme
LOS Level of service
LT London Transport
MLR Multiple linear regression
MSC Mode-specific constant
NBA Next best alternative
NSE Network South East rail system (London)
P&R Park and ride
PCU Passenger car unit
PEM Project evaluation manual (Land Transport New Zealand 2005)
PT Public transport
RLTS Regional land transport strategy
RP Revealed preference
RPTP Regional passenger transport plans
SP Stated preference
TA Territorial authority
TDM Travel demand management
TLA Territorial local authority
VKT Vehicle kilometres travelled
WRC Wellington Regional Council (also referred to as GWRC – see above)
WTSM Wellington Transport Strategy Model

PARK AND RIDE: CHARACTERISTICS AND DEMAND FORECASTING
132