Embed Size (px)
Citation preview
Preliminary Results
U.S. Department of CommerceNational Oceanic and Atmospheric Administration
National Marine Fisheries Service
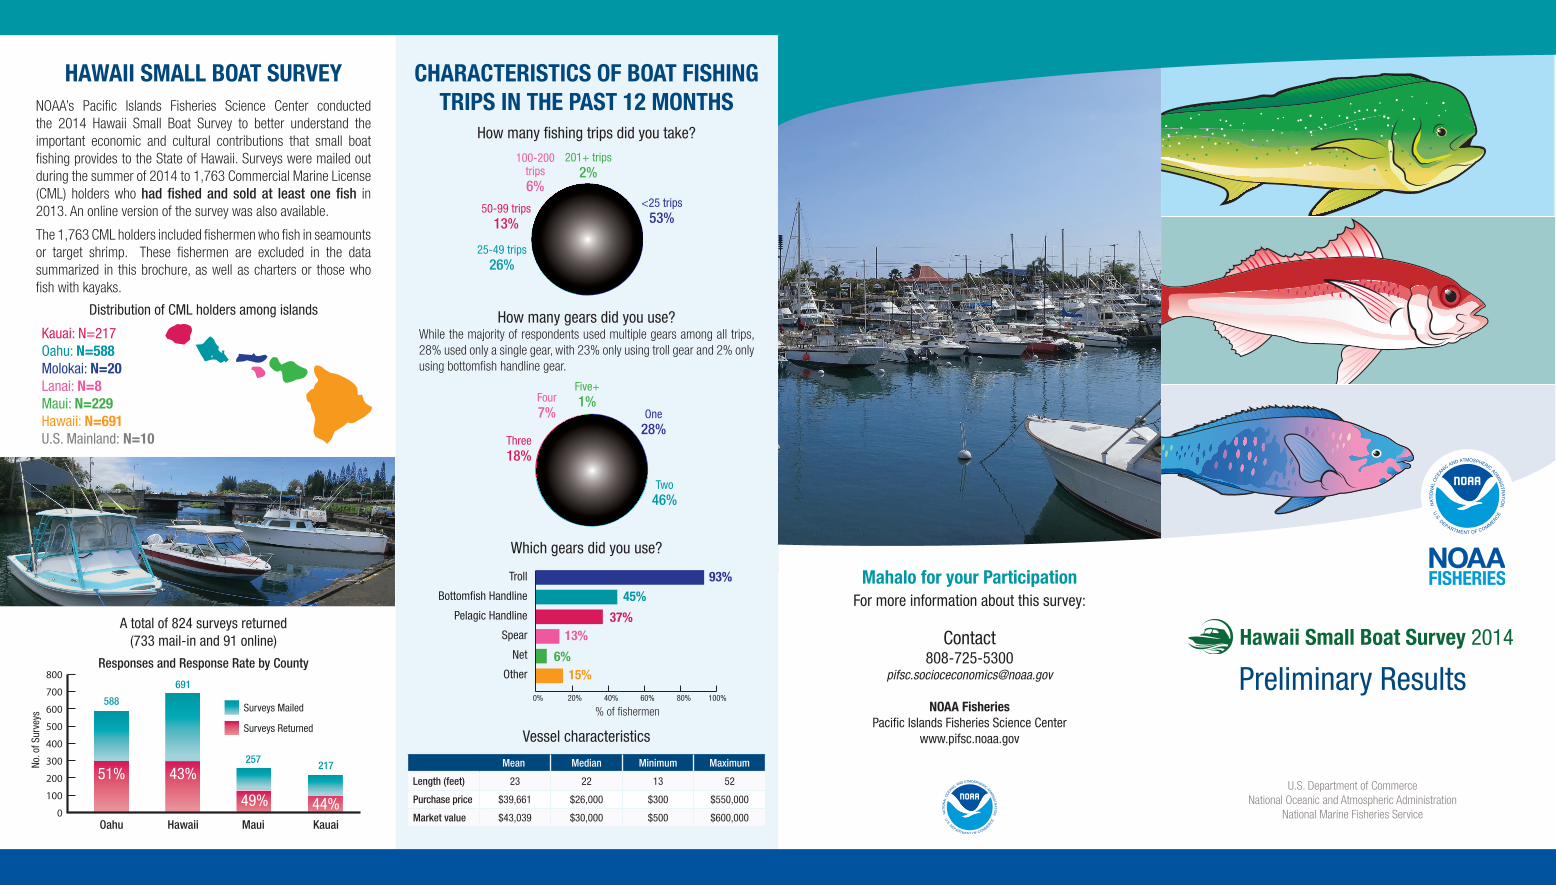
Mahalo for your ParticipationFor more information about this survey:
Contact808-725-5300
NOAA FisheriesPacific Islands Fisheries Science Center
www.pifsc.noaa.gov
How many fishing trips did you take?
Which gears did you use?
Vessel characteristics
Mean Median Minimum Maximum
Length (feet) 23 22 13 52
Purchase price $39,661 $26,000 $300 $550,000
Market value $43,039 $30,000 $500 $600,000
How many gears did you use?While the majority of respondents used multiple gears among all trips, 28% used only a single gear, with 23% only using troll gear and 2% only using bottomfish handline gear.
Distribution of CML holders among islands
A total of 824 surveys returned (733 mail-in and 91 online)
Responses and Response Rate by County
HAWAII SMALL BOAT SURVEYNOAA’s Pacific Islands Fisheries Science Center conducted the 2014 Hawaii Small Boat Survey to better understand the important economic and cultural contributions that small boat fishing provides to the State of Hawaii. Surveys were mailed out during the summer of 2014 to 1,763 Commercial Marine License (CML) holders who had fished and sold at least one fish in 2013. An online version of the survey was also available.
The 1,763 CML holders included fishermen who fish in seamounts or target shrimp. These fishermen are excluded in the data summarized in this brochure, as well as charters or those who fish with kayaks.
CHARACTERISTICS OF BOAT FISHING TRIPS IN THE PAST 12 MONTHS
Hawaii Small Boat Survey 2014
<25 trips53%
201+ trips2%
100-200trips6%
50-99 trips13%
25-49 trips26%
Troll
Bottomfish Handline
Pelagic Handline
Net
Spear
Other
% of fishermen0% 20% 40% 60% 80% 100%
Kauai: N=217Oahu: N=588Molokai: N=20Lanai: N=8Maui: N=229Hawaii: N=691U.S. Mainland: N=10
Oahu
588
No. o
f Sur
veys
Hawaii
691
Maui
257
Kauai
217
0
100
200
300
400
500
600
700
800
Surveys Returned
Surveys Mailed
51% 43%
49% 44%
One28%
Five+ 1%Four
7%
Three18%
Two46%
93%45%
37%
6%
13%
15%
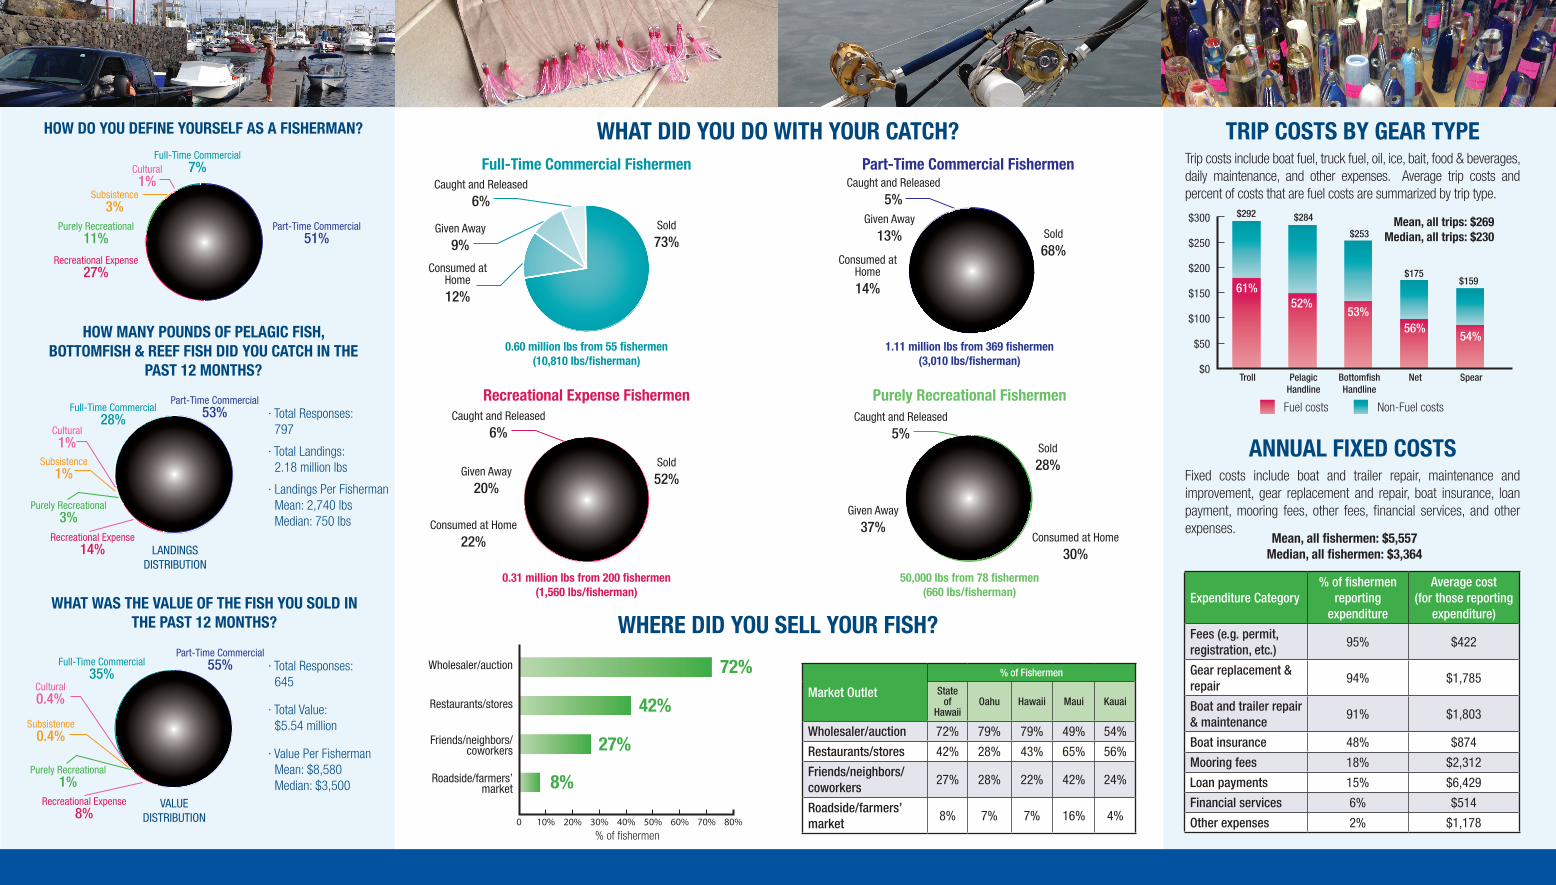
Caught and released
Sold
73%Sold
68%Consumed at
Home
12%
Consumed at Home
14%
Given Away
9%
Given Away
13%
72%
42%
27%
8%
Caught and Released
6%Caught and Released
5%
Part-Time Commercial51%
Part-Time Commercial53%
Part-Time Commercial55%
Full-Time Commercial7%
Full-Time Commercial28%
Full-Time Commercial35%
Cultural1%
Cultural1%
Cultural0.4%
Subsistence3%
Subsistence1%
Subsistence0.4%
Purely Recreational11%
Purely Recreational3%
Purely Recreational1%
Recreational Expense27%
Recreational Expense14%
Recreational Expense8%
Sold
52%
Sold
28%
Consumed at Home
22% Consumed at Home
30%
Given Away
20%
Given Away
37%
Caught and Released
6%Caught and Released
5%
Fuel costs Non-Fuel costs· Total Responses: 797
· Total Landings: 2.18 million lbs
· Landings Per Fisherman Mean: 2,740 lbs Median: 750 lbs
· Total Responses: 645
· Total Value: $5.54 million
· Value Per Fisherman Mean: $8,580 Median: $3,500
LANDINGSDISTRIBUTION
VALUEDISTRIBUTION
WHAT DID YOU DO WITH YOUR CATCH? TRIP COSTS BY GEAR TYPE
ANNUAL FIXED COSTS
HOW DO YOU DEFINE YOURSELF AS A FISHERMAN?
HOW MANY POUNDS OF PELAGIC FISH, BOTTOMFISH & REEF FISH DID YOU CATCH IN THE
PAST 12 MONTHS?
WHAT WAS THE VALUE OF THE FISH YOU SOLD IN THE PAST 12 MONTHS?
Full-Time Commercial Fishermen
0.60 million lbs from 55 fishermen(10,810 lbs/fisherman)
0.31 million lbs from 200 fishermen(1,560 lbs/fisherman)
1.11 million lbs from 369 fishermen(3,010 lbs/fisherman)
50,000 lbs from 78 fishermen(660 lbs/fisherman)
Recreational Expense Fishermen
Part-Time Commercial Fishermen
Purely Recreational Fishermen
Trip costs include boat fuel, truck fuel, oil, ice, bait, food & beverages, daily maintenance, and other expenses. Average trip costs and percent of costs that are fuel costs are summarized by trip type.
Fixed costs include boat and trailer repair, maintenance and improvement, gear replacement and repair, boat insurance, loan payment, mooring fees, other fees, financial services, and other expenses.
Mean, all trips: $269Median, all trips: $230
Mean, all fishermen: $5,557Median, all fishermen: $3,364
Troll
$292
Pelagic Handline
$284
BottomfishHandline
$253
Net
$175
Spear
$159
Expenditure Category% of fishermen
reporting expenditure
Average cost (for those reporting
expenditure)
Fees (e.g. permit, registration, etc.)
95% $422
Gear replacement &repair
94% $1,785
Boat and trailer repair & maintenance
91% $1,803
Boat insurance 48% $874
Mooring fees 18% $2,312
Loan payments 15% $6,429
Financial services 6% $514
Other expenses 2% $1,178
WHERE DID YOU SELL YOUR FISH?
Wholesaler/auction
Roadside/farmers’ market
% of fishermen
Restaurants/stores
Friends/neighbors/coworkers
Market Outlet
% of Fishermen
State of
HawaiiOahu Hawaii Maui Kauai
Wholesaler/auction 72% 79% 79% 49% 54%
Restaurants/stores 42% 28% 43% 65% 56%
Friends/neighbors/coworkers
27% 28% 22% 42% 24%
Roadside/farmers’ market
8% 7% 7% 16% 4%
61%52%
53%56%
54%
$300
$250
$200
$150
$100
$50
$0