Embed Size (px)
Citation preview
Naval Research Laboratory Washington, DC 20375-5320
NRL/MR/5306--16-9654
Characteristics of an Optical Delay Linefor Radar Testing
April 12, 2016
Approved for public release; distribution is unlimited.
Mai T. Ngo
AEGIS Coordinator OfficeRadar Division
JiMMy alaTishe sukoMalTalapaTra
Surveillance Technology BranchRadar Division
i
REPORT DOCUMENTATION PAGE Form ApprovedOMB No. 0704-0188
3. DATES COVERED (From - To)
Standard Form 298 (Rev. 8-98)Prescribed by ANSI Std. Z39.18
Public reporting burden for this collection of information is estimated to average 1 hour per response, including the time for reviewing instructions, searching existing data sources, gathering and maintaining the data needed, and completing and reviewing this collection of information. Send comments regarding this burden estimate or any other aspect of this collection of information, including suggestions for reducing this burden to Department of Defense, Washington Headquarters Services, Directorate for Information Operations and Reports (0704-0188), 1215 Jefferson Davis Highway, Suite 1204, Arlington, VA 22202-4302. Respondents should be aware that notwithstanding any other provision of law, no person shall be subject to any penalty for failing to comply with a collection of information if it does not display a currently valid OMB control number. PLEASE DO NOT RETURN YOUR FORM TO THE ABOVE ADDRESS.
5a. CONTRACT NUMBER
5b. GRANT NUMBER
5c. PROGRAM ELEMENT NUMBER
5d. PROJECT NUMBER
5e. TASK NUMBER
5f. WORK UNIT NUMBER
2. REPORT TYPE1. REPORT DATE (DD-MM-YYYY)
4. TITLE AND SUBTITLE
6. AUTHOR(S)
8. PERFORMING ORGANIZATION REPORT NUMBER
7. PERFORMING ORGANIZATION NAME(S) AND ADDRESS(ES)
10. SPONSOR / MONITOR’S ACRONYM(S)9. SPONSORING / MONITORING AGENCY NAME(S) AND ADDRESS(ES)
11. SPONSOR / MONITOR’S REPORT NUMBER(S)
12. DISTRIBUTION / AVAILABILITY STATEMENT
13. SUPPLEMENTARY NOTES
14. ABSTRACT
15. SUBJECT TERMS
16. SECURITY CLASSIFICATION OF:
a. REPORT
19a. NAME OF RESPONSIBLE PERSON
19b. TELEPHONE NUMBER (include areacode)
b. ABSTRACT c. THIS PAGE
18. NUMBEROF PAGES
17. LIMITATIONOF ABSTRACT
Characteristics of an Optical Delay Line for Radar Testing
Mai T. Ngo, Jimmy Alatishe, and Sukomal Talapatra
Naval Research Laboratory4555 Overlook Avenue, SWWashington, DC 20375-5320
NRL/MR/5306--16-9654
NAVSEA
Approved for public release; distribution is unlimited.
Unclassified Unclassified UnclassifiedUnclassifiedUnlimited
14
Mai Ngo
(202) 767-0253
The Naval Research Laboratory has conducted a systems characterization study of an RF Optical Delay Line Link pertinent to radar applications. In this report, we describe the RF performance characteristics of a Miteq fiber-optical delay line, a commercial product from Miteq. The radar system parameters investigated were: small signal gain, 1 dB gain compression point, input/output Third Order intercept, and Phase Noise.
12-04-2016 Memorandum Report
Optical delay lineRadar
Phase noiseClutter attenuation
1 October 2014 – 30 September 2015
4721
2913
Naval Sea Systems CommandWashington Navy Yard1333 Isaac Hull Avenue, SEWashington, DC 20376
0603271N

Table of Contents
1 INTRODUCTION ........................................................................................................ 1
2 MANUFACTURER PERFORMANCE MEASUREMENT ....................................... 2
3 NRL PERFORMANCE MEASUREMENT ................................................................ 4
3.1 Input vs. Output Power Characteristics ................................................................. 4
3.2 Dynamic Range ..................................................................................................... 6
3.3 Two-Tone Frequency Characteristic – Third-Order-Intercept (TOI) ................... 7
3.4 Phase Noise Measurement .................................................................................... 9
4 SUMMARY................................................................................................................ 11
ACKNOWLEDGEMENT ...................................................................................................... 12
REFERENCES ....................................................................................................................... 12
iii
1
CHARACTERISTICS OF AN OPTICAL DELAY LINE FOR RADAR TESTING
1 INTRODUCTION Fiber-optic delay lines (FODLs) exhibit many unique properties important to radar applications
such as wide radio frequency (RF) bandwidth, low signal loss, compact and light weight, and highly resistant to electromagnetic interference. Fiber-based delay lines have a constant delay versus frequency, are immune to vibration, and do not radiate energy that may interfere with the operation of other electrical devices, or allow unauthorized detection. In addition, integrity of the signals can be preserved travelling through long FODLs in comparison to long RF coaxial cables. Furthermore, for practical purposes FODL systems are a preferred choice in providing bench-top capabilities of replicating radar ranges used in radar applications, eliminating outdoor testing and developing, and thus minimizing cost, complexity and effort. Fiber cable provides longer time delay, approximately 6 nanoseconds/meter compared to about 4.5 nanoseconds/meter for traditional coaxial cable. All of these features are essential for radar testing applications. The basic principle of a FODL is simple – the RF signal is converted to an optical signal and transmitted over a fiber optical link to the optical receiver. The receiver converts the optical signal back to RF signal; thus, faithfully reproducing the original RF waveform with time delayed.
The Naval Research Laboratory has conducted a systems characterization study of an RF Optical Delay Line Link pertinent to radar applications. In this report, we describe the RF performance characteristics of a Miteq fiber-optical delay line, a commercial product from Miteq. The radar system parameters investigated were: small signal gain, 1-dB gain compression point, input/output Third-Order intercept, and phase noise.
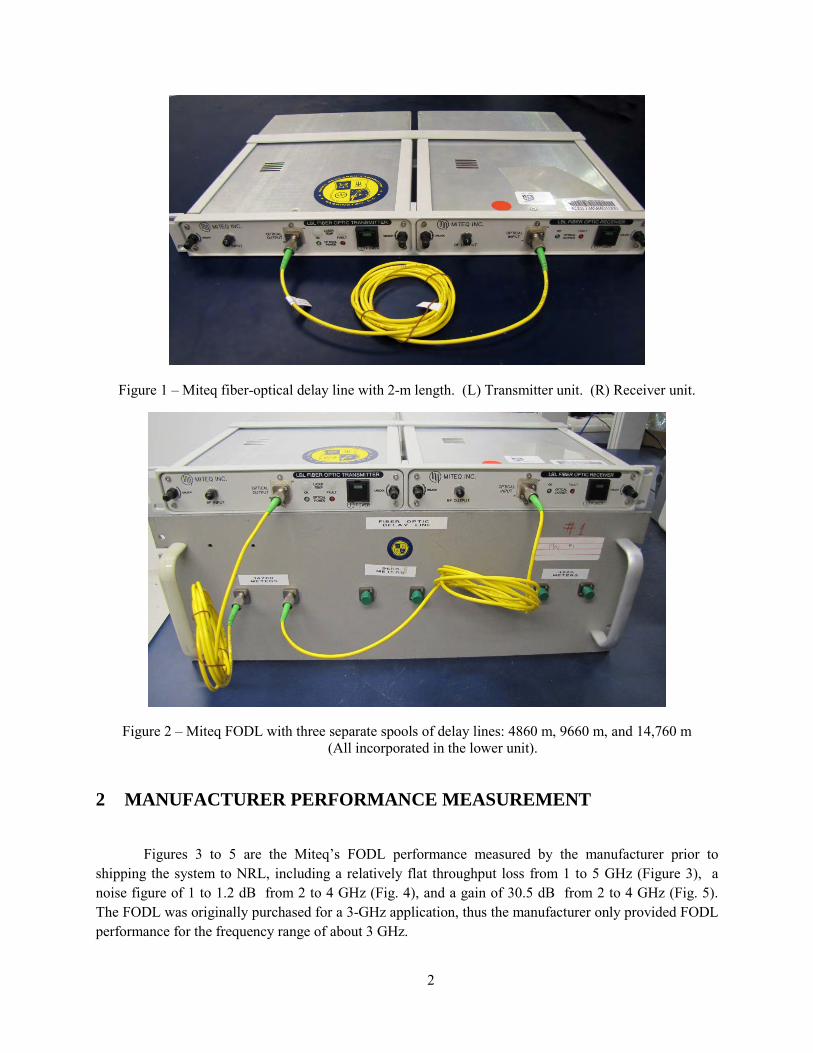
Figure 1 is the Miteq FODL system, including the transmitter unit on the left, 2-m fiber-optical delay line (in yellow), and the receiver unit on the right. The RF input signal is connected to the RF input port of the transmitter unit, and RF output signal is from the RF output port of the receiver unit. Figure 2 shows the Miteq FODL system with three separate lengths of fiber: 4860 m, 9660 m, and 14,760 m, all incorporated in the lower unit. These delay lines can be added together with short jumper fiber for longer delays.
________________Manuscript approved February 24, 2016.
2
Figure 1 – Miteq fiber-optical delay line with 2-m length. (L) Transmitter unit. (R) Receiver unit.
Figure 2 – Miteq FODL with three separate spools of delay lines: 4860 m, 9660 m, and 14,760 m (All incorporated in the lower unit).
2 MANUFACTURER PERFORMANCE MEASUREMENT
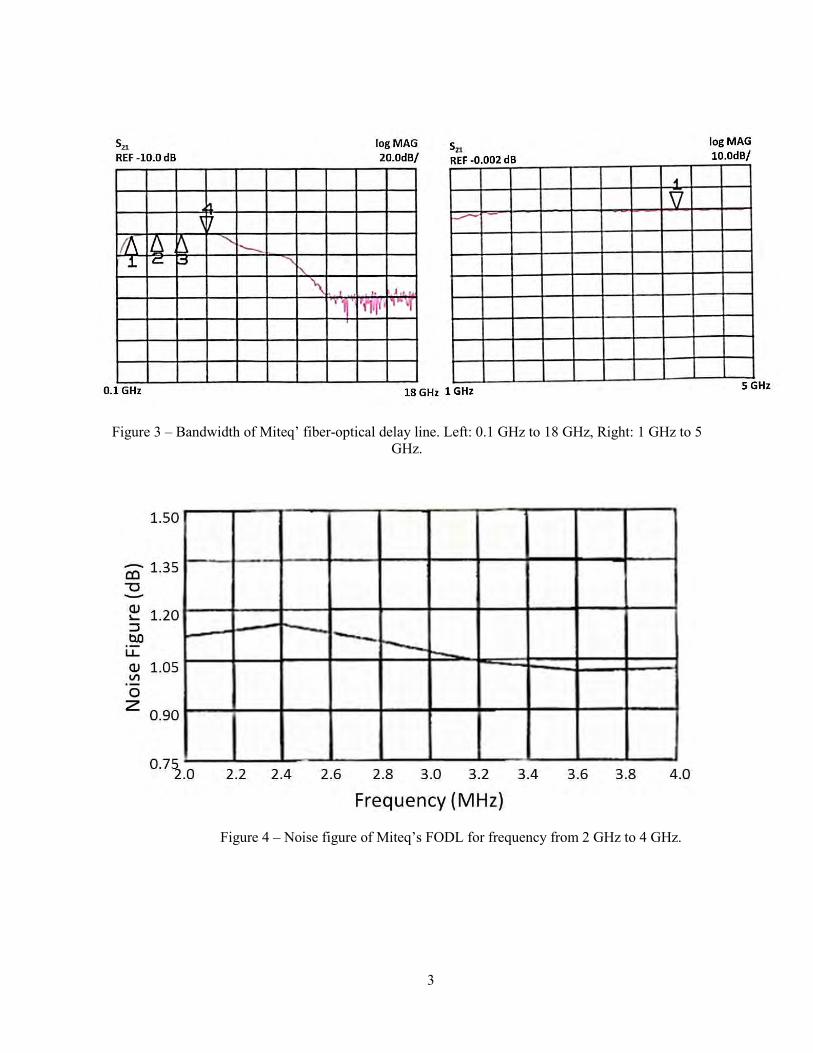
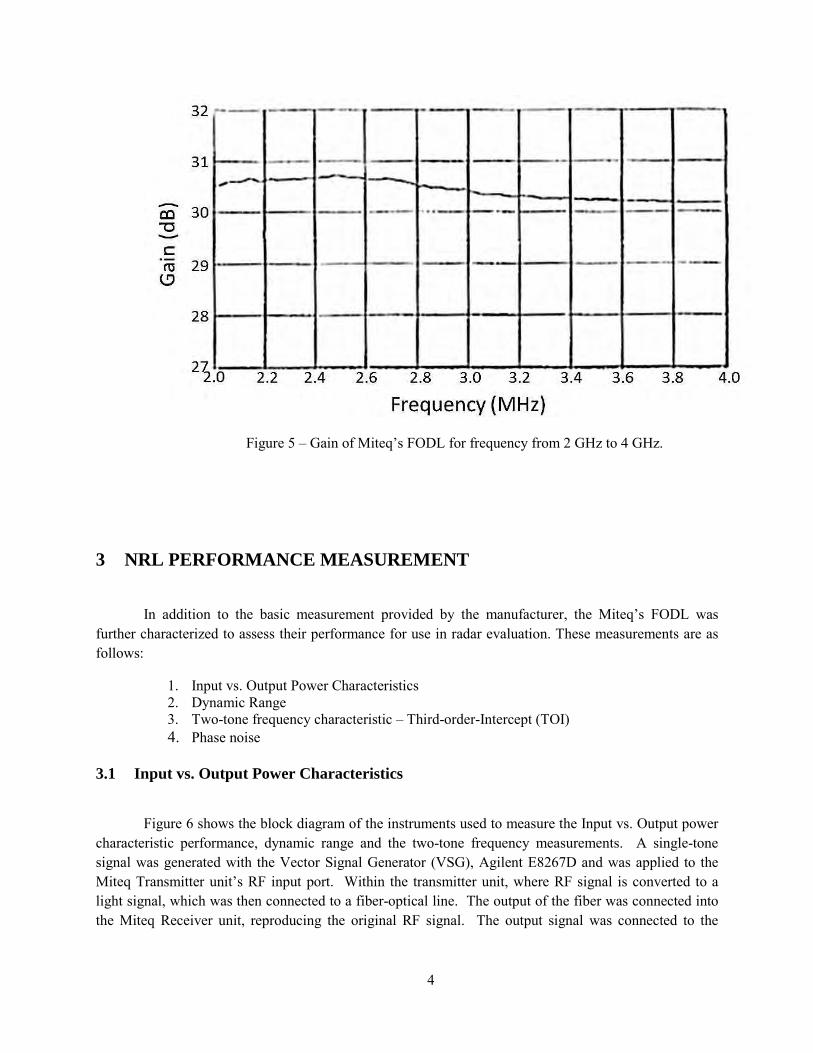
Figures 3 to 5 are the Miteq’s FODL performance measured by the manufacturer prior to shipping the system to NRL, including a relatively flat throughput loss from 1 to 5 GHz (Figure 3), a noise figure of 1 to 1.2 dB from 2 to 4 GHz (Fig. 4), and a gain of 30.5 dB from 2 to 4 GHz (Fig. 5). The FODL was originally purchased for a 3-GHz application, thus the manufacturer only provided FODL performance for the frequency range of about 3 GHz.
3
Figure 3 – Bandwidth of Miteq’ fiber-optical delay line. Left: 0.1 GHz to 18 GHz, Right: 1 GHz to 5 GHz.
Figure 4 – Noise figure of Miteq’s FODL for frequency from 2 GHz to 4 GHz.
4
Figure 5 – Gain of Miteq’s FODL for frequency from 2 GHz to 4 GHz.
3 NRL PERFORMANCE MEASUREMENT
In addition to the basic measurement provided by the manufacturer, the Miteq’s FODL was further characterized to assess their performance for use in radar evaluation. These measurements are as follows:
1. Input vs. Output Power Characteristics 2. Dynamic Range 3. Two-tone frequency characteristic – Third-order-Intercept (TOI) 4. Phase noise
3.1 Input vs. Output Power Characteristics
Figure 6 shows the block diagram of the instruments used to measure the Input vs. Output power characteristic performance, dynamic range and the two-tone frequency measurements. A single-tone signal was generated with the Vector Signal Generator (VSG), Agilent E8267D and was applied to the Miteq Transmitter unit’s RF input port. Within the transmitter unit, where RF signal is converted to a light signal, which was then connected to a fiber-optical line. The output of the fiber was connected into the Miteq Receiver unit, reproducing the original RF signal. The output signal was connected to the
5
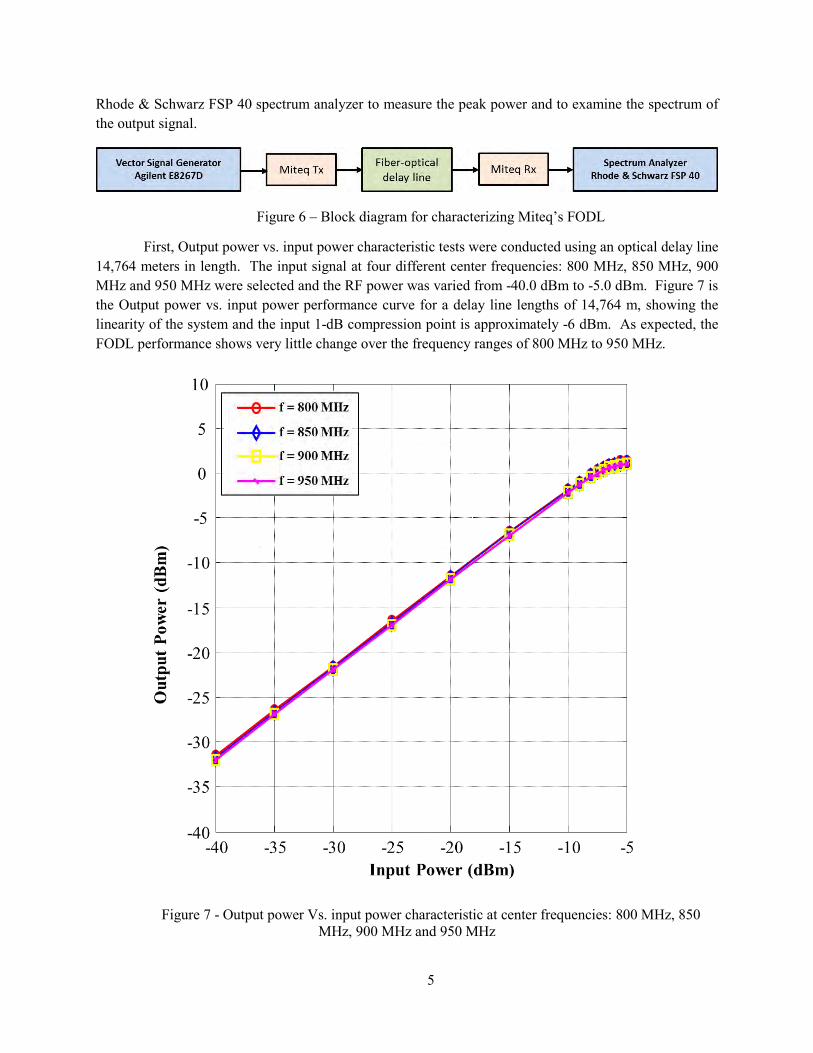
Rhode & Schwarz FSP 40 spectrum analyzer to measure the peak power and to examine the spectrum of the output signal.
Figure 6 – Block diagram for characterizing Miteq’s FODL
First, Output power vs. input power characteristic tests were conducted using an optical delay line 14,764 meters in length. The input signal at four different center frequencies: 800 MHz, 850 MHz, 900 MHz and 950 MHz were selected and the RF power was varied from -40.0 dBm to -5.0 dBm. Figure 7 is the Output power vs. input power performance curve for a delay line lengths of 14,764 m, showing the linearity of the system and the input 1-dB compression point is approximately -6 dBm. As expected, the FODL performance shows very little change over the frequency ranges of 800 MHz to 950 MHz.
Figure 7 - Output power Vs. input power characteristic at center frequencies: 800 MHz, 850 MHz, 900 MHz and 950 MHz
6
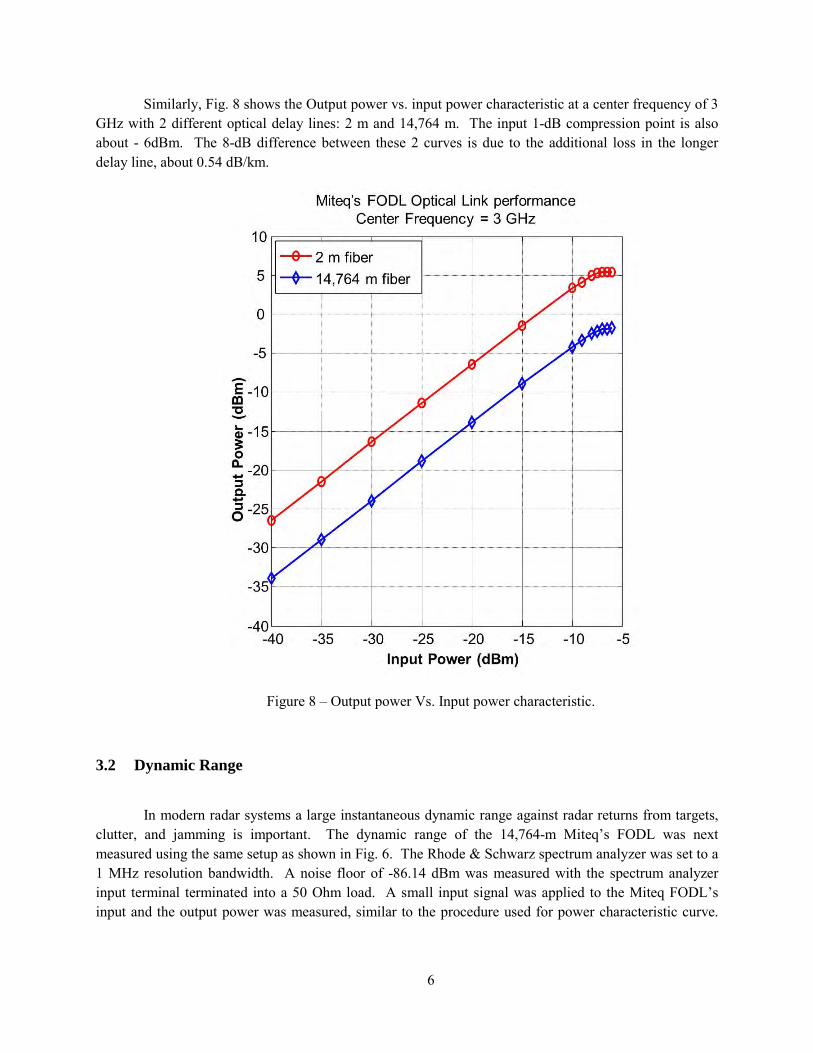
Similarly, Fig. 8 shows the Output power vs. input power characteristic at a center frequency of 3 GHz with 2 different optical delay lines: 2 m and 14,764 m. The input 1-dB compression point is also about - 6dBm. The 8-dB difference between these 2 curves is due to the additional loss in the longer delay line, about 0.54 dB/km.
Figure 8 – Output power Vs. Input power characteristic.
3.2 Dynamic Range
In modern radar systems a large instantaneous dynamic range against radar returns from targets, clutter, and jamming is important. The dynamic range of the 14,764-m Miteq’s FODL was next measured using the same setup as shown in Fig. 6. The Rhode & Schwarz spectrum analyzer was set to a 1 MHz resolution bandwidth. A noise floor of -86.14 dBm was measured with the spectrum analyzer input terminal terminated into a 50 Ohm load. A small input signal was applied to the Miteq FODL’s input and the output power was measured, similar to the procedure used for power characteristic curve.
7
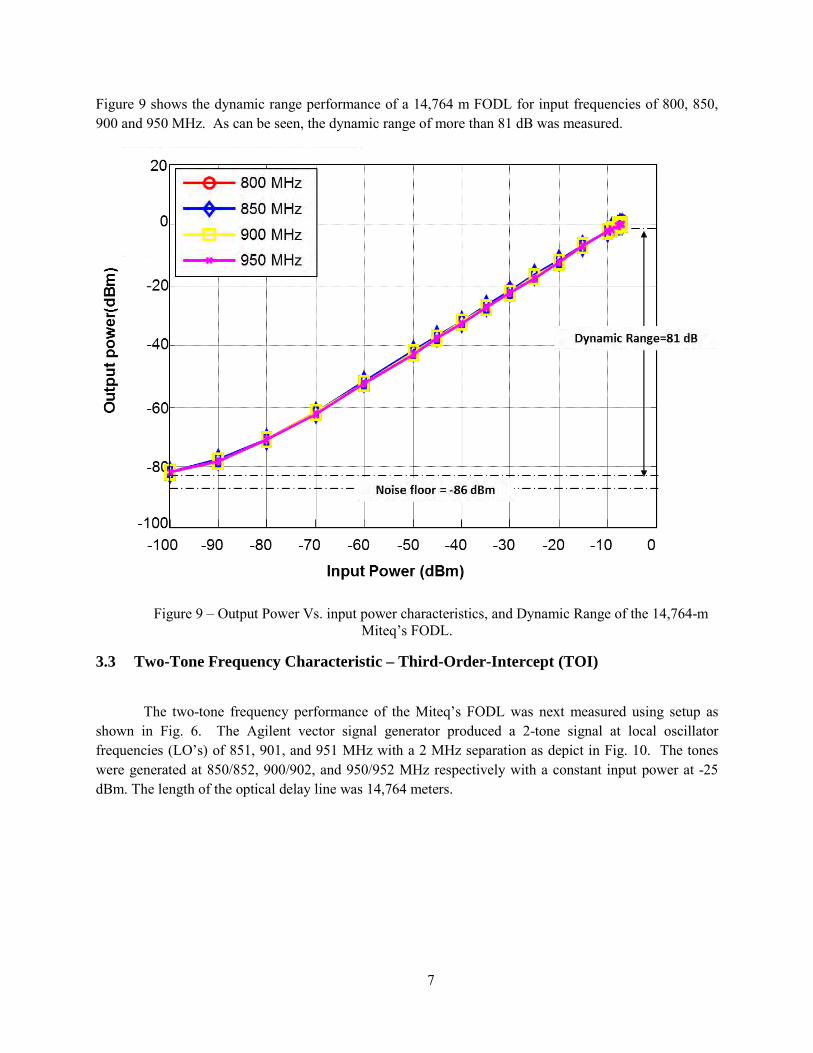
Figure 9 shows the dynamic range performance of a 14,764 m FODL for input frequencies of 800, 850, 900 and 950 MHz. As can be seen, the dynamic range of more than 81 dB was measured.
Figure 9 – Output Power Vs. input power characteristics, and Dynamic Range of the 14,764-m Miteq’s FODL.
3.3 Two-Tone Frequency Characteristic – Third-Order-Intercept (TOI)
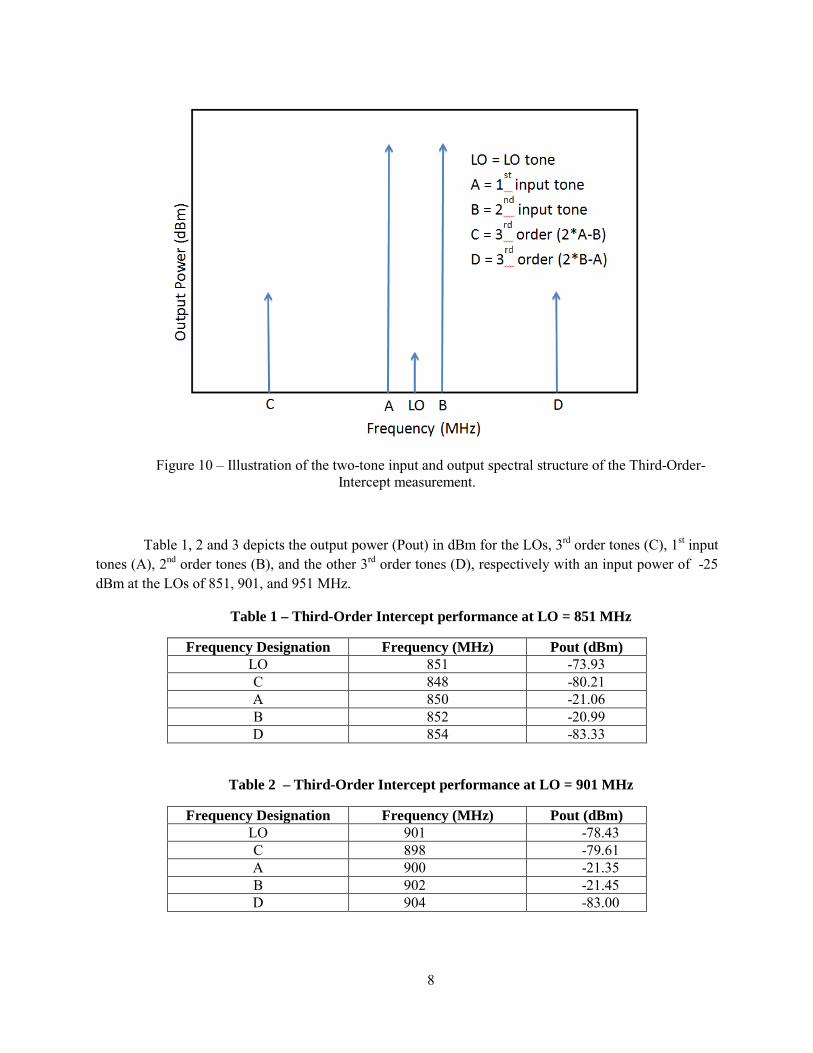
The two-tone frequency performance of the Miteq’s FODL was next measured using setup as shown in Fig. 6. The Agilent vector signal generator produced a 2-tone signal at local oscillator frequencies (LO’s) of 851, 901, and 951 MHz with a 2 MHz separation as depict in Fig. 10. The tones were generated at 850/852, 900/902, and 950/952 MHz respectively with a constant input power at -25 dBm. The length of the optical delay line was 14,764 meters.
8
Figure 10 – Illustration of the two-tone input and output spectral structure of the Third-Order-Intercept measurement.
Table 1, 2 and 3 depicts the output power (Pout) in dBm for the LOs, 3rd order tones (C), 1st input tones (A), 2nd order tones (B), and the other 3rd order tones (D), respectively with an input power of -25 dBm at the LOs of 851, 901, and 951 MHz.
Table 1 – Third-Order Intercept performance at LO = 851 MHz
Frequency Designation Frequency (MHz) Pout (dBm) LO 851 -73.93 C 848 -80.21 A 850 -21.06 B 852 -20.99 D 854 -83.33
Table 2 – Third-Order Intercept performance at LO = 901 MHz
Frequency Designation Frequency (MHz) Pout (dBm) LO 901 -78.43 C 898 -79.61 A 900 -21.35 B 902 -21.45 D 904 -83.00
9
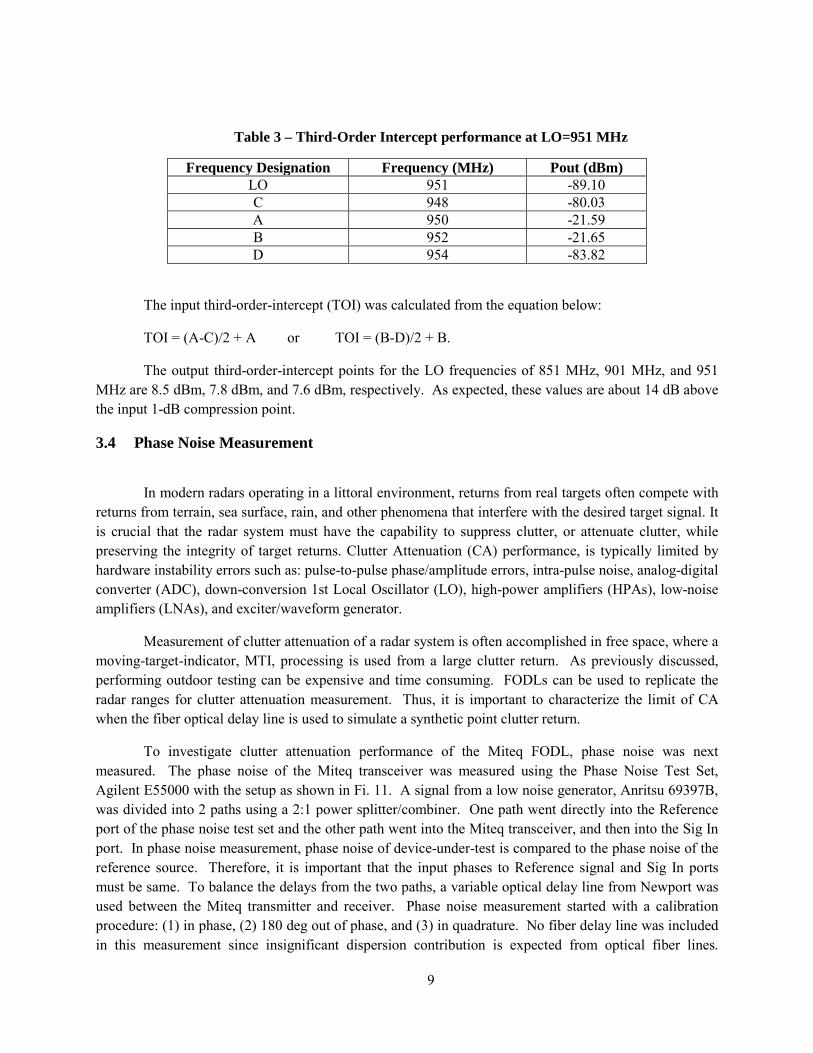
Table 3 – Third-Order Intercept performance at LO=951 MHz
Frequency Designation Frequency (MHz) Pout (dBm) LO 951 -89.10 C 948 -80.03 A 950 -21.59 B 952 -21.65 D 954 -83.82
The input third-order-intercept (TOI) was calculated from the equation below:
TOI = (A-C)/2 + A or TOI = (B-D)/2 + B.
The output third-order-intercept points for the LO frequencies of 851 MHz, 901 MHz, and 951 MHz are 8.5 dBm, 7.8 dBm, and 7.6 dBm, respectively. As expected, these values are about 14 dB above the input 1-dB compression point.
3.4 Phase Noise Measurement
In modern radars operating in a littoral environment, returns from real targets often compete with returns from terrain, sea surface, rain, and other phenomena that interfere with the desired target signal. It is crucial that the radar system must have the capability to suppress clutter, or attenuate clutter, while preserving the integrity of target returns. Clutter Attenuation (CA) performance, is typically limited by hardware instability errors such as: pulse-to-pulse phase/amplitude errors, intra-pulse noise, analog-digital converter (ADC), down-conversion 1st Local Oscillator (LO), high-power amplifiers (HPAs), low-noise amplifiers (LNAs), and exciter/waveform generator.
Measurement of clutter attenuation of a radar system is often accomplished in free space, where a moving-target-indicator, MTI, processing is used from a large clutter return. As previously discussed, performing outdoor testing can be expensive and time consuming. FODLs can be used to replicate the radar ranges for clutter attenuation measurement. Thus, it is important to characterize the limit of CA when the fiber optical delay line is used to simulate a synthetic point clutter return.
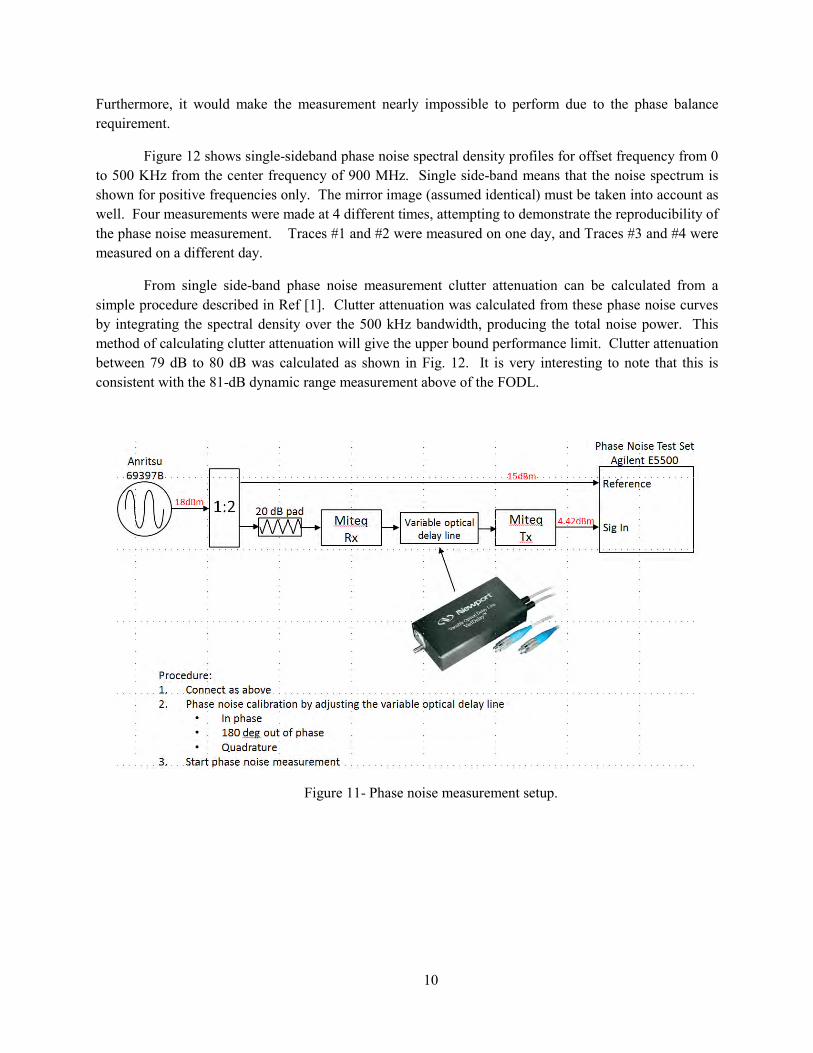
To investigate clutter attenuation performance of the Miteq FODL, phase noise was next measured. The phase noise of the Miteq transceiver was measured using the Phase Noise Test Set, Agilent E55000 with the setup as shown in Fi. 11. A signal from a low noise generator, Anritsu 69397B, was divided into 2 paths using a 2:1 power splitter/combiner. One path went directly into the Reference port of the phase noise test set and the other path went into the Miteq transceiver, and then into the Sig In port. In phase noise measurement, phase noise of device-under-test is compared to the phase noise of the reference source. Therefore, it is important that the input phases to Reference signal and Sig In ports must be same. To balance the delays from the two paths, a variable optical delay line from Newport was used between the Miteq transmitter and receiver. Phase noise measurement started with a calibration procedure: (1) in phase, (2) 180 deg out of phase, and (3) in quadrature. No fiber delay line was included in this measurement since insignificant dispersion contribution is expected from optical fiber lines.
10
Furthermore, it would make the measurement nearly impossible to perform due to the phase balance requirement.
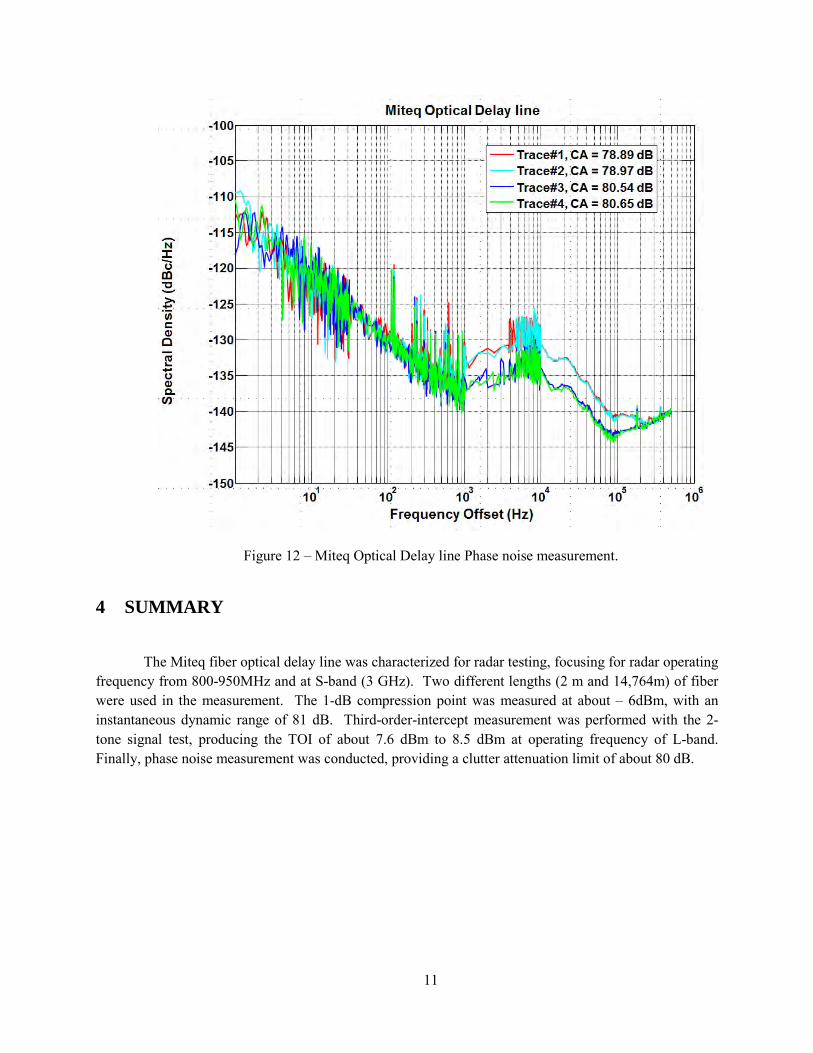
Figure 12 shows single-sideband phase noise spectral density profiles for offset frequency from 0 to 500 KHz from the center frequency of 900 MHz. Single side-band means that the noise spectrum is shown for positive frequencies only. The mirror image (assumed identical) must be taken into account as well. Four measurements were made at 4 different times, attempting to demonstrate the reproducibility of the phase noise measurement. Traces #1 and #2 were measured on one day, and Traces #3 and #4 were measured on a different day.
From single side-band phase noise measurement clutter attenuation can be calculated from a simple procedure described in Ref [1]. Clutter attenuation was calculated from these phase noise curves by integrating the spectral density over the 500 kHz bandwidth, producing the total noise power. This method of calculating clutter attenuation will give the upper bound performance limit. Clutter attenuation between 79 dB to 80 dB was calculated as shown in Fig. 12. It is very interesting to note that this is consistent with the 81-dB dynamic range measurement above of the FODL.
Figure 11- Phase noise measurement setup.
11
Figure 12 – Miteq Optical Delay line Phase noise measurement.
4 SUMMARY
The Miteq fiber optical delay line was characterized for radar testing, focusing for radar operating frequency from 800-950MHz and at S-band (3 GHz). Two different lengths (2 m and 14,764m) of fiber were used in the measurement. The 1-dB compression point was measured at about – 6dBm, with an instantaneous dynamic range of 81 dB. Third-order-intercept measurement was performed with the 2-tone signal test, producing the TOI of about 7.6 dBm to 8.5 dBm at operating frequency of L-band. Finally, phase noise measurement was conducted, providing a clutter attenuation limit of about 80 dB.
12
ACKNOWLEDGEMENT
The authors would like to acknowledge Dr. Jason McKinney of the Optical Division in performing the phase noise measurement.
REFERENCES
[1] W.W.Shrader and V.Gregers-Hansen, "MTI Radar", pp. 2.1-2.102, Ch.2 in Radar Handbook, Third Edition, M. Skolnik, New York: McGraw-Hill, 2008.