Embed Size (px)
Citation preview
Atmos. Chem. Phys., 18, 18169–18186, 2018https://doi.org/10.5194/acp-18-18169-2018© Author(s) 2018. This work is distributed underthe Creative Commons Attribution 4.0 License.
Characteristics and evolution of diurnal foehn eventsin the Dead Sea valleyJutta Vüllers1, Georg J. Mayr2, Ulrich Corsmeier1, and Christoph Kottmeier1
1Institute of Meteorology and Climate Research, Karlsruhe Institute of Technology (KIT),P.O. Box 3640, 76021 Karlsruhe, Germany2Department of Atmospheric and Cryospheric Sciences, University of Innsbruck, Innrain 52f, 6020 Innsbruck, Austria
Correspondence: Jutta Vüllers ([email protected])
Received: 18 May 2018 – Discussion started: 9 August 2018Revised: 7 November 2018 – Accepted: 5 December 2018 – Published: 21 December 2018
Abstract. This paper investigates frequently occurring foehnin the Dead Sea valley. For the first time, sophisticated, high-resolution measurements were performed to investigate thehorizontal and vertical flow field. In up to 72 % of the daysin summer, foehn was observed at the eastern slope of theJudean Mountains around sunset. Furthermore, the resultsalso revealed that in approximately 10 % of the cases thefoehn detached from the slope and only affected elevatedlayers of the valley atmosphere. Lidar measurements showedthat there are two main types of foehn. Type I has a durationof approximately 2–3 h and a mean maximum velocity of5.5 m s−1 and does not propagate far into the valley, whereastype II affects the whole valley, as it propagates across thevalley to the eastern side. Type II reaches mean maximumwind velocities of 11 m s−1 and has a duration of about 4–5 h.A case study of a type II foehn shows that foehn is initiatedby the horizontal temperature gradient across the mountainrange. In the investigated case this was caused by an ampli-fied heating and delayed cooling of the valley boundary layerin the afternoon, compared to the upstream boundary layerover the mountain ridge. The foehn was further intensifiedby the advection of cool maritime air masses upstream overthe coastal plains, leading to a transition of subcritical to su-percritical flow conditions downstream and the formation ofa hydraulic jump and rotor beneath. These foehn events areof particular importance for the local climatic conditions, asthey modify the temperature and humidity fields in the valleyand, furthermore, they are important because they enhanceevaporation from the Dead Sea and influence the aerosol dis-tribution in the valley.
1 Introduction
In mountainous terrain the atmospheric boundary layer, andthus the living conditions in these regions, are governed byprocesses of different scales. Under fair weather conditions,the atmospheric boundary layer (ABL) in a valley is oftendecoupled from the large-scale flow by a strong tempera-ture inversion (Whiteman, 2000). In this case mainly localconvection and thermally driven wind systems, which arecaused by differential heating of adjacent air masses, suchas slope and valley winds, determine the valley ABL (e.g.Atkinson, 1981; Zardi and Whiteman, 2013). They influencethe diurnal temperature and humidity cycle (e.g. Alpert et al.,1997; Bischoff-Gauß et al., 2008) and also determine aerosoldispersion and, thus, air quality (e.g. Kalthoff et al., 2000;Corsmeier et al., 2005; Fast et al., 2006). Mesoscale pro-cesses, such as topographic and advective venting, accom-pany the thermally driven flows under fair weather conditions(e.g. Fast and Zhong, 1998; Adler and Kalthoff, 2014). Whenthe large-scale flow is not negligible it also impacts the valleyABL. The interaction takes place via turbulent transport ordynamically driven flow phenomena, which occur when thelarge-scale flow is affected by the orography. Gravity waves,wave breaking, downslope windstorms, hydraulic jumps androtors can occur on the lee side of the mountains. The inten-sity and extent of the developing phenomena depend on theshape of the mountains, the stratification of the atmosphere,the strength of the valley ABL inversion, the wind speed,and the direction of the large-scale flow (Whiteman, 2000).Stratified flow theory as well as hydraulic flow theory wereboth used successfully to explain the aforementioned phe-nomena (e.g. Schär and Smith, 1993; Corsmeier et al., 2005;
Published by Copernicus Publications on behalf of the European Geosciences Union.
18170 J. Vüllers et al.: Characteristics and evolution of foehn at the Dead Sea
Durran, 2003; Jackson et al., 2013). Field campaigns wereperformed to gather observations of these phenomena alonglarge mountain barriers (Alps, Pyrenees) during field cam-paigns such as ALPEX (Davies and Pichler, 1990), PYREX(Bougeault et al., 1990), and MAP (Bougeault et al., 2001)and also for individual valleys, e.g. T-REX (Grubišic et al.,2008), MATERHORN (Fernando et al., 2015), or craters likein METCRAX (Whiteman et al., 2008; Lehner et al., 2016).This paper contributes to this research by investigating a fre-quently occurring mesoscale flow phenomena which influ-ences weather and climate in the Dead Sea (DS) valley.
The Dead Sea with a water level of currently −430 mabove mean sea level (a.m.s.l.) forms the lowest part of theJordan Rift Valley, which is an over 700 km long north–southoriented depression zone extending from the northern Israeliborder to the Gulf of Aqaba. The complex and steep orogra-phy, together with the land surface heterogeneity in the val-ley, introduced by the lake, results in a strong local forcingand triggers pronounced thermally driven wind systems, suchas a lake breeze, slope, and valley winds (Kottmeier et al.,2016). Additionally, regional forcing influences the atmo-spheric processes in the valley, resulting in a distinct diurnalwind pattern. In particular, strong westerly downslope windsare observed frequently in the evening. Ashbel and Brooks(1939) first described the westerly winds in the northern partof the DS as the Mediterranean Sea breeze (MSB) enteringthe valley, but not with the typical characteristics of a seabreeze at the coast, i.e. a steady, cool, and moist air flow; theyrather described it as a very dry, hot, and gusty wind. Follow-ing Ashbel and Brooks (1939) various observational near-surface studies (e.g. Bitan, 1974, 1976; Lensky and Dayan,2012; Naor et al., 2017) and also numerical studies (e.g.Doron and Neumann, 1978; Alpert et al., 1982; Segal et al.,1983, 1985) have been carried out to study the penetration ofthe MSB into the Jordan Rift Valley. Studies showed that thedownward penetration of the MSB results from the tempera-ture difference between the cooler maritime air mass and thewarmer valley air mass. A density-driven flow, which accel-erates and warms while descending into the valley (Alpertet al., 1990), i.e. a foehn wind, when following the defi-nition of the WMO (WMO, 1992). At the DS they occurmost frequently in summer and enter the Jordan Rift Valleyfirst in the north around Lake Kinneret and at approximately18:00 LT (LT=UTC+2) at the DS (Bitan, 1974, 1976; Se-gal et al., 1985; Naor et al., 2017). These foehn events have alarge impact on the atmospheric conditions in the DS valley.Mean hourly wind velocities of 5 m s−1 in the south and upto 12 m s−1 in the north were recorded during these events(Bitan, 1974; Weiss et al., 1988; Hecht and Gertman, 2003).Furthermore, through the adiabatic heating of the air massduring the descent into the valley, the foehn warms the val-ley (Ashbel and Brooks, 1939; Alpert et al., 1997; Shafir andAlpert, 2011). It also influences humidity. Some studies sug-gest an increase in humidity (Naor et al., 2017), whereas oth-ers have suggested a decrease (Ashbel and Brooks, 1939).
The foehn events influence the lake evaporation, as evapora-tion is driven by wind velocity and vapour pressure deficit,as shown by Metzger et al. (2018). The diurnal maximum ofevaporation is reached, untypically, shortly after sunset whenthe foehn sets in (Metzger et al., 2018). Finally, the foehnevents can also cause an air mass exchange and remove theaerosol particles and the often-occurring haze layer from thevalley, improving air quality (Levin et al., 2005; Holla et al.,2015).
Even though these foehn events apparently have such alarge influence on the atmospheric conditions at the DS, a de-tailed analysis of their three-dimensional structure and theircharacteristics, such as height, duration, and intensity, andfurther insights regarding their evolution are missing. Hence,the following questions are addressed in this study. (i) Is adifferentiation between radiation and density-driven downs-lope flows possible? (ii) What are the typical characteristicsof the foehn events? (iii) What are the key mechanisms dur-ing the foehn evolution?
For the analysis the first sophisticated high-resolution li-dar measurements of foehn events in the DS valley, alongwith long-term near-surface observations, were used. Themeasurements were performed in the framework of the in-terdisciplinary virtual institute DEad SEa Research VEnue(DESERVE) (Kottmeier et al., 2016). In the following sec-tion, Sect. 2, a short geographical overview, information onthe measurement sites and the instrumentation as well as theapplied methods is presented. Section 3.1 presents results ofan objective occurrence frequency analysis, characteristics ofthe foehn events are shown in Sect. 3.2, and a detailed casestudy of a strong foehn event and the processes leading toit are presented in Sect. 3.3. Section 4 provides a summary,including a conceptual model of the processes, and conclu-sions.
2 Methodology
2.1 Study area
The DS is the lowest reachable place on earth with a currentwater level of −430 m a.m.s.l. The valley is north–south ori-ented, with the Judean Mountains to the west, with a meanridge height of about 895 m a.m.s.l., and the Moab Mountainsto the east, which reach up to 1200 m a.m.s.l. (Fig. 1a). Thecross section in Fig. 1b illustrates the steep orography at bothsides of the DS, extending over 1600 m in the vertical. TheDS is about 100 km long and 15 to 17 km wide. The distanceto the Mediterranean Sea is 80 km in the north and increasesup to 120 km towards the south (Fig. 1a, b).
2.2 Experimental set-up
A long-term meteorological observation network has beenoperated around the Dead Sea since 2014 (Fig. 1). Itwas complemented by special observation periods in Au-
Atmos. Chem. Phys., 18, 18169–18186, 2018 www.atmos-chem-phys.net/18/18169/2018/

J. Vüllers et al.: Characteristics and evolution of foehn at the Dead Sea 18171
Figure 1. Topographic map of the research area with the measurement sites (a). Cross section along the dashed line in (a) is shown in (b),and a picture of the KITcube measurement site near Masada is shown in (c).
gust 2014 and November 2014, where the mobile obser-vatory “KITcube”, an assembly of ground-based in situand remote sensing instruments for probing the atmosphere(Kalthoff et al., 2013), was deployed in the DS valley, nearMasada (Fig. 1a, c). Additional radiosoundings were per-formed at the eastern shore of the DS in Ghor Haditha, Jor-dan (Fig. 1a). Further details about the measurement networkaround the DS and the KITcube instruments can be found inKottmeier et al. (2016) and Kalthoff et al. (2013).
2.3 Instrumentation and data
The long-term measurements were performed using mete-orological towers which were equipped with sensors mea-suring air temperature, humidity, and up- and downwellingshortwave and longwave radiation components at 2 m aboveground level (a.g.l.), air pressure, and precipitation at1 m a.g.l., with a temporal resolution of 10 min. Supplemen-tary measurements with a temporal resolution of 20 Hz wereperformed with a sonic anemometer at 10 m a.g.l. at the me-teorological stations (Fig. 1a, orange stations) and with anintegrated gas analyser and sonic anemometer (IRGASON)at 6 m a.g.l. at the energy balance stations (Fig. 1a, red sta-tions), providing all three wind components, sonic tempera-ture, and water vapour. Furthermore, long-term observationsof wind, temperature, and pressure in Jerusalem provided bythe Israel Meteorological Service (IMS) and the operationalradiosoundings from the IMS at Bet Dagan launched every-day at 00:00 and 12:00 UTC were used.
The following subset of KITcube instruments was used inthis study. The first instrument, a two-axis scanning pulsed2 µm wind lidar from Lockheed Martin called “WindTracer”,measured aerosol backscatter and radial velocity. It has apeak power of 4.5 kW and a pulse repetition frequency of
500 Hz (Träumner, 2012). The effective pulse length andhence the minimum spatial resolution is 56 m. The scan pat-tern of the instrument included range-height-indicator (RHI)scans at azimuth angles of 15, 62, 172, and 299◦ with an el-evation ranging from 0 to 180◦, and plan-position-indicator(PPI) scans of 360◦ azimuth for elevation angles of 0.2, 5, 15,and 75◦. The minimum detection range of the instrument is400 m. A quality threshold of−7 dB was used for the signal-to-noise ratio (SNR). To close the gap between the surfaceand the minimum detection range of the Windtracer, a sec-ond wind lidar from Leosphere was used. The “Windcube”has a resolution of 20 m and a detection range from 40 to600 m. It operates with a wavelength of 1.54 µm and workswith a 4-point stop-and-stare mode at a fixed elevation an-gle of 75.2◦ and an integration time of 7 s. From both lidarinstruments, the vertical profiles of the horizontal wind werecalculated using the velocity–azimuth display algorithm afterBrowning and Wexler (1968). Radiosondes were simultane-ously launched during intensive observation periods on bothsides of the DS every 2 h, always from Friday 11:00 UTCuntil Sunday 03:00 UTC due to airspace restrictions, provid-ing temperature, humidity, wind velocity, and wind directionprofiles.
2.4 Layer detection algorithm
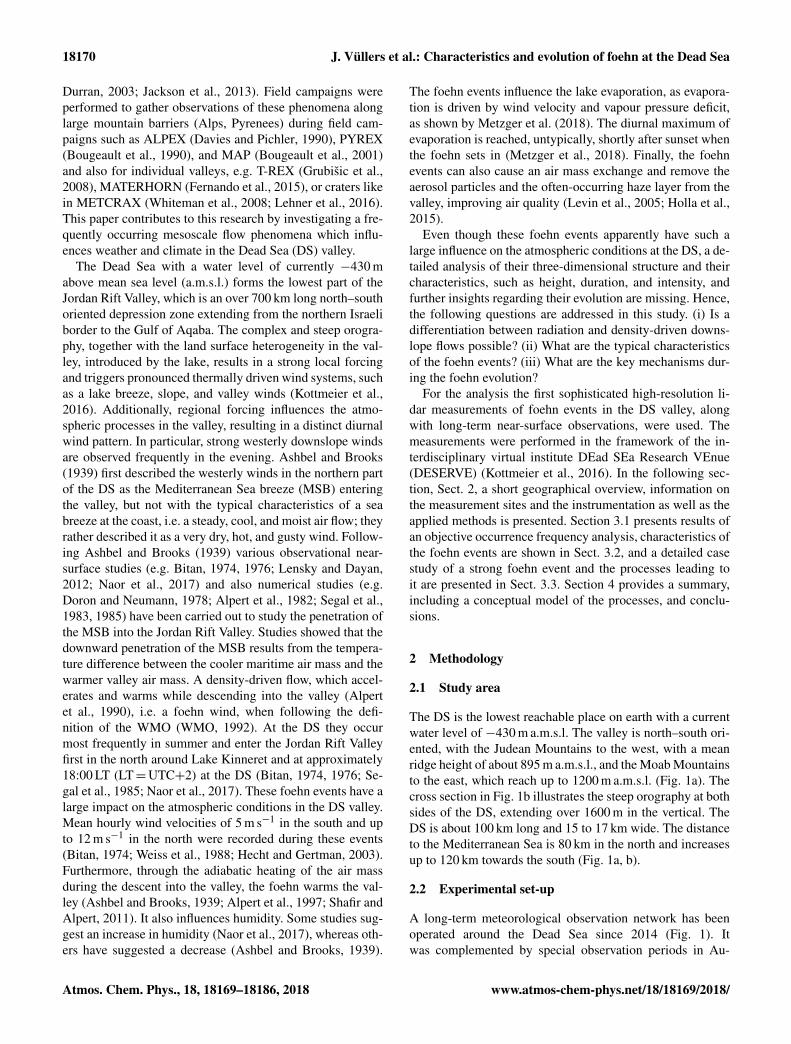
The characteristics of the foehn events were derived from li-dar RHI scans along the main wind direction of the foehnevents (black dashed line in Fig. 2a). By introducing a layerdetection algorithm the characteristics could be derived ob-jectively. The algorithm uses profiles of the horizontal com-ponent of the radial velocity (Fig. 2b) and the backscattersignal (Fig. 2c), averaged between 2 and 3 km away fromthe lidar. The profiles show that within the foehn layer the
www.atmos-chem-phys.net/18/18169/2018/ Atmos. Chem. Phys., 18, 18169–18186, 2018
18172 J. Vüllers et al.: Characteristics and evolution of foehn at the Dead Sea
flow has a jet-like structure with strong wind velocity andbackscatter gradients (Fig. 2d). The strongest wind veloc-ity and backscatter gradient above the wind velocity maxi-mum and the backscatter minimum, respectively, were usedwithin the algorithm to determine the foehn layer height (reddashed line in Fig. 2d). Furthermore, the algorithm detectedthe mean and maximum wind speed, and the height of thewind speed maximum from each RHI scan. These resultswere then used to derive averaged characteristics for eachevent.
2.5 Reduced-gravity shallow-water theory
To explain the observed phenomena described in this paper,the reduced-gravity shallow water (RGSW) theory, as de-scribed by Pettre (1982), is applied. It is a theory to describedynamically driven flows over mountains. The RGSW theorydescribes a two-layer system separated by a strong tempera-ture inversion. An air mass can either be blocked and forcedto flow around the mountain, it can flow over the mountain, orit can pass through gaps in the mountain range. The ratio be-tween the energy needed to overcome negative buoyancy andthe horizontal inertia of the air mass (Jackson et al., 2013) iscalled the non-dimensional mountain height,
H =Nh
U, (1)
with the crest height, h, the horizontal wind speed upstream,U , and the Brunt–Väisälä frequency, N . H is normally cal-culated for a layer, and thus the values represent mean valuesof this layer. For low wind speeds or strongly stable stratifi-cation the air mass is blocked by the mountain indicated byH > 1, but for H ≤ 1 the flow has sufficient kinetic energyto flow over the mountain. To explain the characteristics ofthe flow over the mountain the Froude number,
Fr =u√g′η
, (2)
where u is the mean wind velocity of the lower layer, η isthe inversion height, and g′ = g ·12/2, the reduced gravi-tational acceleration, can be used.12 is hereby the inversionstrength at the top of the lower layer and 2 the mean poten-tial temperature of the lower layer. The flow is subcritical ifFr < 1, Fr > 1 means the flow is supercritical, and Fr = 1is called the critical state. Three situations can occur when aflow passes an obstacle. Firstly, the layer is subcritical every-where. Then the layer height has to decrease when the terrainrises and it has the shallowest depth at the crest. Secondly, theflow is supercritical everywhere; then the layer height and theterrain height rise simultaneously. Thirdly, the layer changesfrom a subcritical state upstream to supercritical state down-stream. This means that the layer has to be thick and slowupstream and fast and shallow downstream. Further down-stream the layer eventually thickens and slows down in a hy-draulic jump. This causes strong turbulence as the momen-tum is conserved but kinetic energy dissipates (Jackson et al.,
Figure 2. PPI scan of the radial velocity at 5◦ elevation on 16 Au-gust 2014, 19:01 LT (a). Blue colours indicate flow towards the lidarand red colours flow away from the lidar. The dashed line indicatesthe direction of the RHI scans of the horizontal component of the ra-dial velocity shown in (b) and of the backscatter signal shown in (c)(note the different colour scales). RHI scans were performed on16 August 2014, 19:06 LT. Vertical profiles of the horizontal radialwind velocity component and of the backscatter signal (d) averagedbetween the black dashed lines in (c). The red dashed lines indi-cate the foehn layer heights, automatically detected by the strongestvertical gradient of the respective profile above the maximum.
Atmos. Chem. Phys., 18, 18169–18186, 2018 www.atmos-chem-phys.net/18/18169/2018/
J. Vüllers et al.: Characteristics and evolution of foehn at the Dead Sea 18173
2013). This is one of the oldest conceptual models and wasfirst proposed by Long (1954), who suggested that there is afundamental similarity between downslope wind storms andhydraulic jumps. For the transition of the state from subcrit-ical to supercritical, the flowing layer has to reach its criticalstate Fr = 1 at crest height.
3 Results
3.1 Occurrence frequency
To analyse how often the westerly downslope winds are ac-tually density-driven, the occurrence frequency of foehn wascalculated using the automatic and probabilistic statisticalmixture model of Plavcan et al. (2014) with data from thelong-term observations between 2014 and 2016. This modelenables a probabilistic distinction between the density-drivenfoehn events and other downslope winds, such as noctur-nal radiatively driven downslope flows. Density-driven flowsare possible when the potential temperature of the upstreamair mass crossing at crest height is equal to or lower thanthe temperature in the valley. The air mass descends, re-sulting in similar potential temperatures at the crest and inthe valley. In contrast, radiatively driven downslope flowsare triggered by radiative cooling of the air layer near theslope and the resulting temperature gradient between the airat the slope and the air at the same height in the valley centre(Whiteman, 2000). This leads to a stable stratification andtherefore to a positive potential temperature difference be-tween the crest and the valley (12=2crest−2valley > 0).The model is based on the assumption that the probabilitydensity function of these two wind regimes are statisticallydistinguishable in one or more characteristic variables. Themodel fits parametric distributions for the two wind regimeswhose mixture results in the observed probability distribu-tion of all downslope wind cases. It yields the probabilitiesthat measurements at a particular time are density-driven orradiatively driven downslope flows (for further details seePlavcan et al., 2014). The wind regimes are identified usingthe potential temperature difference (12) between the crest(Jerusalem, 810 m a.m.s.l.; Fig. 1a) and two downstream sta-tions, one at the slope (Masada, −7 m a.m.s.l.; Fig. 1a) andone in the valley (Ein Gedi Beach, −427 m a.m.s.l.; Fig. 1a),as well as the wind speed at the respective downstream sta-tion. The only parameter which has to be set prior to the fullyautomatic classification is the wind direction sector indicat-ing “downslope”. For Masada, this is 200–315◦ and for EinGedi Beach 220–320◦.
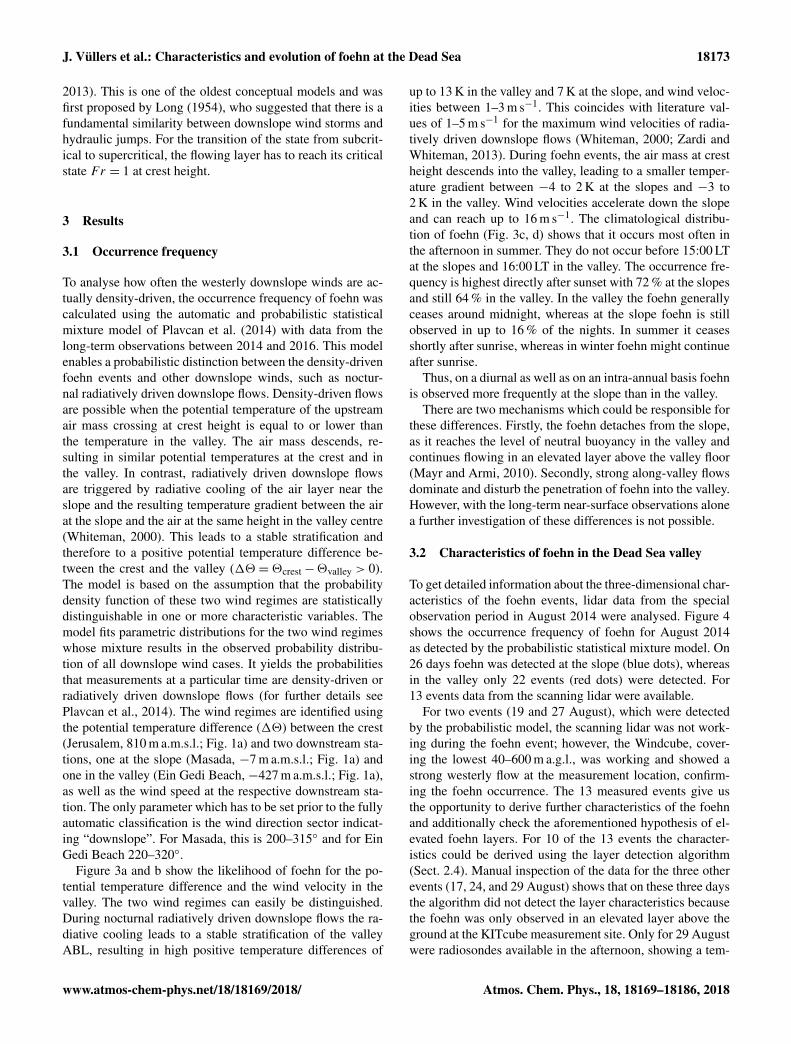
Figure 3a and b show the likelihood of foehn for the po-tential temperature difference and the wind velocity in thevalley. The two wind regimes can easily be distinguished.During nocturnal radiatively driven downslope flows the ra-diative cooling leads to a stable stratification of the valleyABL, resulting in high positive temperature differences of
up to 13 K in the valley and 7 K at the slope, and wind veloc-ities between 1–3 m s−1. This coincides with literature val-ues of 1–5 m s−1 for the maximum wind velocities of radia-tively driven downslope flows (Whiteman, 2000; Zardi andWhiteman, 2013). During foehn events, the air mass at crestheight descends into the valley, leading to a smaller temper-ature gradient between −4 to 2 K at the slopes and −3 to2 K in the valley. Wind velocities accelerate down the slopeand can reach up to 16 m s−1. The climatological distribu-tion of foehn (Fig. 3c, d) shows that it occurs most often inthe afternoon in summer. They do not occur before 15:00 LTat the slopes and 16:00 LT in the valley. The occurrence fre-quency is highest directly after sunset with 72 % at the slopesand still 64 % in the valley. In the valley the foehn generallyceases around midnight, whereas at the slope foehn is stillobserved in up to 16 % of the nights. In summer it ceasesshortly after sunrise, whereas in winter foehn might continueafter sunrise.
Thus, on a diurnal as well as on an intra-annual basis foehnis observed more frequently at the slope than in the valley.
There are two mechanisms which could be responsible forthese differences. Firstly, the foehn detaches from the slope,as it reaches the level of neutral buoyancy in the valley andcontinues flowing in an elevated layer above the valley floor(Mayr and Armi, 2010). Secondly, strong along-valley flowsdominate and disturb the penetration of foehn into the valley.However, with the long-term near-surface observations alonea further investigation of these differences is not possible.
3.2 Characteristics of foehn in the Dead Sea valley
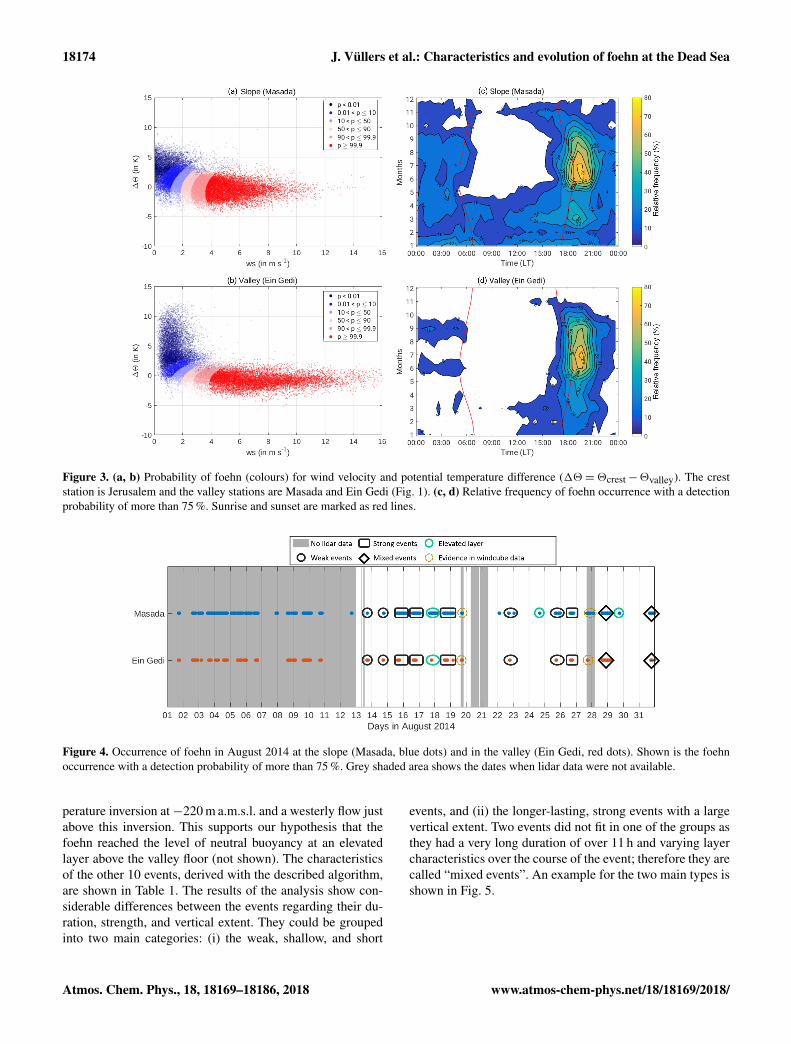
To get detailed information about the three-dimensional char-acteristics of the foehn events, lidar data from the specialobservation period in August 2014 were analysed. Figure 4shows the occurrence frequency of foehn for August 2014as detected by the probabilistic statistical mixture model. On26 days foehn was detected at the slope (blue dots), whereasin the valley only 22 events (red dots) were detected. For13 events data from the scanning lidar were available.
For two events (19 and 27 August), which were detectedby the probabilistic model, the scanning lidar was not work-ing during the foehn event; however, the Windcube, cover-ing the lowest 40–600 m a.g.l., was working and showed astrong westerly flow at the measurement location, confirm-ing the foehn occurrence. The 13 measured events give usthe opportunity to derive further characteristics of the foehnand additionally check the aforementioned hypothesis of el-evated foehn layers. For 10 of the 13 events the character-istics could be derived using the layer detection algorithm(Sect. 2.4). Manual inspection of the data for the three otherevents (17, 24, and 29 August) shows that on these three daysthe algorithm did not detect the layer characteristics becausethe foehn was only observed in an elevated layer above theground at the KITcube measurement site. Only for 29 Augustwere radiosondes available in the afternoon, showing a tem-
www.atmos-chem-phys.net/18/18169/2018/ Atmos. Chem. Phys., 18, 18169–18186, 2018
18174 J. Vüllers et al.: Characteristics and evolution of foehn at the Dead Sea
Figure 3. (a, b) Probability of foehn (colours) for wind velocity and potential temperature difference (12=2crest−2valley). The creststation is Jerusalem and the valley stations are Masada and Ein Gedi (Fig. 1). (c, d) Relative frequency of foehn occurrence with a detectionprobability of more than 75 %. Sunrise and sunset are marked as red lines.
Figure 4. Occurrence of foehn in August 2014 at the slope (Masada, blue dots) and in the valley (Ein Gedi, red dots). Shown is the foehnoccurrence with a detection probability of more than 75 %. Grey shaded area shows the dates when lidar data were not available.
perature inversion at−220 m a.m.s.l. and a westerly flow justabove this inversion. This supports our hypothesis that thefoehn reached the level of neutral buoyancy at an elevatedlayer above the valley floor (not shown). The characteristicsof the other 10 events, derived with the described algorithm,are shown in Table 1. The results of the analysis show con-siderable differences between the events regarding their du-ration, strength, and vertical extent. They could be groupedinto two main categories: (i) the weak, shallow, and short
events, and (ii) the longer-lasting, strong events with a largevertical extent. Two events did not fit in one of the groups asthey had a very long duration of over 11 h and varying layercharacteristics over the course of the event; therefore they arecalled “mixed events”. An example for the two main types isshown in Fig. 5.
Atmos. Chem. Phys., 18, 18169–18186, 2018 www.atmos-chem-phys.net/18/18169/2018/
J. Vüllers et al.: Characteristics and evolution of foehn at the Dead Sea 18175
Table 1. Characteristics of the foehn events derived from RHI scans at 299◦ (dashed line in Fig. 1a). Presented are mean wind speed, meanheight, mean maximum wind speed, and mean height of the wind speed maximum of the foehn events. The mean wind speed was firstcalculated for each RHI scan and then averaged over the whole event. The height, maximum wind speed, and height of the wind speedmaximum were determined for each RHI scan and then also averaged over the whole duration of the event. The events are sorted accordingto their duration.
Date Mean wind speed Mean layer height Mean maximum Mean height of Duration Observed(m s−1) (m a.g.l.) wind speed maximum wind speed (hh:mm) at KITcube
(m s−1) (m a.g.l.) location
13.08.2014 3.4 420.0 5.1 199.0 01:51 yes22.08.2014 4.1 529.1 5.6 293.6 02:09 yes25.08.2014 6.2 501.8 8.3 312.7 02:39 no14.08.2014 3.0 600.0 3.1 407.4 03:14 no
26.08.2014 7.2 961.1 10.8 406.8 04:13 yes15.08.2014 7.5 1338.5 10.1 574.8 05:12 yes16.08.2014 6.8 924.7 8.7 493.0 05:18 yes18.08.2014 5.1 834.4 7.5 450.9 05:24 yes
28.08.2014 5.4 386.5 8.3 201.8 11:47 yes31.08.2014 4.0 251.0 6.1 124.0 11:41 yes
3.2.1 Weak, shallow, and short events
The first type of foehn is a short and weak foehn wind,which only partly penetrates into the valley. The examplefrom 22 August 2014 lasted about 2 h from 18:00 to 20:00 LTand showed maximum near-surface wind velocities of about5 m s−1 (Fig. 5a). Before the west wind reached the val-ley, an elevated west wind maximum just above crest height(1750 m a.g.l.) was observed in the afternoon. At 16:00 LT, itstarted to penetrate down into the valley and reached the val-ley floor at around 18:30 LT (Fig. 5b). To evaluate how far thefoehn penetrated into the valley Hovmoeller diagrams werederived from lidar RHI scans along the main flow axis of thefoehn using the lowest elevation angle above the orography.
The Hovmoeller plot in Fig. 5c shows how the foehn pen-etrated down the slopes, starting at around 16:00 LT. Anopposing upslope wind was still present during this time,slowing down the foehn. At around 18:00 LT the upslopewind ceased and the foehn penetrated down into the valley.For a time window of about 1 h the foehn reached approx-imately 6 km into the valley and was also observable at theKITcube location, which was 3.5 km south-east of the slope(Fig. 5c). The mean wind speed of the foehn was 4.1 m s−1
and the mean layer height 529 m (Table 1). The mean maxi-mum wind velocity was detected at around 300 m a.g.l. witha mean wind velocity of 5.6 m s−1. The characteristics of theother three events of this type are summarised in Table 1.They all show very similar characteristics. A rather short du-ration of 2 to 3 h, mean wind velocities of 3 to 4 m s−1 (ex-cept for one event with 6.2 m s−1), a mean layer height of400 to 600 m, and the mean maximum velocity in a height of200 to 400 m. Two of the four events reached the valley floorand penetrated approximately 6 km into the valley, whereas
the other two foehn events were only observed close to theslope and in an elevated layer above the KITcube location(Table 1).
3.2.2 Longer-lasting and strong events
The second example is the 16 August 2014, representing avery strong event with wind velocities exceeding 10 m s−1
(Fig. 5d). Similar to the first case, an elevated west wind max-imum around crest height penetrated into the valley, but it al-ready started at 14:00 LT and affected a deeper layer of about1500 m (Fig. 5e). It was observed in the valley at 16:30 LT.Another difference compared to the first type is the strongwind velocity increase while the foehn descended into thevalley (Fig. 5d). At crest height velocities of about 6 m s−1
increased to 9 m s−1 in the valley and the layer height de-creased over the course of the event from 1500 to only 350 m.This strong foehn also penetrated further into the valley. Itwas observed at the KITcube location for nearly 4 h (Fig. 5f).The Hovmoeller plot shows that the foehn penetrated at least13.5 km into the valley, with wind velocities up to 10 m s−1.It could not be determined how far it actually reached into thevalley, as the lidar measurements were limited to a radius of10 km (Fig. 5f). However, radiosondes launched at the east-ern shore of the DS (Fig. 1) indicate that the foehn reachedover the DS towards the eastern shore. Soundings at 17:00and 19:00 LT also showed north-westerly winds advecting adrier air mass towards the eastern shore, although wind ve-locities were weaker than on the western side. The generalcharacteristics of the other strong events were similar to thedescribed one. The overall duration of the strong events var-ied between 04:00 and 05:30 h, the mean wind velocity ofthe foehn was 5 to 7 m s−1, and mean maximum wind veloc-ity was 7.5 to 11 m s−1 at a height of about 400 to 570 m.
www.atmos-chem-phys.net/18/18169/2018/ Atmos. Chem. Phys., 18, 18169–18186, 2018

18176 J. Vüllers et al.: Characteristics and evolution of foehn at the Dead Sea
Figure 5. Example for a short and weak foehn event (a, b, c) and for a strong foehn event (d, e, f). Shown are 10 min mean vertical profilesof horizontal wind at the KITcube location (a, d). Length and colours of the arrows represent wind velocity and the direction of the arrowsindicate the horizontal wind direction. Time–height cross sections of the averaged vertical profiles of the horizontal radial wind componentderived from lidar RHI scans at 299◦ (b, e). Negative values (blue colours) indicate a wind component from north-west and positive values(red colours) indicate a wind component from south-east. Black stars indicate the detected height of the foehn. Below the cross sections thevariance of the vertical wind (σw) at 2 m a.g.l. and wind direction (wd) measurements at 40 m height are shown. Hovmoeller diagrams of thenear-surface radial velocity from lidar RHI scans at an azimuth angle of 299 and 7◦ elevation west of the lidar and 1.6◦ east of the lidar (c,f). The black dashed line indicates the end of the western slope and the beginning of the valley floor. Wind direction (wd) was measured at40 m a.g.l. Orange points highlight wind directions between 270 and 330◦, the main wind direction of the foehn.
The penetration distance of the four events all exceeded themeasurement range of the lidar, meaning that they penetratedat least 13.5 km into the valley. For the 15 and 16 August ra-diosondes were launched at the eastern shore, confirming thatthe foehn reached the other side of the valley.
3.2.3 Mixed events
The two mixed events had a duration of over 11 h. The othercharacteristics were similar to the weak events, with meanwind velocities of 4 and 5.4 m s−1; the mean layer height was251 and 387 m and the mean maximum wind velocity was 6.1and 8.3 m s−1, respectively. However, the Hovmoeller plot
Atmos. Chem. Phys., 18, 18169–18186, 2018 www.atmos-chem-phys.net/18/18169/2018/

J. Vüllers et al.: Characteristics and evolution of foehn at the Dead Sea 18177
Figure 6. Example for a mixed event on 28 August 2014. Hov-moeller diagram of the near-surface radial velocity from lidar RHIscans at an azimuth angle of 299 and 7◦ elevation west of the li-dar and 1.6◦ east of the lidar. The black dashed line indicates theend of the western slope and the beginning of the valley floor. Winddirection (wd) was measured in 40 m a.g.l. Orange points highlightwind directions between 270 and 330◦, the main wind direction ofthe foehn.
shows that in particular on the 28 August the event can bedivided into two phases. First, a strong downslope wind withvelocities of 10 m s−1 persisted for about 4 h between 18:00and 22:00 LT and then transformed into a shallow layer withwind speed around 5 m s−1 (Fig. 6). For the first 4 h, thefoehn penetrated over 13 km into the valley, but in the secondphase it merely reached the lidar location. The observationssuggest that on 28 August a strong downslope wind eventwith strong wind speeds transformed into a shallow downs-lope flow lasting for the rest of the night.
3.3 Process understanding of foehn events affecting thewhole valley
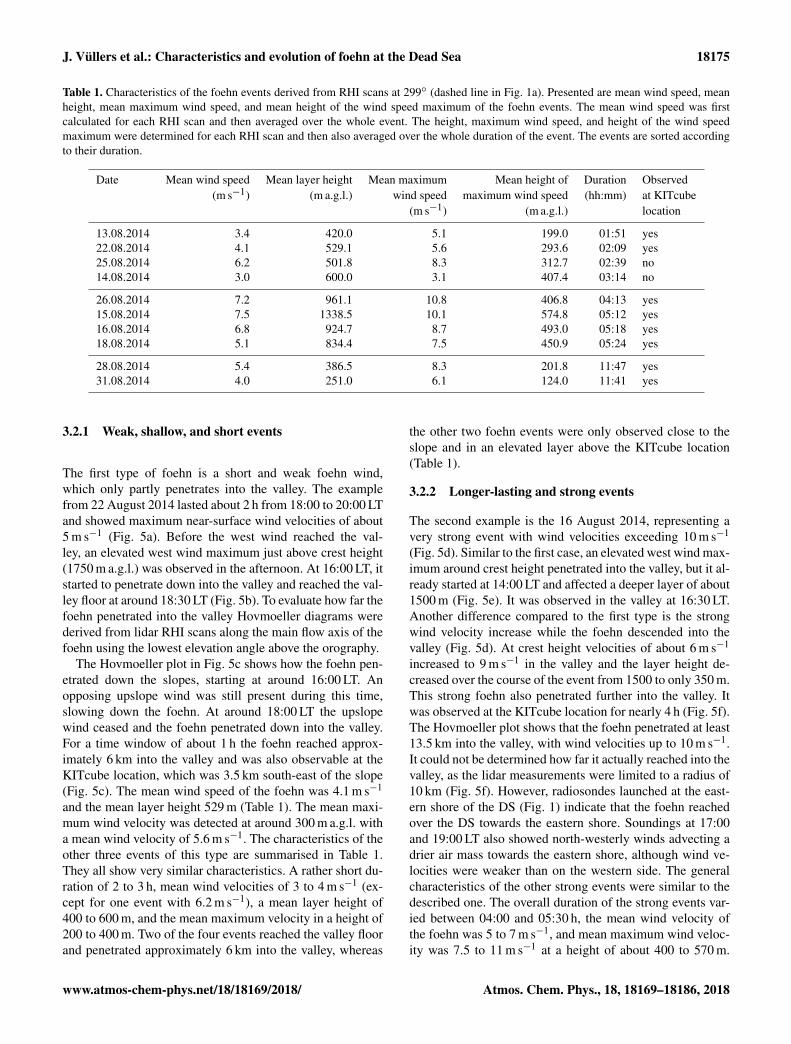
The foehn events which penetrate far into the valley obvi-ously have the strongest effects on the valley atmosphere.Through the deeper layer and the further penetration into thevalley, they cause an air mass exchange, changing tempera-ture, humidity, and aerosol concentration as well as increas-ing evaporation from the lake surface. The processes whichcause such strong events can not be determined by the resultspresented so far. Therefore, a case study was selected anda detailed analysis of the atmospheric conditions was per-formed to reveal the relevant processes leading to such strongevents. As a case study the event of the 16 August 2014 wasselected. On 16 August a typical summer synoptic system, ashallow Persian trough, extended from the Persian Gulf overIraq and Syria bending north-west towards the MediterraneanSea and Greece (Fig. 7). This resulted in westerly flow in the
lowest 1000 m a.m.s.l. downstream of the trough axis. Off-shore over the Mediterranean Sea the near-surface winds hadan intensity of about 4 m s−1 in the morning. The intensityof the trough strengthened over the course of the day andthe near-surface westerly flow over the Mediterranean Seaincreased to over 7 m s−1 in the afternoon.
The evolution of the ABL can be divided into three stages.
3.3.1 Stage I: ABL evolution prior to the foehn(07:00–15:00 LT)
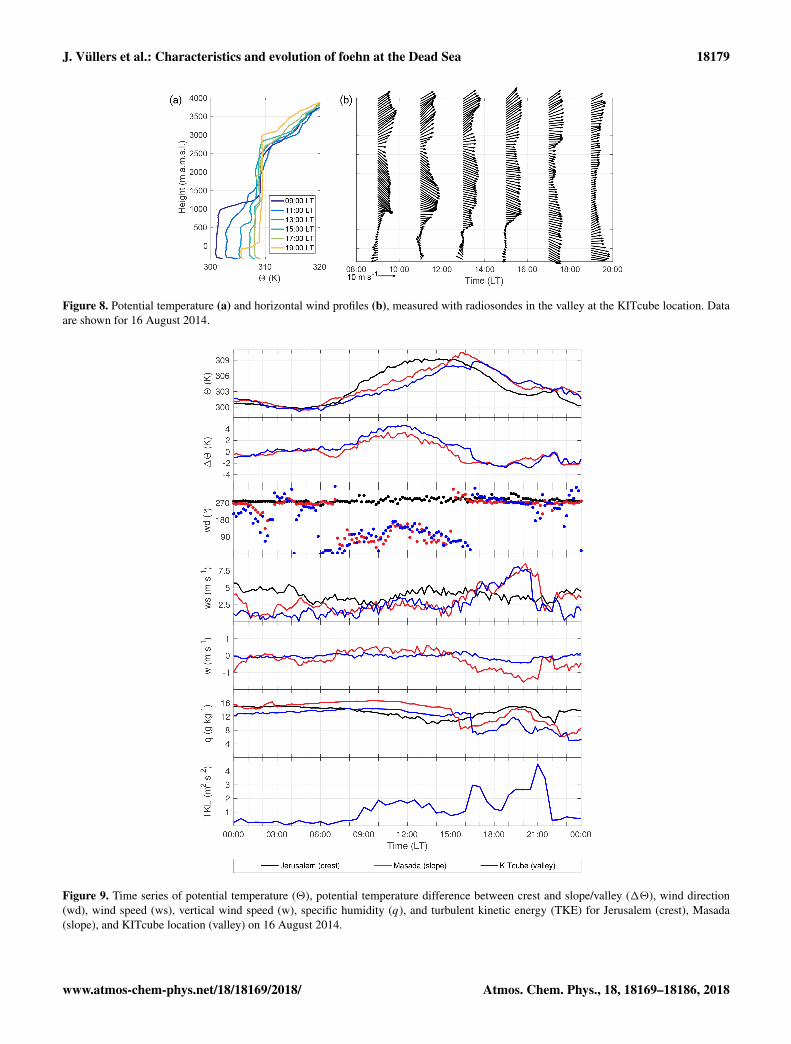
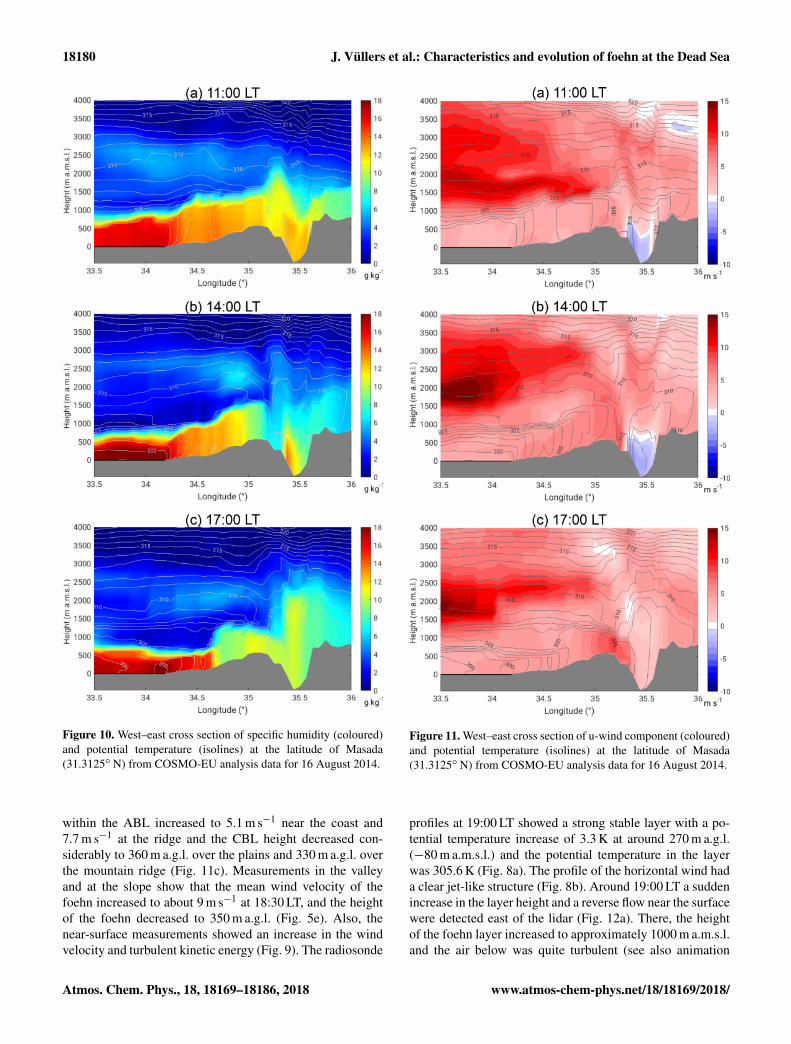
In the morning a strong temperature inversion marked theheight of the valley ABL at 900 m a.m.s.l., resulting in awell-defined capping stable layer (Fig. 8a). In the valley,two local thermally driven wind systems developed. Ups-lope winds set in around 07:00 LT, as indicated by the mea-surements at the slope (Masada) shown in Fig. 9. The winddirection changed from west to east, and the vertical windvelocity changed sign from −0.4 to 0.4 m s−1. The easterlyDS lake breeze reached the KITcube location at 09:00 LT.Wind direction turned east, the 2 m wind velocity increasedto 2 m s−1, and the diurnal temperature increase over landwas attenuated by the advection of the cooler air from thewater until 16:30 LT (Fig. 9). The onshore flow of the lakebreeze reached up to 350 m a.m.s.l. with a mean wind speedof 2.4 m s−1, and the return flow was observable between500 and 900 m a.m.s.l. in the radiosonde profile at 09:00 LT(Fig. 8b). Above the temperature inversion, the large-scaleflow was from the north-west with a wind velocity of about11 m s−1. The strong vertical wind shear between the easterlylake breeze and the strong westerly large-scale flow causedmechanically induced turbulence (Ri < 0.25), which led to adownward mixing of warmer air into the layer between 350and 900 m a.m.s.l. between 09:00 and 13:00 LT, which alsoincreased potential temperature (Fig. 8a). A temperature in-version formed at around 550 m a.m.s.l., resulting in a stablelayer with a potential temperature increase of 2 K. A sec-ondary weaker inversion at 1200 m a.m.s.l. represented theformer ABL top at 13:00 LT. Between the two inversions alayer with westerly flow and reduced wind velocities com-pared to the large-scale flow was established (Fig. 8b). Tounderstand the entire development in the valley the upstreamconditions are also relevant. The analysis of the numericalweather forecast model COSMO-EU (Steppeler et al., 2003)showed the development of a near-neutral convective bound-ary layer (CBL) over land in the morning. Through the west-erly large-scale flow, caused by the shallow Persian trough,the evolution of a well-defined Mediterranean Sea breezefront could not be observed (Figs. 10a, 11a). Neither a tem-perature decrease nor a humidity increase, the typical char-acteristics associated with a sea breeze front propagating in-land, were observable over the coastal plains. Also, in thewind field a possible MSB can not be distinguished fromthe large-scale flow. The advected air masses were mixedwithin the CBL and no frontal structure of the MSB could
www.atmos-chem-phys.net/18/18169/2018/ Atmos. Chem. Phys., 18, 18169–18186, 2018
18178 J. Vüllers et al.: Characteristics and evolution of foehn at the Dead Sea
Figure 7. Large-scale synoptic conditions on 16 August 2014, 15:00 UTC. Geopotential in gpdm at 500 hPa (black contours), surface pressurein hPa (white contours), relative topography 500–1000 hPa (coloured). Green dot indicates investigation area.
be observed. In the afternoon at 14:00 LT the large-scalenear-surface flow over the Mediterranean Sea strengthenedto approximately 8 m s−1 and advected more stratified moistand cool air towards the coastal plains (Fig. 10b). The in-version layer inhibited the CBL evolution. Potential temper-ature in the CBL over the plains stagnated at around 302 Kand the thickness of the CBL decreased from around 960 mat 11:00 LT (Fig. 11a) to 620 m at 14:00 LT (Fig. 11b). At thesame time at the mountain ridge the potential temperature ofthe CBL increased by 3 K and CBL height increased from735 to 910 m a.g.l. This indicates that the maritime air massdid not reach up the slopes at that time (Fig. 10b).
3.3.2 Stage II: development of the foehn(15:00–18:30 LT)
In the afternoon the temperature gradient between the airat the mountain ridge and in the valley changed sign at15:00 LT (Fig. 9). At the same time wind direction at theslope changed from east to west, horizontal wind velocitysuddenly increased, vertical wind velocity became negative,and specific humidity dropped (Fig. 9). This indicates thatthe air mass at ridge height started to descend into the val-ley. The descent and acceleration of the air mass can alsobe observed in the model results (Fig. 11b). In the valleyitself, the foehn was observed at the KITcube location at16:30 LT with a near-surface wind velocity of 5.5 m s−1 and astrong increase in turbulent kinetic energy (TKE) to 3 m2 s−2
(Fig. 9). The vertical extent of the foehn, calculated from
lidar data, was 1500 m a.g.l., with a mean wind velocity of6.0 to 7.0 m s−1 (Fig. 5e). The temperature profile of theradiosonde at 17:00 LT showed a near-neutral layer up to1250 m a.g.l. with 308 K, which was the temperature of theelevated layer between 550 and 1100 m a.m.s.l. at 15:00 LT(Fig. 8a). This is another indicator that the air from the ele-vated layer descended into the valley and replaced the localair mass. From 17:00 until 18:30 LT the density current had alayer height of about 1400 to 1050 m a.g.l. and the horizontalradial mean wind velocity was 6.0 to 6.5 m s−1 (Fig. 5e).
3.3.3 Stage III: intensification of the foehn(18:30–21:00 LT)
The COSMO-EU analysis showed that upstream, with de-creasing solar radiation in the evening, convection weakenedand potential temperature decreased. The mean potentialtemperature in the CBL over the coastal plains was 300.6 K,and at ridge height it was 304.3 K at 17:00 LT (Fig. 10c). Acomparison of the near-surface model results with station ob-servations from the IMS at Jerusalem and Bet Dagan showedcomparatively good agreement; however, the temperature de-crease in the afternoon occurred too early at both stations inthe model. A time shift of 1.5 h was observed, which meansthat the upstream afternoon conditions described from themodel results have to be shifted from 17:00 to 18:30 LT. Atthat time model results show that the potential temperatureat the CBL top increased by 4.1 K over the coastal plainsand at the mountain ridge by 5.0 K. The mean wind speed
Atmos. Chem. Phys., 18, 18169–18186, 2018 www.atmos-chem-phys.net/18/18169/2018/
J. Vüllers et al.: Characteristics and evolution of foehn at the Dead Sea 18179
Figure 8. Potential temperature (a) and horizontal wind profiles (b), measured with radiosondes in the valley at the KITcube location. Dataare shown for 16 August 2014.
Figure 9. Time series of potential temperature (2), potential temperature difference between crest and slope/valley (12), wind direction(wd), wind speed (ws), vertical wind speed (w), specific humidity (q), and turbulent kinetic energy (TKE) for Jerusalem (crest), Masada(slope), and KITcube location (valley) on 16 August 2014.
www.atmos-chem-phys.net/18/18169/2018/ Atmos. Chem. Phys., 18, 18169–18186, 2018
18180 J. Vüllers et al.: Characteristics and evolution of foehn at the Dead Sea
Figure 10. West–east cross section of specific humidity (coloured)and potential temperature (isolines) at the latitude of Masada(31.3125◦ N) from COSMO-EU analysis data for 16 August 2014.
within the ABL increased to 5.1 m s−1 near the coast and7.7 m s−1 at the ridge and the CBL height decreased con-siderably to 360 m a.g.l. over the plains and 330 m a.g.l. overthe mountain ridge (Fig. 11c). Measurements in the valleyand at the slope show that the mean wind velocity of thefoehn increased to about 9 m s−1 at 18:30 LT, and the heightof the foehn decreased to 350 m a.g.l. (Fig. 5e). Also, thenear-surface measurements showed an increase in the windvelocity and turbulent kinetic energy (Fig. 9). The radiosonde
Figure 11. West–east cross section of u-wind component (coloured)and potential temperature (isolines) at the latitude of Masada(31.3125◦ N) from COSMO-EU analysis data for 16 August 2014.
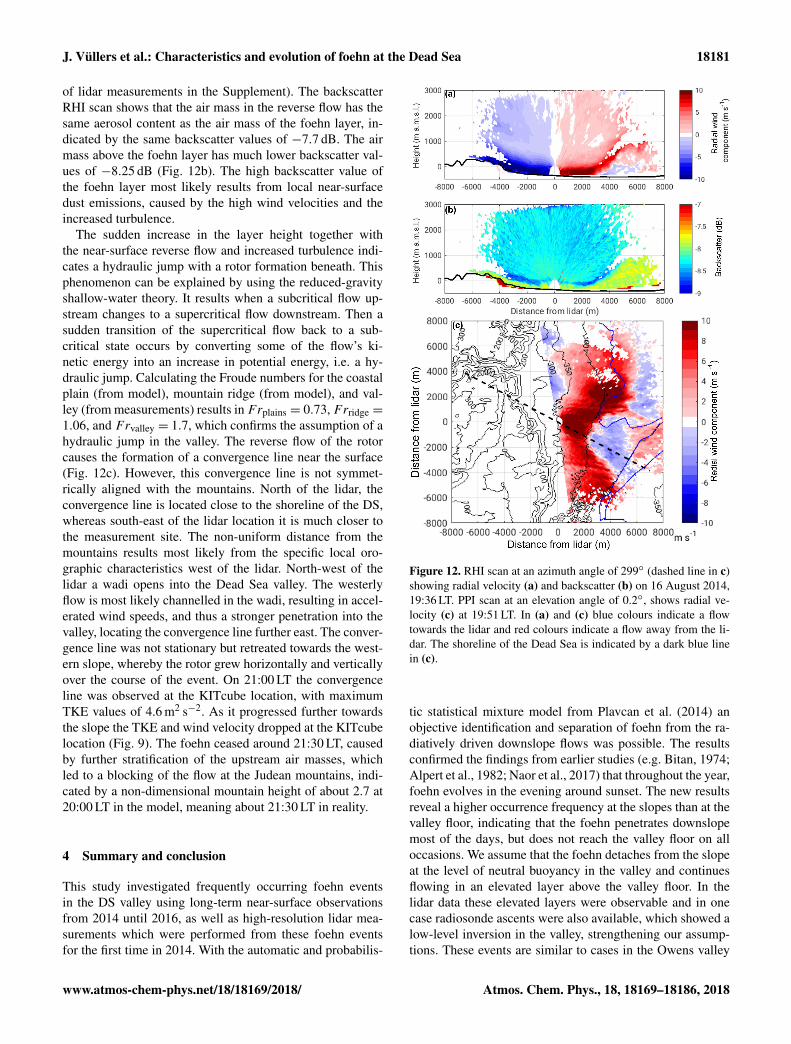
profiles at 19:00 LT showed a strong stable layer with a po-tential temperature increase of 3.3 K at around 270 m a.g.l.(−80 m a.m.s.l.) and the potential temperature in the layerwas 305.6 K (Fig. 8a). The profile of the horizontal wind hada clear jet-like structure (Fig. 8b). Around 19:00 LT a suddenincrease in the layer height and a reverse flow near the surfacewere detected east of the lidar (Fig. 12a). There, the heightof the foehn layer increased to approximately 1000 m a.m.s.l.and the air below was quite turbulent (see also animation
Atmos. Chem. Phys., 18, 18169–18186, 2018 www.atmos-chem-phys.net/18/18169/2018/
J. Vüllers et al.: Characteristics and evolution of foehn at the Dead Sea 18181
of lidar measurements in the Supplement). The backscatterRHI scan shows that the air mass in the reverse flow has thesame aerosol content as the air mass of the foehn layer, in-dicated by the same backscatter values of −7.7 dB. The airmass above the foehn layer has much lower backscatter val-ues of −8.25 dB (Fig. 12b). The high backscatter value ofthe foehn layer most likely results from local near-surfacedust emissions, caused by the high wind velocities and theincreased turbulence.
The sudden increase in the layer height together withthe near-surface reverse flow and increased turbulence indi-cates a hydraulic jump with a rotor formation beneath. Thisphenomenon can be explained by using the reduced-gravityshallow-water theory. It results when a subcritical flow up-stream changes to a supercritical flow downstream. Then asudden transition of the supercritical flow back to a sub-critical state occurs by converting some of the flow’s ki-netic energy into an increase in potential energy, i.e. a hy-draulic jump. Calculating the Froude numbers for the coastalplain (from model), mountain ridge (from model), and val-ley (from measurements) results in Frplains = 0.73, Frridge =
1.06, and Frvalley = 1.7, which confirms the assumption of ahydraulic jump in the valley. The reverse flow of the rotorcauses the formation of a convergence line near the surface(Fig. 12c). However, this convergence line is not symmet-rically aligned with the mountains. North of the lidar, theconvergence line is located close to the shoreline of the DS,whereas south-east of the lidar location it is much closer tothe measurement site. The non-uniform distance from themountains results most likely from the specific local oro-graphic characteristics west of the lidar. North-west of thelidar a wadi opens into the Dead Sea valley. The westerlyflow is most likely channelled in the wadi, resulting in accel-erated wind speeds, and thus a stronger penetration into thevalley, locating the convergence line further east. The conver-gence line was not stationary but retreated towards the west-ern slope, whereby the rotor grew horizontally and verticallyover the course of the event. On 21:00 LT the convergenceline was observed at the KITcube location, with maximumTKE values of 4.6 m2 s−2. As it progressed further towardsthe slope the TKE and wind velocity dropped at the KITcubelocation (Fig. 9). The foehn ceased around 21:30 LT, causedby further stratification of the upstream air masses, whichled to a blocking of the flow at the Judean mountains, indi-cated by a non-dimensional mountain height of about 2.7 at20:00 LT in the model, meaning about 21:30 LT in reality.
4 Summary and conclusion
This study investigated frequently occurring foehn eventsin the DS valley using long-term near-surface observationsfrom 2014 until 2016, as well as high-resolution lidar mea-surements which were performed from these foehn eventsfor the first time in 2014. With the automatic and probabilis-
Figure 12. RHI scan at an azimuth angle of 299◦ (dashed line in c)showing radial velocity (a) and backscatter (b) on 16 August 2014,19:36 LT. PPI scan at an elevation angle of 0.2◦, shows radial ve-locity (c) at 19:51 LT. In (a) and (c) blue colours indicate a flowtowards the lidar and red colours indicate a flow away from the li-dar. The shoreline of the Dead Sea is indicated by a dark blue linein (c).
tic statistical mixture model from Plavcan et al. (2014) anobjective identification and separation of foehn from the ra-diatively driven downslope flows was possible. The resultsconfirmed the findings from earlier studies (e.g. Bitan, 1974;Alpert et al., 1982; Naor et al., 2017) that throughout the year,foehn evolves in the evening around sunset. The new resultsreveal a higher occurrence frequency at the slopes than at thevalley floor, indicating that the foehn penetrates downslopemost of the days, but does not reach the valley floor on alloccasions. We assume that the foehn detaches from the slopeat the level of neutral buoyancy in the valley and continuesflowing in an elevated layer above the valley floor. In thelidar data these elevated layers were observable and in onecase radiosonde ascents were also available, which showed alow-level inversion in the valley, strengthening our assump-tions. These events are similar to cases in the Owens valley
www.atmos-chem-phys.net/18/18169/2018/ Atmos. Chem. Phys., 18, 18169–18186, 2018
18182 J. Vüllers et al.: Characteristics and evolution of foehn at the Dead Sea
Figure 13. Conceptual model describing the different boundary layer processes in the valley on 16 August 2014. (a) The temporal evolutionof the different layers and wind systems. The coloured areas refer to the distinct layers detected. Hatched areas describe distinct processesdescribed in the text, and red arrows in the legend show the main wind direction in the respective layer. Panel (b) shows the wind systems(arrows) and the ongoing processes (shaded areas) leading to the next stage for morning, noon, afternoon, and evening.
described by Mayr and Armi (2010), where gap flows alsodetached from the slope at the level of neutral buoyancy.
Two main types of foehn in the DS valley could be iden-tified with these new data: weak and rather short events andstrong, longer-lasting events which affect the whole valley,leading to a complete air mass exchange. In contrast to ma-jor downslope windstorms in other regions of the world (e.g.Brinkmann, 1974; Mobbs et al., 2005; Grubišic et al., 2008;Gohm et al., 2008) foehn at the DS occurs on a diurnal scaleand only for a few hours per evening. This already shows thatit is not synoptically driven but depends on diurnal local and
mesoscale processes, such as the delayed development andcooling of the valley ABL or the MSB reaching the Judeanmountains in the afternoon, both leading to a horizontal tem-perature gradient across the mountain range. In the presentedcase of a strong foehn event, the delayed cooling of the val-ley ABL in the afternoon led to the initiation of the foehn,which was then intensified by supercritical flow conditions,leading to a hydraulic jump and a rotor formation in the val-ley. A conceptual model was developed to summarise andillustrate the temporal and spatial interactions of the respon-sible mechanisms for such an event, based on the results of
Atmos. Chem. Phys., 18, 18169–18186, 2018 www.atmos-chem-phys.net/18/18169/2018/
J. Vüllers et al.: Characteristics and evolution of foehn at the Dead Sea 18183
the 16 August 2014 (Fig. 13). The model was divided intofour steps:
– Morning. A strong temperature inversion decoupled thevalley ABL from the large-scale flow and thermallydriven upslope winds and a lake breeze developed inthe valley after sunrise (Fig. 13). A strong wind shearbetween the easterly lake breeze in the valley and thestrong westerly large-scale flow produced turbulence atthe top of the valley ABL, indicated by a Richardsonnumber below 0.25 (striped area in Fig. 13a and b).
Due to the turbulence, warmer air from above wasmixed into the upper part of the valley ABL, and asecondary temperature inversion below mountain ridgeheight evolved. Even though the turbulent mixing de-creased the inversion height, an undisturbed valley ABLexisted below the inversion.
– Midday. Between the two temperature inversions belowand above ridge height a westerly flow with reducedwind speed formed a layer between the valley ABLwith its easterly lake breeze and upslope winds and thelarge-scale strong westerly flow. The valley itself wasfurther heated by radiative forcing, which was concen-trated within the reduced air volume in the valley belowthe lower inversion. The topographic amplification fac-tor (Wagner, 1932; Steinacker, 1984) strengthened thevalley heating additionally.
– Afternoon. At the ridge radiative cooling set in anderoded the inversion below ridge height. The cooler airfrom the flowing layer formed a deep foehn flowingdown the slope. While descending into the valley thewind velocity accelerated. A change in the upstreamconditions triggered the further development. The up-stream subcritical flow reached a critical stage aroundridge height, as indicated by the calculated Froude num-bers of 0.73 over the coastal plains and 1.06 at themountain ridge.
– Evening. This transition upstream led to supercriticalflow conditions downstream in the valley (Fr = 1.7).The layer height of the foehn in the valley decreasedstrongly and wind velocity increased. In the valley theflow went from supercritical to a subcritical state form-ing a hydraulic jump with a rotor beneath. The layerheight increased suddenly and mean wind velocities de-creased, generating severe turbulence. The rotor led tothe formation of a convergence line near the ground.Finally, blocking of the upstream air masses by themountains stopped the foehn, as indicated by a non-dimensional mountain height of 2.7.
This study showed that foehn at the DS is initiated by thehorizontal variation in boundary-layer temperature across themountain range. This is caused by an amplified heating of the
valley ABL together with a delayed ABL development in theDS valley compared to the upstream boundary layer, as pre-sented in this study. It can also be caused by the arrival ofthe cool MSB at the western side of the mountains, as shownby various other studies (Ashbel and Brooks, 1939; Bitan,1974; Segal et al., 1985; Lensky and Dayan, 2012; Naoret al., 2017). The obtained results of this study are highlyrelevant for the DS region. They show that the foehn eventsare variable with respect to their strength, layer height, andpenetration into the valley. This is particularly important forthe temperature, humidity, and aerosol distribution in the val-ley, as well as for the evaporation from the DS water surface.In particular, the coupling to evaporation is of high impor-tance as evaporation is the main loss of water from the DS(Metzger et al., 2018), determining the rate of the DS shrink-ing. We conclude that for correct climate, weather, and alsoevaporation forecasts in the region it is therefore important tocorrectly represent the boundary layer processes in the valley,in particular the inversion heights and the diurnal valley heat-ing, as well as the occurring thermal wind systems, the ABLdevelopment upstream, and the interaction with the MSB. Inlight of the ongoing climate change, and the shrinking of theDS, daily maximum temperatures in the valley could furtherincrease, making a penetration of foehn down into the valleymore likely in the future. This of course would further in-crease evaporation and the shrinking of the DS, resulting in apositive feedback cycle and changing the diurnal temperatureand humidity range.
These results also contribute to the wider understanding ofthe boundary layer processes in smaller valleys under weaksynoptic forcing, where thermally driven local and mesoscalewind systems govern the wind field. Thermally driven foehnevents similar to the ones in the DS valley were also observedin other areas of the world. The Washoe Zephyr occurs atthe eastern slope of the Sierra Nevada and is driven by theasymmetric heating between the lower western side and theelevated semi-arid Great Basin (Zhong et al., 2008). At thelee side of the Cascade Mountains the winds are triggeredby the temperature gradient between the semi-desert area onthe lee side and the marine air masses on the upstream sideclose to the Pacific Ocean coast (Doran and Zhong, 1994)and a similar phenomena was found by Bossert (1997) for theMexico City basin. Even though these wind systems differ inscale, the trigger mechanism is similar in all cases and theycan have a large impact on the local aerosol concentrationand dispersion as well as on the local climatic conditions.
Data availability. Metadata for all measurements are publiclyavailable via https://www.deserve-vi.net/index.php/publications(Nied, 2016). Data can be accessed by contacting the personresponsible, given in the metadata.
www.atmos-chem-phys.net/18/18169/2018/ Atmos. Chem. Phys., 18, 18169–18186, 2018
18184 J. Vüllers et al.: Characteristics and evolution of foehn at the Dead Sea
Supplement. The supplement related to this article is availableonline at: https://doi.org/10.5194/acp-18-18169-2018-supplement.
Author contributions. JV analysed the measurements and devel-oped the conceptual model. GM performed the occurrence fre-quency calculations using the automatic and probabilistic statisticalmixture model. UC and CK developed the measurement strategy,supervised the work and contributed to the discussion. JV preparedthe figures and the paper, which was then improved by all authors.
Competing interests. The authors declare that they have no conflictof interest.
Special issue statement. This article is part of the special issue“Environmental changes and hazards in the Dead Sea region(NHESS/ACP/HESS/SE inter-journal SI)”. It is not associated witha conference.
Acknowledgements. The current study was carried out in theframework of the DEad SEa Research VEnue (DESERVE)(https://www.deserve-vi.net, last access: 17 December 2018),an international project funded by the Helmholtz Association ofGerman Research Centres as a Virtual Institute (VH-VI-527),their partners, and their own contributions. We acknowledge ourproject partners, Pinhas Alpert, and his working group from TelAviv University for their support, as well as the National ParksAuthority Masada, in particular Eitan Campbell, for providing themeasurement location. Furthermore, we acknowledge support byDeutsche Forschungsgemeinschaft and Open Access PublishingFund of Karlsruhe Institute of Technology. The authors also thankthe editor and the anonymous referees for their insightful remarks,which helped to improve the paper.
The article processing charges for this open-accesspublication were covered by a ResearchCentre of the Helmholtz Association.
Edited by: Pinhas AlpertReviewed by: two anonymous referees
References
Adler, B. and Kalthoff, N.: Multi-scale Transport Processes Ob-served in the Boundary Layer over a Mountainous Island, Bound.Lay. Meteorol., 153, 515–537, https://doi.org/10.1007/s10546-014-9957-8, 2014.
Alpert, P., Cohen, A., Neumann, J., and Doron, E.: A model sim-ulation of the summer circulation from the Eastern Mediter-ranean past Lake Kinneret in the Jordan Valley, Mon.Weather Rev., 110, 994–1006, https://doi.org/10.1175/1520-0493(1982)110<0994:amsots>2.0.co;2, 1982.
Alpert, P., Abramsky, R., and Neeman, B. U.: The prevailing sum-mer synoptic system in Israel – Subtropical high, not PersianTrough, Israel J. Earth Sci., 39, 93–102, 1990.
Alpert, P., Shafir, H., and Issahary, D.: Recent changes in the climateat the Dead Sea – a preliminary study, Climatic Change, 37, 513–537, https://doi.org/10.1023/A:1005330908974, 1997.
Ashbel, D. and Brooks, C.: The influence of the Dead Sea on theclimate of its neighbourhood, Q. J. Roy. Meteor. Soc., 65, 185–194, https://doi.org/10.1002/qj.49706528005, 1939.
Atkinson, B.: Meso-scale atmospheric circulations, AcademicPress, London, 1981.
Bischoff-Gauß, I., Kalthoff, N., Khodayar, S., Fiebig-Wittmaack,M., and Montecinos, S.: Model simulations of the boundary-layer evolution over an arid Andes valley, Bound. Lay. Meteo-rol., 128, 357–379, https://doi.org/10.1007/s10546-008-9293-y,2008.
Bitan, A.: The wind regime in the north-west section ofthe Dead-Sea, Arch. Meteor. Geophy. B, 22, 313–335,https://doi.org/10.1007/bf02246585, 1974.
Bitan, A.: The influence of the special shape of the Dead-Sea andits environment on the local wind system, Arch. Meteor. Geophy.B, 24, 283–301, https://doi.org/10.1007/bf02263460, 1976.
Bossert, J. E.: An investigation of flow regimes af-fecting the Mexico City region, J. Appl. Mete-orol., 36, 119–140, https://doi.org/10.1175/1520-0450(1997)036<0119:aiofra>2.0.co;2, 1997.
Bougeault, P., Clar, A. J., Benech, B., Carissimo, B.,Pelon, J., and Richard, E.: Momentum budget overthe Pyrenees: The PYREX experiment, B. Am. Me-teorol. Soc., 71, 806–818, https://doi.org/10.1175/1520-0477(1990)071<0806:mbotpt>2.0.co;2, 1990.
Bougeault, P., Binder, P., Buzzi, A., Dirks, R., Kuettner, J.,Houze, R., Smith, R. B., Steinacker, R., and Volkert,H.: The MAP special observing period, B. Am. Me-teorol. Soc., 82, 433–462, https://doi.org/10.1175/1520-0477(2001)082<0433:tmsop>2.3.co;2, 2001.
Brinkmann, W. A. R.: Strong Downslope Windsat Boulder, Colorado, Mon. Weather Rev.,102, 592–602, https://doi.org/10.1175/1520-0493(1974)102<0592:sdwabc>2.0.co;2, 1974.
Browning, K. and Wexler, R.: The determination of kine-matic properties of a wind field using Doppler radar, J.Appl. Meteorol., 7, 105–113, https://doi.org/10.1175/1520-0450(1968)007<0105:tdokpo>2.0.co;2, 1968.
Corsmeier, U., Behrendt, R., Drobinski, P., and Kottmeier,C.: The mistral and its effect on air pollution trans-port and vertical mixing, Atmos. Res., 74, 275–302,https://doi.org/10.1016/j.atmosres.2004.04.010, 2005.
Davies, H. and Pichler, H.: Mountain meteorology and ALPEX– An introduction, Meteorol. Atmos. Phys., 43, 3–4,https://doi.org/10.1007/bf01028104, 1990.
Doran, J. and Zhong, S.: Regional drainage flowsin the Pacific Northwest, Mon. Weather Rev.,122, 1158–1167, https://doi.org/10.1175/1520-0493(1994)122<1158:rdfitp>2.0.co;2, 1994.
Doron, E. and Neumann, J.: Land and mountain breezes with spe-cial attention to Israel’s Mediterranean coastal plain, Tech. rep.,Israel Atomic Energy Commission, Tel Aviv, 1978.
Atmos. Chem. Phys., 18, 18169–18186, 2018 www.atmos-chem-phys.net/18/18169/2018/
J. Vüllers et al.: Characteristics and evolution of foehn at the Dead Sea 18185
Durran, D. R.: Downslope winds, Encyclopedia of AtmosphericSciences, 644–650, 2003.
Fast, J. D. and Zhong, S.: Meteorological factors associatedwith inhomogeneous ozone concentrations within the Mex-ico City basin, J. Geophys. Res.-Atmos., 103, 18927–18946,https://doi.org/10.1029/98jd01725, 1998.
Fast, J. D., Allwine, K. J., Dietz, R. N., Clawson, K. L., and Torcol-ini, J. C.: Dispersion of Perfluorocarbon Tracers within the SaltLake Valley during VTMX 2000, J. Appl. Meteorol. Clim., 45,793–812, https://doi.org/10.1175/jam2371.1, 2006.
Fernando, H. J. S., Pardyjak, E. R., Di Sabatino, S., Chow, F. K.,De Wekker, S. F. J., Hoch, S. W., Hacker, J., Pace, J. C., Pratt, T.,Pu, Z., Steenburgh, W. J., Whiteman, C. D., Wang, Y., Zajic, D.,Balsley, B., Dimitrova, R., Emmitt, G. D., Higgins, C. W., Hunt,J. C. R., Knievel, J. C., Lawrence, D., Liu, Y., Nadeau, D. F., Kit,E., Blomquist, B. W., Conry, P., Coppersmith, R. S., Creegan,E., Felton, M., Grachev, A., Gunawardena, N., Hang, C., Hocut,C. M., Huynh, G., Jeglum, M. E., Jensen, D., Kulandaivelu, V.,Lehner, M., Leo, L. S., Liberzon, D., Massey, J. D., McEner-ney, K., Pal, S., Price, T., Sghiatti, M., Silver, Z., Thompson, M.,Zhang, H., and Zsedrovits, T.: The MATERHORN: Unravelingthe intricacies of mountain weather, B. Am. Meteorol. Soc., 96,1945–1967, https://doi.org/10.1175/bams-d-13-00131.1, 2015.
Gohm, A., Mayr, G. J., Fix, A., and Giez, A.: On the onset of boraand the formation of rotors and jumps near a mountain gap, Q.J. Roy. Meteor. Soc., 134, 21–46, https://doi.org/10.1002/qj.206,2008.
Grubišic, V., Doyle, J. D., Kuettner, J., Mobbs, S., Smith, R.B., Whiteman, C. D., Dirks, R., Czyzyk, S., Cohn, S. A.,Vosper, S., Weissmann, M., Haimov, S., De Wekker, S. F.J., Pan, L. L., and Chow, F. K.: The Terrain-Induced Ro-tor Experiment: A field campaign overview including obser-vational highlights, B. Am. Meteorol. Soc., 89, 1513–1533,https://doi.org/10.1175/2008bams2487.1, 2008.
Hecht, A. and Gertman, I.: Dead Sea meteorological climate, in:Fungal Life in the Dead Sea, edited by: Nevo, E., Oren, A.,and Wasser, S., International Center for Cryptogamic Plants andFungi, Haifa, 68–114, 2003.
Holla, R., Schmitt, S., Frieß, U., Pöhler, D., Zingler, J., Corsmeier,U., and Platt, U.: Vertical distribution of BrO in the bound-ary layer at the Dead Sea, Environ. Chem., 12, 438–460,https://doi.org/10.1071/en14224, 2015.
Jackson, P. L., Mayr, G., and Vosper, S.: Dynamically-drivenwinds, in: Mountain Weather Research and Forecasting: Re-cent Progress and Current Challenges, edited by: Chow, K. F.,De Wekker, F. S., and Snyder, J. B., 121–218, Springer Nether-lands, Dordrecht, https://doi.org/10.1007/978-94-007-4098-3_3,2013.
Kalthoff, N., Horlacher, V., Corsmeier, U., Volz-Thomas, A., Kolah-gar, B., Geiß, H., Möllmann-Coers, M., and Knaps, A.: Influenceof valley winds on transport and dispersion of airborne pollutantsin the Freiburg-Schauinsland area, J. Geophys. Res.-Atmos, 105,1585–1597, https://doi.org/10.1029/1999jd900999, 2000.
Kalthoff, N., Adler, B., Wieser, A., Kohler, M., Träumner, K.,Handwerker, J., Corsmeier, U., Khodayar, S., Lambert, D., Kop-mann, A., Kunka, N., Dick, G., Ramatschi, M., Wickert, J., andKottmeier, C.: KITcube–a mobile observation platform for con-vection studies deployed during HyMeX, Meteorol. Z., 22, 633–647, https://doi.org/10.1127/0941-2948/2013/0542, 2013.
Kottmeier, C., Agnon, A., Al-Halbouni, D., Alpert, P., Corsmeier,U., Dahm, T., Eshel, A., Geyer, S., Haas, M., Holohan, E.,Kalthoff, N., Kishcha, P., Krawczyk, C., Lati, J., Laronne,J. B., Lott, F., Mallast, U., Merz, R., Metzger, J., Mohsen,A., Morin, E., Nied, M., Rödiger, T., Salameh, E., Sawarieh,A., Shannak, B., Siebert, C., and Weber, M.: New per-spectives on interdisciplinary earth science at the Dead Sea:The DESERVE project, Sci. Total Environ., 544, 1045–1058,https://doi.org/10.1016/j.scitotenv.2015.12.003, 2016.
Lehner, M., Whiteman, C. D., Hoch, S. W., Crosman, E. T., Jeglum,M. E., Cherukuru, N. W., Calhoun, R., Adler, B., Kalthoff, N.,Rotunno, R., Horst, T. W., Semmer, S., Brown, W. O. J., Oncley,S. P., Vogt, R., Grudzielanek, A. M., Cermak, J., Fonteyne, N.J., Bernhofer, C., Pitacco, A., and Klein, P.: The METCRAX IIfield experiment: A study of downslope windstorm-type flows inArizonas Meteor Crater, B. Am. Meteorol. Soc., 97, 217–235,https://doi.org/10.1175/bams-d-14-00238.1, 2016.
Lensky, I. M. and Dayan, U.: Continuous detection and charac-terization of the Sea Breeze in clear sky conditions using Me-teosat Second Generation, Atmos. Chem. Phys., 12, 6505–6513,https://doi.org/10.5194/acp-12-6505-2012, 2012.
Levin, Z., Gershon, H., and Ganor, E.: Vertical distribu-tion of physical and chemical properties of haze particlesin the Dead Sea valley, Atmos. Environ., 39, 4937–4945,https://doi.org/10.1016/j.atmosenv.2005.04.039, 2005.
Long, R. R.: Some Aspects of the Flow of Stratified Fluids:II. Experiments with a Two-Fluid System, Tellus, 6, 97–115,https://doi.org/10.1111/j.2153-3490.1954.tb01100.x, 1954.
Mayr, G. J. and Armi, L.: The influence of downstream diurnal heat-ing on the descent of flow across the Sierras, J. Appl. Meteorol.Clim., 49, 1906–1912, https://doi.org/10.1175/2010jamc2516.1,2010.
Metzger, J., Nied, M., Corsmeier, U., Kleffmann, J., and Kottmeier,C.: Dead Sea evaporation by eddy covariance measurementsvs. aerodynamic, energy budget, Priestley-Taylor, and Pen-man estimates, Hydrol. Earth Syst. Sci., 22, 1135–1155,https://doi.org/10.5194/hess-22-1135-2018, 2018.
Mobbs, S., Vosper, S., Sheridan, P., Cardoso, R., Burton, R., Arnold,S., Hill, M., Horlacher, V., and Gadian, A.: Observations ofdownslope winds and rotors in the Falkland Islands, Q. J. Roy.Meteor. Soc., 131, 329–351, https://doi.org/10.1256/qj.04.51,2005.
Naor, R., Potchter, O., Shafir, H., and Alpert, P.: An observationalstudy of the summer Mediterranean Sea breeze front penetrationinto the complex topography of the Jordan Rift Valley, Theor.Appl. Climatol., 127, 275–284, https://doi.org/10.1007/s00704-015-1635-3, 2017.
Nied, M.: DESERVE_measurement_data_20160421, available at:https://www.deserve-vi.net/index.php/publications (last access:6 December 2018), 2016.
Pettre, P.: On the problem of violent valley winds, J. At-mos. Sci., 39, 542–554, https://doi.org/10.1175/1520-0469(1982)039<0542:OTPOVV>2.0.CO;2, 1982.
Plavcan, D., Mayr, G. J., and Zeileis, A.: Automatic and probabilis-tic foehn diagnosis with a statistical mixture model, J. Appl. Me-teor. Climatol., 53, 652–659, https://doi.org/10.1175/jamc-d-13-0267.1, 2014.
Schär, C. and Smith, R. B.: Shallow-water flow past isolatedtopography. Part I: Vorticity production and wake formation,
www.atmos-chem-phys.net/18/18169/2018/ Atmos. Chem. Phys., 18, 18169–18186, 2018
18186 J. Vüllers et al.: Characteristics and evolution of foehn at the Dead Sea
J. Atmos. Sci., 50, 1373–1400, https://doi.org/10.1175/1520-0469(1993)050<1373:swfpit>2.0.co;2, 1993.
Segal, M., Mahrer, Y., and Pielke, R. A.: A study of meteoro-logical patterns associated with a lake confined by mountains:the Dead Sea case, Q. J. Roy. Meteor. Soc., 109, 549–564,https://doi.org/10.1002/qj.49710946107, 1983.
Segal, M., Mahrer, Y., Pielke, R. A., and Kessler, R. C.: Model eval-uation of the summer daytime induced flows over southern Israel,Israel J. Earth. Sci, 34, 39–46, 1985.
Shafir, H. and Alpert, P.: Regional and local climatic effectson the Dead-Sea evaporation, Climatic Change, 105, 455–468,https://doi.org/10.1007/s10584-010-9892-8, 2011.
Steinacker, R.: Area-height distribution of a valley and its relation tothe valley wind, Beiträge zur Physik der Atmosphäre, 57, 64–71,1984.
Steppeler, J., Doms, G., Schättler, U., Bitzer, H., Gassmann, A.,Damrath, U., and Gregoric, G.: Meso-gamma scale forecasts us-ing the nonhydrostatic model LM, Meteorol. Atmos. Phys., 82,75–96, https://doi.org/10.1007/s00703-001-0592-9, 2003.
Träumner, K.: Einmischprozesse am Oberrand der konvektiven at-mosphärischen Grenzschicht, Wissenschaftliche Berichte des In-stituts für Meteorologie und Klimaforschung des Karlsruher In-stituts für Technologie; Vol. 51, KIT Scientific Publishing, Karl-sruhe, zugl.: Karlsruhe, KIT, Diss., 2010, 2012.
Wagner, A.: Neue Theorie des Berg-und Talwindes, Meteorol. Z.,49, 329–341, 1932.
Weiss, M., Cohen, A., and Mahrer, Y.: Upper atmosphere measure-ments and meteorological measurements on the Dead Sea, Tech.rep., Ministry of Energy and Infrastructure (in Hebrew), 19 pp.,1988.
Whiteman, C.: Mountain Meteorology: fundamentalsand applications, Oxford Univ. Press, New York,https://doi.org/10.5860/choice.38-2212, 2000.
Whiteman, C. D., Muschinski, A., Zhong, S., Fritts, D., Hoch, S.W., Hahnenberger, M., Yao, W., Hohreiter, V., Behn, M., Cheon,Y., Clements, C. B., Horst, T. W., Brown, W. O. J., and On-cley, S. P.: METCRAX 2006: Meteorological experiments in ari-zona’s meteor crater, B. Am. Meteorol. Soc., 89, 1665–1680,https://doi.org/10.1175/2008BAMS2574.1, 2008.
WMO: International meteorological vocabulary, Secretariat of theWorld Meteorolog. Organization, 2nd edn., 1992.
Zardi, D. and Whiteman, C. D.: Diurnal Mountain Wind Sys-tems, in: Mountain Weather Research and Forecasting: Re-cent Progress and Current Challenges, edited by: Chow, K. F.,De Wekker, F. S., and Snyder, J. B., 35–119, Springer Nether-lands, Dordrecht, https://doi.org/10.1007/978-94-007-4098-3_2,2013.
Zhong, S., Li, J., Clements, C. B., De Wekker, S. F., and Bian, X.:Forcing mechanisms for Washoe Zephyr-A daytime downslopewind system in the lee of the Sierra Nevada, J. Appl. Meteorol.Clim., 47, 339–350, https://doi.org/10.1175/2007JAMC1576.1,2008.
Atmos. Chem. Phys., 18, 18169–18186, 2018 www.atmos-chem-phys.net/18/18169/2018/


![Diurnal and Nocturnal Animals. Diurnal Animals Diurnal is a tricky word! Let’s all say that word together. Diurnal [dahy-ur-nl] A diurnal animal is an](https://img.pdfslide.us/doc/110x75/56649dda5503460f94ad083f/diurnal-and-nocturnal-animals-diurnal-animals-diurnal-is-a-tricky-word-lets.jpg)