Embed Size (px)
Citation preview
Characteristics and catalytic behavior of NiAlCecatalysts in the hydrogenation of canola oil: the effectof cerium on cis/trans selectivity
Marcin Konkol1 • Robert Bicki1 • Małgorzata Kondracka1•
Katarzyna Antoniak-Jurak1• Paweł Wiercioch1
•
Wiesław Prochniak1
Received: 21 June 2016 / Accepted: 31 August 2016 / Published online: 13 September 2016
� The Author(s) 2016. This article is published with open access at Springerlink.com
Abstract A series of co-precipitated cerium-promoted nickel–aluminum catalysts
was prepared. The physicochemical properties of the precursors were analyzed by
means of various methods including XRF, HT-XRD, TPR, surface area and thermal
decomposition as well as porosity measurements. The activity and selectivity of the
NiAlCe catalysts in the hydrogenation reaction of canola oil were investigated and
the results compared to those for the cerium-free catalyst. Besides improving some
physicochemical properties of the precursors, the addition of cerium significantly
improved the cis/trans selectivity, yet at the expense of some loss of the activity in
case of larger cerium loadings. Upon addition of a relatively low amount of cerium
(0.67 wt%) the content of the C18:1 trans fraction decreased by ca. 35 %. Together
with the synergistic effect of the hydrogen pressure a significant decrease of the
C18:1 trans fraction by ca. 48 % could be achieved. Furthermore, compared to the
cerium-free catalyst, the addition of cerium resulted in a slower drop of the C18:1
cis fraction and a slower increase of the C18:0 fraction in time during the hydro-
genation process.
Keywords Nickel catalyst � Cerium � Hydrogenation � Canola oil � Cis/transselectivity � Fatty acids
Introduction
In industrial practice, the hydrogenation of vegetable oils is most often carried out
on nickel catalysts [1, 2]. The main disadvantage of nickel catalysts is the necessity
to perform the process at higher temperatures ([150 �C) at which adverse cis/trans
& Marcin Konkol
1 New Chemical Syntheses Institute, Al. Tysiaclecia Panstwa Polskiego 13A, 24-110 Puławy,
Poland
123
Reac Kinet Mech Cat (2016) 119:595–613
DOI 10.1007/s11144-016-1080-z
isomerization is favored. The content of TFA isomers (trans fatty acids) in
vegetable oils hydrogenated on nickel catalysts reaches up to 40–50 %, whereas the
content of positional isomers can be in the range of 30–60 % [3]. Trans isomers of
fatty acids have higher melting points than cis forms. Therefore, from the process
viewpoint isomerization to trans forms is desirable, since a moderate growth of the
melting point of oil is achieved at lower degree of hydrogenation, which translates
into lower hydrogen consumption and therefore lower costs. However, this process
is very unfavorable from a medical point of view. Research findings show that TFAs
formed during hydrogenation are deposited on the walls of blood vessels, eventually
leading to their obstruction and consequently increasing the risk of coronary heart
disease [4, 5]. Moreover, TFAs reduce the level of high density cholesterol fraction
(‘‘good cholesterol’’, HDL) and increase the level of low density cholesterol fraction
(‘‘bad cholesterol’’, LDL) [6, 7]. Studies on the consumption of fats in food carried
out by Mozaffarian et al. suggest even a four to fivefold increase in the risk of
coronary heart disease when saturated fats are replaced with trans unsaturated fats
[8].
The adverse effects of TFA isomers generated during conventional hydrogena-
tion on nickel catalysts have triggered research on new type of catalysts (e.g.,
zeolites, precious metals) [3, 9–12], novel process solutions (e.g., electrocatalytic
hydrogenation, hydrogenation in liquids under supercritical conditions) [13] and
modifications of fat components by interesterification, fractionation or blending
[14]. Despite an intensive development of alternative methods to obtain semi-solid
and solid fatty components, which do not contain TFAs and have the desired
melting point and physicochemical properties, conventional hydrogenation remains
an easier and often less expensive method to obtain components with defined
properties that are used for the manufacture of fatty products e.g., margarines and
confectionery fats. Apart from the genetic modifications of edible oils that enable to
obtain oils with a large proportion of monounsaturated fatty acids, ‘‘shallow’’
hydrogenation through partial saturation of double bonds is the only means to
increase thermal and oxidative stability of many highly unsaturated edible oils (e.g.,
soybean, sunflower, canola).
However, a necessary condition imposed now on the process of partial
hydrogenation of vegetable oils is to eliminate the formation of trans fatty acids,
while maintaining desired physical properties and stability of hydrogenated fat
components. This limitation of trans isomers should ideally go hand in hand with as
small as possible increase in the proportion of saturated fatty acids, mainly stearic
acid, whose presence affects taste of the product (‘‘sand taste’’). Therefore, the oil
industry is still looking for new selective hydrogenation catalysts or modifications
of this process that could enable to obtain partially hydrogenated products free of
trans isomers, while simultaneously maintaining appropriate content of saturated
fatty acids. Additionally, the process should be characterized by low investment
costs and it should remain relatively cost-effective, which in the case of many
proposed methods for reducing the amount of trans isomers would be problematic
or difficult to accomplish. For these reasons, despite many efforts of researchers, the
elimination of trans isomers remains one of the main challenges of the oil industry
and is still a subject of ongoing research.
596 Reac Kinet Mech Cat (2016) 119:595–613
123

Cerium oxide and cerium-promoted catalysts have been reported to exhibit
catalytic activity and improve the selectivity in hydrogenation of various organic
substrates [15–17] as well as carbon oxides [18–22]. However, in the literature data,
there are hardly any reports on the activity of cerium compounds in hydrogenation
reactions of oils and fats. To the best of our knowledge the only report by Alouche
et al. concerns only ‘‘shallow’’ hydrogenation with a change of iodine value (IV) of
7–10 units [23]. During such mild hydrogenation the trans isomers are formed to
much lesser extent.
The subject of our studies is the investigation of the physicochemical properties
of cerium-promoted nickel–aluminum precursors and catalysts, their catalytic
activity and selectivity in the deeper hydrogenation reaction of canola oil to the
iodine value of ca. 70 (DIV = ca. 45) at a wide range of hydrogen pressures. Such
depth of hydrogenation corresponds to that in the production of fatty acid
components for margarine and shortenings on an industrial scale.
Experimental
Materials and synthesis
As feedstock, a refined, bleached, low-erucic acid canola oil was used. The nickel
catalysts were prepared from the corresponding NiAlCe precursors obtained by
means of co-precipitation. The precursor is chemically a mixture of nickel–
aluminum hydroxycarbonates with a general formula: NimAln(CO3)x(OH)y�zH2O.
The co-precipitation was carried out in a continuous mode from aqueous solutions
of nickel and cerium nitrates and an aqueous solution of sodium aluminate using a
Na2CO3/NaOH mixture with a molar ratio 2:1 as a precipitating agent. The
appropriate concentrations of reagents were chosen so that the desired stoichiometry
of precursors was ensured. The co-precipitation was carried out in a reaction vessel
(HWS), maintaining pH of the suspension in the range 7–7.4 and temperature of
80 ± 5 �C. The precipitates were then filtered and washed until filter conductivity
below 100 lS was reached. The resulting precursors were dried at 105 �C for 12 h.
They are denoted as NiAl_0Ce, NiAl_1Ce, NiAl_2Ce and NiAl_3Ce according to
the increasing cerium content. The precursors were concurrently calcined and
reduced with hydrogen at the temperature of 450 �C for 2 h and at 550 �C for
additional 2 h followed by coating of the resulting pyrophoric material at ambient
atmosphere in fully hydrogenated vegetable fat. The catalysts were finally formed
into pellets. They are denoted as NiAl_0Ce_C, NiAl_1Ce_C, NiAl_2Ce_C and
NiAl_3Ce_C throughout this publication.
Characterization
The chemical composition of precursors was determined by means of the WDXRF
method using a Panalytical Axios spectrometer. The XRD measurements of
precursors were performed on a PANalytical Empyrean system (Bragg–Brentano
geometry) equipped with a PIXcel3D detector, using Cu Ka radiation (k = 1.542 A)
Reac Kinet Mech Cat (2016) 119:595–613 597
123

and operating at 40 kV and 40 mA. The X-ray diffraction patterns were refined with
a sum of pseudo-Voigt profile functions and an appropriate background function
using a Highscore Plus software. Temperature-programmed XRD measurements
were carried out in an Anton Paar HTK-16N chamber. A sample was deposited as a
thin layer (ca. 0.2–0.4 mm) on a Pt heating strip. A Pt/10 %-RhPt thermocouple
spot-welded to the bottom of the heating strip was used for measuring the
temperature. The decomposition/reduction process of the NiAlCe precursors was
carried out in situ using 5 % H2 in N2 as a reducing agent (flow rate 75 ml/min). The
in situ XRD patterns of the samples were recorded after their isothermal treatment
for 15 min at each temperature.
The nickel content in the catalysts was analyzed by means of the gravimetric
method with dimethylglyoxime, whereas the cerium content was analyzed by means
of the emission atomic spectroscopy method with inductively coupled plasma (ICP-
OES). The analysis was carried out on a Varian 720-ES ICP-OES spectrometer with
vertically oriented, radially viewed plasma.
The thermal decomposition studies of precursors were carried out using a
Netzsch STA 449 Jupiter thermal analyzer coupled with a QMS 430C Aeolos mass
spectrometer. The measurements were performed in a synthetic air stream by means
of TG-DSC, elevating the sample temperature with a rate of 10 �C/min. The
changes of the sample weight and m/z signals corresponding to H2O and CO2 were
constantly monitored during the measurement.
The specific surface area of the samples was determined by means of the nitrogen
adsorption method at the temperature of liquid nitrogen (-196 �C) using a
Micromeritics ASAP 2050 analyzer. The BET isotherms were measured in the p/p0range 0.05–0.3. The pore volume and pore size distribution (in the pore size range
from 2 to 300 nm) were determined from N2 adsorption isotherm in the p/
p0 = 0.02–0.99 using the BJH method.
The TPR measurements were performed using a Micromeritics AutoChem
2950HP system. A precursor sample (ca. 30 mg) was placed in a quartz U-shape
microreactor and heated in a stream of 5 % H2/Ar (40 ml/min) increasing the
temperature with a rate 10 �C/min. The water vapor formed was frozen out with dry
ice. The changes of hydrogen concentration were monitored by means of a TCD
detector.
The nickel surface area (SNi) was determined via oxygen chemisorption at the
temperature of 0 �C using a Micromeritics AutoChem 2950HP analyzer and
according to the reaction: 2Ni ? O2 ? 2NiO. Before the measurement, a sample
was reduced with hydrogen at 500 �C for 2 h. The nickel surface area, dispersion
and average nickel crystallite size parameters were calculated from the following
Eqs. 1–4:
SNi A ¼ nm � xNi � NA � AV
mp
ð1Þ
In this equation, the following notations are used: SNi_A—nickel surface area per 1 g
of catalyst (m2/gcat), nm—number of moles of a gas-adsorbate used during a mea-
surement (mol), xNi—number of moles of a metal corresponding to 1 mol of the
598 Reac Kinet Mech Cat (2016) 119:595–613
123

gas-adsorbate under the measurement conditions (1.1765 mol Ni/mol O2), NA—
nickel atom area (m2) (NA for Ni = 6.45 9 10-20 m2), AV—Avogadro number
(6.023 9 1023 at/mol), mp—sample weight (g)
SNi B ¼ nm � xNi � NA � AV � 100
%Ni � mp
ð2Þ
In this equation, the following notations are used: SNi_B—nickel surface area per 1 g
of nickel (m2/gNi), %Ni—nickel content in a sample (%)
D ¼ nm � xNi �MNi � 104
%Ni � mp
ð3Þ
In this equation, the following notations are used: D—nickel dispersion (%), MNi—
molar mass of nickel (g/mol)
d ¼ 6
SNi � gNið4Þ
The following notations are used: d—average nickel crystallite size (spherical
particle shape) (nm), gNi—nickel density (kg/dm3).
Hydrogenation tests
The hydrogenation reactions were carried out using a high pressure installation
consisting of (a) pressure autoclave Parr 5500, (b) pressure, temperature and stirring
speed controller, (c) hydrogen reservoir (volume 1.0 9 10-4 m3) and (d) digital
manometer with an accuracy up to 0.1 bar. The tests were performed under the
following conditions: temperature 180�C, constant pressure in the autoclave (2.5, 6,
11 and 21 bar(a)), stirring speed 950 rpm, concentration of the NiAl catalyst in oil
0.03 wt% (as Ni), 25 g of canola oil. Hydrogen was supplied to a reaction mixture
from the bottom by means of a dip tube. The autoclave was loaded with a
suspension of the catalyst in oil, the system was evacuated several times and filled
with hydrogen in order to remove oxygen. The suspension was then heated under
slight vacuum to the required temperature followed by loading the autoclave with
hydrogen to the working pressure. The stirring was started and the reaction time was
counted from that moment. In order to maintain the constant pressure during
hydrogenation, the hydrogen consumed in the course of the reaction was
continuously supplied from the reservoir. A decrease of hydrogen pressure in the
reservoir was a measure of the hydrogen consumption for hydrogenation of canola
oil. After the test, the catalyst was filtered off and a liquid fraction was subjected to
analysis. The iodine value (IV) was controlled by means of refractometry. The final
IV was determined by means of the titration method using a Wijs reagent [24].
Fatty acid profile analysis
The fatty acid (FA) profiles of hydrogenated samples were analyzed by means of
gas chromatography coupled with mass spectrometry using a Shimadzu GC-
Reac Kinet Mech Cat (2016) 119:595–613 599
123
MS2010Ultra instrument. The oil samples were subjected to derivatization prior to
analysis in order to obtain methyl esters of fatty acids (FAME). A 10 mg sample of
hydrogenated canola oil was dissolved in 500 ll t-butylmethylether, 250 lm 0.1 %
TMSH in MeOH (Fluka) was added and a mixture was vigorously shaken for
45–60 s. The sample was analyzed using the following conditions: BPX column,
120 m 9 0.25 mm 9 20 lm, isothermal programme 180 �C for 110 min, helium
flow 1.0 ml/min, split 100:1. The peaks of particular FAMEs were identified based
on mass spectra by comparison with a FAME Mix standard from Restek (37
components). The content of fatty acids was determined by means of the internal
normalization, assuming similar response factors of a FID detector for structurally
similar FAME compounds.
Results and discussion
Composition and physicochemical properties of NiAlCe precursorsand catalysts
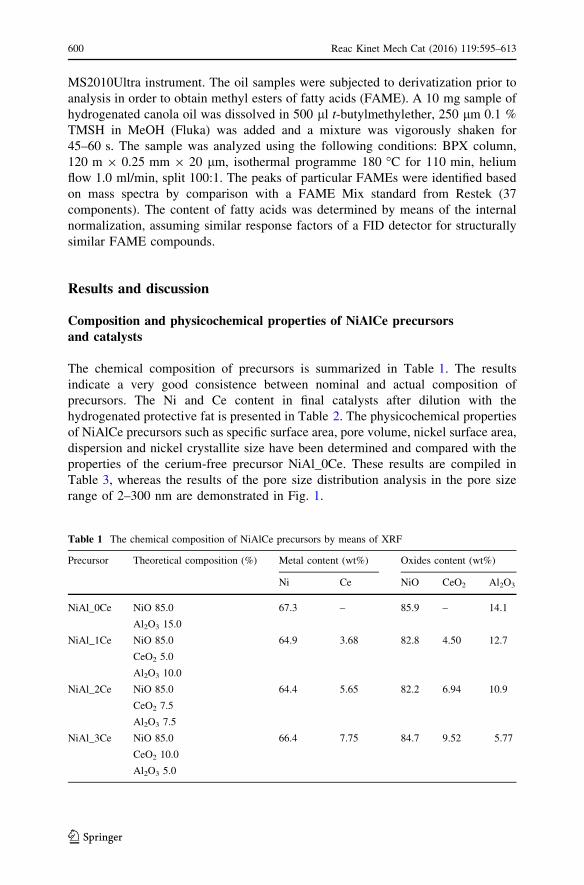
The chemical composition of precursors is summarized in Table 1. The results
indicate a very good consistence between nominal and actual composition of
precursors. The Ni and Ce content in final catalysts after dilution with the
hydrogenated protective fat is presented in Table 2. The physicochemical properties
of NiAlCe precursors such as specific surface area, pore volume, nickel surface area,
dispersion and nickel crystallite size have been determined and compared with the
properties of the cerium-free precursor NiAl_0Ce. These results are compiled in
Table 3, whereas the results of the pore size distribution analysis in the pore size
range of 2–300 nm are demonstrated in Fig. 1.
Table 1 The chemical composition of NiAlCe precursors by means of XRF
Precursor Theoretical composition (%) Metal content (wt%) Oxides content (wt%)
Ni Ce NiO CeO2 Al2O3
NiAl_0Ce NiO 85.0
Al2O3 15.0
67.3 – 85.9 – 14.1
NiAl_1Ce NiO 85.0
CeO2 5.0
Al2O3 10.0
64.9 3.68 82.8 4.50 12.7
NiAl_2Ce NiO 85.0
CeO2 7.5
Al2O3 7.5
64.4 5.65 82.2 6.94 10.9
NiAl_3Ce NiO 85.0
CeO2 10.0
Al2O3 5.0
66.4 7.75 84.7 9.52 5.77
600 Reac Kinet Mech Cat (2016) 119:595–613
123

The results indicate that cerium acts as a structural promoter influencing
considerably the specific surface area. The threefold increase of the SBET value from
70 to 218 m2/g was observed between the cerium-free precursor NiAl_0Ce and
NiAl_2Ce. A further increase of the cerium content above 5.65 wt% did not result in
increase of SBET. The pore distribution analysis in a given range revealed that after
Table 2 The chemical
composition of NiAlCe catalystsCatalyst Ni content (wt%) Ce content (wt%)
NiAl_0Ce_C 5.64 0
NiAl_1Ce_C 5.55 0.36
NiAl_2Ce_C 5.76 0.56
NiAl_3Ce_C 4.95 0.67
Table 3 Physicochemical properties of NiAlCe precursors
Precursor Specific
surface
area, SBET
(m2/g)
Nickel
surface
area, SNi
(m2/gcat)
Nickel
surface
area, SNi
(m2/gNi)
Total
pore
volume,
VC
(cm3/g)
Mesopore
volume,
Vmes
(cm3/g)
Ni
crystallite
size, dav
(nm)
Dispersion,
D (%)
NiAl_0Ce 70 42.6 63.1 0.34 0.17 11.2 9.5
NiAl_1Ce 132 38.0 58.4 0.44 0.22 12.1 8.8
NiAl_2Ce 218 30.9 47.7 0.53 0.26 14.8 7.2
NiAl_3Ce 220 35.4 53.1 0.49 0.30 13.3 8.0
Fig. 1 Pore size distribution of NiAl and NiAlCe precursors
Reac Kinet Mech Cat (2016) 119:595–613 601
123

calcination the dominant pores were in the range from 10 to 100 nm. This
corresponds to the intermediate structure between meso- and macroporous. The pore
volume was found to increase with the increased cerium content up to 5.65 wt% and
then it decreased insignificantly in case of NiAl_3Ce. On the other hand, the
mesopore volume increased constantly with the increased cerium content from 0.17
to 0.30 cm3/g. The increase of the specific surface area is a consequence of the
increase of mesopore volume.
XRD was used to compare the phase composition of NiAlCe precursors. The
diffractograms at room temperature are shown in Fig. 2. The analysis of the position
and intensity of diffraction lines revealed in crystallographic composition a phase of
nickel–aluminum hydroxycarbonate of the takovite-type, Ni6Al2(OH)16(CO3)�4H2O
(ICDD 15-87). Upon increasing the cerium content, the crystallinity of that phase
was found to decrease as indicated by broader peaks of lower intensity. Similarly to
Fig. 2 XRD diffractograms of NiAl and NiAlCe precursors (diffraction lines for a platinum strip areomitted for clarity)
602 Reac Kinet Mech Cat (2016) 119:595–613
123

the CuZnAl hydroxycarbonates with a hydrotalcite-like structure, Ni6Al2(OH)16(-
CO3)�4H2O exhibits a layered structure of the LDH type (layered double hydroxide)
with interlayer water molecules and carbonate anions [25]. This phase is
characterized by peaks with the highest intensity peaks at 2h angles 11.1� and
22.6� corresponding to (003) and (006) diffraction planes, respectively. In
diffractograms of the cerium-promoted NiAlCe precursors no crystalline phases
of cerium oxide could be identified. This indicates that the phase of cerium oxide is
well dispersed or crystallites are below the XRD detection limit, i.e., ca. 2 nm.
Figs. 3 and 4 present the DTG curves and MS profiles corresponding to signals
with m/z = 18 (H2O) and 44 (CO2) for NiAl_0Ce and NiAl_3Ce precursors. A
comparison of the thermal decomposition of both precursors with no cerium and 10
wt% of cerium revealed no significant differences. The thermal decomposition
proceeded in two stages up to the temperature of 450 �C. In the first stage up to ca.
225 �C, the evolution of water vapor (moisture and crystallization water) was
observed. In the second step proceeding in the range of 230–450 �C, the evolution
of water vapor and CO2 took place as a result of the decomposition of hydroxyl and
carbonate groups of nickel–aluminum hydroxycarbonates. This stage was a little bit
more intensive in case of the NiAl_3Ce precursor.
The TPR reduction profiles of NiAlCe precursors are shown in Fig. 5. The
NiAl_0Ce precursor underwent reduction in a single stage in a wide temperature
range from 250 to 600 �C. The maximum reduction rate was achieved at 385 �C.
The addition of cerium resulted in a shift of that temperature maximum by ca. 50�C
Fig. 3 DTG and SQMS profiles of the NiAl_0Ce precursor
Reac Kinet Mech Cat (2016) 119:595–613 603
123

Fig. 4 DTG and SQMS profiles of the NiAl_3Ce precursor
Fig. 5 TPR profiles of the NiAl and NiAlCe samples
604 Reac Kinet Mech Cat (2016) 119:595–613
123

towards lower temperatures, independently of the cerium content. The reduction of
the cerium-promoted precursors proceeds easier and with the increased cerium
content the TPR profiles become more intensive indicating more homogeneous form
of reduced NiO.
The changes in phase composition during concurrent thermal decomposition and
reduction of precursors were also monitored by means of the HT-HRD technique
(Fig. 6). The increase of temperature to 200 �C resulted in a shift of the (003)
diffraction line from 11.1� towards higher 2h angles (100 �C, 12.8�; 200 �C, 13.9�)with a concurrent decrease of the intensity. This observation can be attributed to the
removal of interlayer and weakly bound water leading to the formation of the
intermediate dehydrated phase [25–27]. However, in contrast to CuZnAl-LDH, for
which the intermediate phase was reported to be retained up to 150–200 �C [25], in
the case of the takovite-like phase the intermediate phase is retained up to
200–250 �C. In the diffractogram of the NiAl_0Ce precursor at 300 �C, only very
broad diffraction lines of a low intensity could be observed indicating a very low
crystallinity of components. This observation is further supported by the DTG
results showing that above 200 �C co-evolution of H2O (elimination of the
structural hydroxyl groups) and CO2 (removal of interlayer and structural carbonate
groups) occurs leading to the collapse of the ordered layered structure. At 400 �C
Fig. 6 HT-XRD diffractograms of the NiAl and NiAlCe precursors during thermal decomposition/reduction in 5 % H2/N2
Reac Kinet Mech Cat (2016) 119:595–613 605
123
NiO and Ni phases were observed indicating crystallization of NiO and its
concurrent reduction to Ni. The first measurement at 450 �C revealed still traces of
the NiO phase, but after 45 min only the Ni phase was identified indicating a
complete NiO reduction.
The nickel surface area was observed to decrease with the incorporation of
cerium (from 42.6 for NiAl_0Ce to 30.9 m2/gcat for NiAl_2Ce). Concerning nickel
crystallite size, this parameter was found to increase from 11.2 to 14.8 nm with the
increased cerium content, whereas nickel dispersion decreased from 9.5 to 7.2 for
NiAl_2Ce.
Catalytic activity of NiAlCe catalysts
The catalytic activity of the NiAlCe catalysts was tested in the hydrogenation
reaction of canola oil. The measurements were carried out at the temperature of
180 �C typically used in oil industry and in a wide range of pressures from 2.5 to
21 bar(a). The agitation rate was 950 rpm. It was verified that the agitation rate
above 950 rpm had no effect on the hydrogenation rate. This indicates that above
the agitation rate of 950 rpm there are no diffusional resistances for a transfer of
dissolved hydrogen to the bulk liquid phase and then to the catalyst surface. In all
tests, the hydrogenation depth of canola oil samples was on a similar level as
indicated by similar changes of the iodine value (IV) measured by means of
refractometry (DIV = 43–47) and a final IV determined by means of the Wijs
method (IV = 69–72). Table 4 presents the activity results for cerium-free and
cerium-promoted catalysts. The effect of the hydrogen pressure on hydrogenation
time for cerium-modified nickel catalysts is summarized in Fig. 7. The nickel
content in the reaction suspension was in each test the same and equal to 0.03 wt%.
Two approaches for the estimation of the hydrogenation activity were used. In the
first one, the activity is expressed by the hydrogen consumption per 1 g of Ni per
min (comparable hydrogenation depth of all samples). The second approach is based
on the overall apparent reaction constant kr, according to Plourde et al. [28].
It is well known that the saturation of double bonds follows first-order kinetics
with respect to the iodine value drop as shown in Eq. 5:
1
m
dðIVÞt
dt¼ �kr � ðIV)t ð5Þ
The integration of Eq. 5 using the initial conditions that (IV)t = (IV)0 at t = 0
gives:
m � kr ¼1
t� ln
IV0
IVt
� �ð6Þ
In line with expectations, a considerable increase of the catalytic activity in
canola oil hydrogenation was observed with the increased hydrogen pressure. In
case of the cerium-free catalyst, NiAl_0Ce_C consumption of 1000 cm3 hydrogen
by the oil lasted ca. 30 min shorter upon rising up the pressure from 2.5 to
21 bar(a) (39 vs. 7 min). Concerning the cerium effect, several conclusions can be
606 Reac Kinet Mech Cat (2016) 119:595–613
123

drawn from the activity measurements. As can be observed, the addition of cerium
clearly inhibited the hydrogenation process, especially at highest cerium content and
pressures. Generally, the activity of cerium-promoted catalysts with the cerium
content above 0.36 wt% was found to be lower than that of the cerium-free catalyst
in the entire pressure range under study [11 bar(a): NiAl_0Ce_C, 11,000 cm3 H2/(g
Ni min); NiAl_3Ce_C, 8250 cm3 H2/(g Ni min)]. The results also reveal that the
activity decreases with the increased cerium content [2.5 bar(a): 38 min and
3440 cm3 H2/(g Ni min) for NiAl_1Ce_C; 56 min and 2360 cm3 H2/(g Ni min) for
NiAl_3Ce_C].
Selectivity of NiAlCe catalysts
The results of the selectivity of cerium-promoted nickel–aluminum catalysts in
hydrogenation of canola oil are presented in Table 5. These results indicate that the
addition of cerium impedes the formation of C18:1 trans isomers of fatty acids, both
4-9t and 10-14t ones. This positive effect of cerium was found to increase with the
increased cerium content, and was more pronounced at lower pressures. In the
Table 4 Hydrogenation of canola oil on cerium-modified nickel catalysts
Test p [bar(a)] Dp Time
(min)
A [cm3 H2/
(g Ni min)]
mkr
(min-1)
kr [(kg of oil) (g of
Ni)-1 min-1]
Change of
iodine value
DIV
IVWijs
NiAl_0Ce_C
1 2.5 10.8 39 3350 0.013 0.043 46.2 71.2
2 6.0 10.8 19.3 6770 0.027 0.089 46.2 –
3 11.0 10.9 12 11,000 0.042 0.142 45.8 –
4 21.0 11.0 7 19,050 0.075 0.251 47.0 69.2
NiAl_1Ce_C
5 2.5 10.8 38 3440 0.013 0.043 44.8 71.6
6 6.0 10.8 18 7260 0.028 0.092 44.8 –
7 11.0 10.9 11 12,000 0.045 0.150 44.7 –
8 21.0 11.0 9 14,815 0.055 0.184 44.8 70.1
NiAl_2Ce_C
9 2.5 10.8 40 3270 0.013 0.043 46.0 69.5
10 6.0 11.0 20.5 6500 0.024 0.081 44.8 –
11 11.0 10.9 14 9430 0.036 0.119 45.2 –
12 21.0 10.8 11 11,880 0.044 0.147 44.0 69.8
NiAl_3Ce_C
13 2.5 10.9 56 2360 0.009 0.030 45.7 69.4
14 6.0 10.8 33 3960 0.015 0.051 45.2 –
15 11.0 10.9 16 8250 0.030 0.098 43.2 –
16 21.0 10.8 13 10,050 0.037 0.123 43.7 69.8
Reac Kinet Mech Cat (2016) 119:595–613 607
123

hydrogenation reaction under the pressure of 2.5 bar(a), the content of C18:1 trans
isomers decreased from 36.2 % for the cerium-free catalyst, NiAl_0Ce_C to 27.2 %
for the NiAl_3Ce_C catalyst containing 0.67 % of cerium. However, the influence
of cerium on C18:1 trans isomers was observed to decrease with the increased
pressure (21 bar(a); 22.8 % for NiAl_0Ce_C, 18.7 % for NiAl_3Ce_C). Taking into
account that an increase of hydrogen pressure has also a substantial effect on the
TFA isomer content, both effects (pressure and cerium) resulted in a significant
decrease of C18:1 trans fraction by ca. 48 % (from 36.2 to 18.7 %). The effect of
the suppression of the cis/trans isomerization has been recently reported by
Stankovic et al. in hydrogenation of soybean oil at 160 �C and at 1.6 bar for silver-
modified diatomite-supported NiMg catalysts [29].
The addition of cerium results in a lower content of all trans isomers, including
additionally isomers of linoleic acid, C18:2 trans,trans/cis,trans/trans,cis. Interest-
ingly, with the increase of the cerium content, the share of C18:2 tt/ct/tc isomers
was found to increase slightly (2.5 bar(a); 1.5 % for NiAl_0Ce_C vs. 2.5 % for
NiAl_3Ce_C). This effect becomes less pronounced at higher pressures up to
11 bar(a) (2.1 % for NiAl_0Ce_C vs. 2.3 % for NiAl_3Ce_C) and remains at
similar level above this pressure. Overall, both effects of cerium and hydrogen
pressure leads to the decrease of all TFA isomers from 37.7 to 20.9 %.
An increase of the content of C18:1 cis isomers at the expense of trans ones,
which is observed with the increased pressure, is also accompanied by an increase
of the SFA content, mainly stearic acid, C18:0. In case of the cerium-free catalyst
upon increasing pressure from 2.5 to 21 bar(a) an increase of the C18:0 fraction in
Fig. 7 Effect of the hydrogen pressure on the hydrogenation time of canola oil for cerium-modifiednickel catalysts (180� C, 950 rpm, 0.03 wt% of Ni)
608 Reac Kinet Mech Cat (2016) 119:595–613
123

Ta
ble
5P
erce
nt
com
posi
tion
of
hydro
gen
ated
canola
oil
sam
ple
sobta
ined
atvar
ious
pre
ssure
son
NiA
lCe
cata
lyst
s.A
llco
mposi
tion
val
ues
inw
t%,
aver
age
repro
-
du
cib
ilit
y*
0.2
–0
.5w
t%
FA
Refi
ned
can
ola
oil
NiA
l_0
Ce_
CN
iAl_
1C
e_C
NiA
l_2
Ce_
CN
iAl_
3C
e_C
p[b
ar(a
)]
2.5
61
12
12
.56
11
21
2.5
61
12
12
.56
11
21
C16
:04
.64
.64
.74
.64
.64
.54
.74
.54
.64
.54
.54
.64
.54
.64
.64
.74
.6
C18
:01
.11
3.1
16
.31
6.7
22
.01
3.0
15
.11
5.8
19
.21
3.4
14
.11
6.9
18
.61
4.9
16
.61
6.8
18
.1
C18
:1transa
03
6.2
30
.62
5.1
22
.83
2.8
29
.82
6.0
18
.73
2.4
26
.92
4.6
18
.82
7.7
26
.42
3.7
18
.7
C18
:1cisb
66
.04
1.4
42
.64
6.1
41
.84
4.4
44
.54
6.4
47
.94
4.3
47
.74
6.6
48
.64
6.2
45
.74
6.9
49
.7
C18
:2cis/cis
18
.90
.61
.22
.43
.30
.81
.42
.13
.90
.81
.72
.33
.81
.31
.62
.53
.4
C18
:2tt
/ct/tc
01
.51
.82
.12
.01
.71
.82
.22
.11
.92
.22
.02
.12
.52
.32
.32
.2
C18
:37
.80
00
.20
.50
00
.20
.50
00
.20
.50
00
.20
.5
Oth
erc
1.6
2.5
2.8
2.9
2.9
2.7
2.7
2.8
3.0
2.7
2.8
2.9
3.1
2.8
2.8
2.9
2.8
RT
FA
03
7.7
32
.42
7.2
24
.83
4.5
31
.62
8.2
20
.83
4.3
29
.12
6.6
20
.93
0.2
28
.72
6.0
20
.9
aC
18
:1trans
incl
ud
esth
ree
chro
mat
og
raph
ical
lyse
par
able
gro
up
of
iso
mer
s:C
18
:14
t-9
t,C
18
:11
0t-
14
tan
dC
18
:11
6t
bC
18
:1cis
incl
ud
estw
och
rom
ato
gra
ph
ical
lyse
par
able
gro
up
of
isom
ers:
C18
:19
c,an
dC
18
:11
0-1
5c
cO
ther
FA
incl
ud
esab
ov
eal
lC
20
:0,
C20
:1,
C22
:0,
C22
:1
Reac Kinet Mech Cat (2016) 119:595–613 609
123

the hydrogenated canola oil samples from 13.1 to 22.0 % was observed. Concerning
the cerium effect, the addition of cerium does not significantly influence the amount
of the C18:0 fraction up to pressures of 11 bar(a). However, cerium has a beneficial
influence on the C18:0 amount at the highest pressure. Compared to the canola oil
hydrogenation on NiAl_0Ce_C, hydrogenation on NiAl_3Ce_C resulted in the
decrease of the C18:0 fraction from 22.0 to 18.1 %. The chromatographic analyses
of the FA profiles in hydrogenated samples indicate that the content of linoleic acid
also increases with the increased pressure [NiAl_0Ce_C; 0.6 % at 2.5 bar(a) vs.
3.3 % at 21 bar(a)]. Similarly, cerium addition influences the content of linoleic
acid but only at lowest pressure (2.5 bar(a); 0.6 % for NiAl_0Ce_C vs. 1.3 % for
NiAl_3Ce_C). Furthermore, an increase of pressure was found to affect the content
of linolenic acid, C18:3. Some deterioration of the linolenic selectivity was
observed at elevated hydrogen pressures as evidenced by an increase of the C18:3
content from 0.2 at 11 bar(a) to 0.5 wt% at 21 bar(a). Similar observations were
reported by List et al. for the supported nickel catalyst in the soybean oil
hydrogenation at various pressures [30].
There is no reasonable mechanistic explanation at that stage of investigations for
better cis/trans selectivity of cerium-promoted nickel–aluminum catalysts. The
reason for hampering by cerium the cis/trans isomerization reaction of C18:1 fatty
acids is entirely speculative and the effect of cerium should be presumably
rationalized on the basis of the Horiuti–Polanyi mechanism [31]. This mechanism
assumes that hydrogenation proceeds through a partially hydrogenated transition
state, in which only one hydrogen atom is bound. Particular steps of the Horiuti–
Polanyi mechanism are generally reversible so two scenarios may happen at the
stage of partial hydrogenation: either the second hydrogen is bound (saturation) or
the already bound hydrogen is given back to the metal. The second case may lead to
cis/trans isomerization. If a cleaved hydrogen atom is the same as the one that was
bound, an originally adsorbed compound is reconstituted. Cleavage of the second
hydrogen atom on the same carbon atom results in cis/trans isomerization and
cerium may presumably impede such cleavage. The limited formation of C18:1
trans on cerium-promoted nickel–aluminum catalysts can be presumably rational-
ized in terms of the modification of electronic properties by dopant and the presence
of geometric effects as it was also postulated by Stankovic et al. for silver-modified
diatomite-supported NiMg catalysts [29].
Besides the FA composition of canola oil samples hydrogenated to the iodine
value of ca. 70, changes of FA profiles in the course of hydrogenation were also
investigated. The FA profiles for two catalysts, NiAl_0Ce_C and NiAl_3Ce_C
obtained at pressure of 1.5 bar(a) are presented in Figs. 8 and 9. The results clearly
show that significantly less C18:1 trans fraction is generated during hydrogenation
of canola oil on cerium-promoted nickel-catalyst. This effect is reflected in a slope
of the M-trans curve that is much steeper in case of the cerium-free catalyst. After
60 min of hydrogenation at 180�C and under 1.5 bar(a), the content of C18:1 trans
isomers in the hydrogenated samples was ca. 12 % lower in case of the
NiAl_3Ce_C catalyst. Moreover, the intersection point of C18:1 cis and C18:1
trans curves lies at ca. 60 min in case of the NiAl_0Ce_C catalyst and at ca.
110 min for the NiAl_3Ce_C one. This indicates a slower drop of the C18:1 cis
610 Reac Kinet Mech Cat (2016) 119:595–613
123

fraction that is also accompanied by a slower increase of the C18:0 fraction.
Concerning the C18:2 fraction, addition of cerium impedes the hydrogenation of
polyunsaturated fatty acids, hydrogenation process proceeds slower in case of the
Fig. 8 Changes of the FA composition during hydrogenation of canola oil on NiAl_0Ce_C, 1.5 bar(a),180 �C, 950 rpm, 0.03 wt% of Ni (T—C18:3, D—C18:2, M—C18:1, Sat—C18:0)
Fig. 9 Changes of the FA composition during hydrogenation of canola oil on NiAl_3Ce_C, 1.5 bar(a),180� C, 950 rpm, 0.03 wt% of Ni (T—C18:3, D—C18:2, M—C18:1, Sat—C18:0)
Reac Kinet Mech Cat (2016) 119:595–613 611
123

NiAl_3Ce_C catalyst as indicated by the content of C18:2 cis fraction after 40 min
of hydrogenation (ca. 5 %).
Conclusions
The incorporation of cerium into co-precipitated nickel–aluminum precursors
results in a significant increase of the specific surface area and mesopore volume.
However, for these nickel-rich precursors, no effect on active surface area is
observed. Moreover, the addition of cerium facilitates the reduction process of the
precursor compared to the cerium-free one. The reduction of the cerium-promoted
precursors proceeds easier and with the increased cerium content the TPR profiles
become more intensive indicating more homogeneous form of reduced NiO. The
cerium-promoted nickel–aluminum catalysts exhibit a superior selectivity in
hydrogenation of canola oil, yet at the expense of lower activity. The addition of
cerium inhibits the hydrogenation process, especially at high pressures and high
cerium loading. Nevertheless, upon addition of a relatively low amount of cerium
(0.67 wt%), the content of the C18:1 trans fraction decreased by ca. 35 %. Together
with the synergistic effect of hydrogen pressure a significant decrease of C18:1
trans fraction by ca. 48 % could be achieved. Furthermore, compared to the cerium-
free catalyst, the addition of cerium resulted in a slower drop of the C18:1 cis
fraction and a slower increase of the C18:0 fraction. The addition of cerium slightly
impedes the hydrogenation of polyunsaturated fatty acids, especially C18:2 fraction.
The results of our studies clearly indicate that utilization of cerium-promoted
nickel–aluminum catalysts may lead to a remarkable decrease of the content of
deleterious TFA isomers. Further studies seem to be necessary in order to elucidate
the role of cerium in the hydrogenation mechanism.
Acknowledgments The authors thank Mr. J. Ostrowski, M.Sc. for his ICP-OES analysis.
Open Access This article is distributed under the terms of the Creative Commons Attribution 4.0
International License (http://creativecommons.org/licenses/by/4.0/), which permits unrestricted use, dis-
tribution, and reproduction in any medium, provided you give appropriate credit to the original
author(s) and the source, provide a link to the Creative Commons license, and indicate if changes were
made.
References
1. Moulton KJ, Beal RE, Griffin EL Jr (1971) J Am Oil Chem Soc 48:499–502
2. Fernandez MB, Tonetto GM, Crapiste GH, Damiani DE (2007) J Food Eng 82:199–208
3. Beers A, Ariaansz R, Okonek D (2008) In: Dijkstra AJ, Hamilton RJ, Hamm W (eds) Trans fatty
acids. Blackwell Publishing, Oxford
4. Ascherio A, Katan MB, Zock PL, Stampfer MJ, Willett WC (1999) New Engl J Med 340:1994–1998
5. Hu FB, Stampfer MJ, Manson JE, Rimm E, Colditz GA, Rosner BA, Hennekens CH, Willet WC
(1997) New Engl J Med 337:1491–1499
6. Katan MB, Zock PL, Mensink RP (1995) Annu Rev Nutr 15:473–493
7. Mensink RP, Zock PL, Katan MB, Hornstra G (1992) J Lipid Res 33:1493–1501
612 Reac Kinet Mech Cat (2016) 119:595–613
123

8. Mozaffarian D, Katan MB, Ascherio A, Stampfer MJ, Willet WC (2006) New Engl J Med
354:1601–1613
9. Philippaerts A, Jacobs PA, Sels BF (2013) Angew Chem Int Ed 52:5220–5226
10. Pandarus V, Gingras G, Beland F, Ciriminna R, Pagliaro M (2012) Org Process Res Dev
16:1307–1311
11. Philippaerts A, Paulussen S, Breesch A, Turner S, Lebedev OI, Van Tendeloo G, Sels B, Jacobs P
(2011) Angew Chem Int Ed 50:3947–3949
12. Philippaerts A, Breesch A, De Cremer G, Kayaert P, Hofkens J, Van den Mooter G, Jacobs P, Sels B
(2011) J Am Oil Chem Soc 88:2023–2034
13. Jang ES, Jung MY, Min DB (2005) Compr Rev Food Sci Food Saf 1:22–30
14. Menaa F, Menaa A, Treton J, Menaa B (2013) J Food Sci 78:377–386
15. Leclercq E, Rives A, Payen E, Hubaut R (1998) Appl Catal A 168:279–288
16. Vile G, Dahler P, Vecchietti J, Baltanas M, Collins S, Calatayud M, Bonivardi A, Perez-Ramirez J
(2015) J Catal 324:69–78
17. Vile G, Bridier B, Wichert J, Perez-Ramirez J (2012) Angew Chem Int Ed 51:8620–8623
18. Wang P, Zhang J, Bai Y, Xiao H, Tian S, Xie H, Yang G, Tsubaki N, Han Y, Tan Y (2016) Appl
Catal A 514:14–23
19. Toemen S, Abu Bakar WAW, Ali R (2014) Bull Korean Chem Soc 35:2349–2356
20. Znak L, Stołecki K, Zielinski J (2005) Catal Today 101:65–71
21. Li C, Domen K, Maruya K, Onishi T (1993) J Catal 141:540–547
22. Toyoda T, Nishihara Y, Qian EW (2014) Fuel Process Technol 125:86–93
23. Alouche A, Hubaut R, Bonnelle JP, Davies P, Lambert D (1993) In: Barbier J, Barrault J, Bouchoule
C, Duprez D, Montassier C, Guisnet M, Perot G (eds) Heterogeneous catalysis and fine chemicals III.
Elsevier Science, p. 235
24. Method PN-EN ISO 3961. http://sklep.pkn.pl/pn-en-iso-3961-2013-10e.html
25. Kowalik P, Konkol M, Kondracka M, Prochniak W, Bicki R, Wiercioch P (2013) Appl Catal A
464–465:339–347
26. Perez-Ramırez J, Abello S, van der Pers NM (2007) Chem Eur J 13:870–878
27. Mokhtar M, Inayat A, Ofili J, Schwieger W (2010) Appl Clay Sci 50:176–181
28. Plourde M, Belkacemi K, Arul J (2004) Ind Eng Chem Res 43:2382–2390
29. Stankovic M, Cupic Z, Gabrovska M, Bankovic P, Nikolova D, Jovanovic D (2015) React Kinet
Mech Cat 115:105–127
30. List GR, Neff WE, Holliday RL, King JW, Holser R (2000) J Am Oil Chem Soc 77:311–314
31. Horiuti I, Polanyi M (1934) Trans Faraday Soc 30:1164
Reac Kinet Mech Cat (2016) 119:595–613 613
123