Embed Size (px)
Citation preview

Catalytic Performances of NiMo/Zr-SBA-15 Catalysts for the
Hydrotreating of Bitumen Derived Heavy Gas Oil
A Thesis submitted to the College of Graduate Studies and Research
in Partial Fulfillment of the Requirements for the
Degree of Master of Science
in the Department of Chemical Engineering
University of Saskatchewan
Saskatoon
By
Piyali Biswas
© Copyright Piyali Biswas, April 2011. All rights reserved.

i
COPYRIGHT
The author has consented that the libraries of the University of Saskatchewan may
make this thesis freely available for inspection. Furthermore, the author agrees that
permission for the copying of this thesis in any manner, either in whole or part, for
scholarly purposes be granted primarily by the professor(s) who supervised this thesis or
in their absence by the Department Head of Chemical Engineering or the Dean of the
College of Graduate Studies. Duplication, publication, or any use of this thesis, in part or
in whole, for financial gain without prior written approval by the University of
Saskatchewan is prohibited. It is also understood that due recognition shall be given to
the author of this thesis and to the University of Saskatchewan for any use of the material
in this thesis.
Request for permission to copy or make use of the material in this thesis in whole or
in part should be addressed to:
The Department Head of Chemical Engineering
College of Engineering
University of Saskatchewan
57 Campus Drive
Saskatoon SK Canada
S7N 5A9
ii
ABSTRACT Gas-oil obtained from bitumen contains a significant amount of impurities, which
are difficult to remove using a conventional alumina supported hydrotreating catalyst.
Innumerable studies have been carried out to develop a highly effective hydrotreating
catalyst, and among all utilizing more advanced support is considered as a better
alternative. Recently, SBA-15, which is an ordered mesoporous silica support, has
received importance as a catalyst support because of its excellent textural properties.
However, SBA-15 lacks surface acidity and provides very low metal-support interaction.
By modifying SBA-15 with zirconia, an optimum level of surface acidity and Si-Mo
interaction can be achieved. Also, by doping zirconia with SBA-15, the textural
properties of zirconia can be improved. Hence, a synergistic effect can be obtained while
incorporating zirconia onto SBA-15 and the resulting material Zr-SBA-15 can be used as
an effective support for hydrotreating catalyst. In the present study, Zr-SBA-15 supports
were prepared by the post synthesis and the direct synthesis method with different
zirconia loading. Zr-SBA-15 supported NiMo catalysts were prepared by incipient
wetness impregnation technique. Catalysts and supports were characterized by small
angle X-ray scattering (SAXS), nitrogen adsorption/desorption (BET), powder X-ray
diffraction (XRD), transmission electron spectroscopy (TEM), scanning electron
microscopy (SEM), and Raman spectroscopy methods. Characterization of support
confirmed that the zirconia was successfully incorporated in a mesoporous SBA-15
structure without significantly changing the textural properties of SBA-15. The
performance of the Zr-SBA-15 supported NiMo catalysts was evaluated based on
hydrodesulfurization and hydrodenitrogenation activities exhibited during hydrotreating

iii
of heavy gas oil derived from Athabasca bitumen at industrial operating condition
(temperature 375-395 °C, pressure 8.9 MPa, LHSV 1.0 hr-1 and gas/oil ratio 600
Nm3/m3). The comparison of catalytic activities showed that the NiMo catalysts
supported on Zr-SBA-15, prepared by direct and post synthesis method exhibited higher
hydrotreating activity compared to SBA-15 supported catalyst. NiMo catalyst supported
on Zr-SBA-15 with 23 wt% of ZrO2 loading, prepared by post synthesis method showed
the highest activity among all the catalysts.
After determining the best support, the optimum catalyst metal loadings on the Zr-
SBA-15 support was found to be 17 wt% of Mo and 3.4 wt% of Ni. This catalyst also
showed higher activity in mass basis for the hydrotreating of heavy gas oil compared to
that of commercial hydrotreating catalyst.
A kinetic study was performed on the optimum NiMo/Zr-SBA-15 catalyst to predict its
HDS and HDN activities while varying the parameters of temperature, liquid hourly space
velocity (LHSV), pressure and gas-to-oil ratio. Rate expressions were developed using Power
Law and Langmuir-Hinshelwood model to predict the behavior of both the HDS and HDN
reactions. Power law models were best fit with reaction orders of 1.8 and 1.3, and activation
energies of 115 kJ/mol and 121 kJ/mol, for HDS and HDN reactions, respectively. The
activation energies calculated using Langmuir-Hinshelwood model considering H2S
inhibition were found to be 122 kJ/mol and 138 kJ/mol, for HDS and HDN reactions,
respectively.

iv
ACKNOWLEDGEMENT
I would first like to thank my supervisors, Dr. Ajay Dalai and Dr. John Adjaye, for their
valuable guidance and supervision throughout the initiating, planning, executing and
concluding my research work. I greatly appreciate the effort made by them to review and
provide recommendations to my written materials. I would also like to thank the other two
members of my MSc. supervisory committee, Dr. Richard Evitts and Dr. Jafar Soltan, for
their contributions to my graduate studies.
Secondly, I would also like to thank Mr. Richard Blondin, Mr. Dragan Cekic, and Heli
Eunike for their assistance in the laboratory work that contributed to my project. My thanks
also go to the Natural Sciences and Engineering Research Council of Canada and Syncrude
Canada Limited for their much-appreciated financial assistance. I also greatly appreciate the
work done by the Saskatchewan Structural Science Center and Geology Department of
University of Saskatchewan, University of New Brunswick, and the University of Western
Ontario for their assistance in the catalyst characterizations.
Lastly, I would like to express my gratitude to all the professors, post-doctorate fellows,
and graduate students that have contributed to my graduate study at the University of
Saskatchewan. Most of all, my heartfelt thanks to my mother, father, sister and brother for
their unconditional love and constant encouragements. Also, I would like to extend my
thanks to my husband Prabhu N., for supporting me in both personal and professional life.
Finally, I thank God Almighty for his blessings.
v
TABLE OF CONTENTS
COPYRIGHT i
ABSTRACT ii
ACKNOWLEDGEMENT iv
TABLE OF CONTENTS v
LIST OF TABLES xi
LIST OF FIGURES xiii
NOMENCLATURE xviii
CHAPTER 1. INTRODUCTION 1
1.1 Research Background 1
1.2 Knowledge Gaps 5
1.3 Hypotheses 6
1.4 Research Objectives 6
CHAPTER 2. LITERATURE REVIEW 8
2.1 World Energy Consumption 8
2.2 Characteristics of Petroleum and Gas Oil 9
2.2.1 Definition of Bitumen, Heavy Oil and Heavy Gas Oil 9
2.2.2 Syncrude Upgrading Process 12
2.2.3 Chemical Compounds Present in Petroleum 14
2.2.4 Reactivity of Sulfur and Nitrogen Compounds 16
2.3 Characteristics of Hydroteating Process 18
2.3.1 Definition of Hydrotreating Process 18
2.3.2 Hydrotreating Process Description 20
2.3.3 Purposes of Hydrotreating 22
2.3.4 Hydrotreated Diesel Specification 23
vi
2.3.5 Challenges of Hydrotreating Processes 24
2.3.6 Chemical Reactions of Hydrotreating 28
2.3.7 Reaction Mechanism of HDS and HDN 30
2.3.8 Factors Affecting Hydrotreating Processes 34
2.3.9 Ways to Improve Hydrotreating Process 38
2.4 Hydrotreating Catalyst 39
2.4.1 Conventional Hydrotreating Catalyst 39
2.4.2 Hydrotreating Catalyst Design and Improvement 41
2.4.3 Structure of Hydrotreating Catalysts 43
2.4.4 HDS Reaction Mechanism by Metal-Sulfide Catalysts 46
2.4.5 Promoters 47
2.4.6 Support Materials 48
2.4.7 Progress on Improvement of Hydrotreating Catalyst Support 51
2.4.8 Desired Properties of HDT Catalyst Support 53
2.4.9 Deactivation 58
2.4.10 Objectives of Catalyst Characterization 62
2.5 Selection of Zr-SBA-15 Support for Hydrotreating of Gas Oil 63
2.5.1 SBA-15 Support 63
2.5.2 ZrO2 Incorporation into SBA-15 Framework 64
2.5.3 Synergistic effect of SBA-15 and ZrO2 65
2.6 SBA-15 as Hydrotreating Catalyst Support 68
2.6.1 Characteristics of Mesoporous SBA-15 68
2.6.2 Synthesis Methods of SBA-15 69
2.6.3 Pore Diameter Control of SBA-15 71
2.6.4 Application of SBA-15 Support in Hydrotreating 75
2.7 Zr-SBA-15 as Hydrotreating Catalyst Support 76
2.7.1 Characteristics of Zr-SBA-15 76
2.7.2 Synthesis Methods of Zr-SBA-15 77
2.7.3 Application of Zr-SBA-15 Support in Hydrotreating 84

vii
2.8 Kinetic Modeling of HDS and HDN 85
2.8.1 Purpose of Kinetic Modeling 85
2.8.2 Kinetic Models for HDS and HDN 86
2.8.3 Power Law Model 87
2.8.4 Langmuir-Hinshelwood Model 91
2.8.5 Reactor Performance 95
2.8.6 Effect of Mass Transfer 96
CHAPTER 3. EXPERIMENTAL METHOD 99
3.1 SBA-15 Support Preparation 99
3.2 Zr-SBA-15 Support Preparation 101
3.2.1 Direct Synthesis Method 101
3.2.2 Post Synthesis Method 101
3.3 NiMo/SBA-15 and NiMo/Zr-SBA-15 Catalyst Preparation 103
3.4 Support and Catalyst Characterization Technique 104
3.4.1 Small Angle X-ray Scattering (SAXS) 104
3.4.2 N2 Adsorption/Desorption 104
3.4.3 Elemental Analysis 105
3.4.4 Transmission Electron Microscopy (TEM) 105
3.4.5 Scanning Electron Microscopy (SEM) 105
3.4.6 Fourier Transform Infrared Spectroscopy (FTIR) 105
3.4.7 Pyridine Adsorbed Fourier Transform Infrared Spectroscopy (Py-IR) 106
3.4.8 X-ray Diffraction (XRD) 106
3.4.9 Raman Spectroscopy 106
3.4.10 UV vis Diffuse Reflectance Spetroscopy 107
3.5 Hydrotreating Experimental Set-up and Activity Test 107
3.5.1 Hydrotreating Reactor Set-up 107
3.5.2 Preparation for Hydrotreating Reaction 107
3.5.3 Catalyst Performance Test 110

viii
3.6 Hydrotreated Product Analysis 111
3.6.1 S and N Conversion 111
3.6.2 Boiling Point Distribution 111
CHAPTER 4. HYDROTREATING OF GAS OIL OVER NiMo/Zr-SBA-15
CATALYSTS 112
4.1 Characterization of Supports 112
4.1.1 Small-Angle X-ray Scattering (SAXS) 112
4.1.2 N2 Adsorption/Desorption and Chemical Compositions 114
4.1.3 Transmission Electron Microscopy (TEM) 117
4.1.4 Scanning Electron Microscopy (SEM) 119
4.1.5 Fourier Transform Infrared Spectroscopy (FTIR) 119
4.1.6 Pyridine Adsorbed Fourier Transform Infrared Spectroscopy (Py-IR) 122
4.1.7 Powder X-ray Diffraction (XRD) 123
4.2 Characterization of catalysts 125
4.2.1 Small-Angle X-ray Scattering (SAXS) 125
4.2.2 N2 Adsorption/Desorption and Chemical Compositions 126
4.2.3 Transmission Electron Microscopy (TEM) 129
4.2.4 Powder X-ray Diffraction (XRD) 129
4.2.5 Raman Spectroscopy 131
4.2.6 UV-DRS Spectroscopy 133
4.3 Catalytic Activity Performance Based on HDS and HDN 135
CHAPTER 5. METAL LOADING OPTIMIZATION FOR NiMo/Zr-SBA-15
CATALYSTS 141
5.1 Characterization of Supports 141
5.1.1 Small-Angle X-ray Scattering (SAXS) 141
5.1.2 N2 Adsorption/Desorption and Chemical Compositions 142
5.1.3 Transmission Electron Microscopy (TEM) 144
5.1.4 Scanning Electron Microscopy (SEM) 145
ix
5.2 Characterizations of Catalysts 146
5.2.1 Small-Angle X-ray Scattering (SAXS) 146
5.2.2 N2 Adsorption/Desorption and Chemical Compositions 147
5.2.3 Transmission Electron Microscopy (TEM) 148
5.2.4 Pyridine Adsorbed Fourier Transform Infrared Spectroscopy (Py-IR) 150
5.2.5 Powder X-ray Diffraction (XRD) 151
5.2.6 Raman Spectroscopy 152
5.2.7 UV-DRS Spectroscopy 153
5.2.8 High Resolution Transmission Electron Microscopy (HRTEM) 154
5.3 Catalytic Activity Performance Based on HDS and HDN 156
CHAPTER 6. KINETIC STUDY OF HDS AND HDN 161
6.1 Effect of Reaction Condition on HDS/HDN over Optimized Catalyst 161
6.1.1 Effect of Temperature 161
6.1.2 Effect of LHSV 164
6.1.3 Effect of Pressure 166
6.1.4 Effect of Hydrogen Gas/Oil Ratio 168
6.2 Kinetic Study of HDS/HDN for the Optimum NiMo/Zr-SBA-15 Catalyst 172
6.2.1 Evaluation of Hydrodynamic Parameters 173
6.2.2 Mass Transfer Resistances for the HDS and HDN 174
6.2.3 Hydrodesulfurization and Hydrodenitrogenation Rate kinetics 178
6.2.4 Power Law Model 178
6.2.5 Langmuir-Hinshelwood Model 180
6.3 Stability Study for the Optimum NiMo/Zr-SBA-15 Catalyst 186
6.4 Characterization of Spent Catalysts 188
CHAPTER 7. CONCLUSIONS AND RECOMMENDATIONS 189
7.1 Conclusions 189
7.2 Recommendations 191
x
CHAPTER 8. LIST OF REFERENCES 193
APPENDICES Appendix A Calculation of Molar Product Concentration of N/S and
Reaction Rates of HDN/HDS 210
Appendix B Calculation of Product Concentration for HDS and HDN Conversion Obtained from Kinetic Study
211
Appendix C Evaluation of External Mass Transfer Resistance for HDS and HDN Reactions
213
Appendix D Evaluation of the Internal Mass Transfer Resistances for the HDS and HDN Reactions
221
Appendix E Permissions to Use Figures from Literatures 232
xi
LIST OF TABLES
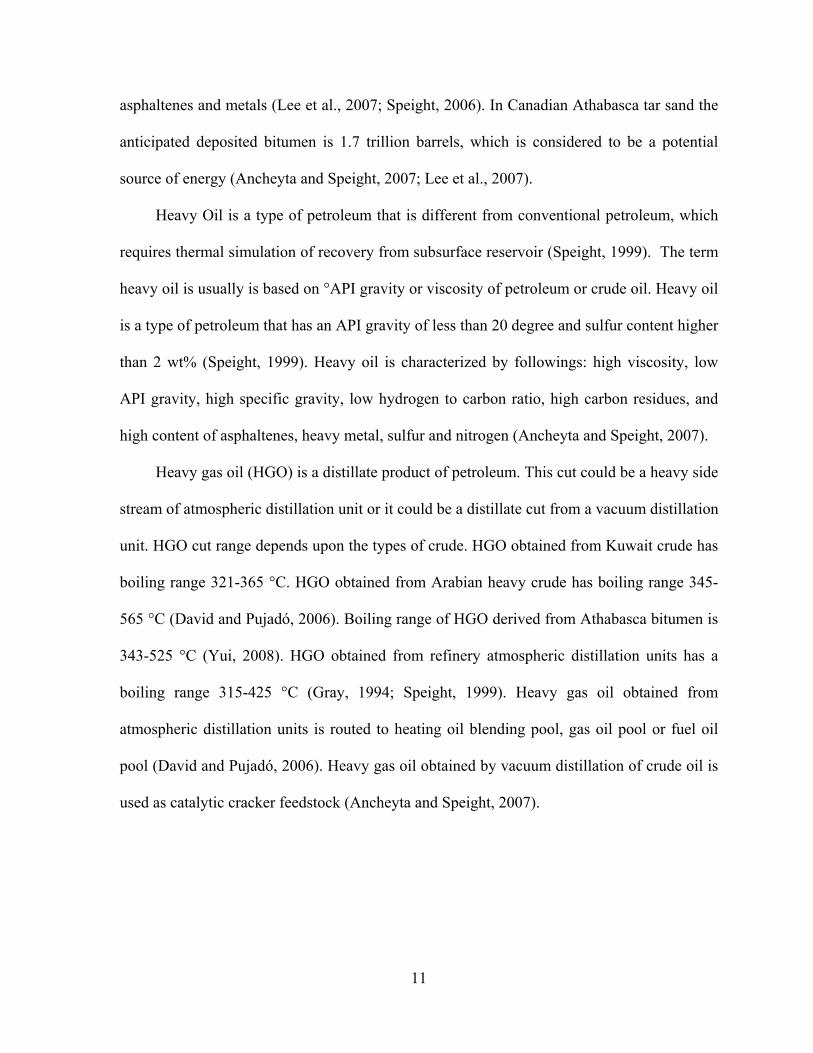
Table 2.1 Characteristics of conventional crude oil, bitumen, and heavy oil 12
Table 2.2 Elemental analysis of petroleum and Athabasca bitumen 12
Table 2.3 Hydrodesulfurization reactivity of various sulfur substituted molecules
16
Table 2.4 Diesel specifications for Europe and USA 24
Table 2.5 Target of product sulfur, required increase in catalyst activity and temperature
27
Table 2.6 Operating conditions for hydrotreating processes 37
Table 2.7 Typical composition of catalyst used for hydrotreating process 40
Table 2.8 Physical characteristics of the hydrotreating catalysts 40
Table 2.9 Role of promoters in the hydrotreating catalyst 48
Table 2.10 Disadvantaged of γ-Al2O3 support for hydrotreating 50
Table 2.11 Typical methods for catalyst characterization 63
Table 2.12 Properties of SBA-15, ZrO2 and Zr-SBA-15 supports 67
Table 2.13 Pore size control of mesoporous SBA-15 structure 74
Table 2.14 Application of SBA-15 support in hydrotreating 75
Table 2.15 Application of Zr-SBA-15 support in hydrotreating 85
Table 2.16 Basic kinetic information derived from Power law for the hydrotreating of real feed
90
Table 2.17 Langmuir-Hinshelwood models for HDS and HDN 92
Table 2.18 Kinetic parameters derived from Langmuir-Hinshelwood model for the hydrotreating of real feed
94
Table 2.19 Parameters for calculating the hydrodynamic parameters 96
Table 3.1 Naming of the supports and catalysts prepared for the project 103
Table 3.2 Characteristics of heavy gas oil derived from Athabasca bitumen 110

xii
Table 4.1 Textural characteristics and chemical compositions of support materials
115
Table 4.2 Textural characteristics and chemical compositions of catalyst materials
127
Table 5.1 Textural characteristics and chemical compositions of support materials
143
Table 5.2 Textural characteristics and chemical compositions of catalysts materials
147
Table 6.1 Effect of temperature, pressure, LHSV and H2/gas oil ratio on sulfur and nitrogen conversion of HGO with optimized catalyst
170
Table 6.2 Hydrodynamic parameter evaluation for plug flow, wall effect, wetting and back-mixing
173
Table 6.3 Values derived from Power law model for the HDS and HDN of heavy gas oil over optimized catalyst
180
Table 6.4 Values derived from Independent Langmuir-Hinshelwood model for the HDS and HDN of heavy gas oil over optimized catalyst
181
Table 6.5 Values derived from Co-dependent Langmuir-Hinshelwood model for the HDS and HDN of heavy gas oil over optimized catalyst
182
Table 6.6 Values derived from Langmuir-Hinshelwood model with H2S inhibition for the HDS and HDN of heavy gas oil over optimized catalyst
183
Table 6.7 BET characterization of fresh and spent catalysts 188

xiii
LIST OF FIGURES
Figure 2.1 World energy consumption 9
Figure 2.2 Syncrude upgrading process 13
Figure 2.3 Structure of sulfur and nitrogen compounds present in petroleum 15
Figure 2.4 Reactivity of various organic sulfur compounds in HDS versus their ring sizes and positions of alkyl substitutions on the ring
17
Figure 2.5 Relative reactivity of nitrogen compounds 18
Figure 2.6 Application of hydrotreating in a modern refinery 19
Figure 2.7 Process scheme for heavy hydrotreating of gas oil 21
Figure 2.8 Sulfur content in diesel fuel 26
Figure 2.9 NOx emission standard for diesel engine 26
Figure 2.10 Examples of hydrodesulfurization reactions 29
Figure 2.11 Examples of hydrodenitrogenation reactions 29
Figure 2.12 Hydrodesulfurization pathways of DBT 31
Figure 2.13 Hydrodesulfurization pathways of 4, 6-DMDBT 31
Figure 2.14 HDN reaction network of quinoline 33
Figure 2.15 HDN reaction network of pyridine 33
Figure 2.16 Factors affecting hydrotreating process 34
Figure 2.17 Structure of sulfide hydrotreating catalyst 39
Figure 2.18 Triangular concept of catalyst design 41
Figure 2.19 Different phases present in a typical alumina-supported catalyst 45
Figure 2.20 Distinction between rim and edge sites for stacked and unstacked MoS2 particles
46
Figure 2.21 HDS mechanism of thiophene by metal-sulfide catalyst 47
Figure 2.22 Diffusion and catalytic reaction of sulfur compounds through the catalyst pores
55
xiv
Figure 2.23 Effect of pore diameter and surface area on catalytic functionality 55
Figure 2.24 Hydrotreating catalyst deactivation profile 61
Figure 2.25 Major type of catalyst deactivation for hydrotreating catalysts due to a) poison b) deposits c) sintering d) mechanical failure e) evaporation
61
Figure 2.26 DBT conversion over different NiMo catalysts 66
Figure 2.27 4, 6-DMDBT conversion over different NiMo catalysts 66
Figure 2.28 Structure of SBA-15 68
Figure 2.29 Synthesis strategy of mesoporous SBA-15 70
Figure 2.30 Synthesis strategy of Zr-SBA-15 preparation by chemical grafting method
83
Figure 2.31 Heterogeneous catalytic reaction in porous catalyst 97
Figure 3.1 Schematic for the SBA-15 preparation in laboratory 100
Figure 3.2 Schematic for the Zr-SBA-15 preparation by post synthesis method in laboratory
102
Figure 3.3 Schematic of the experimental set-up for hydrotreating reaction 108
Figure 3.4 Catalyst bed for trickle bed reactor 109
Figure 4.1 Small-angle X-ray scattering (SAXS) pattern of SBA-15 and Zr-SBA-15 (Post) (a); Zr-SBA-15 (Direct) (b) supports.
113
Figure 4.2 EDX pattern of Zr-SBA-15 (Post 23) support 115
Figure 4.3 Nitrogen adsorption-desorption isotherm of SBA-15 and Zr-SBA-15 (Post) (a); Zr-SBA-15 (Direct) (b) supports
116
Figure 4.4 Transmission electron microscopy images of SBA-15 front view (a), side view (b); Zr-SBA-15 (Post 23) front view (c), side view (d); Zr-SBA-15 (Direct 20) (e) front view, side view (f); Zr-SBA-15 (direct 40) (g) front view, side view (h) supports
117
Figure 4.5 Scanning electron microscopy images of SBA-15 of 10 µm (a), 1 µm (b); Zr-SBA-15 (Post 23) of 10 µm (c), 1µm (d); Zr-SBA-15 (Direct 20) 10 µm (e), 1 µm (f) supports
120
Figure 4.6 FT-IR spectra comparison for SBA-15 and Zr-SBA-15 (Direct) (a); 121

xv
SBA-15 and Zr-SBA-15 (Post) (b) supports
Figure 4.7 FT-IR spectra of pyridine adsorbed species on SBA-15, Zr-SBA-15 (Direct ) and Zr-SBA-15 (Post) supports
123
Figure 4.8 Powder X-ray pattern of SBA-15, Zr-SBA-15 (Direct) and Zr-SBA-15 (Post) supports
124
Figure 4.9 Small-angle X-ray scattering pattern of NiMo catalysts supported on SBA-15, Zr-SBA-15 (Direct) and Zr-SBA-15 (Post) supports
125
Figure 4.10 EDX pattern of NiMo/Zr-SBA-15 (Post 23) catalyst 127
Figure 4.11 Nitrogen adsorption-desorption isotherm of NiMo catalyst supported on SBA-15 and Zr-SBA-15 (Post) (a); Zr-SBA-15 (Direct ) (b)
128
Figure 4.12 Transmission electron microscopy images of NiMo catalyst supported on SBA-15 front view (a); side view (b); Zr-SBA-15 (Post 23) front view (c), side view (d); Zr-SBA-15 (Direct 20) front view (e), side view (f) supports
130
Figure 4.13 Powder X-ray diffraction pattern of NiMo catalysts supported on SBA-15, Zr-SBA-15 (Direct) and Zr-SBA-15 (Post) supports.
131
Figure 4.14 Raman spectra comparison for NiMo catalyst supported on SBA-15 and Zr-SBA-15 (Direct) (a); supported on SBA-15 and Zr-SBA-15 (Post) (b) support
132
Figure 4.15 UV-DRS Spectra of NiMo/SBA-15 catalysts supported on SBA-15, Zr-SBA-15 (Post 16) and Zr-SBA-15 (Post 23) supports, absorption band due to Mo(a); Ni (b)
134
Figure 4.16 Effect of time on stream on the stability of the NiMo/Zr-SBA-15 catalyst during hydrotreating of gas oil. P=8.9 MPa, LHSV = 1 h-1, T = 370 °C, H2/HC ratio 600 Nm3/m3
137
Figure 4.17 The hydrodesulfurization and hydrodenitrogenation activity (volume basis) study of NiMo catalysts supported on SBA-15. Zr-SBA-15 (Post) and Zr-SBA-15 (Direct); T = 375/385/395 °C, P=8.9 MPa, LHSV = 1 h-1, H2/HC ratio 600 Nm3/m3. HDS (a); HDN (b)
138
Figure 4.18 The hydrotreating activity (weight basis) comparison of NiMo/Zr-SBA-15 (Post 23) and commercial catalyst; T = 375/385/395 °C, P=8.9 MPa, LHSV = 1 h-1, H2/HC ratio 600 Nm3/m3. HDS (a); HDN (b)
139
xvi
Figure 4.19 The simulated distillation of HGO feed and the product obtained by hydrotreating of HGO over NiMo/Zr-SBA-15 (Post 23) catalyst
140
Figure 5.1 Small-angle X-ray scattering pattern of SBA-15 and Zr-SBA-15 (Post 23) support
142
Figure 5.2 Nitrogen adsorption-desorption isotherm of SBA-15 and Zr-SBA-15 (Post 23) supports
143
Figure 5.3 Transmission electron microscopy images of SBA-15 front view (a), side view (b); Zr-SBA-15 (Post 23) front view (c), Zr-SBA-15 (Post 23) (d) support
144
Figure 5.4 Scanning electron microscopy images of SBA-15 of 10 µm (a),1 µm (b); Zr-SBA-15 (Post 23) of 10 µm (c), 1µm (d) support
145
Figure 5.5 Small-angle X-ray scattering pattern of NiMo catalysts supported on SBA-15, Zr-SBA-15 (Direct) and Zr-SBA-15 (Post) support
146
Figure 5.6 Nitrogen adsorption-desorption isotherm of NiMo/SBA-15 and NiMo/Zr-SBA-15 catalysts with varying metal loading
148
Figure 5.7 Transmission electron microscopy images of NiMo/SBA-15 (a); NiMo/Zr-SBA-15 (Mo 12); NiMo/Zr-SBA-15 (Mo 17); NiMo/Zr-SBA-15 (Mo 22) catalysts
149
Figure 5.8 FT-IR spectra of pyridine adsorbed species on NiMo/SBA-15 and NiMo/Zr-SBA-15 catalyst with varying metal loading
151
Figure 5.9 Powder X-ray diffraction pattern of NiMo/SBA-15 and NiMo/Zr-SBA-15 catalysts with varying metal loading
152
Figure 5.10 Raman spectra comparison for NiMo/SBA-15 and NiMo/Zr-SBA-15 catalysts with varying metal loading
153
Figure 5.11 UV-DRS comparison for NiMo/Zr-SBA-15 catalyst with varying metal loading
154
Figure 5.12 HRTEM micrographs of sulfided NiMo/SBA-15 (a), NiMo/Zr-SBA-15 (Mo 12) (b), NiMo/Zr-SBA-15 (Mo 17) (c), NiMo/Zr-SBA-15 (Mo 22) (d) catalysts
155
Figure 5.13 The hydrodesulfurization and hydrodenitrogenation activity (volume basis) study NiMo/SBA-15 and NiMo/Zr-SBA-15 catalysts with varying metal loading; T = 375/385/395 °C, P=8.9 MPa, LHSV = 1 h-1, H2/HC ratio 600 Nm3/m3. HDS (a); HDN (b)
157
xvii
Figure 5.14 The hydrotreating activity (weight basis) comparison of NiMo/Zr-SBA-15 (Mo 17) and commercial catalyst; T = 375/385/395 °C, P=8.9 MPa, LHSV = 1 h-1, H2/HC ratio 600 Nm3/m3. HDS (a); HDN (b)
158
Figure 5.15 The hydrotreating activity (volume basis) comparison of NiMo/Zr-SBA-15 (Mo 17) and commercial catalyst; T = 375/385/395 °C, P=8.9 MPa, LHSV = 1 h-1, H2/HC ratio 600 Nm3/m3. HDS (a); HDN (b)
159
Figure 5.16 The simulated distillation comparison of HGO feed and product ontained by hydrotearting of HGO over optimzed NiMo/Zr-SBA-15 (Mo 17) catalyst
160
Figure 6.1 Effect of temperature on the conversion of sulfur and nitrogen present in heavy gas oil at pressure 8.9 MPa, hydrogen/gas oil ratio 600 Nm3/m3
163
Figure 6.2 Effect of LHSV on the conversion of sulfur and nitrogen present in heavy gas oil at pressure 8.9 MPa, hydrogen/gas oil ratio 600 Nm3/m3
165
Figure 6.3 Effect of pressure on the conversion of sulfur and nitrogen present in heavy gas oil at temperature 385 °C, LHSV 1 hr-1 and hydrogen/gas oil ratio 600 Nm3/m3
167
Figure 6.4 Effect of hydrogen/gas oil ratio on the conversion of sulfur and nitrogen present in heavy gas oil at temperature 385 °C, Pressure 8.9 MPa and LHSV 1 hr-1
169
Figure 6.5 Arrhenius plot for HDS and HDN derived from Langmuir-Hinshelwood model with H2S inhibition HDS (a), HDN (b)
184
Figure 6.6 Arrhenius plot for HDS and HDN derived from Langmuir-Hinshelwood model with H2S inhibition for adsorption equilibrium constant for H2S (a), sulfur (b) and nitrogen (c)
185
Figure 6.7 Long term stability study of optimized catalyst exhibited during hydrotreating of heavy gas oil
187

xviii
NOMENCLATURE α proportionality constant relating system pressure to H2 pressure βHDS isothermality ratio for the catalyst pellet in a HDS reaction βHDN isothermality ratio for the catalyst pellet in a HDN reaction γP tortuosity of the catalyst pellets, dimensionless ∆ ρT temperature density correlation, lbs/ft3
∆ ρP pressure density correlation, lbs/ft3
∆HR,HDN heat of the hydrodenitrogenation reaction kJ/mol ∆HR,HDS heat of the hydrodesulfurization reaction kJ/mol ε catalyst bed porosity, dimensionless εP porosity of the catalyst pellets, dimensionless η effectiveness factor [ηO]N effectiveness factor at the inlet of the hydrodenitrogenation reaction
[ηP]S effectiveness factor at the inlet of the hydrodesulphurization reaction
[ηO]N effectiveness factor at the outlet of the hydrodenitrogenation reaction
[ηP]S effectiveness factor at the outlet of the hydrodesulphurization reaction
Φ thiele modulus
[ΦO]N thiele modulus at the inlet of the hydrodenitrogenation reaction
[ΦO]S thiele modulus at the inlet of the hydrodesulphurization reaction
[ΦP]N thiele modulus at the outlet of the hydrodenitrogenation reaction
[ΦP]S thiele modulus at the inlet of the hydrodesulphurization reaction
μL viscosity of HGO at the operating temperature, g/(s·cm)
ρ15.6 density of HGO at 15.6 °C, g/mL
ρL density of HGO at operating condition, g/mL

xix
ρT density of HGO at the operating conditions, g/mL
aL interfacial surface area over unit volume of a catalyst, cm-1
aS liquid/solid interfacial surface area, cm-1
λN adsorption energy for all nitrogen heteroatoms within gas oil, J/mol λS adsorption energy for all sulfur heteroatoms within gas oil, J/mol °API American Petroleum Institute gravity of petroleum liquids, dimensionless
A surface area of catalysts and catalyst supports found from BET analysis, m2/g AHDN Arrhenius constant for the hydrodenitrogenation reaction rate, s-1·(mol/L)(1-v) AHDS Arrhenius constant for the hydrodesulfurization reaction rate, s-1·(mol/L)(1-n) Al aluminum Al2O3 aluminium oxide ATM atmospheric B boron BET Brunauer-Emmett-Teller method BT benzothiophene BTU British thermal unit CA concentration of species A, mol/L Ci concentration of species i, mol/L CN concentration of all nitrogen heteroatoms within gas oil, mol/L Co cobalt CS concentration of all sulfur heteroatoms within gas oil, mol/L d average pore diameter of catalysts and catalyst supports, nm DBT dibenzothiophene DDS direct desulfurization
xx
DM demineralized water DMDBT dimethyl dibenzothiophene DRU diluents recovery unit EA activation energy for the hydrotreating reaction of species ‘A’, J/mol EDX energy dispersive X-ray spectroscopy EHDN activation energy for the hydrodenitrogenation reaction, J/mol EHDS activation energy for the hydrodesulfurization reaction, J/mol FBP final boiling point FCC fluid catalytic cracking unit FID flame ionization detector F fluorine FTIR Fourier transform infrared spectroscopy G/O ratio of volumetric flow rates between hydrogen gas and gas oil HC hydrocarbon HDA hydrodearomatization HDM hydrodemetallization HDN hydrodenitrogenation HDS hydrodesulfurization HGO heavy gas oil HH2 Henry’s constant for hydrogen in HGO, MPa·m3/mol HMS hexagonal mesoporous silica HRTEM high resolution transmission electron microscopy HYD hydrogenation
xxi
IBP initial boiling point ICP-MS inductively coupled plasma mass spectroscopy IWI incipient wetness impregnation kA apparent rate constant for species ‘A’, (mol/L)(1-n).s-1
kHDN apparent rate constant of hydrodenitrogenation, (mol/L)(1-n).s-1 kHDS apparent rate constant of hydrodesulfurization, (mol/L)(1-n).s-1 KA adsorption equilibrium constant for component A, L/mol KAA adsorption equilibrium constant for ammonia KH2S adsorption equilibrium constant for hydrogen sulfide, MPa-1
KIT-6 Korean Institute of Technology – 6 Ki adsorption equilibrium constant for i species within gas oil, L/mol KN adsorption equilibrium constant for nitrogen heteroatoms within gas oil,
L/mol KS adsorption equilibrium constant for sulfur heteroatoms within gas oil, L/mol KSA adsorption equilibrium constant for decahydroquinoline KY adsorption equilibrium constant for aromatic amines LA liquid mass flow over cross-sectional area, g/(s·cm2) LGO light gas oil LHSV liquid hourly space velocity, s-1 LPG liquefied petroleum gas m reaction order constant, dimensionless MAVE average molecular weight of HGO, g/mol MCM-41 Mobil Composition of Matter no. 41

xxii
MCM-48 Mobil Composition of Matter no. 48 Me methyl Mo molybdenum MoO3 molybdenum trioxide MPa megapascal n reaction order constant, dimensionless Ni nickel NiO nickel oxide nm nanometer NMR nuclear magnetic resonance NOx nitrogen oxides OMS ordered mesoporous silica P phosphorus P123 poly (ethylene oxide)20-poly (propylene oxide)70-poly(ethylene oxide)20 (EO20PO70EO20) PEO poly (ethylene oxide) PPO poly (propylene oxode) PH2 partial pressure of hydrogen gas, Pa PH2S partial pressure of hydrogen sulfide, Pa rA reaction rate of species A, mol/(L·s) rHDN rate of the overall hydrodenitrogenation reaction, mol/(L·s) rHDS rate of the overall hydrodesulfurization reaction, mol/(L·s) R universal gas constant, J/(mol-K) R2
coefficient of regression for the reaction models, dimensionless
xxiii
R2
A adjusted coefficient of regression for the reaction models, dimensionless S sulfur SAXS small-angle X-ray scattering SBA-15 santa Barbara amorpous-15 SBET surface area found from BET analysis, m2/g SCO synthetic crude oil SEM scanning electron microscopy SG specific gravity, dimensionless SOx sulfur oxides STEM scanning tunneling electronic microscopy Tb average boiling point of HGO, K TEOS tetraethyl orthosilicate TGA thermogravimetric analysis Ti titanium TiO2 titanium oxide TIPB triisopropyl benzene TMB trimethyl benzene TS pellet surface temperature, K TEM transmission electron microscopy TEOS tetra ethyl ortho silicate UV-DRS ultra violet diffuse reflection spectroscopy vC critical specific molar volume of HGO, mL/mol
vCm critical specific mass volume, mL/g

xxiv
vi molar volume of sulphur/nitrogen under standard conditions, mL/mol
vL molar volume of HGO under standard conditions, mL/mol
vN hydrogen molar volume at standard conditions, L/mol
Vb hydrogen molar volume at the normal boiling point, mL/mol
VC volume of loaded catalyst, mL
VDU vacuum distillation unit
VGO vacuum gas oil
VP total pore volume found for catalysts and catalyst supports, cm3/g xHDN stoichiometric ratio of H2 consumption for nitrogen removal, dimensionless
xHDS stoichiometric ratio of H2 consumption for sulphur removal, dimensionless
XRD X-ray diffraction Zr zirconium ZrO2 zirconium oxide

1
CHAPTER 1
INTRODUCTION
1.1 Research Background
The annual demand for high value petroleum products, specifically liquid fuels
(gasoline and diesel) are increasing annually for most countries in the world (Speight, 2006).
On the other hand, conventional lighter crude oil is depleting at an alarming rate across the
world (Lee et al., 2007). Due to continuing depletion of lighter crude oil and advancement of
oil sand technology, growing tendency to convert lower grade heavy feedstock, particularly
heavy oil and bitumen to liquid product is increasing (Ancheyta and Speight, 2007;
Domínguez-Crespo et al., 2008). In this regard, synthetic crude derived from oil sands are
receiving importance as an alternative source of liquid fuels, which can meet the present and
anticipated demand of conventional petroleum (Bej et al., 2001a; Bej et al., 2001b; Speight,
1984). However, oil sand (Athabasca) derived bitumen contains high levels of impurities
(such as sulfur and nitrogen), which consequently reduce the quality of liquid products such
as heavy gas oil (Bej et al., 2001b; Ding et al., 2007). Furthermore, environmental emission
regulations introduce more stringent emission standards to reduce the level of impurities
from the diesel fuel (Song and Ma, 2003). Hence, removal of impurities from heavy gas oil
has become imperative to meet the more stringent fuel specifications imposed by government
and meet the diesel product specification in terms of cetane number, density, aromatic
content, boiling point. Hydrotreating, basically a means of removal of nitrogen, sulfur,
oxygen, from gas oil, is employed in petroleum industry to improve the product quality
without significant changes of the boiling range and molecular weight distribution of gas oil
(Botchwey et al., 2006; Speight, 2006).

2
γ-Al2O3 supported NiMo/W and CoMo/W catalysts are used for hydrotreating of gas oil
(Bej et al., 2004; Breysse et al., 2008; Speight, 2006). However, gas oil obtained from the
processing of tar sands contains very high levels of impurities (sulfur ˜ 4 wt % and nitrogen ˜
0.32 wt %), which are difficult to remove using conventional NiMo/γ-Al2O3 and CoMo/γ-
Al2O3 catalysts (Ferdous et al., 2006a; Ferdous et al., 2007). Also, hydrotreating of such
lower quality feed stock with the conventional catalysts needs more severe operating
conditions (temperature, pressure), resulting in accelerated catalyst deactivation (Ancheyta et
al., 2002a; Matsushita et al., 2004). Therefore, development of more advanced hydrotreating
catalysts, which are more durable, possess higher activity and have better stability against the
severe operating conditions than the conventional hydrotreating catalysts, is essential to
process the heavy gas oil while meeting the new stringent fuel specifications (Ancheyta et al.,
2002a; Maity et al., 2000).
Innumerable studies have been carried out to develop highly effective hydrotreating
catalysts. Different approaches, such as using new supports (such as ZrO2, TiO2, MCM-41,
and SBA-15), active phases (such as noble metals), promoters (chiral compounds), and
additives (such as boron or fluorine) have been explored (Breysse et al., 2003a; Delmon,
1993; Dhar et al., 2003; Eswaramoorthi et al., 2008), and among the various strategies,
utilization of more advanced support is considered as a better alternative (Grange and
Vanhaeren, 1997; Maity et al., 2000). Catalyst supports play an important role in improving
the property of a catalyst in terms of activity, selectivity, and stability, by manipulating its
surface properties (Grange and Vanhaeren, 1997). By means of an adequate support
designing it is possible to increase the activity of a hydrotreating catalyst significantly. The
following properties are desirable for the development of good hydrotreating catalyst
3
supports: adequate textural properties, high activity and selectivity, appropriate acidity, and
optimal metal-support interaction (Afanasiev et al., 1999; Bej et al., 2004; Furimsky, 2007;
Hinnemann et al., 2005).
For the hydrotreating of heavy feeds, good textural properties are considered to be the
most important criterion that any hydrotreating catalyst support must possess (Afanasiev et
al., 1999). Adequate textural properties, namely high specific surface area and well-ordered
uniform pore structure, of the catalyst support facilitate the dispersion of the active
component on the catalyst support, allow diffusion of larger size molecules and increase the
catalyst resistance to deactivation (Ancheyta and Speight, 2007). In this regard, mesoporous
materials (such as, MCM-41, MCM-48, HMS, KIT-6, and SBA-15), which have excellent
textural properties have been explored as hydrotreating catalyst supports (Huang et al.,
2008a; Kostova et al., 2001; Sampieri et al., 2005; Soni et al., 2010). Among all mesoporous
materials, SBA-15, which consists of large ordered and defined hexagonal cylindrical
channels, received significant attention because of its excellent textural properties, higher
hydrothermal stability, and higher hydrotreating activity for refractory compounds (Chen et
al., 2004; Fulvio et al., 2005; Rayo et al., 2009). Moreover, in a hydrodesulfurization
reaction, the SBA-15 supported catalysts show superior activity compared to γ-Al2O3
supported catalyst prepared in a similar way (Dhar et al., 2005).
Although SBA-15 possesses excellent textural properties and exhibits superior activity
compared to γ-Al2O3 support, it has some limitations including the following: i) pure SBA-15
materials lack acidic sites (Rayo et al., 2009), ii) interaction between silica and Mo is very
weak (Gutiérrez et al., 2006a), and iii) it provides inhomogeneous and poor dispersion of a
sulfided active phase (Hensen et al., 2001).
4
To introduce surface acidity and improve catalytic activity of mesoporous SBA-15,
various heteroatoms and their oxides (such as, Al, Zr, Ti and Al2O3, ZrO2, TiO2) have been
incorporated into the SBA-15 framework (Gutiérrez et al., 2006a; Klimova et al., 2009; Rayo
et al., 2009). Among different heteroatoms and their oxides, zirconia (ZrO2) has attracted
much interest due to higher intrinsic hydrodesulfurization activity in comparison with other
metal oxides (Gutiérrez et al., 2009; Ji et al., 2004; Jia et al., 2005). However, the major
disadvantage associated with pure zirconia supports is low surface area and porosity, which
represent a limitation in its application as hydrotreating catalyst support (Gutiérrez et al.,
2006a; Gutiérrez et al., 2007; Jia et al., 2005). In order to overcome limitations associated
with both SBA-15 and ZrO2, incorporation of ZrO2 into the SBA-15 frameworks has been
proven to be a better alternative (Gutiérrez et al., 2009). ZrO2 incorporation in SBA-15 (Zr-
SBA-15) resulted in improving the textural property and surface acidity of the support
materials (Gutiérrez et al., 2008; Hensen et al., 2001; Rayo et al., 2009). Hence, a synergistic
effect can be obtained while incorporating ZrO2 onto SBA-15 and the resulting support can
be used for hydrotreating catalyst improvement. According to literature, the Zr-SBA-15
supported NiMo catalysts show higher catalytic activity compared to the γ-Al2O3 and SBA-
15 supported NiMo catalyst for hydrodesulfurization of refractory sulfur compounds
(Gutiérrez et al., 2008).
Incorporation of Zr species in SBA-15 can be done by the direct synthesis or the post
synthesis methods (Wu et al., 2004). In the direct synthesis method, Zr species incorporation
into SBA-15 framework is accomplished during hydrothermal synthesis of SBA-15 materials
(Chen et al., 2004). In the post synthesis method, Zr-SBA-15 is synthesized by a two stage
5
process. In the first stage, well-ordered SBA-15 is synthesized, and, in the second stage, Zr
species is impregnated into the SBA-15 structure (Gutiérrez et al., 2006a).
In this thesis, the changes in structural and textural properties due to the incorporation
of Zr species (Zr and ZrO2) in SBA-15 framework by both direct and post synthesis methods
are compared and the effects of resulting changes on the hydrotreating activity of supported
NiMo catalysts over heavy gas oil feedstock derived from Athabasca bitumen are reported.
The activity of the NiMo/Zr-SBA-15 catalyst is compared with the commercial NiMo
catalyst supported on γ-Al2O3.
1.2 Knowledge Gaps
After a comprehensive review of research articles focusing on formulation and
application of hydrotreating catalyst, it has been found that following key areas have not
been explored:
• Till now hydrotreating activity study of zirconia doped SBA-15 supported NiMo
catalyst is limited to model compounds only with a short run length. However, the activity of
the Zr-SBA-15 supported catalysts towards the real feedstock containing various refractory
and heavy compounds may not be the same as model compounds and this has not been
studied.
• Also, till now Zr-SBA-15 supports with a pore diameter of less than 8 nm have been
prepared by the post synthesis methods and tested for the hydrodesulfurization activity.
However, Zr-SBA-15 supports with larger pore diameter (> 10 nm) have not been explored
for hydrotreating activity using real feedstocks.
6
• Furthermore, no study has been conducted to investigate the effect of different Zr-SBA-
15 support preparation methods (direct synthesis and post synthesis) towards catalytic
activity using real feedstocks.
• Also, it is essential to evaluate the kinetics and catalyst stability of such new catalyst
before considering for industrial applications. This has not been done earlier using Zr-SBA-
15 supported NiMo catalyst.
1.3 Hypotheses
Based on the literature review, the following hypothesis has been considered for this
research work:
• Larger pore diameter (> 10 nm) support, prepared by the post synthesis method, will
improve the hydrodesulfurization and hydrodenitrogenation activity of NiMo/Zr-SBA-15
catalysts by transporting bulky sulfur and nitrogen molecules into the catalyst pores.
• Incorporation of Zr species into SBA-15 framework will increase the hydrotreating
activity of the NiMo/Zr-SBA-15 catalyst for Heavy Gas Oil.
• Hydrotreating catalysts supported on large pore sized Zr-SBA-15 supports will be
resistant to catalyst deactivation, which occurs due to coke and metal deposition in the
catalyst pores. Larger pore diameter will prolong the on-stream catalyst life.
1.4 Research Objectives
The main objective of this proposed research is to synthesize, characterize and study
the hydrodesulfurization (HDS) and hydrodenitrogenation (HDN) activities of NiMo catalyst
supported on Zr-SBA-15 material utilizing heavy gas oil (HGO) feed derived from
Athabasca bitumen. In order to achieve this objective the work was divided into three phases
as followings:
7
Phase I: Hydrotreating of gas oil over NiMo/Zr-SBA-15 catalysts
The changes in structural and textural properties due to the incorporation of Zr species
in SBA-15 material by both direct and post synthesis methods were compared and the effects
of the resulting changes on the hydrotreating activity of supported NiMo catalysts over heavy
gas oil feedstock derived from Athabasca bitumen were studied. The best method of Zr-SBA-
15 support preparation was determined by analyzing the extent of HDS and HDN conversion
over NiMo/Zr-SBA-15 catalysts. Furthermore, the activity of the NiMo/Zr-SBA-15 catalyst
was compared with the NiMo catalyst supported on SBA-15 and γ-Al2O3.
Phase II: Metal loading optimization for NiMo/Zr-SBA-15 catalysts
After determination of the effective Zr-SBA-15 support material for the hydrotreating
NiMo catalyst from phase I, variation of metal loading (Ni and Mo) was carried out to find
out the optimum metal (Mo and Ni) loading over Zr-SBA-15 support. In this process,
molybdenum loading was varied from 12 to 22 wt% whereas the Mo/Ni ratio was kept
constant value of 5. Catalytic activities of these catalysts were evaluated based on extent of
HDS and HDN activity exhibited during the hydrotreating of heavy gas oil.
Phase III: Kinetic study of HDS and HDN
After determination of the optimized catalyst from the phase-II, the performance of the
optimized catalyst was tested under various process conditions. The effect of reaction
conditions, such as temperature, pressure, and LHSV and H2 gas/oil ratio on HDS and HDN
over best catalyst was performed. To estimate the kinetic parameters for various reaction
conditions and predict the reaction kinetics, kinetic models were developed based on Power
Law and Langmuir-Hinshelwood kinetic expressions. Finally, in order to check the long term
stability of the optimum catalyst, a long term deactivation study was carried out for the
optimum catalyst.

8
CHAPTER 2
LITERATURE REVIEW
This chapter describes the literature review related to this research work. In section 2.1,
world energy consumption is described. Characteristics of petroleum and gas oil,
hydrotreating process and hydrotreating catalysts are described in section 2.2, 2.3 and 2.4
respectively. In section 2.5, selection of Zr-SBA-15 supports for hydrotreating of gas oil is
described. SBA-15 and Zr-SBA-15 as hydrotreating catalyst supports are described in section
2.6 and 2.7 respectively. Finally, in section 2.8 kinetic modeling of HDS/HDN is described.
2.1 World Energy Consumption
World energy consumption is expected to increase significantly due to rapid economic
growth occurring in developing countries. Presently, petroleum, coal and natural gas govern
the supply of heat, electrical energy and fuels in energy systems worldwide. These fossil
energy cover approximately 90 per cent of primary energy consumption worldwide
(petroleum 40 per cent, coal 27 per cent, natural gas 23 per cent) (Ancheyta and Speight,
2007). Energy statistics from the International Energy Agency (IEA) represent the energy
consumption of the principal fuel from 1970 to 2025 (shown in Figure 2.1) (International
Energy Outlook, 2004). From the figure it is evident that fossil fuels, including oil, coal, and
natural gas will remain the dominant sources of energy. Among the conventional fuels,
natural gas and oil consumption will increase more rapidly compared to others. Oil
consumption will rise continuously, due to increasing demand in the transportation sector.
However, due to continuous depletion of conventional oil, over next few decades the world’s
energy sector encounters challenges, which includes, growing oil scarcity, achieving energy
security, combating environmental degradation and meeting the growing needs of the

9
0
50
100
150
200
250
300
1970 1975 1980 1985 1990 1995 2000 2005 2010 2015 2020 2025
Qua
drill
ion
Btu
Year
World Energy Consumption
Petroleum Natural Gas Coal Nuclear Hydro Renewable
developing world (Dorian et al., 2006). In order to meet the global energy demand and
mitigate the problems related to the depletion of conventional oil, growing tendency to oil
production from non-conventional sources are increasing. In this context, synthetic crude oil,
extracted from tar sand, has been recognized as a viable option for producing a significant
percent of the worlds’ oil (Bej et al., 2001b). Western Canada has a large source of oil sands,
which is used for bitumen production. Currently, bitumen is used for the production of
synthetic crude oil (Yui, 2008).
Figure 2.1: World energy consumption (International Energy Outlook, 2004).
2.2 Characteristics of Petroleum and Gas Oil
2.2.1 Definition of Bitumen, Heavy Oil and Heavy Gas Oil
Petroleum or crude are the world’s major sources of energy, which is used extensively
as the sources of liquid fuels (Ancheyta and Speight, 2007). In some places synthetic crude
10
oils (heavy oil derived tar sands) are also considered as the viable sources of liquid fuel (Lee
et al., 2007). Currently, fuel, transportation and petrochemical industries greatly rely on the
petroleum and synthetic crude oil based feedstocks and this reliance is projected to be
increased continuously for several decades (Lee et al., 2007). “Petroleum”, “bitumen” and
“heavy oil” are usually defined by their physical properties as shown in Table 2.1.
Petroleum or crude oil is a naturally occurring, flammable liquid composed of mixtures
of hydrocarbons of various molecular weights and other compounds containing small
amounts of oxygen, sulfur, nitrogen, vanadium, nickel and chromium (Ancheyta and Speight,
2007; Gray, 1994) The physical characteristics of petroleum vary widely whereas their
chemical compositions are relatively uniform (Gray, 1994). The elemental compositions of
petroleum and Athabasca bitumen are shown in Table 2.2.
Oil sands (also referred as tar sands and bituminous sands) are a naturally occurring
sand deposit that containing about 10-12% bitumen, 4-6% water and 80-85% sand and clay
(Yui, 2008). Oil sand derived synthetic crude contains large amounts of middle distillate
compared to the conventional crude (Yui, 2008). It contains about 44% gas oil and 56%
vacuum bottoms.
Bitumen is the term often referred to as native asphalt and extra heavy oil, is the
mixture of hydrocarbons of natural or pyrogenous origin or combination of both (Krishnan
and Rajagopal, 2003; Speight, 2006). Bitumen basically includes a wide variety of reddish
brown to black materials of semisolid, viscous to brittle character, which are soluble in
carbon disulfide (Ancheyta and Speight, 2007; Gary and Handwerk, 2001). Tar sand (or
Athabasca) bitumen is a highly viscous hydrocarbonaceous material that consists of carbon
and hydrogen with smaller amount of nitrogen, sulfur, oxygen, aromatics, carbon residue,
11
asphaltenes and metals (Lee et al., 2007; Speight, 2006). In Canadian Athabasca tar sand the
anticipated deposited bitumen is 1.7 trillion barrels, which is considered to be a potential
source of energy (Ancheyta and Speight, 2007; Lee et al., 2007).
Heavy Oil is a type of petroleum that is different from conventional petroleum, which
requires thermal simulation of recovery from subsurface reservoir (Speight, 1999). The term
heavy oil is usually is based on °API gravity or viscosity of petroleum or crude oil. Heavy oil
is a type of petroleum that has an API gravity of less than 20 degree and sulfur content higher
than 2 wt% (Speight, 1999). Heavy oil is characterized by followings: high viscosity, low
API gravity, high specific gravity, low hydrogen to carbon ratio, high carbon residues, and
high content of asphaltenes, heavy metal, sulfur and nitrogen (Ancheyta and Speight, 2007).
Heavy gas oil (HGO) is a distillate product of petroleum. This cut could be a heavy side
stream of atmospheric distillation unit or it could be a distillate cut from a vacuum distillation
unit. HGO cut range depends upon the types of crude. HGO obtained from Kuwait crude has
boiling range 321-365 °C. HGO obtained from Arabian heavy crude has boiling range 345-
565 °C (David and Pujadó, 2006). Boiling range of HGO derived from Athabasca bitumen is
343-525 °C (Yui, 2008). HGO obtained from refinery atmospheric distillation units has a
boiling range 315-425 °C (Gray, 1994; Speight, 1999). Heavy gas oil obtained from
atmospheric distillation units is routed to heating oil blending pool, gas oil pool or fuel oil
pool (David and Pujadó, 2006). Heavy gas oil obtained by vacuum distillation of crude oil is
used as catalytic cracker feedstock (Ancheyta and Speight, 2007).
12
Table 2.1: Characteristics of conventional crude oil, bitumen and heavy oil (Gray, 1994; Lee et al., 2007).
Material API Gravity Density, g/cm3 Viscosity, mPa.s
Conventional Crude Oil 25-37 - 10
Bitumen <10 >1.00 > 105
Heavy Oil 20-10 0.934-1.0 102-105
Table 2.2: Elemental analysis of petroleum and Athabasca bitumen (Gray, 1994; Speight, 1999).
Element Percent by weight
Petroleum Athabasca Bitumen
Carbon 83-87 83.1
Hydrogen 10-14 10.3
Sulfur 0.05-6.0 4.9
Nitrogen 0.1-2.0 0.4
Oxygen 0.05 -1.5 1.3
Metals <0.1 >0.1
2.2.2 Syncrude Upgrading Process
Syncrude Canada Ltd. operates surface mining oil sands, a bitumen extraction plant,
and an upgrading facility that process bitumen and produce Synthetic Crude Oil (SCO) from
the Athabasca oil sands deposit (Yui, 2008). In Figure 2.2 the Syncrude upgrading process is
shown in block diagram. Through upgrading process, Syncrude converts bitumen into high
value, light, low sulphur Syncrude Crude Oil. Two upgrading processes are employed for this
upgrading process: primary upgrading and secondary upgrading.
In the primary upgrading, the diluted bitumen from the Extraction and Froth Treatment
Plant is sent to the Diluent Recovery Unit (DRU), where water is removed and naphtha is
recovered. The dry bitumen is then fed to the Vacuum Distillation Unit (VDU), LC-Finer

13
EXTRACTION & FROTH TREATMENT
PLANT
DILUENT RECOVERY
UNIT
VACUUMDISTILLATION
UNIT
FLUID COKER
UNIT
LC-FINING HYDROCRACKER
HYDROGEN PLANT
NAPHTHA HYDROTREATER
LIGHT GAS OIL HYDROTREATER
HEAVY GAS OIL HYDROTREATER
AMINE AND SULFUR PLANT
Sulfur
Sour Gas
Sweet Gas to Utilities
H2
Diluent & WholeBitumen
Diluent
Atmospheric Topped Bitumen
Vacuum Topped Bitumen
Natural Gas
VacuumLGO
Bottoms
Vacuum HGO
Virgin LGOCoke
H2
H2
H2
Syncrude Sweet Premium
Hydrocracking and Coker unit. In the VDU, LGO and HGO are distilled off and sent to the
hydrotreater unit. The remaining bitumen is sent to the LC-Finer hydrocracking and coker
unit, where bitumen is cracked. In the LC-Finer umit, LGO and HGO are produced via a
catalytic process in the presence of hydrogen. LGO and HGO are then sent to the
hydrotreater unit and the remaining bitumen is sent to the Coker unit. In the Coker unit
Naphtha, LGO, HGO, and coke are produced. Naphtha, LGO and HGO are sent to the
hydrotreater unit for further treatment. In the secondary upgrading stage, sulfur, nitrogen and
aromatics are removed from naphtha, LGO and HGO. The treated liquid products are then
blended together to form Syncrude Crude Oil (SCO) and sent to a downstream refinery (Yui,
2008).
Figure 2.2: Syncrude upgrading process (Yui, 2008).
14
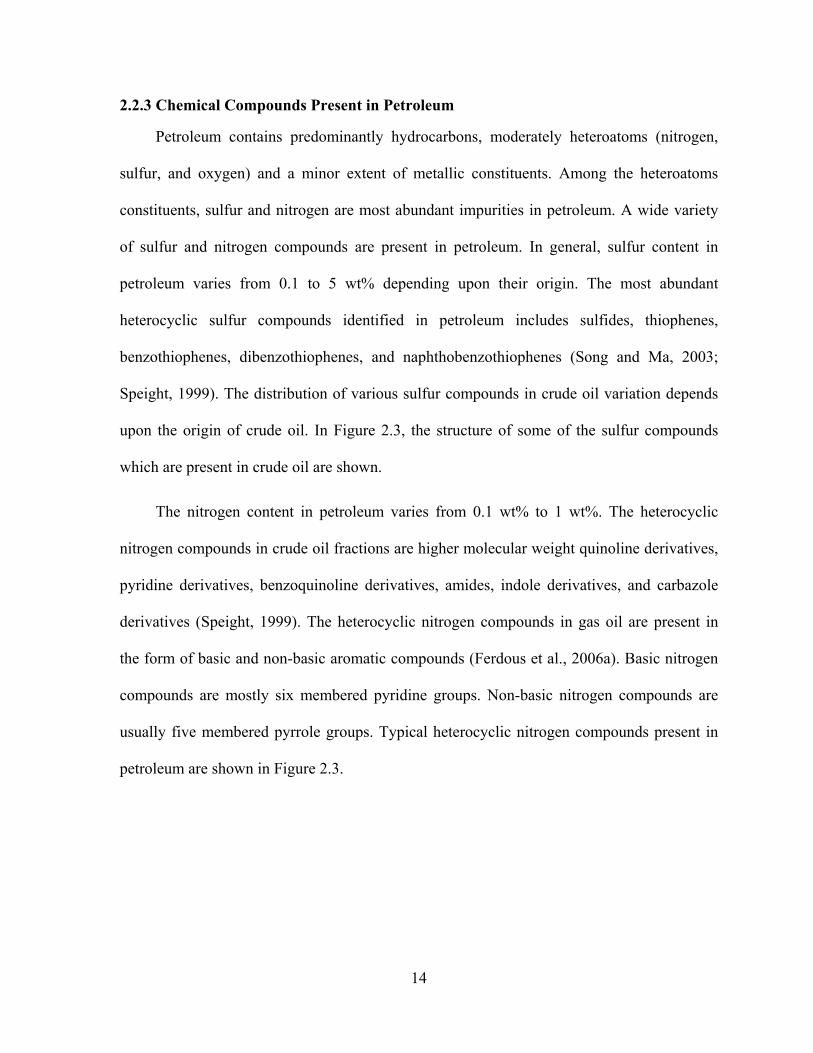
2.2.3 Chemical Compounds Present in Petroleum
Petroleum contains predominantly hydrocarbons, moderately heteroatoms (nitrogen,
sulfur, and oxygen) and a minor extent of metallic constituents. Among the heteroatoms
constituents, sulfur and nitrogen are most abundant impurities in petroleum. A wide variety
of sulfur and nitrogen compounds are present in petroleum. In general, sulfur content in
petroleum varies from 0.1 to 5 wt% depending upon their origin. The most abundant
heterocyclic sulfur compounds identified in petroleum includes sulfides, thiophenes,
benzothiophenes, dibenzothiophenes, and naphthobenzothiophenes (Song and Ma, 2003;
Speight, 1999). The distribution of various sulfur compounds in crude oil variation depends
upon the origin of crude oil. In Figure 2.3, the structure of some of the sulfur compounds
which are present in crude oil are shown.
The nitrogen content in petroleum varies from 0.1 wt% to 1 wt%. The heterocyclic
nitrogen compounds in crude oil fractions are higher molecular weight quinoline derivatives,
pyridine derivatives, benzoquinoline derivatives, amides, indole derivatives, and carbazole
derivatives (Speight, 1999). The heterocyclic nitrogen compounds in gas oil are present in
the form of basic and non-basic aromatic compounds (Ferdous et al., 2006a). Basic nitrogen
compounds are mostly six membered pyridine groups. Non-basic nitrogen compounds are
usually five membered pyrrole groups. Typical heterocyclic nitrogen compounds present in
petroleum are shown in Figure 2.3.
15
Figure 2.3: Structure of sulfur and nitrogen compounds present in petroleum (Topsøe et al., 1996).
16
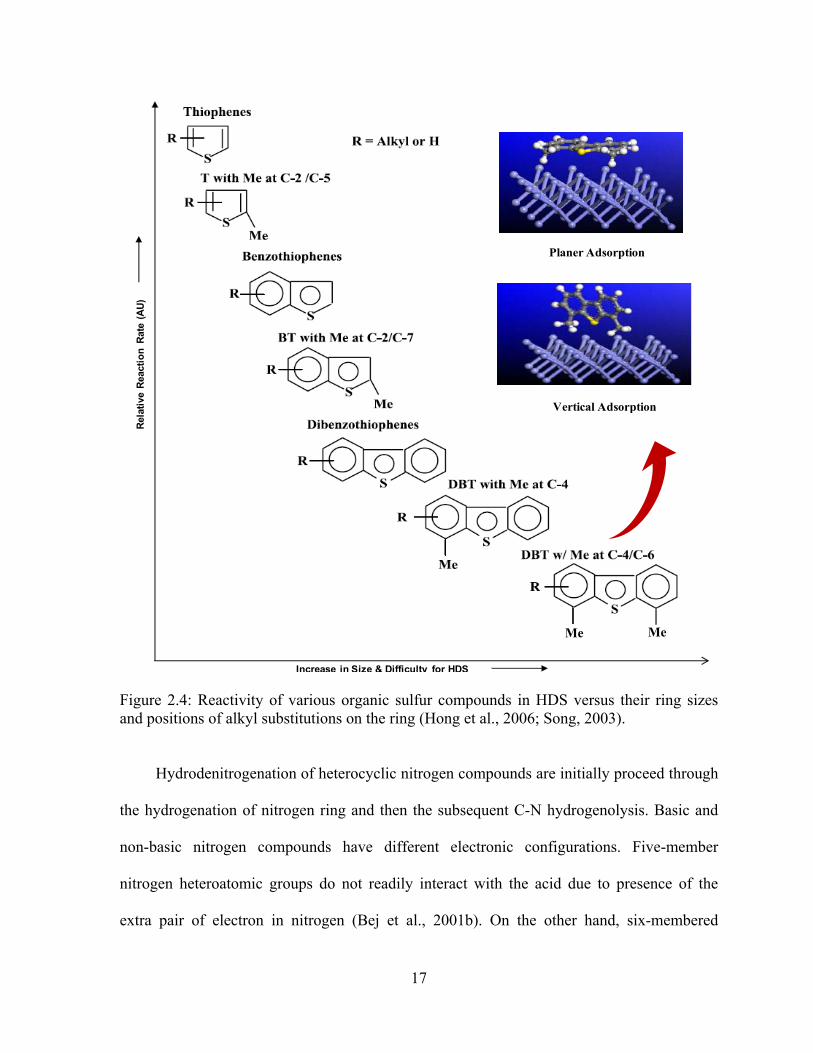
2.2.4 Reactivity of Sulfur and Nitrogen Compounds
Hydrodesulfurization reactivity depends on structure and molecular size of the sulfur
containing compounds. A reactivity ranking for the sulfur compounds in HDS reaction is
presented in Table 2.3 (Speight, 1999). Desulfurization reactivity is related to the location of
the substituent groups. Substituent groups located far from the sulfur atom do not affect the
HDS activity (Kabe et al., 1998). However, substituent groups which are located at the
adjacent of sulfur atom, retard the HDS rates. For refractory compounds, inhibition of C-S
bond cleavage or adsorption of substrates greatly affected by steric hindrance of substituents.
In the diesel oil fraction, the most refractive is compound is higher molecular weight
dibenzothiophene, which has side chains at the adjacent to the sulfur atom. Sterically
hindered compounds, such as 4, 6 –dimethyl dibenzothiophene and 4,-methyl
dibenzothiophene are reported to be less reactive than unsubstituted dibenzothiophene
(Knudsen et al., 1999). In Figure 2.4, the type and size of sulfur molecules and their
reactivity are presented.
Table 2.3: Hydrodesulfurization reactivity of various sulfur substituted molecules (Speight, 1999).
Compound Type Relative Activity
Thiophene 2,5-dimethyl < 2-methyl < no substituent < 3-methyl
Benzothiophene 3-methyl < 2-methyl = no substituent 3,7 – dimethyl < 3-methyl = 2-methyl = 7-methyl < no substituent
Dibenzothiophene 4,6-dimethyl < 4-methyl < no substituent < 3,7-dimethyl < 2,8 – dimethyl
17
Figure 2.4: Reactivity of various organic sulfur compounds in HDS versus their ring sizes and positions of alkyl substitutions on the ring (Hong et al., 2006; Song, 2003).
Hydrodenitrogenation of heterocyclic nitrogen compounds are initially proceed through
the hydrogenation of nitrogen ring and then the subsequent C-N hydrogenolysis. Basic and
non-basic nitrogen compounds have different electronic configurations. Five-member
nitrogen heteroatomic groups do not readily interact with the acid due to presence of the
extra pair of electron in nitrogen (Bej et al., 2001b). On the other hand, six-membered
Rela
tive
Reac
tion
Rate
(AU)
Increase in Size & Difficulty for HDS
Planer Adsorption
Vertical Adsorption
Me Me

18
N
>N
>N
NH
NH
> >
nitrogen heteroatoms interact with the acid due to presence of unshared pair of electrons. The
order of decreasing reactivity for hydrogenation of nitrogen ring compounds is shown in
Figure 2.5.
Figure 2.5: Relative reactivity of nitrogen compounds (Schulz et al., 1986).
2.3 Characteristics of Hydroteating Process
2.3.1 Definition of Hydrotreating Process
Hydrotreating or catalytic hydrogen treating is an important catalytic process that
removes objectionable materials from petroleum fractions and/or stabilizes petroleum
products by selectively reacting them with hydrogen over a catalyst without changing the
boiling range of the feed (Ancheyta and Speight, 2007; Gary and Handwerk, 2001). Removal
of objectionable elements includes heteroatoms, such as nitrogen, oxygen, sulfur, halides,
nickel and vanadium. Stabilization of products includes saturation of olefins, diolefins and
aromatics (Speight, 1999). When the purpose of the hydrotreating process is to remove sulfur
from the petroleum fraction it is called as hydrodesulfurization (HDS). When the purpose of
the hydrotreating process is to remove nitrogen, it is called as hydrodenitrogenation (HDN).
Similarly, the removal of oxygen and metals from the feed by means of hydrotreating process
is called as hydrodeoxygenation (HDO) and hydrodemetallization (HDM). In a modern
refinery the application of hydrotreating depends upon the desired distribution of different
products and their compositional requirements. Starting from lighter material such as naphtha
to heavier distillates such as jet fuel to heavy vacuum gas oil are treated in the hydrotreating

19
unit to meet the environmental regulation or to use as feedstock for other units (Gary and
Handwerk, 2001). Hydrotreating process is also used for upgrading the quality of
atmospheric residues. Application of hydrotreating in a modern refinery is shown in Figure
2.6. However, depending upon the type of crude, local product demand and desired product
slate there will be a variation in the final process schemes.
Figure 2.6: Application of hydrotreating in a modern refinery (Mochida and Choi, 2004).
HydrotreaterLT Naphtha
HV Naphtha
Hydrotreater
HydrotreaterKerosene
ATM Gas Oil Hydrotreater
Atmospheric Distillation
Unit
Reformer Aromatic Extraction
LPG
C4
Gasoline
H2
Kerosene
Hydrotreater Hydrocracker
Fuel Oils
Hydrotreater
Hydrotreater
FCC
Aromatics
Asphalt
Coke
Crude Oil
Vacuum Distillation
Unit
Coker Unit Deasphalting
GasGas Plant
20
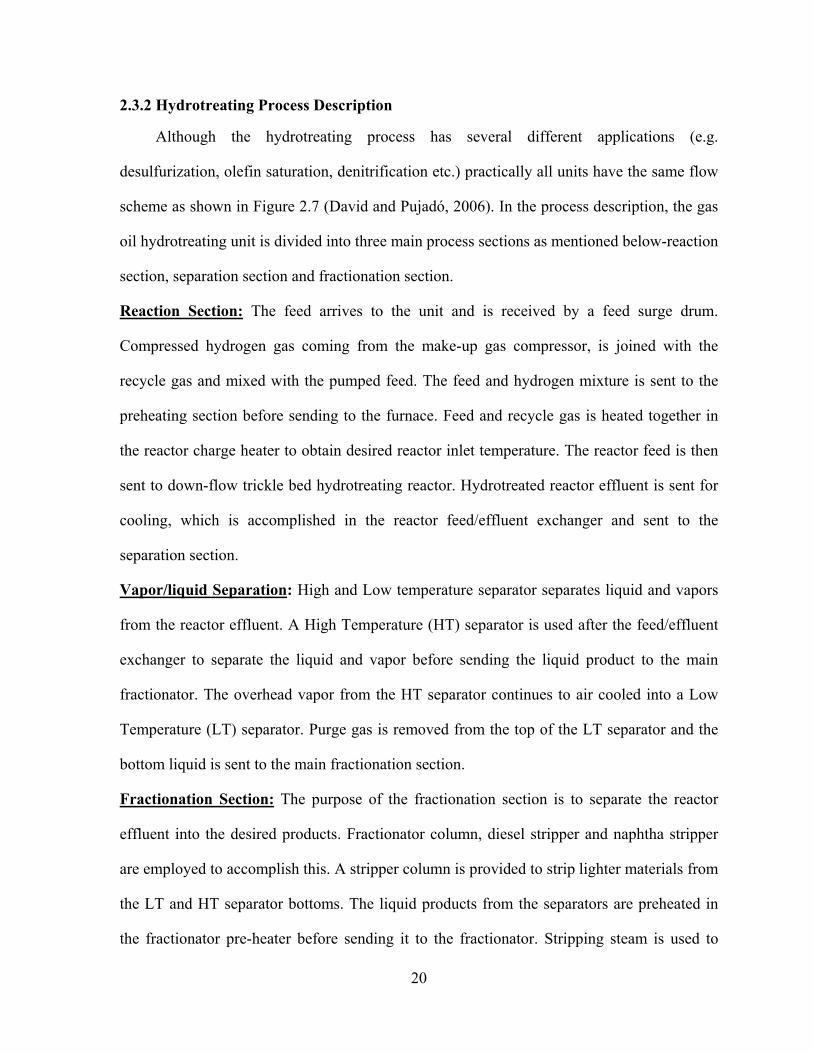
2.3.2 Hydrotreating Process Description
Although the hydrotreating process has several different applications (e.g.
desulfurization, olefin saturation, denitrification etc.) practically all units have the same flow
scheme as shown in Figure 2.7 (David and Pujadó, 2006). In the process description, the gas
oil hydrotreating unit is divided into three main process sections as mentioned below-reaction
section, separation section and fractionation section.
Reaction Section: The feed arrives to the unit and is received by a feed surge drum.
Compressed hydrogen gas coming from the make-up gas compressor, is joined with the
recycle gas and mixed with the pumped feed. The feed and hydrogen mixture is sent to the
preheating section before sending to the furnace. Feed and recycle gas is heated together in
the reactor charge heater to obtain desired reactor inlet temperature. The reactor feed is then
sent to down-flow trickle bed hydrotreating reactor. Hydrotreated reactor effluent is sent for
cooling, which is accomplished in the reactor feed/effluent exchanger and sent to the
separation section.
Vapor/liquid Separation: High and Low temperature separator separates liquid and vapors
from the reactor effluent. A High Temperature (HT) separator is used after the feed/effluent
exchanger to separate the liquid and vapor before sending the liquid product to the main
fractionator. The overhead vapor from the HT separator continues to air cooled into a Low
Temperature (LT) separator. Purge gas is removed from the top of the LT separator and the
bottom liquid is sent to the main fractionation section.
Fractionation Section: The purpose of the fractionation section is to separate the reactor
effluent into the desired products. Fractionator column, diesel stripper and naphtha stripper
are employed to accomplish this. A stripper column is provided to strip lighter materials from
the LT and HT separator bottoms. The liquid products from the separators are preheated in
the fractionator pre-heater before sending it to the fractionator. Stripping steam is used to
21
remove lighter material from the products. The overhead product of the fractionator is sent to
the naphtha stripper to obtain naphtha products. The bottom of the fractionators is basically
heavy product, and is sent for further treatment. The fractionator side cut is sent to the diesel
stripper to remove any water and H2S before sending to diesel storage as the final diesel
product.
Figure 2.7: Process scheme for hydrotreating of gas oil (David and Pujadó, 2006).

22
2.3.3 Purposes of Hydrotreating
Hydrotreating process is applied for various process streams depending upon the
desired product specification of the final products. Hydrotreating for gas oil stream is done to
remove heteroatoms from the gas oil. The elimination of heteroatoms from heavy gas oil is
required for the following reasons:
• Abatement of SOX and NOX emission: The major emission from diesel engines
constitute of SOx and NOx. Control of these emissions is targeted by improving the fuel
specification and engine performance. Environmental emission regulations introduce more
stringent national emission standards to maintain SOx and NOx emissions below regulatory
levels (Song and Ma, 2003). Hence, sulfur and nitrogen removal from gas oil has become
imperative in order to meet the more stringent fuel specifications imposed by government.
• Improvement of diesel fuel properties: Diesel product specification needs to be met
in terms of cetane number, aromatic content, density, and boiling point, which can be
achieved by hydrotreating process (Furimsky, 2007).
• Protection of catalyst: Hydrotreating processes helps to protect the catalysts used in
downstream units (such as fluid catalytic cracking and hydrocracking) of the refining process
(Grange and Vanhaeren, 1997).
• Fuel stability: Hydrotreating processes increases the stability of the final diesel fuel
during storage (Rahimi et al., 1998).
• Reduction of equipment corrosion: High level of sulfur in feedstock can cause
corrosion in the refinery process equipments (Speight, 1999). Hydrotreating processes
reduces the corrosion during refining and handling of various refinery streams.

23
2.3.4 Hydrotreated Diesel Specification
The major emissions from diesel engines constitute of SOX, particulates, CO, NOx and
HC. Hydrotreating process technology is applied to improve the diesel fuel specification and
control the emissions from diesel engine. The following key properties of diesel fuel have
been identified which are considered to have major impact on emission and needs to be
improved by hydrotreating process (Gray, 1994; Satterfield, 1991; Speight, 1999).
• Sulfur: Sulfur present in the crude oils and essential to remove to an acceptable level
during refining process since it promotes corrosion. Sulfur in diesel fuel has a direct
relationship on SOx emission from the exhaust. The H2SO4 formed in the exhaust stream due
to emission of “S” compounds causes increased formation of particulate matter in the
exhaust. Also, sulfur reduces the efficiency of catalytic converters.
• Cetane Number: Cetane number (CN) is a measure of the ignition properties and
combustion of the diesel fuel. Cetane number influences the length of the time from the start
of fuel injection to the start of combustion in diesel engines. Higher cetane values results in
better combustion and lower emissions. Cetane (n-hexadecane), has cetane number a 100 and
it ignites very easily. It is related to the aromatic content of the fuel. The cetane number is
important for the quality measurement of diesel fuel, as a higher cetane number reduces the
ignition delay, provides smoother combustion and lower combustion noise.
• Density: Diesel is made up of a mixture of complex hydrocarbons of various densities
and molecular weights. Hence, the density of diesel is related to other parameters, such as
cetane number, aromatic content, viscosity and distillation. Variation of fuel density can
result in variation in the energy content of fuel, ignition temperature and NOx emission.

24
• Viscosity: Viscosity is the measure of fuels’ resistance to flow. High viscosity fuel can
reduces the flow rate of the fuel, which results in insufficient flow rate and reduces the
performance of the diesel fuel pump. Low viscosity may result in leakage of fuel from
pumping system. Hence the viscosity range of diesel needs to be maintained.
• Aromatics: Aromatics and polyaromatics are the key factors for particulate formation.
Polyaromatics also have an effect on ignition temperature. The formation of NOx is related
to ignition temperature.
• 95% boiling point: The volatility of the diesel is measured by the distillation curve.
For diesel T95 distillation is very important as this provides the information about the
proportion of heavier components. The presence of heavier components in diesel results in
incomplete combustion. Hence, reduction of end point is required to decrease the quantity of
unburned HC and the level of particulate emitted. This also improves viscosity and cold flow
properties of diesel. The diesel specifications for Europe and USA are presented in Table 2.4.
Table 2.4: Diesel specifications for Europe and USA (Topsøe et al., 1996).
Europe USA Year 2005 2005 Density , kg/m3 , max 825 876 S, ppmw, max 50 500 (15 from 2006) Cetane no 58 40 Aromatics , vol% - 10 Poly aromatics, wt% , max 1 2 Boiling range , IBP-FBP, °C 180-340 180-365 Viscosity@40 °C, mm2/s 2.0-4.5 1.9-4.1
2.3.5 Challenges of Hydrotreating Processes
An innumerable number of articles have been published regarding the difficulties
associated with hydrotreating of gas oil. Presently, societal needs for the high quality
valuable liquid fuels, especially diesel and gasoline, are increasing. In order to meet these

25
requirements, refineries are facing challenges to product high quality diesel product due to
following reasons (Babich and Moulijn, 2003).
• Degradation of quality of crude oil: The depletion of the reserves of the conventional
petroleum has created an interest in the conversion of the heavier feedstock, such as
Athabasca bitumen (Speight, 1999). Processing of heavier feedstock causes the quality
degradation of gas oil. Currently, it is difficult to achieve the required level of conversion of
heavier feedstock with the Ni (Co) Mo/γ-Al2O3 catalysts, which have been widely used for
hydroprocessing of conventional feeds (Bej et al., 2001a).
• Presence of refractory sulfur compounds in gas oil: The most refractive sulfur
compounds are higher molecular weight compounds that contain side chains with sulfur
atoms. Refractory molecules, 4-methyl-DBT (4-MDBT) and 4, 6-dimethyl-DBT (4, 6-
DMDBT) are key sulfur compounds in the gas oil fraction and they are difficult to
desulfurize. However, in order to achieve desired level of HDS and targeted product sulfur
level of 15 ppm, it is essential to desulfurize these refractory molecules (Furimsky, 2007).
• Presence of high level of nitrogen: Bitumen derived gas oil contains a high level of
nitrogen (0.30 wt %) compared to other crude such as Kuwait crude oil derived gas oil
(0.13wt %) (Bej et al., 2001a; Ferdous et al., 2006b). In order to obtain a desirable
conversion of hydrotreating reactions a high level of hydrodenitrogenation is essential
(Furimsky and Massoth, 2005). In addition, during hydrotreating process, nitrogen
compounds are more strongly adsorbed on catalytic sites than the refractory compounds.
Strong adsorption of nitrogen compounds adversely affect the hydrogen activation process
and hinder the adsorption of refractory compounds on the catalyst surface resulting in lower
hydrotreating activity (Furimsky and Massoth, 2005).

26
• Stringent environmental regulation: Stringent environmental regulation creates
major technical challenges. In Canada, diesel fuel specification for off-road engines is set at
500 ppm untill 31st May 2010 and 15 ppm from 31st May 2010 onwards (Environmental
Canada). The limit of sulfur in on-road diesel fuels set by government from 1990 to 2015 is
shown in Figure 2.8. Also, the NOx emission level standard over the period of 20 years for
on-road diesel engines is shown in Figure 2.9. Hence, the projected changes in the final
diesel fuel specification require modification of process parameters or replacing current
catalysts with more active catalysts.
• Process, reactor and catalyst improvement: The ultra-low sulfur diesel (ULSD)
production target necessitates major modification in the refinery process, including changing
of process conditions, reactor configuration and catalyst. Hydrotreating efficiency can be
increased by employing advanced reactors (e.g. multiple bed reactors), new reactor internals
and catalyst. In refinery, conventional HDS process is employed to improve the
desulfurization process. However, several other processes, such as transformation of sulfur
compounds by catalytic distillation etc, have been proposed, which may prove very
0
200
400
600
800
1000
2000 2005 2010 2015 2020
NO
x (
tho
usan
d t
on
nes p
er
year)
Year
NOx Level (Canada)
NOx Level
1
10
100
1000
10000
1990 1995 2000 2005 2010 2015
S (m
g/k
g)
Year
S Specification in Diesel (Canada)
S Content
Figure 2.8: Sulfur content in diesel fuel (Environmental Canada)
Figure 2.9: NOx emission standard for diesel engine (Environmental Canada)
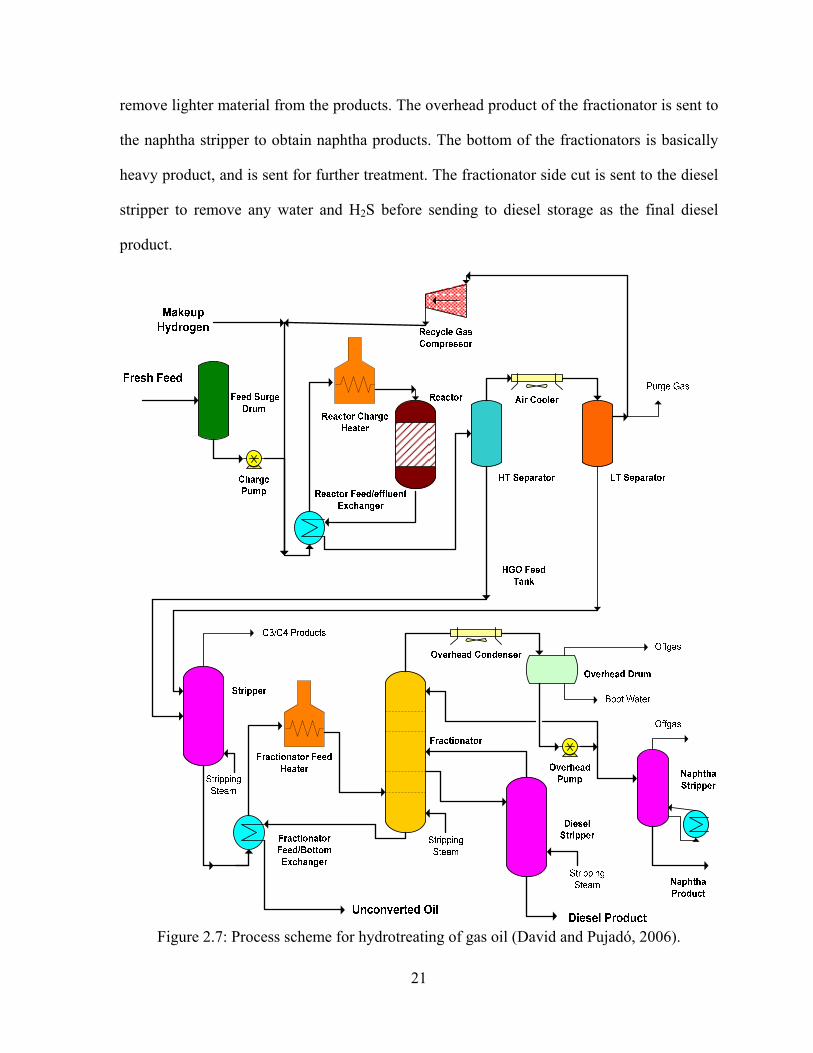
27
promising for producing ULSD (Babich and Moulijn, 2003). Deep desulfurization also can
be obtained by increasing the severity of HDS process conditions. Required increase in
catalyst activity (for typical Co-Mo catalyst) and temperature to achieve different reduction
in sulfur content of diesel product is shown in Table 2.5. However, improving of
hydrotreating process, reactor and catalyst involve significant economic constraints.
• Product demand: Due to advancement of oil sand technology, supply of the heavy
crude oil is increasing to meet the energy demand. In order to satisfy the changing pattern of
the liquid fuel demand and processing of heavier oil, considerable investment in the
improvement of refinery hydrotreating processes will be necessary. Challenges lies to utilize
the heavy crude oil profitably for the production of liquid fuel.
• Economic requirement: In the refinery, hydrotreating process technology and catalyst
have significant economic importance. Economic efficiency of the hydrotreating process
depends upon the process technology being employed. In order to obtain the deep
desulfurization several process technologies such as, UniPure aromatic sulfur reduction
technology and SulphCo desulfurization technology have been suggested (Babich and
Moulijn, 2003). But, further progressive research is required to develop the more
economically favorable technology for the hydrotreating process.
Table 2.5: Target of product sulfur, required increase in catalyst activity and temperature (Knudsen et al., 1999).
Product Sulfur (ppm) Required Increase in Catalyst Activity(%)
Required Increase in Temperature (°C)
500 100 0
350 130 +7
200 190 +17
100 300 +29
50 420 +38

28
2.3.6 Chemical Reactions of Hydrotreating
A wide range of competitive reactions can occur during hydrotreating process. The
desirable reactions, which correspond to the purpose of the hydrotreating process, are:
• Hydrodesulfurization (elimination of sulfur)
• Hydrodenitrogenation (elimination of nitrogen)
• Demetallization (elimination of metal)
• Saturation of olefins and diolefins
• Hydrogenation of aromatic compounds
The undesirable reactions, which cause loss of valuable components of the feedstock
and reduce the activity of catalyst, are:
• Hydrocracking: Hydrocracking is an undesirable reaction, which consume hydrogen
and reduces product yields.
• Coking: Coking occurs due to adsorption of heavy molecules on the acidic sites of the
catalyst and form coke. Coking is responsible for the catalyst activity reduction.
Desirable Hydrotreating Reactions:
Hydrodesulfurization Reactions: In this process sulfur compounds, present in the
feedstock such as mercaptants, sulfides, and disulfides reacts with hydrogen and get
converted into corresponding saturated or aromatic compounds. These reactions are
exothermic and lead to formation of hydrogen sulfides. Examples of hydrodesulfurization
reactions are shown in Figure 2.10 (David and Pujadó, 2006).
Hydrodenitrogenation Reactions: In this process nitrogen compounds present in the
feedstock such as amine and pyridine reacts with hydrogen and gets converted into
corresponding saturated or aromatic compounds. These reactions are exothermic and lead to
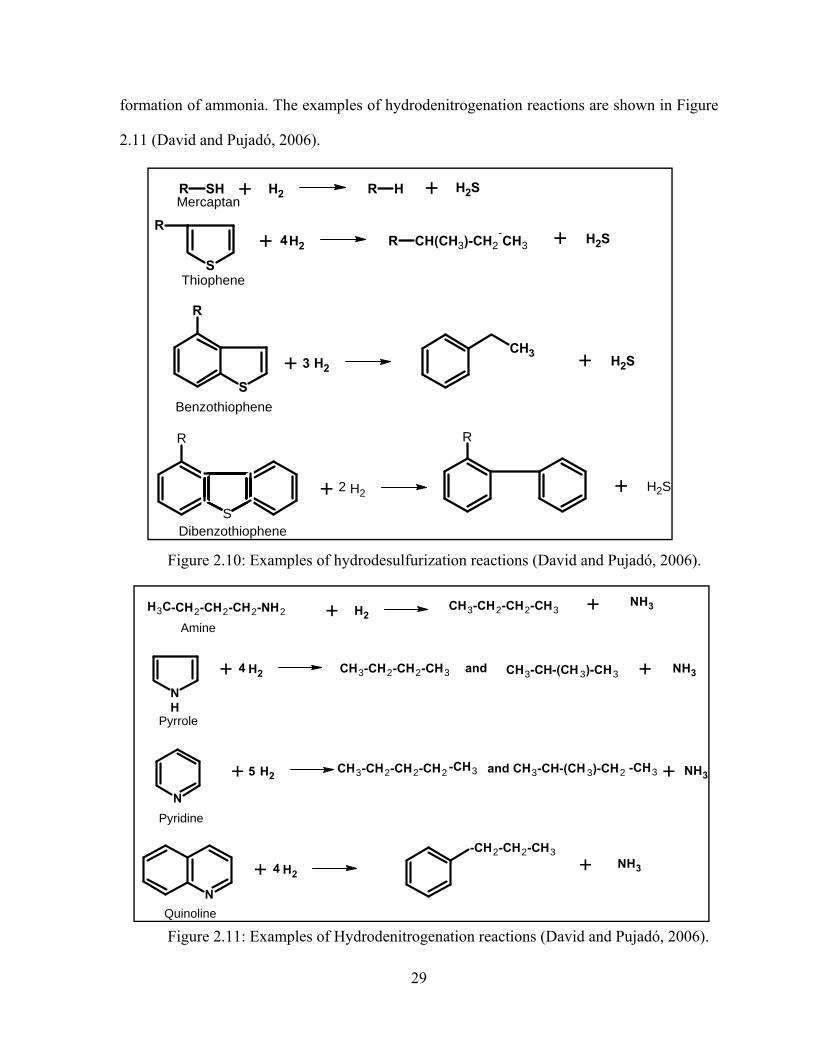
29
-CH2-CH2-CH2-NH2H3C + H2+ NH3CH3-CH2-CH2-CH3
NH
+ H2 + NH3CH3-CH2-CH2-CH34 CH3-CH-(CH 3)-CH3and
N
+ H2 + NH3CH3-CH-(CH 3)-CH2and5 CH3-CH2-CH2-CH2 -CH3 -CH3
N
+ H2 + NH34-CH2-CH2-CH3
Amine
Pyrrole
Pyridine
Quinoline
R SH + H2 R H + SH2
+ H2 R CH(CH3)-CH2-CH3 + SH2
S
R4
S
R
+ H2 + SH23CH3
R
S+ H2 + SH22
R
Mercaptan
Thiophene
Benzothiophene
Dibenzothiophene
formation of ammonia. The examples of hydrodenitrogenation reactions are shown in Figure
2.11 (David and Pujadó, 2006).
Figure 2.10: Examples of hydrodesulfurization reactions (David and Pujadó, 2006).
Figure 2.11: Examples of Hydrodenitrogenation reactions (David and Pujadó, 2006).
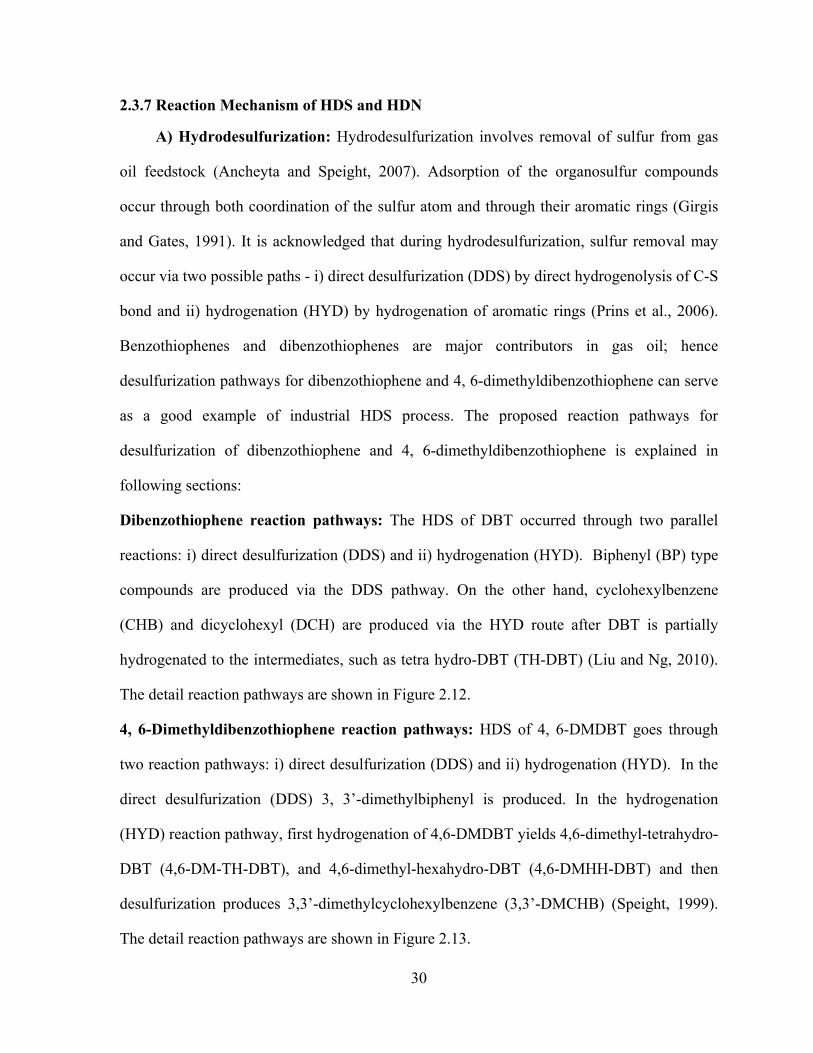
30
2.3.7 Reaction Mechanism of HDS and HDN
A) Hydrodesulfurization: Hydrodesulfurization involves removal of sulfur from gas
oil feedstock (Ancheyta and Speight, 2007). Adsorption of the organosulfur compounds
occur through both coordination of the sulfur atom and through their aromatic rings (Girgis
and Gates, 1991). It is acknowledged that during hydrodesulfurization, sulfur removal may
occur via two possible paths - i) direct desulfurization (DDS) by direct hydrogenolysis of C-S
bond and ii) hydrogenation (HYD) by hydrogenation of aromatic rings (Prins et al., 2006).
Benzothiophenes and dibenzothiophenes are major contributors in gas oil; hence
desulfurization pathways for dibenzothiophene and 4, 6-dimethyldibenzothiophene can serve
as a good example of industrial HDS process. The proposed reaction pathways for
desulfurization of dibenzothiophene and 4, 6-dimethyldibenzothiophene is explained in
following sections:
Dibenzothiophene reaction pathways: The HDS of DBT occurred through two parallel
reactions: i) direct desulfurization (DDS) and ii) hydrogenation (HYD). Biphenyl (BP) type
compounds are produced via the DDS pathway. On the other hand, cyclohexylbenzene
(CHB) and dicyclohexyl (DCH) are produced via the HYD route after DBT is partially
hydrogenated to the intermediates, such as tetra hydro-DBT (TH-DBT) (Liu and Ng, 2010).
The detail reaction pathways are shown in Figure 2.12.
4, 6-Dimethyldibenzothiophene reaction pathways: HDS of 4, 6-DMDBT goes through
two reaction pathways: i) direct desulfurization (DDS) and ii) hydrogenation (HYD). In the
direct desulfurization (DDS) 3, 3’-dimethylbiphenyl is produced. In the hydrogenation
(HYD) reaction pathway, first hydrogenation of 4,6-DMDBT yields 4,6-dimethyl-tetrahydro-
DBT (4,6-DM-TH-DBT), and 4,6-dimethyl-hexahydro-DBT (4,6-DMHH-DBT) and then
desulfurization produces 3,3’-dimethylcyclohexylbenzene (3,3’-DMCHB) (Speight, 1999).
The detail reaction pathways are shown in Figure 2.13.

31
S
S
DBT
TH-DBTBP
CHB
DCH
DDS
ROUTE
HYDROGENATION
ROUTE
3, 3' - DMBP
Isomers of 4,6- DMDBT
DDS ROUTE
HYDROUTE
CH3
+ Isomers
CH3
S
CH3
CH3
S
CH3 CH3
S
CH3
+ Isomers
3, 3' - DMCHB
+ Isomers
HYDD PRODUCTS
4,6- DM-HH-DBT4,6- DM-TH-DBT
4,6- DMDBT
CH3
Figure 2.12: Hydrodesulfurization pathways of DBT (Liu and Ng, 2010).
Figure 2.13: Hydrodesulfurization pathways of 4, 6-DMDBT (Liu and Ng, 2010).

32
B) Hydrodenitrogenation: Hydrodenitrogenation involves removal of nitrogen from
nitrogen containing compounds present in gas oil feedstock (Ancheyta and Speight, 2007).
Nitrogen removal from heterocyclic organo-nitrogen compounds proceed initially through
hydrogenation of the ring containing the nitrogen atom followed by the hydrogenolysis of the
carbon-nitrogen bond (Lu et al., 2007). Major pathways involved in the hydrodenitrogenation
are: i) hydrogenation of nitrogen ring ii) cleavage of C-N bond and formation of amine
intermediates and c) hydrogenolysis of hydrocarbon (Furimsky and Massoth, 2005).
Quinoline and pyridine, heterocyclic nitrogen compounds, are identified in middle distillates
in significant concentration. Also, quinoline and pyridine contain both a heterocyclic ring and
benzene ring. Hence, reaction pathways of quinoline and pyridine HDN are good example of
those involved in industrial HDN process (Lu et al., 2007). In the following section
hydrodenitrogenation of quinoline and pyridine are described:
Quinoline reaction pathways: The mechanism of quinoline HDN reaction consists of three
steps: i) hydrogenation of quinoline, PY-TH (1, 2, 3, 4 -propyl tetrahydro) quinoline and BZ-
TH (5,6,7,8-tetrahydro) quinoline, ii) hydrogenolysis of O-propylaniline and
decahydroquinoline and iii) cracking of n-propylbenzene and n-propyl cyclohexane (Lu et
al., 2007). A reaction pathway for quinoline is shown in Figure 2.14.
Pyridine reaction pathways: The mechanism of pyridine HDN reaction consists of two
steps: i) hydrogenation of pyridine to intermediate piperdine and ii) sequential
hydrogenolysis of C-N bond to form n-pentylamine and C5 hydrocarbon. A reaction pathway
for quinoline is shown in Figure 2.15.
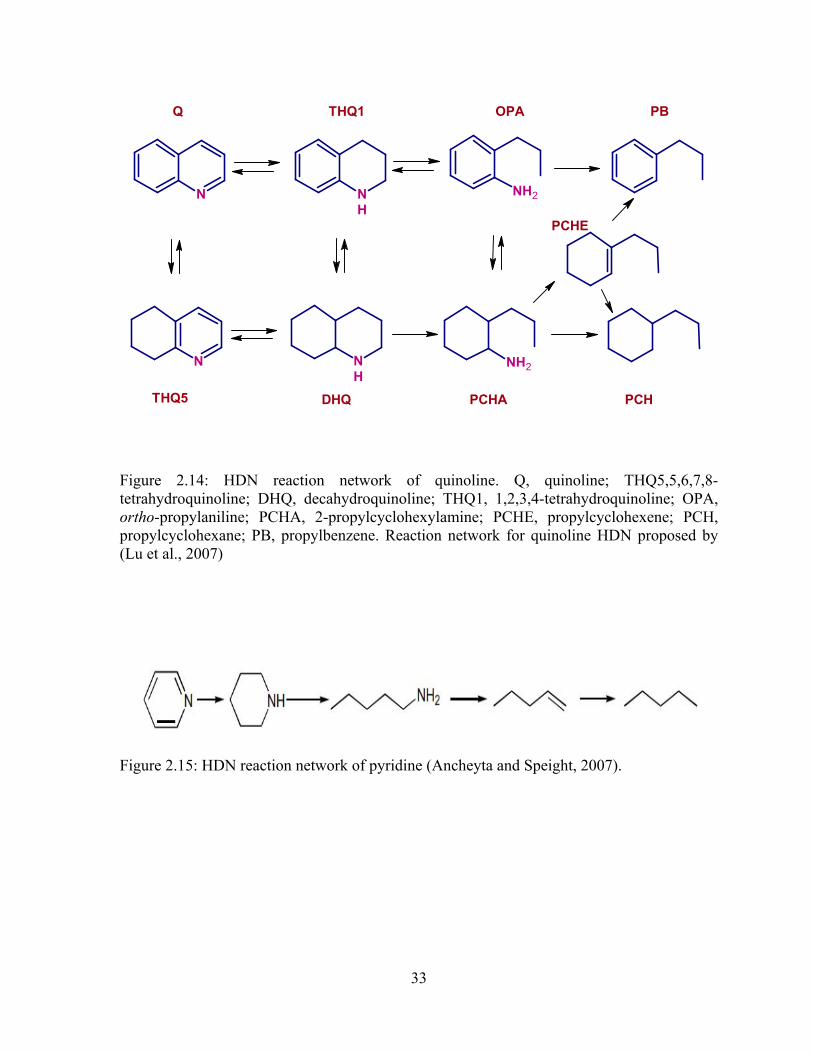
33
N
Q
NH
NH2
THQ1 OPA PB
N NH2NH
PCHE
PCHTHQ5 DHQ PCHA
Figure 2.14: HDN reaction network of quinoline. Q, quinoline; THQ5,5,6,7,8-tetrahydroquinoline; DHQ, decahydroquinoline; THQ1, 1,2,3,4-tetrahydroquinoline; OPA, ortho-propylaniline; PCHA, 2-propylcyclohexylamine; PCHE, propylcyclohexene; PCH, propylcyclohexane; PB, propylbenzene. Reaction network for quinoline HDN proposed by (Lu et al., 2007)
Figure 2.15: HDN reaction network of pyridine (Ancheyta and Speight, 2007).
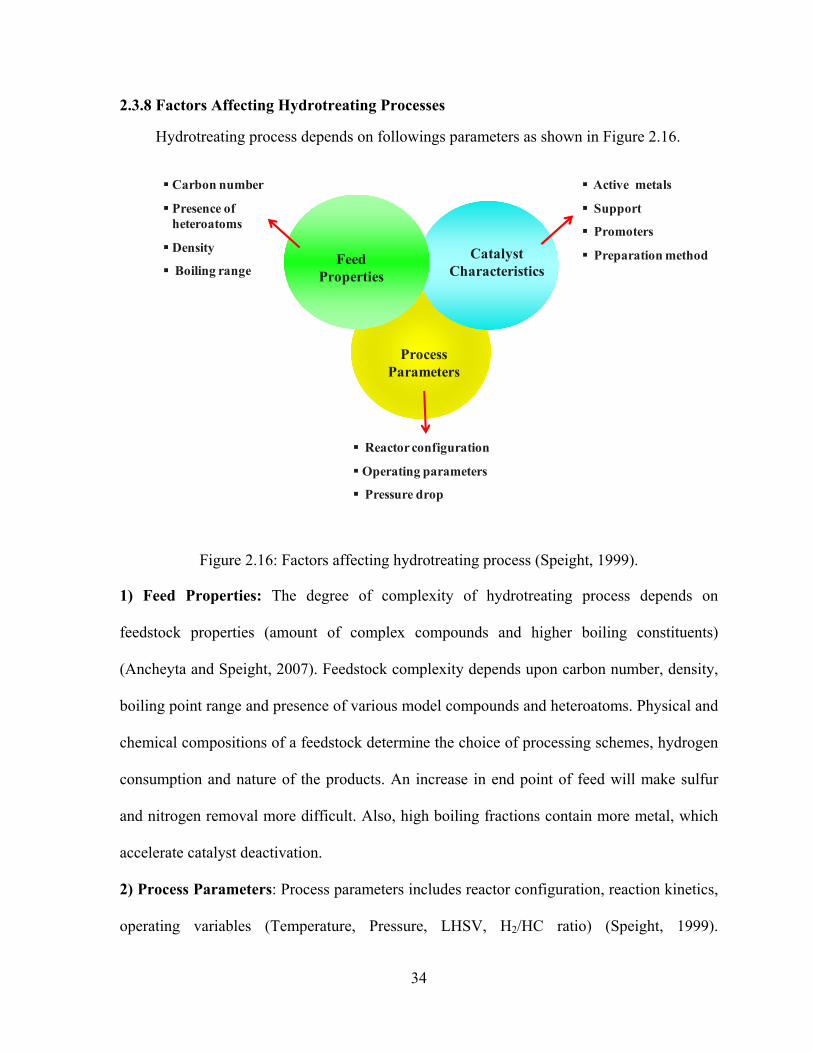
34
2.3.8 Factors Affecting Hydrotreating Processes
Hydrotreating process depends on followings parameters as shown in Figure 2.16.
Figure 2.16: Factors affecting hydrotreating process (Speight, 1999).
1) Feed Properties: The degree of complexity of hydrotreating process depends on
feedstock properties (amount of complex compounds and higher boiling constituents)
(Ancheyta and Speight, 2007). Feedstock complexity depends upon carbon number, density,
boiling point range and presence of various model compounds and heteroatoms. Physical and
chemical compositions of a feedstock determine the choice of processing schemes, hydrogen
consumption and nature of the products. An increase in end point of feed will make sulfur
and nitrogen removal more difficult. Also, high boiling fractions contain more metal, which
accelerate catalyst deactivation.
2) Process Parameters: Process parameters includes reactor configuration, reaction kinetics,
operating variables (Temperature, Pressure, LHSV, H2/HC ratio) (Speight, 1999).
Active metals
Support
Promoters
Preparation method
Carbon number
Presence of heteroatoms
Density
Boiling range
Reactor configuration
Operating parameters
Pressure drop
Feed Properties
Catalyst Characteristics
Process Parameters

35
Hydrotreating process parameters are adjusted depending on the feed quality, type and
amount of heteroatom present and desired product slate.
• Reactor Configuration: Reactors used for hydrotreating of heavy feeds are different
from the lighter feed being used for the hydrotreating. Depending upon the types of feed,
commercial hydrotreating reactors are divided into: fixed bed, moving bed, and ebullated
bed. The fixed bed reactors are in general used for the lighter feed such as naphtha and
middle distillates. Moving bed and ebullated bed reactors are used for hydroprocessing of
difficult feed, such as vacuum residua (Ancheyta and Speight, 2007). The fixed-bed reactor is
commonly used industrially in hydrotreating process since they are easy and simple to
operate. In this reactor, feed enters from the top, trickle down through the fixed catalyst bed
and product leaves from the bottom of the reactor. For naphtha processing, fixed bed reactor
are convenient, as the undesirable impurities such as sulfur compounds are easy to remove by
this reactor. However, to obtain deep desulfurization of gas oil, which contains difficult
refractory sulfur (such as 4,6-DMDBT), nitrogen and aromatics molecules, it is difficult to
product ultra low sulfur diesel using simple fixed bed reactor. In this case, multibed system
with different catalysts has been suggested as better option. In this reactor hydrogen is
introduced between the catalyst bed to control the reaction temperature.
• Operating Conditions: By careful monitoring of process variables of hydrotreating unit
the desired product quality can be obtained. The operating conditions of the hydrotreating
process are determined by the type of feed being processed, degree of desulfurization (or
denitrogenation), product specification, such as cetane improvement or extent of aromatic
saturation. The following operating parameters are important for the hydrotreating process:

36
hydrogen partial pressure, reactor temperature, liquid hourly space velocity, H2/HC ratio,
other parameters such as H2/H2S ratio.
i) Hydrogen partial pressure: This is one of the key parameters for the hydrotreatment
process. Hydrogen partial pressure varies based on degree of sulfur, nitrogen or aromatic
removal. Reduction of operating pressure below the design level will have effect on activity
of catalyst and will accelerate catalyst deactivation. An increase in hydrogen pressure results
in increasing the hydrotreatment reaction and decreasing the coke deposits on the catalysts.
Adequate pressure needs to be kept to obtain desired product yield. The operating pressure
depends upon the type feed stock needs to be processed. In case of aromatic saturation or
improvement of cetane number the pressure needs to be increased. Typical pressure range for
the hydrotreating process is shown in the Table 2.6.
ii) Reactor temperature: Diesel hydrotreating is an exothermic process, where the heat is
generated. The catalyst bed temperature generally increases over the time. Increasing reactor
temperature will accelerate coke formation and reduce the length of the operating cycle. An
average temperature needs to be maintained to allow efficient hydrotreatment and a long
catalyst life. In order to obtain maximum conversion and control the reaction temperature,
catalyst beds are divided into two or three beds by injecting quench gas between the beds.
The required reactor temperature for the hydrotreating process depends upon the feed rate
and quality (David and Pujadó, 2006). Aromatic saturation is favored by low temperature.
For the diesel hydrotreatment in industrial hydrotreating reactor, the average bed temperature
varies from 340 °C at the start of run (SOR) condition to 410 °C to end-of-run (EOR).
iii) Liquid hourly space velocity: Liquid hourly space velocity is defined as :

37
LHSV = [Volumetric flow rate of feed (m3/h)/Catalyst Volume (m3)] (time-1)
LHSV is basically inverse to the residence time. Hence, lower the value of LHSV is the
higher the reaction rate. Increasing the space-velocity requires higher reactor temperature to
achieve the desired conversion level, which results in faster catalyst deactivation rate. In case
of diesel desulfurization, LHSV are maintained 1-2.5 h-1 for the pilot plant and 2.5 h-1 for the
commercial plant (Ancheyta and Speight, 2007).
iv) Hydrogen/gas oil ratio: Hydrogen gas flow rate for the hydrotreating is governed by the
economic consideration. Increasing the partial pressure improves the hydrotreating process
and reduces the catalyst deactivation (Ancheyta and Speight, 2007). However, above certain
gas rate, the change in hydrotreating process is not very significant. In general hydrogen
recycle stream is used to maintain the higher H2/oil ratio and hydrogen partial pressure.
Operating conditions for the hydrotreating processes are shown in the Table 2.6.
Table 2.6: Operating conditions for hydrotreating processes (David and Pujadó, 2006; Gray, 1994).
Feedstock Naphtha Kerosene Gas Oil Vacuum Gas Oil
Residue
Boiling Range (°C) 70-180 160-240 230-350 350-550 >550
Operating Temperature (°C)
260-300 300-340 320-350 360-380 360-380
Operating Pressure (MPa)
0.5-1.0 1.5-3.0 1.5-4.0 4.0-7.0 12.0-16.0
LHSV (hr-1) 4-10 2-4 1-3 1-2 0.15-0.3
H2/HC Ratio (std m3/m3)
36-48 36-48 36-48 36-48 12-24
3) Catalyst Characteristics: Catalyst activity depends upon specific surface area, surface
morphology, and mechanical strength. The hydrotreating catalysts consist of metals in an
38
oxide state. The active form (sulfide state) is obtained by sulfiding the catalyst either prior to
use or with the feed during processing. The hydrotreating process is greatly influenced by the
type of catalyst. Selection of catalyst is done based on the feed characteristic and required
level of the product specification. Recently, in order to achieve deep desulfurization and
denitrogenation several methods are employed to develop better hydrotreating catalyst
compared to the commercial one.
2.3.9 Ways to Improve Hydrotreating Process
There are many ways to attain the desired level of heteroatom (sulfur, nitrogen)
removal from more difficult molecules. Some of the most currently popular suggested and
proven methods are (Ancheyta and Speight, 2007):
• Replacing current catalyst with more active catalyst
• Higher operating temperature
• End point adjustment of the feed
• Higher purity hydrogen make-up or increased hydrogen partial pressure
• Adding additional reactor volume (one or more reactors)
• H2S removal from the recycle gas
• Improving the feed distribution to the trickle-bed (conventional) reactor
Among all the method, replacing current catalyst with more active catalyst is suggested
and proven to be more promising. There has been a growing interest to develop catalyst that
can perform deep desulfurization and hydrodenitrogenation. Catalysts are considered to have
significant role to solve the problem of conversion of heavy oil into more valuable lighter oil.

39
2.4 Hydrotreating Catalyst
2.4.1 Conventional Hydrotreating Catalyst
Hydrotreating catalysts contain active components (molybdenum or tungsten) and
promoters (cobalt or nickel), which are uniformly dispersed over a support (alumina, silica,
silica-alumina) (Speight, 1999). The structure of commercial sulfided catalyst is shown in
Figure 2.17. Cobalt acts as a promoter for sulfided Mo/γ-Al2O3 in hydrodesulfurization
(HDS), whereas nickel is favored in hydrodenitrogenation (HDN) (Speight, 1999). The
commercial hydrotreating catalysts consisting of varying amount of active component and
promoters, depending upon the intended application of hydrotreating process. Gamma
alumina (γ -Al2O3) is usually used as hydrotreating catalyst support (David and Pujadó, 2006;
Speight, 1999). Occasionally, hydrotreating catalysts contain P, B, F, or Cl, (modifier), which
may influence both the catalytic and mechanical properties of the catalyst (Speight, 1999).
Hydrotreating catalysts are active in the sulfide form (Speight, 1999). Typical composition
for the hydrotreating catalyst is shown in the Table 2.7.
Figure 2.17: Structure of sulfided hydrotreating catalyst (Topsøe et al., 1996).
Support
MoS2 Slab
Active edge atom Active corner atom
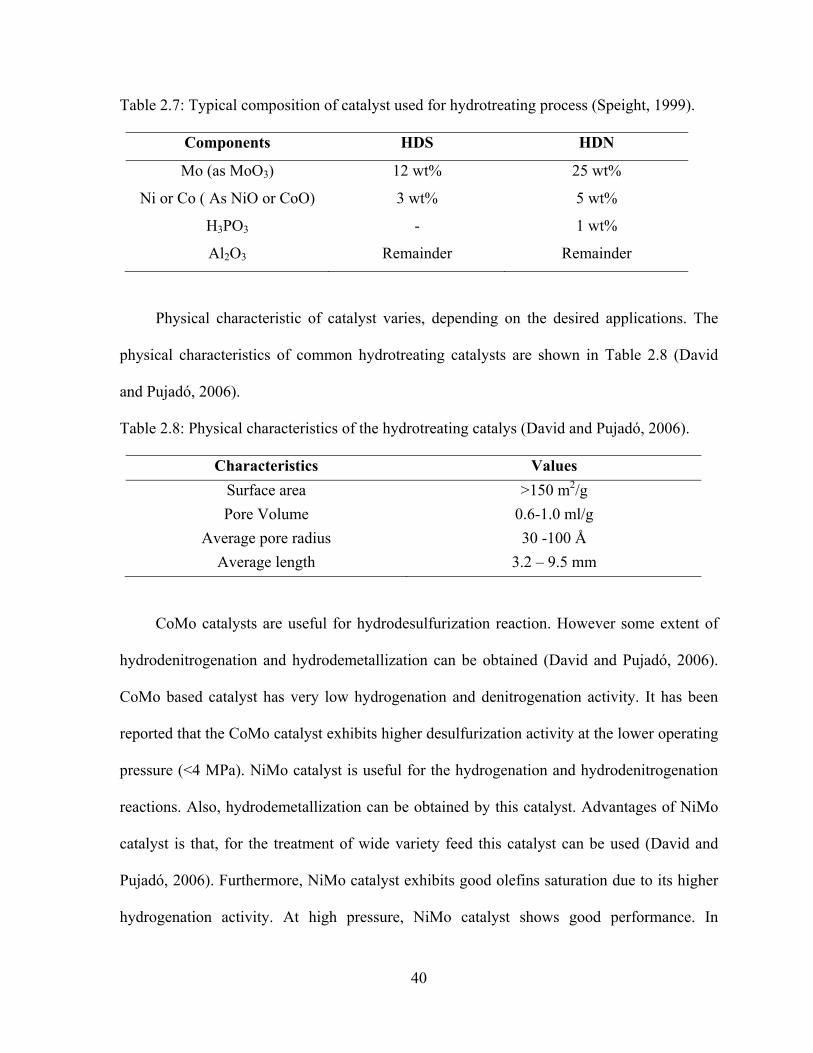
40
Table 2.7: Typical composition of catalyst used for hydrotreating process (Speight, 1999).
Components HDS HDN
Mo (as MoO3) 12 wt% 25 wt%
Ni or Co ( As NiO or CoO) 3 wt% 5 wt%
H3PO3 - 1 wt%
Al2O3 Remainder Remainder
Physical characteristic of catalyst varies, depending on the desired applications. The
physical characteristics of common hydrotreating catalysts are shown in Table 2.8 (David
and Pujadó, 2006).
Table 2.8: Physical characteristics of the hydrotreating catalys (David and Pujadó, 2006).
Characteristics Values Surface area >150 m2/g Pore Volume 0.6-1.0 ml/g
Average pore radius 30 -100 Å Average length 3.2 – 9.5 mm
CoMo catalysts are useful for hydrodesulfurization reaction. However some extent of
hydrodenitrogenation and hydrodemetallization can be obtained (David and Pujadó, 2006).
CoMo based catalyst has very low hydrogenation and denitrogenation activity. It has been
reported that the CoMo catalyst exhibits higher desulfurization activity at the lower operating
pressure (<4 MPa). NiMo catalyst is useful for the hydrogenation and hydrodenitrogenation
reactions. Also, hydrodemetallization can be obtained by this catalyst. Advantages of NiMo
catalyst is that, for the treatment of wide variety feed this catalyst can be used (David and
Pujadó, 2006). Furthermore, NiMo catalyst exhibits good olefins saturation due to its higher
hydrogenation activity. At high pressure, NiMo catalyst shows good performance. In

41
hydrotreating process NiW catalyst is used for the application of higher hydrogenation
reaction (Speight, 1999). This catalyst is good for the saturation of one of the double bond in
diolefins (David and Pujadó, 2006).
2.4.2 Hydrotreating Catalyst Design and Improvement
Hydrotreating Catalyst Design: Catalyst design is the careful optimization of
physical, chemical, mechanical and catalytic properties, which can be described by the
catalyst design triangle concept (shown in Figure 2.18) (Richardson, 1989). A good catalyst
possesses high activity and selectivity. A high activity allows relatively small reactor
volumes, short reaction times, and operation under mild condition. A good catalyst should
maintain its activity and selectivity over a period of time. Catalyst activity can be increased
by increasing the porosity and surface area. However, the surface area decreases with the
increase of catalyst porosity. Also, strength of catalyst decreases as porosity increases.
Figure 2.18: Triangular concept of catalyst design (Richardson, 1989).
Catalyst Design
Chemicophysical Properties :
Texture, Surface area, porosity, acidity, composition, density
Mechanical Properties:
Strength,attrition, abrasion, thermal shock resistance
Catalytic Properties:
Surface area, porosity, activity, selectivity, stability
42
Improvement of Hydrotreating Catalysts: In order to improve activity of
hydrotreating catalyst, several research works have been carried out. In order to develop
more advanced HDT catalysts following main areas are explored (Babich and Moulijn, 2003;
Breysse et al., 2003a; Eswaramoorthi et al., 2008):
• Active Metals: Hydrotreating catalyst are the sulfides of Group VI A (Mo, W)
promoted by sulfides of metals of group VIII (Ni, Co). Various pairs of sulfides are available
with different activity for various conversions. Hence, it is imperative to select a well-defined
association of sulfides depending on the feed characteristics and desired product slate.
Chemical composition of the catalyst also plays an important role in determining overall
activity of the catalyst. In order to develop highly active catalyst, increasing the amount of
active metals or changing of active metal (using noble metals such as Pt, Pd, Ru etc) have
been explored by several researchers.
• Structure of Support: Choice of support used for hydrotreating and characteristics of
support determines activity and selectivity for catalyst. Modification or change of supports
(type, texture, and chirality) is performed to enhance the catalytic activity of hydrotreating
catalysts. Support formulations are optimized to obtain desired product slate. Acidity of the
catalyst is imparted by the support. Acid strength and acid site distribution is imperative for
optimum activity and selectivity of the hydrotreating catalyst. Some of the acidic supports
have been explored in order to enhance the catalyst activity.
• Preparation Routes: Preparation parameters such as i) impregnation method, ii) metal
loading, iii) activation procedure and iv) calcination temperature strongly affect the activity
of the catalyst. Different catalyst preparation routes (such as sol-gel method, multiple
impregnations) have been investigated in order to improve the HDT catalyst activity.
43
• Additives: Changes in catalyst structure and activity can be achieved by adding a third
element to hydrotreating catalyst. In order to improve the acidity and activity several
additives such as phosphorous, boron, zinc, alkali dopant and fluorine have been tested.
• Promoters: New promoters in terms of organic, inorganic and chiral compounds have
been also tested for the improvement of catalyst.
2.4.3 Structure of Hydrotreating Catalysts
Molybdenum (Mo) and Tungsten (W) are effectively used as catalyst active
components for the hydroprocessing of various petroleum fractions and synthetic crudes.
Commercial hydrotreating catalyst comprise of active components (Mo or W), which are
promoted by Co or Ni and dispersed on high surface area support (Lauritsen et al., 2007).
Hydrotreating catalysts are active only in their sulfide forms, such as molybdenum sulfide
(MoS2) or tungsten sulfide (WS2). For the hydrotreating catalyst (NiMo/Al2O3 or
CoMo/Al2O3) the structure and dispersion on the active phase changes during the catalyst life
cycle (Eijsbouts, 1997).
Various catalyst models are presented in the literature about the structural information
of sulfide Co-Mo or NiMo phases, the function and location of Co or Ni for the hydrotreating
catalysts (Eijsbouts, 1997; Lauritsen et al., 2007; Topsoe and Clausen, 1984). These models
are:
• the “monolayer model” (Schuit and Gates, 1973), where molybdenum species are
proposed to be bonded to the surface of alumina by forming a monolayer;
• the “intercalation models” (Voorhoeve, 1971), where MoS2 slab (WS2) is proposed to
be consisting of plane of Mo (W) atoms sandwitched between two hexagonal closed-packed
of sulfur atom and Co is considered to interact into the layer structure of MoS2;
44
• the “contact synergy model” (Delmon, 1979), where the promoting effect of Co is
proposed to be due to contact between Co9S8 and MoS2 phases;
• the “remote control model” (Vissers et al., 1987), where H2 is dissociatively adsorbed
on Co sulphide and subsequently transferred to the MoS2 surface, where it reacts with the
adsorbed sulfur containing molecules (Topsoe and Clausen, 1984);
• the “Co-Mo-S model” (Topsoe and Clausen, 1984), where the Co-Mo-S phase is
proposed to be MoS2 structure and the location of promoters are supposed to be at the edge
plane of MoS2;
• the “rim-edge model” (Daage and Chianelli, 1994), where morphology of the MoS2 or
WS2 structure is assumed to affect the reaction pathways selectivity (direct desulfurization
and hydrogenation) of overall hydrodesulfurization reaction.
Among all models, the “Co-Mo-S model” and “rim-edge model” are the most widely
accepted models for the structure of the hydrotreating catalyst (Topsoe and Clausen, 1984).
According to the “Co-Mo-S model”, the catalyst is proposed to be consist of MoS2
crystallites supported on the alumina surface and promoted by Co or Ni atoms at the edge
plane of MoS2 (Delgado, 2002). The Co-Mo-S structure is not a single phase, but it is
basically a bulk phase with a fixed overall Co: Mo: S stoichiometry (Delgado, 2002). The
structure is described as a family with varying Co concentration ranging from pure MoS2 to
full coverage of MoS2 by Co. In Co-Mo-S, Co is present in three different phases as shown in
Figure 2.19 (Lauritsen et al., 2007) i) the catalytically active Co-Mo-S phase, which has
MoS2-like structure decorated by Co, ii) a thermodynamically stable Co9S8 and iii) Co
dissolved in the Al2O3 structure. Among three phases, Co-Mo-S structure is associated with

45
Al2O3
Co9S8
CoMoS
Co: Al2O3
S
Co(Ni)
Mo
appreciable catalytic activity, and this characteristic is applicable for other related catalysts
structure, such as Ni-Mo-S, Co-W-S, and Ni-W-S (Delgado, 2002).
Figutre 2.19: Different phases present in a typical alumina-supported catalyst (Lauritsen et al., 2007)
Depending on the type of support, preparation and activation parameters, metal
loading, presence of additives, both single and multiple Co-Mo-S structure (Delgado, 2002;
Eijsbouts, 1997) are proposed. The type I phases, i.e. CoMoS2 type-I, consists of highly
dispersed monolayer MoS2 particles interacting with the support via Mo-O-Al bond and
supposed to be incompletely sulfided, i.e. have lower S coordination of Mo and Co (Ni)
(Eijsbouts, 1997; Hensen et al., 2001; Joshi et al., 2008). The type II, i.e. CoMoS2 II consists
of lower dispersed MoS2 particles of higher stacking degree and proposed to be fully
sulfided, i.e. have higher S coordination of Mo and Co (Ni). In the type-II structure, MoS2
particles weakly interact with the support via Van der Waals interactions. Catalytic activity
of type-I and type-II phases depends upon the reactants. For thiophene hydrodesulfurization,
CoMoS type-II phases are reported to be more active than the type-I phases (Topsoe and
Clausen, 1984). However, for the dibenzothiophene HDS in trickle flow, CoMoS type-I

46
reported to be more active than the CoMoS type-II phase. The activity difference for
thiophene and DBT HDS reaction is attributed to the difference in HDS mechanism for both
the cases.
In the “Rim-edge” model, the catalyst particles are assumed as a stack of several discs
as shown in Figure 2.20 (Daage and Chianelli, 1994). The top and bottom disc are described
as “rim site” and the disc located in between the top and bottom disc are described as “edge
site”. According to this model, sulfur hydrogenolysis (C-S bond breaking) takes places both
rim and edge sites, whereas, DBT hydrogenation takes place on the rim site only. The
proportions of of rim site are very high in Al2O3 supported catalyst.
Figure 2.20: Distinction between rim and edge sites for stacked and unstacked MoS2 particles (Berhault et al., 2008).
2.4.4 HDS Reaction Mechanism by Metal-Sulfide Catalysts
Hydrodesulfurization of sulfur molecules on metal sulfide catalysts is described by the
concept of “vacancy” (Delgado, 2002; Gray, 1994). Vacancies in the catalyst are generated
due to reaction of hydrogen with surface sulfide group. Thermodynamically unstable vacant
sites then tend to regain the stability by forming metal bonded sulfide group. Hence, sulfur
extrusion from organosulfur compounds takes place by C-S bond cleavage and the extruded

47
sulfur fills the vacant sites of the metal-sulfide catalyst. The catalytic site is regenerated by
removing sulfur by hydrogen. Catalytic cycle for hydrodesulfurization of a sulfur-containing
molecule by a sulfur vacancy on MoS2 is shown in Figure 2.21.
Figure 2.21: HDS mechanism of thiophene by metal-sulfide catalyst (Mochida and Choi, 2004).
2.4.5 Promoters
Catalytic activity of hydrotreating catalyst can be significantly enhanced by adding
promoters. Several models have been suggested in order to describe the promotional effect of
hydrotreating catalyst by many authors. The role of Co and Ni promoters in hydrotreating
catalysts are shown in the Table 2.9.
Mo
S
Mo
S
S Mo S +S
S
Mo
SH
Mo
SH
S Mo S
S
Mo
S
Mo
SH
S Mo S
S
Mo
S
Mo
S
S Mo
S
S
+
H2
Mo
S
Mo
SH
S Mo S
SH
SH2-
+
CH2
CH2
Mo
S
Mo
S
S Mo S
H2+
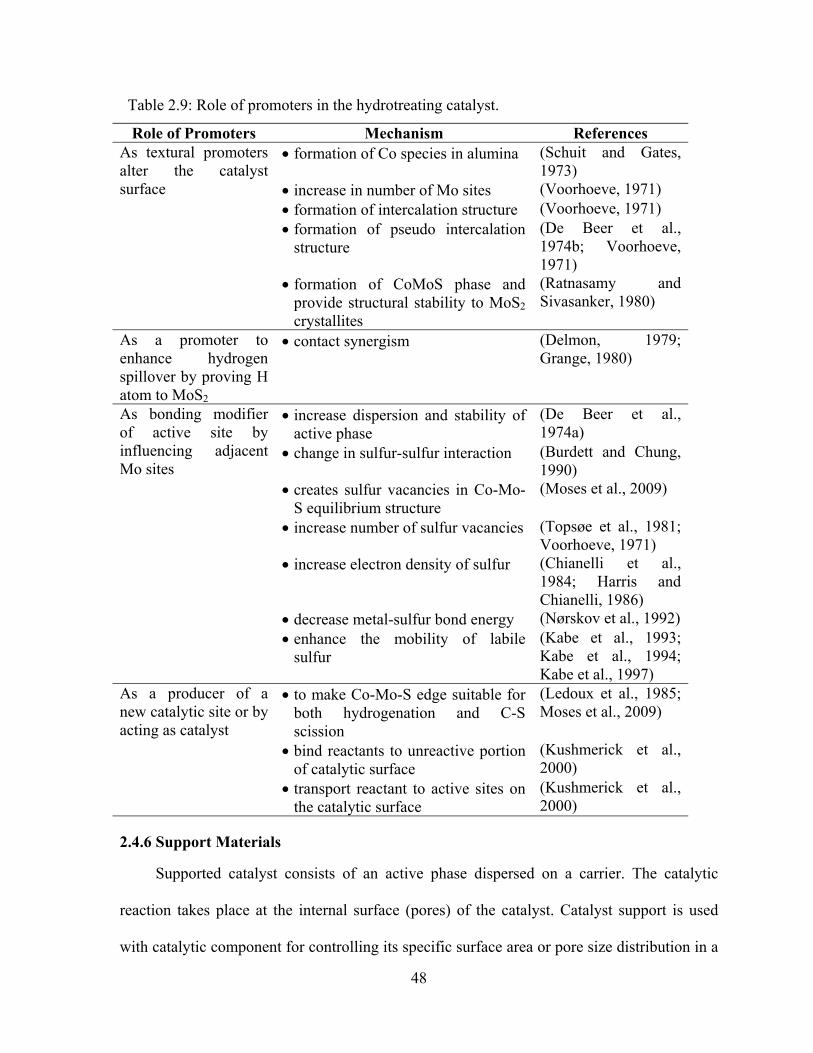
48
Table 2.9: Role of promoters in the hydrotreating catalyst.
Role of Promoters Mechanism References As textural promoters alter the catalyst surface
• formation of Co species in alumina (Schuit and Gates, 1973)
• increase in number of Mo sites (Voorhoeve, 1971) • formation of intercalation structure (Voorhoeve, 1971) • formation of pseudo intercalation
structure (De Beer et al., 1974b; Voorhoeve, 1971)
• formation of CoMoS phase and provide structural stability to MoS2 crystallites
(Ratnasamy and Sivasanker, 1980)
As a promoter to enhance hydrogen spillover by proving H atom to MoS2
• contact synergism (Delmon, 1979; Grange, 1980)
As bonding modifier of active site by influencing adjacent Mo sites
• increase dispersion and stability of active phase
(De Beer et al., 1974a)
• change in sulfur-sulfur interaction (Burdett and Chung, 1990)
• creates sulfur vacancies in Co-Mo-S equilibrium structure
(Moses et al., 2009)
• increase number of sulfur vacancies (Topsøe et al., 1981; Voorhoeve, 1971)
• increase electron density of sulfur (Chianelli et al., 1984; Harris and Chianelli, 1986)
• decrease metal-sulfur bond energy (Nørskov et al., 1992)• enhance the mobility of labile
sulfur (Kabe et al., 1993; Kabe et al., 1994; Kabe et al., 1997)
As a producer of a new catalytic site or by acting as catalyst
• to make Co-Mo-S edge suitable for both hydrogenation and C-S scission
(Ledoux et al., 1985; Moses et al., 2009)
• bind reactants to unreactive portion of catalytic surface
(Kushmerick et al., 2000)
• transport reactant to active sites on the catalytic surface
(Kushmerick et al., 2000)
2.4.6 Support Materials
Supported catalyst consists of an active phase dispersed on a carrier. The catalytic
reaction takes place at the internal surface (pores) of the catalyst. Catalyst support is used
with catalytic component for controlling its specific surface area or pore size distribution in a

49
solid catalyst (Furimsky, 2007; Grange and Vanhaeren, 1997). Catalyst support plays an
important role to improve the property of catalyst by manipulating its surface properties,
because the nature of the individual sites at the surface is responsible for the activity,
selectivity and stability of the catalyst (Grange and Vanhaeren, 1997). The hydrotreating
catalyst support affects the activity and selectivity of hydrotreating catalyst (Hagen, 2006).
Nature of support is of great importance to the design of hydrotreating catalyst. By means of
an adequate support design it is possible to increase the HDS and HDN functionality of
hydrotreating catalysts significantly. Role of hydrotreating catalyst supports are:
• Anchoring and stabilization of active component on catalyst support (Hagen, 2006)
• Improvement of dispersion of the active phases by formation of high dispersed particles
(Satterfield, 1991)
• Improvement of textural property (such as surface area, pore diameter) of catalyst
(Hagen, 2006)
• Modification of the reducibility of oxide precursor through change of the interaction
between the active phase and support (Grange and Vanhaeren, 1997)
• Increase the useable promoter (Co/Ni) content of the catalyst by decreasing the
concentration of spinel phase (Grange and Vanhaeren, 1997)
• Reduce the catalyst deactivation resulting from coking and pore mouth plugging
(Furimsky, 2007; Satterfield, 1991)
Conventional Hydrotreating Catalyst Support: Conventional commercial hydrotreating
catalysts are composed of a sulfide active phase, molybdenum sulfide (or tungsten sulfide)
promoted by cobalt or nickel and usually supported on alumina. γ-alumina is widely used as
support for hydrotreating catalyst because of following reasons (Satterfield, 1991):
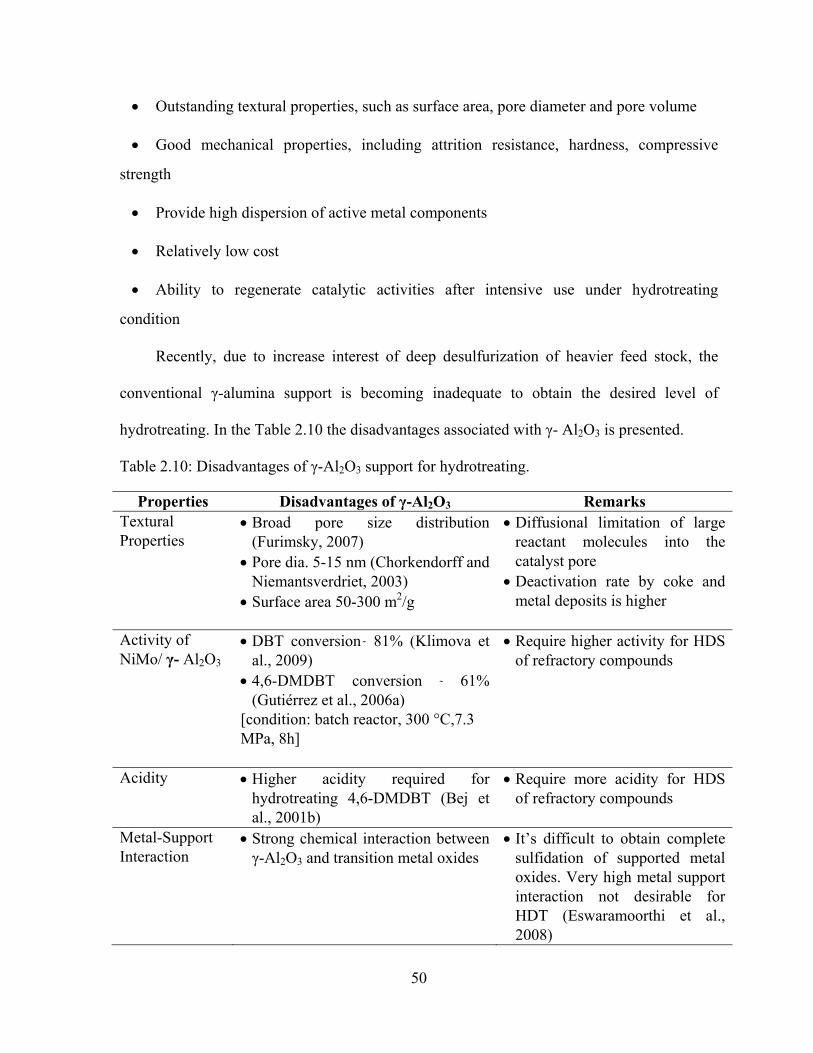
50
• Outstanding textural properties, such as surface area, pore diameter and pore volume
• Good mechanical properties, including attrition resistance, hardness, compressive
strength
• Provide high dispersion of active metal components
• Relatively low cost
• Ability to regenerate catalytic activities after intensive use under hydrotreating
condition
Recently, due to increase interest of deep desulfurization of heavier feed stock, the
conventional γ-alumina support is becoming inadequate to obtain the desired level of
hydrotreating. In the Table 2.10 the disadvantages associated with γ- Al2O3 is presented.
Table 2.10: Disadvantages of γ-Al2O3 support for hydrotreating.
Properties Disadvantages of γ-Al2O3 Remarks Textural Properties
• Broad pore size distribution (Furimsky, 2007)
• Pore dia. 5-15 nm (Chorkendorff and Niemantsverdriet, 2003)
• Surface area 50-300 m2/g
• Diffusional limitation of large reactant molecules into the catalyst pore
• Deactivation rate by coke and metal deposits is higher
Activity of NiMo/ γ- Al2O3
• DBT conversion 81% (Klimova et al., 2009)
• 4,6-DMDBT conversion ˜ 61% (Gutiérrez et al., 2006a)
[condition: batch reactor, 300 °C,7.3 MPa, 8h]
• Require higher activity for HDS of refractory compounds
Acidity • Higher acidity required for hydrotreating 4,6-DMDBT (Bej et al., 2001b)
• Require more acidity for HDS of refractory compounds
Metal-Support Interaction
• Strong chemical interaction between γ-Al2O3 and transition metal oxides
• It’s difficult to obtain complete sulfidation of supported metal oxides. Very high metal support interaction not desirable for HDT (Eswaramoorthi et al., 2008)

51
2.4.7 Progress on Improvement of Hydrotreating Catalyst Support
Extensive works have been carried out in the research realms regarding the
development of new supports for hydrotreating catalysts. Due to necessity to develop
advanced hydrotreating catalyst with enhanced properties several supports have been
explored. It is acknowledged that the activity of support can be improved by enhancing the
textural properties, metal-support interaction and acidic or basic properties. In this regards,
following progresses are made to improve the hydrotreating catalyst support:
A) Textural Properties of Support: Over the years significant efforts have been made to
improve the textural properties of hydrotreating catalyst support. It has been acknowledged
that the TiO2 and ZrO2 supported MoS2 catalyst exhibits three to five times higher
desulfurization and hydrogenation activities than Al2O3 supported MoS2 catalyst (Breysse et
al., 2003b). However, the very low surface areas of these materials limit their application as
catalyst support. Various methods have been explored in order to improve the specific
surface area. By improving preparation method, relatively higher specific surface area and
larger pore diameter for both ZrO2 and TiO2 supports can be obtained. For example, by
changing the preparation method, the specific surface area of ZrO2 was improved from 100
m2/g to 300 m2/g (Breysse et al., 2003b). Also, in order to improve specific surface area
combination of mixed oxides are studied as catalyst support.
B) Oxide Support: Oxide supports such as silica and silica-alumina have been studied as
hydrotreating catalyst support. Further, this study has been expanded to other oxides as well.
Unconventional oxides such as TiO2 and ZrO2 have been used as treatment of heavy oils and
hydrocracking of bituminous coal and these oxides are appear to be promising for the
hydrotreating process. Also, the combinations of two mixed oxides supports such as TiO2-

52
ZrO2, TiO2-Al2O3, SiO2-ZrO2 and SiO2-TiO2 have been tested as hydrotreating catalyst. The
combination of two oxides observed to be more effective as HDT catalyst supports (Breysse
et al., 2003b). For example, ZrO2 –TiO2 mixed oxide with specific surface area 254 m2/g was
studied as catalyst support and proved to be promising for the HDS reaction (Maity et al.,
2001).
C) Acidic and Basic Support: For the deep desulfurization of heavy feed, acidic supports
have received importance in several studies. In this context, acidic zeolite or silica-alumina,
alumina-zeolite supports have been studied as hydrotreating catalyst support. It is reported
that zeolite-supported catalysts are more active in HDS than alumina counterparts due to
better dispersion of molybdenum in the zeolitic material (Bataille et al., 2001).
Basic supports has attracted significant attention as catalyst support, since basicity
increases (high and stable) dispersion of Mo species on support and inhibits coking (Klicpera
and Zdražil, 2002). For example, for the hydrotreating of thiophene, Co (Ni) promoted basic
MgO supported catalyst has been proven as 1.5 – 2.3 times more active as γ-Al2O3 supported
catalyst. Zirconium oxide (zirconia) posses both acidic and basic properties and can be used
as effective support material for hydrotreating catalyst (Chuah et al., 1996).
D) Carbon: Carbon supported transition metal sulfide exhibits higher activity in HDS and
HDN compared to γ-Al2O3 supported counterpart (Pawelec et al 2001). Advantages of using
carbon as supports are: carbon facilitate sulfidation of metal oxides, provide large specific
surface area with control volume, reduce coking propensity and easy metal recovery
(Breysse et al., 2003b). CoMo catalyst supported on carbon is proven to be more active than
γ-Al2O3. Also, natural clay and pillared clays getting more attentions due to high specific
surface area, mechanical and thermal stability and acidic properties (Breysse et al., 2003b).

53
E) Ordered Mesoporous Material: Recently mesoporous materials, specifically various
mesoporous silicas, MCM-41, MCM-48, HMS, FSM-16, KIT-1, and SBA-15 have received
great attention in the field of catalysis due to their remarkable features. Ordered mesoporous
material was first developed by scientists of Mobil Corporation in 1992. MCM-41 consists of
highly ordered hexagonal array with unidimensional pores (Taguchi and Schüth, 2005). The
most important features of ordered mesoporous oxide are their exceptionally high surface
area. The narrow and uniform pore size of mesoporous materials with extremely high surface
area can be utilized as potential support for the development of novel solid catalysts. Due to
their high specific surface area and good thermal stability, ordered mesoporous oxides have
been used as supports for metals, and metal oxides for certain catalysts. In many reported
studies it is observed that mesoporous materials have a comparable and superior performance
compared to conventional microporous zeolites or amorphous silica–alumina catalysts
(Taguchi and Schüth, 2005).
2.4.8 Desired Properties of HDT Catalyst Support
A) Textural Property: Good textural properties, namely a high specific surface area, a well-
ordered porous structure, and narrow pore size distribution are considered to be the most
important criterion that any catalyst support should fulfill (Ancheyta and Speight, 2007;
Furimsky, 2007). The activity of the HDS and HDN depends on the pore diameter of the
catalyst for some of the reactions taking place inside catalyst pores during hydrotreating
(Ancheyta and Speight, 2007). Diffusion of bulky reactants, such as DBT (molecular size 0.8
nm) and 4, 6-DMDBT (molecular size 0.9 nm), into the catalyst pores significantly affects
the activity of the catalyst having smaller pore size (Jayne et al., 2005). Diffusion and
catalytic reaction of different sizes of sulfur molecules are shown in the Figure 2.22.
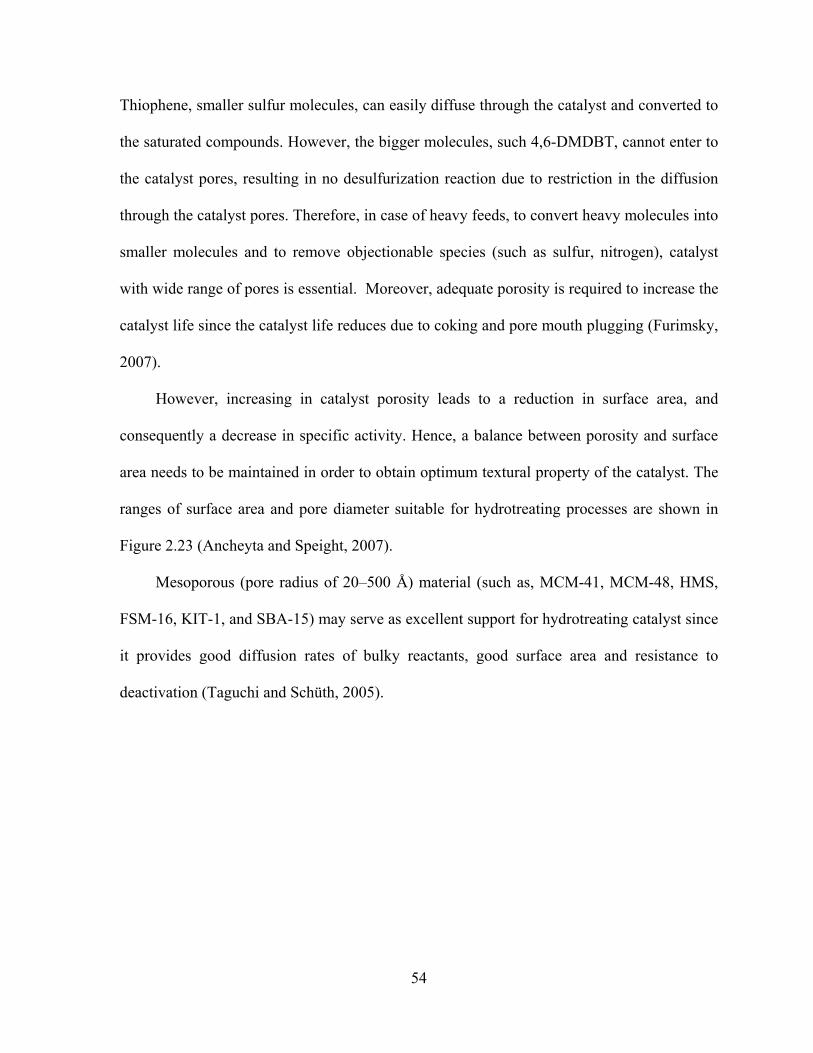
54
Thiophene, smaller sulfur molecules, can easily diffuse through the catalyst and converted to
the saturated compounds. However, the bigger molecules, such 4,6-DMDBT, cannot enter to
the catalyst pores, resulting in no desulfurization reaction due to restriction in the diffusion
through the catalyst pores. Therefore, in case of heavy feeds, to convert heavy molecules into
smaller molecules and to remove objectionable species (such as sulfur, nitrogen), catalyst
with wide range of pores is essential. Moreover, adequate porosity is required to increase the
catalyst life since the catalyst life reduces due to coking and pore mouth plugging (Furimsky,
2007).
However, increasing in catalyst porosity leads to a reduction in surface area, and
consequently a decrease in specific activity. Hence, a balance between porosity and surface
area needs to be maintained in order to obtain optimum textural property of the catalyst. The
ranges of surface area and pore diameter suitable for hydrotreating processes are shown in
Figure 2.23 (Ancheyta and Speight, 2007).
Mesoporous (pore radius of 20–500 Å) material (such as, MCM-41, MCM-48, HMS,
FSM-16, KIT-1, and SBA-15) may serve as excellent support for hydrotreating catalyst since
it provides good diffusion rates of bulky reactants, good surface area and resistance to
deactivation (Taguchi and Schüth, 2005).
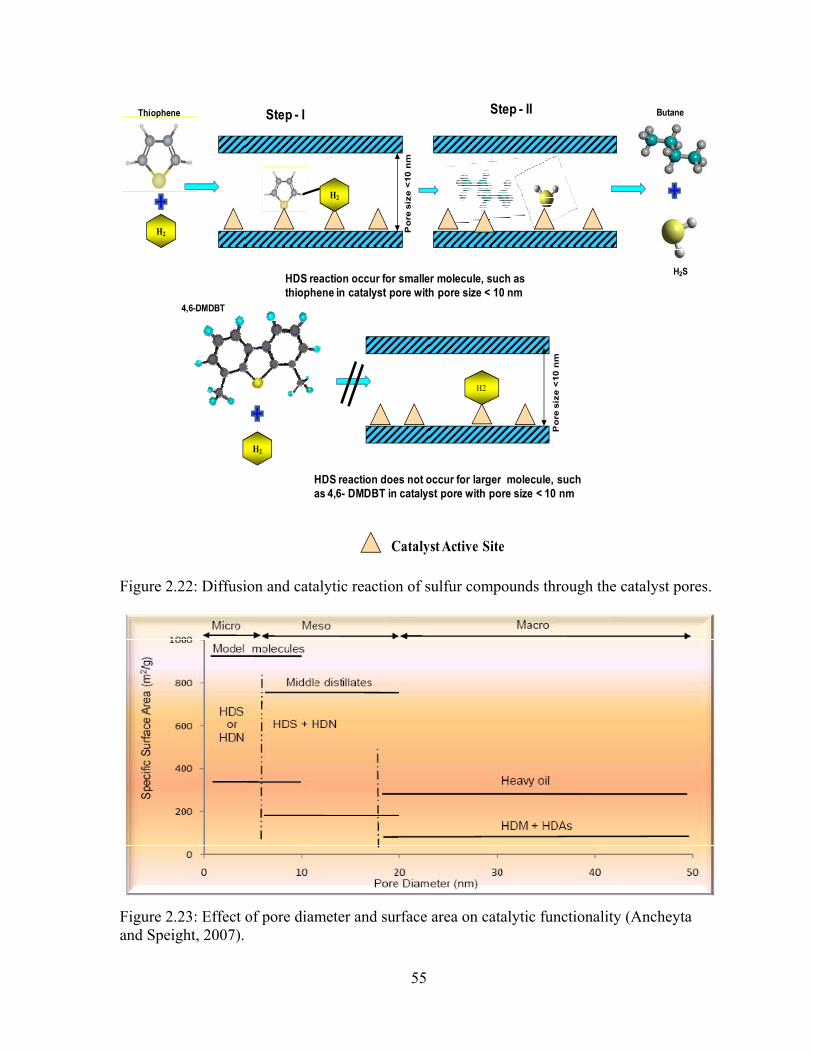
55
Figure 2.22: Diffusion and catalytic reaction of sulfur compounds through the catalyst pores.
Figure 2.23: Effect of pore diameter and surface area on catalytic functionality (Ancheyta and Speight, 2007).
H2
Po
re s
ize
<10
nm
H2
H2
Po
re s
ize
<10
nm
H2
Step - I Step - II
HDS reaction occur for smaller molecule, such as thiophene in catalyst pore with pore size < 10 nm
HDS reaction does not occur for larger molecule, such as 4,6- DMDBT in catalyst pore with pore size < 10 nm
Catalyst Active Site
Thiophene
4,6-DMDBT
Butane
H2S

56
B) Activity and Selectivity: Other important parameters for catalyst formulation are activity
and selectivity. High activity of the catalyst results in fast reaction rates and short reaction
time. High selectivity of catalyst facilitates maximum yield while eliminating undesirable
reactions (Chorkendorff and Niemantsverdriet, 2003). The new catalyst should possess a
high activity and high selectivity for middle distillate (Furimsky, 2007). Supports play an
important role in changing both activity and selectivity of the catalyst towards HDS and
HDN reactions (Klimova et al., 2009). SBA-15 supported catalyst shows superior catalytic
activity compared to γ-Al2O3 supported catalyst for the HDS of thiophene (Dhar et al., 2005).
Also, metal oxide (TiO2, ZrO2, Al2O3) supported catalysts have been explored as support for
hydrotreating catalyst. It is reported that for hydrodesulfurization reactions, ZrO2 supported
MoS2 catalysts are three times more active than alumina supported ones with an equivalent
Mo loading/nm2 (Breysse et al., 2003).
C) Acidity: In hydrotreating process, removal of refractory dialkyl dibenzothiophenes [4, 6-
dimethyl dibenzothiophene (4, 6-DMDBT)] is essential in order to reduce the sulfur content
from diesel fuel (Bej et al., 2004). Conversion of 4, 6-dimethyldibenzothiophene (4, 6-
DMDBT) into a more reactive compound, can be achieved either through isomerization,
dealkylation and C-C bond scission (Rayo et al., 2009). The increase in acidity in support
helps to enhance the isomerization, dealkylation and C-C bond scission of the alkyl groups
present in 4, 6-DMDBT (Bej et al., 2004). However, increases in acidity may lead to
undesirable cracking reactions. Hence, an appropriate tuning of the support acidity is
imperative for achieving desirable HDS activity of refractory compounds. Improvement in
the catalytic performance of the HDT catalyst can be achieved by using supports, which can
provide optimal level of surface acidity as well as excellent well-ordered porous structure. In
57
this context, heteroatom (such as Zr, Ti, Al) modified SBA-15 materials have been
investigated by several researchers (Klimova et al., 2009; Rayo et al., 2009).
D) Metal Support Interaction: Supported metal catalysts consist of small metal particles
dispersed on the surface of a support material (Furimsky, 2007). Apart from increasing
surface area, the role of the support is to control the course of a catalytic reaction by allowing
specific interaction of the support with the active phase. Due to recent emphasis on the
production of ultralow sulfur diesel (ULSD), special attention has been dedicated to the
development of improved catalysts and to the understanding of metal-support interactions to
produce catalysts with desired activity (Joshi et al., 2008). Catalytic properties depend on the
nature of the metal-support interactions (Hinnemann et al., 2005). It is acknowledged that
Co-Mo-S/Ni-Mo-S phase is responsible for the most important part of the catalytic activity
(Eijsbouts, 1997). Co-Mo-S/Ni–Mo–S structures may be classified as either Type I or II on
the basis of metal-support interaction (Hinnemann et al., 2005). In type I, presence of some
Mo-O-Ms linkages between the MoS2 and the support metal (Ms) is formed (Joshi et al.,
2008). Strong linkage between MoS2 and Ms is responsible for the low catalytic activity for
γ-Al2O3 supported hydrotreating catalyst (Hinnemann et al., 2005). On the other hand, Type
II structure is considered as highly active catalyst for the hydrotreating process due to
absence of such linkage (Topsøe, 2007).
Very weak metal-support interaction results in inhomogeneous dispersion of MoS2
phase, which adversely affect the catalytic activity. In SBA-15 supported catalyst, low and
inhomogeneous dispersion of the MoS2 phase is attributed to the very weak interactions
between silica and molybdenum sulfide (Hensen et al., 2001). An optimal level of metal-
support interaction is essential to obtain the desired catalytic activity. Since ZrO2 provide
58
relatively stronger metal–support interaction, hence, incorporation zirconia into SBA-15
framework improves the metal-support interaction final catalyst (Gutiérrez et al., 2008). The
rank order of the supports representing Type-I (strong interaction) tendency is SiO2 < Al2O3
< ZrO2 (Joshi et al., 2008).
2.4.9 Deactivation
Deactivation is a physical or chemical process, which decreases the activity of a
catalyst (Furimsky and Massoth, 1999). Catalyst deactivation, also refer to as ageing, is
basically the decrease in catalytic activity with time. Hydrotreating reaction takes place on
the active sites of the catalyst. Deactivation of hydrotreating catalyst occurs due to the loss of
active sites due to following reasons.
A) Catalyst Poisoning: Catalyst poisoning is defined as loss of catalytic activity by
impurities due to formation of strong adsorptive bond with the catalyst surface (Hagen,
2006). During hydrotreating process, catalyst poisoning occurs due to presence of strongly
adsorbed species, such as, nitrogen-compounds, coke molecules, metal deposits, which
occupy an active site (Mo vacancy or Co or Ni sites) of the catalyst (Furimsky and Massoth,
1999).
A poison can be reversible or irreversible depending on the nature of feed and reaction
conditions (Furimsky and Massoth, 1999). In reversible or temporary poisons, the catalyst
activity can be restored by removing the poison from the feed. In irreversible or permanent
poisoning, the bonding between the impurities and the active sites are so strong that the
poison cannot be desorbed. For the hydroprocessing, the nitrogen containing compounds are
the main source of catalyst poison due to their strong adsorption nature on the catalyst sites
(Furimsky and Massoth, 1999). Other poisons are H2S, Pb, Hg, S and P.
59
B) Deactivation by Deposits: Catalyst deactivation occurs by external impurities (metals
coming with feed) or reaction bi-products (coke), which block the pore mouth or filling up
the pore volume of the catalyst (Furimsky and Massoth, 1999; Moulijn et al., 2001). Catalyst
activity loss by coke and metal deposition depends upon the feed properties, catalyst
properties and hydrotreating process condition (Furimsky and Massoth, 1999). Deactivation
by coke and metals are simultaneous. Coke deposition is rapid at the initial stage of
hydrotreating until it reaches to the steady-state. On the other hand metal deposition follows
the linear deposition patter with time.
In hydroprocessing, polymeric compounds, especially coke, are formed from the side
reactions. Aromatic and olefinic hydrocarbons, sourced from the feed stream or formed as
intermediate product in the hydrotreating process, are the precursor for the coking process
(Hagen, 2001). Coking process takes places at high temperature by dehydrogenating
polymers to carbon. During hydrotreating, the metals present in the feed stream causes the
catalyst deactivation. Heavy oils derived from the tar sand contains vanadium, nickel, titania,
iron and small amount some other metal, which deposits on the catalyst pores and reduces the
catalyst activity. Deactivation by metal is an irreversible process. In the Figure 2.24, the
typical catalytic activity loss of hydrotreating catalyst over the time-on-stream is shown.
Catalyst deactivation profile is divided into three phase. In phase I, rapid decline of catalyst
activity, occurs due to linear increase in metal deposits and saturation of coke deposits. In
phase II, slow deactivation of catalyst, observed due to continuous deposition of metal. Phase
III, accelerated and complete deactivation of the catalyst, due to pore plugging.
60
C) Sintering: Sintering (thermal degradation) of catalyst occurs due to 1) loss of catalytic
surface area due to crystallite growth in catalytic phase 2) loss of support area due to collapse
of support materials 3) transformation of catalytic phases to non-catalytic phases 4) catalyst
damage due to thermal shock (Furimsky and Massoth, 1999; Moulijn et al., 2001) . Sintering
takes place at very high temperature. Main parameters affecting the rates of sintering are
temperature, atmosphere, metal type, metal dispersion, promoters, impurities, support surface
area, texture, and porosity etc.
D) Mechanical Deformation: Mechanical breaking or failure of catalyst is occur due to high
pressure in several different forms 1) crushing of granular or pellet due to load 2) attrition,
the size reduction and break up of catalyst granules or pellet to produce fines 3) erosion of
catalyst particles at high fluid velocity (Furimsky and Massoth, 1999; Moulijn et al., 2001).
Commercial catalysts are vulnerable to mechanical failure because of their forms, cylindrical,
spherical, and extrudated etc.
E) Evaporation (leaching): Metal loss occurs due to direct vaporization of components at
very high temperature (Moulijn et al., 2001). This may result in catalyst activity loss and
contamination of product. Evaporation at high temperature may affect the supported metals
by 1) reaction of the metals with promoters or carriers (for example, solid state reaction of
NiO with Al2O3 at high temp to form stable but inactive NiAlO4) 2) segregation of metals or
carrier phase and 3) metals and carrier phase transition (γ-Al2O3 to α -Al2O3).
In Figure 2.25, the major catalyst deactivation for hydrotreating catalyst due to above
mentioned reasons are shown.
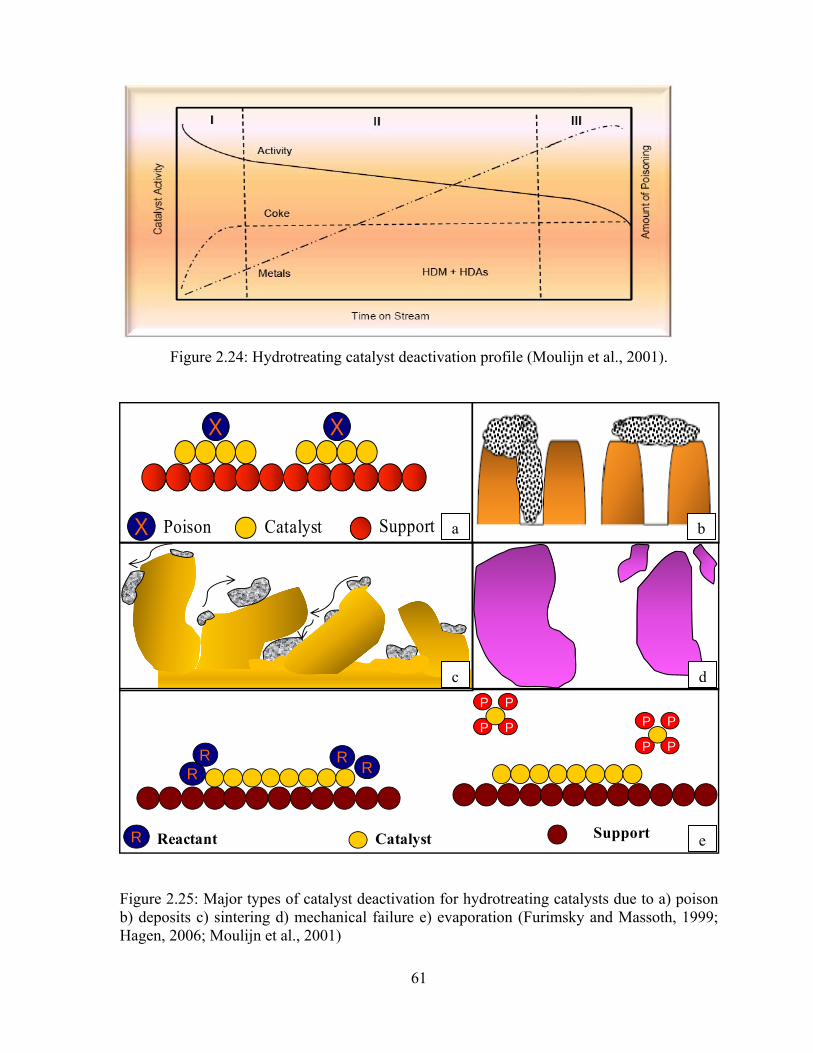
61
X
Poison SupportCatalyst
X
X
R
Reactant SupportCatalyst
R
R
R R
P
P
P
P
P
P
P
P
Figure 2.24: Hydrotreating catalyst deactivation profile (Moulijn et al., 2001).
Figure 2.25: Major types of catalyst deactivation for hydrotreating catalysts due to a) poison b) deposits c) sintering d) mechanical failure e) evaporation (Furimsky and Massoth, 1999; Hagen, 2006; Moulijn et al., 2001)
a b
c d
e

62
2.4.10 Objectives of Catalyst Characterization
Industrial hydrotreating catalysts are extremely complex materials containing a mixture
of multiphase compounds, including active compounds, promoters and additives. An
understanding of this complex system is essential for selection of catalysts and for design and
development of newer catalyst systems. Catalyst characterization provides valuable
guidelines for monitoring the quality of catalyst. Objectives for catalyst characterization are
(Satterfield, 1991; Topsøe et al., 1996):
i) Understanding relationship among physical, chemical, and catalytic properties related
to the catalyst structure and function. Physical properties involve geometric structure, and
morphology from macro scale to micro scale. Chemical properties is referred to elemental
composition, structure and properties of individual crystallographic phases present in the
catalyst, as well as surface compositions and the nature of properties of functional group
present on catalyst surface. Catalytic properties are referred to its activity, i.e. ability to carry
out a chemical reaction under specified conditions.
ii) Investigating causes of catalyst deactivation, designing procedures for regeneration
and choosing catalyst properties to minimize deactivation.
iii) Determining physical and chemical properties [composition, pore size, surface area,
particles size, strength] for purpose of catalyst marketing, reactor design, modeling, and
process optimization.
iv) Ensuring quality control in catalyst manufacturing, i.e. monitoring changes of
physical and chemical properties of the catalyst during preparation, activation and reaction
stage.
Typical method for catalyst characterization is presented in Table 2.11.

63
Table 2.11: Typical methods for catalyst characterization (Satterfield, 1991; Topsøe et al., 1996).
Properties Characterization Methods
• Composition and chemical elements Elemental analysis (ICP-MS),SEM, TEM, X-ray fluorescence, atomic absorption
• Texture of catalyst and support(porosity, specific surface area, pore size distribution), state of dispersion, active agent
BET, Porosimetry, Chemisorption, XRD, SEM,TEM,
• Nature and structure of catalytic chemical species
XRD, NMR,FTIR, Raman, UV-DRS, TGA
• Mechanical Properties Crushing test in hydraulic press, ultrasonic test
2.5 Selection of Zr-SBA-15 Support for Hydrotreating of Gas Oil
2.5.1 SBA-15 Support
Highly ordered and large pore size mesoporous siliceous materials have attracted
significant attention for reactions involving large molecules (Corma, 1997; Zhao et al.,
1998a; Zhao et al., 1998b). Among various ordered mesoporous silica (OMS), SBA-15,
which is a polymer-templated silica with hexagonally ordered mesopores, became very
popular in the application of catalysis, due to their excellent textural properties, high
hydrothermal stability and thick pore walls (Fulvio et al., 2005; Zhao et al., 1998a; Zhao et
al., 1998b).
Although, SBA-15 possesses excellent textural properties and exhibit superior activity
compare to γ-Al2O3, but it has some limitation including the followings: i) pure SBA-15
materials lack acidic sites, which is essential for the hydrodesulfurization of refractory
compounds (Rayo et al., 2009), ii) interaction between silica and Mo is very weak (Gutiérrez

64
et al., 2006a), and iii) it provides inhomogeneous and poor dispersion of sulfided active
phase (Hensen et al., 2001).
2.5.2 ZrO2 Incorporation into SBA-15 Framework
To introduce strong surface acidity and improve catalytic activity, various heteroatoms,
such as Al, Zr, Ti, have been incorporated into SBA-15 (Rayo et al., 2009). Heteroatoms
modified SBA-15 catalyst has been stated as more active for HDS than those supported on
pure silica SBA-15 (Klimova et al., 2009). Among various heteroatoms and their oxides, Zr
and zirconia (ZrO2) has attracted much interest in view of their potential applications in
heterogeneous catalysis. Already, zirconia has been used as support for hydrotreating
catalysts by many research workers and showed promising results in hydrotreating reactions
(Maity et al., 2000). Zirconium oxide has drawn great attention as catalyst and catalyst
support due to their following characteristics (Gutiérrez et al., 2008; Ji et al., 2004; Maity et
al., 2000):
• ZrO2 has higher intrinsic HDS activity compared to γ –alumina
• ZrO2 exhibits higher intrinsic HDS activity compared to other metal oxides (TiO2,
MgO)
• ZrO2 has a high melting point of about 2700°C and is stable even under reducing
conditions.
• ZrO2 has higher thermal stability, extreme hardness, high specific mass of zirconia are
the advantages for its use as catalyst support
• ZrO2 improves reduction and sulfidation of MoO+6
• ZrO2 supported Ni promoted Mo catalyst shows higher activity in both HYD and HDS
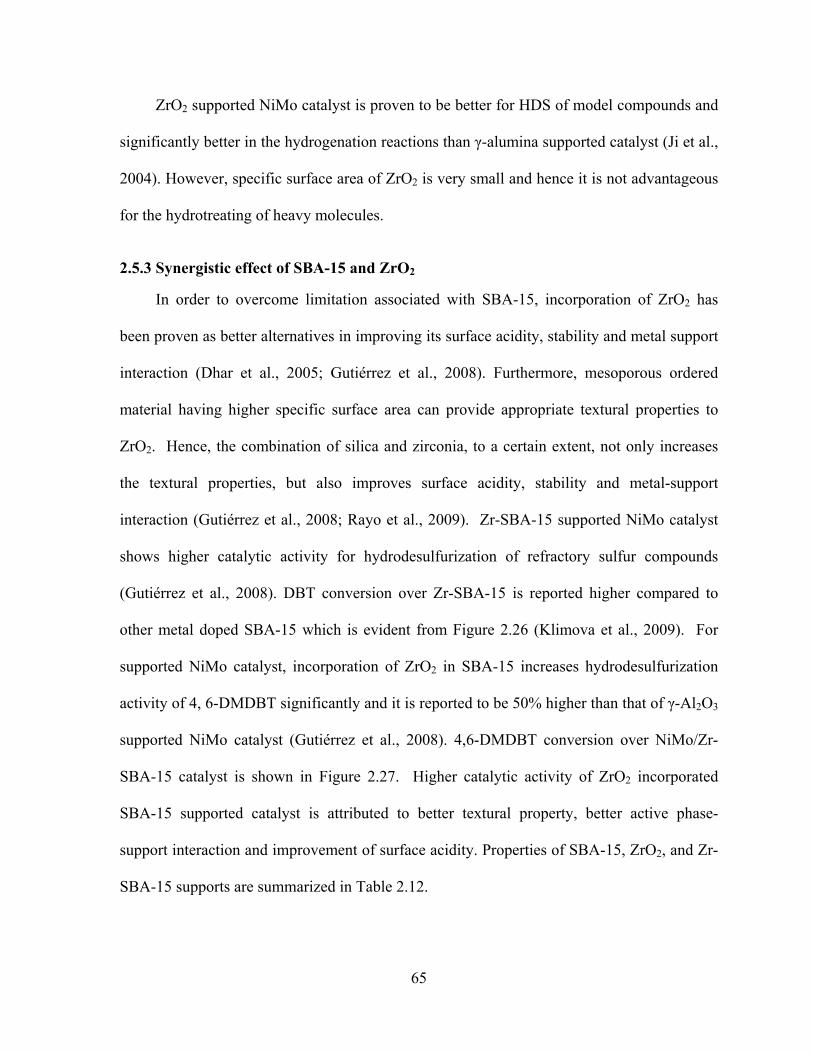
65
ZrO2 supported NiMo catalyst is proven to be better for HDS of model compounds and
significantly better in the hydrogenation reactions than γ-alumina supported catalyst (Ji et al.,
2004). However, specific surface area of ZrO2 is very small and hence it is not advantageous
for the hydrotreating of heavy molecules.
2.5.3 Synergistic effect of SBA-15 and ZrO2
In order to overcome limitation associated with SBA-15, incorporation of ZrO2 has
been proven as better alternatives in improving its surface acidity, stability and metal support
interaction (Dhar et al., 2005; Gutiérrez et al., 2008). Furthermore, mesoporous ordered
material having higher specific surface area can provide appropriate textural properties to
ZrO2. Hence, the combination of silica and zirconia, to a certain extent, not only increases
the textural properties, but also improves surface acidity, stability and metal-support
interaction (Gutiérrez et al., 2008; Rayo et al., 2009). Zr-SBA-15 supported NiMo catalyst
shows higher catalytic activity for hydrodesulfurization of refractory sulfur compounds
(Gutiérrez et al., 2008). DBT conversion over Zr-SBA-15 is reported higher compared to
other metal doped SBA-15 which is evident from Figure 2.26 (Klimova et al., 2009). For
supported NiMo catalyst, incorporation of ZrO2 in SBA-15 increases hydrodesulfurization
activity of 4, 6-DMDBT significantly and it is reported to be 50% higher than that of γ-Al2O3
supported NiMo catalyst (Gutiérrez et al., 2008). 4,6-DMDBT conversion over NiMo/Zr-
SBA-15 catalyst is shown in Figure 2.27. Higher catalytic activity of ZrO2 incorporated
SBA-15 supported catalyst is attributed to better textural property, better active phase-
support interaction and improvement of surface acidity. Properties of SBA-15, ZrO2, and Zr-
SBA-15 supports are summarized in Table 2.12.
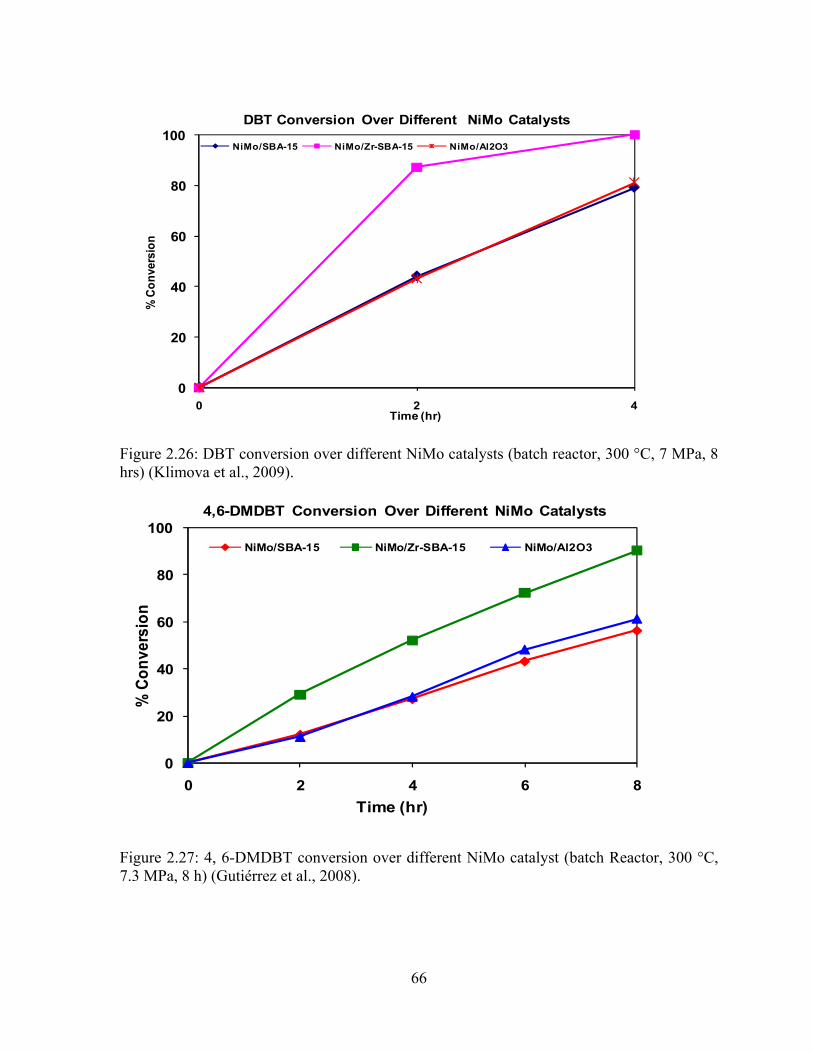
66
0
20
40
60
80
100
0 2 4
% C
onve
rsio
n
Time (hr)
DBT Conversion Over Different NiMo Catalysts
NiMo/SBA-15 NiMo/Zr-SBA-15 NiMo/Al2O3
0
20
40
60
80
100
0 2 4 6 8
% C
onve
rsio
n
Time (hr)
4,6-DMDBT Conversion Over Different NiMo Catalysts
NiMo/SBA-15 NiMo/Zr-SBA-15 NiMo/Al2O3
Figure 2.26: DBT conversion over different NiMo catalysts (batch reactor, 300 °C, 7 MPa, 8 hrs) (Klimova et al., 2009).
Figure 2.27: 4, 6-DMDBT conversion over different NiMo catalyst (batch Reactor, 300 °C, 7.3 MPa, 8 h) (Gutiérrez et al., 2008).
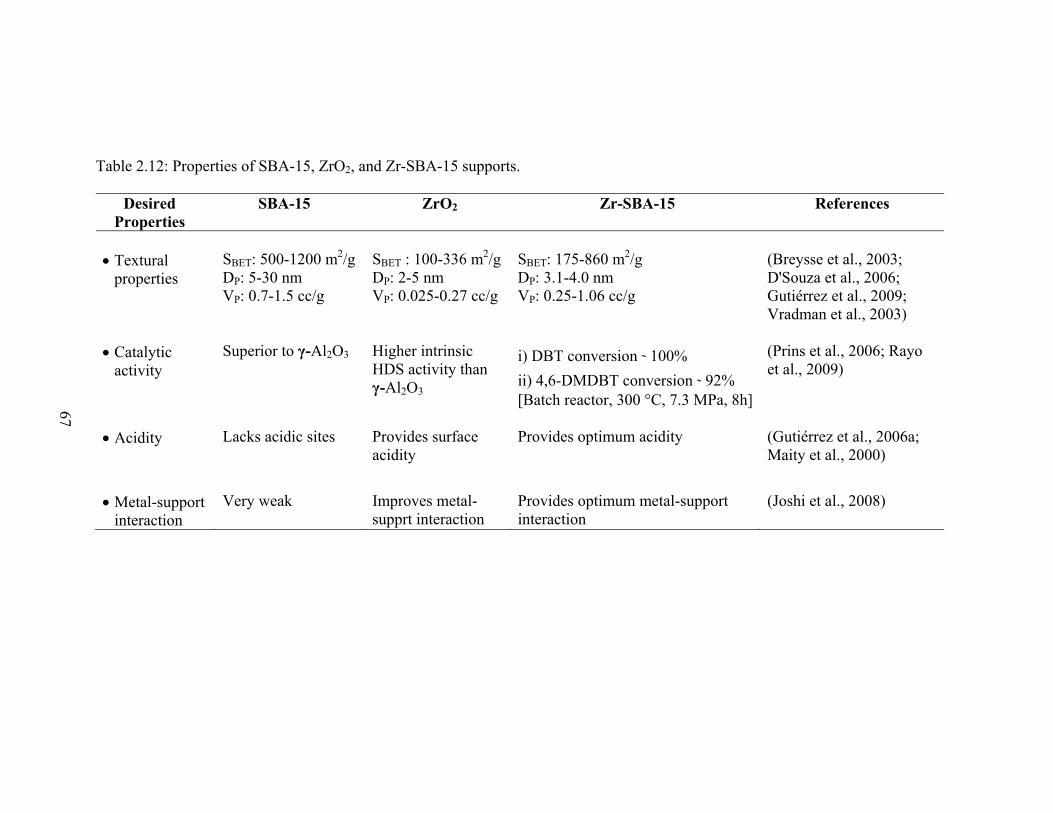
67
Table 2.12: Properties of SBA-15, ZrO2, and Zr-SBA-15 supports.
Desired Properties
SBA-15 ZrO2 Zr-SBA-15 References
• Textural
properties SBET: 500-1200 m2/g DP: 5-30 nm VP: 0.7-1.5 cc/g
SBET : 100-336 m2/g DP: 2-5 nm VP: 0.025-0.27 cc/g
SBET: 175-860 m2/g DP: 3.1-4.0 nm VP: 0.25-1.06 cc/g
(Breysse et al., 2003; D'Souza et al., 2006; Gutiérrez et al., 2009; Vradman et al., 2003)
• Catalytic
activity Superior to γ-Al2O3 Higher intrinsic
HDS activity than γ-Al2O3
i) DBT conversion ˜ 100% ii) 4,6-DMDBT conversion ˜ 92% [Batch reactor, 300 °C, 7.3 MPa, 8h]
(Prins et al., 2006; Rayo et al., 2009)
• Acidity Lacks acidic sites Provides surface
acidity Provides optimum acidity (Gutiérrez et al., 2006a;
Maity et al., 2000)
• Metal-support interaction
Very weak Improves metal-supprt interaction
Provides optimum metal-support interaction
(Joshi et al., 2008)
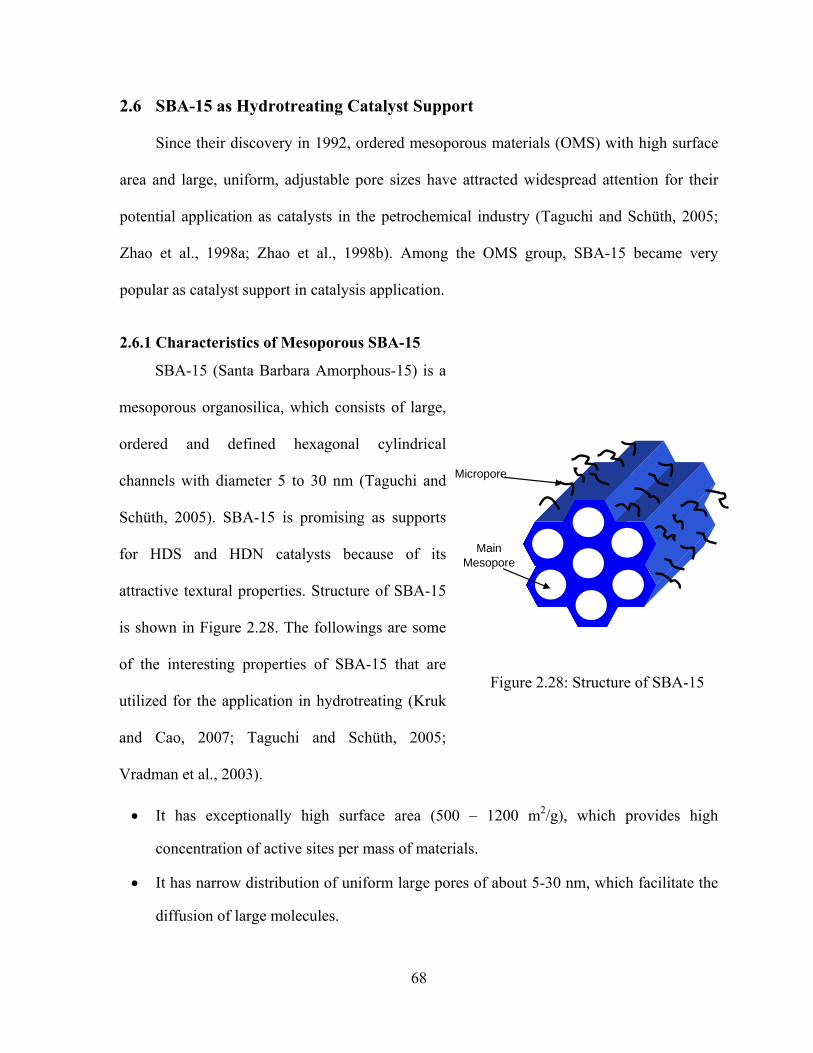
68
SBA-15 (Santa Barbara Amorphous-15) is a
mesoporous organosilica, which consists of large,
ordered and defined hexagonal cylindrical
channels with diameter 5 to 30 nm (Taguchi and
Schüth, 2005). SBA-15 is promising as supports
for HDS and HDN catalysts because of its
attractive textural properties. Structure of SBA-15
is shown in Figure 2.28. The followings are some
of the interesting properties of SBA-15 that are
utilized for the application in hydrotreating (Kruk
and Cao, 2007; Taguchi and Schüth, 2005;
Vradman et al., 2003).
Figure 2.28: Structure of SBA-15
Main Mesopore
Micropore
2.6 SBA-15 as Hydrotreating Catalyst Support
Since their discovery in 1992, ordered mesoporous materials (OMS) with high surface
area and large, uniform, adjustable pore sizes have attracted widespread attention for their
potential application as catalysts in the petrochemical industry (Taguchi and Schüth, 2005;
Zhao et al., 1998a; Zhao et al., 1998b). Among the OMS group, SBA-15 became very
popular as catalyst support in catalysis application.
2.6.1 Characteristics of Mesoporous SBA-15
• It has exceptionally high surface area (500 – 1200 m2/g), which provides high
concentration of active sites per mass of materials.
• It has narrow distribution of uniform large pores of about 5-30 nm, which facilitate the
diffusion of large molecules.
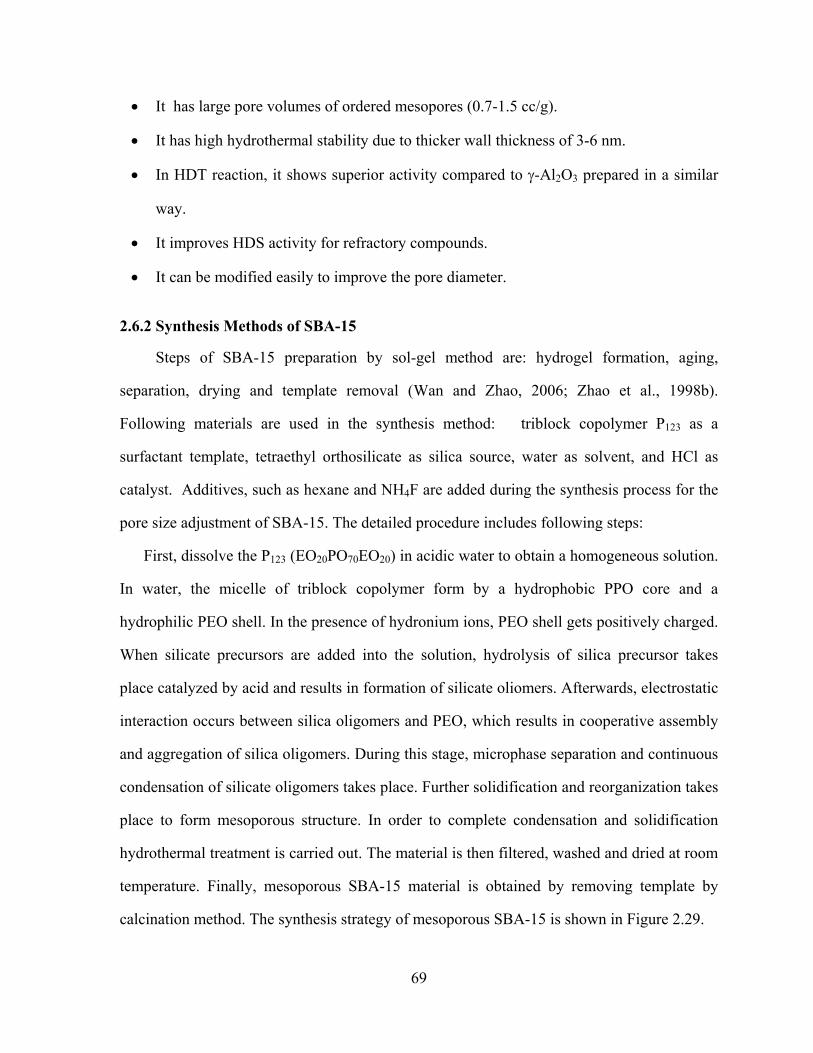
69
• It has large pore volumes of ordered mesopores (0.7-1.5 cc/g).
• It has high hydrothermal stability due to thicker wall thickness of 3-6 nm.
• In HDT reaction, it shows superior activity compared to γ-Al2O3 prepared in a similar
way.
• It improves HDS activity for refractory compounds.
• It can be modified easily to improve the pore diameter.
2.6.2 Synthesis Methods of SBA-15
Steps of SBA-15 preparation by sol-gel method are: hydrogel formation, aging,
separation, drying and template removal (Wan and Zhao, 2006; Zhao et al., 1998b).
Following materials are used in the synthesis method: triblock copolymer P123 as a
surfactant template, tetraethyl orthosilicate as silica source, water as solvent, and HCl as
catalyst. Additives, such as hexane and NH4F are added during the synthesis process for the
pore size adjustment of SBA-15. The detailed procedure includes following steps:
First, dissolve the P123 (EO20PO70EO20) in acidic water to obtain a homogeneous solution.
In water, the micelle of triblock copolymer form by a hydrophobic PPO core and a
hydrophilic PEO shell. In the presence of hydronium ions, PEO shell gets positively charged.
When silicate precursors are added into the solution, hydrolysis of silica precursor takes
place catalyzed by acid and results in formation of silicate oliomers. Afterwards, electrostatic
interaction occurs between silica oligomers and PEO, which results in cooperative assembly
and aggregation of silica oligomers. During this stage, microphase separation and continuous
condensation of silicate oligomers takes place. Further solidification and reorganization takes
place to form mesoporous structure. In order to complete condensation and solidification
hydrothermal treatment is carried out. The material is then filtered, washed and dried at room
temperature. Finally, mesoporous SBA-15 material is obtained by removing template by
calcination method. The synthesis strategy of mesoporous SBA-15 is shown in Figure 2.29.
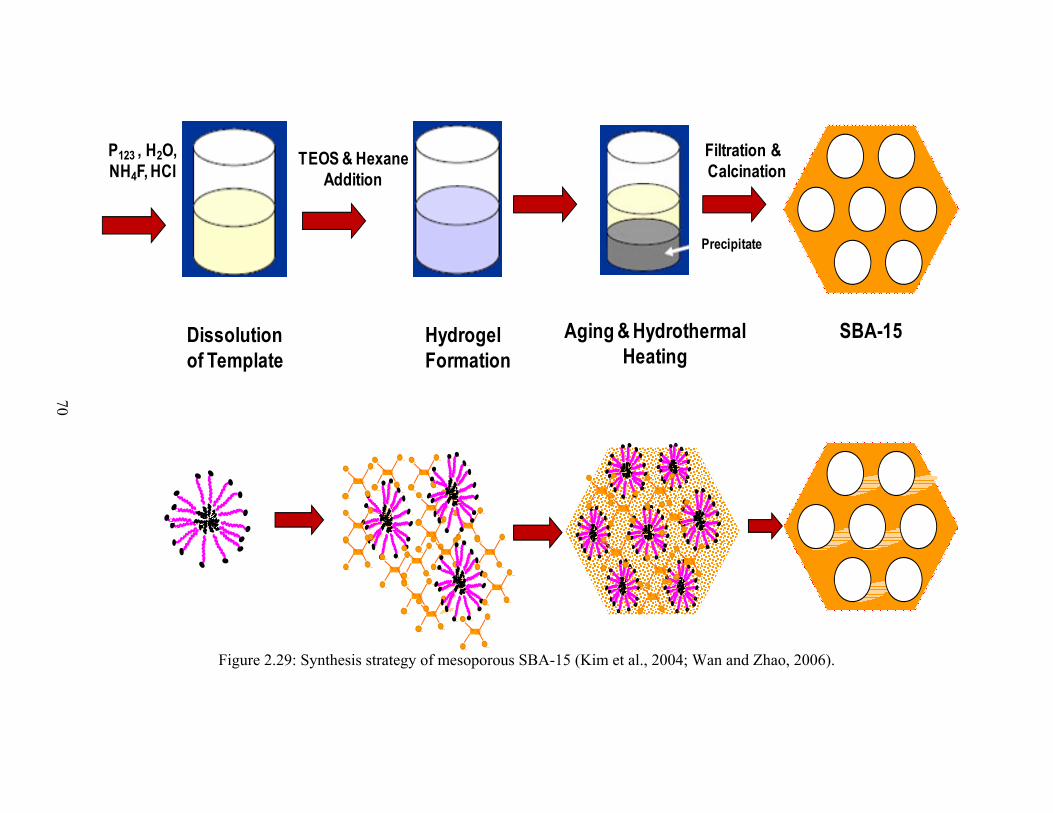
70
Figure 2.29: Synthesis strategy of mesoporous SBA-15 (Kim et al., 2004; Wan and Zhao, 2006).
P123 , H2O, NH4F, HCl
TEOS & Hexane Addition
Filtration &Calcination
Dissolution of Template
Hydrogel Formation
Aging & Hydrothermal Heating
SBA-15
Precipitate
71
2.6.3 Pore Diameter Control of SBA-15
Since the discovery of mesoporous siliceous materials, significant efforts have been
made by several researchers to develop ordered mesoporous silica with two-dimensional (2-
D) hexagonal structure (p6mm symmetry) that consists of cylindrical pores of 2 to 12 nm or
larger (Kruk and Cao, 2007). In the catalysis realm, growing interest to develop large pore
size mesoporous material is observed for the catalytic conversion of bulky molecules present
in the feedstock. In this regards, several studies have been conducted on pore size control of
mesoporous material, which can be effectively used for the industrial catalytic application.
The control over pore size of mesoporous materials can be obtained by adjusting volumes of
the hydrophobic group in the surfactants (Wan and Zhao, 2006). From various research on
synthesis of mesoporous silica molecular sieve material, it has been observed that the
mesoporous diameter of mesoporous materials can be adjusted by using followings (Jana et
al., 2004): surfactants with different chain length (Corma, 1997; Namba et al., 1998), triblock
polymer templates (Zhao et al., 1998b), organic swelling agent 1,3,5-trimethylbenzene
(TMB) (Corma, 1997; Lettow et al., 2000), organic swelling agent triisopropylbenzene
(TIPB) (Li et al., 2000), alkanes (Blin and Su, 2002; Nagarajan, 1999), amines (Sayari,
1996), and hydrothermal post-synthesis treatment. Among various strategies of pore diameter
control of SBA-15, followings are widely reported in the literature:
A) Addition of Swelling Agent: The addition of a swelling agent (micelle expander) is
reported to be effective for the pore size control of 2-D hexagonal mesoporous SBA-15
(Zhao et al., 1998a; Zhao et al., 1998b). The advantage of using swelling agent is that by
increasing the amount of swelling agent, the pore size of the SBA-15 can be increased
proportionally. Different swelling agents are:

72
i) 1,3,5–Trimethylbenzene (TMB/mesitylene): By adding 1,3,5-trimethylbenzene
(TMB or mesitylene ) as organic swelling agent, the pore size of hexagonal mesoporous
SBA-15 has been expanded from 50 nm to 300 Å successfully (Zhao et al., 1998a; Zhao
et al., 1998b). However, a subsequent study confirms that the large amount of TMB
(mesitylene) addition results in phase transition from highly ordered cylindrical 2D
hexagonal SBA-15 (7-12 nm) structure to mesoporous cellular forms (MCF) (Schmidt-
Winkel et al., 2000). Using TMB as swelling agent, the largest obtainable pore diameter
with highly ordered 2D hexagonal structure SBA-15 was 12 nm (Lettow et al., 2000).
Also, using of organic swelling agent is not desirable since their use involve addition of
large volume of organic swelling agent, which needs additional separation process
(Corma, 1997).
ii) 1,3,5-Tri isopropylbenzene (TIPB): Using 1,3,5-Tri isopropylbenzene (TIPB) as
organic swelling agent, the pore size of hexagonal 2D ordered mesoporous SBA-15 can
be expanded upto 140 Å successfully (Cao et al., 2009; Li et al., 2000).
iii) Alcohol additives: Large pore SBA-15 can be synthesized using alcohol additives
(butanol, pentanol, hexanol), some instances combine with octane utilizing pluronic F127
block polymers (EO106PO70EO106) (Feng et al., 2000). However, high mass fraction
hydrophilic PEO blocks lead to formation of spherical templates rather than cylindrical
ones (Kruk and Cao, 2007; Zhao et al., 1998b).
iv) Alkanes additives: Alkanes (pentane, hexane, heptanes, octane) acts as powerful
micelle expanders for the synthesis of mesoporous materials, which has been reported by
Blin and Kruk (Blin et al., 2000; Blin and Su, 2002; Kruk and Cao, 2007). In their
studies, alkane swelling agent showed low degree of structural ordering and limited
73
swelling capability for the preparation of 2D hexagonal structure (Jana et al., 2004).
However, subsequent studies reported that adding linear alkanes with small amount of
NH4F and maintaining the suitable initial synthesis temperature, large pore highly
ordered 2D hexagonal structure could be achievable (Kruk and Cao, 2007).
Details of pore size control of mesoporous SBA-15 is shown in Table 2.13.
B) Hydrothermal Treatment Temperature: The pore size of ordered hexagonal SBA-
15 structure can be controlled by varying the reaction temperature from 35 – 140 °C
(Zhao et al., 1998a).
C) Hydrothermal Treatment Time: The adjustment of pore size of ordered mesoporous
hexagonal SBA-15 material can be achieved by changing the duration of the
hydrothermal treatment time from 11 – 72 hours (Zhao et al., 1998a; Zhao et al., 1998b).

74
Table 2.13: Pore size control of mesoporous SBA-15 structure.
References Swelling Agent
Block Polymer
Pore Size Obtained (nm)
Structure Obtained Remarks
(Lettow et al., 2000)
TMB P123 (EO20PO70EO20)
6-12 2D hexagonal cylindrical pores
Mesocellular form formation upon increase of TMB
(Zhao et al., 1998a)
TMB P123 (EO20PO70EO20)
5-30 Until 12 nm 2D hexagonal cylindrical pores
Large amount of TMB causes change of structure from 2D hexagonal to mesocellular form [Schimdt and winkel, 1999]
(Zhao et al., 1998b)
TMB P123 (EO20PO70EO20)
4.6-8.9 2D hexagonal cylindrical pores
Addition of large amount of TMB causes change of structure of SBA-15
(Cao et al., 2009)
TIPB P123 (EO20PO70EO20)
10-26 2D hexagonal cylindrical pores
Loss of hexagonal 2D structure beyond pore diameter 26 nm
(Feng et al., 2000)
Alcohol F127 (EO106PO70EO106)
up to 19 2D hexagonal pores Spherical structure obtained
(Lin et al., 2006)
Alcohol (MAxEOyMAx) 9 2D hexagonal cylindrical pores
Large-pore 2-D hexagonally ordered structure was obtained using new triblock copolymers as templates.
(Jana et al., 2004)
Alkane P123 (EO20PO70EO20)
0.9 2D hexagonal cylindrical pores
Disordered meso-cellular foam formation for the larger pore diameter
(Sun et al., 2005)
Alkane & NH4F
P123 (EO20PO70EO20)
15 2D hexagonal cylindrical pores
SBA-15 with good mesoporous structure is obtained
(Kruk and Cao, 2007)
Alkane & NH4F
P123 (EO20PO70EO20)
12-18 2D hexagonal cylindrical pores
SBA-15 with good mesoporous structure is obtained
Where, (MAxEOyMAx) = Poly (methyl acrylate)-poly (ethylene oxide)-poly (methyl acrylate) [x = 33-70]

75
2.6.4 Application of SBA-15 Support in Hydrotreating
SBA-15 mesoporous materials as catalyst support have been tested for the
hydrotreating with various model compounds and real feedstocks. The application of
SBA-15 support in the hydrotreating reaction is presented in Table 2.14.
Table 2.14: Application of SBA-15 support in hydrotreating.
References Catalysts Feed Remarks
(Dhar et al., 2005)
Mo/SBA-15, CoMo/SBA-15, NiMo/SBA-15
Thiophene and cyclohexane
SBA-15 supported catalysts showed superior catalytic activity compared to the γ-Al2O3 supported catalyst
(Vradman et al., 2003)
NiW/SBA-15 Dibenzothiophene and toluene
SBA-15 supported NiW catalysts showed higher HDS activity compared to the commercial CoMo catalyst
(Sampieri et al., 2005)
Mo/SBA-15 Dibenzothiophene SBA-15 supported catalysts showed higher catalytic activity compared to the γ-Al2O3 supported catalyst
(Rayo et al., 2008)
NiMo/SBA-15 Thiophene NiMo/SBA-15 catalyst prepared under acidic condition showed higher catalytic activity
(Huang et al., 2008b)
Mo/SBA-15 and CoMo/SBA-15
Dibenzothiophene CoMo/SBA-15 catalyst showed higher HDS activity compared to γ-Al2O3 catalyst
(Soni et al., 2010)
NiMo/SBA-15 Coker Light Gas Oil
NiMo/SBA-15 catalyst showed higher HDS and HDN activity compared to NiMo/ γ-Al2O3 catalyst

76
2.7 Zr-SBA-15 as Hydrotreating Catalyst Support
2.7.1 Characteristics of Zr-SBA-15
Zirconium Oxide (ZrO2) and zirconium containing compounds have got significant
attention as an effective catalyst and an efficient catalytic support for many catalytic
reactions (Chuah et al., 1996; Gutiérrez et al., 2009). In particular, growing interest
towards the zirconium based materials in catalysis is observed for many years due to
following: i) it possess high mechanical, chemical, and thermal stability and ii) it possess
both acidic, basic and redox properties, which are advantageous for the hydrotreating
process as well (Gutiérrez et al., 2009; Maity et al., 2000):
However, pure zirconia has very unpromising (low) textural properties (specific
surface area (100 m2/g) and porosity 2-3 nm), which limit its possibility in hydrotreating
application, where good dispersion of active components over supports, good diffusion of
bulky molecules inside catalyst pores and resistance towards deactivation are essential
(Gutiérrez et al., 2009). In order to overcome these limitations associated with ZrO2 and
improve its catalytic activity, combination of ZrO2 with SBA-15 (materials with good
textural characteristic), has been received significant attention. By incorporating zirconia
onto SBA-15 support promising effect has been observed in Zr-SBA-15 support.
Following promising characteristics are reported for Zr-SBA-15 support in the
hydrotreating catalyst application:
• excellent textural properties
• homogeneous dispersion of active metal over the support materials
• good metal-support interaction

77
• presence of surface acidity, which is essential for the desulfurization of refractory
compounds.
2.7.2 Synthesis Methods of Zr-SBA-15
Zirconia incorporation into the framework of mesoporous materials can be done by
two typical methods, namely direct synthesis and post synthesis.
A) Direct Synthesis Method: In direct synthesis method, zirconia incorporation into
SBA-15 framework is accomplished during hydrothermal synthesis of SBA-15 materials.
This is a single stage process wherein silica precursor (TEOS) and zirconia precursor
(ZrOCl2.8H2O) are sequentially added to the block copolymer template P123
(EO20PO70EO20) (pore directing agent) before hydrothermal treatment (Chen et al., 2004)
Advantages of Direct Synthesis:
• Better dispersion of active sites (Szczodrowski et al., 2008).
• More homogeneous distribution of metal produces more stable and dispersed
framework (Melero et al., 2005).
• Formation of extra framework can be avoided (Szczodrowski et al., 2008).
• The procedure of heteroatom into mesoporous material by this method is quite
simple for the incorporation (Szczodrowski et al., 2009; Wu et al., 2004).
• Decrease of surface area is not significant.
• Chances of partial pore blockage can be avoided.
Disadvantages of Direct Synthesis Method:
• Efficiency of direct synthesis method is low compared to the post synthesis method,
since only small amount of heteroatom can be incorporated into SBA-15 (Wu et al.,
2004).
78
• Zirconia incorporation by direct synthesis method becomes difficult, since during
synthesis majority of zirconia precursor gets dissolved in the strong acidic medium
(Amezcua et al., 2005; Chen et al., 2010).
• Difficult to maintain the pore ordering of mesoporus material upon large amount of
zirconia incorporation by direct synthesis method, since zirconia precursor causes the
disturbance of self-assembly of surfactant micelles and silicate (Chen et al., 2010;
Newalkar et al., 2001).
• Reaction mechanism for the co-condensation method is relatively complex
(Szczodrowski et al., 2009) and very difficult to control the heteroatom insertion in SBA-
15 framework. Temperature, pH, aging time, precursor nature, reaction mixture
composition and reactivity, are very difficult to control by this synthesis method. Hence
chances of high heterogeneity and poor reproducibility of the resultant samples.
• Various sizes of ZrO4-, formed around the templating structure, cause local
distortion of inorganic framework (Szczodrowski et al., 2009).
• Co-condensation reaction is very sensitive to the experimental condition
(Szczodrowski et al., 2009). Zr-O-Si bonds become fragile due to presence of strong
acidic hydrothermal environment and the significant difference between hydrolysis rate
of silicon and metal precursors (Szczodrowski et al., 2009).
• Difficult to obtain larger pore diameter of Zr-SBA-15.
Zr-SBA-15 Preparation by Direct Synthesis Methods:
Several methods are developed for the direct synthesis of Zr-SBA-15.
• Self-generated Acidic Environment (Chen et al., 2004): In this method, Zr-SBA-15
is prepared in the absence of HCl and using ZrOCl2.8H2O as zirconium precursor, TEOS

79
as silica source and amphiphilic triblock copolymer P123 (EO20PO70EO20) as pore-
directing agent. In this method, P123, ZrOCl2.8H2O and water mixture is stirred at 35 °C
for one day and then allowed hydrothermally reacted at 90 °C for one day. After that the
solution is filtered, washed and calcined to obtain Zr-SBA-15 mesoporous material. By
this method the loading of zirconia is relatively low (Si/Zr ratio >10).
• Microwave Assisted Synthesis (Du et al., 2009; Newalkar et al., 2001): Using this
method Zr-SBA-15 is prepared (up to bulk Si/Zr =20) without changing the textural
properties (Newalkar et al., 2001). However, in the subsequent literature the
disadvantages of this method have been reported. The mesostructure of Zr-SBA-15
materials decreases significantly upon Zr/Si atomic ratio greater than 5% and structure
gets disorganized at a Zr/Si ratio of 10% (Chen et al., 2004). In this method followings
are used: ZrOCl2.8H2O as zirconium precursor, TEOS as silica source and amphiphilic
triblock copolymer P123 (EO20PO70EO20) as pore-directing agent. In this method, first P123
is dissolve in distilled water. The resultant solution is then mixed with HCl and
ZrOCl2.8H2O to obtain homogeneous solution. Then TEOS is added to the solution and
kept for crystallization under microwave-hydrothermal condition. The product is then
filtered, washed and calcined.
• “pH” Adjusting Method (Du et al., 2009): Highly ordered hexagonal Zr-SBA-15
with large amount of zirconium ( Si/Zr ratio 5.0 to 9.0) can be prepared using urea as pH
adjustor. However, in this process aqueous leaching and thermal decomposition of the
active components cannot be avoided. In this method, materials are used: ZrOCl2.8H2O
as zirconium precursor, tetraethyl orthosilicate (TEOS) as silica source, amphiphilic
triblock copolymer P123 (EO20PO70EO20) as pore-directing agent and urea as pH adjustor.

80
In this method, TEOS is added to HCl containing P123 solution. After that, ZrOCl2.8H2O
and urea is added subsequently to the solution. The solution is then stirred and refluxed
until the pH of solution changes from 5 to 6. Then the solution is kept for aging. The final
product is then filtered, dried and calcined to obtain Zr-SBA-15.
• Surfactant Templated Method (Salas et al., 2009): Highly ordered Zr-MCM-41 with
large amount of zirconium (Si/Zr molar ratio 40 to 5) can be prepared by this method. In
this method, materials are used: cetyltrimethylammonium bromide (CTAB) as template,
tetraethyl orthosilicate (TEOS) as silica source and zirconium-n-propoxide (70%
propanol) as zirconium source. First, solution is prepared by mixing zirconium-n-
propoxide with TEOS. Second solution is prepared by adding CTAB, (NH4)2SO4 and
NH3.H2O into hot water. These two solutions were mixed and keep for aging. The final
product is then filtered, dried and calcined to obtain Zr-MCM-41 material.
• Two-step Process (Fuxiang et al., 2007): High loading of Zr into SBA-15 (Si/Zr
ratio 0.43 to ∞) is obtained by this process. However, the most of the Zr species present
in the Zr-SBA-15 materials prepared by this method are crystalline ZrO2 instead of
isolated Zr4+ .In this method, hexadecyl trimethyl ammonium bromide (CTAB) and
triblock copolymer P123 (EO20PO70EO20) as template, tetraethyl orthosilicate (TEOS) as
silica source and zirconium nitrate (Zr(NO3)4.3H2O) as zirconium source. In this method
the first sample is prepared by mixing CTAB alcohol with Zr(NO3)4.3H2O and preheating
the mixture. The second sample is prepared by adding TEOS into HCl containing
EO20PO70EO20. These samples are then added, stirred continuously and kept for aging.
Finally the product is filtered, dried and calcined to obtain Zr-SBA-15 material.
81
B) Post Synthesis Method: Zirconia or zirconia isopropoxide can be successfully
attached to the walls of mesoporous materials by post synthesis methods (Hagen et al.,
1998; Luan et al., 1999). In the post synthesis method, Zr-SBA-15 is synthesized by two
stage process. In the first stage, well-ordered SBA-15 is synthesized by conventional sol-
gel process by using triblock copolymer P123 (EO20PO70EO20) as the structure directing
agent and TEOS as silica source (Kruk and Cao, 2007). In the second stage, zirconia is
impregnated into SBA-15 structure using zirconia precursor (zirconium (IV) propoxide)
and calcined SBA-15 (Gutiérrez et al., 2008).
Advantages of Post Synthesis:
• In this method, greater concentration of heteroatom can be loaded effectively on the
surface (Luan et al., 1999; Rayo et al., 2009; Wu et al., 2004).
• This method offers deposition of highly dispersed zirconia sites on the SBA-15
surface without changing its texture and structure significantly (Luan et al., 1999).
• Post synthesis grafting method allows the allocation of grafting species (zirconia)
on the surface of SBA-15 materials, which are more accessible for the interaction with
catalyst active sites (Amezcua et al., 2005; Klimova et al., 2001).
• Characteristics of deposited zirconia species can be fine tuned by changing the
preparation methods (chemical grafting or incipient impregnation method) (Amezcua et
al., 2005; Klimova et al., 2001; Luan et al., 1999).
• By this method, increase of thermal and hydrothermal stability of mesoporous
materials is obtained by increasing the pore wall thickness.
• Post-synthesis grafting method can be carried out under both acidic and basic
condition (Wu et al., 2004).

82
• Larger pore diameter of Zr-SBA-15 can be prepared.
Disadvantages of Post Synthesis:
• Formation of segregated metal oxide on the surface causes partial blockage of the
pore (Rayo et al., 2008).
• Reduction of textural properties of the mesoprous framework upon zirconia
incorporation, which will cause decrease in catalytic activity (Newalkar et al., 2001; Wu
et al., 2004).
• Post synthesis routes for the heteroatom insertion into mesoporous materials are
quite complicated and in some routes the synthesis methods needs to be performed in the
absence of water and oxygen (Luan et al., 1999; Wu et al., 2004).
• It is difficult to achieve quantitatively incorporation of heteroatom by grafting
method, since heteroatom partially leached out during filtration (Wu et al., 2004).
• By post synthesis method, 4-coordinated heteroatom incorporation into SBA-15 not
obtainable exclusively. There are some 6-coordinated heteroatom incorporated species
are present in the final material (Luan et al., 1999; Wu et al., 2004).
Zr-SBA-15 Preparation by Post Synthesis Methods:
Zirconia incorporation into SBA-15 mesoporous material can be done by following post
synthesis methods:
• Chemical Grafting (CG) (Klimova et al., 2001): In this method, zirconium (IV)
propoxide (Zr(n-PrO)4 70 wt% solution in 1-proponal) is used as zirconia precursor and
dry ethanol as solvent. In this method, grafting procedure carried out by mixing SBA-15
with (Zr(n-PrO)4) containing dry ethanol. Excess ethanol is removed from the grafting
material by filtrating and washing with ethanol. Finally, Zr-SBA-15 material is obtained
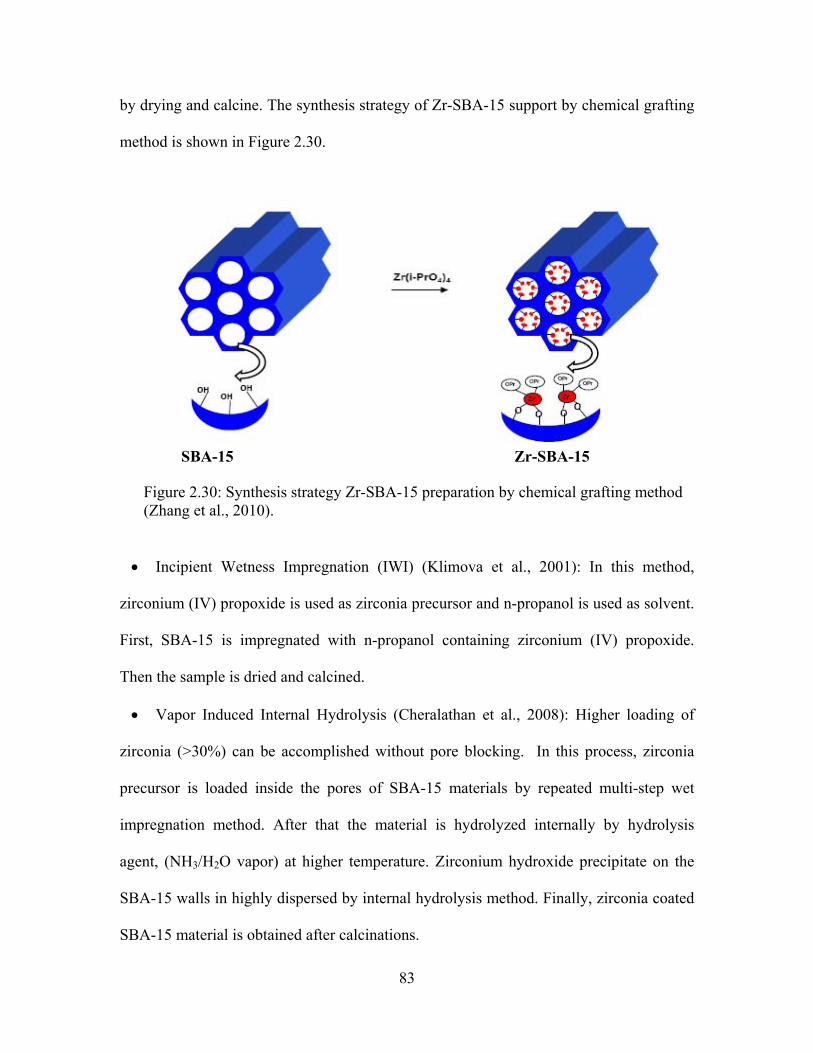
83
by drying and calcine. The synthesis strategy of Zr-SBA-15 support by chemical grafting
method is shown in Figure 2.30.
Figure 2.30: Synthesis strategy Zr-SBA-15 preparation by chemical grafting method (Zhang et al., 2010).
• Incipient Wetness Impregnation (IWI) (Klimova et al., 2001): In this method,
zirconium (IV) propoxide is used as zirconia precursor and n-propanol is used as solvent.
First, SBA-15 is impregnated with n-propanol containing zirconium (IV) propoxide.
Then the sample is dried and calcined.
• Vapor Induced Internal Hydrolysis (Cheralathan et al., 2008): Higher loading of
zirconia (>30%) can be accomplished without pore blocking. In this process, zirconia
precursor is loaded inside the pores of SBA-15 materials by repeated multi-step wet
impregnation method. After that the material is hydrolyzed internally by hydrolysis
agent, (NH3/H2O vapor) at higher temperature. Zirconium hydroxide precipitate on the
SBA-15 walls in highly dispersed by internal hydrolysis method. Finally, zirconia coated
SBA-15 material is obtained after calcinations.
SBA-15 Zr-SBA-15

84
• Chemical Solution Deposition (CSD) (Landau et al., 2005): Landau and coworkers
successfully prepared Zr-SBA-15 (ZrO2 loading 48-75 wt %) by Chemical Solution
Deposition method. In this method materials are used: calcined SBA-15, zirconium (IV)
propoxide (Zr(n-PrO)4 70wt% in n-propanol) as zirconia source. SBA-15 is impregnated
with zirconium (IV) propoxide (Zr(n-PrO)4) under nitrogen atmosphere. The wet solid
obtained after the filtration from excess solution is placed in a n-propanol containing
autoclave. The chemical solution deposition is performed at higher temperature. The final
Zr-SBA-15 product is then cooled, dried and calcined.
• Internal Hydrolysis (Landau et al., 2005): In this method zirconium (IV) propoxide
(Zr(n-PrO)4) is used as zirconia precursor. The Zr impregnation inside the SBA-15 is
carried by hydrolysis of (Zr(n-PrO)4). First, SBA-15 is impregnated with zirconium (IV)
propoxide (Zr(n-PrO)4) under nitrogen atmosphere. After separation from excess
solution, the solid is hydrolyzed by distilled water in a glass vessel. The solid is separated
from water by filtration. Final zirconia impregnated SBA-15 is obtained by dried and
calcined the materials.
• “pH Adjusting” Method (Wu et al., 2004): In this method, high content of
heteroatom is impregnated in strongly high acidic media. First, the heteroatom source is
added into a highly acidic solution (pH<0). When the mesostructure is formed, the pH
value of solution is adjusted from strong acid (pH<0) to neutral media (pH=7).
Thereafter, hydrothermal treatment is carried out. Finally, material is dried and calcined.
2.7.3 Application of Zr-SBA-15 Support in Hydrotreating
Zr-SBA-15 support has been explored as catalyst for hydrotreating of model
compounds. The details are presented in Table 2.15.
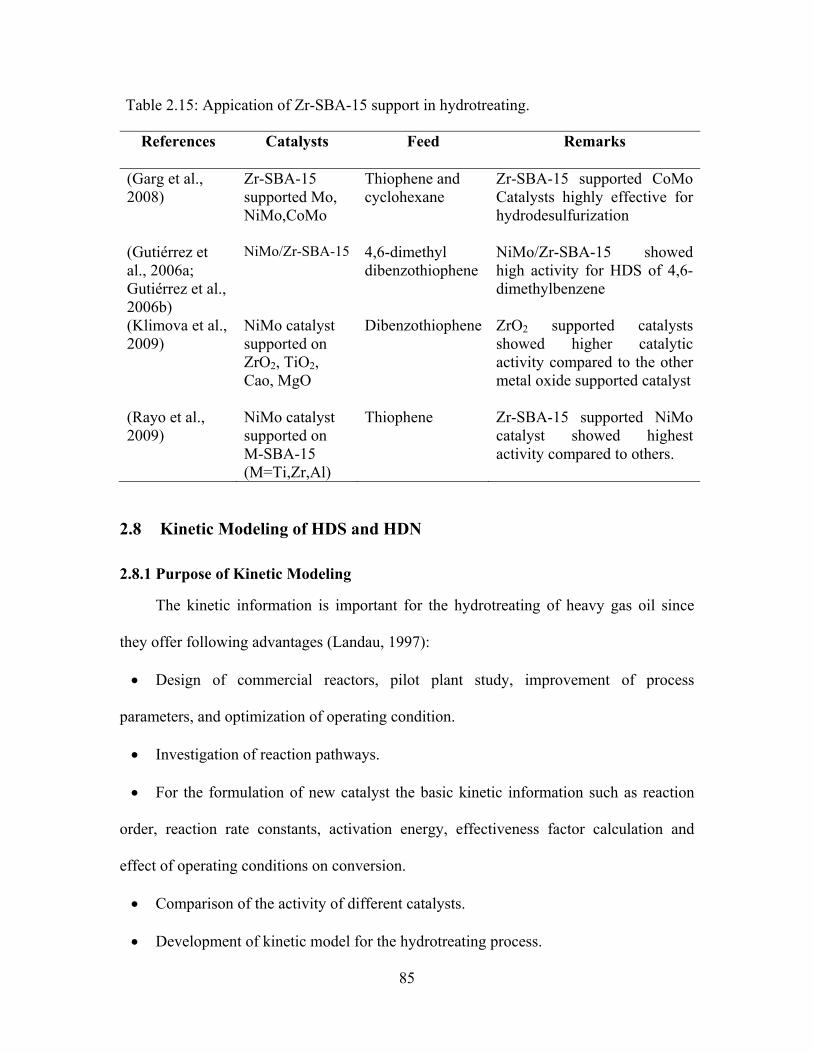
85
Table 2.15: Appication of Zr-SBA-15 support in hydrotreating.
References Catalysts Feed Remarks
(Garg et al., 2008)
Zr-SBA-15 supported Mo, NiMo,CoMo
Thiophene and cyclohexane
Zr-SBA-15 supported CoMo Catalysts highly effective for hydrodesulfurization
(Gutiérrez et al., 2006a; Gutiérrez et al., 2006b)
NiMo/Zr-SBA-15 4,6-dimethyl dibenzothiophene
NiMo/Zr-SBA-15 showed high activity for HDS of 4,6-dimethylbenzene
(Klimova et al., 2009)
NiMo catalyst supported on ZrO2, TiO2, Cao, MgO
Dibenzothiophene ZrO2 supported catalysts showed higher catalytic activity compared to the other metal oxide supported catalyst
(Rayo et al., 2009)
NiMo catalyst supported on M-SBA-15 (M=Ti,Zr,Al)
Thiophene Zr-SBA-15 supported NiMo catalyst showed highest activity compared to others.
2.8 Kinetic Modeling of HDS and HDN
2.8.1 Purpose of Kinetic Modeling
The kinetic information is important for the hydrotreating of heavy gas oil since
they offer following advantages (Landau, 1997):
• Design of commercial reactors, pilot plant study, improvement of process
parameters, and optimization of operating condition.
• Investigation of reaction pathways.
• For the formulation of new catalyst the basic kinetic information such as reaction
order, reaction rate constants, activation energy, effectiveness factor calculation and
effect of operating conditions on conversion.
• Comparison of the activity of different catalysts.
• Development of kinetic model for the hydrotreating process.

86
Deep hydrodesulfurization and hydrodenitrogenation of heavy gas oil feedstock
necessitates the development of more active catalysts and the modification of existing
kinetic of hydrodesulfurization and hydrodenitrogenation models (Van Looij et al.,
1998). In this section, the purpose of the kinetic study is to develop kinetic models for
hydrotreating activity of NiMo/Zr-SBA-15 catalyst on heavy gas oil feed under industrial
condition which will be reliable for the scale-up of pilot plat data.
2.8.2 Kinetic Models for HDS and HDN
Several kinetic models have been documented in the literature for
hydrodesulfurization and hydrodenitrogenation of model compounds. Generally, it has
been reported that kinetic studies based on model compounds follows first order for the
hydrodesulfurization and hydrodenitrogenation reaction (Ancheyta et al., 2002a;
Botchwey et al., 2004). However, heavy gas oil is highly complex mixture of hundreds of
paraffins, naphthenes, (polycyclic) aromatics, organo-sulfur, and nitrogen compounds
hence kinetic data of HGO won’t be analogous to the kinetic data based on model
compounds (Callejas and Martínez, 1999). Due to complex mixture of the different
compounds, it is difficult to express the overall hydrodesulfurization or
hydrodenitrogenation reaction kinetics with a single rate expression (Sie, 1999).
Also, several investigations on hydrodesulfurization of model compounds show that
the presence of inorganic reactants and products such as hydrogen, hydrogen sulfide, and
ammonia can significantly affect the rate of the hydrodesulfurization reaction (Korsten
and Hoffmann, 1996). Similar observation was made while using the complex mixture of
hydrocarbons Also, hydrodesulfurization reactivity depends on the type of sulphur
compounds present in the feed (Ancheyta et al., 2002a). In case of HDN, the complexity
87
of HDN kinetic results arise predominantly from the competitive adsorption of various
reactants, intermediates and products on catalytic sites. Hence, for the heavy gas oil,
complex mixture of hydrocarbon, an appropriate kinetic model is imperative in order to
generate reliable data and to quantify the effect of various parameters on overall HDS and
HDN reaction (Van Looij et al., 1998).
Apart from the feedstock variation, the kinetic parameters, such as reaction order
and activation energy changes with the variation of catalyst. The HDS and HDN reaction
mechanism and kinetics observed with new catalysts differ from the conventional
catalysts. In this context, kinetic models are very useful to evaluate the performance of
the new catalyst using real feedstock.
In general, Power Law model and the Langmuir-Hinshelwood model are applied to
express the kinetic rate of hydrodesulfurization and hydrodenitrogenation reactions
(Ferdous et al., 2006a).
2.8.3 Power Law Model
Power law model is a more comprehensive approach to generate the basic kinetic
information, such as reaction order, reaction rate constant, activation energy, effect of
operating condition on conversion (Marroquín et al., 2005). Due to its simplicity, the
power law model is very popular to generate basic kinetic information, such as reaction
order, reaction rate constant, activation energy, effect of operating condition on
conversion (Ferdous et al., 2006a). Also, it is documented that to represent kinetics of
hydrotreating reaction for real feed stock, power law is more useful. The removal of
sulfur and nitrogen from HGO are described by following power law model (Ferdous et
al., 2006b):
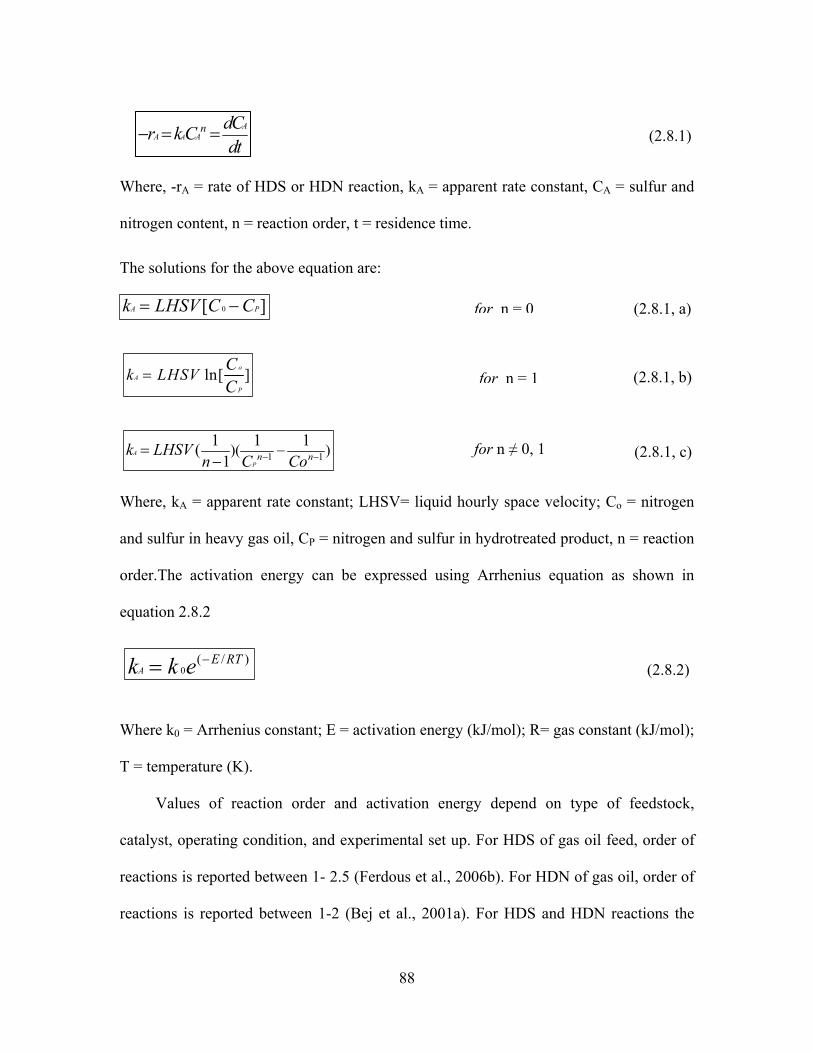
88
ln[ ]oA
P
k LHSV CC
=
1 1)( )1 1 1(1
A
Pn nk LHSV
n C Co− −−=−
AA
A An dCr k C
dt− = =
Where, -rA = rate of HDS or HDN reaction, kA = apparent rate constant, CA = sulfur and
nitrogen content, n = reaction order, t = residence time.
The solutions for the above equation are:
Where, kA = apparent rate constant; LHSV= liquid hourly space velocity; Co = nitrogen
and sulfur in heavy gas oil, CP = nitrogen and sulfur in hydrotreated product, n = reaction
order.The activation energy can be expressed using Arrhenius equation as shown in
equation 2.8.2
Where k0 = Arrhenius constant; E = activation energy (kJ/mol); R= gas constant (kJ/mol);
T = temperature (K).
Values of reaction order and activation energy depend on type of feedstock,
catalyst, operating condition, and experimental set up. For HDS of gas oil feed, order of
reactions is reported between 1- 2.5 (Ferdous et al., 2006b). For HDN of gas oil, order of
reactions is reported between 1-2 (Bej et al., 2001a). For HDS and HDN reactions the
0[ ]A Pk LHSV C C= −
0( / )
AE RTk k e −= (2.8.2)
(2.8.1)
(2.8.1, a) for n = 0
for n = 1 (2.8.1, b)
for n ≠ 0, 1 (2.8.1, c)

89
power law model is used by researchers extensively (Ferdous et al., 2006b). However,
power rate laws are stated as simply an explanation of experimental data and provide
insufficient knowledge about the underlying process (Chorkendorff and Niemantsverdriet
, 2003).
Basic kinetic information, such as reaction order and activation energy, derived
from power law model for the hydrodesulfurization and hydrodenitrogenation of real feed
is summarized in Table 2.16.
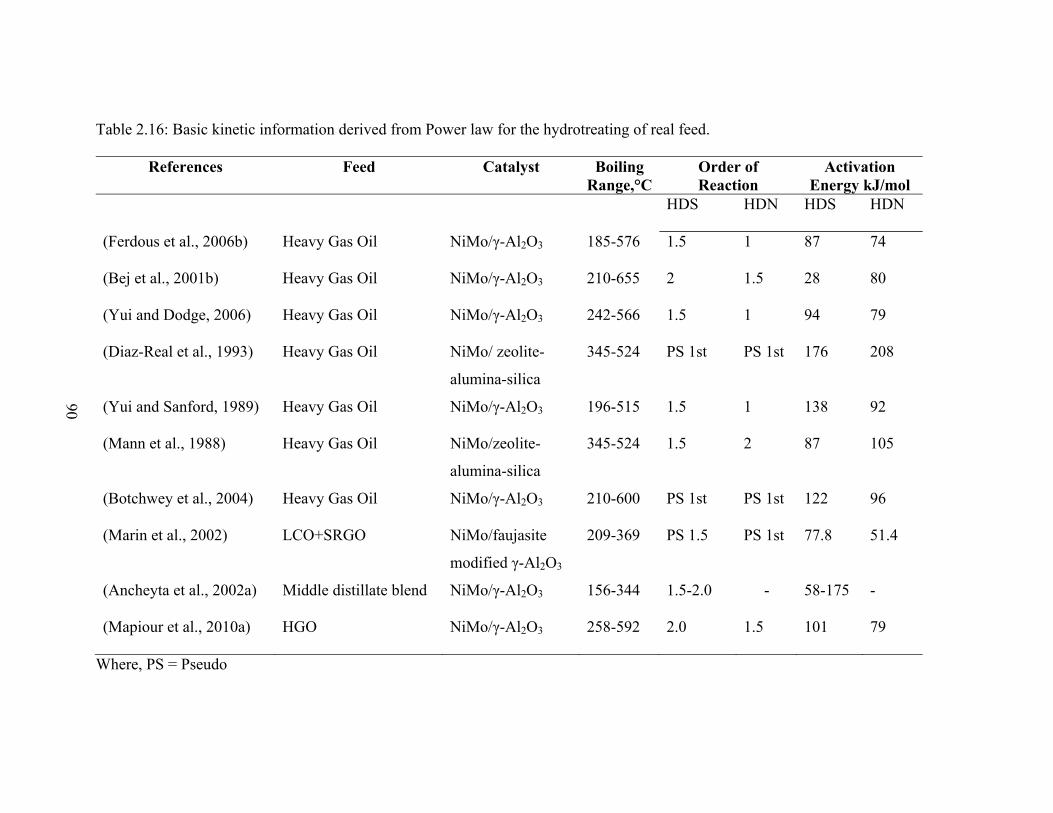
90
Table 2.16: Basic kinetic information derived from Power law for the hydrotreating of real feed.
References Feed Catalyst Boiling Range,°C
Order of Reaction
Activation Energy kJ/mol
HDS HDN HDS HDN
(Ferdous et al., 2006b) Heavy Gas Oil NiMo/γ-Al2O3 185-576 1.5 1 87 74
(Bej et al., 2001b) Heavy Gas Oil NiMo/γ-Al2O3 210-655 2 1.5 28 80
(Yui and Dodge, 2006) Heavy Gas Oil NiMo/γ-Al2O3 242-566 1.5 1 94 79
(Diaz-Real et al., 1993) Heavy Gas Oil NiMo/ zeolite-
alumina-silica
345-524 PS 1st PS 1st 176 208
(Yui and Sanford, 1989) Heavy Gas Oil NiMo/γ-Al2O3 196-515 1.5 1 138 92
(Mann et al., 1988) Heavy Gas Oil NiMo/zeolite-
alumina-silica
345-524 1.5 2 87 105
(Botchwey et al., 2004) Heavy Gas Oil NiMo/γ-Al2O3 210-600 PS 1st PS 1st 122 96
(Marin et al., 2002) LCO+SRGO NiMo/faujasite
modified γ-Al2O3
209-369 PS 1.5 PS 1st 77.8 51.4
(Ancheyta et al., 2002a) Middle distillate blend NiMo/γ-Al2O3 156-344 1.5-2.0 - 58-175 -
(Mapiour et al., 2010a) HGO NiMo/γ-Al2O3 258-592 2.0 1.5 101 79
Where, PS = Pseudo
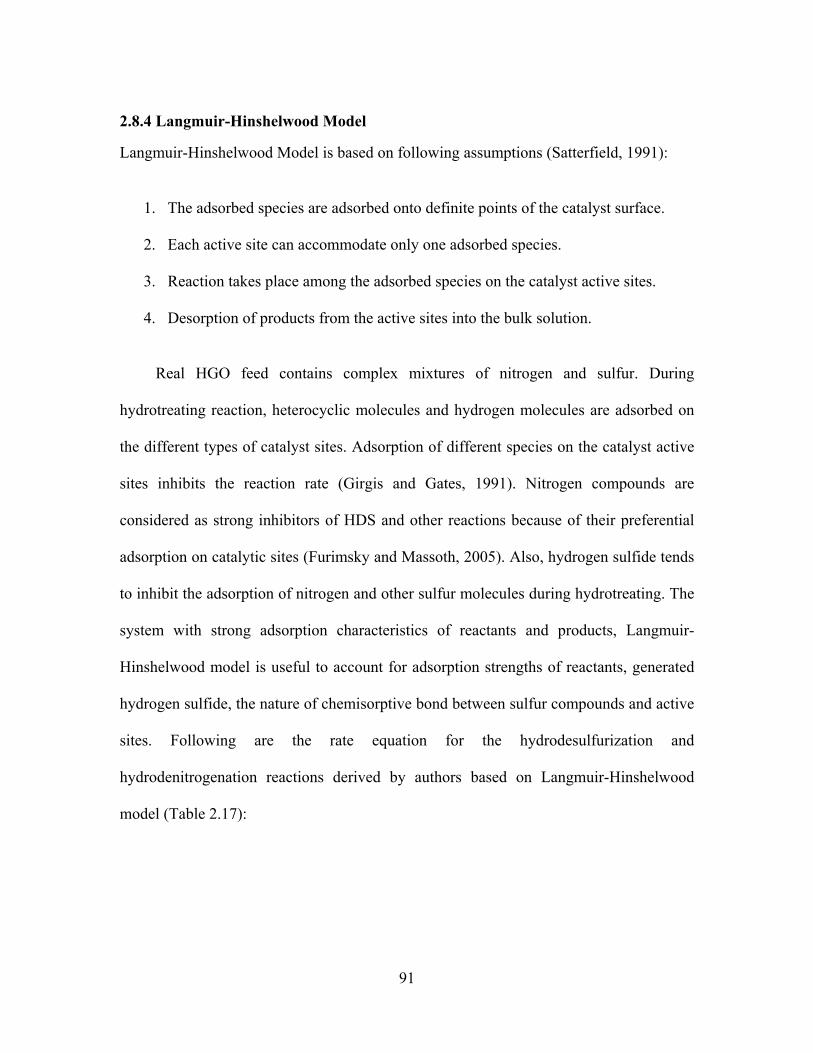
91
2.8.4 Langmuir-Hinshelwood Model
Langmuir-Hinshelwood Model is based on following assumptions (Satterfield, 1991):
1. The adsorbed species are adsorbed onto definite points of the catalyst surface.
2. Each active site can accommodate only one adsorbed species.
3. Reaction takes place among the adsorbed species on the catalyst active sites.
4. Desorption of products from the active sites into the bulk solution.
Real HGO feed contains complex mixtures of nitrogen and sulfur. During
hydrotreating reaction, heterocyclic molecules and hydrogen molecules are adsorbed on
the different types of catalyst sites. Adsorption of different species on the catalyst active
sites inhibits the reaction rate (Girgis and Gates, 1991). Nitrogen compounds are
considered as strong inhibitors of HDS and other reactions because of their preferential
adsorption on catalytic sites (Furimsky and Massoth, 2005). Also, hydrogen sulfide tends
to inhibit the adsorption of nitrogen and other sulfur molecules during hydrotreating. The
system with strong adsorption characteristics of reactants and products, Langmuir-
Hinshelwood model is useful to account for adsorption strengths of reactants, generated
hydrogen sulfide, the nature of chemisorptive bond between sulfur compounds and active
sites. Following are the rate equation for the hydrodesulfurization and
hydrodenitrogenation reactions derived by authors based on Langmuir-Hinshelwood
model (Table 2.17):

92
2 2
2 2 ) )(1 (1H Hs
H S H S F F
n mS Sk C P k C PdC
dt K P K C
β∞
= +⋅ ⋅ ⋅ ⋅−+ +
2
2 2 2 22) )(1 (1
H
DBT DBT H S H S H H
DBTr k C CK C K C K C
=+⋅ ⋅
+ ⋅ ⋅ ⋅ + ⋅
Table 2.17: Langmuir-Hinshelwood models for HDS and HDN.
References Feed Catalyst HDS or HDN Model
(Van Hasselt et al., 1999) DBT Co(Ni)Mo/
Al2O3
(Tsamatsoulis and Papayannakos, 1998)
VGO Co(Ni)Mo/Al2O3
(Satterfield and Yang, 1984) Quinoline NiMo/Al2O3
(Rodríguez and Ancheyta, 2004) VGO NiMo/Al2O3
(Knudsen et al., 1999) Diesel Co(Ni)Mo/
Al2O3
(Botchwey et al., 2006) HGO NiMo/Al2O3
(Broderick and Gates, 1981) DBT CoMo/Al2O3
Considering inhibition effect of hydrogen sulfide, nitrogen, sulfur compounds, the kinetic
expression for HDS and HDN of heavy gas oil can be expressed by following equations:
A) Langmuir-Hinshelwood Model I:
Considering reaction occur on separate active sites:
[ ]1
nHDS S S
HDSS S
k K CrK C⋅ ⋅
− =+ ⋅ [ ]1
mHDN N N
HDNN N
k K CrK C⋅ ⋅
− =+ ⋅
(2.8.4) (2.8.3)
[ ]2
2
21r DBT H
AH S
k C CrK C
⋅ ⋅=
+
[ ]2.3
2
2 21HDS H S
HDSH S H S
k P CrK P⋅ ⋅
=+
0 .4 52
22 2
( )( )(1 )
S SS H
H D S H D S S SH H S
C Cr kK C
=+
[ ]ij i i
ijAA AA SA SA Y Y
k K Cr
K C K C K C
⋅ ⋅− =
+ +
2 2
2 2 2 21i i H H i
i
i i H H H S H S
r kKK P CKC K P K P
− =+ + +
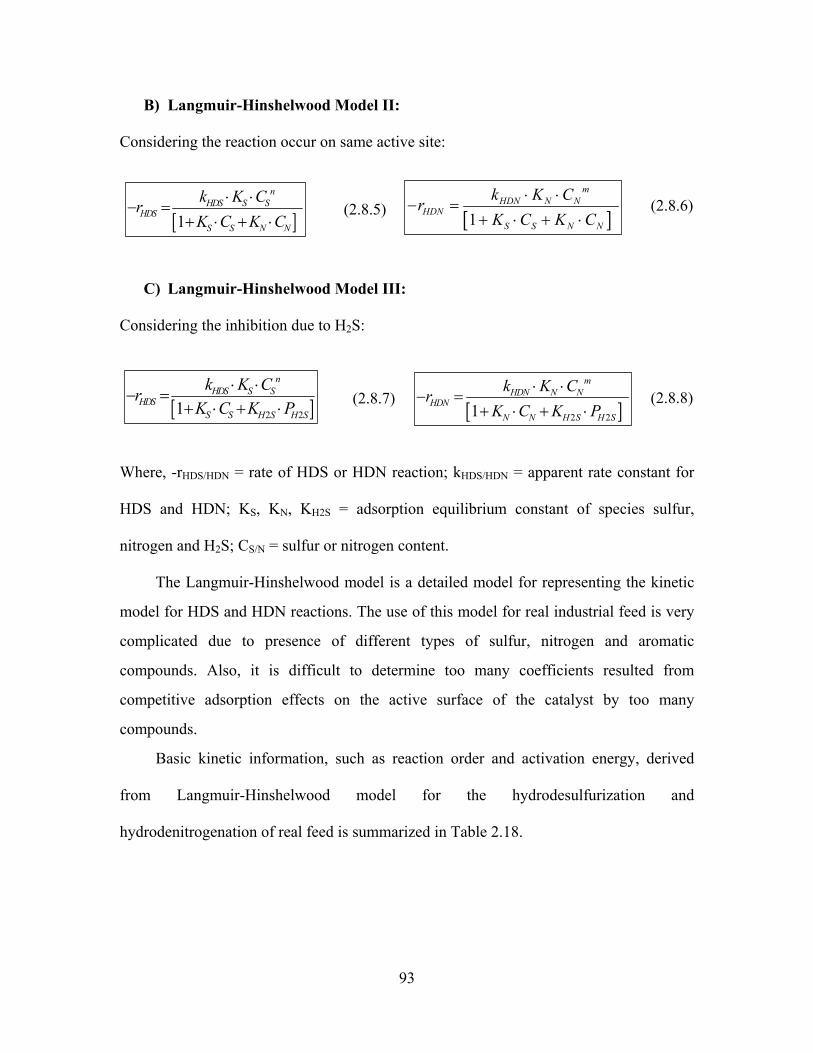
93
B) Langmuir-Hinshelwood Model II:
Considering the reaction occur on same active site:
C) Langmuir-Hinshelwood Model III:
Considering the inhibition due to H2S:
Where, -rHDS/HDN = rate of HDS or HDN reaction; kHDS/HDN = apparent rate constant for
HDS and HDN; KS, KN, KH2S = adsorption equilibrium constant of species sulfur,
nitrogen and H2S; CS/N = sulfur or nitrogen content.
The Langmuir-Hinshelwood model is a detailed model for representing the kinetic
model for HDS and HDN reactions. The use of this model for real industrial feed is very
complicated due to presence of different types of sulfur, nitrogen and aromatic
compounds. Also, it is difficult to determine too many coefficients resulted from
competitive adsorption effects on the active surface of the catalyst by too many
compounds.
Basic kinetic information, such as reaction order and activation energy, derived
from Langmuir-Hinshelwood model for the hydrodesulfurization and
hydrodenitrogenation of real feed is summarized in Table 2.18.
[ ]1
nHDS S S
HDSS S N N
k K CrK C K C
⋅ ⋅− =
+ ⋅ + ⋅ [ ]1
mHDN N N
HDNS S N N
k K CrK C K C
⋅ ⋅− =
+ ⋅ + ⋅(2.8.6) (2.8.5)
[ ]2 21
mHDN N N
HDNN N H S H S
k K CrK C K P
⋅ ⋅− =
+ ⋅ + ⋅[ ]2 21
nHDS S S
HDSS S H S H S
k K CrK C K P
⋅ ⋅− =
+ ⋅ + ⋅ (2.8.7) (2.8.8)
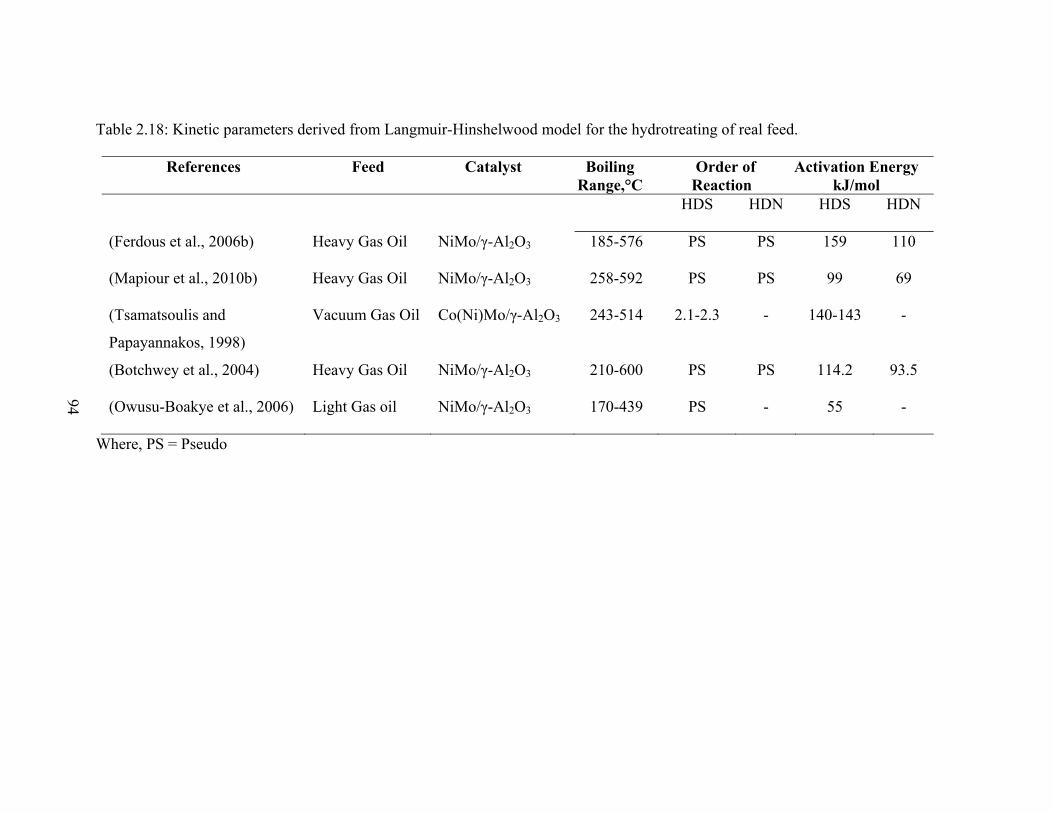
94
Table 2.18: Kinetic parameters derived from Langmuir-Hinshelwood model for the hydrotreating of real feed.
References Feed Catalyst Boiling Range,°C
Order of Reaction
Activation Energy kJ/mol
HDS HDN HDS HDN
(Ferdous et al., 2006b) Heavy Gas Oil NiMo/γ-Al2O3 185-576 PS PS 159 110
(Mapiour et al., 2010b) Heavy Gas Oil NiMo/γ-Al2O3 258-592 PS PS 99 69
(Tsamatsoulis and
Papayannakos, 1998)
Vacuum Gas Oil Co(Ni)Mo/γ-Al2O3 243-514 2.1-2.3 - 140-143 -
(Botchwey et al., 2004) Heavy Gas Oil NiMo/γ-Al2O3 210-600 PS PS 114.2 93.5
(Owusu-Boakye et al., 2006) Light Gas oil NiMo/γ-Al2O3 170-439 PS - 55 -
Where, PS = Pseudo

95
2.8.5 Reactor Performance
Small-scale trickle bed microreactors are widely used for the generation of
meaningful data which is can be useful for the studying the new catalyst (Bej et al.,
2000). In kinetic study, the basic assumptions of the trickle bed microreactor operation
are isothermality and plug flow (Mann et al., 1988). However, the dimension of
commercial reactor and catalyst bed length are different from that of the microreator
which causes some limitation of trickle bed microreactor. Major problem arises during
the catalyst performance evaluation in trickle bed microreactors are: poor wetting of
catalyst, wall effects and back mixing of liquid. These problems cause the deviations of
performance of the laboratory trickle bed reactor from that of an ideal flow reactor (Mann
et al., 1988). Considerable efforts have been made by several authors to address this
issues and several recommendation have been made to solve this problem. Diluting
catalytic bed with nonporous, inert particles have been suggested by several researchers
to avoid deviations from ideal plug flow which is observed in micro scale trickle bed
reactor during hydrotreating of real feedstock with commercial size catalysts (Bej et al.,
2000; Ramírez et al., 2004). The performance of the trickle bed microreactor is suggested
to be improved by eliminating wall effect. For the kinetic studies of hydroprocessing
reaction several experiments have been reported by the researchers using catalyst pellets
diluted with appropriate inert diluents (Bej et al., 2002). It has been reported that
hydrodynamic are controlled by the diluents whereas the kinetics are dictated by the
catalyst pellet.
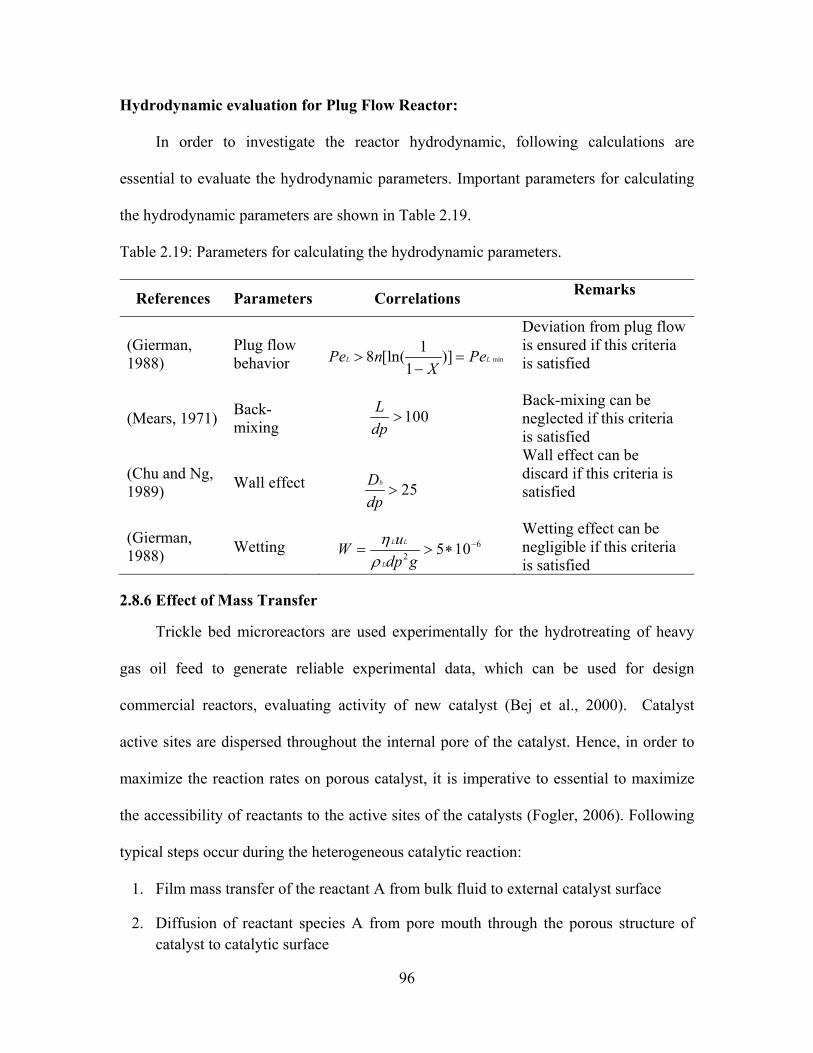
96
Hydrodynamic evaluation for Plug Flow Reactor:
In order to investigate the reactor hydrodynamic, following calculations are
essential to evaluate the hydrodynamic parameters. Important parameters for calculating
the hydrodynamic parameters are shown in Table 2.19.
Table 2.19: Parameters for calculating the hydrodynamic parameters.
References Parameters Correlations Remarks
(Gierman, 1988)
Plug flow behavior
Deviation from plug flow is ensured if this criteria is satisfied
(Mears, 1971) Back-mixing
Back-mixing can be neglected if this criteria is satisfied
(Chu and Ng, 1989) Wall effect
Wall effect can be discard if this criteria is satisfied
(Gierman, 1988) Wetting
Wetting effect can be negligible if this criteria is satisfied
2.8.6 Effect of Mass Transfer
Trickle bed microreactors are used experimentally for the hydrotreating of heavy
gas oil feed to generate reliable experimental data, which can be used for design
commercial reactors, evaluating activity of new catalyst (Bej et al., 2000). Catalyst
active sites are dispersed throughout the internal pore of the catalyst. Hence, in order to
maximize the reaction rates on porous catalyst, it is imperative to essential to maximize
the accessibility of reactants to the active sites of the catalysts (Fogler, 2006). Following
typical steps occur during the heterogeneous catalytic reaction:
1. Film mass transfer of the reactant A from bulk fluid to external catalyst surface
2. Diffusion of reactant species A from pore mouth through the porous structure of catalyst to catalytic surface
min18 [ln( )]
1L LPe n Pe
X> =
−
62 5 10L L
L
uWdp gηρ
−= > ∗
100Ldp
>
25bDdp
>

97
Catalyst
Pore
3. Adsorption of reactant A into catalyst surface
4. Reaction of A to B on catalytic sites on catalyst surface
5. Desorption of product B molecules from surface
6. Diffusion of product species B from interior of pellet through porous structure to pore mouth
7. Film mass transfer of product B from external surface to the bulk fluid.
Step 1, 2, 6, and 7 are diffusional processes and step 3, 4, and 5 are chemical
processes. Any of these steps can be slow, relative to others, controls the overall rate
of reaction. In Figure 2.31, the details step for the catalytic reaction in a porous
catalyst is shown.
Figure 2.31: Heterogeneous catalytic reaction in porous catalyst (Fogler, 2006).
A1 A2
A1 A2
1
2
3
7
6
5
4
Film diffusion
Pore diffusion
Adsorption / desorption
Chemical reaction
A1
A2Boundary
Layer
2 6
A1 A2
Porouscatalyst
Bulk Phase
4 3 5
A2 A1
Active site at catalyst surface
1
7
98
Depending upon the presence or absence of internal and external mass transfer
limitation, the kinetic studies can be performed under three different conditions (Bej et
al., 2002):
1) Intrinsic Kinetic model: Intrinsic kinetic study involves detailed mechanistic
understanding of all reactions. In order to eliminate both internal and external mass
transfer limitation the experiments are conducted using a fine size of catalyst and
appropriate condition is considered.
2) Apparent kinetic model: Apparent kinetic study is derived from the overall
stoichiometric reaction where the experiments are conducted using commercial size
catalyst by eliminating only external mass transfer resistence. This type of kinetic model
is generally used by the industrial researcher for the scale-up of the commercial reactors.
3) Extrinsic kinetic model: In this kinetic study, the internal and external mass
transfer limitation cannot be eliminated.

99
CHAPTER 3
EXPERIMENTAL METHOD
This chapter outlines the experimental procedure and reactor set-up for the
hydrotreating process. Preparation of SBA-15 support, Zr-SBA-15 support and NiMo/Zr-
SBA-15 catalyst are illustrated in section 3.1, 3.2 and 3.3 respectively. Support and
catalyst characterization method is described is in section 3.4. In section 3.5, description
of catalyst performance test is illustrated.
3.1 SBA-15 Support Preparation SBA-15 material was synthesized according to the procedure described in literature
(Kruk and Cao, 2007). The following chemicals were used in SBA-15 material synthesis:
triblock copolymer P123 (EO20PO70EO20) as structure directing agent, tetraethyl
orthosilicate (TEOS) as silica source, hexane (C6H14) as swelling agent, hydrochloric acid
(HCl) as acid media, ammonium fluoride (NH4F) as frame order enhancer, and water
(H2O) as dissolving media. The molar composition of the synthesis mixture was TEOS:
P123: C6H14: NH4F: HCl: H2O = 1: 0.0168: 4.02: 0.0295: 4.42: 186. The triblock
copolymer P123 and NH4F were dissolved in the diluted HCl aqueous solution by
magnetic stirring at room temperature. TEOS and hexane were added into the solution
sequentially, and the mixture was stirred at 15 °C for 24 hrs. Subsequently, the mixture
was transferred into a Teflon autoclave bottle and was aged at 130 °C for 48 hrs. The
product was filtered, washed by demineralized water and air-dried at room temperature.
Finally, calcination of the material was carried out at 550 °C for 5 hrs. Schematic for
SBA-15 support preparation in laboratory is shown in Figure 3.1.

100
Figure 3.1: Schematic for SBA-15 support preparation in laboratory.
Aging & hydrothermal heating in Muffle Furnace Hydrogel Formation in
Constant Temperature Bath
Addition of TEOS
P123 H2O HCl NH4F
Filtration
Air Drying in Crucible
Calcination in Muffle Furnace
SBA-15 Powder
101
3.2 Zr-SBA-15 Support Preparation
3.2.1 Direct Synthesis Method
Zr-SBA-15 supports were prepared by both direct synthesis and post synthesis
methods. In the direct synthesis method, Zr incorporation into the SBA-15 framework
was accomplished as per the procedure provided by literature ( Chen et al., 2004), using
block copolymer template P123 (EO20PO70EO20) as pore directing agent, tetraethyl
orthosilicate (TEOS) as silica precursor, and zirconium oxychloride (ZrOCl2.8H2O) as
zirconia precursor (Chen et al., 2004). In the synthesis condition atomic ratio of the
following chemicals was used- P123: Si: Zr: H2O =0.017: 1.0: (0.05 and 0.025): 220. The
mixture was stirred at 35 °C for 24 hrs. Then, the mixture was transferred into a Teflon
autoclave bottle and was kept for aging at 130 °C for 48 hrs. The product was filtered and
washed with demineralized water and dried at room temperature. Finally, the material
was calcined at 550 °C for 5 hrs.
3.2.2 Post Synthesis Method
Zirconia modified support was prepared by the post synthesis (chemical grafting)
method as described in previous literature (Gutiérrez et al., 2006a). Zirconium (IV)
propoxide [Zr(n-PrO)4] ( 70 wt% solution in 1-propanol) was used as the zirconia source
and dry ethanol (EtOH 99.999 %) was used as the solvent. Calcined SBA-15 was slurried
in the dry ethanol for 8 hours at room temperature. The material was filtered and washed
with dry ethanol. The solid was then dried at room temperature for overnight. Finally, the
material was calcined at 550 °C for 5 hrs. Schematic for Zr-SBA-15 support preparation
by post synthesis method is presented in Figure 3.2.

102
Figure 3.2: Schematic for Zr-SBA-15 support preparation by post synthesis method in laboratory.
Chemical Grafting in Conical Flask
SBA-15, Dry Ethanol, Zr(n-PrO)4
Filtration
Air Drying in Crucible
Calcination in Muffle Furnace Zr-SBA-15 (Post) Powder

103
3.3 NiMo/SBA-15 and NiMo/Zr-SBA-15 Catalyst Preparation
NiMo catalysts supported on SBA-15 and Zr-SBA-15 were prepared by standard
incipient wetness impregnation (IWI) technique. Ammonium heptamolybdate,
(NH4)6Mo7O24.4H2O (Aldrich) was used as the molybdenum source and nickel nitrate, Ni
(NO3)2.6H2O (Aldrich) was used as the nickel source. Molybdenum and nickel were
impregnated into the calcined SBA-15 and Zr-SBA-15 successively. After each
impregnation, the catalysts were dried at 100 °C for 24 hrs and calcined at 500 °C for 4
hrs. The naming of the synthesized supports and catalysts are presented in Table 3.1.
Table 3.1: Naming of the supports and catalysts prepared for the project.
Support SynthesisMethod
Target ZrO2 (wt %)
Target Si/Zr Ratio
Target Mo
Target Ni
Phase - I
SBA-15 - - - - -
Zr-SBA-15 (Post 16) Post 16.0 -
Zr-SBA-15 (Post 23) Post 23.0 -
Zr-SBA-15 (Direct 40) Direct - 40.0
Zr-SBA-15 (Direct 20) Direct - 20.0
NiMo/SBA-15 IWI - - 12.0 2.4
NiMo/Zr-SBA-15 (Post 16) IWI 16.0 - 12.0 2.4
NiMo/Zr-SBA-15 (Post 23) IWI 23.0 - 12.0 2.4
NiMo/Zr-SBA-15 (Direct 40) IWI - 40.0 12.0 2.4
NiMo/Zr-SBA-15 (Direct 20) IWI - 20.0 12.0 2.4
Phase - II
Zr-SBA-15 (Post 23) Post 23.0 - - -
NiMo/Zr-SBA-15 (Mo 12) IWI 23.0 - 12.0 2.4
NiMo/Zr-SBA-15 (Mo 17) IWI 23.0 - 17.0 3.4
NiMo/Zr-SBA-15 (Mo 22) IWI 23.0 - 22.0 4.4
NiMo/Zr-SBA-15 (Optimum) IWI 23.0 - 17.0 3.4

104
3.4 Support and Catalyst Characterization Technique
The support and catalyst were characterized by following characterization method
as described below:
3.4.1 Small Angle X-ray Scattering (SAXS)
Structural analysis of mesoporous support and catalysts were evaluated by SAXS
analysis. A small amount of sample was placed in between two sheets of Mylar film
supported by a flat, metal holder with a hole through it (for transmittance). Data were
obtained using a still data collection with an exposure time of 300 seconds with a Bruker
Smart6000 CCD detector on a 3-circle D8 goniometer. The source was a Rigaku RU200
Cu rotating anode generator fitted with parallel focusing cross-coupled mirrors and a 0.5
mm pinhole collimator.
3.4.2 N2 Adsorption/Desorption
Brunauer-Emmett-Teller (BET) surface area, pore volume, and pore size
measurements of support and catalysts were performed using Micrometrics adsorption
equipment (Model ASAP 2000) using liquid N2 (99.995% pure, obtained from Praxair,
Canada). About 0.20 g of sample was used for each analysis. The samples were degassed
at 200˚C for 2 hrs in a vacuum of 550 Torr to remove moisture from the support and
catalyst surface before analysis. The N2 adsorption and desorption isotherms used in the
evaluation of BET surface area (SBET) were obtained at the liquid nitrogen temperature
(77 K). The pore volume (VP) and pore sizes (DP) were determined using the BJH
algorithm (developed by Barrett–Joyner–Halenda, using the Kelvin equation for
calculation of pore volume and pore sizes) for adsorption and desorption of nitrogen.

105
3.4.3 Elemental Analysis
The amount of Si and Zr in the support was determined by SEM-EDX analysis. The
EDX spectra were collected using a JEOL 6400 SEM. Quantitative estimation of Zr, Mo,
and Ni in the catalysts was performed using inductively coupled plasma - mass
spectrometer (ICP-MS). A catalyst sample (0.1 g) was dissolved in concentrated
hydrofluoric acid (48-51%) at a temperature of 100-150˚C for three days. After cooling,
samples were further dissolved in concentrated HNO3 to ensure the complete dissolution
of the metals. The final solution was prepared using 0.2 N HNO3 and analyzed with a
mass spectrometer.
3.4.4 Transmission Electron Microscopy (TEM)
The morphology and structure of support and catalyst were analyzed by TEM. The
TEM images were recorded using a 200 keV JEOL 2011 STEM. The sample was
sonicated in ethanol for 10 minutes before the analysis.
3.4.5 Scanning Electron Microscopy (SEM)
The morphology of mesoporous supports were examined by the scanning electron
microscopy (SEM) instrument. The SEM image of support sample was retrieved in a
JOEL 840A SEM instrument.
3.4.6 Fourier Transform Infrared Spectroscopy (FTIR)
The framework vibration of calcined SBA-15 and Zr-SBA-15 materials was
examined by FTIR spectroscopy. KBr pellet technique was employed to obtain infrared
spectra of the samples at room temperature. The spectra were retrieved in the wave
number range of 400-2000 cm-1 with a resolution of 4 cm-1 by an infrared spectrometer
type JASCO FTIR 4100.

106
3.4.7 Pyridine Adsorbed Fourier Transform Infrared Spectroscopy (Py-IR)
The strength and type of acid site on calcined SBA-15 and Zr-SBA-15 were
analyzed by pyridine adsorbed FTIR spectroscopy. 10 mg of sample was placed in IR cell
and heated up to 200 °C with a heating rate of 3 °C /min while maintaining the helium
flow of 50 ml/min. The sample was cooled to 35 °C and the background spectra of the
sample were recorded. The pyridine was introduced along with the helium flow and kept
for 30 min. After that, the pyridine flow was stopped, and the adsorbed pyridine from the
sample was removed by purging with the helium at 120 °C for 1 hr. Finally, the spectra
were retrieved in a Perkin-Elmer (Spectrum –GX) spectrometer for the wavelength of
1400-1600 cm-1.
3.4.8 X-ray Diffraction (XRD)
XRD studies were carried out on the calcined catalyst samples to identify the
presence of any crystalline species. Analyses were performed using a Rigaku
diffractometer (Rigaku, Tokyo, Japan) with Cu Kα radiation filtered by a graphic
monochromator at a setting of 40 kV and 80 mA. The powdered samples were spread on
a glass slide with acetone and dried at room temperature. The X-ray diffraction analyses
were carried in the scanning angle range of 10 to 80° at a scanning speed of 1°/min.
3.4.9 Raman Spectroscopy
The vibrational characteristic of NiMo/SBA-15 and NiMo/Zr-SBA-15 were
analyzed by Raman spectroscopy using a Renishaw Micro-Raman System 2000
spectrometer at the argon laser wavelength of 785 nm.

107
3.4.10 UV vis Diffuse Reflectance Spetroscopy
The UV-vis-DRS electronic spectra of the catalyst samples were recorded in the
wavelength of 270-2500 nm using Cary spectrophotometer equipped with diffuse
reflectance attachment. BaSO4 was used as reference.
3.5 Hydrotreating Experimental Set-up and Activity Test
3.5.1 Hydrotreating Reactor Set-up
The schematic of the experimental set-up for the hydrotreating reaction is shown in
Figure 3.3. The system consists of a liquid and gas feeding section, a reaction section and
a high pressure gas-liquid separation section. The feed section comprises of heavy gas oil
(HGO) feed tank, an Eldex syringe feed pump and hydrogen gas source. The reaction
section consist of a 304 stainless steel, tubular, micro scale trickle bed reactor (length 240
mm and diameter 10 mm) filled with catalyst (diluted with silicon carbide particles) and a
heater with a temperature controller (Eurotherm Controls, model No. 2216e) for
controlling the temperature of the catalyst bed. Liquid product and gas phase separation
section includes water scrubber, high pressure (HP) separator and H2S Scrubber. At the
downstream of the separation section, hydrotreated liquid product collection vessel is
provided. A H2S scrubber is provided to collect the gaseous product. The reactor section
is pressurized by helium gas and the pressure is maintained by adjusting a back-pressure
regulator.
3.5.2 Preparation for Hydrotreating Reaction
Reactor loading, reactor pressurizing and catalyst sulfidation were performed prior
to the hydrotreating reaction run. After cleaning the reactor thoroughly, the bottom of the
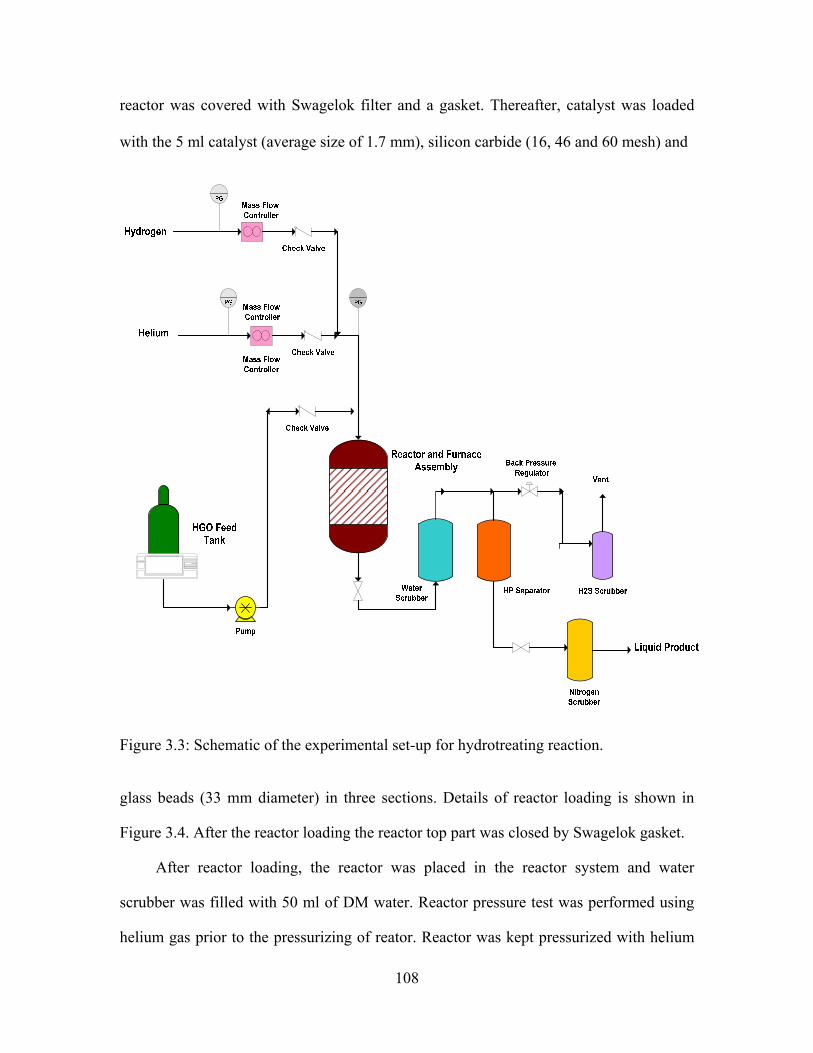
108
reactor was covered with Swagelok filter and a gasket. Thereafter, catalyst was loaded
with the 5 ml catalyst (average size of 1.7 mm), silicon carbide (16, 46 and 60 mesh) and
Figure 3.3: Schematic of the experimental set-up for hydrotreating reaction.
glass beads (33 mm diameter) in three sections. Details of reactor loading is shown in
Figure 3.4. After the reactor loading the reactor top part was closed by Swagelok gasket.
After reactor loading, the reactor was placed in the reactor system and water
scrubber was filled with 50 ml of DM water. Reactor pressure test was performed using
helium gas prior to the pressurizing of reator. Reactor was kept pressurized with helium
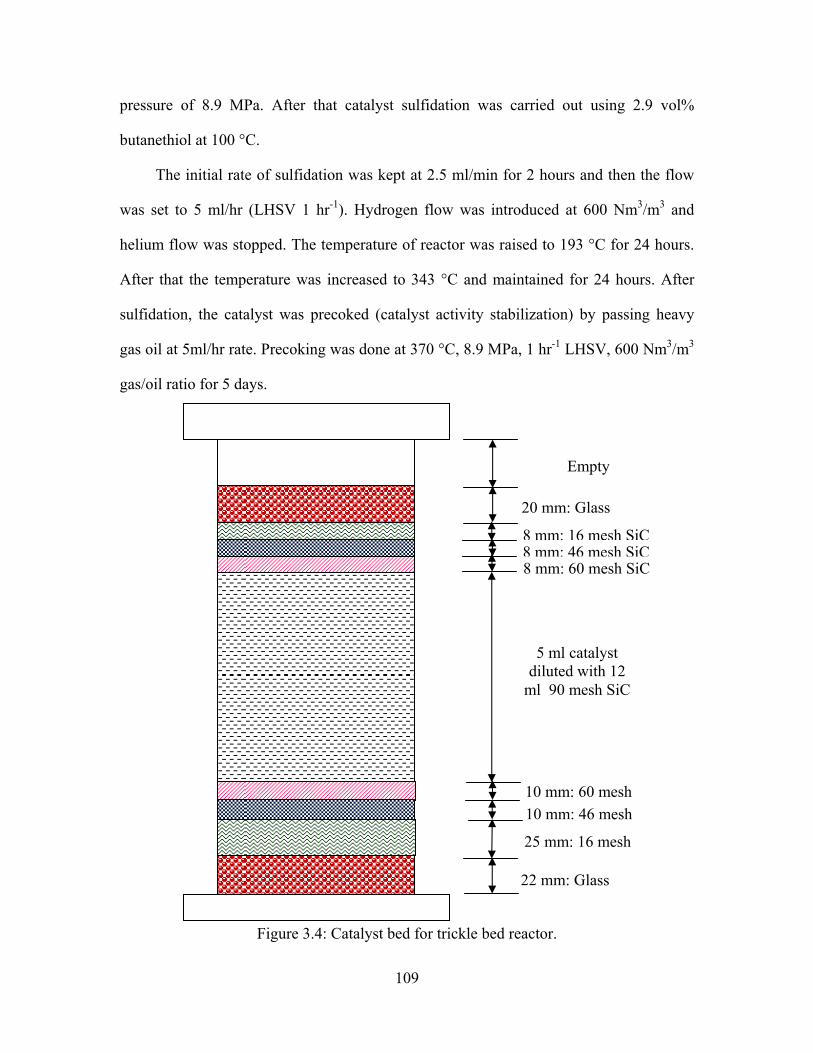
109
pressure of 8.9 MPa. After that catalyst sulfidation was carried out using 2.9 vol%
butanethiol at 100 °C.
The initial rate of sulfidation was kept at 2.5 ml/min for 2 hours and then the flow
was set to 5 ml/hr (LHSV 1 hr-1). Hydrogen flow was introduced at 600 Nm3/m3 and
helium flow was stopped. The temperature of reactor was raised to 193 °C for 24 hours.
After that the temperature was increased to 343 °C and maintained for 24 hours. After
sulfidation, the catalyst was precoked (catalyst activity stabilization) by passing heavy
gas oil at 5ml/hr rate. Precoking was done at 370 °C, 8.9 MPa, 1 hr-1 LHSV, 600 Nm3/m3
gas/oil ratio for 5 days.
Figure 3.4: Catalyst bed for trickle bed reactor.
Empty
20 mm: Glass
8 mm: 16 mesh SiC 8 mm: 46 mesh SiC 8 mm: 60 mesh SiC
5 ml catalyst diluted with 12
ml 90 mesh SiC
25 mm: 16 mesh
10 mm: 60 mesh 10 mm: 46 mesh
22 mm: Glass

110
3.5.3 Catalyst Performance Test
The performance of all synthesized catalysts for hydrodesulfurization (HDS) and
hydrodenitrogenation (HDN) reactions were evaluated in a down-flow concurrent trickle
bed microreactor using heavy gas oil (HGO) derived from Athabasca bitumen provided
by Syncrude Canada as feedstock. The characteristic of heavy gas oil is presented in
Table 3.2. The hydrotreating reactor system consists of a liquid and gas feeding section, a
reaction section and a high pressure gas-liquid separation section. The HGO was pumped
by metering pump and mixed with the hydrogen gas before entering the reactor.
Table 3.2: Characteristics of heavy gas oil derived from Athabasca bitumen.
HGO Characteristics Sulfur (wt%) 3.4424 Nitrogen (wt%) 0.3081 Density (g/ml) 0.98
Simulated Distillation
IBP (°C) 282 FBP (°C) 648 Boiling Range (°C) wt% IBP-310 2 310-350 6 351-400 17.2 401-450 27.2 451-500 26.3 501-600 19.2 600-FBP 2.1
Hydrotreating reaction takes place inside the reactor, and the hydrotreated product
was sent to the water scrubber for removing ammonia or ammonium sulfide. Liquid and
gas were separated in high pressure gas-liquid separator. The gaseous product is sent to
the H2S scrubber to remove H2S gas and the hydrotreated liquid product was collected

111
from the HP separator. The HDS and HDN activity study of the catalyst were performed
at three temperatures, namely 375, 385 and 395 °C, while keeping pressure 8.9 MPa,
LHSV 1 hr-1, and gas/oil ratio 600 Nm3/m3. The transition samples (first sample) were
collected after 24 hours of changing process condition. The second and third samples
were collected in 12 hours of gap and used for the analysis. The residual gases from the
product samples were removed by N2 stripping. The liquid product was tested for sulfur
and nitrogen content using an Antek 9000 NS analyzer.
3.6 Hydrotreated Product Analysis
3.6.1 S and N Conversion
The concentrations of sulfur and nitrogen compounds present in feed and products
were determined using an Antek 9000 NS analyzer. The sulfur content was measured
using the combustion-fluorescence technique of the ASTM D5463 method. The nitrogen
content of the liquid product was determined by the combustion-chemiluminescence
technique of the ASTM D4629 method. The instrumental error for both N and S analysis
was found to be approximately ±2%, based on analyzing standard solutions of known
composition.
3.6.2 Boiling Point Distribution
To determine the boiling point distribution of the liquid feeds and products, a
simulated distillation ASTM D6352 method was used. The simulated distillation of the
heavy gas oil feed and product liquids was performed using a Varian Model CP 3800 Gas
Chromatograph coupled with a Varian CP 8400 Auto sampler. The components boiling
range were determined using a flame ionization detector (FID). The boiling fractions
were determined by comparing them against a calibration curve.
112
CHAPTER 4
HYDROTREATING OF GAS OIL OVER NiMo/Zr-SBA-15 CATALYSTS
This chapter describes the results of support and catalyst characterizations obtained
for phase-I work. Detailed description of various characterizations methods, such as BET,
SAXS, FT-IR, SEM, TEM, XRD, UV-DRS, and Raman spectroscopy, performed on the
supports and catalysts are elaborated in this chapter. Also, a comparison of the
characteristics of Zr-SBA-15 supports prepared by direct synthesis and post synthesis
method is provided in this chapter. Furthermore, the implication of characterization
results on catalyst performances for HDS and HDN of HGO are described. Also,
evaluation of best method of Zr-SBA-15 support preparation is illustrated in this chapter.
4.1 Characterization of Supports
4.1.1 Small-Angle X-ray Scattering (SAXS)
The small-angle X-ray scattering pattern for parent the SBA-15 shows typical three
well-resolved peaks (Figure 4.1a) that are indexable as (100), (110), and (200) reflections
associated with 2-D hexagonal symmetry (Kruk and Cao, 2007). From Figure 4.1 it is
evident that the Zr-SBA-15 (Post) support prepared by the post synthesis method shows a
similar SAXS pattern as parent SBA-15, implying that the hexagonal order is preserved
after incorporation of ZrO2 on the SBA-15 surface. However, intensity for Zr-SBA-15
(Post) decreases upon incorporation of ZrO2 into the SBA-15 surface, indicating the
slight modification of long-range order of pores of SBA-15 that occurs with ZrO2
loading, which also reported in previous article. The SAXS pattern (Figure 4.1b) for Zr-
SBA-15 support prepared by the direct synthesis method with a Si/Zr atomic ratio of 20
and 40 also exhibits three well-resolved peaks, which indicates that the 2-D hexagonal
structure of SBA-15 is maintained during the synthesis and calcinations of Zr-SBA-15
(Direct).

113
Figure 4.1. Small-angle X-ray scattering (SAXS) pattern of SBA-15 and Zr-SBA-15 (Post) (a); Zr-SBA-15 (Direct) (b) supports.
0
500000
1000000
1500000
2000000
2500000
0.6 1.5 2.4 3.3 4.2 5.1
Inte
nsity
(a.
u.)
2θ (degree)
100
200
110
b
Zr-SBA-15 (Post 23)
Zr-SBA-15 (Post 16)
SBA-15
Zr-SBA-15 (Direct 40)
Zr-SBA-15 (Direct 20)
0
2000000
4000000
6000000
8000000
10000000
12000000
0.6 1.5 2.4 3.3 4.2 5.1
Inte
nsity
(a.u
.)
2θ (degree)
100
110
200
a
SBA-15
Zr-SBA-15 (Post 23)
Zr-SBA-15 (Post 16)
114
4.1.2 N2 Adsorption/Desorption and Chemical Compositions
The textural characteristics and chemical compositions of SBA-15 and Zr-SBA-15
supports are summarized in Table 4.1. Chemical compositions of the support materials
are calculated based on ICP-MS and SEM-EDX characterization results. An example of
SEM-EDX characterization for the Zr-SBA-15 (Post 23) support is shown in the Figure
4.2. From the result of textural characteristics it is evident that there is a decrease in the
surface area and the pore diameter of SBA-15 upon the incorporation of zirconia in the
SBA-15 framework by post synthesis method, which is also observed by other
researchers (Gutiérrez et al., 2006a). However, no significant surface area and pore
volume reduction was observed for the Zr-SBA-15 (Direct) sample prepared by the direct
synthesis method. This trend indicates that the Zr species is incorporated in silica
framework for the direct synthesis method (Chen et al., 2004). Furthermore, it is
observed that the Zr-SBA-15 supports of larger pore diameter can be obtained by the post
synthesis method. Figure 4.3 shows the nitrogen adsorption-desorption isotherm for
SBA-15, Zr-SBA-15 (Post) and Zr-SBA-15 (Direct) supports. SBA-15, Zr-SBA-15
(Post), and Zr-SBA-15 (Direct) support samples exhibit a type-IV isotherm with a
hysteresis loop, which correspond to hexagonal pore system generally reported for
mesoporous SBA-15 and Zr-SBA-15 materials (Garg et al., 2008; Gutiérrez et al., 2006a;
Kruk and Cao, 2007). It is evident from Figure 4.3a that the height of the hysteresis loop
decreases with the increase in ZrO2 loading on SBA-15 prepared by the post synthesis
method, which also reported in previous literature. A similar trend is observed for the Zr-
SBA-15 (Direct) support with the increase in Zr loading (Figure 4.3b).

115
Table 4.1. Textural characteristics and chemical compositions of support materials.
Figure 4.2. EDX pattern of Zr-SBA-15 (Post 23) support.
Support Achieved ZrO2 (or Zr) Content
Surface Area, SBET (m2/g)
Pore Volume, VP (cm3/g)
Average Pore Dia., DP (nm)
SBA-15 - 471 1.44 12.2
Zr-SBA-15(Post 16) ZrO2 wt% = 16.0 416 1.12 10.8
Zr-SBA-15(Post 23) ZrO2 wt% = 23.9 402 1.02 10.1
Zr-SBA-15(Direct 40) Si/Zr Ratio = 39.7 982 1.36 6.2
Zr-SBA-15(Direct 20) Si/Zr Ratio = 22.0 790 1.31 6.6
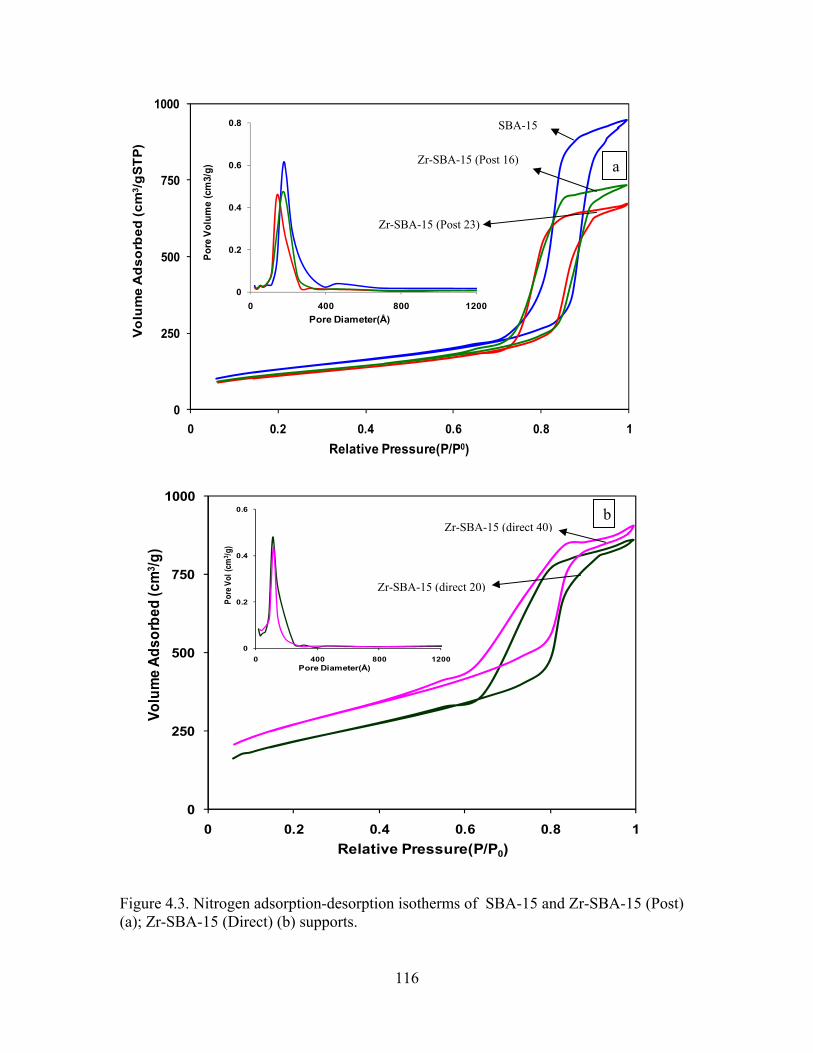
116
0
250
500
750
1000
0 0.2 0.4 0.6 0.8 1
Volu
me
Ads
orbe
d (c
m3 /g
STP)
Relative Pressure(P/P0)
0
0.2
0.4
0.6
0.8
0 400 800 1200
Pore
Vol
ume
(cm
3/g)
Pore Diameter(Å)
0
250
500
750
1000
0 0.2 0.4 0.6 0.8 1
Volu
me
Ads
orbe
d (c
m3 /g
STP)
Relative Pressure(P/P0)
0
0.2
0.4
0.6
0.8
0 400 800 1200
Pore
Vol
ume
(cm
3/g)
Pore Diameter(Å)
SBA-15
Zr-SBA-15 (Post 16)
Zr-SBA-15 (Post 23)
Figure 4.3. Nitrogen adsorption-desorption isotherms of SBA-15 and Zr-SBA-15 (Post) (a); Zr-SBA-15 (Direct) (b) supports.
0
250
500
750
1000
0 0.2 0.4 0.6 0.8 1
Volu
me
Adso
rbed
(cm
3 /g)
Relative Pressure(P/P0)
0
0.2
0.4
0.6
0 400 800 1200
Pore
Vol
(cm
3 /g)
Pore Diameter(Å)
0
250
500
750
1000
0 0.2 0.4 0.6 0.8 1
Volu
me
Adso
rbed
(cm
3 /g)
Relative Pressure(P/P0)
0
0.2
0.4
0.6
0 400 800 1200
Pore
Vol
(cm
3 /g)
Pore Diameter(Å)
Zr-SBA-15 (direct 40)
Zr-SBA-15 (direct 20)
a
b
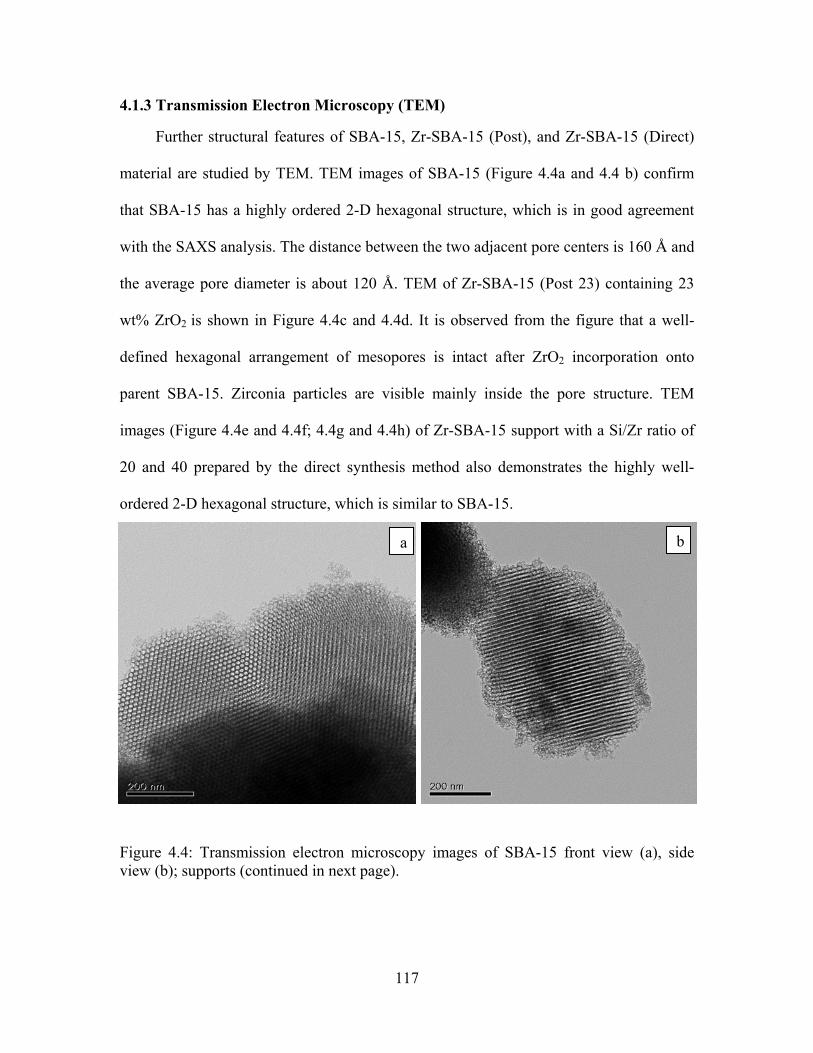
117
4.1.3 Transmission Electron Microscopy (TEM)
Further structural features of SBA-15, Zr-SBA-15 (Post), and Zr-SBA-15 (Direct)
material are studied by TEM. TEM images of SBA-15 (Figure 4.4a and 4.4 b) confirm
that SBA-15 has a highly ordered 2-D hexagonal structure, which is in good agreement
with the SAXS analysis. The distance between the two adjacent pore centers is 160 Å and
the average pore diameter is about 120 Å. TEM of Zr-SBA-15 (Post 23) containing 23
wt% ZrO2 is shown in Figure 4.4c and 4.4d. It is observed from the figure that a well-
defined hexagonal arrangement of mesopores is intact after ZrO2 incorporation onto
parent SBA-15. Zirconia particles are visible mainly inside the pore structure. TEM
images (Figure 4.4e and 4.4f; 4.4g and 4.4h) of Zr-SBA-15 support with a Si/Zr ratio of
20 and 40 prepared by the direct synthesis method also demonstrates the highly well-
ordered 2-D hexagonal structure, which is similar to SBA-15.
Figure 4.4: Transmission electron microscopy images of SBA-15 front view (a), side view (b); supports (continued in next page).
a b

118
Figure 4.4: Transmission electron microscopy images of Zr-SBA-15 (Post 23) front view (c), side view (d); Zr-SBA-15 (Direct 20) front view (e), side view (f); Zr-SBA-15 (Direct 40) front view (g), side view (h) supports.
c d
e
gh
f

119
4.1.4 Scanning Electron Microscopy (SEM)
The morphology and structure of SBA-15 and Zr-SBA-15 supports are investigated
by SEM. SEM micrograph of calcined SBA-15 is shown in Figure 4.5a and 4.5b. The
SEM image exhibits fiberlike uniform cylindrical morphology, which is in good
agreement with previous articles (Eswaramoorthi et al., 2008; Landau et al., 2005; Liu et
al., 2004) . The SEM image of Zr-SBA-15 (Post) prepared by the post synthesis method
reveals that the morphology of the sample is preserved after the zirconia impregnation.
Zr-SBA-15 support prepared by direct synthesis method also displays the similar
fiberlike cylindrical image as observed in parent SBA-15.
4.1.5 Fourier Transform Infrared Spectroscopy (FTIR)
FTIR spectroscopy was utilized to verify the nature of Zr species incorporated into
the SBA-15 framework. FTIR spectra of calcined SBA-15, Zr-SBA-15 (Direct), and Zr-
SBA-15 (Post) supports are shown in Figure 4.6. All support samples exhibit broad band
at 1220-1070 cm-1 corresponding to Si-O-Si vibration (Bhaumik et al., 2004). A weaker
band observed at 803 cm-1 is due to Si-O-Si symmetric stretching, and a strong band
identified at 465 cm-1 is due to vibration of Si-O-Si (Gómez-Cazalilla et al., 2007). For
Zr-SBA-15 (Direct) support the strong band observed at 966 cm-1 can be attributed to the
Si-O-Zr vibration, which validates the Zr incorporation into SBA-15 framework
effectively (Dang et al., 1995; Ferrer et al., 2009). However, in the pure SBA-15, the
band at 966 cm-1 is absent. For Zr-SBA-15 (Direct) supports, as the Si/Zr ratio decreases,
the intensity of the band at 966 cm-1 increases (Salas et al., 2009). This can be explained
by the fact that with the decrease in the Si/Zr ratio, there is a substitution of silicon ion by
zirconium ion in the Zr-SBA-15 framework, which results in an increase in the number of
the Zr-O-Si bonds (Salas et al., 2009). Similarly, Zr-SBA-15 (Post) support exhibits the
broad band at 1220-1070 cm-1, a moderately strong band at 966 cm-1, a weaker band at
800 cm-1 and a strong band at 460 cm-1. The presence of the 966 cm-1 band indicates that
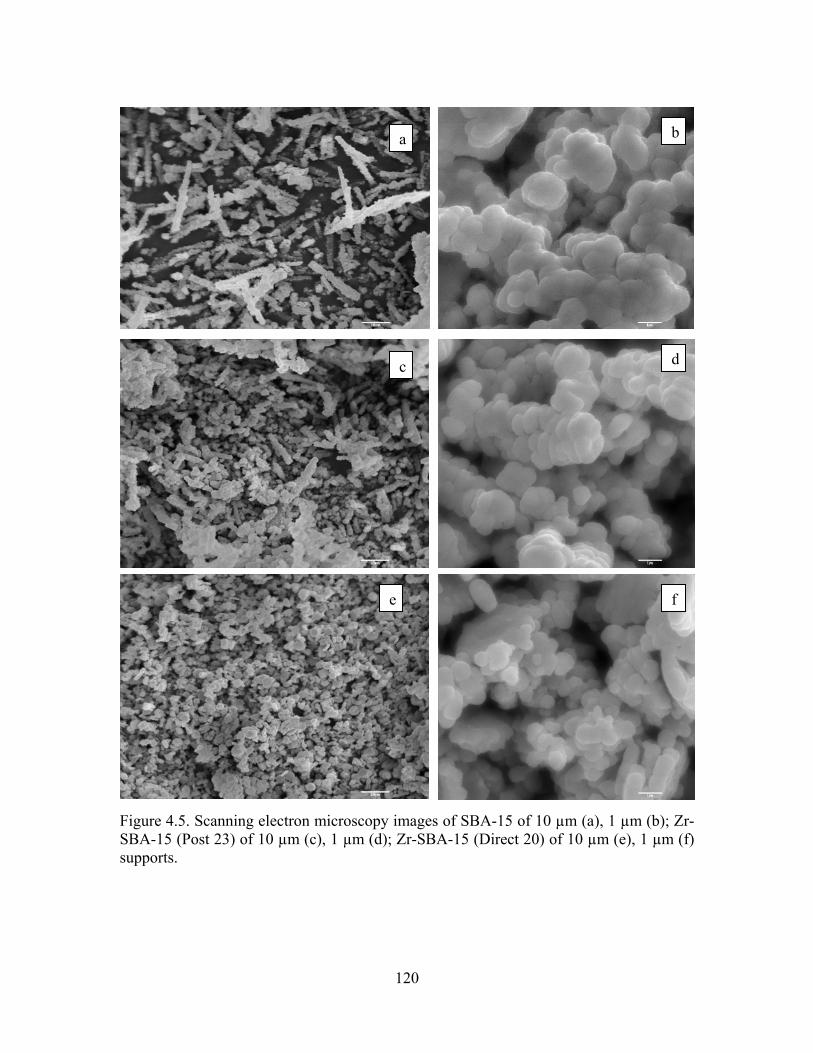
120
Figure 4.5. Scanning electron microscopy images of SBA-15 of 10 µm (a), 1 µm (b); Zr-SBA-15 (Post 23) of 10 µm (c), 1 µm (d); Zr-SBA-15 (Direct 20) of 10 µm (e), 1 µm (f) supports.
a b
e
d
f
c
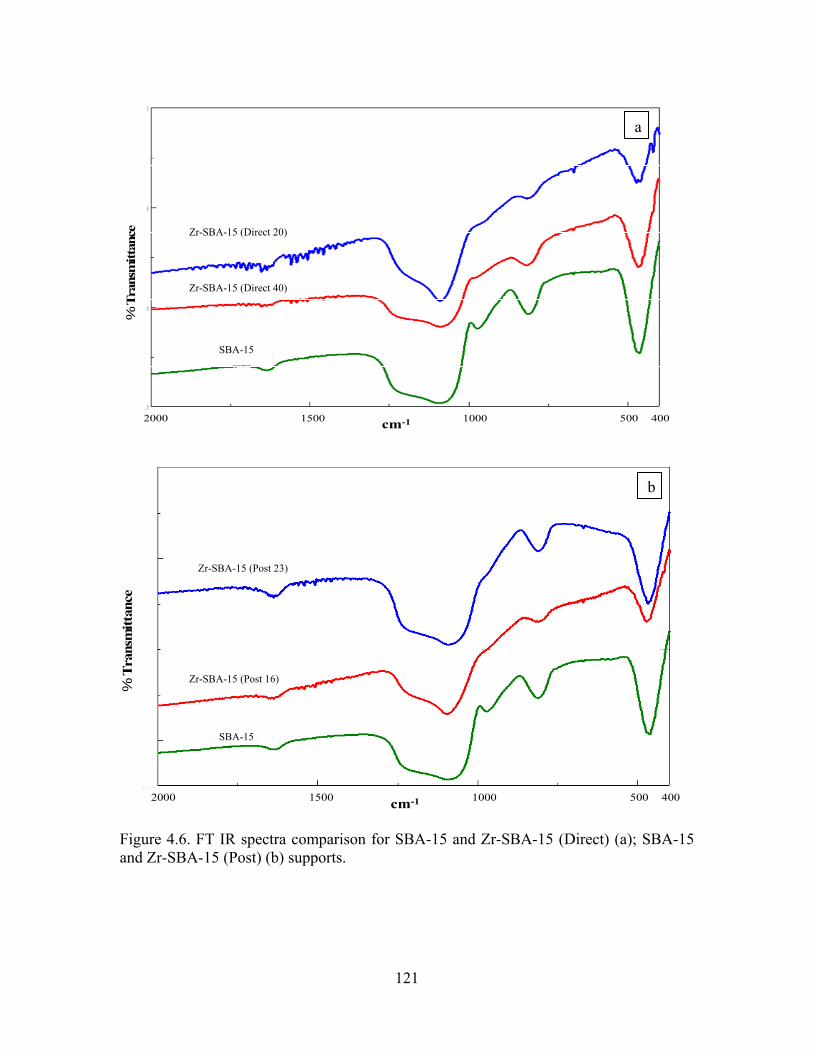
121
Figure 4.6. FT IR spectra comparison for SBA-15 and Zr-SBA-15 (Direct) (a); SBA-15 and Zr-SBA-15 (Post) (b) supports.
2000 1500 1000 500 400cm-1
% T
rans
mitt
ance
2000 1500 1000 500 400cm-1
% T
rans
mitt
ance
2000 1500 1000 500 400cm-1
% T
rans
mitt
ance
2000 1500 1000 500 400cm-1
% T
rans
mitt
ance
a
b
Zr-SBA-15 (Direct 20)
Zr-SBA-15 (Direct 40)
SBA-15
Zr-SBA-15 (Post 23)
Zr-SBA-15 (Post 16)
SBA-15

122
for the Zr-SBA-15 (Post) support there must be a chemical attachment of ZrO2 to the
SBA-15 framework (Dang et al., 1995). There is an increase in intensity of the 966 cm-1
band due to the incorporation of higher zirconia by the post synthesis method, indicating
the increment of Zr-O-Si linkage due to an increase of ZrO2 loading on the SBA-15
framework.
4.1.6 Pyridine Adsorbed Fourier Transform Infrared Spectroscopy (Py-IR)
To examine the type of surface acidity of the supports, pyridine adsorption of the
support materials was performed. Figure 4.7 shows the FTIR spectra of pyridine
adsorption SBA-15 and Zr-SBA-15 (Direct), and Zr-SBA-15 (Post) supports. All support
samples show the characteristic bands at 1450 cm-1 (strong), 1480 cm-1 (strong), 1580
cm-1(weak), and 1609 cm-1(weak), which correspond to the pyridine adsorbed on Lewis
acid sites (Chen et al., 2006; Kemdeo et al., 2010; Nava et al., 2007). A band appeared at
1540 cm-1, indicating the creation of the Brønsted acid sites in all Zr-SBA-15 samples. In
addition, for all the Zr-SBA-15 samples, bands at 1490 cm-1 can be associated with
pyridine adsorbed on both Lewis and Brønsted acid sites (Chen et al., 2006). In pure
SBA-15 support, the bands corresponding to the Lewis acid sites at 1450 cm-1, 1624 cm-1
and 1580 cm-1 are observed. However, no band is observed at 1540 cm-1 and 1490 cm-1.
Hence, it can be concluded that the Brønsted acid sites were generated due to the
presence of Zr and ZrO2 in SBA-15 support during direct synthesis and post synthesis Zr-
SBA-15 supports, respectively. For Zr-SBA-15 (Direct) support, the intensity bands for
Brønsted acidity increases with increasing Zr content in SBA-15. Similarly, for the Zr-
SBA-15 (Post) supports, the intensity of Brønsted acid sites has increased with the
increasing of ZrO2 onto the SBA-15 surface. Hence, the highest Brønsted acidity peak is
observed for the Zr-SBA-15 (Post 23) support loaded with 23wt% of zirconia.
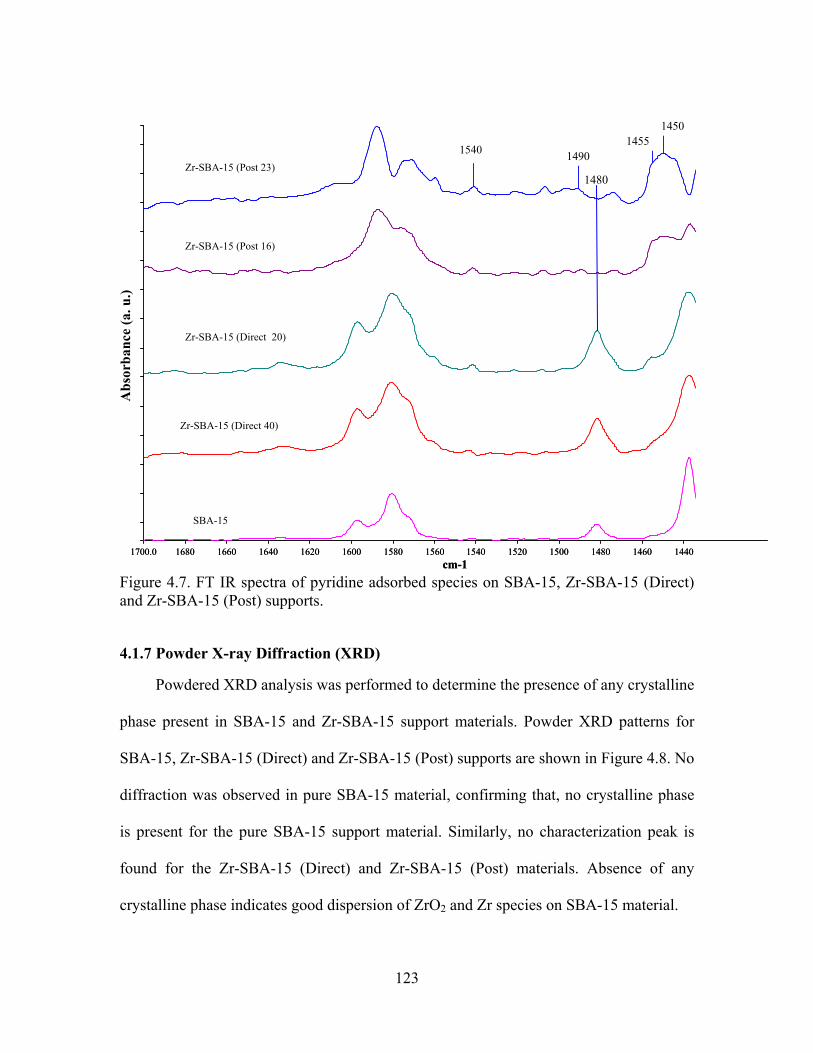
123
Figure 4.7. FT IR spectra of pyridine adsorbed species on SBA-15, Zr-SBA-15 (Direct) and Zr-SBA-15 (Post) supports.
4.1.7 Powder X-ray Diffraction (XRD)
Powdered XRD analysis was performed to determine the presence of any crystalline
phase present in SBA-15 and Zr-SBA-15 support materials. Powder XRD patterns for
SBA-15, Zr-SBA-15 (Direct) and Zr-SBA-15 (Post) supports are shown in Figure 4.8. No
diffraction was observed in pure SBA-15 material, confirming that, no crystalline phase
is present for the pure SBA-15 support material. Similarly, no characterization peak is
found for the Zr-SBA-15 (Direct) and Zr-SBA-15 (Post) materials. Absence of any
crystalline phase indicates good dispersion of ZrO2 and Zr species on SBA-15 material.
1700.0 1680 1660 1640 1620 1600 1580 1560 1540 1520 1500 1480 1460 1440cm-1
A
15411490
1455
1450
1541 1490
14501455
Abs
orba
nce
(a. u
.)
1700.0 1680 1660 1640 1620 1600 1580 1560 1540 1520 1500 1480 1460 1440cm-1
A
15411490
1455
1450
1541 1490
14501455
Abs
orba
nce
(a. u
.)
Zr-SBA-15 (Post 23)
Zr-SBA-15 (Post 16)
SBA-15
Zr-SBA-15 (Direct 40)
Zr-SBA-15 (Direct 20)
1540
1480

124
Figure 4.8. Powder XRD pattern of SBA-15; Zr-SBA-15 (Direct 40); Zr-SBA-15 (Direct 20); Zr-SBA-15 (Post 16); Zr-SBA-15 (Post 23) supports.
Zr-SBA-15 (Post 23)
Zr-SBA-15 (Post 16)
SBA-15
Zr-SBA-15 (Direct 40)
Zr-SBA-15 (Direct 20)
0
200
400
600
800
1000
1200
10 20 30 40 50 60 70 802θ (degree)
Inte
nsity
(a.u
.)

125
0
500000
1000000
1500000
2000000
2500000
3000000
3500000
0.5 1.5 2.5 3.5 4.5
Inte
nsity
(a.u
.)
2θ
4.2 Characterization of catalysts
4.2.1 Small-Angle X-ray Scattering (SAXS)
The small-angle X-ray scattering spectra (Figure 4.9) for NiMo catalysts show
similar patterns corresponding to that of the support material. These data show that the
three characteristic peaks of hexagonal structure (100), (110), and (200) are preserved,
which are associated with the well-ordered hexagonal structure. However, a mild
reduction of peak intensities is observed in SBA-15, Zr-SBA-15 (Post), and Zr-SBA-15
(Direct) supports due to the addition of metal to the support materials, indicating a mild
reduction of hexagonal long-range periodicity of SBA-15 and Zr-SBA-15 support
materials upon the metals incorporation.
Figure 4.9. Small-angle X-ray scattering pattern of NiMo catalysts supported on SBA-15, Zr-SBA-15 (Direct) and Zr-SBA-15 (Post) supports.
NiMo/Zr-SBA-15 (Direct 20)
NiMo/SBA-15
NiMo/Zr-SBA-15 (Post 23)
126
4.2.2 N2 Adsorption/Desorption and Chemical Compositions
The textural characteristics and chemical compositions of NiMo catalysts supported
on SBA-15 and Zr-SBA-15 supports are summarized in Table 4.2. Chemical
compositions of the catalysts are calculated based on ICP-MS and SEM-EDX
characterization results. Example of SEM-EDX characterization for the NiMo/Zr-SBA-
15 (Post 23) catalyst is shown in the Figure 4.10. It is observed that for all catalysts, the
achieved Mo and Ni concentration are lower than those of targeted ones. This
discrepancy can be attributed to the diffusion limitations of Mo and Ni occurs during
catalyst preparation or the inherent nature of these elements to form considerable metal
vacancies (Jacobsen et al., 1995; Yu et al., 1998). The results of textural characteristics of
the catalysts show that there is a decrease in specific surface area and pore volume for all
the catalyst samples due to loading of NiO and MoO3. Also, metal oxide addition
produces a minor decrease in pore diameter, indicating a relatively large pore plugging
due to the incorporation of metal oxide. It can be observed that NiMo catalysts supported
on Zr-SBA-15 material prepared by the post synthesis method provides larger pore
diameter compared to the Zr-SBA-15 support prepared by the direct synthesis method.
Figure 4.11 shows the nitrogen adsorption-desorption isotherm for NiMo catalyst
supported on pure SBA-15, Zr-SBA-15 (Post) and Zr-SBA-15 (Direct) supports. All
catalyst samples exhibit a type-IV isotherms with a hysteresis loop, which indicates that
all isotherms preserved the characteristic shape of the SBA-15 and Zr-SBA-15
mesoporous materials, even after metal loading onto SBA-15 and Zr-SBA-15 supports.

127
Table 4.2: Textural characteristics and chemical compositions of catalysts materials.
Figure 4.10: EDX pattern for NiMo/Zr-SBA-15 (Post 23) catalyst
Catalyst Targeted/ Achived
Mo Content (wt%)
Targeted/ Achieved
Ni Content (wt%)
Surface Area, SBET
(m2/g)
Pore Vol.e, VP (cm3/g)
Av. Pore Dia., DP
(nm)
NiMo/SBA-15 12 / 11.4 2.4 / 2.1 333 0.96 11.4
NiMo/Zr-SBA-15(Post 16) 12 / 11.5 2.4 / 2.4 298 0.78 10.7
NiMo/Zr-SBA-15(Post 23) 12 / 10.2 2.4 / 2.1 281 0.71 10.1
NiMo/Zr-SBA-15(Direct 40) 12 / 11.6 2.4 / 2.1 532 0.80 6
NiMo/Zr-SBA-15(Direct 20) 12 / 11.3 2.4 / 2.2 481 0.80 6.6

128
0
250
500
750
0 0.2 0.4 0.6 0.8 1
Volu
me A
dsor
bed
(cm
3 /g S
TP)
Relative Pressure(P/P0)
0
0.2
0.4
0 400 800 1200
Pore
Vol
ume (
cm3 /g
)
Pore Diameter(Å)
0
250
500
750
0 0.2 0.4 0.6 0.8 1
Volu
me A
dsor
bed
(cm
3 /g S
TP)
Relative Pressure(P/P0)
0
0.2
0.4
0 400 800 1200
Pore
Vol
ume (
cm3 /g
)
Pore Diameter(Å)
0
250
500
750
0 0.2 0.4 0.6 0.8 1
Volu
me
Ads
orbe
d (c
m3 /g
STP)
Relative Pressure(P/P0)
0
0.2
0.4
0.6
0 400 800 1200
Pore
Vol
ume
(cm
3 /g)
Pore Diameter (Å)
0
250
500
750
0 0.2 0.4 0.6 0.8 1
Volu
me
Ads
orbe
d (c
m3 /g
STP)
Relative Pressure(P/P0)
0
0.2
0.4
0.6
0 400 800 1200
Pore
Vol
ume
(cm
3 /g)
Pore Diameter (Å)
Figure 4.11 Nitrogen adsorption-desorption isotherm of NiMo catalyst supported on SBA-15 and Zr-SBA-15 (Post) (a); Zr-SBA-15 (Direct ) (b).
NiMo/Zr-SBA-15 (Direct 40)
NiMo/Zr-SBA-15 (Direct 20)
NiMo/Zr-SBA-15 (Post 23)
NiMo/Zr-SBA-15 (Post 16)
NiMo/SBA-15
a
b

129
4.2.3 Transmission Electron Microscopy (TEM)
TEM images of NiMo/SBA-15, NiMo/Zr-SBA-15 (Post), and NiMo/Zr-SBA-15
(Direct) catalysts are presented Figure 4.12a/b/c/d/e/f. All catalyst samples display
uniform and long-range ordered structure, implying that the structural integrity of support
remains intact even after incorporation of metal on SBA-15 and Zr-SBA-15 materials.
From the TEM images, hexagonal structures (front view) and cylindrical pores (side
view) of the catalysts are observed, which are similar to the corresponding supports
materials.
4.2.4 Powder X-ray Diffraction (XRD)
Powdered XRD analysis was performed to determine the presence of any crystalline
phases present in the NiMo/SBA-15 and NiMo/Zr-SBA-15 catalysts. Powder XRD
patterns for the NiMo catalysts supported on SBA-15, Zr-SBA-15 (Direct), and Zr-SBA-
15 (Post) supports are shown in Figure 4.13. Diffraction due to the crystalline MoO3
phase (JCPDS card 35-609 and JCPDS card 05-0508) (Gutiérrez et al., 2006a; Gutiérrez
et al., 2009; Li et al., 2006) is observed for the NiMo catalysts supported on pure SBA-15
and Zr-SBA-15 (Direct) supports. However, XRD reflections of the crystalline MoO3
phase disappear for the NiMo catalysts supported on Zr-SBA-15 (Post) supports prepared
by the post synthesis method. Disappearance of XRD reflection for these catalysts
indicates good dispersion of nickel and molybdenum oxide due to an increase in zirconia
loading on the pure SBA-15 support. The NiMo catalyst supported on Zr-SBA-15 with
23 wt% ZrO2 loading shows excellent dispersion of MoO3 species.

130
Figure 4.12. Transmission electron microscopy images of NiMo catalyst supported on SBA-15 front view (a), side view (b); Zr-SBA-15 (Post 23) front view (c), side view (d); Zr-SBA-15 (Direct 20) front view (e), side view (f).
ef
a b
c d

131
Figure 4.13. Powder X-ray diffraction patterns of NiMo catalysts supported on SBA-15, Zr-SBA-15 (Direct) and Zr-SBA-15 (Post) supports. * represents MoO3 peaks (JCPDS card 35-609 and JCPDS card 05-0508).
4.2.5 Raman Spectroscopy
To investigate the nature of molybdenum oxide phases present on the Zr-SBA-15
support, Raman spectroscopy was employed. The Raman spectra of SBA-15, Zr-SBA-15
(Direct), and Zr-SBA-15 (Post) supported NiMo catalysts are shown in Figure 4.14. All
spectra exhibit Raman bands at 285.5, 335.5, 377, 663, 816.5, 945, and 991 cm-1. The
bands at 285.5, 335.5, 663, 816.5 and 991 cm-1 are attributed to the crystalline MoO3
particles (Ferdous et al., 2007; Sigurdson et al., 2008). The bands at 377 and 945 cm-1
were assigned to the Mo=O bending vibration (Ferdous et al., 2007; Montesinos-
Castellanos and Zepeda, 2008). The intensity band due to MoO3 particles is strong for the
NiMo catalyst supported on pure SBA-15. However, the intensity of these bands
decreases with the incorporation of Zr species (Zr or zirconia) in NiMo catalyst. This
trend is in agreement with the powder XRD results. Hence, it can be concluded that the
NiMo/SBA-15
NiMo/Zr-SBA-15 (Post 23)
NiMo/Zr-SBA-15 (Direct 40)
NiMo/Zr-SBA-15 (Direct 20)
NiMo/Zr-SBA-15 (Post 16)

132
incorporation of the zirconia into the SBA-15 support [Zr-SBA-15 (Post)] increases the
interaction of an active component (Mo) with the support material. A similar trend is
observed for the NiMo catalyst supported on Zr-SBA-15 (Direct) supports.
Figure 4.14. Raman spectra comparison for NiMo catalyst supported on SBA-15 and Zr-SBA-15 (Direct) (a); supported on SBA-15 and Zr-SBA-15 (Post) (b) support.
NiMo/SBA-15
NiMo/Zr-SBA-15 (Direct 40)
NiMo/Zr-SBA-15 (Direct 20)
NiMo/SBA-15
NiMo/Zr-SBA-15 (Post 16)
NiMo/Zr-SBA-15 (Post 23)
a
b
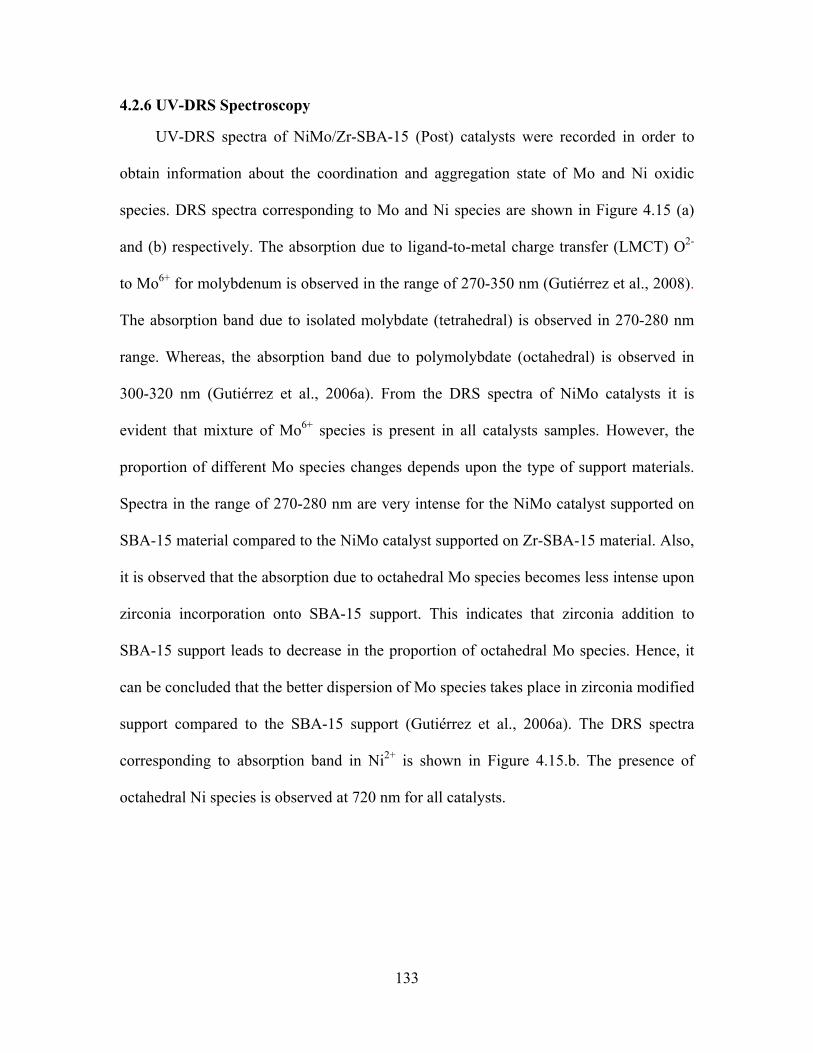
133
4.2.6 UV-DRS Spectroscopy
UV-DRS spectra of NiMo/Zr-SBA-15 (Post) catalysts were recorded in order to
obtain information about the coordination and aggregation state of Mo and Ni oxidic
species. DRS spectra corresponding to Mo and Ni species are shown in Figure 4.15 (a)
and (b) respectively. The absorption due to ligand-to-metal charge transfer (LMCT) O2-
to Mo6+ for molybdenum is observed in the range of 270-350 nm (Gutiérrez et al., 2008).
The absorption band due to isolated molybdate (tetrahedral) is observed in 270-280 nm
range. Whereas, the absorption band due to polymolybdate (octahedral) is observed in
300-320 nm (Gutiérrez et al., 2006a). From the DRS spectra of NiMo catalysts it is
evident that mixture of Mo6+ species is present in all catalysts samples. However, the
proportion of different Mo species changes depends upon the type of support materials.
Spectra in the range of 270-280 nm are very intense for the NiMo catalyst supported on
SBA-15 material compared to the NiMo catalyst supported on Zr-SBA-15 material. Also,
it is observed that the absorption due to octahedral Mo species becomes less intense upon
zirconia incorporation onto SBA-15 support. This indicates that zirconia addition to
SBA-15 support leads to decrease in the proportion of octahedral Mo species. Hence, it
can be concluded that the better dispersion of Mo species takes place in zirconia modified
support compared to the SBA-15 support (Gutiérrez et al., 2006a). The DRS spectra
corresponding to absorption band in Ni2+ is shown in Figure 4.15.b. The presence of
octahedral Ni species is observed at 720 nm for all catalysts.
134
0
1
2
3
4
5
400 450 500 550 600 650 700 750 800
F (R
)
Wavelength (nm)
NiMo/Zr-SBA-15 (post 16)
NiMo/Zr-SBA-15 (post 22)
NiMo/SBA-15
0
20
40
60
80
100
270 330 390 450 510 570
F (R
)
Wavelength (nm)
NiMo/Zr-SBA-15 (post 16)
NiMo/Zr-SBA-15 (post 22)
NiMo/SBA-15
Figure 4.15. UV-DRS spectra of NiMo catalysts supported on SBA-15 and Zr-SBA-15 (Post 16) and Zr-SBA-15 (Post 23) support absorption band due to Mo (a); Ni (b).
a
b

135
4.3 Catalytic Activity Performance Based on HDS and HDN
In the present study, the performance of all catalysts was evaluated based on
hydrodesulfurization (HDS) and hydrodenitrogenation (HDN) activities exhibited during
hydrotreatment of heavy gas oil (HGO) derived from Athabasca bitumen. In a typical
run, 5 ml of catalyst was loaded in the reactor, and sulfidation of catalyst was carried out
for 48 hrs. The sulfided catalyst was then precoked (stabilized) using HGO for 5 days (T
= 370˚C, P=8.9 MPa, LHSV = 1.0 h-1, gas-to-oil ratio = 600 Nm3/m3). From the catalyst
stabilization study (Figure 4.16) it was evident that the HDS and HDN activity decrease
with time for an initial two days due to the coke deposition on catalyst surface and then
level out.
Hydrotreating of gas oil was carried out for three different temperatures, namely
375˚C, 385˚C, and 395˚C. As seen from Figure 4.17, the HDS and HDN activities of
NiMo catalysts supported on Zr-SBA-15 are higher than that of the catalysts supported
on pure SBA-15. This higher hydrotreating activity of NiMo/Zr-SBA-15 catalysts may be
due to the better dispersion of Mo active species (as seen in XRD and UV-DRS data),
good metal-support interaction (as seen in Raman spectra), and higher acidity (as
observed by FT-IR of pyridine adsorption) compared to those that of the NiMo/SBA-15
catalyst. A similar trend in HDS activity was observed for the hydrotreating of model
compounds over NiMo/Zr-SBA-15 catalysts and the NiMo/SBA-15 catalyst (Gutiérrez et
al., 2006a; Gutiérrez et al., 2008).
In the case of all Zr-SBA-15 supported catalysts, the NiMo catalyst supported on
Zr-SBA-15 (Post) prepared by the post synthesis method shows significantly higher HDS
and HDN activities compared to the NiMo/Zr-SBA-15 (Direct) catalysts, prepared by the
136
direct synthesis method. This can be attributed to the better textural characteristics
(higher pore diameter), higher zirconia loading, and higher acidity of NiMo/Zr-SBA-15
(Post) catalysts than that of NiMo/Zr-SBA-15 (Direct) catalysts. It is interesting to note
that the hydrotreating activities of NiMo/Zr-SBA-15 (Direct) catalysts are lower, in spite
of the higher surface area compared to NiMo/Zr-SBA-15 (Post) catalysts, indicating that
the higher pore diameter plays an important role in avoiding excessive pore blockage
during the hydrotreating of heavy gas oil feedstock, which contains many refractory
sulfur and nitrogen compounds in significant quantities (Bej et al., 2001; Ferdous et al.,
2006b).
It can be observed that among NiMo catalysts supported over Zr-SBA-15 (Direct)
material, support with a Si/Zr ratio of 20 exhibits higher HDS and HDN activities than
that of the support with a Si/Zr ratio of 40. This trend may be attributed to the better
structural ordering, better dispersion of Mo species, and higher acidity due to higher Zr
content in Zr-SBA-15 (Direct 20) support compared to the Zr-SBA-15 (Direct 40)
support. Furthermore, the NiMo catalyst supported on the Zr-SBA-15 support with
23wt% zirconia loading shows higher hydrotreating activity compared to the Zr-SBA-15
support with 16 wt% zirconia loading. An increase in zirconia loading on the SBA-15
structure results in well-dispersed ZrO2 species and higher acidity on the surface of SBA-
15, leading to higher HDS and HDN activities. This trend has been reported by other
researchers for HDS of 4,6-DMDBT (Gutiérrez et al., 2006b; Gutiérrez et al., 2008). The
results of the comparative study show that the NiMo/Zr-SBA-15 (Post 23) catalyst has
maximum HDS and HDN activities compared to all other NiMo/Zr-SBA-15 catalysts as
well as the NiMo catalyst supported on SBA-15.
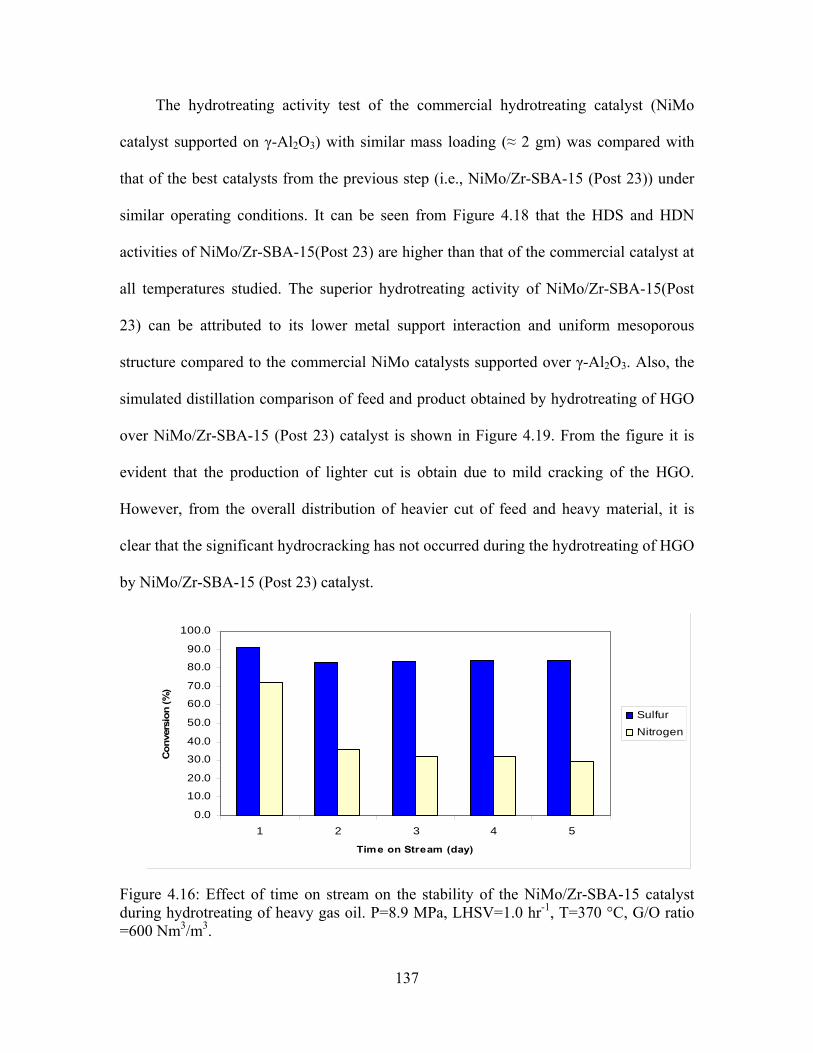
137
0.0
10.0
20.0
30.0
40.0
50.0
60.0
70.0
80.0
90.0
100.0
1 2 3 4 5
Time on Stream (day)
Con
vers
ion
(%)
Sulfur
Nitrogen
The hydrotreating activity test of the commercial hydrotreating catalyst (NiMo
catalyst supported on γ-Al2O3) with similar mass loading (≈ 2 gm) was compared with
that of the best catalysts from the previous step (i.e., NiMo/Zr-SBA-15 (Post 23)) under
similar operating conditions. It can be seen from Figure 4.18 that the HDS and HDN
activities of NiMo/Zr-SBA-15(Post 23) are higher than that of the commercial catalyst at
all temperatures studied. The superior hydrotreating activity of NiMo/Zr-SBA-15(Post
23) can be attributed to its lower metal support interaction and uniform mesoporous
structure compared to the commercial NiMo catalysts supported over γ-Al2O3. Also, the
simulated distillation comparison of feed and product obtained by hydrotreating of HGO
over NiMo/Zr-SBA-15 (Post 23) catalyst is shown in Figure 4.19. From the figure it is
evident that the production of lighter cut is obtain due to mild cracking of the HGO.
However, from the overall distribution of heavier cut of feed and heavy material, it is
clear that the significant hydrocracking has not occurred during the hydrotreating of HGO
by NiMo/Zr-SBA-15 (Post 23) catalyst.
Figure 4.16: Effect of time on stream on the stability of the NiMo/Zr-SBA-15 catalyst during hydrotreating of heavy gas oil. P=8.9 MPa, LHSV=1.0 hr-1, T=370 °C, G/O ratio =600 Nm3/m3.

138
0
10
20
30
40
50
60
70
80
90
100
375 385 395
Sulfu
r Con
versi
on (%
)
Temperature (0C)
HDS
NiMo/Zr-SBA-15 (Post 23)
NiMo/Zr-SBA-15(Post 16)
NiMo/Zr-SBA-15(Direct 20)
NiMo/Zr-SBA-15(Direct 40)
NiMo/SBA-15
0
10
20
30
40
50
60
70
375 385 395
Nitro
gen C
onve
rsion
(%)
Temperature (0C)
HDN
NiMo/Zr-SBA-15 (Post 23)NiMo/Zr-SBA-15(Post 16)NiMo/Zr-SBA-15(Direct 20)NiMo/Zr-SBA-15(Direct 40) NiMo/SBA-15
Figure 4.17. The hydrodesulfurization and hydrodenitrogenation activity (volume basis) study of NiMo catalysts supported on SBA-15, Zr-SBA-15 (Post) and Zr-SBA-15 (Direct); T = 375/385/395 °C, P=8.9 MPa, LHSV = 1 h-1, H2/HC ratio 600 Nm3/m3. HDS (a); HDN (b)
b
a

139
0
20
40
60
80
100
375 385 395
Sulfu
r Con
vers
ion
(%)
Temperature (0C)
HDS
NiMo/Zr-SBA-15 (Post 23)
Commercial Catalyst
0
20
40
60
80
375 385 395
Nitr
ogen
Con
vers
ion
(%)
Temperature (0C)
HDN
NiMo/Zr-SBA-15 (Post 23)
Commercial Catalyst
Figure 4.18. The hydrotreating activity ( weight basis) comparison of NiMo/Zr-SBA-15 (Post 23) and commercial catalyst; T = 375/385/395 °C, P=8.9 MPa, LHSV = 1 h-1, H2/HC ratio 600 Nm3/m3. HDS (a); HDN (b).
a
b
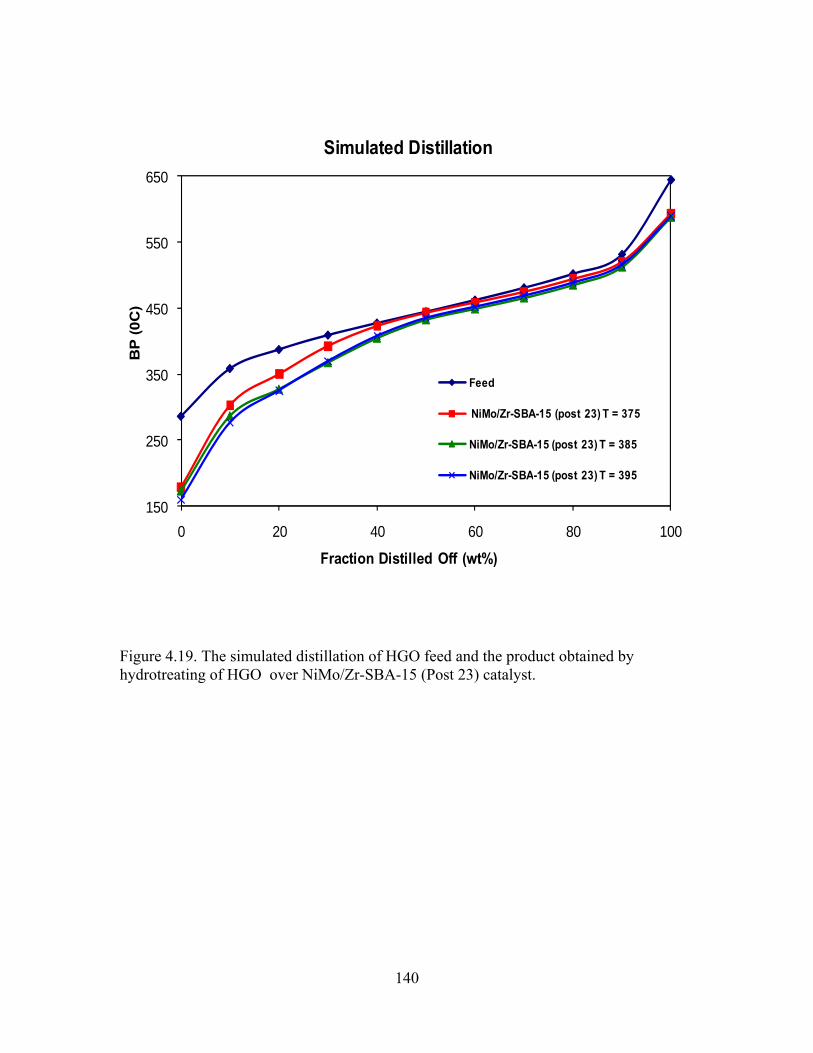
140
150
250
350
450
550
650
0 20 40 60 80 100
BP
(0C
)
Fraction Distilled Off (wt%)
Simulated Distillation
Feed
NiMo/Zr-SBA-15 (post 23) T = 375
NiMo/Zr-SBA-15 (post 23) T = 385
NiMo/Zr-SBA-15 (post 23) T = 395
Figure 4.19. The simulated distillation of HGO feed and the product obtained by hydrotreating of HGO over NiMo/Zr-SBA-15 (Post 23) catalyst.

141
CHAPTER 5
METAL LOADING OPTIMIZATION FOR NiMo/Zr-SBA-15 CATALYSTS
This chapter describes the results of support and catalyst characterizations obtained
for phase-II work. Detailed description of various characterizations methods, such as
BET, SASX, FT-IR, SEM, TEM, XRD, UV-DRS, Raman etc, performed on supports and
catalyst are elaborated in this section. Also, a comparison of catalysts with different metal
loading illustrated in this chapter. Furthermore, determination of best catalyst is described
based on catalyst characterization results and HDS and HDN activity performances on
heavy gas oil.
5.1 Characterization of Supports
5.1.1 Small-Angle X-ray Scattering (SAXS)
The small-angle X-ray scattering (SAXS) pattern of calcined parent SBA-15 and
Zr-SBA-15 (Post 23) are shown in Figure 5.1. Both the samples displayed three well-
resolved peaks that confirmed well ordered structure for mesoporous materials. These
three peaks can be indexable as (100), (110), and (200) reflections associated with 2-D
hexagonal symmetry. Furthermore, presence of three peaks for Zr-SBA-15 support
confirms that the hexagonal orderliness is preserved even after incorporation of ZrO2 on
SBA-15 surface by post synthesis method. However, intensity for the Zr-SBA-15 support
decreases upon incorporation of ZrO2 into the SBA-15 surface, indicating that slight
modification of long range order of pores of SBA-15 occurs with ZrO2 loading.
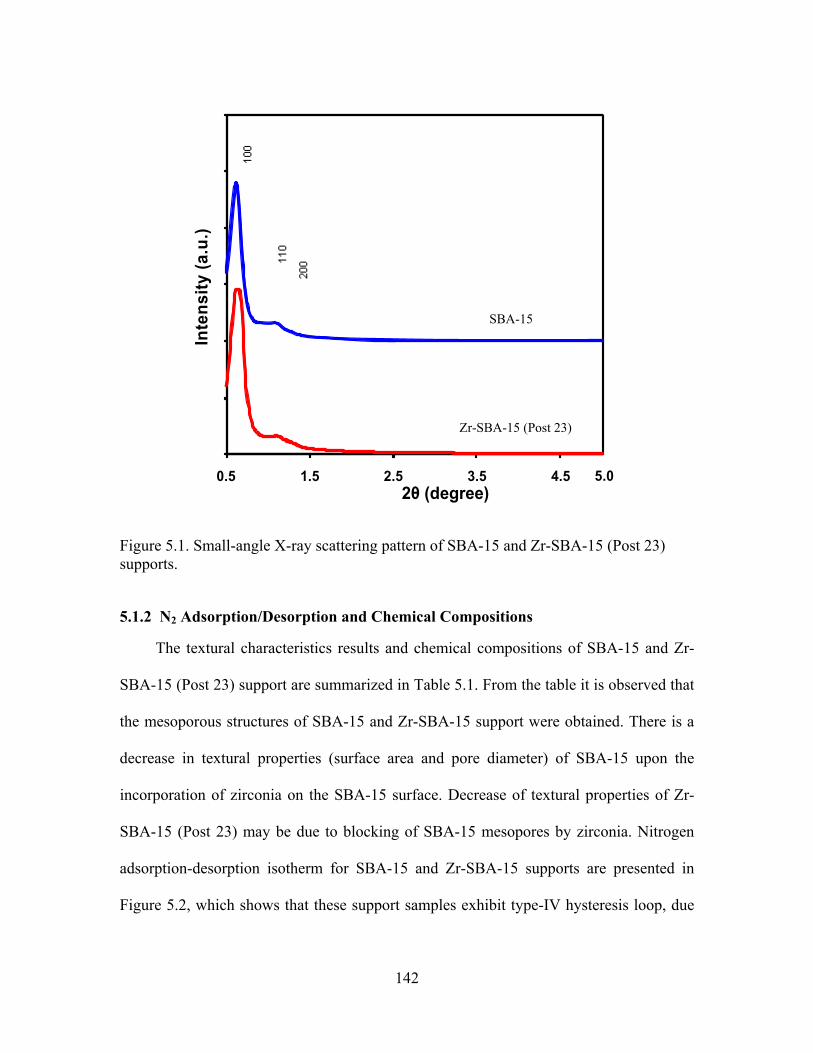
142
Figure 5.1. Small-angle X-ray scattering pattern of SBA-15 and Zr-SBA-15 (Post 23) supports.
5.1.2 N2 Adsorption/Desorption and Chemical Compositions
The textural characteristics results and chemical compositions of SBA-15 and Zr-
SBA-15 (Post 23) support are summarized in Table 5.1. From the table it is observed that
the mesoporous structures of SBA-15 and Zr-SBA-15 support were obtained. There is a
decrease in textural properties (surface area and pore diameter) of SBA-15 upon the
incorporation of zirconia on the SBA-15 surface. Decrease of textural properties of Zr-
SBA-15 (Post 23) may be due to blocking of SBA-15 mesopores by zirconia. Nitrogen
adsorption-desorption isotherm for SBA-15 and Zr-SBA-15 supports are presented in
Figure 5.2, which shows that these support samples exhibit type-IV hysteresis loop, due
0
500000
1000000
1500000
2000000
2500000
3000000
0.5 1.5 2.5 3.5 4.5
Intensity(a.u.)
2θ (degree)5.0
Inte
nsity
(a.u
.)
0
500000
1000000
1500000
2000000
2500000
3000000
0.5 1.5 2.5 3.5 4.5
Intensity(a.u.)
2θ (degree)
0
500000
1000000
1500000
2000000
2500000
3000000
0.5 1.5 2.5 3.5 4.5
Intensity(a.u.)
2θ (degree)5.0
Inte
nsity
(a.u
.)
SBA-15
Zr-SBA-15 (Post 23)
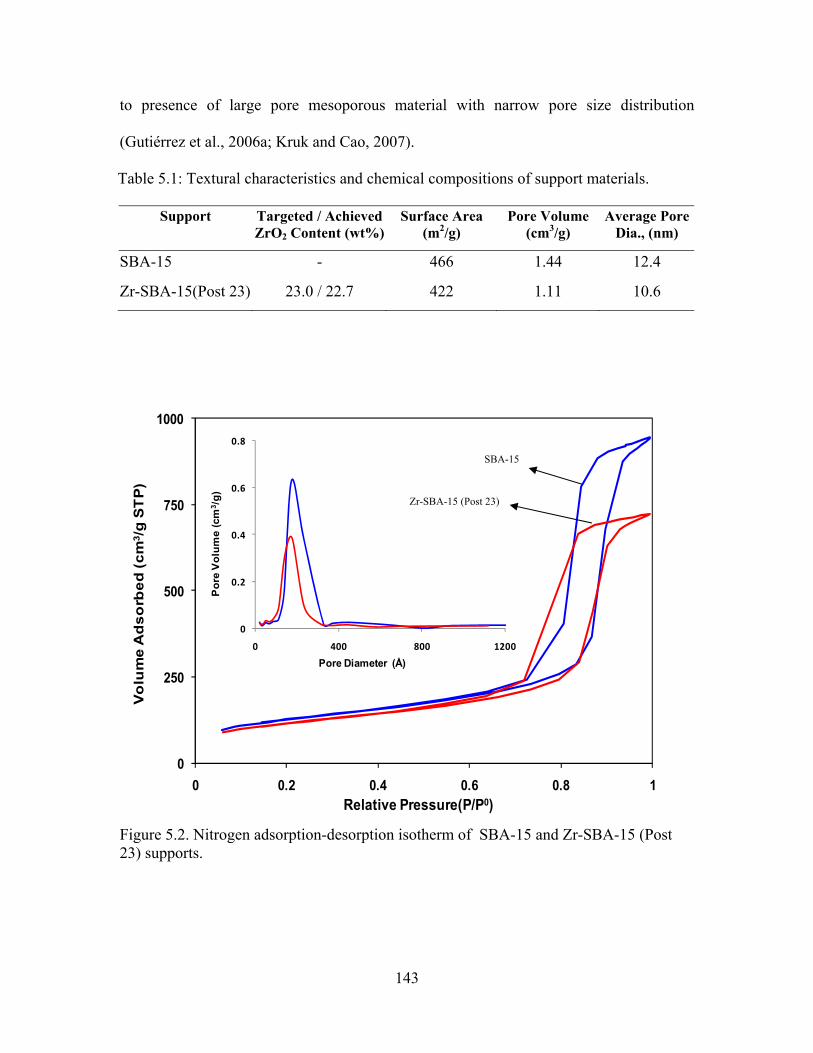
143
0
250
500
750
1000
0 0.2 0.4 0.6 0.8 1
Vo
lum
e A
dso
rbed
(cm
3 /g
ST
P)
Relative Pressure(P/P0)
0
0.2
0.4
0.6
0.8
0 400 800 1200
Por
e V
olum
e (c
m3 /
g)
Pore Diameter (Å)
0
250
500
750
1000
0 0.2 0.4 0.6 0.8 1
Vo
lum
e A
dso
rbed
(cm
3 /g
ST
P)
Relative Pressure(P/P0)
0
0.2
0.4
0.6
0.8
0 400 800 1200
Por
e V
olum
e (c
m3 /
g)
Pore Diameter (Å)
to presence of large pore mesoporous material with narrow pore size distribution
(Gutiérrez et al., 2006a; Kruk and Cao, 2007).
Table 5.1: Textural characteristics and chemical compositions of support materials.
Support Targeted / Achieved ZrO2 Content (wt%)
Surface Area (m2/g)
Pore Volume (cm3/g)
Average Pore Dia., (nm)
SBA-15 - 466 1.44 12.4
Zr-SBA-15(Post 23) 23.0 / 22.7 422 1.11 10.6
Figure 5.2. Nitrogen adsorption-desorption isotherm of SBA-15 and Zr-SBA-15 (Post 23) supports.
SBA-15
Zr-SBA-15 (Post 23)
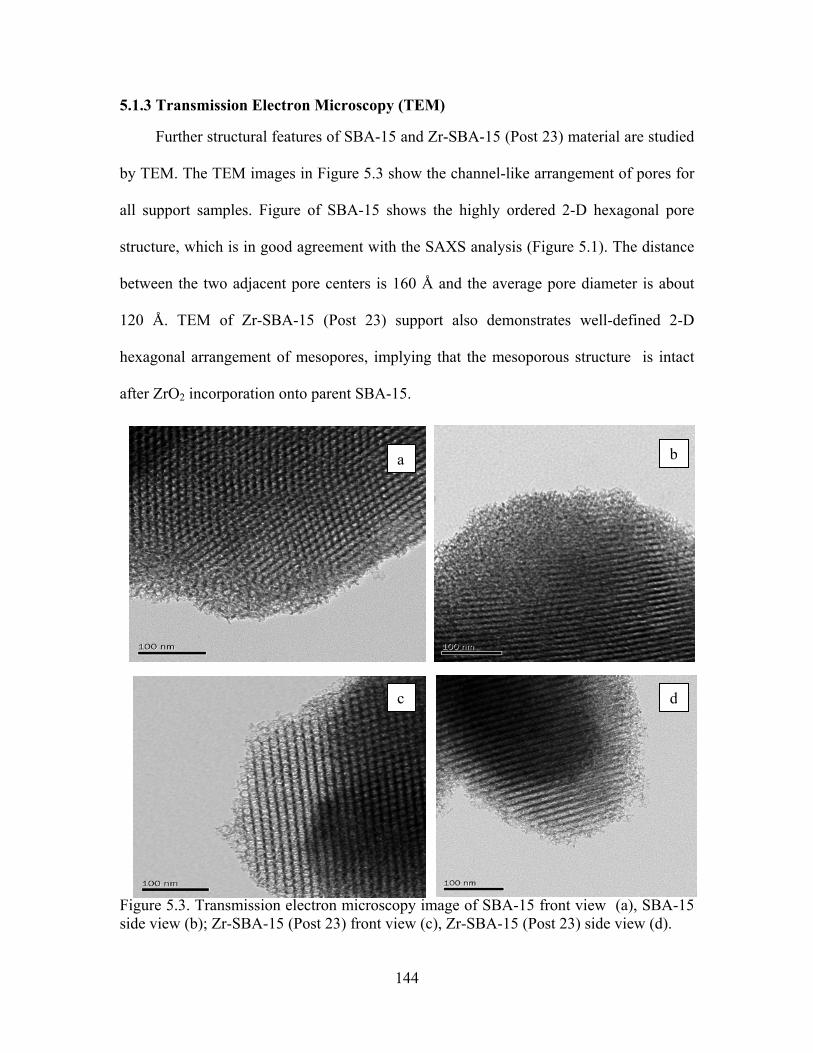
144
5.1.3 Transmission Electron Microscopy (TEM)
Further structural features of SBA-15 and Zr-SBA-15 (Post 23) material are studied
by TEM. The TEM images in Figure 5.3 show the channel-like arrangement of pores for
all support samples. Figure of SBA-15 shows the highly ordered 2-D hexagonal pore
structure, which is in good agreement with the SAXS analysis (Figure 5.1). The distance
between the two adjacent pore centers is 160 Å and the average pore diameter is about
120 Å. TEM of Zr-SBA-15 (Post 23) support also demonstrates well-defined 2-D
hexagonal arrangement of mesopores, implying that the mesoporous structure is intact
after ZrO2 incorporation onto parent SBA-15.
Figure 5.3. Transmission electron microscopy image of SBA-15 front view (a), SBA-15 side view (b); Zr-SBA-15 (Post 23) front view (c), Zr-SBA-15 (Post 23) side view (d).
a b
c d

145
5.1.4 Scanning Electron Microscopy (SEM)
The morphology and structure of SBA-15 and Zr-SBA-15 (Post 23) supports are
investigated by SEM. SEM micrograph of calcined SBA-15 is shown in Figure 5.4a/b.
SBA-15 sample exhibits uniform cylindrical form with diameter of 1-3µm and consists of
fiber-like packages. The similar morphology of SBA-15 is reported by other researchers
(Eswaramoorthi et al., 2008; Landau et al., 2005). SEM image of Zr-SBA-15 (Post 23)
support also displays the similar fiber like cylindrical image as observed in parent SBA-
15. It can be inferred that the morphology of the sample is preserved after the zirconia
impregnation in SBA-15 support.
Figure 5.4. Scanning electron microscopy image of SBA-15 of 10 µm (a); SBA-15 of 1 µm (b); Zr-SBA-15 (Post 23) of 10 µm (c); Zr-SBA-15 (Post 23) of 1µm (d)
a b
c d
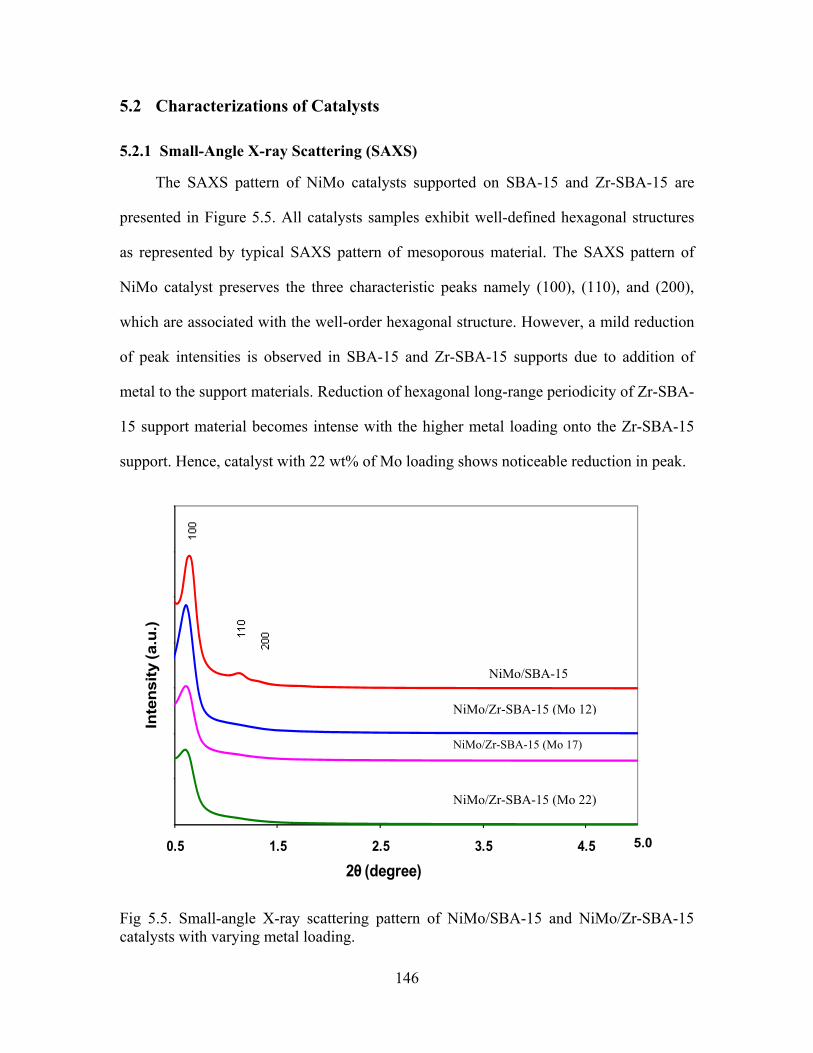
146
0
500000
1000000
1500000
2000000
2500000
3000000
3500000
0.5 1.5 2.5 3.5 4.5
Inte
nsity
(a.u
.)
2θ (degree)
5.00
500000
1000000
1500000
2000000
2500000
3000000
3500000
0.5 1.5 2.5 3.5 4.5
Inte
nsity
(a.u
.)
2θ (degree)
5.0
5.2 Characterizations of Catalysts
5.2.1 Small-Angle X-ray Scattering (SAXS)
The SAXS pattern of NiMo catalysts supported on SBA-15 and Zr-SBA-15 are
presented in Figure 5.5. All catalysts samples exhibit well-defined hexagonal structures
as represented by typical SAXS pattern of mesoporous material. The SAXS pattern of
NiMo catalyst preserves the three characteristic peaks namely (100), (110), and (200),
which are associated with the well-order hexagonal structure. However, a mild reduction
of peak intensities is observed in SBA-15 and Zr-SBA-15 supports due to addition of
metal to the support materials. Reduction of hexagonal long-range periodicity of Zr-SBA-
15 support material becomes intense with the higher metal loading onto the Zr-SBA-15
support. Hence, catalyst with 22 wt% of Mo loading shows noticeable reduction in peak.
Fig 5.5. Small-angle X-ray scattering pattern of NiMo/SBA-15 and NiMo/Zr-SBA-15 catalysts with varying metal loading.
NiMo/Zr-SBA-15 (Mo 22)
NiMo/SBA-15
NiMo/Zr-SBA-15 (Mo 12)
NiMo/Zr-SBA-15 (Mo 17)
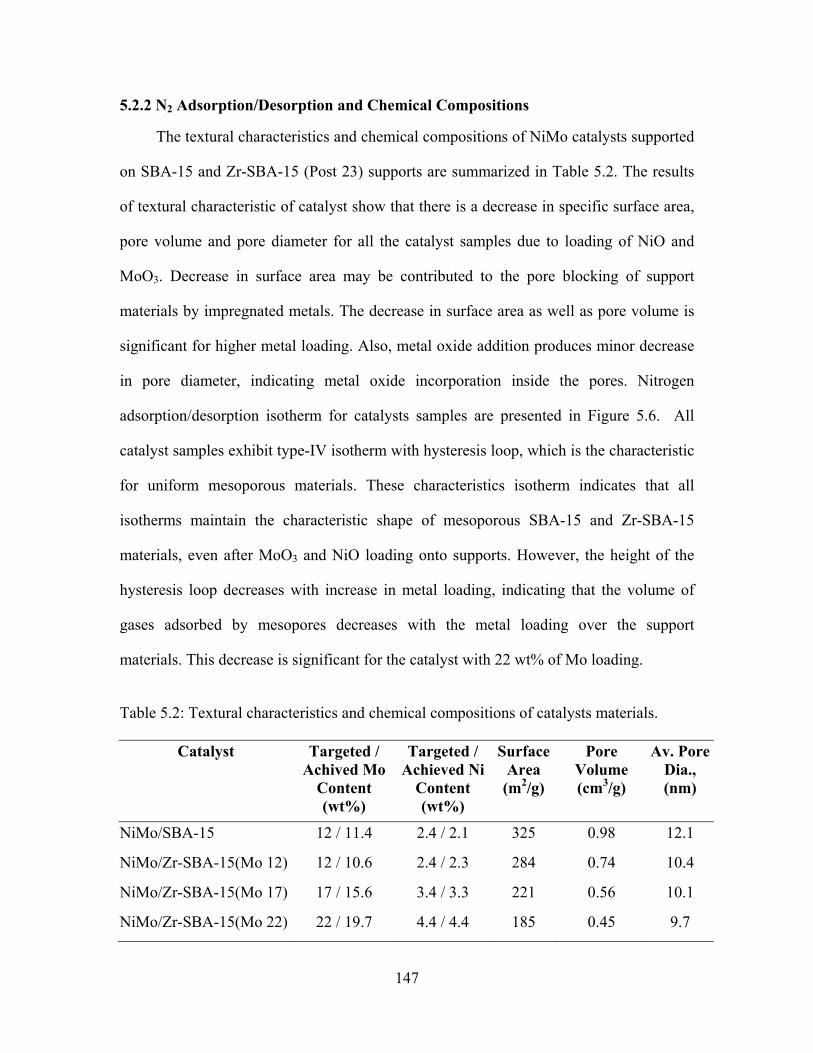
147
5.2.2 N2 Adsorption/Desorption and Chemical Compositions
The textural characteristics and chemical compositions of NiMo catalysts supported
on SBA-15 and Zr-SBA-15 (Post 23) supports are summarized in Table 5.2. The results
of textural characteristic of catalyst show that there is a decrease in specific surface area,
pore volume and pore diameter for all the catalyst samples due to loading of NiO and
MoO3. Decrease in surface area may be contributed to the pore blocking of support
materials by impregnated metals. The decrease in surface area as well as pore volume is
significant for higher metal loading. Also, metal oxide addition produces minor decrease
in pore diameter, indicating metal oxide incorporation inside the pores. Nitrogen
adsorption/desorption isotherm for catalysts samples are presented in Figure 5.6. All
catalyst samples exhibit type-IV isotherm with hysteresis loop, which is the characteristic
for uniform mesoporous materials. These characteristics isotherm indicates that all
isotherms maintain the characteristic shape of mesoporous SBA-15 and Zr-SBA-15
materials, even after MoO3 and NiO loading onto supports. However, the height of the
hysteresis loop decreases with increase in metal loading, indicating that the volume of
gases adsorbed by mesopores decreases with the metal loading over the support
materials. This decrease is significant for the catalyst with 22 wt% of Mo loading.
Table 5.2: Textural characteristics and chemical compositions of catalysts materials.
Catalyst Targeted / Achived Mo
Content (wt%)
Targeted / Achieved Ni
Content (wt%)
Surface Area
(m2/g)
Pore Volume (cm3/g)
Av. Pore Dia., (nm)
NiMo/SBA-15 12 / 11.4 2.4 / 2.1 325 0.98 12.1
NiMo/Zr-SBA-15(Mo 12) 12 / 10.6 2.4 / 2.3 284 0.74 10.4
NiMo/Zr-SBA-15(Mo 17) 17 / 15.6 3.4 / 3.3 221 0.56 10.1
NiMo/Zr-SBA-15(Mo 22) 22 / 19.7 4.4 / 4.4 185 0.45 9.7

148
0
250
500
750
0 0.2 0.4 0.6 0.8 1
Vol
ume
Ads
orbe
d (c
m3 /
g S
TP)
Relative Pressure(P/P0)
0
0.2
0.4
0.6
0 400 800 1200
Pore
Vol
ume
(cm
3 /g)
Pore Diameter (Å)
0
250
500
750
0 0.2 0.4 0.6 0.8 1
Vol
ume
Ads
orbe
d (c
m3 /
g S
TP)
Relative Pressure(P/P0)
0
0.2
0.4
0.6
0 400 800 1200
Pore
Vol
ume
(cm
3 /g)
Pore Diameter (Å)
Figure 5.6. Nitrogen adsorption-desorption isotherm of NiMo/SBA-15 and NiMo/Zr-SBA-15 catalysts with varying metal loading.
5.2.3 Transmission Electron Microscopy (TEM)
Further structural features of NiMo catalysts supported on SBA-15 and Zr-SBA-15
material are studied by TEM. The TEM images in Figure 5.7 show the channel-like
arrangement of pores for all catalyst samples. Figure of NiMo/SBA-15 shows the well
ordered hexagonal pore structure, which is in good agreement with the SAXS analysis.
TEM of NiMo catalysts supported on Zr-SBA-15 supports also demonstrate well-defined
2-D hexagonal arrangement of mesopores, implying that the mesoporous structure is
intact after metal incorporation onto parent SBA-15 and Zr-SBA-15 (Post 23) supports.
NiMo/Zr-SBA-15 (Mo 12)
NiMo/SBA-15
NiMo/Zr-SBA-15 (Mo 17)
NiMo/Zr-SBA-15 (Mo 22)
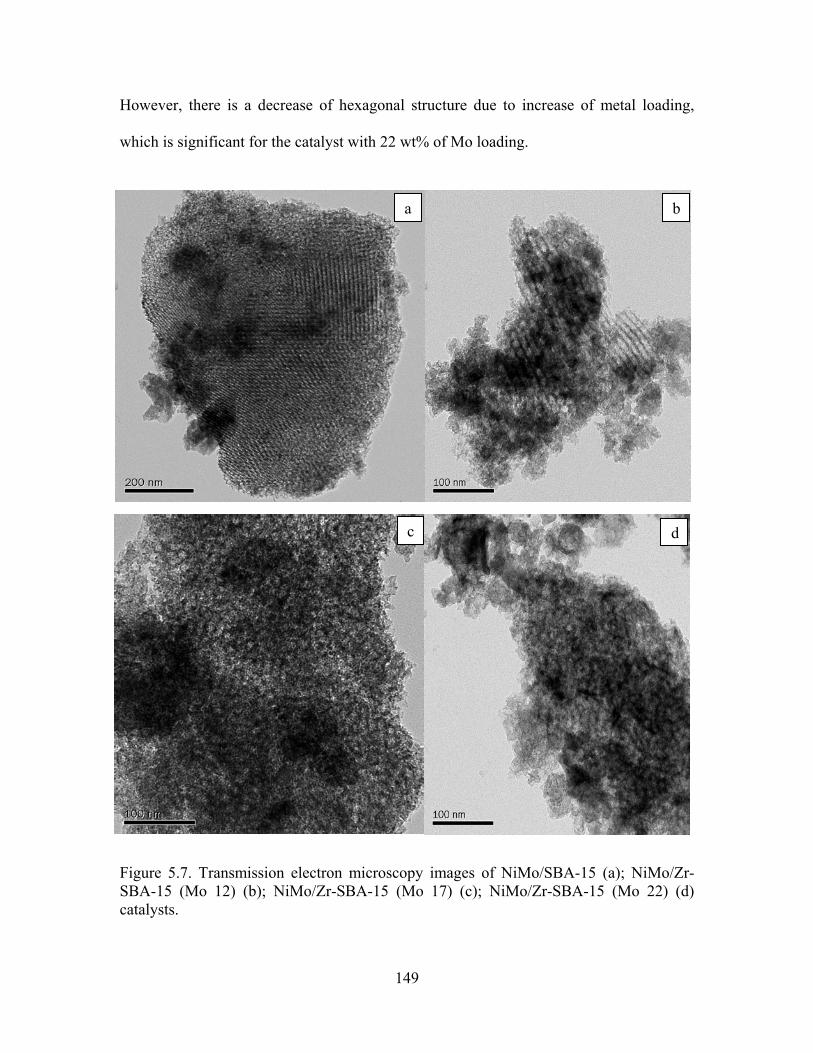
149
However, there is a decrease of hexagonal structure due to increase of metal loading,
which is significant for the catalyst with 22 wt% of Mo loading.
Figure 5.7. Transmission electron microscopy images of NiMo/SBA-15 (a); NiMo/Zr-SBA-15 (Mo 12) (b); NiMo/Zr-SBA-15 (Mo 17) (c); NiMo/Zr-SBA-15 (Mo 22) (d) catalysts.
a b
c d
150
5.2.4 Pyridine Adsorbed Fourier Transform Infrared Spectroscopy (Py-IR)
The acid properties on catalysts samples were examined by the FTIR spectroscopy
of pyridine adsorption. Figure 5.8 shows the FTIR spectrum of pyridine adsorbed on the
catalysts samples. All catalyst samples show the characteristic band at 1450 cm-1 (strong),
1580 cm-1(weak), 1609 cm-1(weak), which correspond to the pyridine adsorbed on lewis
acid sites (Chen et al., 2006; Nava et al., 2007). Also, a band appeared at 1540 cm-1,
indicating creation of the Brønsted acid sites in all NiMo/Zr-SBA-15 samples. In
addition, for all NiMo/Zr-SBA-15 samples, bands at 1490 cm-1 are associated with
pyridine adsorbed on both Lewis and Brønsted acid sites (Chen et al., 2006). In pure
NiMo/SBA-15 support, the bands corresponding to the only Lewis acid sites at 1450 cm-
1, 1624 cm-1 and 1580 cm-1 are observed. However, no band is observed at 1540 cm-1 and
1490 cm-1, which corresponding to the Brønsted acidity. Hence, it can be concluded that
the Brønsted acid sites were generated due to presence of zirconia in SBA-15 support.
Furthermore, it is observed that the Brønsted acidity increases with the Mo loading. On
the other hand, Lewis acidity is found to decrease upon increasing the Mo loading.
Hence, highest Brønsted acidity is observed for the NiMo/Zr-SBA-15 (Mo 22) catalyst.

151
1700.0 1680 1660 1640 1620 1600 1580 1560 1540 1520 1500 1480 1460 1440 1420 1400.0cm-1
A
1450
14901541
cm-1
1541 1490
1450
1700.0 1680 1660 1640 1620 1600 1580 1560 1540 1520 1500 1480 1460 1440 1420 1400.0cm-1
A
1450
14901541
cm-1
1541 1490
1450
Figure 5.8. FT-IR spectra of pyridine adsorbed species on NiMo/SBA-15 and NiMo/Zr-SBA-15 catalysts with varying metal loading.
5.2.5 Powder X-ray Diffraction (XRD)
To determine the presence of any crystalline phase present in the NiMo/SBA-15
and NiMo/Zr-SBA-15 catalysts, powder XRD analysis was performed. In Figure 5.9
powder XRD pattern for NiMo catalyst supported on SBA-15 and Zr-SBA-15 support is
shown. Diffraction due to the crystalline MoO3 phase (JCPDS card 35-609 and JCPDS
card 05-0508) (Gutiérrez et al., 2006a; Gutiérrez et al., 2009; Li et al., 2006) is observed
for the NiMo catalysts supported on pure SBA-15 (sharp signal). However, XRD
reflections of crystalline MoO3 phase disappear for the NiMo catalyst supported on Zr-
SBA-15 support. Disappearance of XRD reflection for these catalysts indicates better
dispersion of nickel and molybdenum oxide due to increase in zirconia loading on pure
SBA-15 support. NiMo/Zr-SBA-15 catalyst with Mo loading from 12 to 17 wt% (Ni
loading 2.4 to 3.4 wt %) shows excellent dispersion of MoO3 species, which imply that
the addition of Mo and Ni significantly improve the MoO3 dispersion. However, at higher
Mo loading (22 wt %) reflection due to crystalline MoO3 phase become pronounced,
implying that the agglomeration of MoO3 species occurs at higher metal loading.
NiMo/Zr-SBA-15 (Mo12)
NiMo/Zr-SBA-15 (Mo17)
NiMo/Zr-SBA-15 (Mo22)
NiMo/SBA-15
Abs
orba
nce
(a.u
.)1540
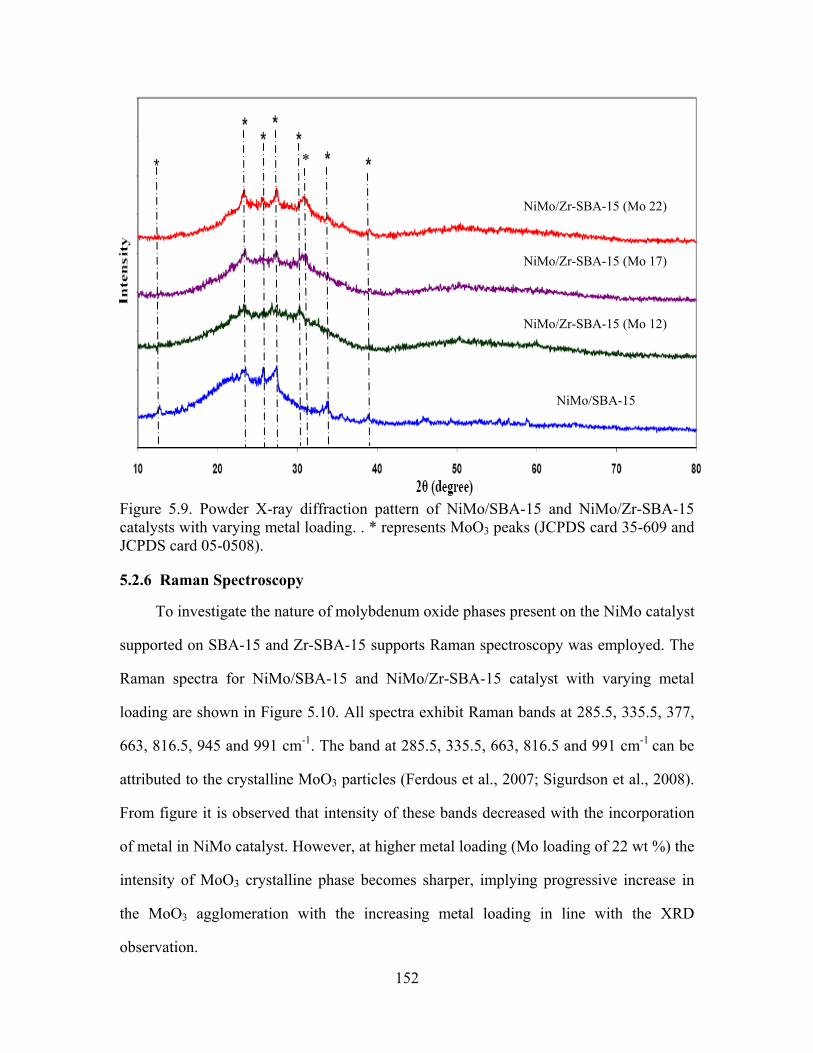
152
Figure 5.9. Powder X-ray diffraction pattern of NiMo/SBA-15 and NiMo/Zr-SBA-15 catalysts with varying metal loading. . * represents MoO3 peaks (JCPDS card 35-609 and JCPDS card 05-0508).
5.2.6 Raman Spectroscopy
To investigate the nature of molybdenum oxide phases present on the NiMo catalyst
supported on SBA-15 and Zr-SBA-15 supports Raman spectroscopy was employed. The
Raman spectra for NiMo/SBA-15 and NiMo/Zr-SBA-15 catalyst with varying metal
loading are shown in Figure 5.10. All spectra exhibit Raman bands at 285.5, 335.5, 377,
663, 816.5, 945 and 991 cm-1. The band at 285.5, 335.5, 663, 816.5 and 991 cm-1 can be
attributed to the crystalline MoO3 particles (Ferdous et al., 2007; Sigurdson et al., 2008).
From figure it is observed that intensity of these bands decreased with the incorporation
of metal in NiMo catalyst. However, at higher metal loading (Mo loading of 22 wt %) the
intensity of MoO3 crystalline phase becomes sharper, implying progressive increase in
the MoO3 agglomeration with the increasing metal loading in line with the XRD
observation.
*
NiMo/Zr-SBA-15 (Mo 22)
NiMo/Zr-SBA-15 (Mo 17)
NiMo/Zr-SBA-15 (Mo 12)
NiMo/SBA-15
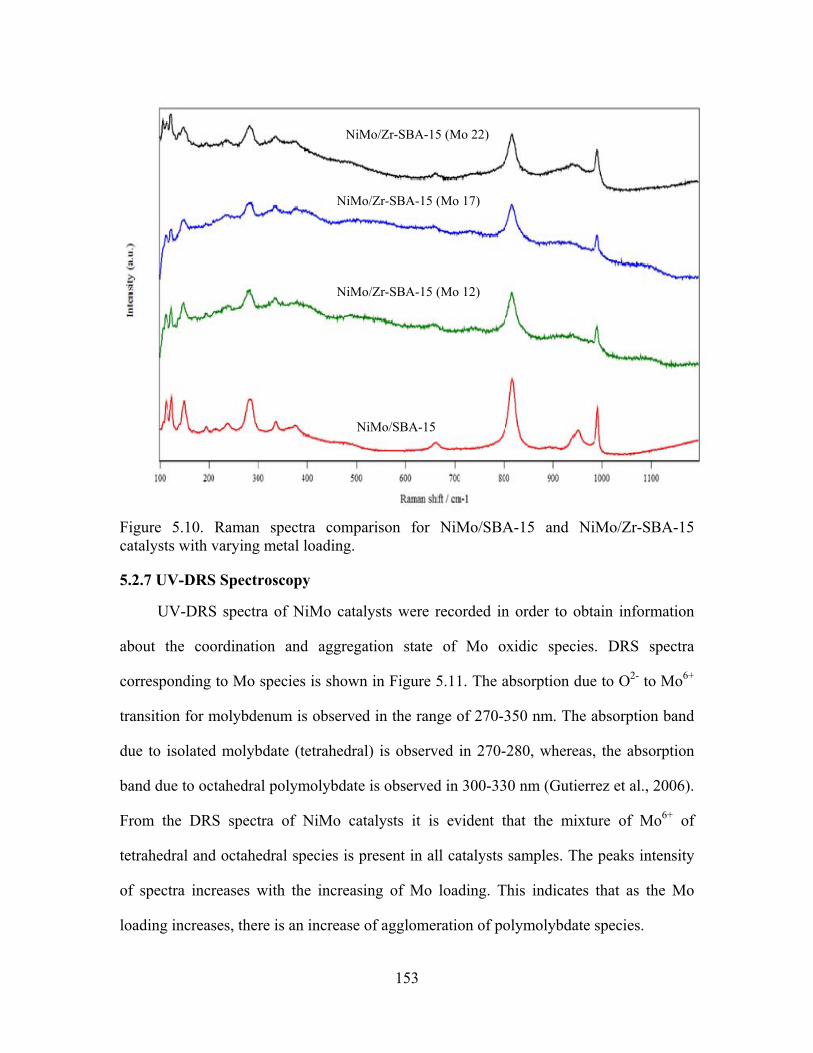
153
Figure 5.10. Raman spectra comparison for NiMo/SBA-15 and NiMo/Zr-SBA-15 catalysts with varying metal loading.
5.2.7 UV-DRS Spectroscopy
UV-DRS spectra of NiMo catalysts were recorded in order to obtain information
about the coordination and aggregation state of Mo oxidic species. DRS spectra
corresponding to Mo species is shown in Figure 5.11. The absorption due to O2- to Mo6+
transition for molybdenum is observed in the range of 270-350 nm. The absorption band
due to isolated molybdate (tetrahedral) is observed in 270-280, whereas, the absorption
band due to octahedral polymolybdate is observed in 300-330 nm (Gutierrez et al., 2006).
From the DRS spectra of NiMo catalysts it is evident that the mixture of Mo6+ of
tetrahedral and octahedral species is present in all catalysts samples. The peaks intensity
of spectra increases with the increasing of Mo loading. This indicates that as the Mo
loading increases, there is an increase of agglomeration of polymolybdate species.
NiMo/SBA-15
NiMo/Zr-SBA-15 (Mo 12)
NiMo/Zr-SBA-15 (Mo 17)
NiMo/Zr-SBA-15 (Mo 22)

154
Figure 5.11. UV-DRS comparison for NiMo/Zr-SBA-15 catalysts with varying metal loading.
5.2.8 High Resolution Transmission Electron Microscopy (HRTEM)
HRTEM study is effective for getting information about the dispersion of the
activated catalysts (Gutiérrez et al., 2007). Figure 5.12 represents the obtained HRTEM
micrograph of sulfided NiMo/SBA-15 and NiMo/Zr-SBA-15 catalysts with varying Mo
loading. In the sulfide catalyst typical fringes due to MoS2 crystallites with 6.1 Å
interplanar distances are observed. The number of stacking layers in NiMo sulfide
catalyst supported on pure SBA-15 support is observed as 2-8 layers MoS2 particles with
length 40 – 90 Å, which provides inhomogeneous distribution of slab over the SBA-15
support (Gutiérrez et al., 2006a). On the other hand, for the NiMo/Zr-SBA-15 catalyst
with Mo loading of 12 wt% and 17 wt%, the smaller size MoS2 slabs are homogeneously
distributed over the Zr-SBA-15 supports. However, an increase in MoO3 loading results
in worse dispersion of active phase due to increase in MoS2 length and layers. Among all
0
20
40
60
80
100
270 320 370 420 470 520 570
F (R
)
Wavelength (nm)
NiMo/Zr-SBA-15 (Mo 17)
NiMo/Zr-SBA-15 (Mo 12)
NiMo/Zr-SBA-15 (Mo 22)

155
catalysts, NiMo/Zr-SBA-15 (Mo 17) catalyst with MoS2 length 20-40 Å and stacking
layers of 2-4 shows excellent dispersion of active phase.
Fig 5.12. HRTEM micrograph of sulfided NiMo/SBA-15 (a), NiMo/Zr-SBA-15 (Mo 12) (b); NiMo/Zr-SBA-15 (Mo17) (c) and NiMo/Zr-SBA-15 (Mo 22) (d) catalysts
a b
c d
Slab length: 40-90 Å Slab layers: 2-8 Slab length: 20-60 Å
Slab layers: 1-4
Slab length: 20-40 Å Slab layers: 2-4
Slab length: 30-100 Å Slab layers: 2-8
156
5.3 Catalytic Activity Performance Based on HDS and HDN
In the phase II, the performance of all catalysts was evaluated based on HDS and
HDN activity exhibited during hydrotreatment of heavy gas oil (HGO) derived from
Athabasca bitumen. All Zr-SBA-15 supported NiMo catalysts exhibited higher activity
compared to the NiMo catalyst supported on SBA-15 support, implying that the metal
loading improves the dispersion of Mo over support (Figure 5.13). For Zr-SBA-15
supported NiMo catalysts, increase in HDS and HDN activities were observed when the
Mo loading was increased from 12 wt% to 17 wt% (Mo/Ni mass ratio of 5). This can be
attributed to the better textural characteristics, better dispersion of active metal and higher
acidity of NiMo/Zr-SBA-15 catalysts. However, a further increase in Mo loading up to
22 wt% led to a decrease in the HDS and HDN activity. This shows that the 17 wt% is
the optimum Mo loading on Zr-SBA-15 support, which gives the highest catalytic
activity. This trend may be attributed to the variation of dispersion of Mo active species
over the support material. The Mo species may be well-dispersed on the support material
up to 17 wt% of loading. The agglomeration of Mo species occurs at the higher metal
loading, which causes the reduction in catalytic activities. The hydrotreating activity
comparison of best catalyst, NiMo/Zr-SBA-15 (Mo 17) was compared with the
commercial catalyst on weight basis (i.e. 2 gm catalyst) (Figure 5.14) and volume basis
(i.e. 5 ml catalyst) (Figure 5.15). On weight basis, the optimum catalyst showed higher
activity compared to that of the commercial catalyst. However, on volume basis, the
commercial catalyst exhibited higher activity.
Also, the simulated distillation comparison of feed and product obtained by
hydrotreating of HGO over optimum catalyst is shown in Figure 5.16. From the figure it
is evident that the production of lighter cut is obtained due to mild cracking of the HGO.
However, from the overall distribution of heavier cut of feed and heavy material, it is
clear that the significant hydrocracking has not occurred during the hydrotreating of HGO
by NiMo/Zr-SBA-15 (Mo 17) catalyst.

157
0
10
20
30
40
50
60
70
80
90
100
375 385 395
Sulfu
r Con
vers
ion (%
)
Temperature (0C)
HDS
NiMo/Zr-SBA-15 (Mo 22)
NiMo/Zr-SBA-15(Mo 17)
NiMo/Zr-SBA-15(Mo 12)
NiMo/SBA-15
0
10
20
30
40
50
60
70
375 385 395
Nitro
gen C
onve
rsio
n (%
)
Temperature (0C)
HDN
NiMo/Zr-SBA-15 (Mo 22)
NiMo/Zr-SBA-15(Mo 17)
NiMo/Zr-SBA-15 (Mo 12)
NiMo/SBA-15
Figure 5.13. The hydrodesulfurization and hydrodenitrogenation activity (volume basis) study of NiMo/SBA-15 and NiMo/Zr-SBA-15 catalysts with varying metal loading, T = 375/385/395 °C, P=8.9MPa, LHSV = 1 h-1, H2/HC ratio 600 Nm3/m3. HDS (a); HDN (b)
a
b

158
0
20
40
60
80
100
375 385 395
Sulfu
r Con
vers
ion
(%)
Temperature (0C)
HDS
NiMo/Zr-SBA-15 (Mo 17)
Commercial Catalyst
0
20
40
60
80
375 385 395
Nitr
ogen
Con
vers
ion
(%)
Temperature (0C)
HDN
NiMo/Zr-SBA-15 (Mo 17)
Commercial Catalyst
Figure 5.14. Hydrotreating activity (weight basis) comparison of NiMo/Zr-SBA-15 (Mo 17) and commercial catalysts; T = 375/385/395 °C, P=8.9 MPa, LHSV = 1 h-1, H2/HC ratio 600 Nm3/m3. HDS (a); HDN (b).
a
b

159
0
20
40
60
80
100
375 385 395
Sulfu
r Con
vers
ion
(%)
Temperature (0C)
HDS
NiMo/Zr-SBA-15 (Mo 17)
Commercial Catalyst
0
20
40
60
80
375 385 395
Nitro
gen
Conv
ersi
on (%
)
Temperature (0C)
HDN
NiMo/Zr-SBA-15 (Mo 17)
Commercial Catalyst
Figure 5.15. Hydrotreating activity ( volume basis) comparison of NiMo/Zr-SBA-15 (Mo 17) and commercial catalysts; T = 375/385/395 °C, P=8.9 MPa, LHSV = 1 h-1, H2/HC ratio 600 Nm3/m3. HDS (a); HDN (b).
b
a

160
150
250
350
450
550
650
0 20 40 60 80 100
BP
(0C
)
Fraction Distilled Off (wt%)
Simulated Distillation
Feed
Optimized Catalysts T = 375
Optimized Catalysts T = 385
Optimized Catalyst T = 395
Figure 5.16. The simulated distillation of HGO feed and the product obtained by hydrotreating of HGO over optimized NiMo/Zr-SBA-15 (Mo 17) catalyst.
161
CHAPTER 6
KINETIC STUDY OF HDS AND HDN
This chapter describes the effect of reaction condition and kinetic study of HDS and
HDN reaction over the optimized catalyst. Kinetic expression for the HDS and HDN over
optimized NiMo/Zr-SBA-15 catalyst is expressed based on Power law model and
Langmuir –Hinshelwood model. Also, this chapter illustrates the catalyst stability study
performed on best catalyst. Furthermore, characterization of spent catalyst is explained in
this section.
6.1 Effect of Reaction Condition on HDS/HDN over Optimized Catalyst
6.1.1 Effect of Temperature
The effect of temperature on the HDS and HDN activity for NiMo/Zr-SBA-15
catalyst was studied in the range of 375 to 395 °C while keeping pressure at 8.9 MPa,
gas/oil ratio at 600 Nm3/m3 and varying LHSV value from 0.5 to 2.0 hr-1. The results on
the effect of temperature on HDS reaction are shown in Figure 6.1a. It is seen from the
figure that as the temperature is increased, the percent of sulfur conversion increases. The
sulfur conversion is higher at lower temperature range (375-385 °C) as compared to that
at higher temperature (385-395 °C). The reaction temperature affects both the direct
desulfurization (DDS) and hydrogenation (HYD) routes significantly during
desulfurization of refractory compounds, such as 4,6-DMDBT. At lower temperature 4,6-
DMDBT is easily transformed into hydrogenated product, which results into higher
activity at lower temperature rather than very high temperature (Xu et al., 2004). In the
present study, the sulfur conversion increases from 94.6% to 97.0% at LHSV 0.5 hr-1,

162
89.3 to 92.3 at LHSV 1.0 hr-1 and 83.3% to 89.2% at LHSV 1.5 hr-1 with increase in
temperature from 375 to 385 °C. Similar trend is observed at different LHSV values for
an increasing temperature from 385 to 395 °C. Therefore, a maximum sulfur conversion
of 97.8 wt% can be achieved at temperature 395 °C, LHSV 0.5 hr-1, pressure 8.9 MPa,
and H2/GO ratio 600 Nm3/m3 for hydrodesulfurization of HGO using NiMo/Zr-SBA-15
catalyst.
The result of temperature effect on HDN reaction is shown in Figure 6.1b. As the
temperature is increased, the percentage of nitrogen conversion increases similar to sulfur
conversion. However, the nitrogen conversion is quite significant compared to the sulfur
conversion upon temperature increase. Also, nitrogen conversion is higher in the lower
range of temperature as compared to that at higher range of temperature. Nitrogen
conversion increases from 62.6 to 79.3 for LHSV 0.5 hr-1, 48.6 to 57.7 for LHSV 1.0 hr-1
and 37.0 to 47.9 89.2 for LHSV 1.5 hr-1 while increasing temperature from 375 to 385
°C. A similar trend is observed at different LHSV values for an increasing temperature
from 385 to 395 °C. Therefore, a maximum nitrogen conversion of 91.4 wt% can be
achieved at temperature 395 °C, LHSV 0.5 8.9 MPa, and H2/GO ratio 600 Nm3/m3 for
hydrodenitrogenation of HGO using NiMo/Zr-SBA-15 catalyst.
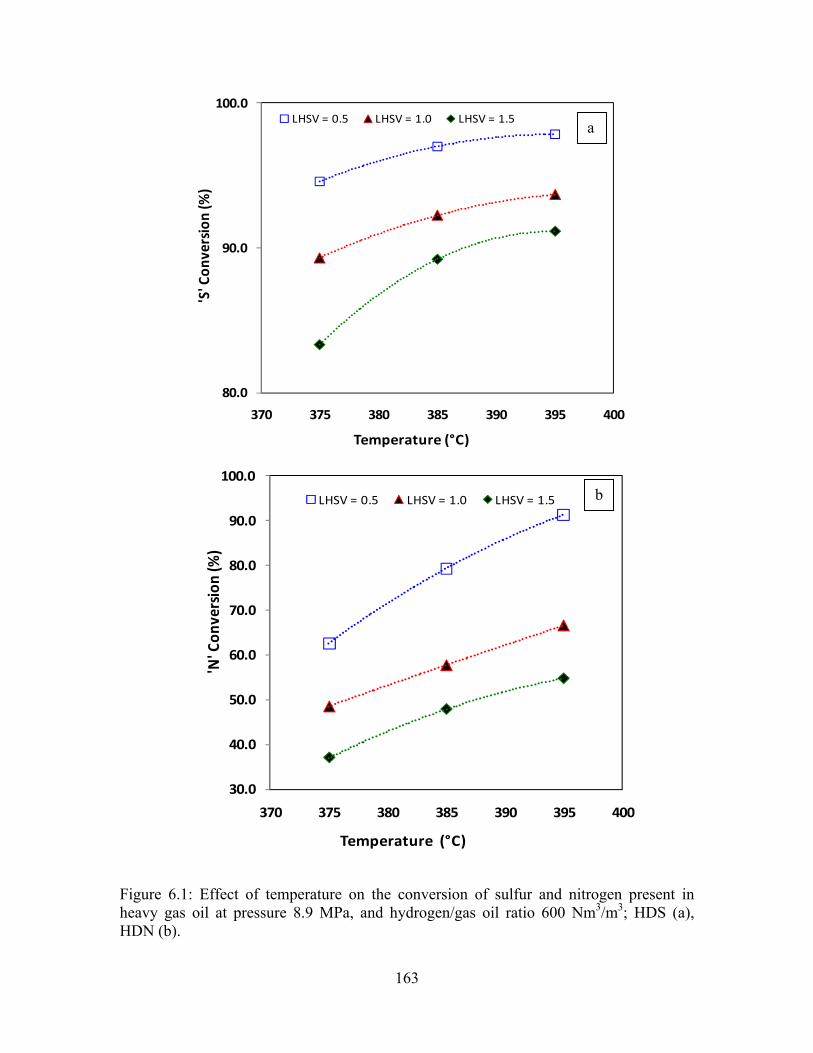
163
80.0
90.0
100.0
370 375 380 385 390 395 400
'S' Con
version (%
)
Temperature (°C)
LHSV = 0.5 LHSV = 1.0 LHSV = 1.5
30.0
40.0
50.0
60.0
70.0
80.0
90.0
100.0
370 375 380 385 390 395 400
'N' Con
version (%
)
Temperature (°C)
LHSV = 0.5 LHSV = 1.0 LHSV = 1.5
Figure 6.1: Effect of temperature on the conversion of sulfur and nitrogen present in heavy gas oil at pressure 8.9 MPa, and hydrogen/gas oil ratio 600 Nm3/m3; HDS (a), HDN (b).
a
b

164
6.1.2 Effect of LHSV
The effect of liquid hourly space velocity (LHSV) on the HDS and HDN of heavy
gas oil was studied in the LHSV range from 0.5 to 1.5 h-1 and varying temperature from
375 °C to 395 °C, while keeping pressure at 8.9 MPa and a hydrogen/heavy gas oil
volumetric ratio at 600 Nm3/m3. The effect of LHSV on HDS conversion is shown in
Figure 6.2a. As the LHSV of heavy gas oil is decreased, the HDS conversion is increased
due to increase in the contact time of the liquid with the catalyst. Also, at lower space
velocity and lower temperatures allows us to achieve a high conversion of sulfur
compounds where this equilibrium limitation is less pronounced. At present study highest
sulfur conversion was observed at LHSV of 0.5 hr-1 and temperature of 395 °C. Similar
observation can be made for the HDN conversion also (Figure 6.2b). Decrease of LHSV
results in increase of nitrogen conversion. In this study highest nitrogen conversion of
91.4 wt% was observed at LHSV of 0.5 hr-1, temperature of 395 °C, pressure 8.9 MPa,
and gas/oil ratio 600 Nm3/m3.
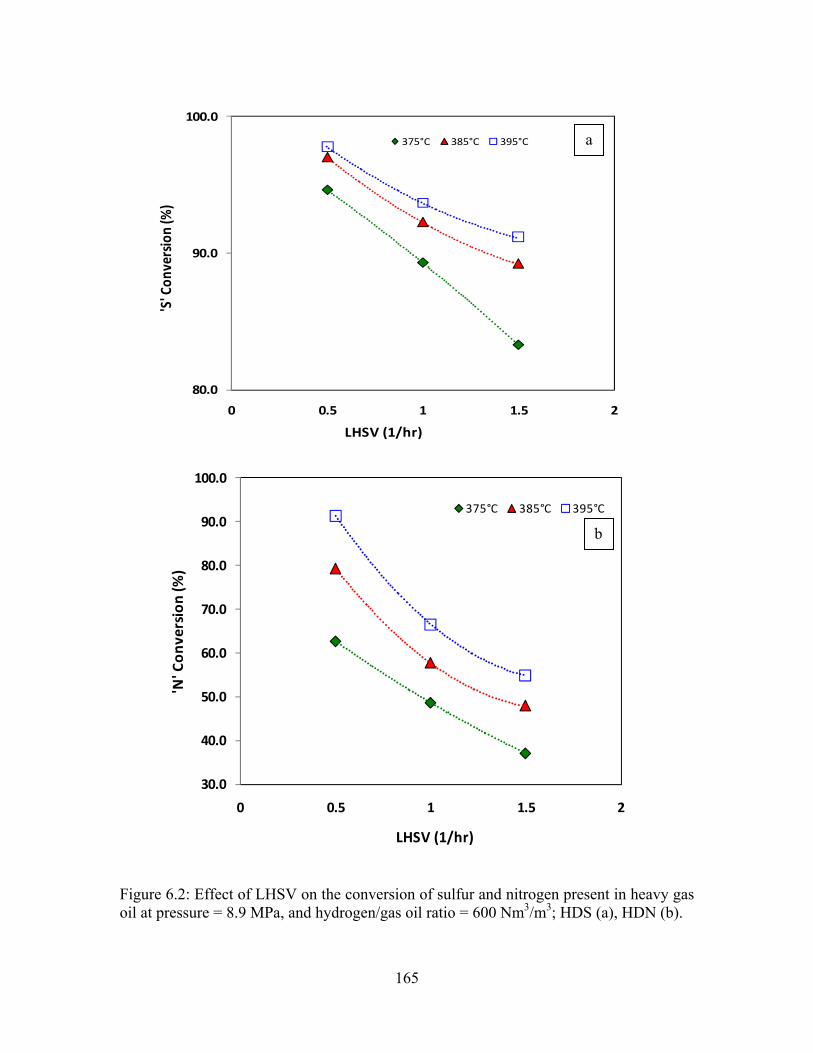
165
30.0
40.0
50.0
60.0
70.0
80.0
90.0
100.0
0 0.5 1 1.5 2
'N' Con
version (%
)
LHSV (1/hr)
375°C 385°C 395°C
80.0
90.0
100.0
0 0.5 1 1.5 2
'S' Con
version (%
)
LHSV (1/hr)
375°C 385°C 395°C
Figure 6.2: Effect of LHSV on the conversion of sulfur and nitrogen present in heavy gas oil at pressure = 8.9 MPa, and hydrogen/gas oil ratio = 600 Nm3/m3; HDS (a), HDN (b).
a
b

166
6.1.3 Effect of Pressure
The effects of reaction pressure on the HDS and HDN activities of optimized
NiMo/Zr-SBA-15 catalyst were studied at three different pressure levels, namely at 7.9,
8.9 and 9.9 MPa, while keeping temperature, LHSV and gas/oil ratio at 385 °C, 1.0 h-1
and 600 Nm3/m3, respectively. The effects of pressure on HDS conversion is presented
in Figure 6.3a. It can be observed from the figure that the effect of pressure on HDS of
HGO was not very significant. Upon increase in pressure from 7.9 MPa to 8.9 MPa,
sulfur conversion increases from 91.8 wt% to 92.3 wt% and with the increase of pressure
from 8.9 MPa to 9.9 MPa, sulfur conversion increases from 92.3% to 93.2%. It can also
be observed that an increase in pressure from 8.9 MPa to 9.9 MPa shows comparatively
higher increase in sulfur conversions than that with the increase in pressure 7.9 to 8.9
MPa i.e. at higher pressure range the sulfur conversion is higher than that at lower
pressure range. This trend is observed for the NiMo/Zr-SBA-15 catalyst because of the
hydrodesulfurization of refractory molecules, such as 4,6-DMDBT, via a hydrogenation
route which requires higher hydrogen pressure (Tanaka et al., 2003). Hence, increase in
pressure results in increase in desulfurization of refractory molecules through
hydrogenation route and thus increased catalytic activity.
Figures 6.3b represents the nitrogen conversions in the pressure range investigated.
Upon the increase in pressure, nitrogen conversion is significantly higher compared to the
sulfur conversion. This trend is observed due to following reasons: i) at sufficient
hydrogen pressure there might be the profound effect of competitive adsorption of
nitrogen compounds or ii) due to reversibility of conversion of refractory sulfur
compounds such as 4,6 DMDBT at higher pressure (Topsøe et al., 1996). Upon increase
of pressure from 7.9 MPa to 8.9 MPa, nitrogen conversion increases from 52.5 to 57.7
wt% and with the increase of pressure from 8.9 MPa to 9.9 MPa, nitrogen conversion

167
90.0
95.0
100.0
6.9 7.9 8.9 9.9 10.9
'S' Con
version (%
)
Pressure (MPa)
S Conversion
40.0
50.0
60.0
70.0
80.0
6.9 7.9 8.9 9.9 10.9
'N' Con
version (%
)
Pressure (MPa)
N Conversion
increases from 57.7 to 63.4 wt%. This might be because HDN proceeds through
hydrogenation of the aromatic ring which is strongly influenced by the hydrogen partial
pressure (Topsøe et al., 1996).
Figure 6.3: Effect of pressure on the conversion of sulfur and nitrogen present in heavy gas oil at temperature = 385 °C, LHSV = 1 hr-1, and hydrogen/gas oil ratio = 600 Nm3/m3; HDS (a), HDN (b).
a
b

168
6.1.4 Effect of Hydrogen Gas/Oil Ratio
The effect of the hydrogen/heavy gas oil volumetric ratio on the conversion HDS
and HDN was studied out by changing its value in the range from 400 to 800 Nm3/m3
while keeping temperature, pressure, and LHSV, at 385 °C, 8.9 MPa, and 1.0 h-1,
respectively. The effects of the gas/oil ratio on HDS and HDN are presented in Figure
6.4. It is evident from the figure that there is increase of HDS and HDN activity due to
increase in hydrogen/gas oil ratio. For example, as the hydrogen/heavy gas oil ratio is
increased from 400 to 600 Nm3/m3, the sulfur conversion increases from 90.3 to 92.3
wt% and N conversion increases from 55.5 to 57.7 wt%. For the increase in gas/oil ratio
from 600 to 800 Nm3/m3, sulfur conversion increase from 92.3 to 93.9 wt% and nitrogen
conversion increases from 57.7 to 59.5 wt%. Beyond gas/oil ratio of 800 Nm3/m3, both
HDS and HDN conversions are not significant and the conversion becomes constant.
The effects of temperature, pressure, LHSV and H2/GO ratio on sulfur and nitrogen
conversion of HGO with optimized catalyst is shown in Table 6.1.

169
80.0
85.0
90.0
95.0
100.0
200 400 600 800 1000
'S' Con
version (%
)
Gas/Oil Ratio
S Conversion
40.0
50.0
60.0
70.0
200 400 600 800 1000
'N' Con
version (%
)
Gas/Oil Ratio
N Conversion
Figure 6.4: Effect of hydrogen/gas oil ratio on the conversion of sulfur and nitrogen present in heavy gas oil at temperature = 385 °C, LHSV = 1 hr-1, pressure =8.9 MPa, HDS (a), HDN (b).
a
b

170
Table 6.1: Effect of temperature, pressure, LHSV and H2/gas oil ratio on sulfur and nitrogen conversion for HGO with optimized catalyst.
T (°C)
P (Mpa)
LHSV (hr-1)
H2/GO (Nm3/m3)
S Conversion wt%
N Conversion wt%
375 8.9 0.5 600 94.6 62.7
375 8.9 0.5 600 94.7 62.5
375 8.9 1 600 89.3 48.6
375 8.9 1 600 89.4 48.6
375 8.9 1.5 600 83.3 37.0
375 8.9 1.5 600 82.6 37.0
385 8.9 0.5 600 97.1 79.7
385 8.9 0.5 600 96.9 78.9
385 8.9 1 600 92.7 57.3
385 8.9 1 600 91.9 58.1
385 8.9 1.5 600 89.1 48.2
385 8.9 1.5 600 90.4 47.6
395 8.9 0.5 600 97.9 91.0
395 8.9 0.5 600 97.8 91.7
395 8.9 1 600 93.6 66.2
395 8.9 1 600 93.8 66.8
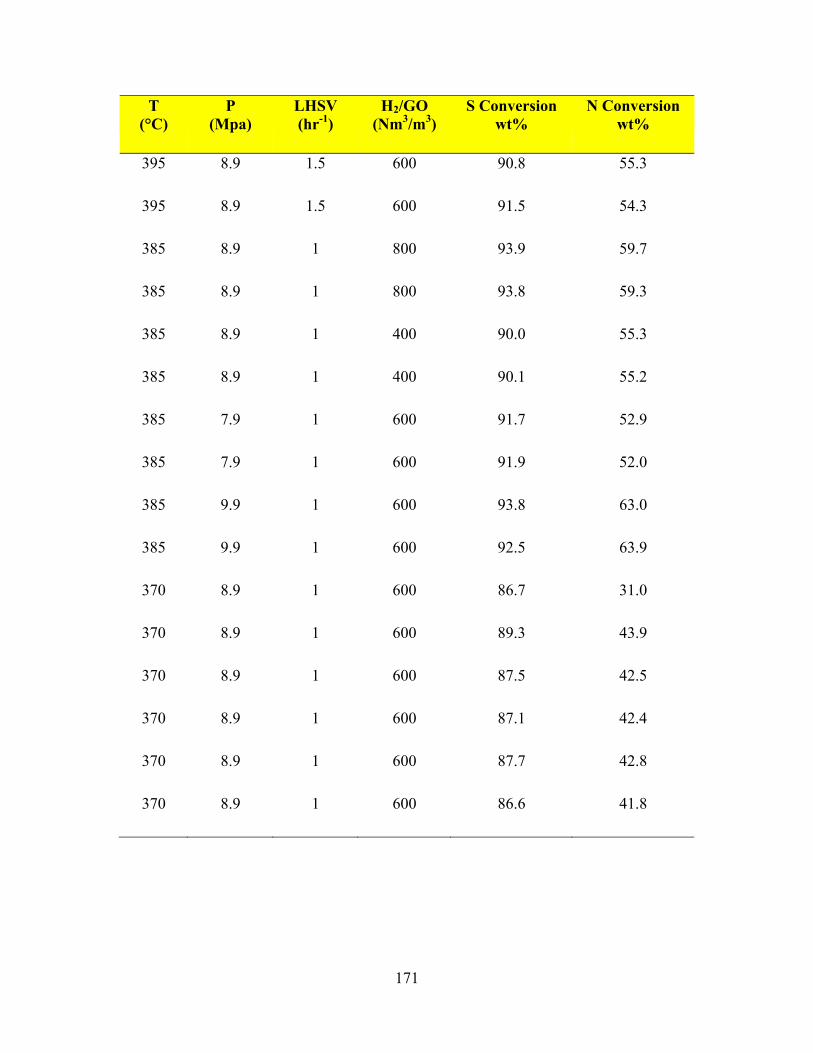
171
T (°C)
P (Mpa)
LHSV (hr-1)
H2/GO (Nm3/m3)
S Conversion wt%
N Conversion wt%
395 8.9 1.5 600 90.8 55.3
395 8.9 1.5 600 91.5 54.3
385 8.9 1 800 93.9 59.7
385 8.9 1 800 93.8 59.3
385 8.9 1 400 90.0 55.3
385 8.9 1 400 90.1 55.2
385 7.9 1 600 91.7 52.9
385 7.9 1 600 91.9 52.0
385 9.9 1 600 93.8 63.0
385 9.9 1 600 92.5 63.9
370 8.9 1 600 86.7 31.0
370 8.9 1 600 89.3 43.9
370 8.9 1 600 87.5 42.5
370 8.9 1 600 87.1 42.4
370 8.9 1 600 87.7 42.8
370 8.9 1 600 86.6 41.8
172
6.2 Kinetic Study of HDS/HDN for the Optimum NiMo/Zr-SBA-15 Catalyst
The kinetic analysis was performed to study the effects of reaction parameters on
the HDS and HDN activities over NiMo/Zr-SBA-15 (optimum with 17 wt% loading)
catalyst and to investigate the effects of mass transfer limitation on the HDS and HDN
reactions using micro scale trickle bed reactor. Based on these information, kinetic
models were developed to predict the hydrotreating activities of the NiMo/Zr-SBA-15
catalyst exhibited during hydrotreating reaction. The following assumptions were made
for the kinetic analysis:
• Trickle bed microreactor operations were considered as steady state isothermal
and plug flow (Mann et al., 1988).
• The effects of H2S and NH3 concentrations on both the mass transfer resistance
and hydrotreating activities were considered negligible (Korsten and Hoffmann,
1996).
• Axial dispersion and wall effects were neglected due to dilution of the catalyst
bed with nonporous, inert particles during experimental run (Bej et al., 2000).
• Complete wetting of catalyst.
The heavy gas oil derived from Athabasca bitumen was selected as feed for kinetic
study. The properties of the HGO feedstock are shown in Table 3.2. The calculation
methods for molar product concentration of sulfur and nitrogen and reaction rates of HDS
and HDN are presented in Appendix A. Calculation of product concentration for HDS
and HDN conversion obtained from kinetic study is presented in Appendix B.
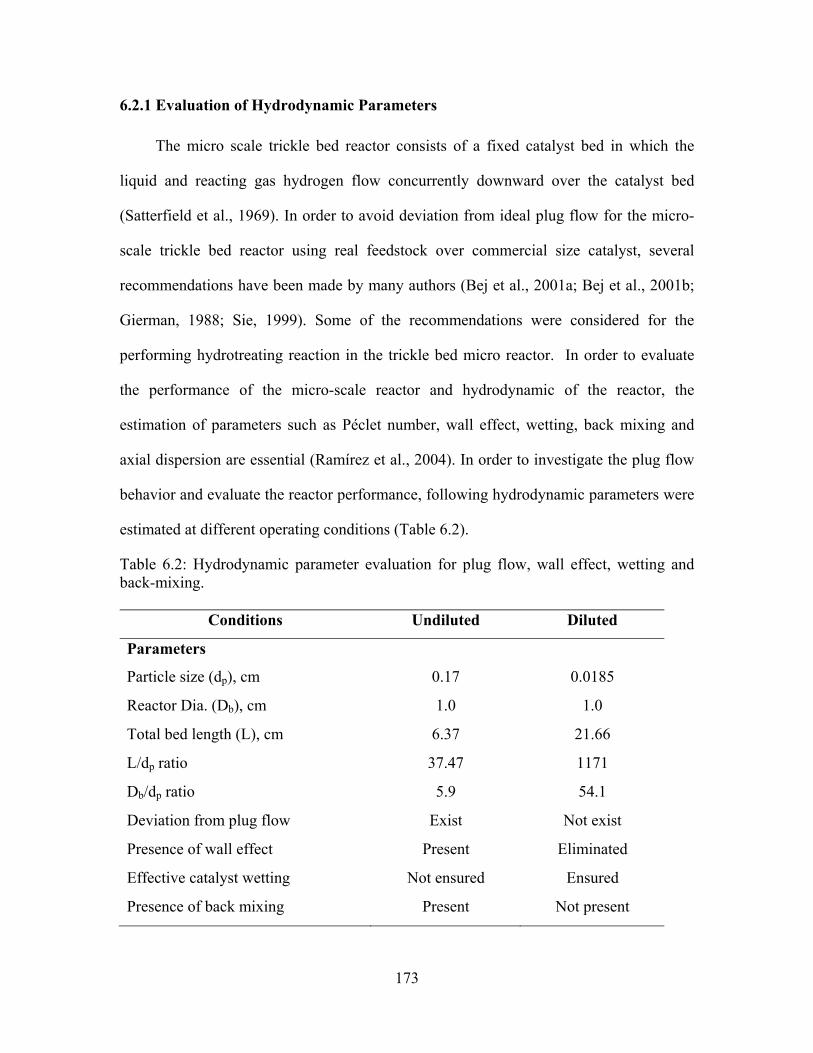
173
6.2.1 Evaluation of Hydrodynamic Parameters
The micro scale trickle bed reactor consists of a fixed catalyst bed in which the
liquid and reacting gas hydrogen flow concurrently downward over the catalyst bed
(Satterfield et al., 1969). In order to avoid deviation from ideal plug flow for the micro-
scale trickle bed reactor using real feedstock over commercial size catalyst, several
recommendations have been made by many authors (Bej et al., 2001a; Bej et al., 2001b;
Gierman, 1988; Sie, 1999). Some of the recommendations were considered for the
performing hydrotreating reaction in the trickle bed micro reactor. In order to evaluate
the performance of the micro-scale reactor and hydrodynamic of the reactor, the
estimation of parameters such as Péclet number, wall effect, wetting, back mixing and
axial dispersion are essential (Ramírez et al., 2004). In order to investigate the plug flow
behavior and evaluate the reactor performance, following hydrodynamic parameters were
estimated at different operating conditions (Table 6.2).
Table 6.2: Hydrodynamic parameter evaluation for plug flow, wall effect, wetting and back-mixing.
Conditions Undiluted Diluted
Parameters
Particle size (dp), cm 0.17 0.0185
Reactor Dia. (Db), cm 1.0 1.0
Total bed length (L), cm 6.37 21.66
L/dp ratio 37.47 1171
Db/dp ratio 5.9 54.1
Deviation from plug flow Exist Not exist
Presence of wall effect Present Eliminated
Effective catalyst wetting Not ensured Ensured
Presence of back mixing Present Not present

174
6.2.2 Mass Transfer Resistances for the HDS and HDN
In trickle bed reactor, the conversion depends on both reaction kinetics and
transport processes. For the hydrotreating reaction in trickle bed, the reaction rate is
greatly influenced by various transport properties such as flow dynamics, mass transfer,
and heat transfer (Ancheyta et al., 2002a). In the trickle bed reactor, where chemical
reaction takes place in porous catalyst, the following mass transfer resistances are
observed during transport of reacting molecules from bulk phase to the active sites of the
catalyst (Bej et al., 2001a):
• from bulk gas to gas-liquid interface,
• from gas-liquid interface to bulk liquid,
• from bulk liquid to external catalyst surface
• intra-particle diffusion
Among all these resistances, resistance due to intra-particle is the predominant one
(Sie and Krishna., 1998). The effects of these diffusion limitations can be significant
which can affect the reported kinetic-quality data and inaccuracy in kinetic parameters
estimation (Ancheyta et al., 2002b). Hence, it is imperative to evaluate the mass transfer
limitation and their influence on the HDS and HDN reaction inside the trickle bed
reactor. The mass transfer evaluation includes: external mass transfer resistance and
internal mass transfer resistance.
External Mass Transfer Resistance for HDS and HDN:
External mass transfer resistance is observed during diffusion of hydrogen (gas
phase) from gas oil (liquid phase) exterior to the catalyst external surface. External mass
transfer limitation was evaluated for NiMo/Zr-SBA-15 catalyst to determine their

175
influence on the result on kinetic study. The external mass transfer resistance was
evaluated with the Satterfield criteria (Satterfield et al., 1969). This criterion checks
whether the rate of diffusion of hydrogen from bulk phase to the catalyst surface is the
rate limiting step. The detailed calculation is presented in Appendix C. In order to
determine whether the mass transfer is the predominant in the reaction set up, the value of
the left hand side of the Satterfield criteria needs to be at least 10 times larger than the
value of the right hand side (Korsten and Hoffmann, 1996). In the present study, the
value of the left hand side was evaluated for both HDS and HDN reactions at all the
temperature of the kinetic studies (375-395 °C).
As per the calculation, for the hydrodesulfurization, the values of LHS of Satterfield
criteria were higher than the RHS value. Hence, it can be concluded that, for the HDS
reaction mass transfer limitation exists. However, in case of hydrodenitrogenation
reaction, at lower conversion (low temperature and higher LHSV) level, LHS values of
Satterfield criteria were lower than the RHS value. This implies that the mass transfer
limitation for the HDN reaction is negligible at lower conversion level. However, at
higher conversion level (higher temperature and lower LHSV), most of the data satisfied
the Satterfield criteria, implying that at higher conversion level mass transfer limitation
exits. Furthermore, it is observed that the hydrogen consumption for HDS reaction is
higher than that for HDN reaction. This trend is attributed to the presence of the high
concentration of the sulfur compounds in the HGO feedstock.
Internal Mass Transfer Resistance for HDS and HDN:
In kinetic study, the presence of the internal mass transfer causes the reduction of
the catalyst effectiveness and reduces the catalytic activity of the catalyst. Hence, it is
176
imperative to eliminate the internal mass transfer limitations, as these lead to erroneous
kinetic data. Internal mass transfer limitation, i.e. pore diffusion limitation consists of the
diffusion of reactants into the catalyst pores.
For the catalytic reaction, catalyst active sites should be accessible to reactants and
reaction products should leave the catalyst pores easily. The effectiveness factor (η) is
defined as the ratio of actual reaction rate with pore diffusion limitation and rate of
reaction with surface conditions in which same sites are accessible without any diffusion
limitations (Fogler, 2006). The value of catalyst effectiveness factor is valid only for
isothermal condition. On the other hand, thermal conductivity limitation results in
temperature gradient within the catalyst pellet (Froment G.F. and Bischoff K.B., 1990).
Hence, for the calculation of internal mass transfer resistance, it is imperative to evaluate
isothermality of the cross-section of the catalyst pellet. Isothermality of the catalyst pellet
can be checked by two methods: A) calculating the highest temperature rise between the
catalyst pellet core and surface of the pellet (Fogler, 2006) and B) Anderson’s criteria
(Anderson, 1963). The details of internal mass transfer analysis are presented in
Appendix D.
β is defined as the ratio of maximum temperature difference that exists in the
catalyst pellet core and catalyst surface and catalyst surface temperature [ΔTmax =(Tmax-
TS)/TS]. β is calculated in order to estimate the temperature rise in the catalyst pellet due
to the reaction. As per the calculation the value of β is 0.000003. Hence, it can be
assumed that the catalyst pellet is isothermal. In order to confirm this assumption, another
method, the Anderson criteria was adopted. Anderson criterion was based on the
comparison between the rate of heat generation from the reaction inside the catalyst pellet
177
and rate of heat removal by conduction and convection. According to the calculation, the
right side of the criterion was found to be far greater than the left side for both reactions;
×105 greater in magnitude for HDS and ×107 greater in magnitude for HDN. Hence, it
can be concluded that isothermal behavior of the NiMo/Zr-SBA-15 catalyst is acceptable.
The dimensionless term, Thiele modulus (ф) determines whether the internal
diffusion limits the overall rate of reaction or the surface reaction limits the reaction rates
(Fogler, 2006). Thiele modulus is defined as ratio of intrinsic reaction rate in the absence
of mass transfer limitation to the rate of diffusion through the pellet (Hill and Hill, 1977).
For the calculation of effectiveness factor the value of Thiele modulus is essential, which
requires the intrinsic reaction rate. However, it is difficult to determine the intrinsic
reaction rate in the presence of the external mass transfer resistance. The modulus (ф)
and effectiveness factor (η) were evaluated for HDS and HDN at the both inlet and outlet
of the reactor. The results are shown in Table D.2 and Table D.3.
The values of Ф for HDS reactions were in the range of 0.791 to 2.42 at the reactor
inlet and 13.09 to 37.26 at the reactor outlet. From the trend it can be observed that Ф
increases over the length of the reactor from inlet to outlet. The η values estimated in the
range of 0.851 to 0.948 at the reactor inlet and 0.207 to 0.455 at the reactor outlet.
Furthermore, lower η values were observed at reactor outlet especially at higher
temperature and lower LHSV. This implies that diffusion limitation in the catalyst pellets
is quite significant at lower sulfur concentration.
The values of Ф for HDN reactions were in the range of 0.60 to 1.3 at the reactor
inlet and 0.9 to 8.9 at the reactor outlet. It is observed that that Ф increases over the
length of the reactor from inlet to outlet. The η values estimated in the range of 0.91 to
178
1.00 at the reactor inlet and 0.56 to 0.94 at the reactor outlet. In most of the cases, the
value of η estimated are higher than 0.9, implying that the most of the HDN reactions are
not significantly affected by internal mass transfer diffusion. However, at higher HDN
conversion level (at higher temperature and lower LHSV) internal mass transfer
limitations for the HDN cannot be neglected.
From the mass transfer studies, it can be concluded that the reaction rate equation
for HDS reaction is extrinsic (i.e. both external and internal mass transfer limitations are
present), whereas the reaction rate equation for HDN is intrinsic in most cases (i.e. no
significant external and internal mass transfer limitations are present).
6.2.3 Hydrodesulfurization and Hydrodenitrogenation Rate kinetics
The following assumptions are considered to develop the rate models:
• The HDS and HDN reactions are irreversible under the operating condition
(Girgis and Gates, 1991)
• The rate equations follow the Power law and Langmuir-Hinshelwood model
• The effect of hydrocracking reactions on HDS and HDN is negligible
Power law and Langmuir-Hinshelwood models were used to express the kinetic
parameters that satisfactorily describe the experimental data and predict the performance
of hydrotreating reactor.
6.2.4 Power Law Model
The removal of sulfur and nitrogen compounds from heavy gas oil can be described
by simple Power law model. The rate expressions for HDS and HDN were fitted using
non-linear regression analysis. The value of activation energy (E) and pre-exponential

179
constant (A) for HDS and HDN was calculated using linear regression. POLYMATHTM
software was employed to perform the regression analysis. The values of the determined
parameters of Power law for HDS and HDN reactions are presented in Table 6.3.
The value of reaction order, n, depends on the boiling range of the feedstock and types of
sulfur and nitrogen compounds present in the feed. In terms of Power law models, heavy
gas oil can have HDS reaction order ranging from 1.0 to 2.5, while HDN reaction order
ranges from 1.0 to 2.0 (Ferdous et al., 2006b; Mapiour et al., 2010a). The reaction order
found from power law modeling for the hydrotreating activity study of NiMo/Zr-SBA-15
catalyst on HGO [reaction order for HDS – 1.8 and reaction order for HDN – 1.3]
appears to be in good agreement with the reported values in the literature (Table 2.16).
The values of activation energies for the HDS and HDN conversion calculated from
power law models are 115 kJ/mol and 121 kJ/mol, respectively. These values are
comparable to the previous reported values (Table 2.16). Higher activation energy
determined for the HDN reaction compared to the HDS reaction, implies the difficultly of
removal of nitrogen compounds present in the heavy gas oil by NiMo/Zr-SBA-15 catalyst
compared to that of removal of sulfur compounds. Similar trend is reported for the
hydrotreatment of Athabasca bitumen derived heavy gas oil using NiMo/zeolite-alumina-
silica catalyst (Diaz-Real et al., 1993; Mann et al., 1988). The value of coefficient of
determination (R2), obtained from Power law is reasonably high, implying the higher
level of accuracy in the Power law model. Furthermore, simple calculation method makes
power law model convenient for determining the performance of NiMo/Zr-SBA-15
catalyst activity towards the hydrotreating of heavy gas oil.

180
Table 6.3: Values derived from Power law model for the HDS and HDN of heavy gas oil over optimized catalyst.
nHDS HDS Sr k C− = ⋅ m
HDN HDN Nr k C− = ⋅
EHDS 115.5 kJ/mol EHDN 120.7 kJ/mol
AHDS 3.26×10⁶ M-0.8·s-1 AHDN 1.78×10⁶ M-0.3·s-1
n 1.78 m 1.33
(R2)HDS 0.9815 (R2)HDN 0.9608
6.2.5 Langmuir-Hinshelwood Model
A Langmuir-Hinshelwood model was developed considering various types of
competitive and non-competitive adsorptions. Following models were considered for the
kinetic calculations:
A. Independent Langmuir Hinshelwood Model:
Assumption considered for this model is that two different reactions take place on
different active sites, i.e. the each reaction is inhibited by its own compounds. The fitted
parameter for this model is shown in Table 6.4. From this model it can be observed that
the calculated HDS activation energy by this method is lower than the HDS activation
energy obtained from power law model. Lower value of R2 indicates that for the HDS
reaction this equation is less predictive. For HDN reaction, the calculated activation
energy by this method is higher than that obtained from power law model. This might be
due to the consideration of inhibition in the Langmuir-Hinshelwood model. Similar trend
is reported in the previous literature (Ferdous et al., 2006b). Higher value of R2 for HDN
reaction implies that independent Langmuir Hinshelwood is quite predictive for the
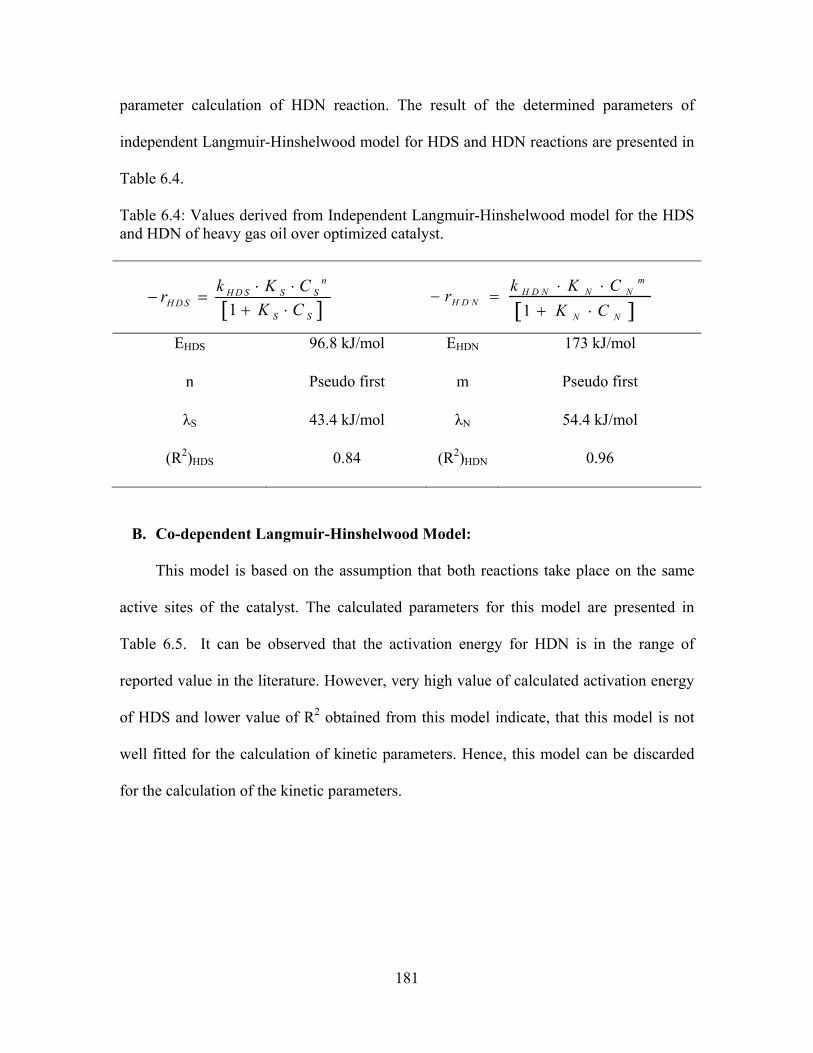
181
parameter calculation of HDN reaction. The result of the determined parameters of
independent Langmuir-Hinshelwood model for HDS and HDN reactions are presented in
Table 6.4.
Table 6.4: Values derived from Independent Langmuir-Hinshelwood model for the HDS and HDN of heavy gas oil over optimized catalyst.
EHDS 96.8 kJ/mol EHDN 173 kJ/mol
n Pseudo first m Pseudo first
λS 43.4 kJ/mol λN 54.4 kJ/mol
(R2)HDS 0.84 (R2)HDN 0.96
B. Co-dependent Langmuir-Hinshelwood Model:
This model is based on the assumption that both reactions take place on the same
active sites of the catalyst. The calculated parameters for this model are presented in
Table 6.5. It can be observed that the activation energy for HDN is in the range of
reported value in the literature. However, very high value of calculated activation energy
of HDS and lower value of R2 obtained from this model indicate, that this model is not
well fitted for the calculation of kinetic parameters. Hence, this model can be discarded
for the calculation of the kinetic parameters.
[ ]1
nH D S S S
H D SS S
k K CrK C⋅ ⋅
− =+ ⋅ [ ]1
mH D N N N
H D NN N
k K CrK C⋅ ⋅
− =+ ⋅
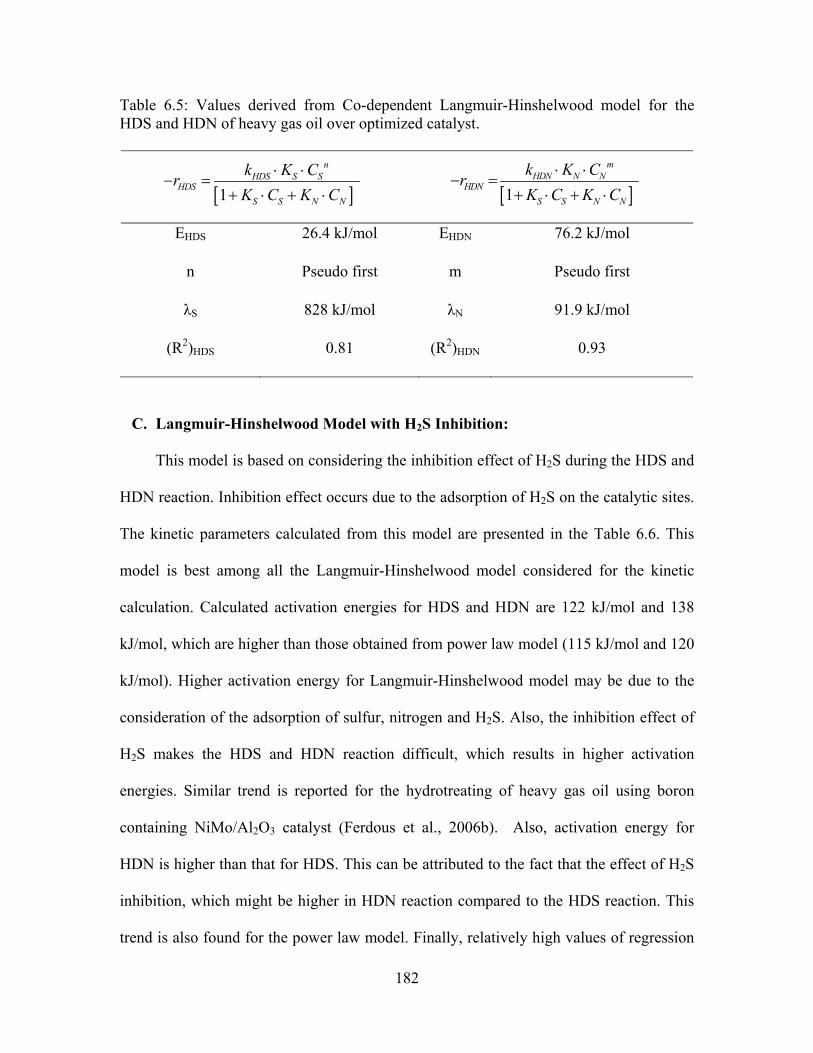
182
Table 6.5: Values derived from Co-dependent Langmuir-Hinshelwood model for the HDS and HDN of heavy gas oil over optimized catalyst.
EHDS 26.4 kJ/mol EHDN 76.2 kJ/mol
n Pseudo first m Pseudo first
λS 828 kJ/mol λN 91.9 kJ/mol
(R2)HDS 0.81 (R2)HDN 0.93
C. Langmuir-Hinshelwood Model with H2S Inhibition:
This model is based on considering the inhibition effect of H2S during the HDS and
HDN reaction. Inhibition effect occurs due to the adsorption of H2S on the catalytic sites.
The kinetic parameters calculated from this model are presented in the Table 6.6. This
model is best among all the Langmuir-Hinshelwood model considered for the kinetic
calculation. Calculated activation energies for HDS and HDN are 122 kJ/mol and 138
kJ/mol, which are higher than those obtained from power law model (115 kJ/mol and 120
kJ/mol). Higher activation energy for Langmuir-Hinshelwood model may be due to the
consideration of the adsorption of sulfur, nitrogen and H2S. Also, the inhibition effect of
H2S makes the HDS and HDN reaction difficult, which results in higher activation
energies. Similar trend is reported for the hydrotreating of heavy gas oil using boron
containing NiMo/Al2O3 catalyst (Ferdous et al., 2006b). Also, activation energy for
HDN is higher than that for HDS. This can be attributed to the fact that the effect of H2S
inhibition, which might be higher in HDN reaction compared to the HDS reaction. This
trend is also found for the power law model. Finally, relatively high values of regression
[ ]1
mHDN N N
HDNS S N N
k K CrK C K C
⋅ ⋅− =
+ ⋅ + ⋅[ ]1
nHDS S S
HDSS S N N
k K CrK C K C
⋅ ⋅− =
+ ⋅ + ⋅
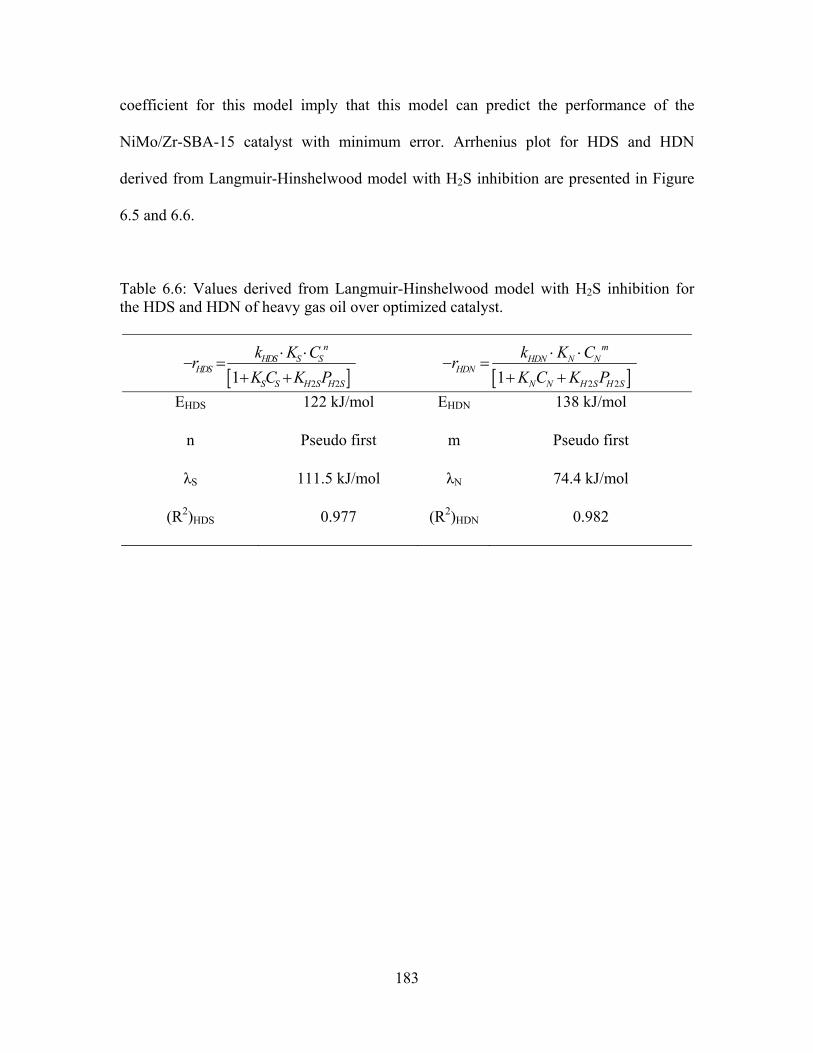
183
coefficient for this model imply that this model can predict the performance of the
NiMo/Zr-SBA-15 catalyst with minimum error. Arrhenius plot for HDS and HDN
derived from Langmuir-Hinshelwood model with H2S inhibition are presented in Figure
6.5 and 6.6.
Table 6.6: Values derived from Langmuir-Hinshelwood model with H2S inhibition for the HDS and HDN of heavy gas oil over optimized catalyst.
EHDS 122 kJ/mol EHDN 138 kJ/mol
n Pseudo first m Pseudo first
λS 111.5 kJ/mol λN 74.4 kJ/mol
(R2)HDS 0.977 (R2)HDN 0.982
[ ]2 21
mHDN N N
HDNN N H S H S
k K CrK C K P
⋅ ⋅− =
+ +[ ]2 21
nHDS S S
HDSS S H S H S
k K CrK C K P
⋅ ⋅− =
+ +

184
Figure 6.5: Arrhenius plot for HDS and HDN derived from Langmuir-Hinshelwood model with H2S inhibition HDS (a), HDN (b).
y = -14.671x + 22.391R² = 0.999
-0.4
0.0
0.4
0.8
1.491.501.511.521.531.541.55
ln(k
-HD
S)
1000*1/T
LH Model : HDS
y = -16.638x + 20.313R² = 0.994
-5.6
-5.2
-4.8
-4.4
1.491.501.511.521.531.541.55
ln(k
-HDS
)
1000*1/T
LH Model : HDN
a
b

185
y = 13.388x - 23.067R² = 0.971
-4.0
-3.0
-2.0
-1.0
0.0
1.491.501.511.521.531.541.55
ln(K
s)
1000*1/T
LH Model : Ks
y = 8.940x - 11.996R² = 0.992
1.0
1.2
1.4
1.6
1.8
2.0
1.491.501.511.521.531.541.55
ln(K
N)
1000*1/T
LH Model: KN
y = 7.661x - 5.303R² = 0.998
6.0
6.2
6.4
6.6
1.491.501.511.521.531.541.55
ln(K
H 2S)
1000*1/T
LH Model : KH2S
Figure 6.6: Arrhenius plot for HDS and HDN derived from Langmuir-Hinshelwood model with H2S inhibition; sulfur (a), nitrogen (b) and H2S (c).
a
b
c
186
6.3 Stability Study for the Optimum NiMo/Zr-SBA-15 Catalyst
In the final phase, the long term stability study with the optimum NiMo/Zr-SBA-15
catalyst was performed. The NiMo/Zr-SBA-15 (optimum), which was used for the
kinetic study at different operating condition (pressure =7.9 to 9.9, temperature =375 to
385 °C, LHSV =0.5 to 1.5 hr-1, gas/oil ratio =400 to 800 Nm3/m3), was used for the
stability study. “zero(0)”day for catalyst stability ( or deactivation) study starts at the end
of kinetic study (45 day), while keeping the reaction temperature at 370 °C, pressure 8.9
MPa, LHSV 1.0 hr-1 and gas/oil ratio 600 Nm3/m3. The samples were collected every 24
hours for 26 days. The HDS and HDN activity for the long term stability test is compared
with the HDS and HDN activity exhibited during initial 5 days of precoking conditions
(temperature at 370 °C, pressure 8.9 MPa, LHSV 1.0 hr-1 and gas/oil ratio 600 Nm3/m3).
The comparison results are presented in Figure 6.7. The HDS and HDN conversion for
precoking day 2nd, 3rd and 5th days are 88.4, 87.7 and 88.4 and 48.4, 43.1 and 43.9
respectively. HDS and HDN conversion for the 20, 23rd and 26th days of operation are
87.9, 88.3 and 88.2 and 43.7, 44.4 and 45.5, respectively. Hence, it can be concluded that
the catalyst stability remains almost constant in long term for both HDS and HDN
reactions.
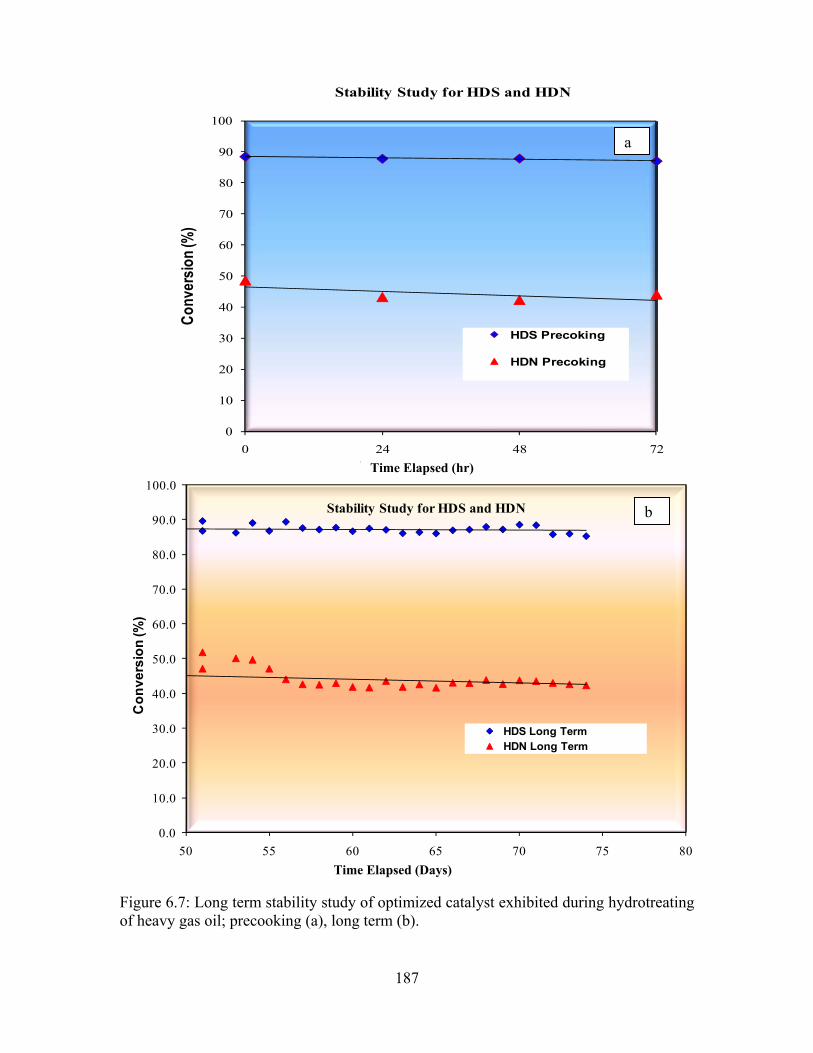
187
0
10
20
30
40
50
60
70
80
90
100
0 24 48 72
Conv
ersio
n (%
)
Time Elasped (hr)
Stability Study for HDS and HDN
HDS Precoking
HDN Precoking
0.0
10.0
20.0
30.0
40.0
50.0
60.0
70.0
80.0
90.0
100.0
50 55 60 65 70 75 80
Con
vers
ion
(%)
Time Elasped (Days)
Stability Study for HDS and HDN
HDS Long TermHDN Long Term
Figure 6.7: Long term stability study of optimized catalyst exhibited during hydrotreating of heavy gas oil; precooking (a), long term (b).
a
b
Time Elapsed (hr)
Time Elapsed (Days)

188
6.4 Characterization of Spent Catalysts
Spent catalysts were characterized with BET surface area method. Before BET
analysis, the spent catalysts were treated with hexane to remove heavy gas oil and fine
silicon carbide particles from the catalyst samples. Result of BET analysis for the spent
catalyst is shown in the Table 6.7. It can be observed from the table that the reduction of
surface area and total pore volume occur in spent catalyst. The reduction in surface area
and pore volume can be attributed to the blockage of pores by carbonaceous materials or
sintering of pores during the reaction.
Table 6.7: BET characterization of fresh and spent catalysts.
Catalyst Surface
Area
(m2/g)
Pore
Diameter
(nm)
Pore
Volume
(m3/g)
Ph-I: Fresh NiMo/Zr-SBA-15 (Post 23) 281 10.1 0.71
Ph-I: Spent NiMo/Zr-SBA-15 (Post 23) 81 9.6 0.19
Ph-II: Fresh NiMo/Zr-SBA-15 (Mo 17) 221 10.1 0.56
Ph-II:Spent NiMo/Zr-SBA-15 (Mo 17) 76 9.0 0.17

189
CHAPTER 7
CONCLUSIONS AND RECOMMENDATIONS
The Main objective of this thesis was to synthesize, characterize and performance
test of NiMo/Zr-SBA-15 catalyst for the hydrodesulfurization (HDS) and
hydrodenitrogenation (HDN) of heavy gas oil (HGO) derived from Athabasca bitumen.
In addition, the kinetic study of HDS and HDN reaction and catalyst stability study were
performed for the best catalyst. A list of conclusion drawn from the thesis is presented in
this section.
7.1 Conclusions
Phase - I: Hydrotreating of gas oil over NiMo/Zr-SBA-15 catalysts
SBA-15 mesoporous material was prepared and successfully modified with Zr
species (Zr and ZrO2) by both the direct and the post synthesis method. The incorporation
of Zr and ZrO2 in SBA-15 increases the surface acidity of SBA-15 support without
significant change in structural ordering. Then, a series of NiMo catalysts supported on
SBA-15 and Zr-SBA-15 (Direct), and Zr-SBA-15 (Post) material were prepared,
characterized, and their hydrotreating activity was studied using heavy gas oil derived
from Athabasca bitumen in a trickle bed reactor. From the catalytic activity test, it was
found that NiMo catalysts supported on Zr-SBA-15 materials prepared by both the post
synthesis method and the direct synthesis method show higher HDS and HDN activities
than that of NiMo/SBA-15 catalyst. The NiMo catalyst supported on the Zr-SBA-15
(Post 23) is the best among the NiMo/Zr-SBA-15 catalyst series and this trend can be
attributed to its following properties: a) excellent textural property (larger pore diameter),
190
b) higher zirconia loading, c) better dispersion of Mo active species, and d) higher
acidity. Furthermore, the NiMo catalyst supported on the Zr-SBA-15 (Post 23) material
exhibits higher catalytic activity compared to that of the commercial NiMo catalyst
supported on γ-Al2O3 (weight basis). This can be attributed to the uniform mesoporous
structure and optimum metal support interaction of the NiMo/Zr-SBA-15 (Post 23)
catalyst compared to the commercial catalyst. This study reveals the potential of the
NiMo/Zr-SBA-15 (Post 23) catalyst to become an efficient alternative to the conventional
γ-Al2O3 supported commercial NiMo catalyst for the hydrotreating of heavy gas oil
feedstock.
Phase-II: Metal loading optimization for NiMo/Zr-SBA-15 catalysts
In the phase II, NiMo/Zr-SBA-15 catalysts with varying metal (Mo and Ni) loading
were prepare and characterized. The performance of all catalysts was evaluated based on
HDS and HDN activity exhibited during hydrotreatment of heavy gas oil (HGO) derived
from Athabasca bitumen. In Zr-SBA-15 supported catalysts, increase HDS and HDN
activities were observed when the Mo loading was increased from 12 wt% to 17 wt%
with constant Mo/Ni mass ratio of 5. This can be attributed to the better textural
characteristics, better dispersion of active metal and higher acidity of NiMo/Zr-SBA-15
catalysts with increasing metal loading. However, a further increase of MoO3 loading up
to 22 wt% led to a decrease in the HDS and HDN activity. This shows that the 17 wt% is
the optimum Mo loading on Zr-SBA-15 support, which gives the highest catalytic
activity. This trend may be attributed to the variation of dispersion of Mo active species
over the support material. The Mo species may be well-dispersed on the support material
up to 17 wt% of loading. The agglomeration of Mo species occurs at the higher loading
191
of 22 wt%, which causes the reduction in catalytic activities. This study reveals that
NiMo catalyst supported on Zr-SBA-15 support with maximum metal loading of 17 wt%
Mo and 3.4 wt% Ni is the best for the hydrotreating of HGO.
Part III: Kinetic study for HDS and HDN
In the phase III, kinetic study of the optimized catalyst was performed by varying
the pressure, temperature, LHSV and gas/oil ratio. Based on the data, the kinetic equation
were developed using Power law and Langmuir-Hinshelwood models. As per the power
law, calculated reaction orders are 1.8 and 1.3 and calculated activation energies are 115
kJ/mol and 120 kJ/mol for the HDS and HDN reaction respectively. Among the three
Langmuir-Hinshelwood models, studied in this work, model with H2S inhibition was well
fitted for the calculation of kinetic parameters. As per this model, the calculated
activation energies are 122 kJ/mol and 138 kJ/mol for HDS and HDN reactions
respectively.
In the long term stability test, the catalyst activity remains almost constant for both HDS
and HDN reactions.
7.2 Recommendations
The following recommendations are made for future work in the field of study:
• Zr-SBA-15 (Direct) support, prepared by direct synthesis method, with better textural
properties and higher Zr loading needs to be prepared and performance of the better Zr-
SBA-15 (Direct) supported NiMo catalyst needs to be carried out for the
hydrotreatment of heavy gas oil.
• Various methods of Zr-SBA-15 support preparation by both direct and post synthesis
methods are discussed in the literature review section. Some of the methods need to be
192
explored for the Zr-SBA-15 support preparation and performance of those supports
needs to be evaluated in the hydrotreating catalyst application.
• The activity enhancement study for the NiMo catalyst supported on Zr-SBA-15
support prepared by post synthesis method needs to be explored by adding some
additives such as phosphorous, boron and fluorine.
• The performance of optimized NiMo/Zr-SBA-15 catalyst needs to be done with the
variety of gas oil, such as straight run light gas oil, vacuum light gas oil /heavy gas oil.
• The hydrodearomatization and hydrodemetalization study needs to done with the
optimized catalyst in order to investigate the performance of this catalyst for the HDA
and HDM reactions.
193
CHAPTER 8
LIST OF REFERENCES
Afanasiev, P., A. Thiollier, M. Breysse and J.L. Dubois, "Control of the textural properties of zirconium oxide," Topics in Catalysis. 8, 147-160 (1999).
Ahmed T., "Hydrocarbon Phase Behavior," Gulf Publishing, Houston (1989).
Amezcua, J.C., L. Lizama, C. Salcedo, I. Puente, J.M. Domínguez and T. Klimova, "NiMo catalysts supported on titania-modified SBA-16 for 4,6-dimethyldibenzothiophene hydrodesulfurization," Catalysis Today. 107-108, 578-588 (2005).
Ancheyta, J. and J.G. Speight, "Hydroprocessing of Heavy Oil and Residua," CRC Press, Taylor and Francis Group:, Boca Raton, FL (2007).
Ancheyta, J., M.J. Angeles, M.J. MacÃas, G. MarroquÃn and R. Morales, "Changes in Apparent Reaction Order and Activation Energy in the Hydrodesulfurization of Real Feedstocks," Energy & Fuels. 16, 189-193 (2002a).
Ancheyta, J., G. Marroquín, M.J. Angeles, M.J. Macías, I. Pitault, M. Forissier and R.D. Morales, "Some experimental observations of mass transfer limitations in a trickle-bed hydrotreating pilot reactor," Energy and Fuels. 16, 1059-1067 (2002b).
Anderson J. B., "Criterion for isothermal behavior of a catalyst pellet," 18, 147-148 (1963).
Babich, I.V. and J.A. Moulijn, "Science and technology of novel processes for deep desulfurization of oil refinery streams: A review," Fuel. 82, 607-631 (2003).
Bataille, F., J.L. Lemberton, G. Pérot, P. Leyrit, T. Cseri, N. Marchal and S. Kasztelan, "Sulfided Mo and CoMo supported on zeolite as hydrodesulfurization catalysts: Transformation of dibenzothiophene and 4,6-dimethyldibenzothiophene," Applied Catalysis A: General. 220, 191-205 (2001).
Bej, S.K., A.K. Dalai and J. Adjaye, "Kinetics of hydrodesulfurization of heavy gas oil derived from oil-sands bitumen," Petroleum Science and Technology. 20, 867-877 (2002).
Bej, S.K., A.K. Dalai and J. Adjaye, "Effect of hydrotreating conditions on the conversion of residual fraction and microcarbon residue present in oil sands derived heavy gas oil," Energy and Fuels. 15, 1103-1109 (2001a).
194
Bej, S.K., A.K. Dalai and J. Adjaye, "Comparison of hydrodenitrogenation of basic and nonbasic nitrogen compounds present in oil sands derived heavy gas oil," Energy and Fuels. 15, 377-383 (2001b).
Bej, S.K., R.P. Dabral, P.C. Gupta, K.K. Mittal, G.S. Sen, V.K. Kapoor and A.K. Dalai, "Studies on the performance of a microscale trickle bed reactor using different sizes of diluent," Energy and Fuels. 14, 701-705 (2000).
Bej, S.K., S.K. Maity and U.T. Turaga, "Search for an Efficient 4,6-DMDBT Hydrodesulfurization Catalyst: A Review of Recent Studies," Energy & Fuels. 18, 1227-1237 (2004).
Bej, S.K., A.K. Dalai and J. Adjaye, "Comparison of Hydrodenitrogenation of Basic and Nonbasic Nitrogen Compounds Present in Oil Sands Derived Heavy Gas Oil," Energy & Fuels. 15, 377-383 (2001).
Berhault, G., M. Perez De la Rosa, A. Mehta, M.J. Yácaman and R.R. Chianelli, "The single-layered morphology of supported MoS2-based catalysts-The role of the cobalt promoter and its effects in the hydrodesulfurization of dibenzothiophene," Applied Catalysis A: General. 345, 80-88 (2008).
Bhaumik, A., S. Samanta and N.K. Mal, "Highly active disordered extra large pore titanium silicate," Microporous and Mesoporous Materials. 68, 29-35 (2004).
Blin, J.L. and B.L. Su, "Tailoring pore size of ordered mesoporous silicas using one or two organic auxiliaries as expanders," Langmuir. 18, 5303-5308 (2002).
Blin, J.L., C. Otjacques, G. Herder and B. Su, "Pore size engineering of mesoporous silicas using alkanes as swelling agents," in "Studies in Surface Science and Catalysis," Abdelhamid Sayari and Mietek Jaroniec, Ed. Elsevier (2000), pp. 75-84.
Botchwey, C., A.K. Dalai and J. Adjaye, "Simulation of a two-stage micro trickle-bed hydrotreating reactor using athabasca bitumen-derived heavy gas oil over commercial NiMo/Al 2O3 catalyst: Effect of H2S on hydrodesulfurization and hydrodenitrogenation," International Journal of Chemical Reactor Engineering. 4, 1-18 (2006).
Botchwey, C., A.K. Dalai and J. Adjaye, "Kinetics of bitumen-derived gas oil upgrading using a commercial NiMo/Al2O3 catalyst," Canadian Journal of Chemical Engineering. 82, 478-487 (2004).
Breysse, M., P. Afanasiev, C. Geantet and M. Vrinat, "Overview of support effects in hydrotreating catalysts," Catalysis Today. 86, 5-16 (2003a).
195
Breysse, M., C. Geantet, P. Afanasiev, J. Blanchard and M. Vrinat, "Recent studies on the preparation, activation and design of active phases and supports of hydrotreating catalysts," Catalysis Today. 130, 3-13 (2008).
Broderick, D.H. and B.C. Gates, "Hydrogenolysis and Hydrogenation of Dibenzothiophene Catalyzed by Sulfided Co0-MoO3/y-AI2O3: The Reaction Kinetics," American Institute of Chemical Engineers Journal. 27, 663-673 (1981).
Burdett, J.K. and J.T. Chung, "Volcano plots, hydrodesulfurization and surface atom pair potentials," Surface Science. 236, L353-L357 (1990).
Callejas, M.A. and M.T. Martínez, "Hydroprocessing of a Maya residue. Intrinsic kinetics of sulfur-, nitrogen-, nickel-, and vanadium-removal reactions," Energy and Fuels. 13, 629-636 (1999).
Cao, L., T. Man and M. Kruk, "Synthesis of ultra-large-pore SBA-15 silica with two-dimensional hexagonal structure using triisopropylbenzene as micelle expander," Chemistry of Materials. 21, 1144-1153 (2009).
Chen, L.F., L.E. Noreña, J. Navarrete and J.A. Wang, "Improvement of surface acidity and structural regularity of Zr-modified mesoporous MCM-41," Materials Chemistry and Physics. 97, 236-242 (2006).
Chen, S.Y., J.F. Lee and S. Cheng, "Pinacol-type rearrangement catalyzed by Zr-incorporated SBA-15," Journal of Catalysis. 270, 196-205 (2010).
Chen, S.Y., L.Y. Jang and S. Cheng, "Synthesis of thermally stable zirconia-based mesoporous materials via a facile post-treatment," Journal of Physical Chemistry B. 110, 11761-11771 (2006).
Chen, S.Y., L.Y. Jang and S. Cheng, "Synthesis of Zr-incorporated SBA-15 mesoporous materials in a self-generated acidic environment," Chemistry of Materials. 16, 4174-4180 (2004).
Cheralathan, K.K., T. Hayashi and M. Ogura, "Post-synthesis coating of alumina on the mesopore walls of SBA-15 by ammonia/water vapour induced internal hydrolysis and its consequences on pore structure and acidity," Microporous and Mesoporous Materials. 116, 406-415 (2008).
Chianelli, R.R., T.A. Pecoraro, T.R. Halbert, W.-. Pan and E.I. Stiefel, "Transition metal sulfide catalysis: Relation of the synergic systems to the periodic trends in hydrodesulfurization," Journal of Catalysis. 86, 226-230 (1984).
Chorkendorff I. and Niemantsverdriet J.W., "Concept of Modern Catalysis and Kinetics," Wiley-VCH, Denmark (2003).
196
Chu, C.F. and K.M. Ng, "Flow in packed tubes with a small tube to particle diameter ratio," AICHE Journal. 35, 148-158 (1989).
Chuah, G.K., S. Jaenicke, S.A. Cheong and K.S. Chan, "The influence of preparation conditions on the surface area of zirconia," Applied Catalysis A: General. 145, 267-284 (1996).
Cocchetto, J.F. and C.N. Satterfield, "Chemical equilibria among quinoline and its reaction products in hydrodenitrogenation," Industrial & Engineering Chemistry Process Design and Development. 20, 49-53 (1981).
Corma, A., "From microporous to mesoporous molecular sieve materials and their use in catalysis," Chemical Reviews. 97, 2373-2419 (1997).
Daage, M. and R.R. Chianelli, "Structure-Function Relations in Molybdenum Sulfide Catalysts: The "Rim-Edge" Model," Journal of Catalysis. 149, 414-427 (1994).
Dang, Z., B.G. Anderson, Y. Amenomiya and B.A. Morrow, "Silica-supported zirconia. 1. Characterization by infrared spectroscopy, temperature-programmed desorption, and X-ray diffraction," Journal of Physical Chemistry. 99, 14437-14443 (1995).
David S.J.J. and Pujadó P. R, "Handbook of Petroleum Processing," Springer, Netherlands (2006).
De Beer, V.H.J., T.H.M. Van Sint Fiet, G.H.A.M. Van Der Steen, A.C. Zwaga and G.C.A. Schuit, "The CoO-MoO3-γ-Al2O3 catalyst. V. Sulfide catalysts promoted by cobalt, nickel, and zinc," Journal of Catalysis. 35, 297-306 (1974a).
De Beer, V.H.J., T.H.M. Van Sint Fiet, G.H.A.M. Van Der Steen, A.C. Zwaga and G.C.A. Schuit, "The CoO-MoO3-γ-Al2O3 catalyst. V. Sulfide catalysts promoted by cobalt, nickel, and zinc," Journal of Catalysis. 35, 297-306 (1974b).
Delgado R. A. S., "Organometallic Modeling of the Hydrodesulfurization and Hydrodenitrogenation Reactions " Kluwer Academic, Netherland (2002).
Delmon B., "A new hypothesis explaining synergy between two phases in heterogeneous catalysis. The case of hydrodesulfurization catalysts," 88, 979-987 (1979).
Delmon, B., "New technical challenges and recent advances in hydrotreatment catalysis. A critical updating review," Catalysis Letters. 22, 1-32 (1993).
Dhar, G.M., G.M. Kumaran, M. Kumar, K.S. Rawat, L.D. Sharma, B.D. Raju and K.S.R. Rao, "Physico-chemical characterization and catalysis on SBA-15 supported molybdenum hydrotreating catalysts," Catalysis Today. 99, 309-314 (2005).

197
Dhar, G.M., B.N. Srinivas, M.S. Rana, M. Kumar and S.K. Maity, "Mixed oxide supported hydrodesulfurization catalysts—a review," Catalysis Today. 86, 45-60 (2003).
Diaz-Real, R.A., R.S. Mann and I.S. Sambi, "Hydrotreatment of athabasca bitumen derived gas oil over Ni-Mo, Ni-W, and Co-Mo catalysts," Industrial and Engineering Chemistry Research. 32, 1354-1358 (1993).
Ding, L., Y. Zheng, Z. Zhang, Z. Ring and J. Chen, "HDS, HDN, HDA, and hydrocracking of model compounds over Mo-Ni catalysts with various acidities," Applied Catalysis A: General. 319, 25-37 (2007).
Domínguez-Crespo, M.A., A.M. Torres-Huerta, L. Díaz-García, E.M. Arce-Estrada and E. Ramírez-Meneses, "HDS, HDN and HDA activities of nickel–molybdenum catalysts supported on alumina," Fuel Processing Technology. 89, 788-796 (2008).
Dorian, J.P., H.T. Franssen and D.R. Simbeck, "Global challenges in energy," Energy Policy. 34, 1984-1991 (2006).
D'Souza, L., A. Suchopar, K. Zhu, D. Balyozova, M. Devadas and R.M. Richards, "Preparation of thermally stable high surface area mesoporous tetragonal ZrO2 and Pt/ZrO2: An active hydrogenation catalyst," Microporous and Mesoporous Materials. 88, 22-30 (2006).
Du, Y., S. Liu, Y. Zhang, F. Nawaz, Y. Ji and F. Xiao, "Urea-assisted synthesis of hydrothermally stable Zr-SBA-15 and catalytic properties over their sulfated samples," Microporous and Mesoporous Materials. 121, 185-193 (2009).
Eijsbouts, S., "On the flexibility of the active phase in hydrotreating catalysts," Applied Catalysis A: General. 158, 53-92 (1997).
Environmental Canada, "http://www.ec.gc.ca/cleanair-airpur/caol/ogeb/fuels/reports," Oct, 2009.
Eswaramoorthi, I., V. Sundaramurthy, N. Das, A.K. Dalai and J. Adjaye, "Application of multi-walled carbon nanotubes as efficient support to NiMo hydrotreating catalyst," Applied Catalysis A: General. 339, 187-195 (2008).
Feng, P., X. Bu, G.D. Stucky and D.J. Pine, "Monolithic mesoporous silica templated by microemulsion liquid crystals [23]," Journal of the American Chemical Society. 122, 994-995 (2000).
Ferdous, D., A.K. Dalai and J. Adjaye, "Comparison of product selectivity during hydroprocessing of bitumen derived gas oil in the presence of NiMo/Al2O3 catalyst containing boron and phosphorus," Fuel. 85, 1286-1297 (2006a).
198
Ferdous, D., A.K. Dalai and J. Adjaye, "Hydrodenitrogenation and hydrodesulfurization of heavy gas oil using NiMo/Al2O3 catalyst containing boron: Experimental and kinetic studies," Industrial and Engineering Chemistry Research. 45, 544-552 (2006b).
Ferdous, D., N.N. Bakhshi, A.K. Dalai and J. Adjaye, "Synthesis, characterization and performance of NiMo catalysts supported on titania modified alumina for the hydroprocessing of different gas oils derived from Athabasca bitumen," Applied Catalysis B: Environmental. 72, 118-128 (2007).
Ferrer, F.J., F. Frutos, J. García-López, C. Jiménez and F. Yubero, "Electrical characteristics of mixed Zr-Si oxide thin films prepared by ion beam induced chemical vapor deposition at room temperature," Thin Solid Films. 517, 5446-5452 (2009).
Fogler H.S., "Elements of Chemical Reaction Engineering," Prentice Hall, Upper Saddle River, New Jersey (2006).
Froment G.F. and Bischoff K.B., "Chemical Reactor Analysis and Design," (1990).
Fulvio, P.F., S. Pikus and M. Jaroniec, "Tailoring properties of SBA-15 materials by controlling conditions of hydrothermal synthesis," Journal of Materials Chemistry. 15, 5049-5053 (2005).
Furimsky E., "Catalysts for Upgrading Heavy Petroleum Feeds. " Studies in Surface Science and Catalysis. 169, 1-387 (2007).
Furimsky, E. and F.E. Massoth, "Hydrodenitrogenation of petroleum," Catalysis Reviews - Science and Engineering. 47, 297-489 (2005).
Furimsky, E. and F.E. Massoth, "Deactivation of hydroprocessing catalysts," Catalysis Today. 52, 381-495 (1999).
Fuxiang, L., Y. Feng, L. Yongli, L. Ruifeng and X. Kechang, "Direct synthesis of Zr-SBA-15 mesoporous molecular sieves with high zirconium loading: Characterization and catalytic performance after sulfated," Microporous and Mesoporous Materials. 101, 250-255 (2007).
Garg, S., K. Soni, G.M. Kumaran, M. Kumar, J.K. Gupta, L.D. Sharma and G.M. Dhar, "Effect of Zr-SBA-15 support on catalytic functionalities of Mo, CoMo, NiMo hydrotreating catalysts," Catalysis Today. 130, 302-308 (2008).
Gary J.H. and Handwerk G.E., "Petroleum Refining Technology and Economics " Marcel Dekker (2001).
Gierman, H., "Design of laboratory hydrotreating reactors. Scaling Down of Trickle-flow Reactors," Applied Catalysis. 43, 277-286 (1988).

199
Girgis, M.J. and B.C. Gates, "Reactivities, reaction networks, and kinetics in high-pressure catalytic hydroprocessing," Industrial & Engineering Chemistry Research. 30, 2021-2058 (1991).
Gómez-Cazalilla, M., J.M. Mérida-Robles, A. Gurbani, E. Rodríguez-Castellón and A. Jiménez-López, "Characterization and acidic properties of Al-SBA-15 materials prepared by post-synthesis alumination of a low-cost ordered mesoporous silica," Journal of Solid State Chemistry. 180, 1130-1140 (2007).
Grange, P., "Catalytic hydrodesulfurization." Catalysis Reviews - Science and Engineering. 21, 135-181 (1980).
Grange, P. and X. Vanhaeren, "Hydrotreating catalysts, an old story with new challenges," Catalysis Today. 36, 375-391 (1997).
Gray M.R., "Upgrading Petroleum Residues and Heavy Oils," Marcel Dekker Inc. (1994), pp. 348.
Gutiérrez, O.Y., A. Erika, I. Puente and T. Klimova, "Application of new ZrO2-SBA-15 materials as catalytic supports: Study of intrinsic activity of Mo catalysts in deep HDS," Chemical Engineering Communications. 196, 1163-1177 (2009).
Gutiérrez, O.Y., D. Valencia, G.A. Fuentes and T. Klimova, "Mo and NiMo catalysts supported on SBA-15 modified by grafted ZrO2 species: Synthesis, characterization and evaluation in 4,6-dimethyldibenzothiophene hydrodesulfurization," Journal of Catalysis. 249, 140-153 (2007).
Gutiérrez, O.Y., G.A. Fuentes, C. Salcedo and T. Klimova, "SBA-15 supports modified by Ti and Zr grafting for NiMo hydrodesulfurization catalysts," Catalysis Today. 116, 485-497 (2006a).
Gutiérrez, O.Y., K.A. Romero, G.A. Fuentes and T. Klimova, "New NiMo catalysts supported on ZrO2-modified SBA-15 materials for 4,6-dimethyldibenzothiophene hydrodesulfurization," Studies in Surface Science and Catalysis. 162, 355-362 (2006b).
Gutiérrez, O.Y., F. Pérez, G.A. Fuentes, X. Bokhimi and T. Klimova, "Deep HDS over NiMo/Zr-SBA-15 catalysts with varying MoO3 loading," Catalysis Today. 130, 292-301 (2008).
Hagen J., "Industrial Catalysis A Practical Approach," Wiley-Vch, Germany (2006).
Hagen, A., D. Wei and G.L. Haller, "Titanium containing MCM-41 molecular sieves prepared by secondary treatment,"Studies in Surface Science and Catalysis 117, 191-200(1998).

200
Harris, S. and R.R. Chianelli, "Catalysis by transition metal sulfides: A theoretical and experimental study of the relation between the synergic systems and the binary transition metal sulfides," Journal of Catalysis. 98, 17-31 (1986).
Hensen, E.J.M., P.J. Kooyman, Y. Van der Meer, A.M. Van der Kraan, V.H.J. De Beer, J.A.R. Van Veen and R.A. Van Santen, "The relation between morphology and hydrotreating activity for supported MoS2 particles," Journal of Catalysis. 199, 224-235 (2001).
Hill C. G. and Hill D., "An Introduction to Chemical Engineering Kinetics and Reactor Design," John Wiley and Sons (1977).
Hinnemann, B., J.K. NØrskov and H. TopsØe, "A density functional study of the chemical differences between type I and type II MoS2-based structures in hydrotreating catalysts," Journal of Physical Chemistry B. 109, 2245-2253 (2005).
Hong, N., L. Mingfeng, G. Xiaodong, S. Yahua and L. Dadong, "New Progress of Producing Clean Fuels— Hydrogenation Catalyst and Technology Developed by RIPP," Research Institute of Petroleum Processing , SINOPEC. (2006).
Huang, W., A. Duan, Z. Zhao, G. Wan, G. Jiang, T. Dou, K.H. Chung and J. Liu, "Ti-modified alumina supports prepared by sol-gel method used for deep HDS catalysts," Catalysis Today. 131, 314-321 (2008a).
Huang, Z.-., W. Bensch, L. Kienle, S. Fuentes, G. Alonso and C. Ornelas, "SBA-15 as support for MoS2 and Co-MoS2 catalysts derived from thiomolybdate complexes in the reaction of HDS of DBT," Catalysis Letters. 122, 57-67 (2008b).
International Energy Outlook, 2., "International Energy Outlook, 2004,"Http://www. Iea. org/textbase/nppdf/free/2004/weo2004. Pdf Oct, 2009, 577(2004).
Jacobsen, C.J.H., N.Y. Topsoe, H. Topsoe, L. Kellberg and H.J. Jakobsen, "Quantitative 1H MAS NMR Studies of Structurally Different OH Surface Groups on η-Al2O3 and Mol-/η-Al2O3 Catalysts," Journal of Catalysis. 154, 65-68 (1995).
Jana, S.K., R. Nishida, K. Shindo, T. Kugita and S. Namba, "Pore size control of mesoporous molecular sieves using different organic auxiliary chemicals," Microporous and Mesoporous Materials. 68, 133-142 (2004).
Jayne, D., Y. Zhang, S. Haji and C. Erkey, "Dynamics of removal of organosulfur compounds from diesel by adsorption on carbon aerogels for fuel cell applications," International Journal of Hydrogen Energy. 30, 1287-1293 (2005).
Ji, Y., P. Afanasiev, M. Vrinat, W. Li and C. Li, "Promoting effects in hydrogenation and hydrodesulfurization reactions on the zirconia and titania supported catalysts," Applied Catalysis A: General. 257, 157-164 (2004).

201
Jia, M., P. Afanasiev and M. Vrinat, "The influence of preparation method on the properties of NiMo sulfide catalysts supported on ZrO2," Applied Catalysis A: General. 278, 213-221 (2005).
Jiménez, F., V. Kafarov and M. Nuñez, "Modeling of industrial reactor for hydrotreating of vacuum gas oils. Simultaneous hydrodesulfurization, hydrodenitrogenation and hydrodearomatization reactions," Chemical Engineering Journal. 134, 200-208 (2007).
Joshi, Y.V., P. Ghosh, M. Daage and W.N. Delgass, "Support effects in HDS catalysts: DFT analysis of thiolysis and hydrolysis energies of metal-support linkages," Journal of Catalysis. 257, 71-80 (2008).
Kabe T., Ishihara A. and Qian W., "Hydrodesulfurization and Hydrodenitrogenation Chemistry and Engineering," Kodansha,Wiley-VCH, Tokyo (1998), pp. 374.
Kabe, T., W. Qian and A. Ishihara, "Elucidation of hydrodesulfurization mechanism using 35S radioisotope pulse tracer methods," Catalysis Today. 39, 3-12 (1997).
Kabe, T., W.H. Qian and A. Ishihara, "Study of Hydrodesulfurization of Dibenzothiophene on Ni-Mo/Al2O3, Mo/Al2O3, and Ni/Al2O3 Catalysts by the Use of Radioisotope 35S Tracer," Journal of Catalysis. 149, 171-180 (1994).
Kabe, T., W.H. Qian, S. Ogawa and A. Ishihara, "Mechanism of Hydrodesulfurization of Dibenzothiophene on Co-Mo/Al2O3 and Co/Al2O3 Catalyst by the Use of Radioisotope 35S Tracer," Journal of Catalysis. 143, 239-248 (1993).
Kemdeo, S.M., V.S. Sapkal and G.N. Chaudhari, "TiO2-SiO2 mixed oxide supported MoO3 catalyst: Physicochemical characterization and activities in nitration of phenol," Journal of Molecular Catalysis A: Chemical. 323, 70-77 (2010).
Kim, D.J., B.C. Dunn, P. Cole, G.C. Turpin, R.D. Ernst, R.J. Pugmire and E.M. Eyring, "Ordered Mesoporous Silica Supported Cobalt Catalysts for FT Synthesis: Impregnation Method and Solvent Exchange," CFFS Annual Technical Meeting. (2004).
Klicpera, T. and M. Zdražil, "Preparation of high-activity MgO-supported Co-Mo and Ni-Mo sulfide hydrodesulfurization catalysts," Journal of Catalysis. 206, 314-320 (2002).
Klimova, T., E. Rodríguez, M. Martínez and J. Ramírez, "Synthesis and characterization of hydrotreating Mo catalysts supported on titania-modified MCM-41," Microporous and Mesoporous Materials. 44-45, 357-365 (2001).
Klimova, T., L. Peña, L. Lizama, C. Salcedo and O.Y. Gutiérrez, "Modification of activity and selectivity of NiMo/SBA-15 HDS catalysts by grafting of different metal oxides on the support surface," Industrial and Engineering Chemistry Research. 48, 1126-1133 (2009).

202
Knudsen, K.G., B.H. Cooper and H. Topsøe, "Catalyst and process technologies for ultra low sulfur diesel," Applied Catalysis A: General. 189, 205-215 (1999).
Korsten, H. and U. Hoffmann, "Three-Phase Reactor Model for Hydrotreating in Pilot Trickle-Bed Reactors," American Institute of Chemical Engineers Journal. 42, 1350-1360 (1996).
Kostova, N.G., A.A. Spojakina, K. Jiratova, O. Solcova, L.D. Dimitrov and L.A. Petrov, "Hexagonal mesoporous silicas with and without Zr as supports for HDS catalysts," Catalysis Today. 65, 217-223 (2001).
Krishnan, J.M. and K.R. Rajagopal, "Review of the uses and modeling of bitumen from ancient to modern times," Applied Mechanics Reviews. 56, 149-214 (2003).
Kruk, M. and L. Cao, "Pore size tailoring in large-pore SBA-15 silica synthesized in the presence of hexane," Langmuir. 23, 7247-7254 (2007).
Kushmerick, J.G., S.A. Kandel, P. Han, J.A. Johnson and P.S. Weiss, "Atomic-Scale Insights into Hydrodesulfurization," Journal of Physical Chemistry B. 104, 2980-2988 (2000).
Landau, M.V., "Deep hydrotreating of middle distillates from crude and shale oils," Catalysis Today. 36, 393-429 (1997).
Landau, M.V., L. Vradman, X. Wang and L. Titelman, "High loading TiO2 and ZrO2 nanocrystals ensembles inside the mesopores of SBA-15: Preparation, texture and stability," Microporous and Mesoporous Materials. 78, 117-129 (2005).
Lauritsen, J.V., J. Kibsgaard, G.H. Olesen, P.G. Moses, B. Hinnemann, S. Helveg, J.K. Nørskov, B.S. Clausen, H. Topsøe, E. Lægsgaard and F. Besenbacher, "Location and coordination of promoter atoms in Co- and Ni-promoted MoS2-based hydrotreating catalysts," Journal of Catalysis. 249, 220-233 (2007).
Ledoux, M.J., O. Michaux, G. Agostini and P. Panissod, "CoMo sulfide catalysts studies by metal solid NMR: The question of the existence of the chemical synergy," Journal of Catalysis. 96, 189-201 (1985).
Lee S., Speight J.G. and Loyalka S.K., "Handbook of Alternative Fuel Technologies," CRC Press, Taylor and Francis Group: Boca Raton, FL. (2007).
Lettow, J.S., Y.J. Han, P. Schmidt-Winkel, P. Yang, D. Zhao, G.D. Stucky and J.Y. Ying, "Hexagonal to mesocellular foam phase transition in polymer-templated mesoporous silicas," Langmuir. 16, 8291-8295 (2000).
203
Li, B., S. Inagaki, C. Miyazaki and H. Takahashi, "Preparation of highly ordered mesoporous silica materials and application as immobilized enzyme supports in organic solvent," Chemical Journal on Internet. 2, 1-9 (2000).
Li, W., F. Cheng, Z. Tao and J. Chen, "Vapor-transportation preparation and reversible lithium intercalation/deintercalation of α-MoO3 microrods," Journal of Physical Chemistry B. 110, 119-124 (2006).
Lin, C.-., H.-. Lin, C.-. Mou and S.-. Liu, "Periodic mesoporous silicas via templating of new triblock amphiphilic copolymers," Microporous and Mesoporous Materials. 91, 151-155 (2006).
Liu, K. and F.T.T. Ng, "Effect of the nitrogen heterocyclic compounds on hydrodesulfurization using in situ hydrogen and a dispersed Mo catalyst," Catalysis Today. 149, 28-34 (2010).
Liu, Y.M., Y. Cao, N. Yi, W.L. Feng, W.L. Dai, S.R. Yan, H.Y. He and K. Fan, "Vanadium oxide supported on mesoporous SBA-15 as highly selective catalysts in the oxidative dehydrogenation of propane," Journal of Catalysis. 224, 417-428 (2004).
Lu, M., A. Wang, X. Li, X. Duan, Y. Teng, Y. Wang, C. Song and Y. Hu, "Hydrodenitrogenation of quinoline catalyzed by MCM-41-supported nickel phosphides," Energy and Fuels. 21, 554-560 (2007).
Luan, Z., E.M. Maes, P.A.W. Van Der Heide, D. Zhao, R.S. Czernuszewicz and L. Kevan, "Incorporation of titanium, into mesoporous silica molecular sieve SBA-15," Chemistry of Materials. 11, 3680-3686 (1999).
Maity, S.K., M.S. Rana, S.K. Bej, J. Ancheyta-Juárez, G. Murali Dhar and T.S.R. Prasada Rao, "Studies on physico-chemical characterization and catalysis on high surface area titania supported molybdenum hydrotreating catalysts," Applied Catalysis A: General. 205, 215-225 (2001).
Maity, S.K., M.S. Rana, B.N. Srinivas, S.K. Bej, G. Murali Dhar and T.S.R. Prasada Rao, "Characterization and evaluation of ZrO2 supported hydrotreating catalysts," Journal of Molecular Catalysis A: Chemical. 153, 121-127 (2000).
Mann, R.S., I.S. Sambi and K.C. Khulbe, "Hydrofining of heavy gas oil on zeolite-alumina supported nickel-molybdenum catalyst," Industrial and Engineering Chemistry Research®. 27, 1788-1792 (1988).
Mapiour, M., V. Sundaramurthy, A.K. Dalai and J. Adjaye, "Effects of hydrogen partial pressure on hydrotreating of heavy gas oil derived from oil-sands bitumen: Experimental and kinetics," Energy and Fuels. 24, 772-784 (2010a).

204
Mapiour, M., V. Sundaramurthy, A.K. Dalai and J. Adjaye, "Effects of the operating variables on hydrotreating of heavy gas oil: Experimental, modeling, and kinetic studies," Fuel. 89, 2536-2543 (2010b).
Marroquín, G., J. Ancheyta and C. Esteban, "A batch reactor study to determine effectiveness factors of commercial HDS catalyst," Catalysis Today. 104, 70-75 (2005).
Matsushita, K., A. Hauser, A. Marafi, R. Koide and A. Stanislaus, "Initial coke deposition on hydrotreating catalysts. Part 1. Changes in coke properties as a function of time on stream," Fuel. 83, 1031-1038 (2004).
Mears, D.E., "Tests for transport limitations in experimental catalytic reactors," Industrial and Engineering Chemistry: Process Design and Development. 10, 541-547 (1971).
Melero, J.A., J.M. Arsuaga, P.D. Frutos, J. Iglesias, J. Sainz and S. Blázquez, "Direct synthesis of titanium-substituted mesostructured materials using non-ionic surfactants and titanocene dichloride," Microporous and Mesoporous Materials. 86, 364-373 (2005).
Mochida, I. and K.-. Choi, "An overview of hydrodesulfurization and hydrodenitrogenation," Journal of the Japan Petroleum Institute. 47, 145-163 (2004).
Montesinos-Castellanos, A. and T.A. Zepeda, "High hydrogenation performance of the mesoporous NiMo/Al(Ti, Zr)-HMS catalysts," Microporous and Mesoporous Materials. 113, 146-162 (2008).
Moses, P.G., B. Hinnemann, H. Topsøe and J.K. Nørskov, "The effect of Co-promotion on MoS2 catalysts for hydrodesulfurization of thiophene: A density functional study," Journal of Catalysis. 268, 201-208 (2009).
Moulijn, J.A., A.E. Van Diepen and F. Kapteijn, "Catalyst deactivation: Is it predictable? What to do?" Applied Catalysis A: General. 212, 3-16 (2001).
Nagarajan, R., "Solubilization of hydrocarbons and resulting aggregate shape transitions in aqueous solutions of Pluronic® (PEO-PPO-PEO) block copolymers," Colloids and Surfaces B: Biointerfaces. 16, 55-72 (1999).
Namba, S., A. Mochizuki and M. Kito, "Fine control of pore size of highly ordered MCM-41 by using template mixtures of dodecyltrimethylammonium bromide/hexadecyltrimethylammonium bromide with various molar ratios," Chemistry Letters., 569-570 (1998).
Nava, R., R.A. Ortega, G. Alonso, C. Ornelas, B. Pawelec and J.L.G. Fierro, "CoMo/Ti-SBA-15 catalysts for dibenzothiophene desulfurization," Catalysis Today. 127, 70-84 (2007).

205
Newalkar, B.L., J. Olanrewaju and S. Komarneni, "Microwave-hydrothermal synthesis and characterization of zirconium substituted SBA-15 mesoporous silica," Journal of Physical Chemistry B. 105, 8356-8360 (2001).
Nørskov, J.K., B.S. Clausen and H. Topsøe, "Understanding the trends in the hydrodesulfurization activity of the transition metal sulfides," Catalysis Letters. 13, 1-8 (1992).
Owusu-Boakye, A., A.K. Dalai, D. Ferdous and J. Adjaye, "Experimental and kinetics studies of aromatic hydrogenation in a two-stage hydrotreating process using NIMO/AL2O3 and NIW/AL 2O3 catalysts," Canadian Journal of Chemical Engineering. 84, 572-580 (2006).
Prins, R., M. Egorova, A. Röthlisberger, Y. Zhao, N. Sivasankar and P. Kukula, "Mechanisms of hydrodesulfurization and hydrodenitrogenation," Catalysis Today. 111, 84-93 (2006).
Probst K., Wohlfahrt K., “Empirical estimate of effective diffusion coefficients in porous systems”, Chemie Ingenieur Technik, 737-738, 51, 1979
Rahimi, P., C. Fairbridge, M. Oballa, C. Wong and A. Somogyvari, "Effect of hydrotreating on the stability of synthetic crude from western Canada," ACS Division of Fuel Chemistry, Preprints. 43, 13-15 (1998).
Ramírez, L.F., J. Escobar, E. Galván, H. Vaca, F.R. Murrieta and M.R.S. Luna, "Evaluation of diluted and undiluted trickle-bed hydrotreating reactor with different catalyst volume," Petroleum Science and Technology. 22, 157-175 (2004).
Ratnasamy, P. and S. Sivasanker, "Structural chemistry of Co-Mo-alumina catalysts." Catalysis Reviews Softcover Ed. 22, 401-429 (1980).
Rayo, P., J. Ramírez, M.S. Rana, J. Ancheyta and A. Aguilar-Elguézabal, "Effect of the incorporation of Al, Ti, and Zr on the cracking and hydrodesulfurization activity of NiMo/SBA-15 catalysts," Industrial and Engineering Chemistry Research. 48, 1242-1248 (2009).
Rayo, P., M.S. Rana, J. Ramírez, J. Ancheyta and A. Aguilar-Elguézabal, "Effect of the preparation method on the structural stability and hydrodesulfurization activity of NiMo/SBA-15 catalysts," Catalysis Today. 130, 283-291 (2008).
Richardson J. T., "Principles of Catalyst Development," Springer, New York (1989).
Rodríguez, M.A. and J. Ancheyta, "Modeling of hydrodesulfurization (HDS), hydrodenitrogenation (HDN), and the hydrogenation of aromatics (HDA) in a vacuum gas oil hydrotreater," Energy and Fuels. 18, 789-794 (2004).
206
Salas, P., J.A. Wang, H. Armendariz, C. Angeles-Chavez and L.F. Chen, "Effect of the Si/Zr molar ratio on the synthesis of Zr-based mesoporous molecular sieves," Materials Chemistry and Physics. 114, 139-144 (2009).
Sampieri, A., S. Pronier, J. Blanchard, M. Breysse, S. Brunet, K. Fajerwerg, C. Louis and G. Pérot, "Hydrodesulfurization of dibenzothiophene on MoS2/MCM-41 and MoS2/SBA-15 catalysts prepared by thermal spreading of MoO3," Catalysis Today. 107-108, 537-544 (2005).
Satterfield, C.N., "Heterogeneous Catalysis in Industrial Practice," McGraw-Hill, New York (1991).
Satterfield, C.N. and S.H. Yang, "Catalytic hydrodenitrogenation of quinoline in a trickle-bed reactor. Comparison with vapor phase reaction," Industrial & Engineering Chemistry Process Design and Development. 23, 11-19 (1984).
Satterfield,C.N.,Pelossof A.A., Sherwood T.K., "Mass transfer limitations in trickle bed reactor," 15, 224-226 (1969).
Sayari, A., "Catalysis by crystalline mesoporous molecular sieves," Chemistry of Materials. 8, 1840-1852 (1996).
Schmidt-Winkel, P., J. Lukens W.W., P. Yang, D.I. Margolese, J.S. Lettow, J.Y. Ying and G.D. Stucky, "Microemulsion templating of siliceous mesostructured cellular foams with well-defined ultralarge mesopores," Chemistry of Materials. 12, 686-696 (2000).
Schuit, G.C.A. and B.C. Gates, "Chemistry and engineering of catalytic hydrodesulfurization," AICHE Journal. 19, 417-438 (1973).
Schulz, H., M. Schon and N.M. Rahman, "Chapter 6 Hydrogenative Denitrogenation of Model Compounds as Related to the Refining of Liquid Fuels,"Studies in Surface Science and Catalysis 27, 201-255(1986).
Sie, S.T., "Reaction order and role of hydrogen sulfide in deep hydrodesulfurization of gas oils: Consequences for industrial reactor configuration," Fuel Processing Technology. 61, 149-171 (1999).
Sigurdson, S., V. Sundaramurthy, A.K. Dalai and J. Adjaye, "Phosphorus promoted trimetallic NiMoW/γ-Al2O3 sulfide catalysts in gas oil hydrotreating," Journal of Molecular Catalysis A: Chemical. 291, 30-37 (2008).
Song, C., "An overview of new approaches to deep desulfurization for ultra-clean gasoline, diesel fuel and jet fuel," Catalysis Today. 86, 211-263 (2003).

207
Song, C. and X. Ma, "New design approaches to ultra-clean diesel fuels by deep desulfurization and deep dearomatization," Applied Catalysis B: Environmental. 41, 207-238 (2003).
Soni, K., K.C. Mouli, A.K. Dalai and J. Adjaye, "Influence of frame connectivity of SBA-15 and KIT-6 supported NiMo catalysts for hydrotreating of gas oil," Catalysis Letters. 136, 116-125 (2010).
Speight J. G., "The Desulfurization of Heavy Oil and Residua " Marcel Dekker (1999).
Speight, J.G., "Upgrading heavy oils and residua: the nature of the problem."Studies in Surface Science and Catalysis, 515-527(1984).
Speight, J.G., "The Chemistry and Technology of Petroleum," CRC Press, Taylor and Francis Group:, Boca Raton, FL, (2006).
Sun, J., H. Zhang, D. Ma, Y. Chen, X. Bao, A. Klein-Hoffmann, N. Pfänder and D.S. Su, "Alkanes-assisted low temperature formation of highly ordered SBA-15 with large cylindrical mesopores," Chemical Communications., 5343-5345 (2005).
Szczodrowski, K., B. Prélot, S. Lantenois, J.-. Douillard and J. Zajac, "Effect of heteroatom doping on surface acidity and hydrophilicity of Al, Ti, Zr-doped mesoporous SBA-15," Microporous and Mesoporous Materials. 124, 84-93 (2009).
Szczodrowski, K., B. Prélot, S. Lantenois, J. Zajac, M. Lindheimer, D. Jones, A. Julbe and A. van der Lee, "Effect of synthesis conditions on the pore structure and degree of heteroatom insertion in Zr-doped SBA-15 silica-based materials prepared by classical or microwave-assisted hydrothermal treatment," Microporous and Mesoporous Materials. 110, 111-118 (2008).
Taguchi, A. and F. Schüth, "Ordered mesoporous materials in catalysis," Microporous and Mesoporous Materials. 77, 1-45 (2005).
Tanaka, Y., H. Iki, K. Hayasaka and S. Hatanaka, "A Practical Approach to 10 ppm Sulfur Diesel Production,"13th Annual Saudi-Japanse Symposium - Catalysts in Petroleum Refining and Petrochemicals, Proceedings, 90-96(2003).
Topsøe, H., "The role of Co-Mo-S type structures in hydrotreating catalysts," Applied Catalysis A: General. 322, 3-8 (2007).
Topsøe, H., B.S. Clausen and Massoth, "Hydrotreating Catalysis –Science and Technology,Vol 11," Springer, Berlin (1996).
Topsøe, H., B.S. Clausen, R. Candia, C. Wivel and S. Mørup, "In situ Mössbauer emission spectroscopy studies of unsupported and supported sulfided CoMo
208
hydrodesulfurization catalysts: Evidence for and nature of a CoMoS phase," Journal of Catalysis. 68, 433-452 (1981).
Topsoe, H. and B.S. Clausen, "Importance of Co-Mo-S type structures in hydrodesulfurization. " Catalysis Reviews. 26, 395-420 (1984).
Tsamatsoulis, D. and N. Papayannakos, "Investigation of intrinsic hydrodesulphurization kinetics of a VGO in a trickle bed reactor with backmixing effects," Chemical Engineering Science. 53, 3449-3458 (1998).
Van Hasselt, B.W., P.J.M. Lebens, H.P.A. Calis, F. Kapteijn, S.T. Sie, J.A. Moulijn and C.M. Van den Bleek, "A numerical comparison of alternative three-phase reactors with a conventional trickle-bed reactor. The advantages of countercurrent flow for hydrodesulfurization," Chemical Engineering Science. 54, 4791-4799 (1999).
Van Looij, F., P. Van Der Laan, W.H.J. Stork, D.J. DiCamillo and J. Swain, "Key parameters in deep hydrodesulfurization of diesel fuel," Applied Catalysis A: General. 170, 1-12 (1998).
Vissers J. P. R., Beer V. H. J., Prins R., "The Role of Co in Sulphidised CO-MO Hydrodesulphurisation Catalysts supported on Carbon and Alumina," 83, 2145-2155 (1987).
Voorhoeve, R.J.H., "Electron spin resonance study of active centers in nickel-tungsten sulfide hydrogenation catalysts," Journal of Catalysis. 23, 236-242 (1971).
Vradman, L., M.V. Landau, M. Herskowitz, V. Ezersky, M. Talianker, S. Nikitenko, Y. Koltypin and A. Gedanken, "High loading of short WS2 slabs inside SBA-15: Promotion with nickel and performance in hydrodesulfurization and hydrogenation," Journal of Catalysis. 213, 163-175 (2003).
Wan Y. and Zhao D., "On the Controllable Soft-Templating Approach to Mesoporous Silicates," 107, 2821 (2006).
Wijngaarden R.J., Kronberg A., Westerterp K.R., "Industrial Catalysis: Optimizing Catalysts and Processes," Wiley-VCH, Weinheim (1998).
Wu, S., Y. Han, Y.C. Zou, J.W. Song, L. Zhao, Y. Di, S.Z. Liu and F.S. Xiao, "Synthesis of Heteroatom Substituted SBA-15 by the "pH-Adjusting" Method," Chemistry of Materials. 16, 486-492 (2004).
Xu, Y., H. Shang, R. Zhao and C. Liu, "The studies of hydrodesulfurization of 4,6-dimethyldibenzothiophene on sulfided Mo/γ-Al2O3: The effects of reactive temperature and pressure,"ACS Division of Fuel Chemistry, Preprints 49(2004).

209
Yu, C.C., S. Ramanathan and S.T. Oyama, "New catalysts for hydroprocessing: Bimetallic oxynitrides MI-MII-O-N (MI, MII = Mo, W, V, Nb, Cr, Mn, and Co). Part I. Synthesis and characterization," Journal of Catalysis. 173, 1-9 (1998).
Yui, S., "Producing quality synthetic crude oil from Canadian oil sands bitumen," Journal of the Japan Petroleum Institute. 51, 1-13 (2008).
Yui, S. and T. Dodge, "Catalyst deactivation, kinetics, and product quality of mild hydrocracking of bitumen-derived heavy gas oils," Petroleum Science and Technology. 24, 351-365 (2006).
Yui, S.M. and E.C. Sanford, "Mild hydrocracking of bitumen-derived coker and hydrocracker heavy gas oils: Kinetics, product yields, and product properties," Industrial and Engineering Chemistry Research®. 28, 1278-1284 (1989).
Zhang, J., Z. Ma, J. Jiao, H. Yin, W. Yan, E.W. Hagaman, J. Yu and S. Dai, "Surface functionalization of mesoporous silica SBA-15 by liquid-phase grafting of zirconium phosphate," Microporous and Mesoporous Materials. 129, 200-209 (2010).
Zhao, D., Q. Huo, J. Feng, B.F. Chmelka and G.D. Stucky, "Nonionic triblock and star diblock copolymer and oligomeric sufactant syntheses of highly ordered, hydrothermally stable, mesoporous silica structures," Journal of the American Chemical Society. 120, 6024-6036 (1998a).
Zhao, D., J. Feng, Q. Huo, N. Melosh, G.H. Fredrickson, B.F. Chmelka and G.D. Stucky, "Triblock copolymer syntheses of mesoporous silica with periodic 50 to 300 angstrom pores," Science. 279, 548-552 (1998b).

210
APPENDIX A:
Calculation of Molar Product Concentrations of N/S and Reaction Rates of HDN/HDS
The sulfur and nitrogen concentrations in the feed and product gas oil liquids are found
via the following equations:
ρL = Density of HGO feedstock and product (assumed equal)
CS/N = Sulfur/nitrogen heteroatom concentration, mol/L (M)
MS/N = Sulfur/nitrogen molecular weight, g/mol
The reaction rates of hydrodesulfurization and hydrodenitrogenation reactions are
calculated based on the following equations:
([ ] [ ] ){ }(3 6 0 0 )
P
sh
S SH D S
C A T
C o C L H S VRρ
− ⋅=
⋅
( [ ] [ ] ){ }(3 6 0 0 )
P
sh
N NH D N
C A T
C o C L H S VRρ
− ⋅=
⋅
{RHDS/HDN} = Global rate of the HDS/HDN reaction, mol/(s·kg-cat)
[CO/P]S/N = Feedstock/product concentration of sulfur/nitrogen, mol/L
LHSV = Liquid hourly space velocity, h-1
ρCAT = Catalyst pellet density (NiMo/Zr-SBA-15 catalyst)
[A.3]
[A.4]
3
6 6
( ) ( ) ( 0 .9 8 1 0 )(1 0 ) (1 0 ) (3 2 .0 6 4 0 )
gLw t L w t
S gm o lS
p p m p p mCM
ρ⋅ ⋅ ×= =
⋅ ⋅
3
6 6
( ) ( ) ( 0 .9 8 1 0 )(1 0 ) (1 0 ) (1 4 .0 0 6 7 )
gLw t L w t
N gm o lN
p p m p p mCM
ρ⋅ ⋅ ×= =
⋅ ⋅
[A.1]
[A.2]
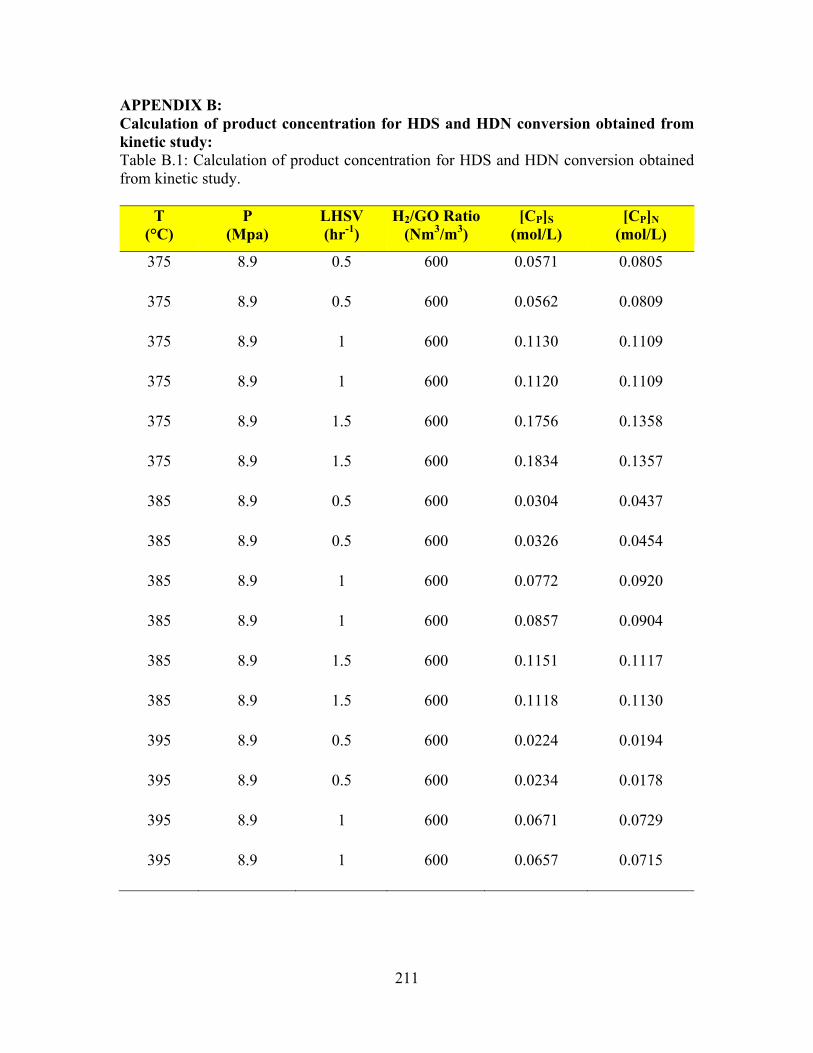
211
APPENDIX B: Calculation of product concentration for HDS and HDN conversion obtained from kinetic study: Table B.1: Calculation of product concentration for HDS and HDN conversion obtained from kinetic study.
T (°C)
P (Mpa)
LHSV (hr-1)
H2/GO Ratio (Nm3/m3)
[CP]S (mol/L)
[CP]N (mol/L)
375 8.9 0.5 600 0.0571 0.0805
375 8.9 0.5 600 0.0562 0.0809
375 8.9 1 600 0.1130 0.1109
375 8.9 1 600 0.1120 0.1109
375 8.9 1.5 600 0.1756 0.1358
375 8.9 1.5 600 0.1834 0.1357
385 8.9 0.5 600 0.0304 0.0437
385 8.9 0.5 600 0.0326 0.0454
385 8.9 1 600 0.0772 0.0920
385 8.9 1 600 0.0857 0.0904
385 8.9 1.5 600 0.1151 0.1117
385 8.9 1.5 600 0.1118 0.1130
395 8.9 0.5 600 0.0224 0.0194
395 8.9 0.5 600 0.0234 0.0178
395 8.9 1 600 0.0671 0.0729
395 8.9 1 600 0.0657 0.0715

212
T (°C)
P (Mpa)
LHSV (hr-1)
H2/GO Ratio (Nm3/m3)
[CP]S (mol/L)
[CP]N (mol/L)
395 8.9 1.5 600 0.0970 0.0965
395 8.9 1.5 600 0.0892 0.0986
385 8.9 1 800 0.0637 0.0870
385 8.9 1 800 0.0656 0.0877
385 8.9 1 400 0.1052 0.0963
385 8.9 1 400 0.1046 0.0965
385 7.9 1 600 0.0877 0.1016
385 7.9 1 600 0.0848 0.1034
385 9.9 1 600 0.0650 0.0797
385 9.9 1 600 0.0790 0.0779
370 8.9 1 600 0.1399 0.1488
370 8.9 1 600 0.1123 0.1209
370 8.9 1 600 0.1312 0.1239
370 8.9 1 600 0.1359 0.1242
370 8.9 1 600 0.1300 0.1233
370 8.9 1 600 0.1409 0.1256

213
APPENDIX C:
Evaluation of External Mass Transfer Resistance for HDS and HDN Reactions:
For determining whether the rate of hydrogen diffusion into heavy gas oil was the rate
determining step or not, Charles N. Satterfield (1969) (Satterfield, 1969) criteria was used.
The criterion is defined as:
= Overall mass transfer coefficient for hydrogen, cm/s
CH2 = Hydrogen concentration in the liquid phase at equilibrium, mol/mL
= Rate of hydrogen conversion in the reaction, mol/(s∙mL)
VC = Volume of loaded catalyst = 5.0 mL
dP = Average diameter of the catalyst particles = 0.17 cm
The validation of the Satterfield criterion would determine that the mass transfer was
dominant in the overall reaction.
Evaluation of the overall mass transfer coefficient (kOVR): The overall mass transfer coefficient was found by the following equation:
The variables are defined as:
kL = Liquid film side hydrogen –gas oil mass transfer coefficient, cm/s
kS = Solid side hydrogen –gas oil mass transfer coefficient, cm/s
2
103
1pO VR
H C
dK
Cdn
V dt⎛ ⎞⎜ ⎟ >⎜ ⎟⎝ ⎠
−
1 1 1
OVR L Sk k k= +
O VRK
1C
dnV dt
⎛ ⎞⎜ ⎟⎜ ⎟⎝ ⎠
−
[C.1]
[C.2]
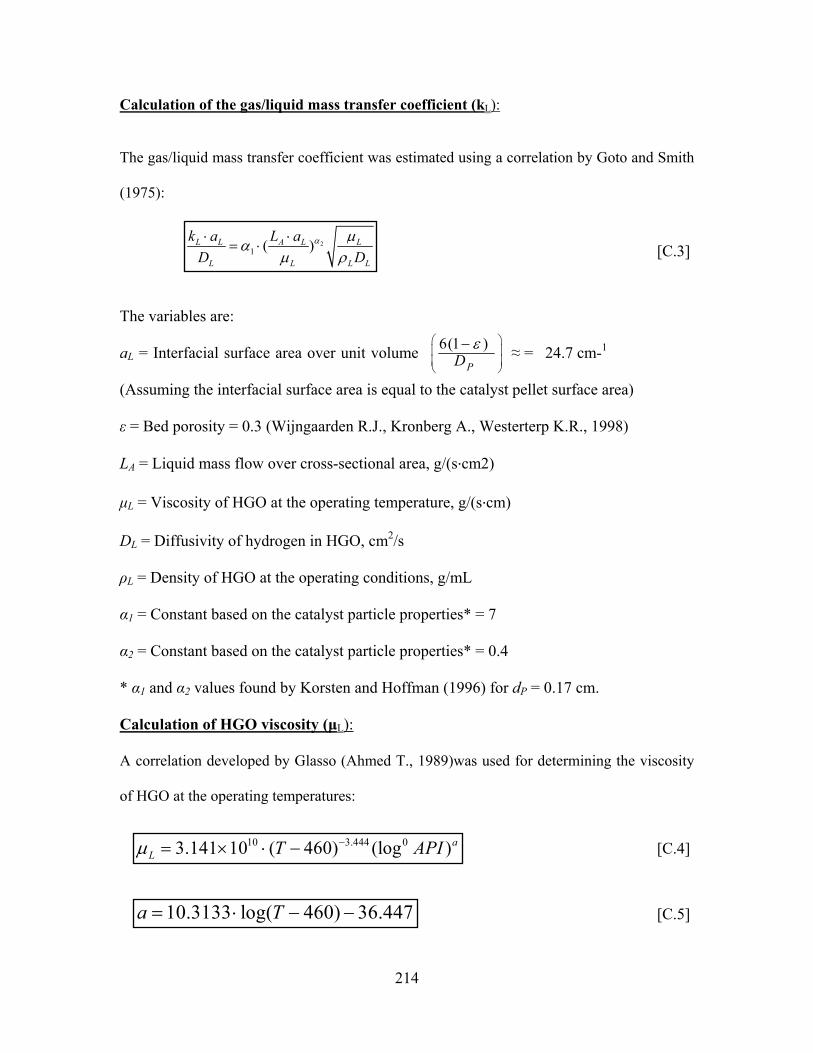
214
Calculation of the gas/liquid mass transfer coefficient (kL):
The gas/liquid mass transfer coefficient was estimated using a correlation by Goto and Smith
(1975):
The variables are:
aL = Interfacial surface area over unit volume ≈ = 24.7 cm-1
(Assuming the interfacial surface area is equal to the catalyst pellet surface area)
ε = Bed porosity = 0.3 (Wijngaarden R.J., Kronberg A., Westerterp K.R., 1998)
LA = Liquid mass flow over cross-sectional area, g/(s∙cm2)
μL = Viscosity of HGO at the operating temperature, g/(s∙cm)
DL = Diffusivity of hydrogen in HGO, cm2/s
ρL = Density of HGO at the operating conditions, g/mL
α1 = Constant based on the catalyst particle properties* = 7
α2 = Constant based on the catalyst particle properties* = 0.4
* α1 and α2 values found by Korsten and Hoffman (1996) for dP = 0.17 cm.
Calculation of HGO viscosity (μL): A correlation developed by Glasso (Ahmed T., 1989)was used for determining the viscosity
of HGO at the operating temperatures:
21 ( )L L A L L
L L L L
k a L aD D
α μαμ ρ
⋅ ⋅= ⋅
6(1 )PDε⎛ ⎞
⎜ ⎟⎜ ⎟⎝ ⎠
−
10 3.444 03.141 10 ( 460) (log )aL T APIμ −= × ⋅ −
10.3133 log( 460) 36.447a T= ⋅ − −
[C.3]
[C.4]
[C.5]

215
The variables are defined as:
T = Operating temperature, °R
°API =
SG = Specific gravity of HGO at 15.6°C = 0.98
°API ≈ 12.89
a = -7.12 to -6.84 (for temperatures ranging from 375°C to 395°C)
μL = 1.99 cP to 2.4 cP (for temperatures ranging from 375°C to 395°C)
Calculation of HGO average molecular weight (MAVE): Average molecular weight of gas oil was evaluated from the Aspen software.
Calculation of diffusivity of hydrogen in gas oil (DL):
A correlation by Wilke and Chang (1955) was used for calculating the effective diffusivity of
hydrogen:
The variables are defined as:
X = Association parameter = 1 for hydrocarbon mixtures
Vb = Hydrogen molar volume at the normal boiling point
Vb = 14.3 mL/mol (Wiljngaarden et al., 1998)
DL = 7.64 ×10⁻⁵ cm2/s to 9.56 ×10⁻⁵ cm2/s
(for temperatures ranging from 375°C to 395°C)
Calculation of HGO density at reaction temperatures and pressures:
A correlation by Standing and Katz (Jiménez et al., 2007) was found for determining the
density of gas oils at reactor operating conditions:
141.5 131.5SG
−
80.6(7.4 10 )
b
L L AVED X MT Vμ −⋅ ⋅
= × [C.6]

216
ΔρT = Temperature density correlation, lbs/ft3
ΔρP = Pressure density correlation, lbs/ft3
The values applied to these equations were:
P = 7.9 MPa to 9.9 MPa
T = 1160°R to 1200°R (375°C to 395°C)
From these pressure and temperature values:
ΔρP = 0.235 to 0.295 lbs/ft3
ΔρT = 9.222 to 9.624 lbs/ft3
ρL = 830 to kg/m3 to 836 kg/m3
Finally, from the previously calculated values:
kL = 1.13 ×10⁻⁴ cm/s to 1.9 ×10⁻⁴ cm/s
Calculation of the liquid/solid mass transfer coefficient (kS):
The liquid/solid mass transfer coefficient was estimated using a correlation by Van Krevelen
and Krekels (Froment G.F. and Bischoff K.B., 1990):
15.6L T Pρ ρ ρ ρ= − +
15.6
15.6
0.0425
0.603 2
[0.167 (16.181 10 )] [ ]1000
0.01 [0.299 (263 10 )] [ ]1000
PP
P
ρ
ρ
ρ −
−
= + × ⋅
− ⋅ + × ⋅
15.6 )
2.4515.6
0.764 (6 2
[0.0133 (152.4 ( ) )] [ 520]
[8.10 10 (0.0622 10 )] [ 520]P
T P T
Tρ ρ
ρ ρ ρ −
− +−
= + ⋅ + ⋅ −
− × − × ⋅ −
[C.8]
[C.9]
[C.7]
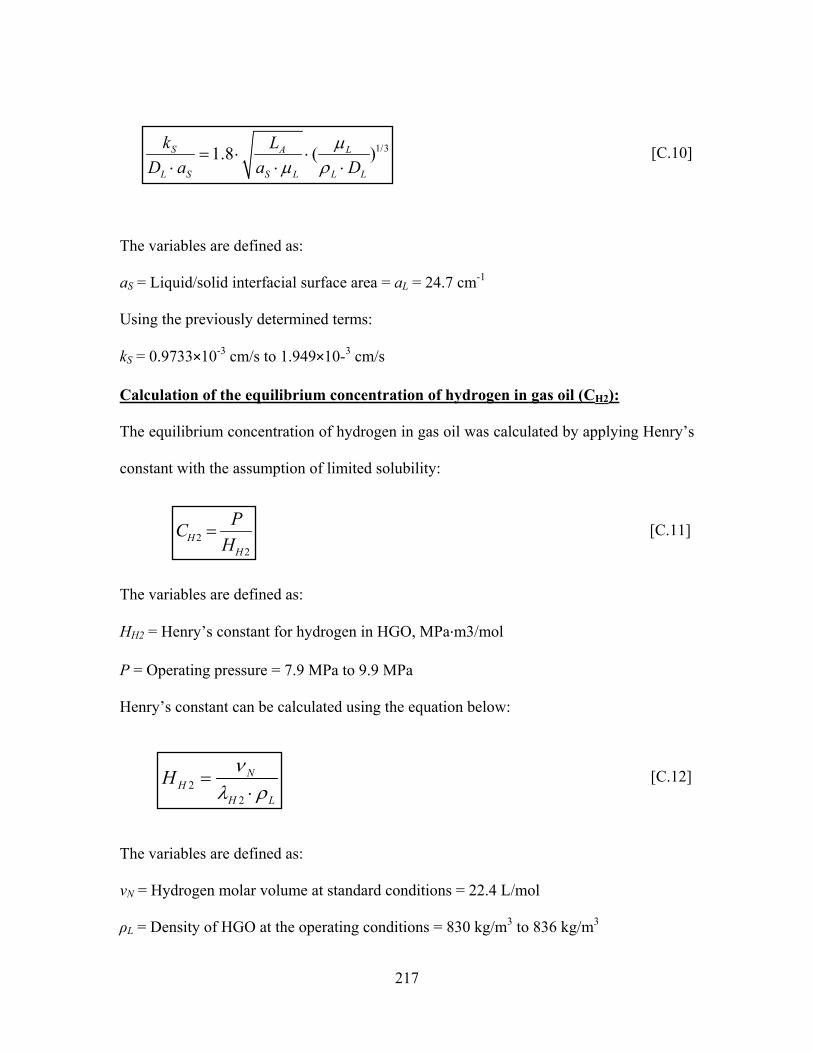
217
The variables are defined as:
aS = Liquid/solid interfacial surface area = aL = 24.7 cm-1
Using the previously determined terms:
kS = 0.9733×10⁻³ cm/s to 1.949×10⁻³ cm/s
Calculation of the equilibrium concentration of hydrogen in gas oil (CH2):
The equilibrium concentration of hydrogen in gas oil was calculated by applying Henry’s
constant with the assumption of limited solubility:
The variables are defined as:
HH2 = Henry’s constant for hydrogen in HGO, MPa∙m3/mol
P = Operating pressure = 7.9 MPa to 9.9 MPa
Henry’s constant can be calculated using the equation below:
The variables are defined as:
vN = Hydrogen molar volume at standard conditions = 22.4 L/mol
ρL = Density of HGO at the operating conditions = 830 kg/m3 to 836 kg/m3
1/31.8 ( )S A L
L S S L L L
k LD a a D
μμ ρ
= ⋅ ⋅⋅ ⋅ ⋅
22
HH
PCH
=
22
NH
H L
H νλ ρ
=⋅
[C.10]
[C.11]
[C.12]
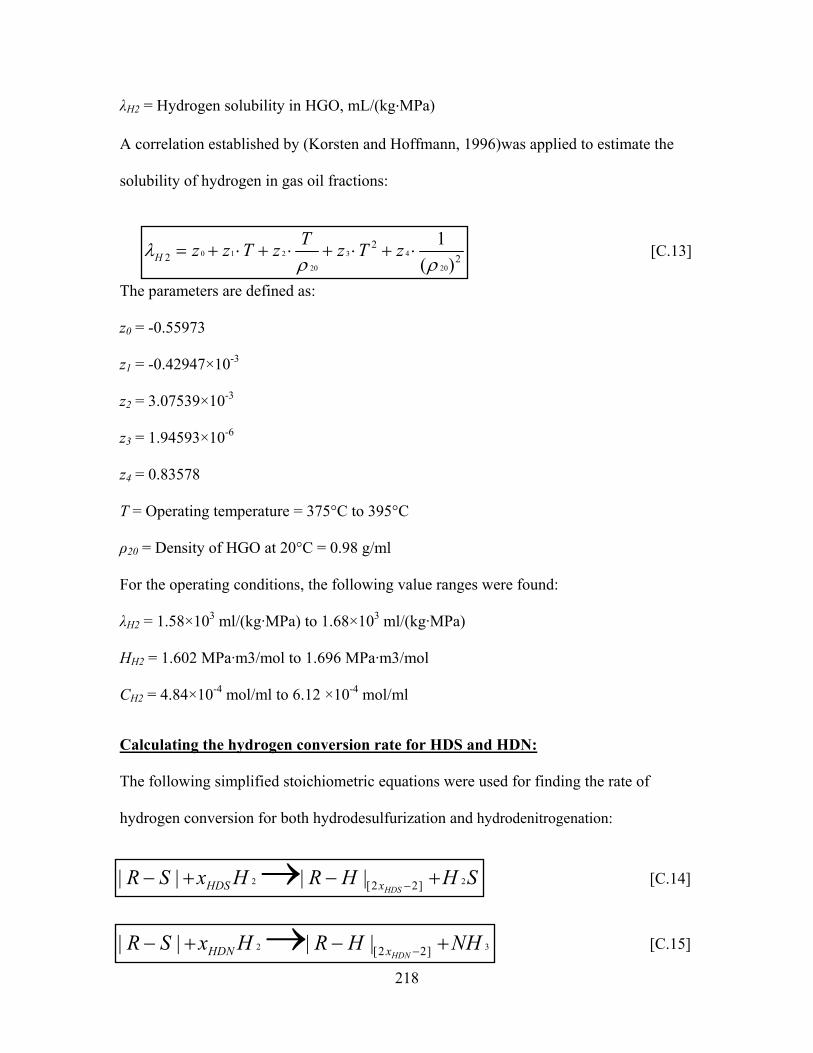
218
λH2 = Hydrogen solubility in HGO, mL/(kg∙MPa)
A correlation established by (Korsten and Hoffmann, 1996)was applied to estimate the
solubility of hydrogen in gas oil fractions:
The parameters are defined as:
z0 = -0.55973
z1 = -0.42947×10⁻³
z2 = 3.07539×10⁻³
z3 = 1.94593×10⁻⁶
z4 = 0.83578
T = Operating temperature = 375°C to 395°C
ρ20 = Density of HGO at 20°C = 0.98 g/ml
For the operating conditions, the following value ranges were found:
λH2 = 1.58×10³ ml/(kg·MPa) to 1.68×10³ ml/(kg·MPa)
HH2 = 1.602 MPa·m3/mol to 1.696 MPa·m3/mol
CH2 = 4.84×10⁻⁴ mol/ml to 6.12 ×10⁻⁴ mol/ml
Calculating the hydrogen conversion rate for HDS and HDN:
The following simplified stoichiometric equations were used for finding the rate of
hydrogen conversion for both hydrodesulfurization and hydrodenitrogenation:
0 1 2 3 4
20 20
22 2
1( )H
Tz z T z z T zλρ ρ
= + ⋅ + ⋅ + ⋅ + ⋅
2 2[2 2]| | | |HDSHDS xR S x H R H H S−− + − +→
[C.13]
[C.14]
2 3[2 2]| | | |HDNHDN xR S x H R H NH−− + − +→ [C.15]
219
The rates of nitrogen and sulfur removal for varying operating conditions applied to the
hydrotreating process were determined from section and Appendix B of the report. Equations
C.14 and C.15 allow for the following substitutions:
Where rHDS is the molar rate of sulfur removal and rHDN is the molar rate of nitrogen removal
achieved from the hydrotreating catalyst (mol/s). Assuming the hydrogenation of a 5-
membered thiophenic ring for sulfur removal and a 6-membered basic pyridinic ring for
nitrogen removal, the following stoichiometric values were assumed for the HDS and HDN
reactions of heavy gas oil:
Given these assumed values for each reaction, the following value ranges were found for
each side of the Satterfield inequality:
Hydrodesulfurization Reaction:
Left hand side of Satterfield’s criterion = 5.79×10⁻⁴ cm/s to 16.26×10⁻⁴
cm/s
Right hand side of Satterfield’s criterion = 1.015 ×10⁻⁴ cm/s to 1.732×10⁻⁴
cm/s
Hydrodenitrogenation Reaction:
Left hand side of Satterfield’s criterion = 0.99 ×10⁻⁴ cm/s to 2.51×10⁻⁴ cm/s
Right hand side of Satterfield’s criterion = 1.015 ×10⁻⁴ cm/s to 1.732×10⁻⁴
cm/s
A summary of all the operating conditions and estimated parameters contributing to these
results can be found in Table C.1 on the following page.
1( ) ( )HDS HDS
C C
x rdnV dt V
⋅−⋅ =
1( ) ( )HDN HDN
C C
x rdnV dt V
⋅−⋅ =
4.0HDSx = 5.0HDNx =
[C.16]
[C.17]

220
Parameter Symbol Units Value Range Pressure P Mpa 8.9 7.9-9.9Temperature T 0C 385 375-395Av boling point of HGO TB
0C 436 -Liquid hourly space velosity LHSV hr-1 1 0.5-1.5Feed flow rate L g/hr 4.9 2.45-7.35Catalyst particle size dP cm 0.17 -Bed porosity (Wijngaarden et al 1998) ε - 0.3 -Interfacial surface area per unit volume αL cm-1 24.7Liquid mass flow per unit area LA x 10-3 g/(cm2.s) 1.73 0.87-2.60HGO density @ operating condition ρL kg/m3 832.59 830-836
HGO density @ 150C ρ15 kg/m3 980 -
HGO density @ 200C ρ20 kg/m3 980 -Pressure density correlation ΔρP lbs/ft3 0.2649 0.235-0.295Temperature density correlation ΔρT lbs/ft3 9.467 9.222-9.624
HGO specific gravity @600F SG - 0.98 -API density rating 0API - 12.89 -Constant in viscosity correlation α - -6.950 (-)7.12 - (-)6.84HGO average molecular weight MAVE kg/mol 361.4 -HGO viscosity @ operating temp μL cP 2.144 1.993-2.400Henry's constant HH2 x10-2 Mpa-m3/gmol 1.639 1.602-1.696
H2 molecular volume, std condition vN cc/mol 22400 -
Concentration of H2 in HGO CH2 x 10-4 mol/cc 5.47 4.84-6.12Solubility of H2 in HGO (Hoffman et al, λH2 x 103 cc/kg 1.64 1.58-1.68
Bulk diffusivity of H2 DL x 10-5 cm2/s 8.75 7.64-9.56Particle properties constant (Korsten & α1 - 7 -Particle properties constant (Korsten & α2 - 0.4 -
Liquid side: H2/HGO mass transfer kL x 10-4 cm/s 1.56 1.13-1.9
Solid side: H2/HGO mass transfer kS x10-3 cm/s 14.81 0.973-1.949Overall mass transfer cofficient kOVR x 10-4 cm/s 1.41 1.015-1.732
Rate of H2 consumption for HDS reaction (xHDS.rHDS)/VC x 10-7 mol.H2/(s.cc) 10.83 5.5-16.05
Rate of H2 consumption for HDN (xHDN.rHDN)/VC x 10-7 mol.H2/(s.cc) 1.72 0.927-2.448Satterfield's criterian for HDS, LHS SHDS x 10-4 11.22 5.79-16.26Satterfield's criterian for HDN, LHS SHDN x 10-4 1.78 0.99-2.51
Table C.1 : Summary of the external mass transfer resistances study performed for a trickle bed hydrotreating reactor loaded with NiMo/Zr-SBA-15 catalyst
221
APPENDIX D: Evaluation of the Internal Mass Transfer Resistances for the HDS and HDN Reactions The preliminary calculations performed as part of this evaluation was to see if isothermality
could be assumed within the catalyst pellets. The determination of each pellet’s degree of
isothermality was performed in two ways: by finding both the highest potential temperature
rise between the core and the surface of the pellet (Fogler, 2006), as well as by confirming
Anderson’s criterion (Anderson, 1963) .
Maximum temperature rise (ΔTMAX):
The variables are defined as:
ΔHR,i = Heat of HDS/HDN reaction, kJ/mol
[Ci]S = Catalyst surface concentration of sulfur/nitrogen species, mol/ml
kt = Thermal conductivity of the NiMo/Zr-SBA-15 catalyst pellet.
kt = 1.0225 W/(cm·K) (assuming a pure catalyst pellet)
TS = Pellet surface temperature (reaction temperatures)
Calculation of the HDS/HDN heats of reaction:
The hydrodesulfurization heat of reaction for heavy gas oil from Athabasca bitumen was
approximated by using the heat of reaction range for most thiophene molecules; 63 to 66
kJ/mol of hydrogen consumed (Speight, 2006). The hydrodenitrogenation heat of reaction for
HGO from Athabasca bitumen was approximated by using the heat of reaction range for most
quinoline molecules; 65 to 68 kJ/mol of hydrogen consumed (Cocchetto and Satterfield,
1981). These values were converted to units of kJ/mol of sulfur/nitrogen removed by using
the stoichiometric coefficients (xHDS and xHDN) discussed in Appendix C.
, [ ]R i i i SMAX
S t S
H D CTT k T
β⋅ ⋅
= =⋅
[D.1]
222
ΔHR,HDS = 63 to 66 kJ/mol of H2 consumed
ΔHR,HDS = 260 kJ/mol of sulfur
ΔHR,HDN = 65 to 68 kJ/mol of H2 consumed
ΔHR,HDN = 265 kJ/mol of nitrogen
Calculating the effective diffusivities of organosulfur and organonitrogen compounds in
HGO ([DS]E/[DN]E):
The effective diffusivity of sulfur compounds was estimated by the following equation:
The variables are defined as:
εP = Porosity of the catalyst pellets
γP = Tortuosity of the catalyst pellets
Di = Bulk diffusivity of organosulfur compounds, cm2/g
A correlation by Probst and Wohlfahrt (1979) was used to find the ratio of porosity and
tortuosity of pelletized catalysts:
Values of m were found to range from 0.70 to 1.65 for porous compressed catalysts (group
D). It was recommended to use an m value of 1.05 when not otherwise determined
(Wijngaarden et al., 1998). Porosity values were found to range from 0.05 to 0.65 (average
value was used, 0.35). Based on these conditions, the porosity/tortuosity values were found:
[ ] P ii E
P
DD εγ⋅
=
1[ ](2 )
mP P
mP P
ε εγ ε +=
−
0 .119P
P
εγ
=
[D.2]
[D.3]

223
Calculating the bulk diffusivities of organosulfur and organonitrogen compounds in
HGO (DS/DN):
The assumption was made that the organosulfur and organonitrogen compounds held the
same density, average boiling point, average molecular weight and average molar volume as
the heavy gas oil feedstock. The bulk diffusivities of each species were found using the Tyn-
Calus correlation (Reid et al., 1987):
The variables are defined as:
T = Operating temperature
μL = HGO viscosity at operating conditions = 1.99 cP to 2.24 cP
vi = Molar volume of sulfur/nitrogen molecules under standard conditions, mL/mol
vL = Molar volume of HGO under standard conditions, mL/mol
The molar volume of the gas oil was found by the following:
vC = Critical specific molar volume of HGO, mL/mol
The critical specific molar volume is given by:
MAVE = 361 g/mol
vCm = Critical specific mass volume, mL/g
0.2678 8
0.433 0.166(8.93 10 ) ( ) ( ) (8.93 10 ) ( )Li
i L L i
T TD νν μ μ ν
− −= × ⋅ ⋅ = × ⋅⋅
1.048(0.285)i Cν ν= ⋅
mC C AVEMν ν= ⋅
[D.5]
[D.4]
[D.6]

224
The critical specific mass volume of liquid was calculated using a correlation by Raizi
and Daubert (Ahmed T., 1989):
The variables are defined as:
vCm = Critical specific mass volume, ft3/lb
Tb = Average boiling point temperature = 816.8 °F
SG15.6 = Specific gravity at 15.6°C = 0.98
These values lead to the following results:
vCm = 3.94 mL/g
vC = 1423 mL/mol
vi = 574.75 mL/mol
Di = DS = DN = 8.332 ×10⁻⁶ cm2/g to 10.43 ×10⁻⁶ cm2/g
[DS]E = [DN]E = 8.332 ×10⁻⁶ cm2/g to 10.43 ×10⁻⁶ cm2/g
The effective diffusivity values lead to isothermality ratios of:
βHDS = 3.47 ×10⁻⁶ to 4.18×10⁻⁶
βHDN = 7.24×10⁻⁷ to 8.72 ×10⁻⁷
Because the HDS and HDN reactions are occurring simultaneously, the sum of the beta
values would give the overall maximum temperature change with respect to the catalyst
surface temperature. This gives a highest possible ΔTMAX value of 0.0034 K, which can be
considered negligible.
Anderson’s Criterion:
3 0.2896 0.7666(7.5214 10 )mC bT SGν − −= × ⋅ ⋅ [D.7]
2,| | { } 3R i i P S
t S i
H R d T Rk T E⋅ ⋅ ⋅ ⋅
<⋅
[D.8]

225
The variables are defined as:
{Ri} = Global reaction rate: HDS/HDN, mol/(s·mL)
kt = Catalyst thermal conductivity = 1.022 W/(cm·K)
R = Universal gas constant = 8.314 J/(mol·K)
Ei = Energy of activation: HDS/HDN, J/mol
The range of operating conditions tested, the values for the left and right hand side of
Anderson’s criterion were as follows:
Left hand side of Anderson’s criterion (HDS) = 1.689×10⁻⁷ to 3.668×10⁻⁷
Right hand side of Anderson’s criterion (HDS) = 0.034 to 0.036
Left hand side of Anderson’s criterion (HDN) = 4.152×10⁻⁹ to 9.299×10⁻⁹
Right hand side of Anderson’s criterion (HDN) = 0.033 to 0.0345
The results confirm that isothermal behavior can be assumed when examining the internal
mass transfer resistances of the hydrotreating process. Table D.1 at the end of this
appendix provides a summary of the pertinent parameters and results of the catalyst pellet
isothermality study.
Calculation of Φ:
A dimensionless modulus (Φ), analogous to the Thiele modulus found without
knowledge of the intrinsic reaction rate, was found for each collected sample in the
kinetic study. The dimensionless modulus was used to represent an estimation of the pore
diffusion resistance (Satterfield, 1991):
The variables are defined as: dP = Average diameter of the catalyst particles = 0.17 cm
2 { }4 [ ] [ ]
iP
E i S
RdD C
Φ = ⋅⋅
[D.9]

226
{Ri} = Global reaction rate: HDS/HDN, mol/(s·mL)
[Di]E = Effective diffusivity of sulfur/nitrogen compounds, cm2/g
[Ci]S = Catalyst surface concentration of sulfur/nitrogen species, mol/mL
The change in the global reaction rate and the change in surface concentration of sulfur
and nitrogen heteroatoms allow the dimensionless modulus to be calculated at both the
inlet and outlet of the reactor. In finding the dimensionless modulus, a rough
approximation of the effectiveness factor (η) could be determined by applying the
following equations in unison (Satterfield, 1991):
Solving for the effectiveness factor using equations [D.10] and [D.11] will only provide a
rough estimate of both η and φ, the true Thiele modulus. This is because equation D.10
only applies to integer-power rate equations for spherical catalyst pellets. Additionally,
equation D.11 only applies to isothermal first-order reactions for spherical catalysts.
Nonetheless, these equations to provide a measure of comparison between the
effectiveness factors for each collected sample.
Table D.2 provides a summary of all the dimensionless modulus values for the inlet and
outlet ([ΦO]S and [ΦP]S), as well as all the determined effectiveness factors ([ηO]S and
[ηP]S), for the hydrodesulfurization kinetic study.
Table D.3 provides a summary of all the dimensionless modulus values for the inlet and
outlet ([ΦO]N and [ΦP]N), as well as all the determined effectiveness factors ([ηO]N and
[ηP]N), for the hydrodenitrogenation kinetic study.
2( )ϕ ηΦ = ⋅
3 1 1[ ]tanh( )
ηϕ ϕ ϕ
= −
[D.10]
[D.11]
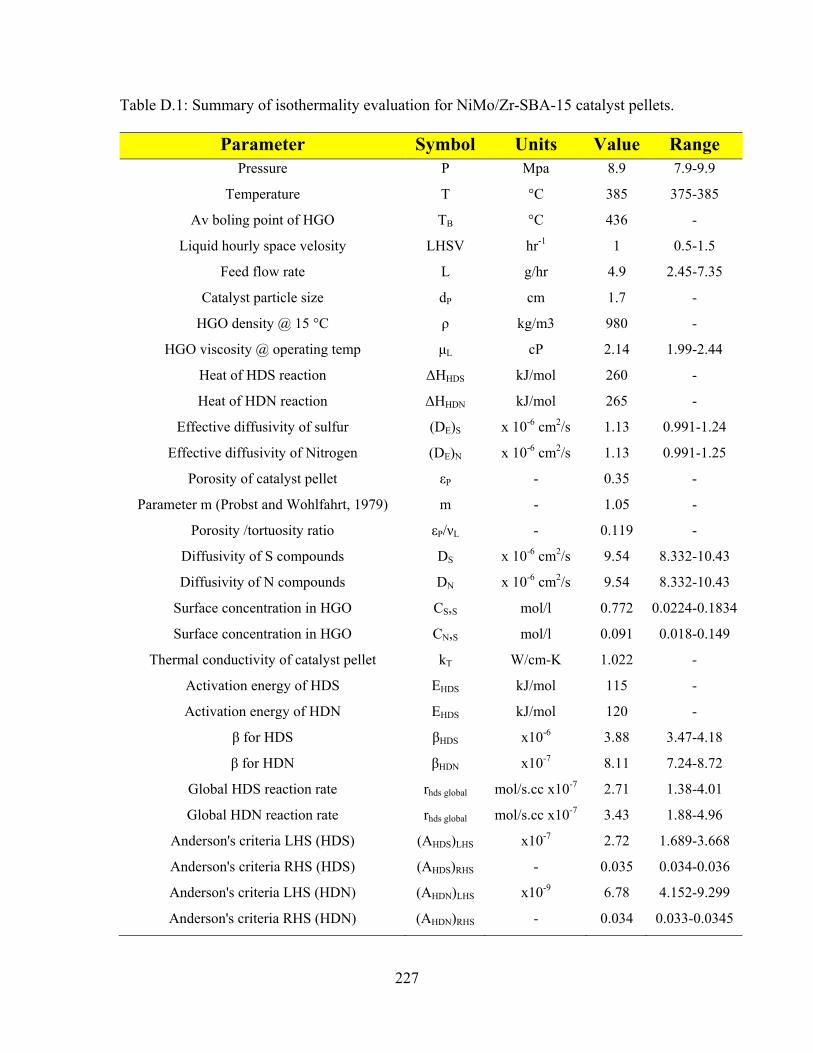
227
Table D.1: Summary of isothermality evaluation for NiMo/Zr-SBA-15 catalyst pellets.
Parameter Symbol Units Value Range Pressure P Mpa 8.9 7.9-9.9
Temperature T °C 385 375-385
Av boling point of HGO TB °C 436 -
Liquid hourly space velosity LHSV hr-1 1 0.5-1.5
Feed flow rate L g/hr 4.9 2.45-7.35
Catalyst particle size dP cm 1.7 -
HGO density @ 15 °C ρ kg/m3 980 -
HGO viscosity @ operating temp μL cP 2.14 1.99-2.44
Heat of HDS reaction ΔHHDS kJ/mol 260 -
Heat of HDN reaction ΔHHDN kJ/mol 265 -
Effective diffusivity of sulfur (DE)S x 10-6 cm2/s 1.13 0.991-1.24
Effective diffusivity of Nitrogen (DE)N x 10-6 cm2/s 1.13 0.991-1.25
Porosity of catalyst pellet εP - 0.35 -
Parameter m (Probst and Wohlfahrt, 1979) m - 1.05 -
Porosity /tortuosity ratio εP/νL - 0.119 -
Diffusivity of S compounds DS x 10-6 cm2/s 9.54 8.332-10.43
Diffusivity of N compounds DN x 10-6 cm2/s 9.54 8.332-10.43
Surface concentration in HGO CS,S mol/l 0.772 0.0224-0.1834
Surface concentration in HGO CN,S mol/l 0.091 0.018-0.149
Thermal conductivity of catalyst pellet kT W/cm-K 1.022 -
Activation energy of HDS EHDS kJ/mol 115 -
Activation energy of HDN EHDS kJ/mol 120 -
β for HDS βHDS x10-6 3.88 3.47-4.18
β for HDN βHDN x10-7 8.11 7.24-8.72
Global HDS reaction rate rhds global mol/s.cc x10-7 2.71 1.38-4.01
Global HDN reaction rate rhds global mol/s.cc x10-7 3.43 1.88-4.96
Anderson's criteria LHS (HDS) (AHDS)LHS x10-7 2.72 1.689-3.668
Anderson's criteria RHS (HDS) (AHDS)RHS - 0.035 0.034-0.036
Anderson's criteria LHS (HDN) (AHDN)LHS x10-9 6.78 4.152-9.299
Anderson's criteria RHS (HDN) (AHDN)RHS - 0.034 0.033-0.0345
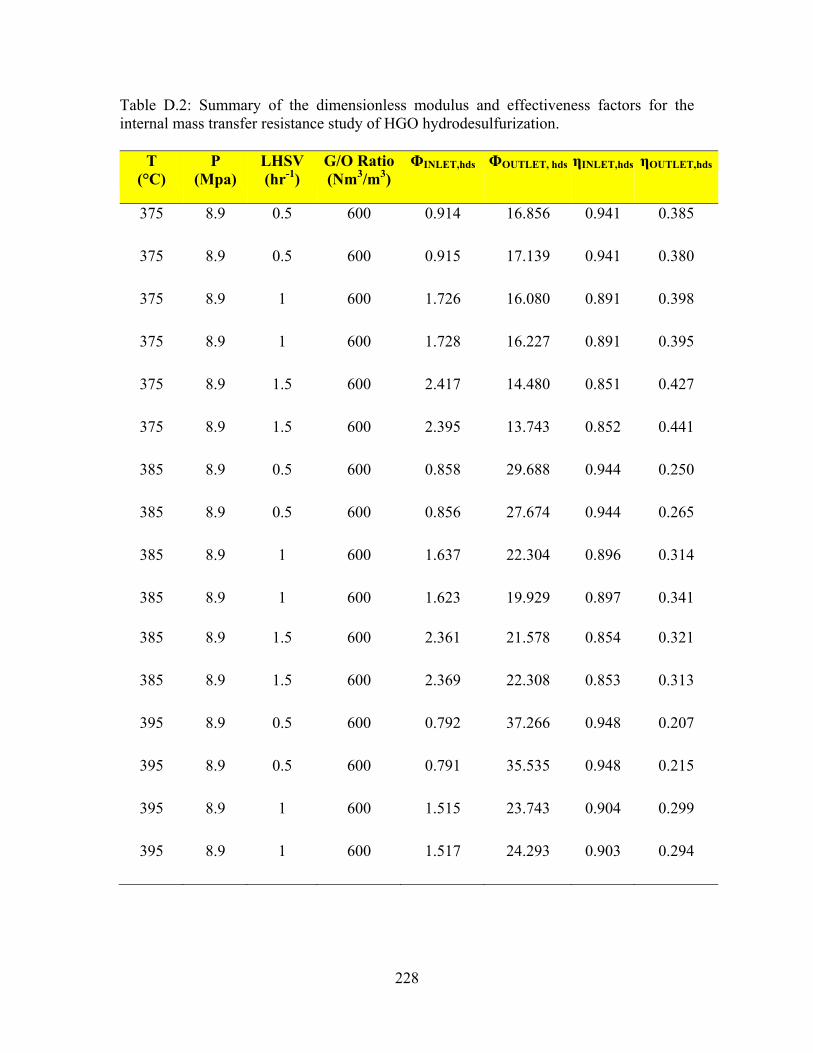
228
Table D.2: Summary of the dimensionless modulus and effectiveness factors for the internal mass transfer resistance study of HGO hydrodesulfurization.
T (°C)
P (Mpa)
LHSV (hr-1)
G/O Ratio (Nm3/m3)
ΦINLET,hds ΦOUTLET, hds ηINLET,hds ηOUTLET,hds
375 8.9 0.5 600 0.914 16.856 0.941 0.385
375 8.9 0.5 600 0.915 17.139 0.941 0.380
375 8.9 1 600 1.726 16.080 0.891 0.398
375 8.9 1 600 1.728 16.227 0.891 0.395
375 8.9 1.5 600 2.417 14.480 0.851 0.427
375 8.9 1.5 600 2.395 13.743 0.852 0.441
385 8.9 0.5 600 0.858 29.688 0.944 0.250
385 8.9 0.5 600 0.856 27.674 0.944 0.265
385 8.9 1 600 1.637 22.304 0.896 0.314
385 8.9 1 600 1.623 19.929 0.897 0.341
385 8.9 1.5 600 2.361 21.578 0.854 0.321
385 8.9 1.5 600 2.369 22.308 0.853 0.313
395 8.9 0.5 600 0.792 37.266 0.948 0.207
395 8.9 0.5 600 0.791 35.535 0.948 0.215
395 8.9 1 600 1.515 23.743 0.904 0.299
395 8.9 1 600 1.517 24.293 0.903 0.294
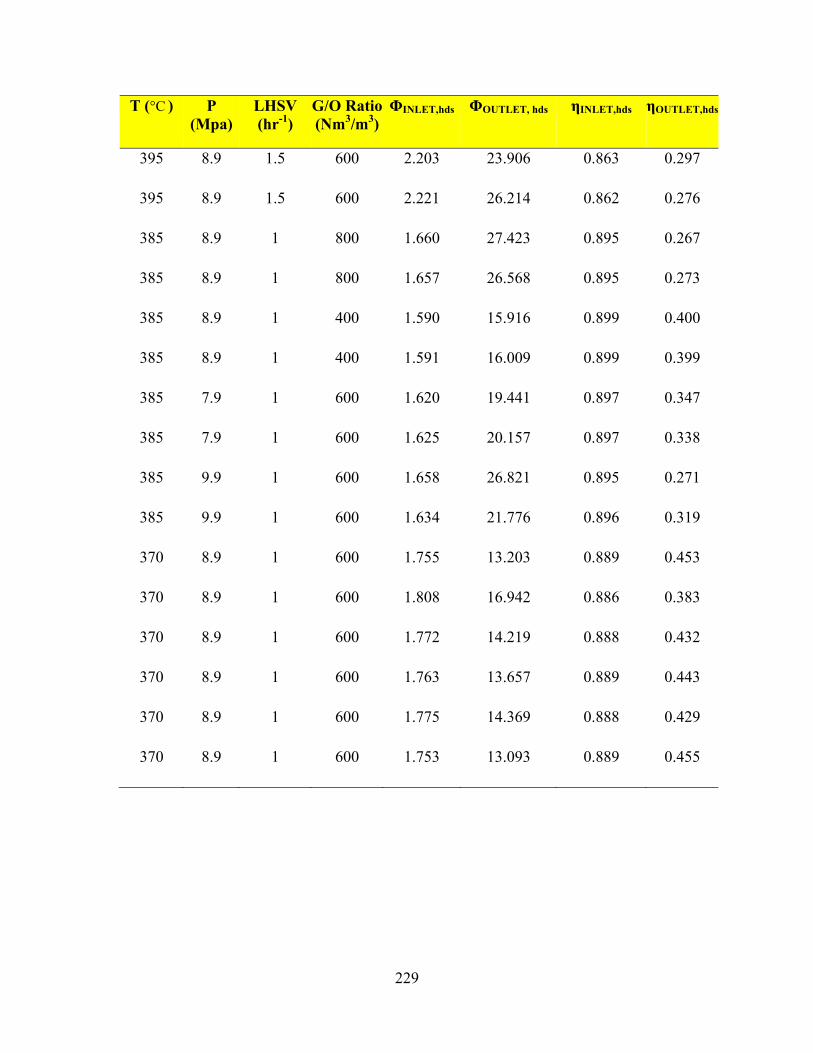
229
T (°C ) P (Mpa)
LHSV (hr-1)
G/O Ratio (Nm3/m3)
ΦINLET,hds ΦOUTLET, hds ηINLET,hds ηOUTLET,hds
395 8.9 1.5 600 2.203 23.906 0.863 0.297
395 8.9 1.5 600 2.221 26.214 0.862 0.276
385 8.9 1 800 1.660 27.423 0.895 0.267
385 8.9 1 800 1.657 26.568 0.895 0.273
385 8.9 1 400 1.590 15.916 0.899 0.400
385 8.9 1 400 1.591 16.009 0.899 0.399
385 7.9 1 600 1.620 19.441 0.897 0.347
385 7.9 1 600 1.625 20.157 0.897 0.338
385 9.9 1 600 1.658 26.821 0.895 0.271
385 9.9 1 600 1.634 21.776 0.896 0.319
370 8.9 1 600 1.755 13.203 0.889 0.453
370 8.9 1 600 1.808 16.942 0.886 0.383
370 8.9 1 600 1.772 14.219 0.888 0.432
370 8.9 1 600 1.763 13.657 0.889 0.443
370 8.9 1 600 1.775 14.369 0.888 0.429
370 8.9 1 600 1.753 13.093 0.889 0.455

230
Table D.3: Summary of the dimensionless modulus and effectiveness factors for the internal mass transfer resistance study of HGO hydrodenitrogenation.
T (°C )
P (Mpa)
LHSV (hr-1)
G/O Ratio (Nm3/m3)
ΦINLET,hdn ΦOUTLET, hdn ηINLET,hdn ηOUTLET,hdn
375 8.9 0.5 600 0.606 1.623 0.960 0.897
375 8.9 0.5 600 0.604 1.608 0.960 0.898
375 8.9 1 600 0.939 1.825 0.940 0.886
375 8.9 1 600 0.939 1.826 1.004 0.886
375 8.9 1.5 600 1.074 1.705 0.931 0.892
375 8.9 1.5 600 1.074 1.706 0.931 0.892
385 8.9 0.5 600 0.705 3.477 0.953 0.793
385 8.9 0.5 600 0.697 3.312 0.954 0.801
385 8.9 1 600 1.013 2.375 0.935 0.856
385 8.9 1 600 1.026 2.448 0.934 0.852
385 8.9 1.5 600 1.277 2.465 0.918 0.848
385 8.9 1.5 600 1.261 2.404 0.919 0.854
395 8.9 0.5 600 0.736 8.183 0.951 0.590
395 8.9 0.5 600 0.742 8.964 0.951 0.564
395 8.9 1 600 1.071 3.168 0.931 0.809
395 8.9 1 600 1.081 3.258 0.931 0.804
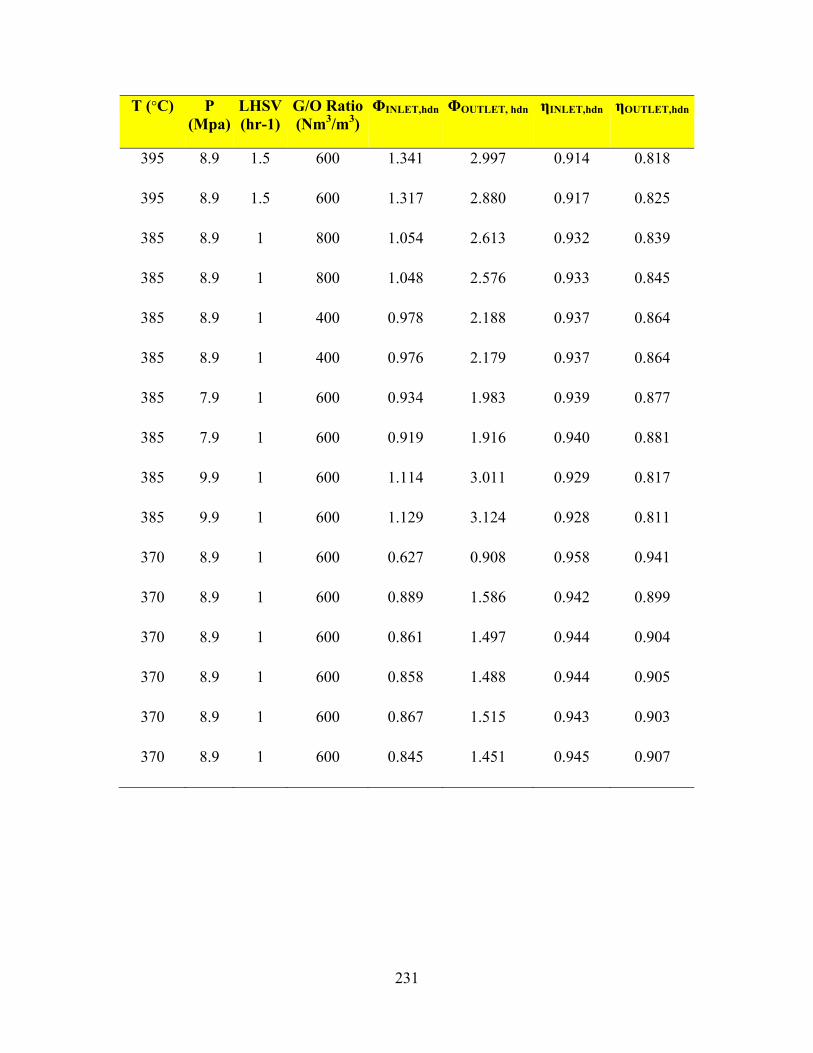
231
T (°C) P (Mpa)
LHSV (hr-1)
G/O Ratio (Nm3/m3)
ΦINLET,hdn ΦOUTLET, hdn ηINLET,hdn ηOUTLET,hdn
395 8.9 1.5 600 1.341 2.997 0.914 0.818
395 8.9 1.5 600 1.317 2.880 0.917 0.825
385 8.9 1 800 1.054 2.613 0.932 0.839
385 8.9 1 800 1.048 2.576 0.933 0.845
385 8.9 1 400 0.978 2.188 0.937 0.864
385 8.9 1 400 0.976 2.179 0.937 0.864
385 7.9 1 600 0.934 1.983 0.939 0.877
385 7.9 1 600 0.919 1.916 0.940 0.881
385 9.9 1 600 1.114 3.011 0.929 0.817
385 9.9 1 600 1.129 3.124 0.928 0.811
370 8.9 1 600 0.627 0.908 0.958 0.941
370 8.9 1 600 0.889 1.586 0.942 0.899
370 8.9 1 600 0.861 1.497 0.944 0.904
370 8.9 1 600 0.858 1.488 0.944 0.905
370 8.9 1 600 0.867 1.515 0.943 0.903
370 8.9 1 600 0.845 1.451 0.945 0.907

232
APPENDIX E: Permissions to Use Figures from Literatures
1. Permission to use Figure 2.2

233
2. Permission to use Figure 2.4
234
3. Permission to use Figure 2.12 and 2.13

235
4. Permission to use Figure 2.14

236
5. Permission to use Figure 2.19
237
6. Permission to use Figure 2.20

238
7. Permission to use Figure 2.23

239
8. Permission to use Figure 2.24 and 2.25
240
9. Permission to use Figure 2.30