Embed Size (px)
Citation preview
1
Characterising Gross Plastic Deformation in Design by
Analysis
Hongjun Li• & Donald Mackenzie
Department of Mechanical Engineering
University of Strathclyde
75 Montrose St
Glasgow G1 1XJ
UK
Abstract
An investigation of three simple structures is conducted to identify and characterise the
condition of gross plastic deformation in pressure vessel Design by Analysis. Limit
analysis and bilinear hardening plastic analysis is performed for three simple example
problems. It is found that previously proposed plastic criteria do not fully represent the
effect of the hardening material model on the development of the plastic failure
mechanism. A new criterion of plastic collapse based on the curvature of the
load-plastic work history is therefore proposed. This is referred to as the Plastic Work
Curvature or PWC criterion. It is shown that salient points of curvature correspond to
critical stages in the physical evolution of the gross plastic deformation mechanism.
The PWC criterion accounts for the effect of the bilinear hardening model on the
development of the plastic mechanism and gives an enhanced plastic load when
compared to the limit load.
Keywords: Design by Analysis, gross plastic deformation, plastic load, criterion of
plastic collapse
• Corresponding Author Fax 0141 552 5105 Email [email protected]
2
1. Introduction
Gross plastic deformation under static loading is a fundamental failure mode
considered in pressure vessel Design By Analysis (DBA), as defined in Codes of
Practice such as PD5500 Unfired Fusion Welded Pressure Vessels [1], EN13445: Part 3,
Unfired Pressure Vessels [2] and ASME Boiler & Pressure Vessel Code Section VIII
Division 2 [3]. In elastic DBA, gross plastic deformation is prevented by limiting the
primary stress in the vessel. In inelastic DBA, gross plastic deformation it is prevented
by limiting the load applied to the vessel, restricting it to a fraction of the notional
ductile collapse load of the vessel. This paper considers how the ductile collapse load is
characterised in inelastic DBA. In practice, this is done through limit analysis, which
assumes an elastic-perfectly plastic material model, or by performing a more complex
elastic-plastic analysis which may include strain hardening and large deformation
effects.
The Codes include different provision and guidelines for inelastic analysis. References
[1] to [3] define procedures for calculating the ductile collapse load of a vessel through
conventional limit analysis. The limit load is the highest load satisfying equilibrium
between external and internal forces and may be assumed to be the ductile collapse load
in DBA. Limit analysis does not consider the effect large deformations have on the
structural response and the equilibrium calculation is based on the initial geometry of
the structure. Large deformation or non-linear geometry effects may enhance or
diminish the load carrying capacity of the structure, referred to as geometric
strengthening and geometric weakening respectively. When large deformation effects
are included in the analysis, the equilibrium calculation is based on the deformed
geometry of the structure.
PD5500 does not refer to large deformation effects in inelastic DBA. EN13445 Annex B
Design by Analysis – Direct Route [2] states “In checks on structures … where
deformation … has an unfavorable (weakening) effect, geometrically non-linear effects
shall be taken into account in gross plastic deformation …checks”. Thus EN13445
3
requires any geometric weakening effect is included in the analysis. In such a case, the
calculated collapse load, referred to as a “lower bound limit value”, is not a
conventional limit load. The equilibrium calculation is based on the deformed
geometry of the structure and collapse may occur due to structural instability. EN13445
does not specify any guidelines for geometrical strengthening and should this occur the
enhanced strength is ignored and the allowable load based on conventional limit
analysis.
Large deformation effects may be included in the ASME VIII DBA procedure in what
is termed a plastic analysis, which may also include material strain hardening (neither
PD5500 nor EN13445 consider strain hardening). The ductile collapse load calculated
in a plastic analysis is not the load required to cause physical collapse of the real vessel.
It is the load at which gross plastic deformation occurs and is thus referred to as the
“plastic load” rather than plastic collapse load, as suggested by Gerdeen [4]. In ASME
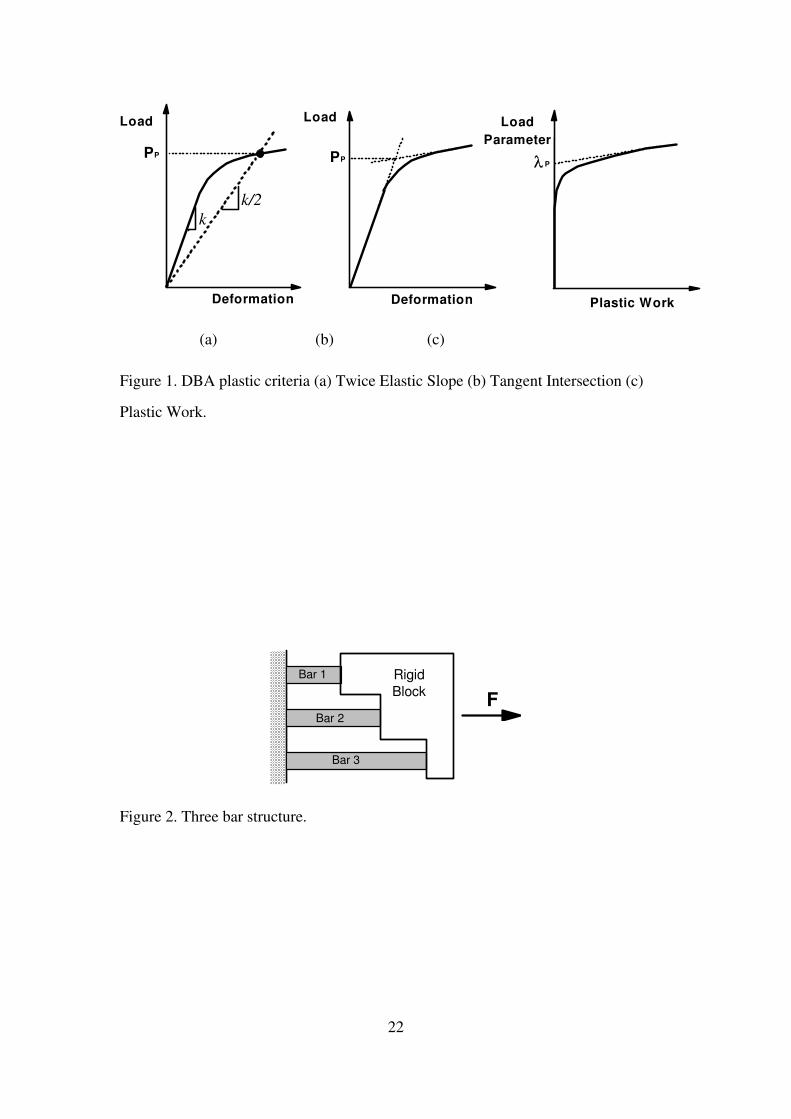
VIII, the plastic load is defined by applying the Twice Elastic Slope (TES) criterion of
plastic collapse to a characteristic load-deformation curve for the vessel. In the TES
criterion, the structural response is characterised by plotting a load parameter against a
deformation parameter. A straight collapse limit line is then drawn from the origin of
the characteristic curve with slope of half the stiffness of the initial elastic response, as
shown in Figure 1a. (This is often referred to as “twice the elastic slope” as the ASME
procedure the collapse limit line is defined in terms of the angle between the line and
the load axis). The plastic load is defined as the load corresponding to the intersection
of the collapse limit line and the load-deformation curve.
2. Determining Plastic Load
The ASME VIII Div 2 Twice Elastic Slope (TES) criterion of plastic collapse is one of
several similar criteria that have been proposed, some of which were incorporated in
earlier versions of the ASME Code. The 1% plastic strain method [5], the twice elastic
deformation method [6], the 0.2% offset strain criterion [7], the proportional limit
criterion [7] and the tangent-intersection (TI) criterion [8] all define the plastic load by
4
applying a heuristic graphical constructions to characteristic load-deformation curves.
In all cases, the calculated plastic load depends on the load and deformation parameters
chosen to characterise the response.
Moffat et al [9] investigated both the TES and TI methods for determining plastic loads
for branch connections. In the TI criterion, two straight lines are drawn on the
characteristic load-deformation curve, one tangent to the initial elastic response and one
tangent to the plastic deformation region of the curve, as shown in Figure 1b. The load
corresponding to the intersection of the two straight lines is defined as the plastic load.
Moffat showed that the TES did not give a unique value for the plastic load of a branch
due to the sensitivity of the criterion to the elastic response of the structure remote from
the region where the plastic failure mechanism actually occurs. However, the TI
method was found to give a unique value of plastic load, independent of the elastic
behaviour, provided the characteristic load deformation curve exhibited a steady state
response after the initial plastic zones formed. This was confirmed by Muscat et al [10].
Robertson and the present writers investigated the evolution of plastic failure
mechanisms in pipe bends under combined pressure and closing in-plane moment
loading and applied both the TES and TI criteria to define plastic loads [11]. It was
found that the calculated plastic load was dependent on the criterion used and how
that criterion was interpreted. In the case of the TI criterion, choosing the location at
which to draw the tangent to the plastic deformation part of the loading curve is
subjective and significant variation in the calculated plastic pressure is possible.
Gerdeen attempted to provide a more rigorous justification for choice of plastic load by
considering the relationship between work done on the vessel by the external loads and
the plastic work dissipated in the vessel as load is increased [4]. He postulated that the
plastic load occurs when the plastic work WP is a specific factor α of the elastic work
WE. Gerdeen did not define a general value of α indicating gross plastic deformation
but showed that for certain configurations, certain values of α gave a correspondence
with previous criteria such as the TES criterion. Limitations in inelastic analysis
methods at the time led Gerdeen to characterise the elastic and plastic work in terms of
5
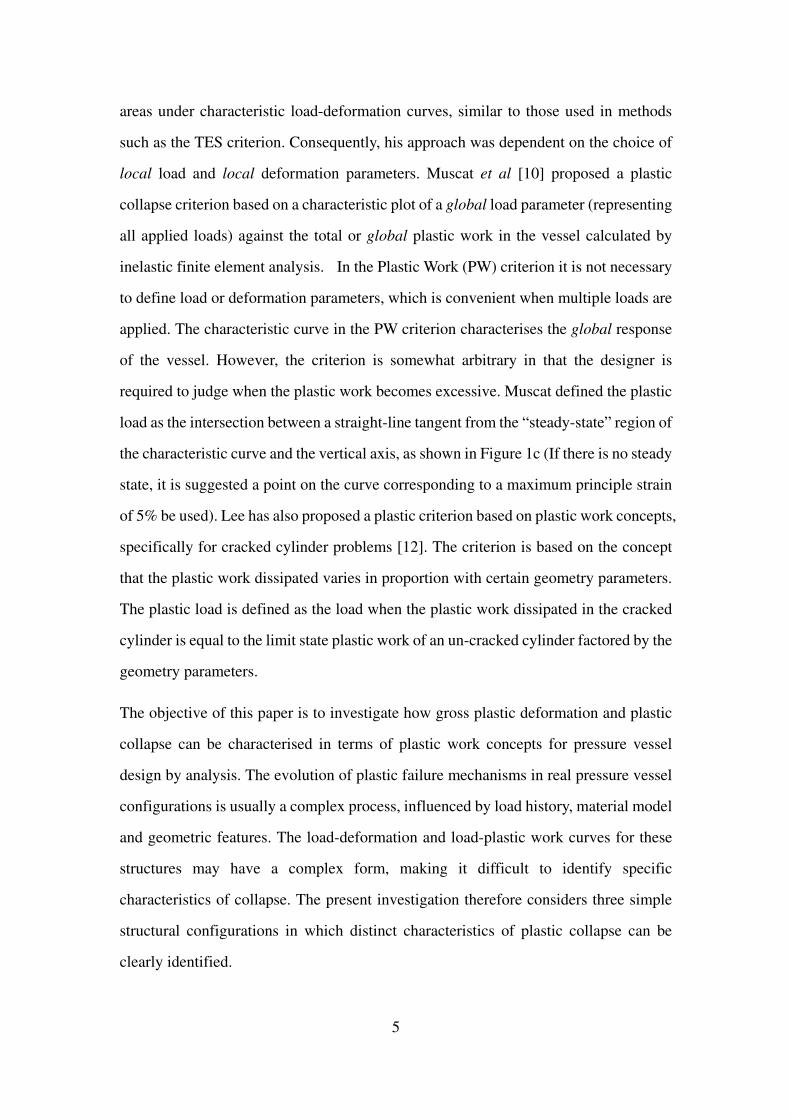
areas under characteristic load-deformation curves, similar to those used in methods
such as the TES criterion. Consequently, his approach was dependent on the choice of
local load and local deformation parameters. Muscat et al [10] proposed a plastic
collapse criterion based on a characteristic plot of a global load parameter (representing
all applied loads) against the total or global plastic work in the vessel calculated by
inelastic finite element analysis. In the Plastic Work (PW) criterion it is not necessary
to define load or deformation parameters, which is convenient when multiple loads are
applied. The characteristic curve in the PW criterion characterises the global response
of the vessel. However, the criterion is somewhat arbitrary in that the designer is
required to judge when the plastic work becomes excessive. Muscat defined the plastic
load as the intersection between a straight-line tangent from the “steady-state” region of
the characteristic curve and the vertical axis, as shown in Figure 1c (If there is no steady
state, it is suggested a point on the curve corresponding to a maximum principle strain
of 5% be used). Lee has also proposed a plastic criterion based on plastic work concepts,
specifically for cracked cylinder problems [12]. The criterion is based on the concept
that the plastic work dissipated varies in proportion with certain geometry parameters.
The plastic load is defined as the load when the plastic work dissipated in the cracked
cylinder is equal to the limit state plastic work of an un-cracked cylinder factored by the
geometry parameters.
The objective of this paper is to investigate how gross plastic deformation and plastic
collapse can be characterised in terms of plastic work concepts for pressure vessel
design by analysis. The evolution of plastic failure mechanisms in real pressure vessel
configurations is usually a complex process, influenced by load history, material model
and geometric features. The load-deformation and load-plastic work curves for these
structures may have a complex form, making it difficult to identify specific
characteristics of collapse. The present investigation therefore considers three simple
structural configurations in which distinct characteristics of plastic collapse can be
clearly identified.
6
3. Plastic Analysis of Simple Configurations
Three simple model are considered: a three-bar system under axial force, a cantilever
beam under a tip bending moment and a thick cylinder under internal pressure. Two
material models are considered: elastic-perfectly plastic and bilinear hardening. All
structures were analysed using the ANSYS [13] program, both for small and large
deformation theory. Closed form analytical solutions for the elastic-plastic response of
the three bar structure and the beam (assuming small deformation theory) obtained by
Li [14] are also presented.
3.1 Three Bar Structure
The first simple structure is a system of three parallel bars of equal cross section A and
different lengths L, such that L3>L2>L1, as shown in Figure 2. The bars are fixed at
one end and constrained to equivalent axial deformation d at the other when force F is
applied.
In an elastic analysis, the highest stress occurs in bar 1 and the lowest stress in bar 3. As
F increases, bar 1 yields first, then bar 2 and then bar 3. Assuming a bilinear strain
hardening material model, the load-deformation response of the structure is given by
Wholly elastic: ⎟⎟⎠
⎞⎜⎜⎝
⎛++=
321
111
LLLEAdF (1)
Bar 1 plastic: ⎟⎟⎠
⎞⎜⎜⎝
⎛+++⎟⎟
⎠
⎞⎜⎜⎝
⎛−=
321
1L
E
L
E
L
EdA
E
EAF
plpl
Yσ (2)
Bars 1 & 2 plastic: ⎟⎟⎠
⎞⎜⎜⎝
⎛+++⎟⎟
⎠
⎞⎜⎜⎝
⎛−=
321
12L
E
L
E
L
EdA
E
EAF
plplpl
Yσ (3)
Fully plastic: ⎟⎟⎠
⎞⎜⎜⎝
⎛+++⎟⎟
⎠
⎞⎜⎜⎝
⎛−=
321
11113
LLLdAE
E
EAF pl
pl
Yσ (4)
where σy is the yield stress, E is the elastic modulus and Epl the tangent modulus of the
bilinear hardening material. The elastic and plastic work done on the structure as the
7
load increases are obtained from uniaxial stress and strain theory. The elastic work We
is:
∑=
=3
12
1
i
i
el
iie VW εσ (5)
where σi is the stress, Ei
el
i /σε = is the elastic strain and Vi is the volume of bar i. The
plastic work is calculated from
∑=
=3
1i
i
pl
i
m
ip VW εσ (6)
Where m
iσ is the average stress in bar i:
2
Yim
i
σσσ
+= (7)
and el
ii
pl
i εεε −= is the plastic strain.
The elastic-plastic response of the general three bar structure is characterised in terms
of load-deformation behaviour and load-plastic work behaviour by the analytical
solution of equations (1) to (7). Here, the response of a specific structure with
dimensions A=40mm2, L1=40mm, L2=80mm, L3=120mm and material properties
E=200 GPa, Yield stress σy=300MPa and Epl=0 GPa or Epl=4 GPa is considered.
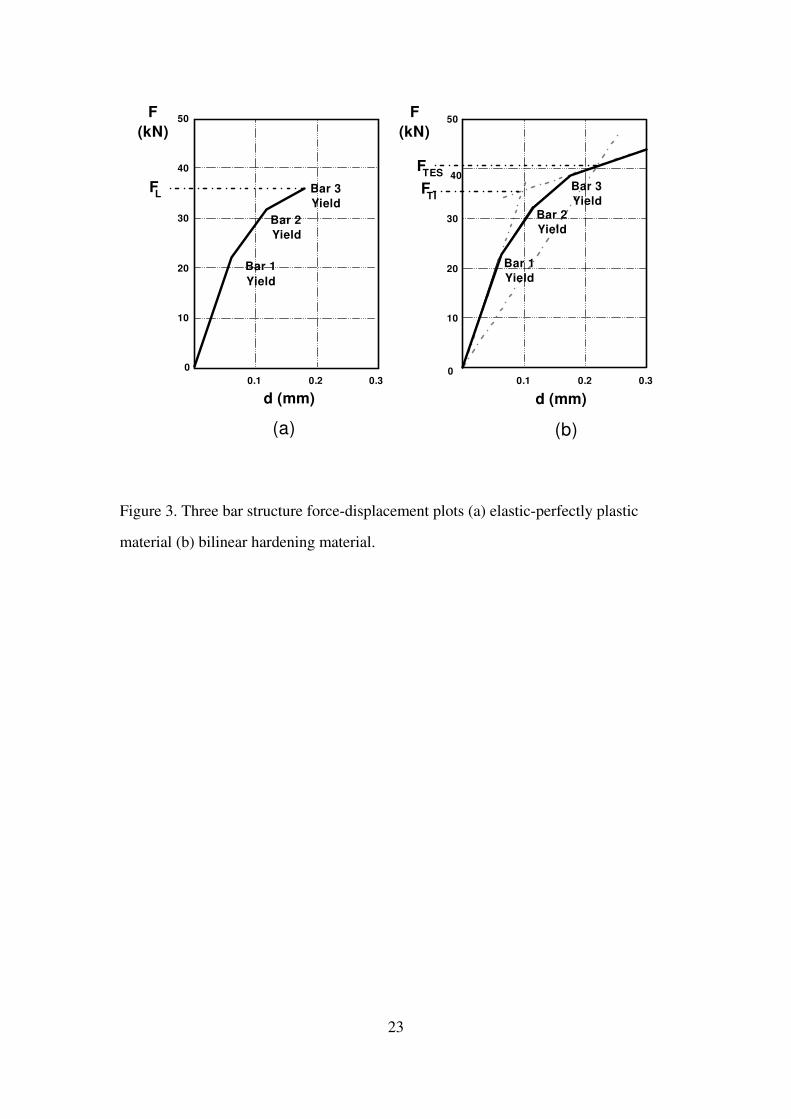
Force-displacement plots for the elastic-perfectly plastic and bilinear hardening
materials are presented in Figures 3a and 3b respectively. Both curves show distinct
changes in slope as the bars yield in sequence 1, 2, 3. In the elastic-perfectly plastic
structure, the limit load is reached when bar 3 yields, at FL=36kN. Above this load,
equilibrium between the internal and external forces is violated and unlimited plastic
flow occurs. In the strain hardening structure, the structure becomes fully plastic when
bar 3 yields at FFP=39kN but the structure can continue to support increasing load
indefinitely, due to the bilinear hardening material model, and a criterion of plastic
collapse must be used to define the plastic load. Applying the TES and TI criteria to the
8
strain-hardening force-deformation curve of Figure 3b gives plastic loads FTES=41kN
and FTI=36kN.
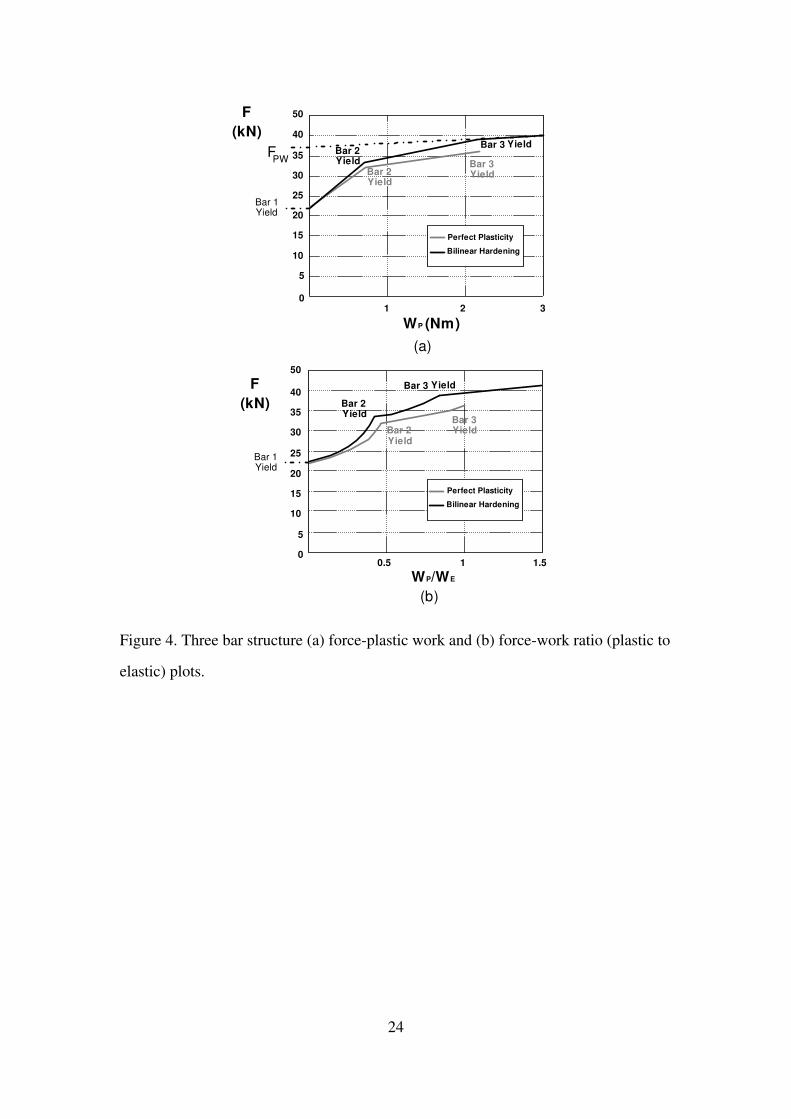
The evolution of gross plastic deformation in the three bar structures is characterised in
terms of plastic work dissipation in two plots in Figure 4. Figure 4a is a plot of applied
load against plastic work dissipation, as used in Muscat’s PW criterion. Figure 4b is a
plot of applied load against the ratio of plastic work dissipated, WP, to elastic strain
energy stored, WE. Gerdeen proposed that the load corresponding to a specific value of
the ratio EP WW /=α could characterise the plastic load but did not define a general
value for α.
Figure 4a shows that the elastic-perfectly plastic structure experiences more plastic
dissipation for a given (post-yield) load than the strain hardening structure (as bar 1 can
continue to store part of the external work done as elastic strain energy). As load is
increased, Bars 2 and 3 of the strain hardening structure remain elastic at loads greater
than the corresponding yield loads for these bars in the elastic-perfectly plastic
structure. The elastic-perfectly plastic structure becomes fully plastic when the limit
load FL=36kN is reached. Thereafter, the theoretical plastic dissipation increases
without bound as unlimited plastic flow occurs. The strain hardening structure becomes
fully plastic when the applied load reaches at FFP=39kN but it continues to support
increasing load. The rate of plastic dissipation is proportional to the increase in load and,
in accordance with the material model, it can continue to increase indefinitely.
Applying Muscat’s PW criterion [10] to the strain hardening curve gives a plastic load
FPW=37.5kN.
The Force-WP/WE curves for elastic-perfectly plastic and strain hardening materials in
Figure 4b show distinct changes in response at points corresponding to yield of each bar,
indicating distinct changes in elastic-plastic behaviour. For a given load, WP/WE is
greater for the elastic-perfectly plastic material than for the strain hardening material.
Considering the elastic-perfectly plastic material, the ratio WP/WE at the limit load has a
αL=1. At the fully plastic load in the strain hardening structure, the ratio has value
9
αFP=0.84.
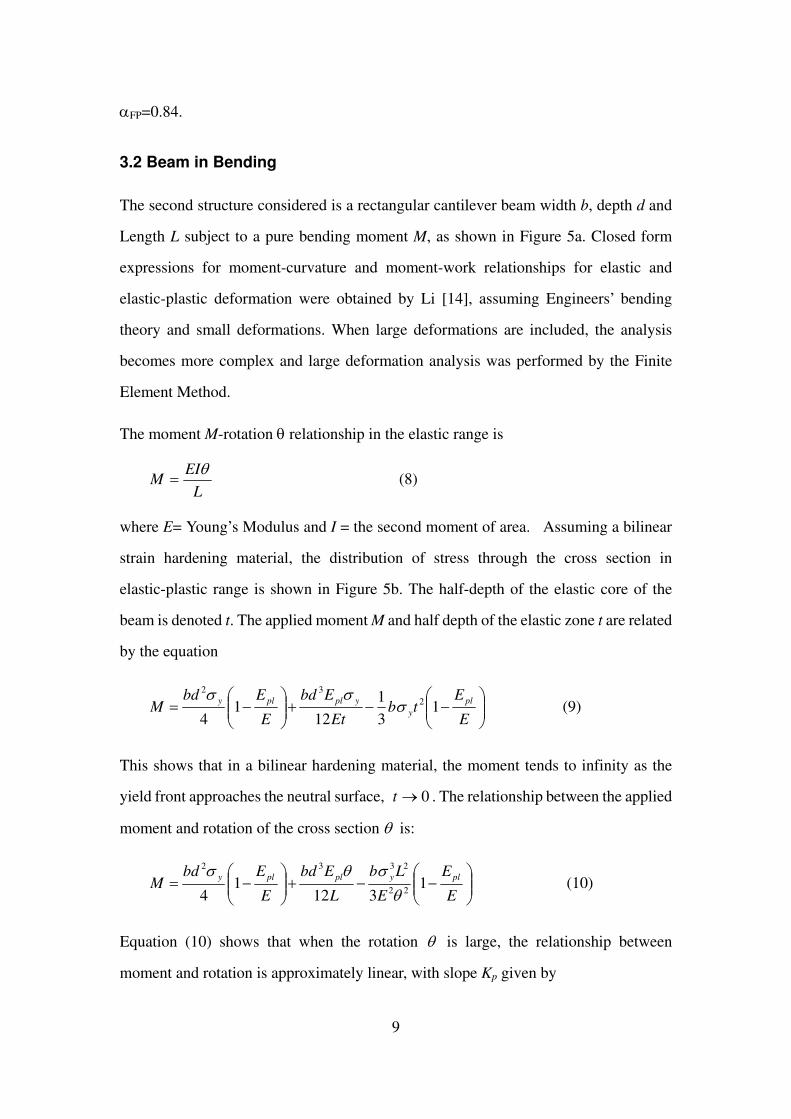
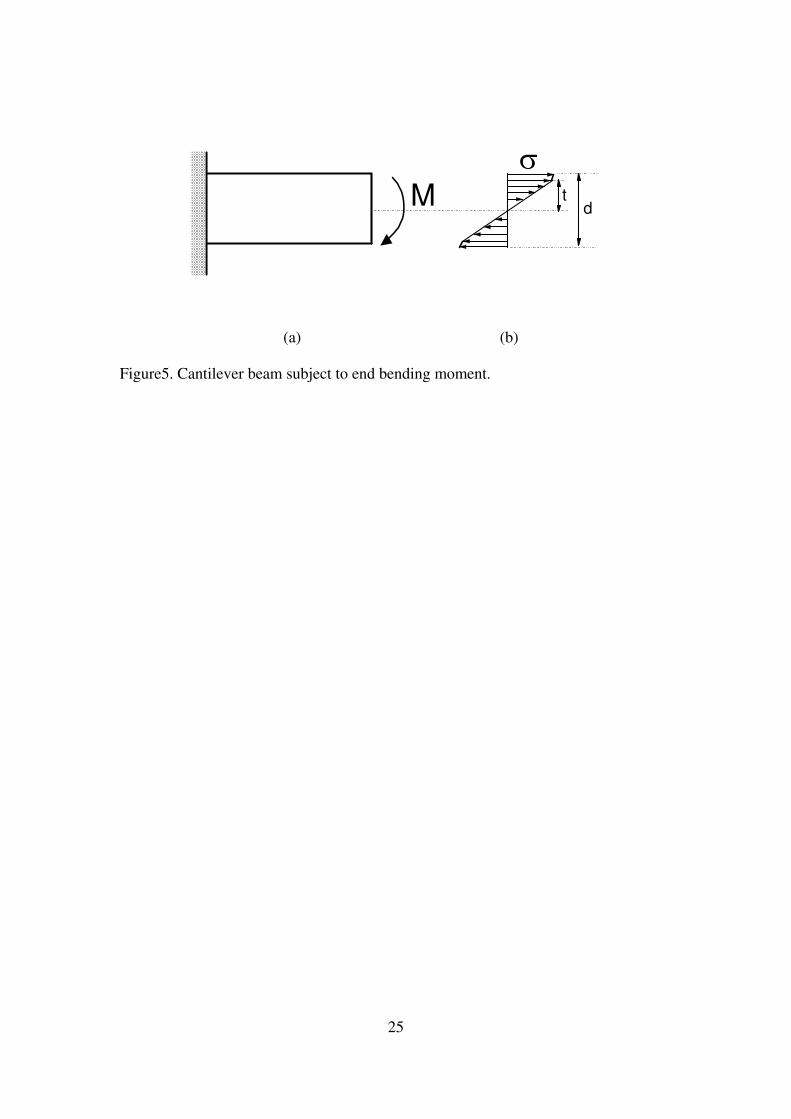
3.2 Beam in Bending
The second structure considered is a rectangular cantilever beam width b, depth d and
Length L subject to a pure bending moment M, as shown in Figure 5a. Closed form
expressions for moment-curvature and moment-work relationships for elastic and
elastic-plastic deformation were obtained by Li [14], assuming Engineers’ bending
theory and small deformations. When large deformations are included, the analysis
becomes more complex and large deformation analysis was performed by the Finite
Element Method.
The moment M-rotation θ relationship in the elastic range is
L
EIM
θ= (8)
where E= Young’s Modulus and I = the second moment of area. Assuming a bilinear
strain hardening material, the distribution of stress through the cross section in
elastic-plastic range is shown in Figure 5b. The half-depth of the elastic core of the
beam is denoted t. The applied moment M and half depth of the elastic zone t are related
by the equation
⎟⎟⎠
⎞⎜⎜⎝
⎛−−+⎟⎟
⎠
⎞⎜⎜⎝
⎛−=
E
Etb
Et
Ebd
E
EbdM
pl
y
yplply1
3
1
121
4
2
32
σσσ
(9)
This shows that in a bilinear hardening material, the moment tends to infinity as the
yield front approaches the neutral surface, 0→t . The relationship between the applied
moment and rotation of the cross section θ is:
⎟⎟⎠
⎞⎜⎜⎝
⎛−−+⎟⎟
⎠
⎞⎜⎜⎝
⎛−=
E
E
E
Lb
L
Ebd
E
EbdM
plyplply1
3121
4 22
2332
θσθσ
(10)
Equation (10) shows that when the rotation θ is large, the relationship between
moment and rotation is approximately linear, with slope Kp given by
10
L
EbdK
pl
p12
3
= (11)
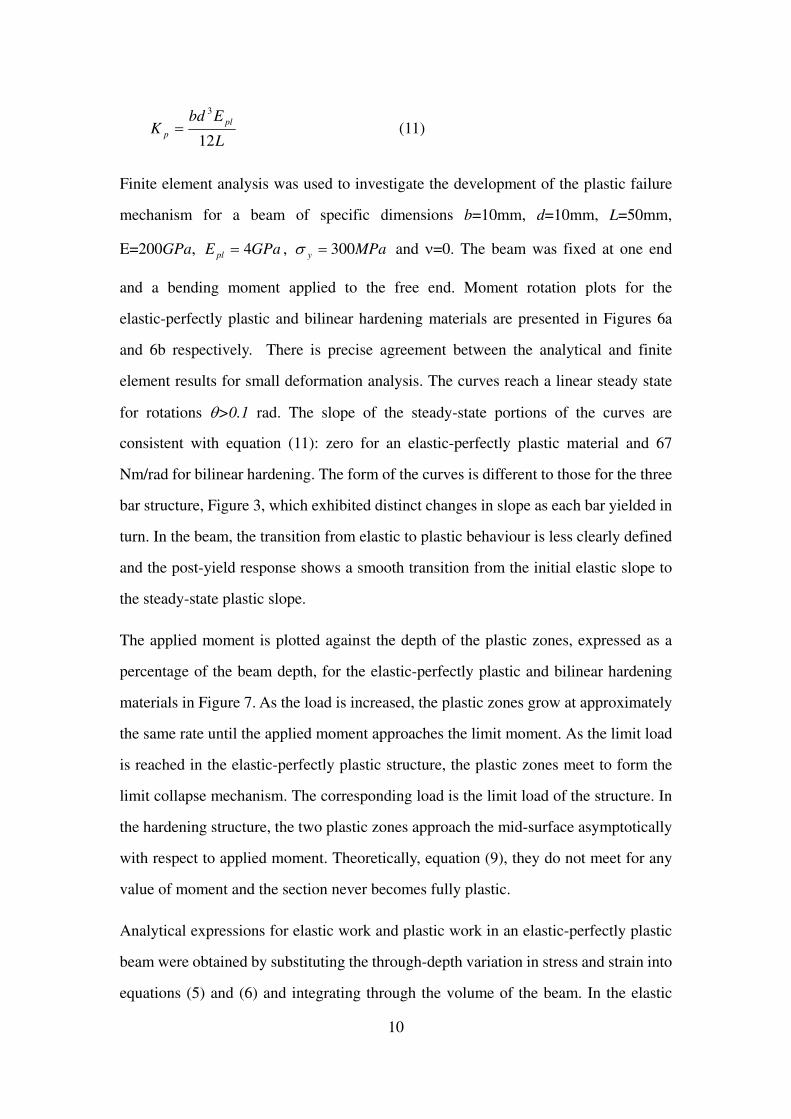
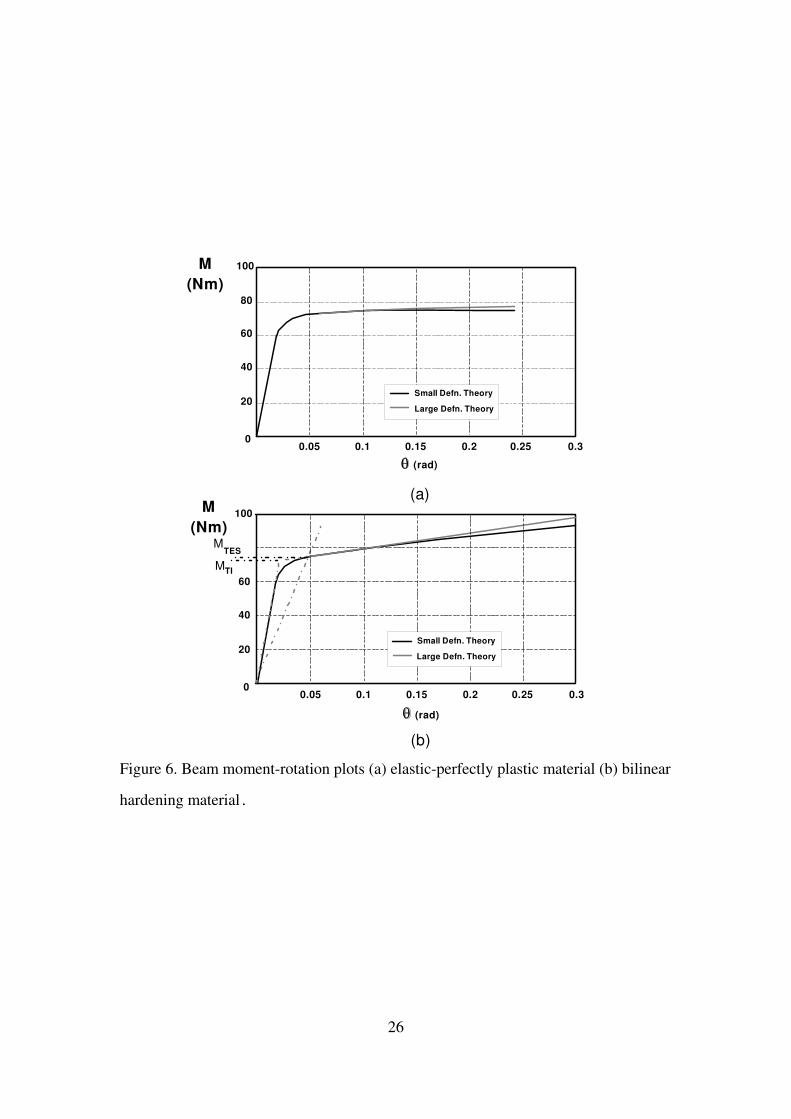
Finite element analysis was used to investigate the development of the plastic failure
mechanism for a beam of specific dimensions b=10mm, d=10mm, L=50mm,
E=200GPa, GPaE pl 4= , MPay 300=σ and ν=0. The beam was fixed at one end
and a bending moment applied to the free end. Moment rotation plots for the
elastic-perfectly plastic and bilinear hardening materials are presented in Figures 6a
and 6b respectively. There is precise agreement between the analytical and finite
element results for small deformation analysis. The curves reach a linear steady state
for rotations θ>0.1 rad. The slope of the steady-state portions of the curves are
consistent with equation (11): zero for an elastic-perfectly plastic material and 67
Nm/rad for bilinear hardening. The form of the curves is different to those for the three
bar structure, Figure 3, which exhibited distinct changes in slope as each bar yielded in
turn. In the beam, the transition from elastic to plastic behaviour is less clearly defined
and the post-yield response shows a smooth transition from the initial elastic slope to
the steady-state plastic slope.
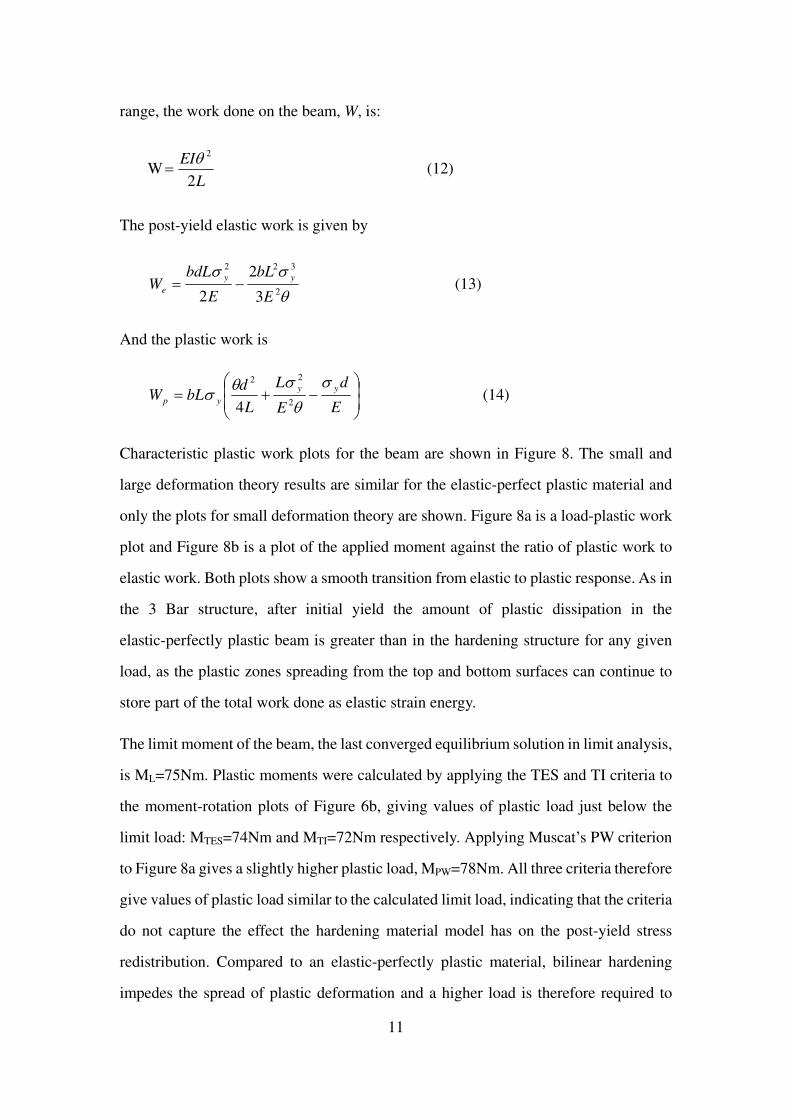
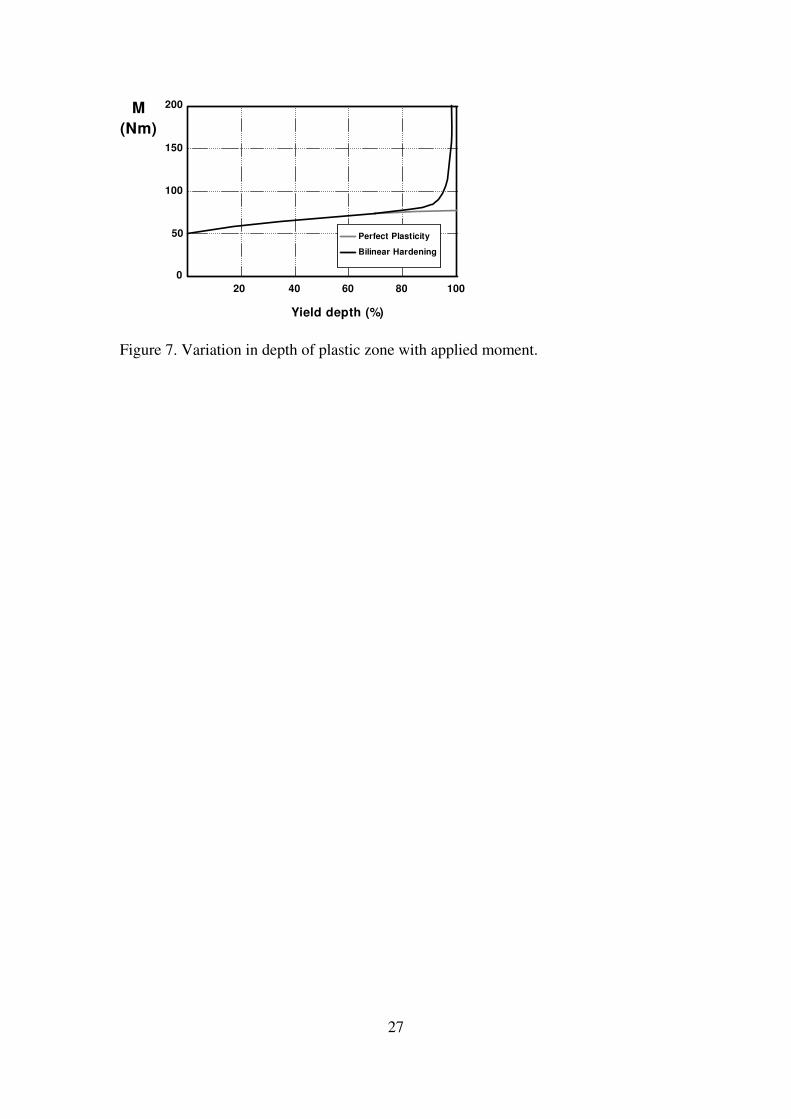
The applied moment is plotted against the depth of the plastic zones, expressed as a
percentage of the beam depth, for the elastic-perfectly plastic and bilinear hardening
materials in Figure 7. As the load is increased, the plastic zones grow at approximately
the same rate until the applied moment approaches the limit moment. As the limit load
is reached in the elastic-perfectly plastic structure, the plastic zones meet to form the
limit collapse mechanism. The corresponding load is the limit load of the structure. In
the hardening structure, the two plastic zones approach the mid-surface asymptotically
with respect to applied moment. Theoretically, equation (9), they do not meet for any
value of moment and the section never becomes fully plastic.
Analytical expressions for elastic work and plastic work in an elastic-perfectly plastic
beam were obtained by substituting the through-depth variation in stress and strain into
equations (5) and (6) and integrating through the volume of the beam. In the elastic
11
range, the work done on the beam, W, is:
WL
EI
2
2θ= (12)
The post-yield elastic work is given by
θσσ2
322
3
2
2 E
bL
E
bdLW
yy
e −= (13)
And the plastic work is
⎟⎟⎠
⎞⎜⎜⎝
⎛−+=
E
d
E
L
L
dbLW
yy
yp
σθ
σθσ2
22
4 (14)
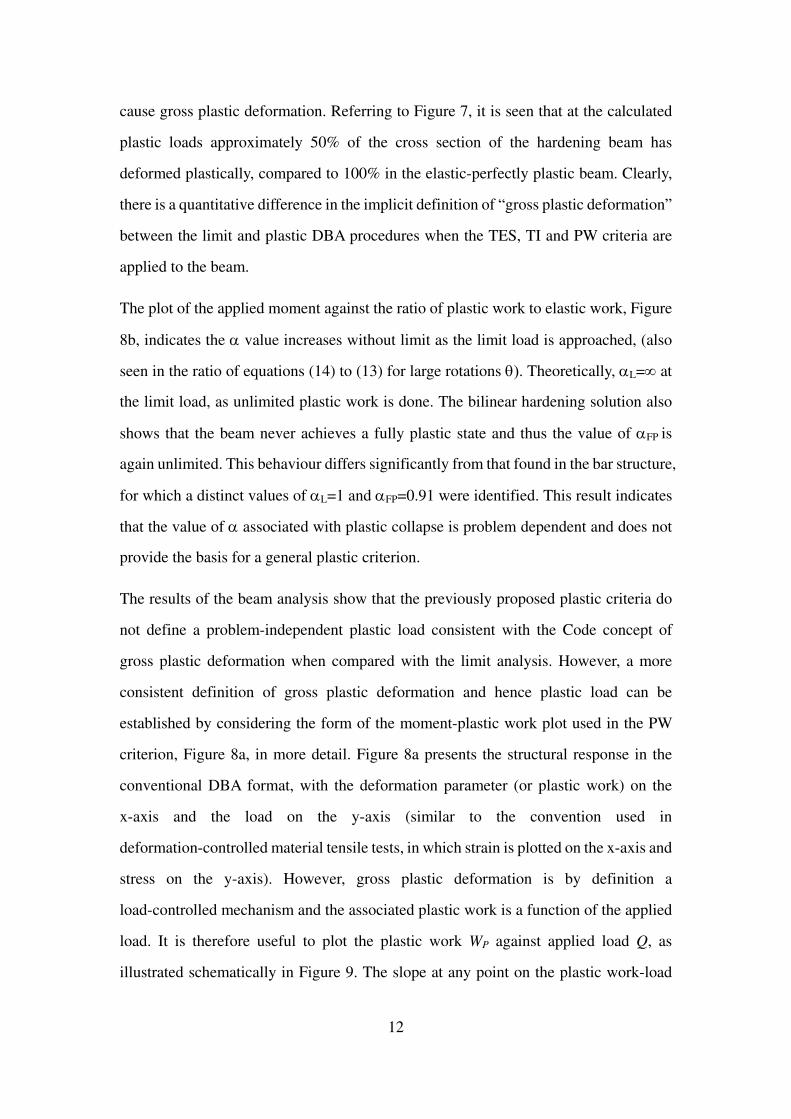
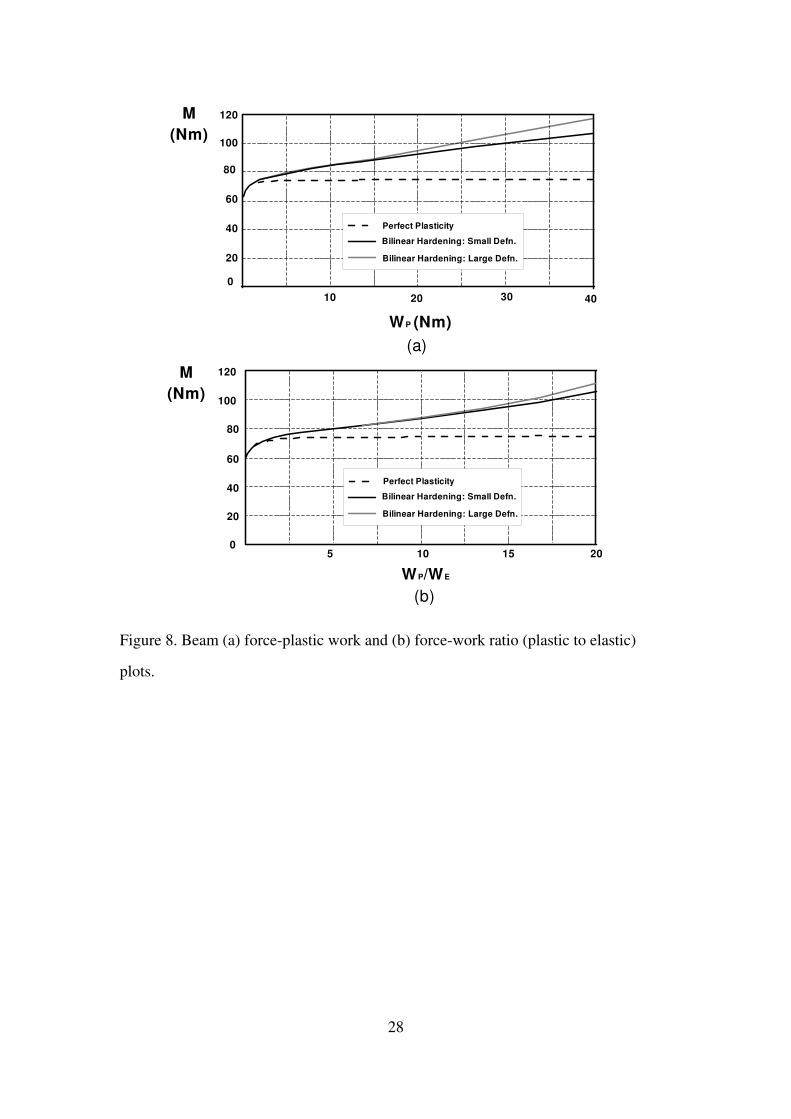
Characteristic plastic work plots for the beam are shown in Figure 8. The small and
large deformation theory results are similar for the elastic-perfect plastic material and
only the plots for small deformation theory are shown. Figure 8a is a load-plastic work
plot and Figure 8b is a plot of the applied moment against the ratio of plastic work to
elastic work. Both plots show a smooth transition from elastic to plastic response. As in
the 3 Bar structure, after initial yield the amount of plastic dissipation in the
elastic-perfectly plastic beam is greater than in the hardening structure for any given
load, as the plastic zones spreading from the top and bottom surfaces can continue to
store part of the total work done as elastic strain energy.
The limit moment of the beam, the last converged equilibrium solution in limit analysis,
is ML=75Nm. Plastic moments were calculated by applying the TES and TI criteria to
the moment-rotation plots of Figure 6b, giving values of plastic load just below the
limit load: MTES=74Nm and MTI=72Nm respectively. Applying Muscat’s PW criterion
to Figure 8a gives a slightly higher plastic load, MPW=78Nm. All three criteria therefore
give values of plastic load similar to the calculated limit load, indicating that the criteria
do not capture the effect the hardening material model has on the post-yield stress
redistribution. Compared to an elastic-perfectly plastic material, bilinear hardening
impedes the spread of plastic deformation and a higher load is therefore required to
12
cause gross plastic deformation. Referring to Figure 7, it is seen that at the calculated
plastic loads approximately 50% of the cross section of the hardening beam has
deformed plastically, compared to 100% in the elastic-perfectly plastic beam. Clearly,
there is a quantitative difference in the implicit definition of “gross plastic deformation”
between the limit and plastic DBA procedures when the TES, TI and PW criteria are
applied to the beam.
The plot of the applied moment against the ratio of plastic work to elastic work, Figure
8b, indicates the α value increases without limit as the limit load is approached, (also
seen in the ratio of equations (14) to (13) for large rotations θ). Theoretically, αL=∞ at
the limit load, as unlimited plastic work is done. The bilinear hardening solution also
shows that the beam never achieves a fully plastic state and thus the value of αFP is
again unlimited. This behaviour differs significantly from that found in the bar structure,
for which a distinct values of αL=1 and αFP=0.91 were identified. This result indicates
that the value of α associated with plastic collapse is problem dependent and does not
provide the basis for a general plastic criterion.
The results of the beam analysis show that the previously proposed plastic criteria do
not define a problem-independent plastic load consistent with the Code concept of
gross plastic deformation when compared with the limit analysis. However, a more
consistent definition of gross plastic deformation and hence plastic load can be
established by considering the form of the moment-plastic work plot used in the PW
criterion, Figure 8a, in more detail. Figure 8a presents the structural response in the
conventional DBA format, with the deformation parameter (or plastic work) on the
x-axis and the load on the y-axis (similar to the convention used in
deformation-controlled material tensile tests, in which strain is plotted on the x-axis and
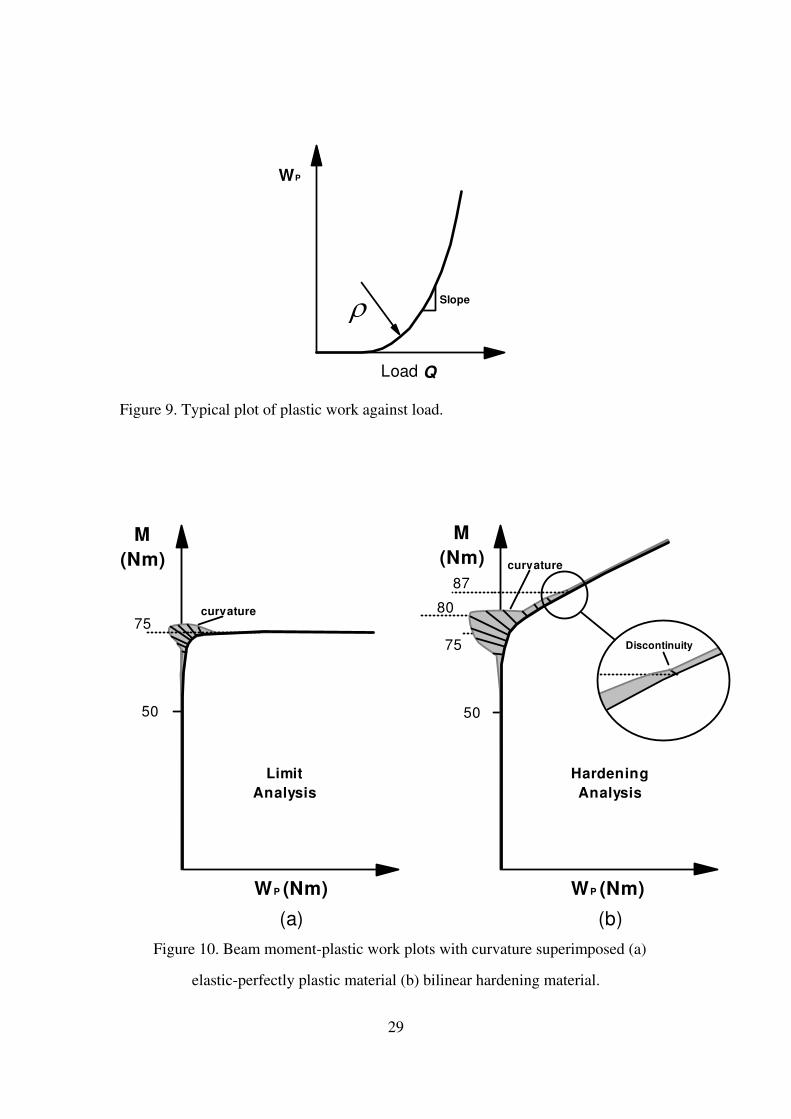
stress on the y-axis). However, gross plastic deformation is by definition a
load-controlled mechanism and the associated plastic work is a function of the applied
load. It is therefore useful to plot the plastic work WP against applied load Q, as
illustrated schematically in Figure 9. The slope at any point on the plastic work-load
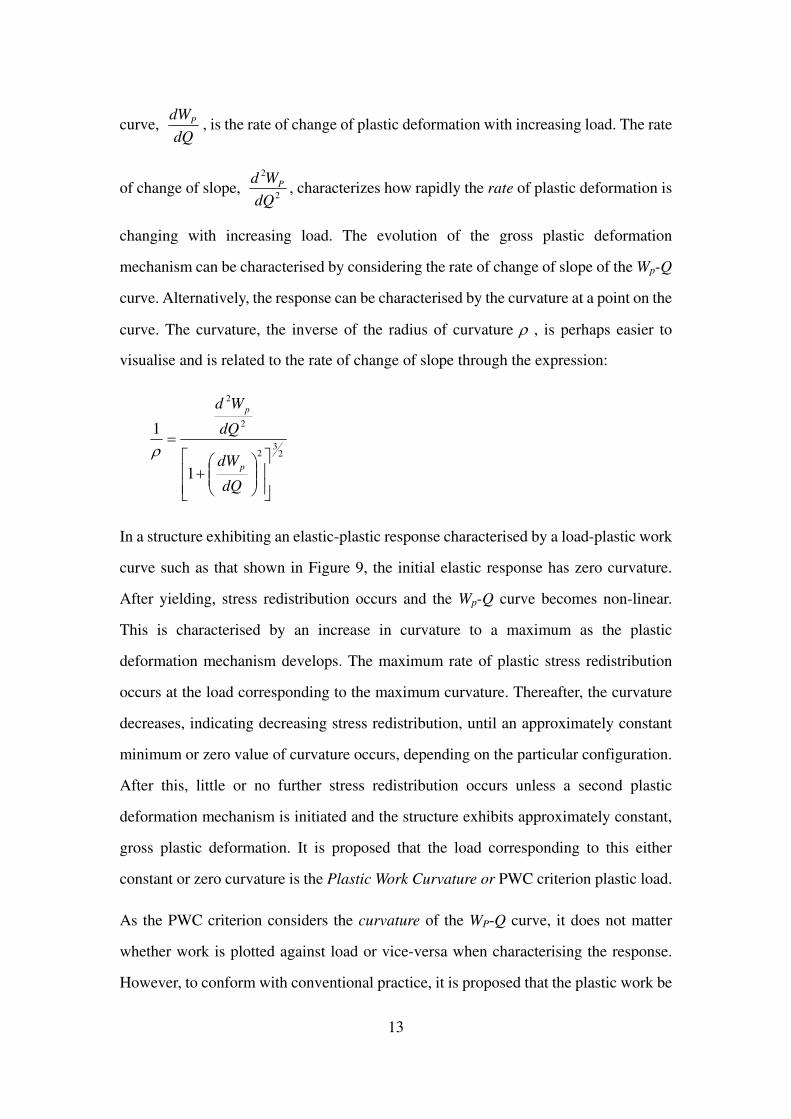
13
curve, dQ
dWP , is the rate of change of plastic deformation with increasing load. The rate
of change of slope, 2
2
dQ
Wd P , characterizes how rapidly the rate of plastic deformation is
changing with increasing load. The evolution of the gross plastic deformation
mechanism can be characterised by considering the rate of change of slope of the Wp-Q
curve. Alternatively, the response can be characterised by the curvature at a point on the
curve. The curvature, the inverse of the radius of curvature ρ , is perhaps easier to
visualise and is related to the rate of change of slope through the expression:
23
2
2
2
1
1
⎥⎥⎦
⎤
⎢⎢⎣
⎡⎟⎟⎠
⎞⎜⎜⎝
⎛+
=
dQ
dW
dQ
Wd
p
p
ρ
In a structure exhibiting an elastic-plastic response characterised by a load-plastic work
curve such as that shown in Figure 9, the initial elastic response has zero curvature.
After yielding, stress redistribution occurs and the Wp-Q curve becomes non-linear.
This is characterised by an increase in curvature to a maximum as the plastic
deformation mechanism develops. The maximum rate of plastic stress redistribution
occurs at the load corresponding to the maximum curvature. Thereafter, the curvature
decreases, indicating decreasing stress redistribution, until an approximately constant
minimum or zero value of curvature occurs, depending on the particular configuration.
After this, little or no further stress redistribution occurs unless a second plastic
deformation mechanism is initiated and the structure exhibits approximately constant,
gross plastic deformation. It is proposed that the load corresponding to this either
constant or zero curvature is the Plastic Work Curvature or PWC criterion plastic load.
As the PWC criterion considers the curvature of the WP-Q curve, it does not matter
whether work is plotted against load or vice-versa when characterising the response.
However, to conform with conventional practice, it is proposed that the plastic work be
14
plotted on the x-axis and the load on the y-axis. The curvature of the load-plastic work
curve can be obtained in several ways. Here, for convenience, the commercial
modeling program Pro/Engineer [15] was used to evaluate the curvature. A cubic spline
fit through load-plastic work data points was generated in ProE and the ProE Curvature
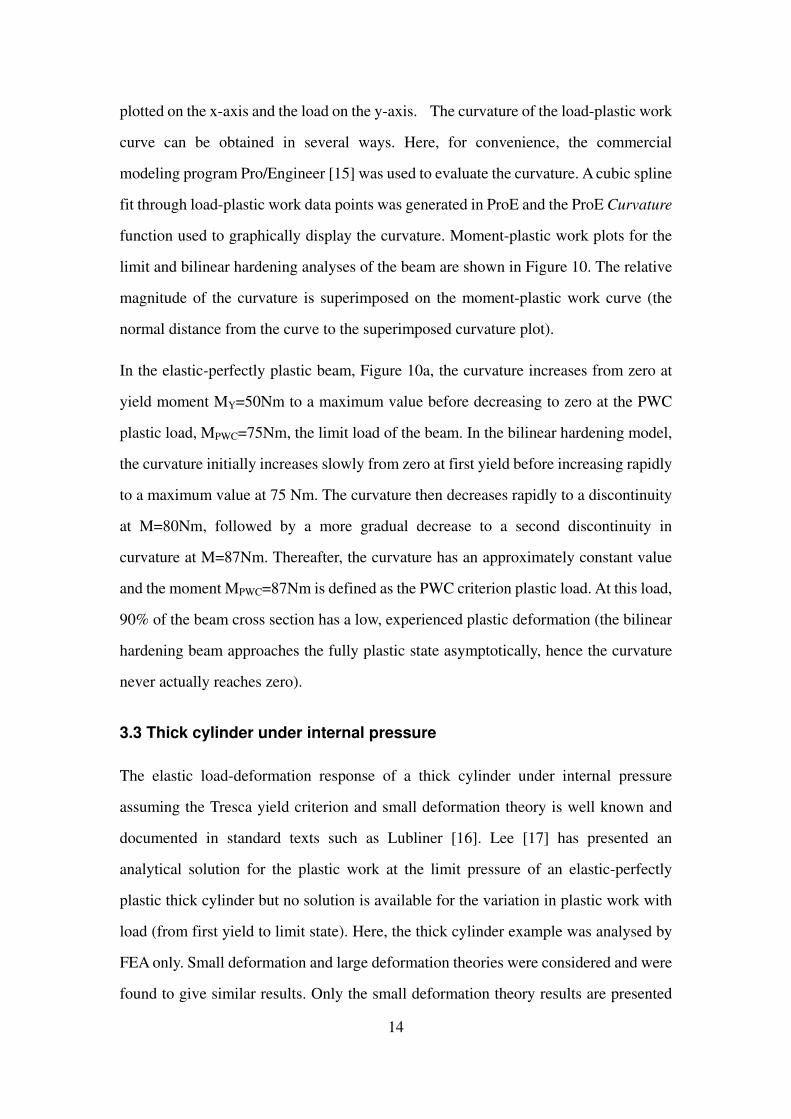
function used to graphically display the curvature. Moment-plastic work plots for the
limit and bilinear hardening analyses of the beam are shown in Figure 10. The relative
magnitude of the curvature is superimposed on the moment-plastic work curve (the
normal distance from the curve to the superimposed curvature plot).
In the elastic-perfectly plastic beam, Figure 10a, the curvature increases from zero at
yield moment MY=50Nm to a maximum value before decreasing to zero at the PWC
plastic load, MPWC=75Nm, the limit load of the beam. In the bilinear hardening model,
the curvature initially increases slowly from zero at first yield before increasing rapidly
to a maximum value at 75 Nm. The curvature then decreases rapidly to a discontinuity
at M=80Nm, followed by a more gradual decrease to a second discontinuity in
curvature at M=87Nm. Thereafter, the curvature has an approximately constant value
and the moment MPWC=87Nm is defined as the PWC criterion plastic load. At this load,
90% of the beam cross section has a low, experienced plastic deformation (the bilinear
hardening beam approaches the fully plastic state asymptotically, hence the curvature
never actually reaches zero).
3.3 Thick cylinder under internal pressure
The elastic load-deformation response of a thick cylinder under internal pressure
assuming the Tresca yield criterion and small deformation theory is well known and
documented in standard texts such as Lubliner [16]. Lee [17] has presented an
analytical solution for the plastic work at the limit pressure of an elastic-perfectly
plastic thick cylinder but no solution is available for the variation in plastic work with
load (from first yield to limit state). Here, the thick cylinder example was analysed by
FEA only. Small deformation and large deformation theories were considered and were
found to give similar results. Only the small deformation theory results are presented
15
here.
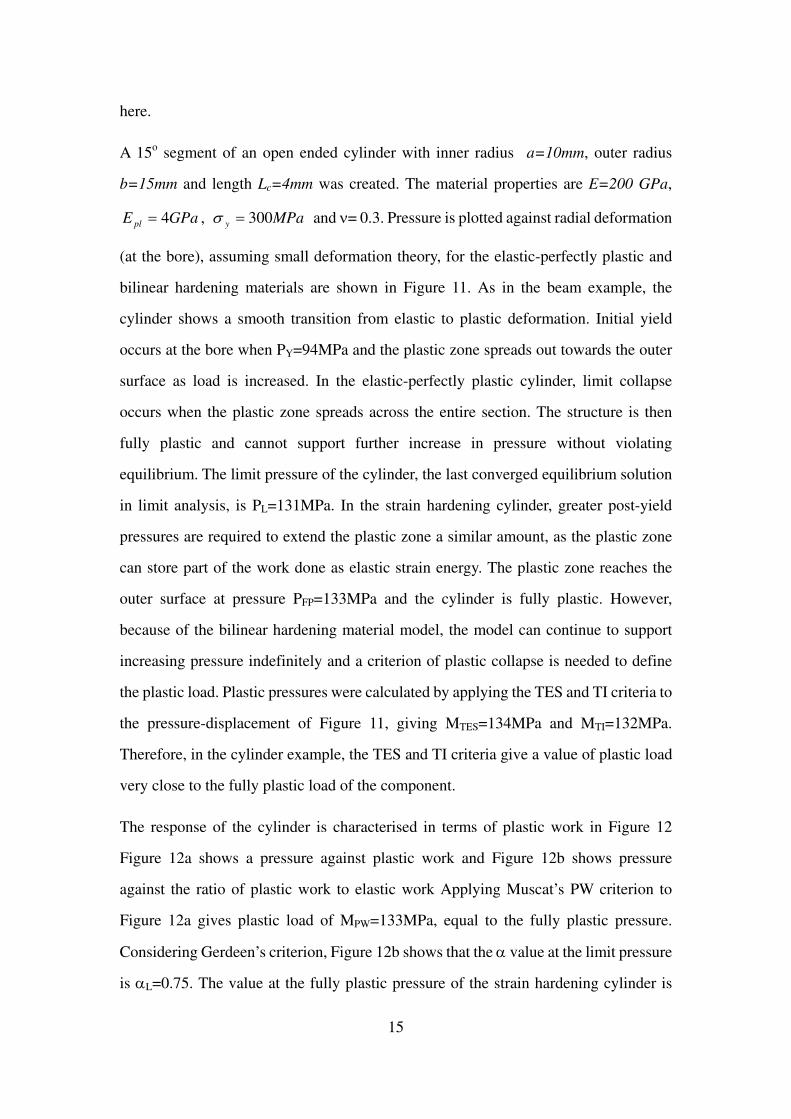
A 15o segment of an open ended cylinder with inner radius a=10mm, outer radius
b=15mm and length Lc=4mm was created. The material properties are E=200 GPa,
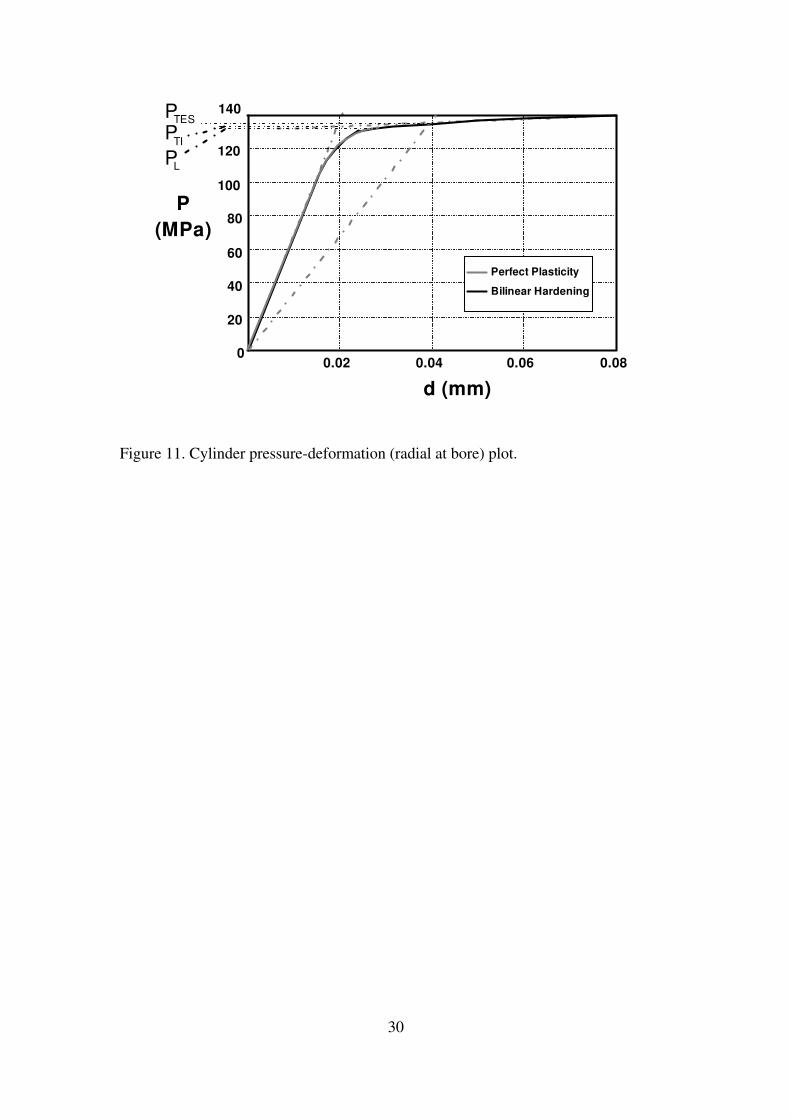
GPaE pl 4= , MPay 300=σ and ν= 0.3. Pressure is plotted against radial deformation
(at the bore), assuming small deformation theory, for the elastic-perfectly plastic and
bilinear hardening materials are shown in Figure 11. As in the beam example, the
cylinder shows a smooth transition from elastic to plastic deformation. Initial yield
occurs at the bore when PY=94MPa and the plastic zone spreads out towards the outer
surface as load is increased. In the elastic-perfectly plastic cylinder, limit collapse
occurs when the plastic zone spreads across the entire section. The structure is then
fully plastic and cannot support further increase in pressure without violating
equilibrium. The limit pressure of the cylinder, the last converged equilibrium solution
in limit analysis, is PL=131MPa. In the strain hardening cylinder, greater post-yield
pressures are required to extend the plastic zone a similar amount, as the plastic zone
can store part of the work done as elastic strain energy. The plastic zone reaches the
outer surface at pressure PFP=133MPa and the cylinder is fully plastic. However,
because of the bilinear hardening material model, the model can continue to support
increasing pressure indefinitely and a criterion of plastic collapse is needed to define
the plastic load. Plastic pressures were calculated by applying the TES and TI criteria to
the pressure-displacement of Figure 11, giving MTES=134MPa and MTI=132MPa.
Therefore, in the cylinder example, the TES and TI criteria give a value of plastic load
very close to the fully plastic load of the component.
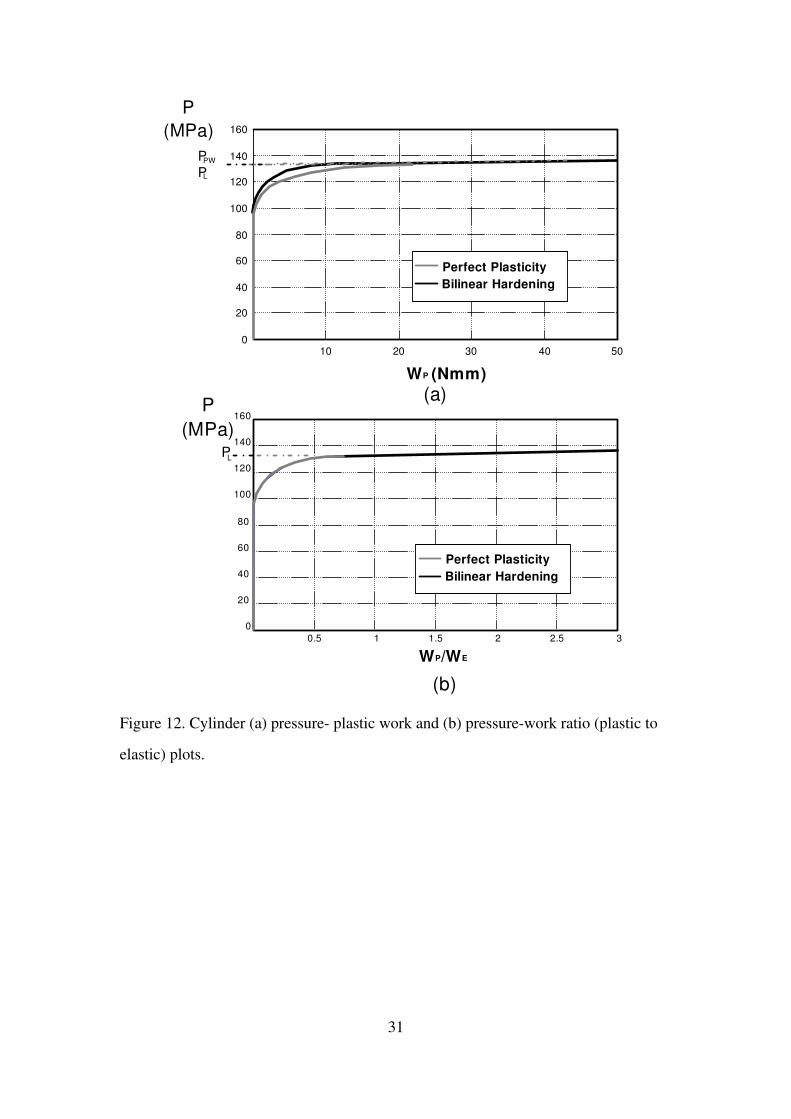
The response of the cylinder is characterised in terms of plastic work in Figure 12
Figure 12a shows a pressure against plastic work and Figure 12b shows pressure
against the ratio of plastic work to elastic work Applying Muscat’s PW criterion to
Figure 12a gives plastic load of MPW=133MPa, equal to the fully plastic pressure.
Considering Gerdeen’s criterion, Figure 12b shows that the α value at the limit pressure
is αL=0.75. The value at the fully plastic pressure of the strain hardening cylinder is
16
αFP=1.6.
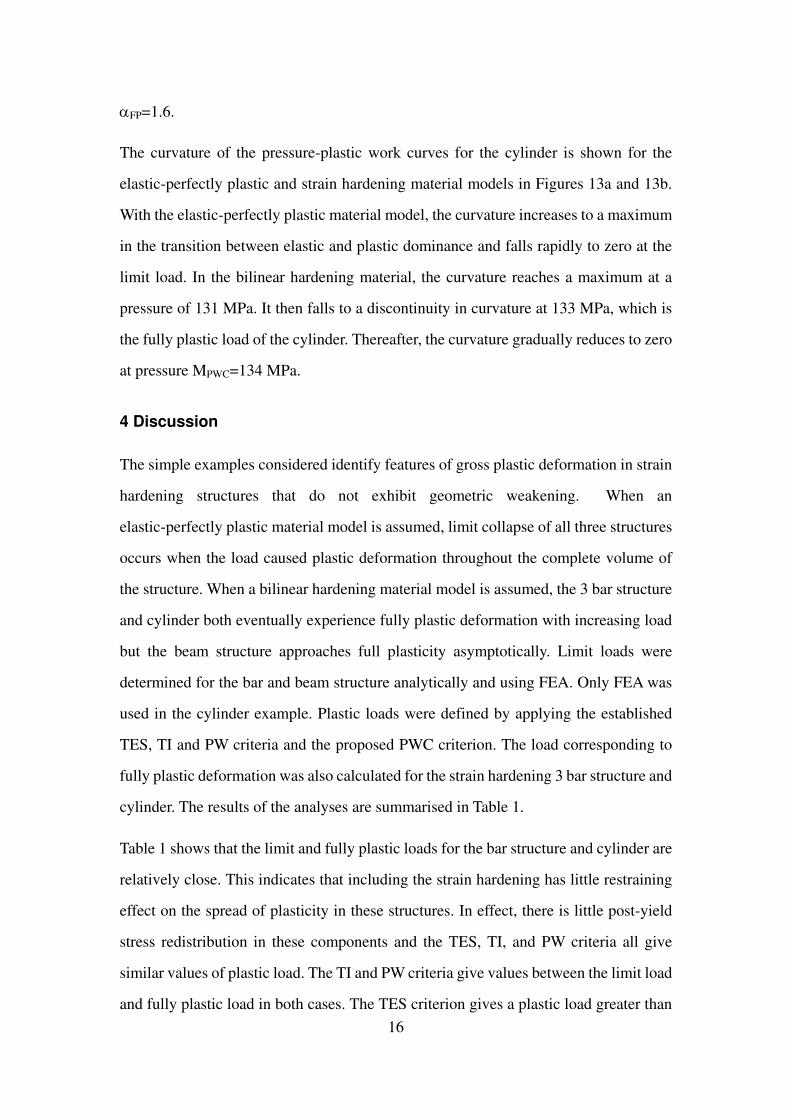
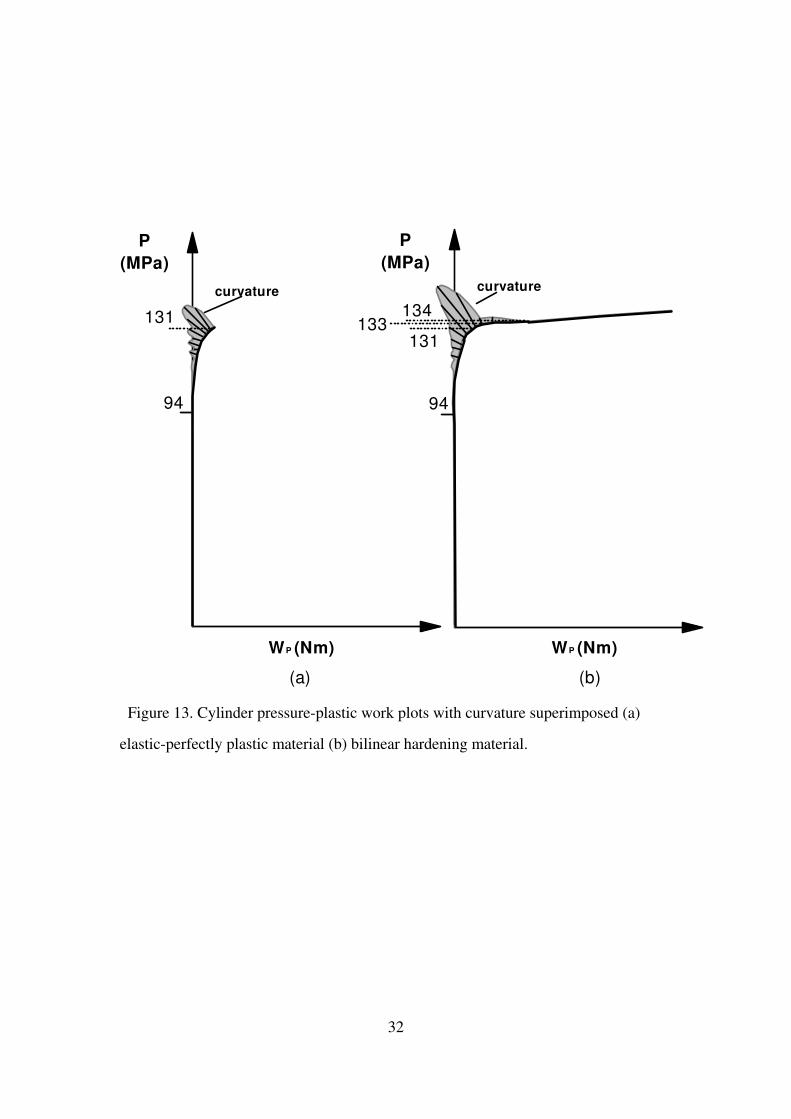
The curvature of the pressure-plastic work curves for the cylinder is shown for the
elastic-perfectly plastic and strain hardening material models in Figures 13a and 13b.
With the elastic-perfectly plastic material model, the curvature increases to a maximum
in the transition between elastic and plastic dominance and falls rapidly to zero at the
limit load. In the bilinear hardening material, the curvature reaches a maximum at a
pressure of 131 MPa. It then falls to a discontinuity in curvature at 133 MPa, which is
the fully plastic load of the cylinder. Thereafter, the curvature gradually reduces to zero
at pressure MPWC=134 MPa.
4 Discussion
The simple examples considered identify features of gross plastic deformation in strain
hardening structures that do not exhibit geometric weakening. When an
elastic-perfectly plastic material model is assumed, limit collapse of all three structures
occurs when the load caused plastic deformation throughout the complete volume of
the structure. When a bilinear hardening material model is assumed, the 3 bar structure
and cylinder both eventually experience fully plastic deformation with increasing load
but the beam structure approaches full plasticity asymptotically. Limit loads were
determined for the bar and beam structure analytically and using FEA. Only FEA was
used in the cylinder example. Plastic loads were defined by applying the established
TES, TI and PW criteria and the proposed PWC criterion. The load corresponding to
fully plastic deformation was also calculated for the strain hardening 3 bar structure and
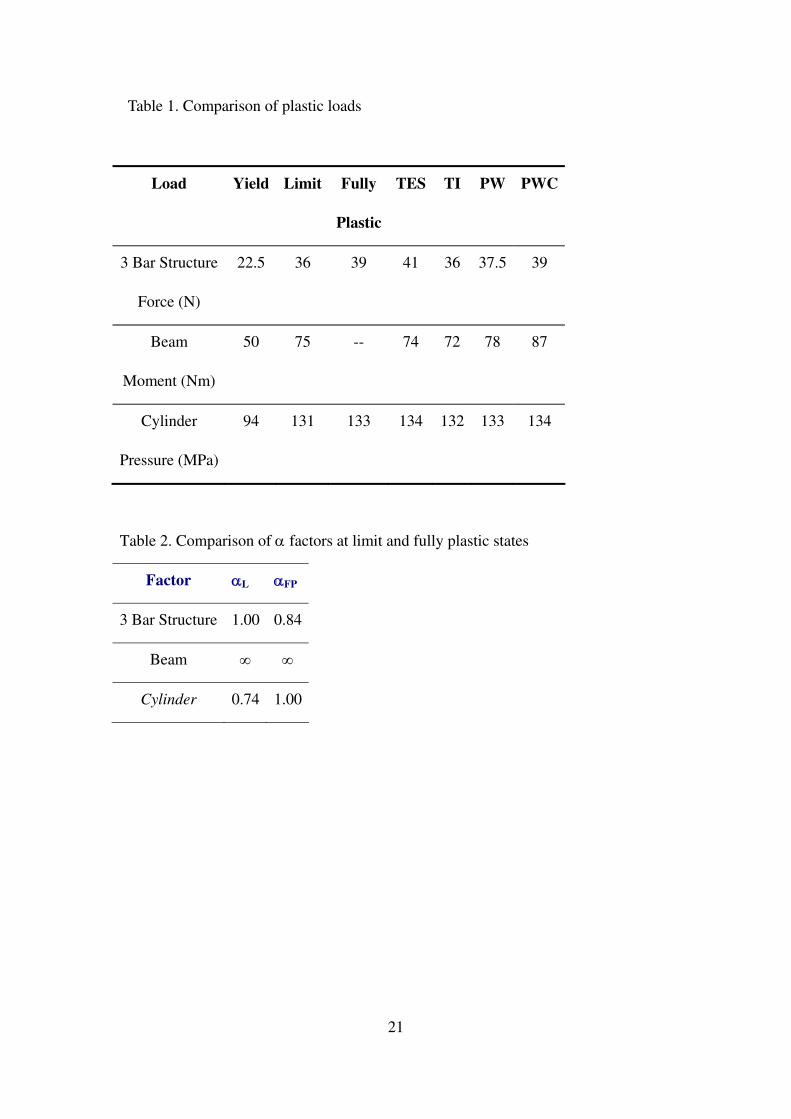
cylinder. The results of the analyses are summarised in Table 1.
Table 1 shows that the limit and fully plastic loads for the bar structure and cylinder are
relatively close. This indicates that including the strain hardening has little restraining
effect on the spread of plasticity in these structures. In effect, there is little post-yield
stress redistribution in these components and the TES, TI, and PW criteria all give
similar values of plastic load. The TI and PW criteria give values between the limit load
and fully plastic load in both cases. The TES criterion gives a plastic load greater than
17
the fully plastic load for the bar structure and a plastic pressure marginally greater than
the fully plastic pressure for the cylinder. The new PWC is applied to this structure by
inspection of the load-plastic work curve of Figure 4a. There is a discontinuity in the
curve at the point at which bar 3 yields, effectively a curvature of infinity. Thereafter,
the structural response is steady state plastic deformation with no further stress
redistribution. Yield of bar 3, or the fully plastic state, is therefore taken as the PWC
plastic load.
The beam structure behaves differently from the others in that it never becomes fully
plastic. These is also extensive stress redistribution between yield and the gross plastic
deformation state for this configuration. The TES, TI and PW criteria all give plastic
moments for the strain hardening structures close to the limit moment, corresponding to
50% plastic deformation of the beam cross section. In limit analysis, 100% of the beam
cross section experiences (gross) plastic deformation at the limit moment. In this case,
the TES, TI and PW criteria do not, therefore, capture the strength enhancing effect of
strain hardening. The PWC criterion gives a significantly larger value for plastic
moment, corresponding to 90% plastic deformation of the cross section of the beam.
This signifies gross plastic deformation in the PWC criterion.
Gerdeen’s proposal that the ratio of plastic work to elastic work, the α factor, can be
used as an indicator of gross plastic deformation was also investigated for the three
examples. Gerdeen did not specify a general value for α to be used in DBA and the
plots of load against WP/WE obtained fro the three examples do not indicate a general
trend. The α values corresponding to the limit state and fully plastic state (where
possible) are shown in Table 2. These indicate that the appropriate value of α to be used
in DBA is likely to be problem dependent.
5 Conclusion
The investigation indicates that the PWC criterion may prove to be a useful way to
determine the plastic load in pressure vessel DBA. The curvature characterises the real
physical process, the evolution of plastic deformation with increasing load. Salient
18
points on the curve indicate significant events in the formation of the failure mechanism.
The onset of curvature indicates initial yield, the maximum value of curvature indicates
a change from elastic to plastic dominated response and the return to low or zero
curvature indicates gross plasticity. At this stage in the development criterion no value
of curvature or relative curvature is defined as indicating gross plastic deformation and
the values specified in the sample analysis are to some extent subjective. The scope of
the investigation was limited to three simple structural configurations and two material
models. A more extensive investigation of real pressure vessel components, boundary
conditions and material models is required to establish if a general and objective
formulation of the criterion can be specified. It is proposed to extend the investigation
of the PWC criterion to more complex problems in future work.
Acknowledgement
The authors wish to thank Dr Bobby Hamilton for his help and insight when preparing
this paper.
19
References
[1] BSI, PD5500:2000 Specification for Unfired fusion welded pressure vessels.
British standards Institution, London, 2000.
[2] EN 13445, Unfired pressure vessels – Part 3: Design. European Committee for
Standardisation (CEN), 2002.
[3] ASME, Boiler and Pressure Vessel Code Section VIII, American Society for
Mechanical Engineers, New York, USA, 2004.
[4] J.C. Gerdeen, “A Critical Evaluation of Plastic Behaviour Data and a United
Definition of Plastic Loads for Pressure Components,” Welding Research Bulletin
No.254, 1979.
[5] Townley, C. H. A., Findlay, G. E., Goodman, A. M., and Stanley, P., “Elastic-Plastic
Computations as a Basis for Design Charts for Torispherical Pressure Vessel Ends,”
Proc. I. Mech. E., Vol. 185(63), pp, 869-877, 1971.
[6] American Society for Mechanical Engineers, New York, USA-ASME, Boiler and
Pressure Vessel Code, 1974.
[7] American Society for Mechanical Engineers, New York, USA-ASME, Boiler and
Pressure Vessel Code, 1971.
[8] M.Save, Experimental verification of plastic limit analysis of torispherical and
toriconical heads, Pressure vessels and piping: Design and Analysis, Vol.1 ASME p
382-416,1972.
[9] Moffat D. G., Hsieh M.F., Lynch M. “An Assessment of ASME III and CEN TC54
Methods of Determining Plastic and Limit Loads for Pressure System Components.” J.
Strain Analysis, 36(3): 301- 12, 2001.
[10] Muscat M, Mackenzie D and Hamilton R, “A work Criterion for Plastic
Collapse”, Int. J. of Pressure Vessel and Piping, 80, p 49-58, 2003.
20
[11] Robertson A, Li H and Mackenzie D, “Plastic collapse of pipe bends under
combined internal pressure and in-plane bending,” Int. J. of Pressure Vessel and Piping,
In Press.
[12] K. S. Lee, “The Influence of Attachment Size on the Limit Pressures of Defective
Piping Components.” PhD Thesis, the University of Liverpool, UK, 2003.
[13] ANSYS Version 8.0. ANSYS Inc., Canonsberg, PA 15317; 2003.
[14] H. Li, “Plastic Collapse Analysis of Pressure Vessel Components,” MPhil Thesis,
University Of Strathclyde, UK, 2004.
[15] Pro/Engineer, PTC, Needham, MA, USA, 2001.
[16] Lubliner J., “Plasticity Theory”, Macmillan Publishing Company, New York,
1990.
21
Table 1. Comparison of plastic loads
Load Yield Limit Fully
Plastic
TES TI PW PWC
3 Bar Structure
Force (N)
22.5 36 39 41 36 37.5 39
Beam
Moment (Nm)
50 75 -- 74 72 78 87
Cylinder
Pressure (MPa)
94 131 133 134 132 133 134
Table 2. Comparison of α factors at limit and fully plastic states
Factor αL αFP
3 Bar Structure 1.00 0.84
Beam ∞ ∞
Cylinder 0.74 1.00
22
Load
Deformation
PP
k
k/2
Load
Deformation
PP
Load
Parameter
Plastic Work
λP
(a) (b) (c)
Figure 1. DBA plastic criteria (a) Twice Elastic Slope (b) Tangent Intersection (c)
Plastic Work.
Bar 2
Bar 1
F
Rigid
Block
Bar 3
Figure 2. Three bar structure.
23
0
10
20
30
40
50
0.1 0.2 0.3
(a) (b)
0.1 0.2 0.3
0
10
20
30
40
50F
(kN)
d (mm)
F
(kN)
d (mm)
FL
Bar 1
Yield
Bar 1
Yield
Bar 3
Yield
Bar 2
Yield
Bar 2
Yield
Bar 3
YieldF
TI
FTES
Figure 3. Three bar structure force-displacement plots (a) elastic-perfectly plastic
material (b) bilinear hardening material.
24
0
5
10
15
20
25
30
35
40
0.5 1 1.5
WP/WE
F
(kN)
Bar 1Yield
Bar 3YieldBar 2
Yield
Bar 3 Yield
Bar 2Yield
Bilinear Hardening
Perfect Plasticity
(b)
50
0
5
10
15
20
25
30
35
40
1 2 3
WP (Nm)
F
(kN)
FPW
Bar 1Yield
Bar 3YieldBar 2
Yield
Bar 2Yield
Bar 3 Yield
Bilinear Hardening
Perfect Plasticity
(a)
50
Figure 4. Three bar structure (a) force-plastic work and (b) force-work ratio (plastic to
elastic) plots.
25
M
t
σd
(a) (b)
Figure5. Cantilever beam subject to end bending moment.
26
0.05 0.1 0.15 0.2 0.25 0.3
20
40
60
80
100
0
20
40
60
100
00.05 0.1 0.15 0.2 0.25 0.3
(a)
(b)
Small Defn. Theory
Large Defn. Theory
Small Defn. Theory
Large Defn. Theory
MTI
MTES
M
(Nm)
M
(Nm)
θ (rad)
θ (rad)
Figure 6. Beam moment-rotation plots (a) elastic-perfectly plastic material (b) bilinear
hardening material.
27
0
50
100
150
200
20 40 60 80 100
Yield depth (%)
M
(Nm)
Bilinear Hardening
Perfect Plasticity
Figure 7. Variation in depth of plastic zone with applied moment.
28
0
20
40
60
80
100
120
20 4010 30
Bilinear Hardening: Small Defn.
Perfect Plasticity
Bilinear Hardening: Large Defn.
0
20
40
60
80
100
120
10 205 15
WP (Nm)
WP/WE
Bilinear Hardening: Small Defn.
Perfect Plasticity
Bilinear Hardening: Large Defn.
(a)
(b)
M
(Nm)
M
(Nm)
Figure 8. Beam (a) force-plastic work and (b) force-work ratio (plastic to elastic)
plots.
29
Load Q
Slope
WP
ρ
Figure 9. Typical plot of plastic work against load.
80
87
50
75
50
curvature
curvature
75
Limit
Analysis
Hardening
Analysis
WP (Nm)
M
(Nm)
WP (Nm)
M
(Nm)
(a) (b)
Discontinuity
Figure 10. Beam moment-plastic work plots with curvature superimposed (a)
elastic-perfectly plastic material (b) bilinear hardening material.
30
0
20
40
60
80
100
120
140
0.02 0.04 0.06 0.08
d (mm)
Bilinear Hardening
Perfect Plasticity
PTES
PTI
PL
P
(MPa)
Figure 11. Cylinder pressure-deformation (radial at bore) plot.
31
0
20
40
60
80
100
120
140
160
10 20 30 40 50
Bilinear Hardening
Perfect Plasticity
P
(MPa)
WP (Nmm)
PPW
PL
0
20
40
60
80
100
120
140
160
0.5 1 1.5 2 2.5 3
WP/WE
P
(MPa)PL
(a)
(b)
Bilinear Hardening
Perfect Plasticity
Figure 12. Cylinder (a) pressure- plastic work and (b) pressure-work ratio (plastic to
elastic) plots.
32
134131 133
94 94
P
(MPa)
P
(MPa)
curvature curvature
131
WP (Nm) WP (Nm)
(a) (b)
Figure 13. Cylinder pressure-plastic work plots with curvature superimposed (a)
elastic-perfectly plastic material (b) bilinear hardening material.