Embed Size (px)
Citation preview
Chapter 1
ADAPTIVE VALUE NETWORKS Convergence of Emerging Tools, Technologies and Standards as Catalytic Drivers*
Shoumen Datta1, Bob Betts2, Mark Dinning3, Feryal Erhun4, Tom Gibbs5, Pinar Keskinocak6, Hui Li1, Mike Li1, Micah Samuels7 Massachusetts Institute of Technology1, Timogen Inc.2, Dell Corporation3, Stanford University4, Intel Corporation5, Georgia Institute of Technology6, Amazon.com7
Abstract: If a typhoon in the South China Sea impacts the shipment and delivery of memory chips to an assembly plant in Mexico City, you can count on the ripple effect to impact financial service providers, manufacturers and suppliers, shippers in charge of logistics and of course, the end-consumer. Can we plan to reduce the risk arising from such uncertainties? Can businesses (semiconductor plants, banks, logistics providers) cooperate to minimize uncertainties? Conventional wisdom states that uncertainties are equivalent to accidents and hence by nature remain unpredictable. However, application of tools and technologies based on emerging standards may partially disprove such wisdom. Focus on demand management may be the guiding light for supply chain practitioners. Can we collapse information asymmetries (between manufacturers and their lending institutions, for example) and add far more value to networks or demand webs? Real-time operational adaptability is key, especially in fast ‘clockspeed’ industries. Confluence of emerging tools, technologies and standards are required to converge to catalyze the evolution of such adaptable enterprise. Can real-time distributed data, in-network processing, Agent-based autonomy, taken together, tame the Bullwhip Effect? Can the (semantic) web catalyze the “Nash Equilibrium” of people (games) and information (theory) in our quest for real time "predictive" decision support systems? We will explore a few of these issues and how they may coalesce to enable the adaptive value network of the future.
Key words: Adaptive value networks, Game theory, Bullwhip effect, Agent, Automatic Identification Technologies
2 Chapter 1
New technologies for supply chain management and flexible
manufacturing imply that businesses can perceive imbalances in inventories at an early stage — virtually in real time — and can cut production promptly in response to the developing signs of unintended inventory build up.
Alan Greenspan Testimony to the U.S. Senate Committee on Banking, Housing and Urban Affairs (13 February 2001) *Disclaimer: This article is an over-simplified and incomplete
exploration of a few tools and technologies that may converge to influence decision support systems in a manner that may catalyze the transformation of current-day supply chains toward an adaptive value network. In addition to named contributions, the corresponding author has used several sources of information in an effort to ‘connect the dots’ to suggest how apparently distant disciplines, if coalesced, may be complementary. Although the list of references is seriously incomplete, it should be amply clear that the original research is not due to the corresponding author. However, quotes, opinions, comments expressed in this article are solely attributable to the corresponding author and do not represent the views of MIT as an institution or the co-authors or their institutions or organizations. Some terms, for example, information asymmetry, may be used in a generic sense to imply lack of information or information visibility. This article is not an original research document but rather a synthesis of a few ideas, which, if taken together, may be catalytic in the transformation of supply chain management to become adaptive or perhaps even predictive. In this chapter we suggest that adaptive may morph into ‘predictive’ through a confluence of principles. We advocate inclusion of ARCH (autoregressive conditional heteroskedasticity) and GARCH (generalized ARCH) in the context of supply chains to model high frequency (volume) real-time data (from RFID tags) that may also exhibit volatility (http://pages.stern.nyu.edu/~rengle/). All errors of content or coherence are solely due to the corresponding author.

1. ADAPTIVE VALUE NETWORKS 3 1. INTRODUCTION
“At the science museum in Barcelona, I saw an exhibit that beautifully illustrated ‘chaos.’ A nonlinear version of a pendulum was set up so that a visitor could hold the bob and start out in a chosen position with a chosen velocity. One could then watch the subsequent motion, which was also recorded with a pen on a sheet of paper. The visitor was then invited to seize the bob again and try to imitate exactly the previous initial position and velocity. No matter how carefully it was done, the subsequent motion was quite different from what it was the first time. I asked the museum director what the two men were doing who were standing in a corner, watching us. He replied, “Oh, those are two Dutchmen waiting to take away the “chaos.” Apparently, the exhibit was about to be dismantled and taken to Amsterdam. I have wondered ever since whether the services of those two Dutchmen would not be in great demand across the globe, by organizations that wanted their chaos taken away.” (Gell-Mann 1994).
The holy grail of industry is to remove “chaos” from the supply chain in order to better adapt to demand fluctuations. Managing uncertainty is compounded by the increasing degree of information asymmetry1 between the supply “chain” (value network2) partners (designers, suppliers, distributors, retailers, consumers) who have different and often conflicting objectives, that threaten to create barriers on the road to adaptive business networks of the future (Heinrich and Betts, 2003).
Ampex pioneered the video recorder market in 1956. Each unit was priced at $50,000 and the only competitors, RCA and Toshiba, were way behind. Sony, JVC and Matsushita were mere observers. Masaru Ibuka, co-founder of Sony and Yuma Shiraishi at JVC, issued directives for their respective engineers to produce an unit that would cost $500, a mere 1% of Ampex’s price. In the 1980’s, video recorder sales went from $17 million to $2 billion at Sony, $2 million to $2 billion at JVC, $6 million to $3 billion at Matsushita and $296 million to $480 million at Ampex. Failure to adapt eclipsed Ampex. (Tellis and Golder, 1996).
One business objective of suppliers is to secure large volume purchase commitments (with delivery flexibility) from manufacturers. It conflicts with the manufacturer’s objective that must include rapid response to demand fluctuation yet the manufacturer must mass produce (to take advantage of economies of scale) yet production runs must adapt to fluctuations even though a certain run may have been planned based on demand forecast. Thus, manufacturers may need more or less raw materials and therefore seek flexibility in purchasing raw materials, which conflicts with the supplier’s objective. Manufacturer’s desire to run long production batches are in
4 Chapter 1 conflict with the warehouse and distribution centers that aim to reduce inventory due to storage capacity constraints. The latter increases cost of transportation for all the players.
During 2000, supply chain related costs in USA alone exceeded $1 trillion (10% of GDP), which is close to the entire GDP of Russia, is more than the GDP of Canada or Spain or the combined GDP of all the 22 nations who are members of the League of Arab Nations. The combined GDP of all 22 Arab nations is less than that of Spain (www.wrmea.com/archives/sept-oct02/0209044-2.html; www.bea.doc.gov; www.cia.gov). A mere 10% savings of supply chain costs in USA is nearly equal to the GDP of Ireland. Therefore, tools and processes that may reduce supply chain inefficiencies and help it better adapt to demand changes, are valuable. We will briefly explore some of the tools that may catalyze the adaptive value network.
Some emerging technologies may take leading catalytic roles but technology is not the solution. Ability to adapt supply chains will depend on continuous business process innovation led by management capable of envisioning use of technology as a tool to reduce (1) inefficiencies, (2) uncertainties and (3) information asymmetry within the value network. In essence, decision making processes should respond to (dynamic) information such that the system (enterprise) is able to rapidly adapt and/or respond.
One driver of this transformation (from ‘push’ based supply chain management to ‘pull’ based adaptive value networks) is the potential use of real-time information to catalyze or trigger autonomous decision steps capable of re-planning and execution. By some estimates, business in 2003 generated more than1 terabyte of data per second (excludes data gathered by automatic identification technologies). Is this equivalent to information? It is unlikely that this data, as is, can be considered as information. Even when we extract the information, will it offer a “transactional” value? The ability to extract intelligence from data to manage information may be the differentiator between companies who will profit from data (such as automatic identification or sensors) versus those who will not. Data that is stored in business systems (such as ERP) may suffer from problems that reduces the value of their information. ERP systems may also compromise the efficacy of dynamic data if the data feeds static systems unable to respond in near real-time. When such ERP data and/or information sources are used by strategic planners for forecasting and optimization, it leaves room for speculation about the validity of the outcome since the process may have been optimized, or forecast delivered, based on “noise” rather than robust dynamic data. Stemming from poor data quality and information asymmetry between supply chain partners, these errors (of optimization, forecasting) accumulate at successive stages of a supply chain and manifests
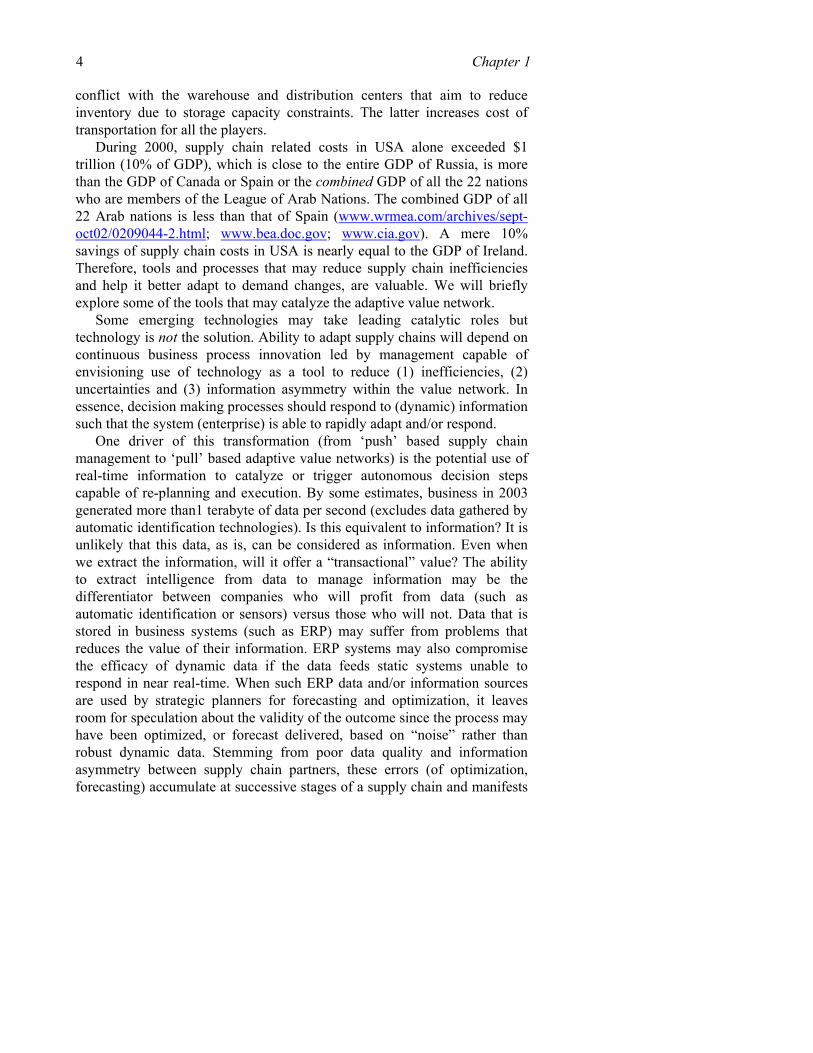
1. ADAPTIVE VALUE NETWORKS 5 itself as the generic Bullwhip Effect (Forrester 1961, Sterman 1989, Lee et al., 1997) (Figure 1-1 and Figure 1-2).
40
20
0
0 4 8 12 16 20 24 28 32 36Week
Ord
ers
DISTRIBUTOR
WHOLESALER
FACTORY
RETAILER40
20
0
0 4 8 12 16 20 24 28 32 36Week
Ord
ers
DISTRIBUTOR
WHOLESALER
FACTORY
RETAILER
Figure 1-1. The Bullwhip Effect (Source: Joshi 2000)
RET AILER40
20
00 4 8 12 16 20 24 28 32 36
Week
Ord
ers
WHOLESALER
DIST RIBUT OR
FACT ORY
RET AILER40
20
00 4 8 12 16 20 24 28 32 36
Week
Ord
ers
WHOLESALER
DIST RIBUT OR
FACT ORY
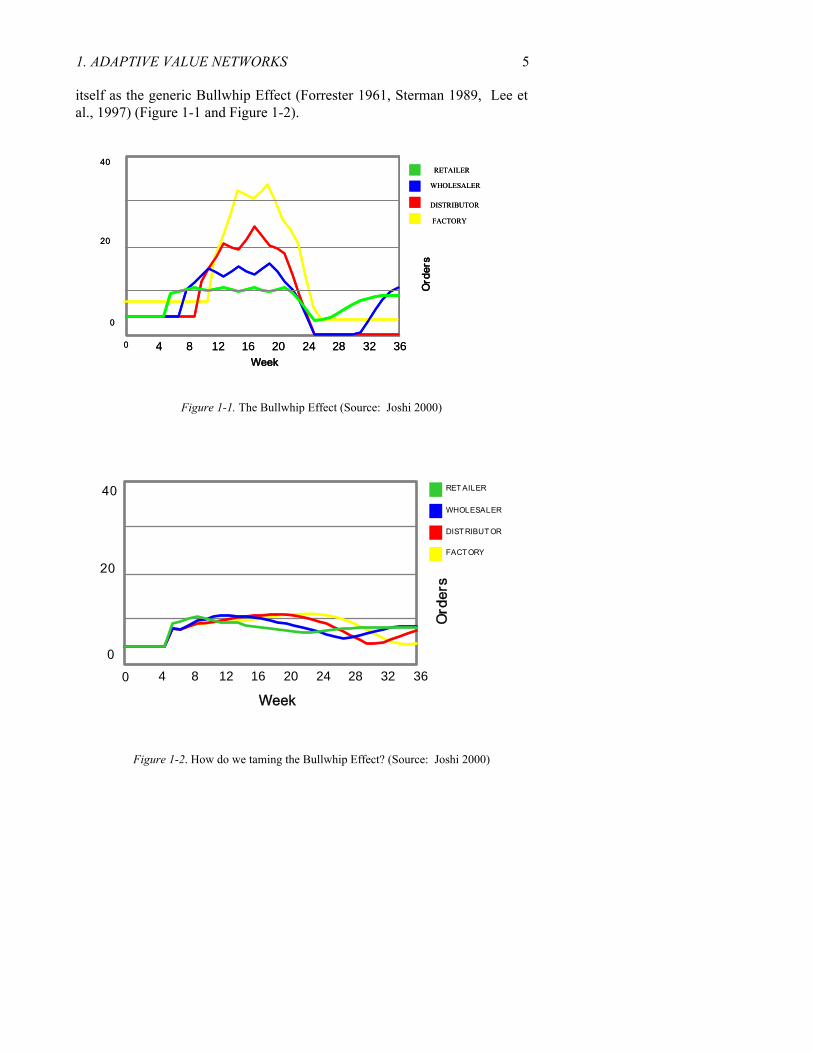
Figure 1-2. How do we taming the Bullwhip Effect? (Source: Joshi 2000)
6 Chapter 1
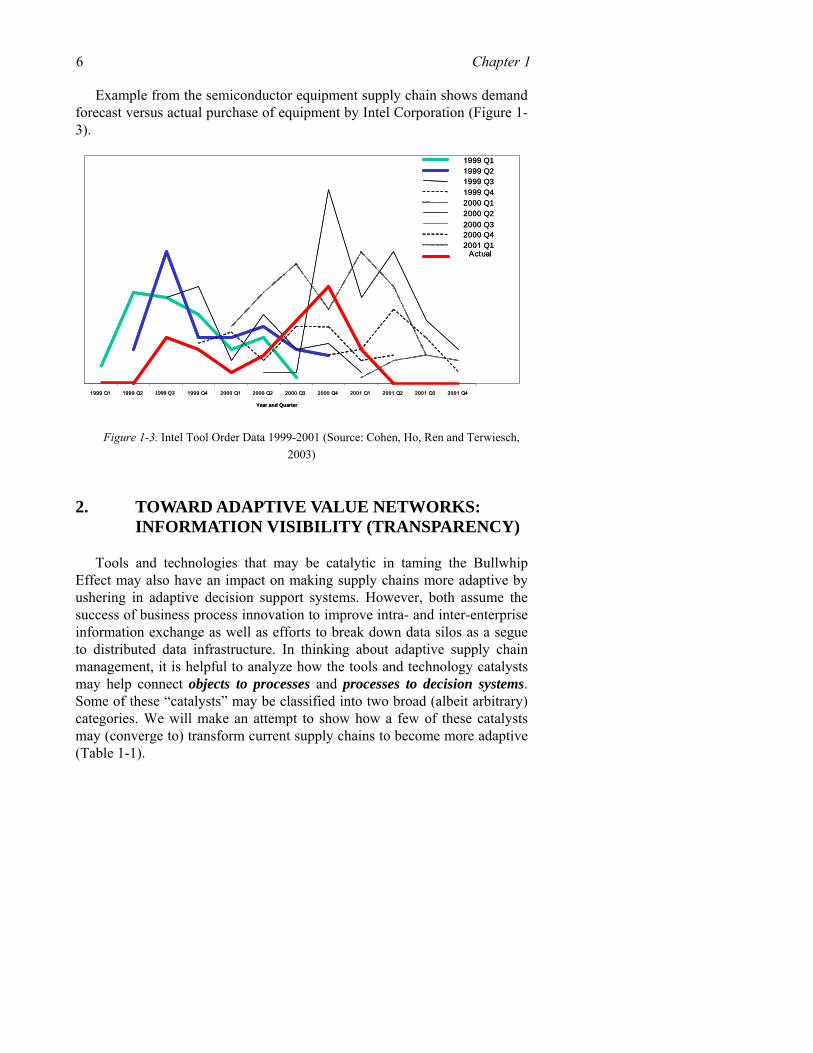
Example from the semiconductor equipment supply chain shows demand forecast versus actual purchase of equipment by Intel Corporation (Figure 1-3).
1999 Q1 1999 Q2 1999 Q3 1999 Q4 2000 Q1 2000 Q2 2000 Q3 2000 Q4 2001 Q1 2001 Q2 2001 Q3 2001 Q4
Year and Quarter
1999 Q11999 Q21999 Q31999 Q42000 Q12000 Q22000 Q32000 Q42001 Q1
Actual
1999 Q1 1999 Q2 1999 Q3 1999 Q4 2000 Q1 2000 Q2 2000 Q3 2000 Q4 2001 Q1 2001 Q2 2001 Q3 2001 Q4
Year and Quarter
1999 Q11999 Q21999 Q31999 Q42000 Q12000 Q22000 Q32000 Q42001 Q1
Actual
Figure 1-3. Intel Tool Order Data 1999-2001 (Source: Cohen, Ho, Ren and Terwiesch, 2003)
2. TOWARD ADAPTIVE VALUE NETWORKS: INFORMATION VISIBILITY (TRANSPARENCY)
Tools and technologies that may be catalytic in taming the Bullwhip Effect may also have an impact on making supply chains more adaptive by ushering in adaptive decision support systems. However, both assume the success of business process innovation to improve intra- and inter-enterprise information exchange as well as efforts to break down data silos as a segue to distributed data infrastructure. In thinking about adaptive supply chain management, it is helpful to analyze how the tools and technology catalysts may help connect objects to processes and processes to decision systems. Some of these “catalysts” may be classified into two broad (albeit arbitrary) categories. We will make an attempt to show how a few of these catalysts may (converge to) transform current supply chains to become more adaptive (Table 1-1).
1. ADAPTIVE VALUE NETWORKS 7
Table1-1. Tools and Concepts versus Data Mobility Tools and Concepts Data Mobility Operations Research and Game Theory Automatic identification technologies
(RFID, UWB, GPS) Distributed Artificial Intelligence and Agents
Wireless protocols (802.11, 802.16)
‘Clockspeed’ as defined by Charles Fine, MIT
Sensor networks
Semantic Web Simulation
3. OPERATIONS RESEARCH AND GAME THEORY3
The workhorse of optimization (algorithms) is based on operations research. It is an area of intense research and innumerable sources of information are available. However, Game Theory was not such a “household” name until 1994 when John Nash, and later the movie about him, changed the public’s perception so much so that generic business journals began touting the virtues of Game Theory.
Having game theory in your corporate ‘bag of tricks’ can mean the difference between success and failure. (Investor’s Business Daily, 25 January 1996).
Managers have much to learn from game theory - provided they use it to clarify their thinking, not as a substitute for business experience (The Economist, 15 June 1996).
Game theory helps us model, analyze and understand the behavior of multiple self-interested parties who interact while making decisions. As such, Game Theory deals with interactive optimization problems. In particular, it is a tool for analyzing situations where the parties strive to maximize their (expected) pay-offs while choosing their strategies. Each party’s final pay-off depends on the profile of strategies chosen by all parties. Most business situations can be modeled by a “game” since in any business interaction, involving two or more parties, the pay-off of each party depends on the other party’s actions.
For centuries economists have worked on various game-theoretic models but Neumann and Morgenstern (1944) are credited as the fathers of modern Game Theory. Game Theory has since enjoyed an explosion of developments, including the concept of equilibrium (Nash, 1950), games
8 Chapter 1 with imperfect information (Kuhn, 1953), cooperative games (Aumann, 1959; Shubik, 1962) and auctions (Vickrey, 1961).
3.1 Let the Game Begin
The overarching theme in Game Theory is “interactions.” In business, each decision maker is a player making a decision or choosing a strategy that will be impacted by the competitor.
“A chip manufacturer slashed prices of its desktop and mobile processors just days after a similar move by a rival. We’re going to do what it takes to stay competitive’ on prices, said representative. The companies aggressive price-chopping means the company doesn’t want to give up market share gains, even at the cost of losses on the bottom line (CNet News.com, May 30, 2002)”
In this example, companies compete on price to gain market share. During Q1 of 2002, this semiconductor company increased processor shipments (compared to Q4 of 2001) worth $8 million but processor revenue declined by 3% (sold more chips for less money). Companies engaged in price wars rarely, if ever, benefit from such competition. Reducing prices slightly might increase the overall market potential but decreasing prices beyond a certain limit has a diminishing impact. Eventually the size of the “pie” does not increase anymore and firms fight harder to get a bigger “pie” by slashing prices and profits. Why do firms behave this way? In this situation and in some others, firms are caught in what is known in Game Theory as the “Prisoner’s Dilemma” where the rational response may not be the optimal.
3.1.1 Prisoner’s Dilemma
Two burglars, Alice and Bob, are arrested near the scene of a burglary and interrogated separately. Each suspect can either confess with a hope of a lighter sentence or may refuse to talk (does not confess). The police do not have sufficient information to convict the suspects, unless at least one of them confesses. Each must choose without knowing what the other will do. In other words, each has to choose whether or not to confess and implicate the other. If neither confesses, then both will serve one year on a charge of carrying a concealed weapon (Table 1-2). If both confess and implicate each other, both will go to prison for 10 years. However, if one burglar confesses and implicates the other but the other burglar does not confess, then the one who cooperates with the police will go free, while the other burglar will go

1. ADAPTIVE VALUE NETWORKS 9 to prison for 20 years on the maximum charge. The “strategy space” in this case is simple: confess or don't confess (each chooses one of the two strategies). The payoffs (penalties) are the sentences served. In effect, Alice chooses a column and Bob chooses a row.
Table 1-2.Prisoner’s Dilemma
Alice Alice
Confess
Does not
Bob
Confess 10, 10 0, 20
Bob Does not
20, 0 1, 1
The two numbers in each cell show the outcomes for the two prisoners
when the corresponding pair of strategies are chosen. The number to the left shows the payoff to the person who chooses the rows (Bob) while the number to the right tells the payoff to the person who chooses the columns (Alice). Thus (reading down the first column) if they both confess, each gets 10 years, but if Alice confesses and Bob does not, Bob gets 20 and Alice goes free. Therefore, what strategies are "rational" in this game if both of them want to minimize their sentences? Alice might reason: "Two things can happen: Bob can confess or Bob can keep quiet. If Bob confesses, I get 20 years (if I don't confess) and 10 years if I do confess (cooperate), so in that case it is better to confess. On the other hand, if Bob doesn't confess and I don't either, I get a year but in that case, if I confess I can go free. Either way, it is better if I confess. Therefore, I will confess."
But Bob can and presumably will reason in the same way. So they both
reason rationally to confess and go to prison for 10 years each. But, if they had acted "irrationally" and did not confess, they each could have gotten off with a year (http://william-king.www.drexel.edu/top/eco/game/ game.html).
Prisoner’s Dilemma4 is an example of a non-cooperative static game
where the players choose strategies simultaneously and are thereafter committed to their chosen strategies. The main issue of such games is the existence and uniqueness of Nash equilibrium (NE). NE is the point where no player has incentive to change her strategy since each player has chosen a strategy that maximizes his or her own payoff given the strategies of the other players. It may be prudent to point out that the fundamental distinction between cooperative and non-cooperative games is that cooperative games allow binding agreements while non-cooperative games do not. Study of cooperative games focuses on the outcome of the game in terms of the value

10 Chapter 1 created through cooperation of players, but does not specify the actions that each player will take. The study of non-cooperative games is more concerned with the specific actions of the players. Hence the former allows us to model outcomes of more complex business processes.
3.1.2 Dilemma in Prisoner’s Dilemma
A key concept not captured in “Prisoner’s Dilemma” is the repetition of interactions. In business, most players know they will be in the “game” for awhile. Hence, they may choose to cooperate, especially if they deem that cooperation today may increase the chances of cooperation, or even collaboration, in the future. With repeated actions, companies build a reputation, which influences the actions of others. For example, a restaurant might make a higher profit today by selling slightly less fresh food (prepared yesterday), but will it be worth the possible consequence of losing customers in the future? Thus, rationally speaking, companies aim to act strategically with competitors and partners. In practice the behemoths continually try to squeeze their suppliers (blinded by “cost” reduction) and could lose critical partners.
Intel uses its much envied supplier ranking and rating program - which tracks a supplier’s total cost, availability, service, supports responsiveness and quality – to keep its top suppliers on a course for better quality. ‘We reward suppliers who have the best rankings and ratings with more business,’ says Keith Erickson, Director of Purchasing.
As an added incentive, Intel occasionally plugs high-quality suppliers in magazine and newspaper advertisements. The company even lets its top performing suppliers publicize their relationship with Intel. That’s a major marketing coup, considering that Intel supplies 80% of chips used in PCs today and is one of the most recognized brand names in the world.
Given that each party in a supply chain acts entirely on self interest, individual choices collectively do not lead to an “optimal” outcome for the supply chain. Thus, supply chain profit of a “decentralized” supply chain composed of multiple, independently managed companies, is less than the total supply chain profit of the “centralized” version of the same chain where the partner interactions (suppliers, manufacturers, retailers) are managed by a single decision-maker (information symmetry) to optimize total supply chain profits. Sharing of information in centralized supply chains reduces inefficiencies that are obvious in decentralized supply chains due to “double marginalization” stemming from self-centered decision making.
1. ADAPTIVE VALUE NETWORKS 11
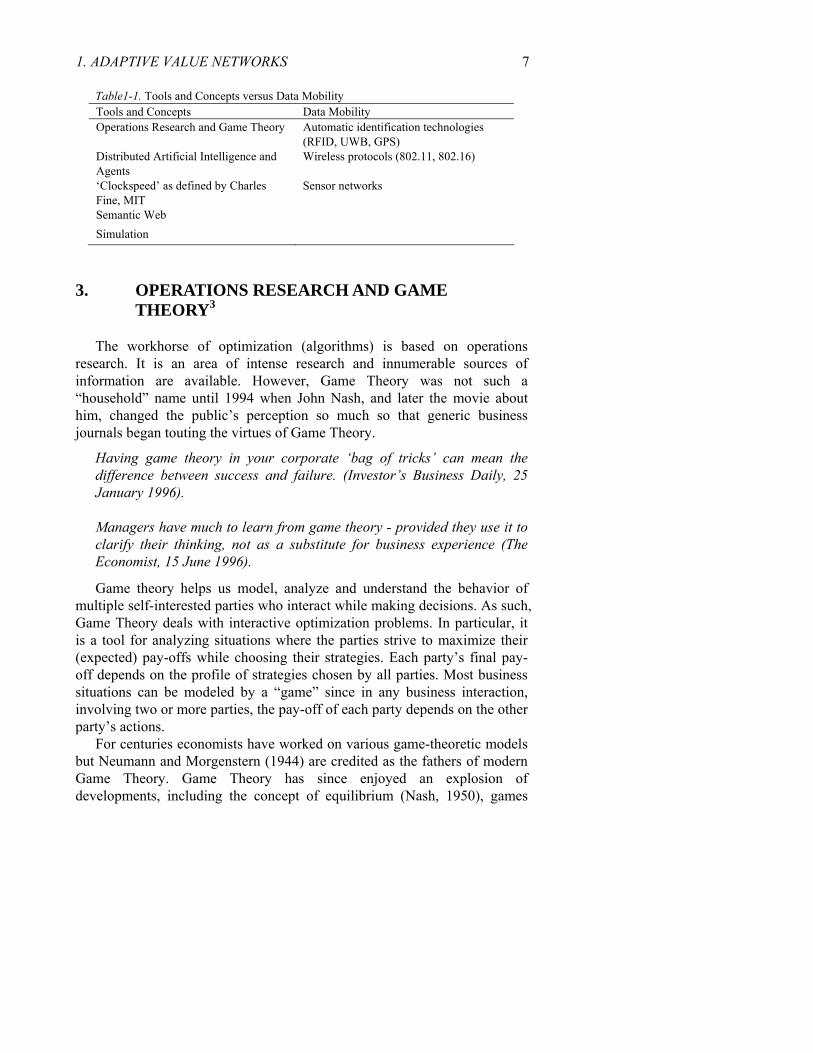
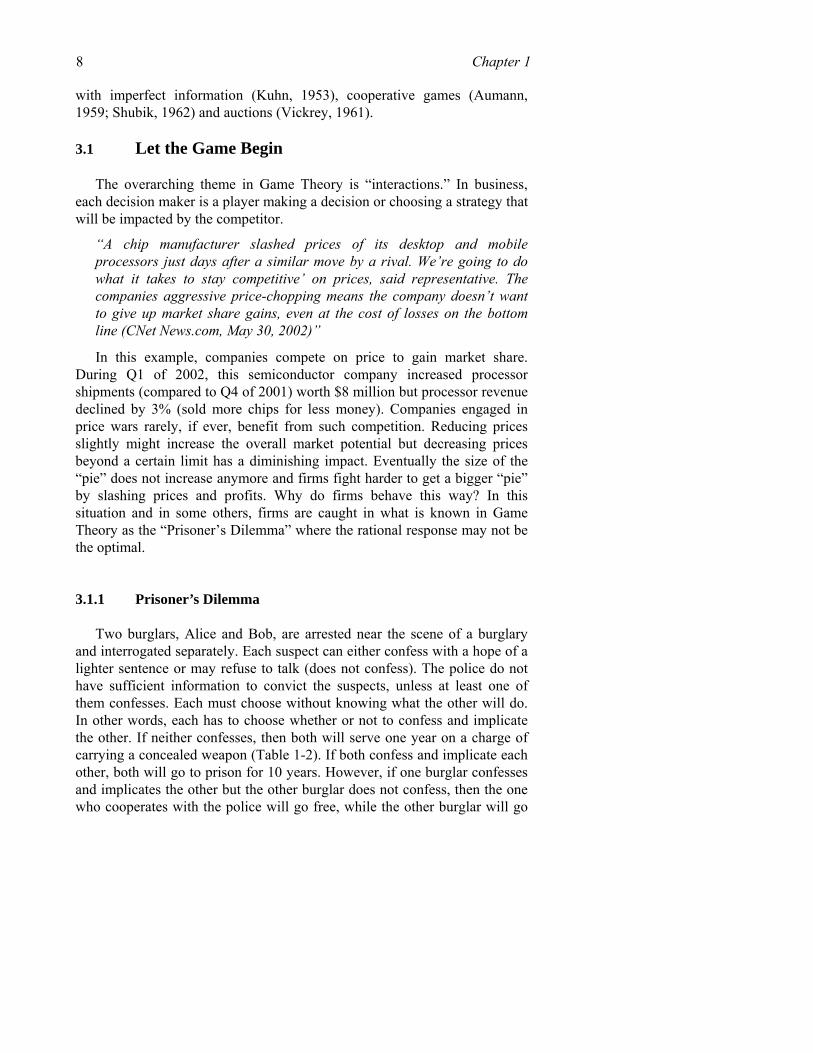
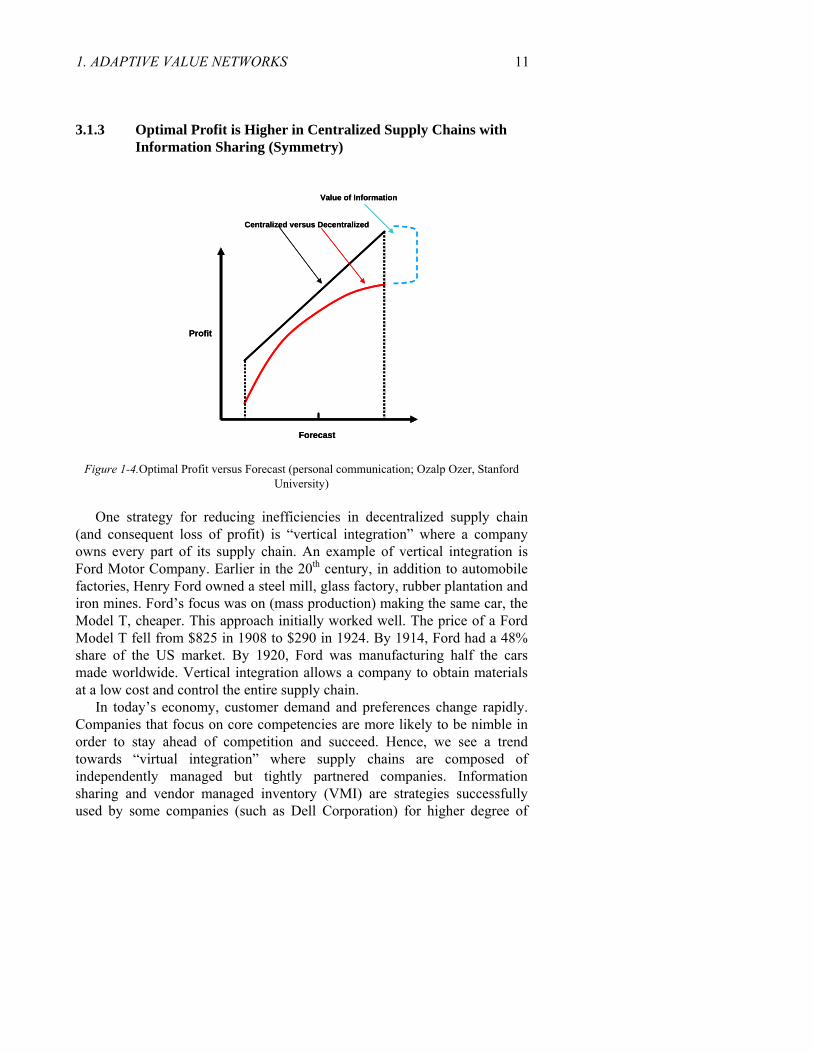
3.1.3 Optimal Profit is Higher in Centralized Supply Chains with Information Sharing (Symmetry)
Forecast
Centralized versus Decentralized
Profit
Value of Information
Forecast
Centralized versus Decentralized
Profit
Value of Information
Figure 1-4.Optimal Profit versus Forecast (personal communication; Ozalp Ozer, Stanford University)
One strategy for reducing inefficiencies in decentralized supply chain
(and consequent loss of profit) is “vertical integration” where a company owns every part of its supply chain. An example of vertical integration is Ford Motor Company. Earlier in the 20th century, in addition to automobile factories, Henry Ford owned a steel mill, glass factory, rubber plantation and iron mines. Ford’s focus was on (mass production) making the same car, the Model T, cheaper. This approach initially worked well. The price of a Ford Model T fell from $825 in 1908 to $290 in 1924. By 1914, Ford had a 48% share of the US market. By 1920, Ford was manufacturing half the cars made worldwide. Vertical integration allows a company to obtain materials at a low cost and control the entire supply chain.
In today’s economy, customer demand and preferences change rapidly. Companies that focus on core competencies are more likely to be nimble in order to stay ahead of competition and succeed. Hence, we see a trend towards “virtual integration” where supply chains are composed of independently managed but tightly partnered companies. Information sharing and vendor managed inventory (VMI) are strategies successfully used by some companies (such as Dell Corporation) for higher degree of

12 Chapter 1 virtual integration. However, most companies still find it difficult or face internal reluctance to usher changes in their supply chain practices. Similar issues apply to independently managed intra-company divisions, such as marketing, production, and sales.
Game Theory makes some assumptions in its study of the impact of
interactions of multiple players and the resulting dynamics in a market environment. Two key assumptions are: – Each player in the market acts on self-interest, but they pursue well-
defined exogenous objectives, that is, they are rational; – In choosing a strategy, a player considers the potential reaction of other
players and takes into account his or her knowledge of other decision makers’ behavior, that is, he or she reasons strategically. These assumptions rule out games of pure chance, such as lotteries and
slot machines, where strategies do not matter and games without strategic interaction between players, such as Solitaire. Credibility is a central issue in games.
Coca-Cola is developing a vanilla-flavored version of its best-selling flagship cola, a report says, extending the company’s palette of flavorings from Cherry Coke and Diet Coke with lemon. But don’t expect to see a vanilla-flavored Pepsi anytime soon. ‘It’ s not something we’re looking at,’ said spokesman Larry Jabbonsky of Pepsi. ‘We think it’s a bit vanilla.’ (USA Today, 1 April 2002).
PepsiCo is launching Pepsi Vanilla and its diet version in stores across the country this weekend. Coke came out with Vanilla Coke in May 2002 and it was a resounding success, selling 90 million cases. ‘We’re a little surprised that Pepsi decided to enter the vanilla segment,’ said Mart Martin of Coca-Cola. ‘When we came out with Vanilla Coke, Pepsi originally said the idea sounded ‘a bit vanilla.’ (CNN/Money August 8, 2003).
3.2 Game Theory in Quantity and Price Competition
Business decisions include what to produce/procure, sell, how much, and at what price. Study of competitive interactions around these issues can be addressed using game theoretic models that focus on price and quantity decisions (several excellent papers including that of Albeniz and Simchi-Levi, 2003).

1. ADAPTIVE VALUE NETWORKS 13
Quantity competition (Cournot Game) is especially important for commodities where there is an inverse relationship between quantity and market price. Price competition (Bertrand Game), on the other hand, occurs in every market, as competing companies try to maintain or increase market share.
OPEC decided to slash its crude oil production by 1.5 million barrels a day (6%). The issue came to a head this autumn with weakening world economy, together with the uncertainty caused by the Sep 11 attacks on the US, dragged down prices some 30%. The cut is expected to lift OPEC’s benchmark price to $22 a barrel, the group’s minimum target price (CBS News, December 28, 2001).
Burger King will put its Whopper on sale for 99 cents. The move is likely to intensify and prolong the burger price wars that have been roiling the US fast-food industry in recent months. Burger King Officials had said earlier they had little choice given a $1 menu at McDonald’s that included a Whopper-like hamburger called the Big ’N Tasty.” (Chicago Sun-Times, January 3, 2003).
Tesco announced plans to slash £80 million from prices of more than 1,000 products, with some prices falling by more than 30%. The cuts came as rival Asda also said it was slashing selected prices. The cuts echo memories of the supermarket price wars in 1999 as stores fought to capture more customers and increased market share (Sunday Telegraph, January 5, 2003).
Cournot Game A market with two competing firms, selling homogeneous goods, where
the two firms choose production quantities simultaneously, is known as a Cournot Game. It is a static game where the player’s action sets are continuous (each player can produce any non-negative quantity). This is a tacit collusion to raise prices to a jointly optimal level and thus is a “cartel.” A cartel is defined as a combination of producers of any product joined together to control its production, sale and price, so as to obtain a monopoly and restrict competition in any particular industry or commodity (www.legal-database.com). Cartels can be quite unstable. At each stage, the players have a huge incentive to cheat.
On Tuesday, 23 September 2003, an agreement was submitted to the US District Court in Philadelphia for an out-of-court settlement for a suit filed by industrial purchasers in 1999. According to this agreement, International Paper, Weyerhaeuser and Georgia-Pacific will pay US$68

14 Chapter 1
million to avoid litigation related to class-action lawsuits that accused them of conspiring to fix prices for container-board (packaging material).
The oil market is notoriously difficult to balance - demonstrated by the rollercoaster of prices over the last few years. Member states of OPEC do not have identical interests and find it difficult to reach consensus on strategy. Countries with relatively small oil reserves are often seen as ‘hawks’ pushing for higher prices. Meanwhile, producers with massive reserves and small populations fear that high prices will accelerate technological change and the development of new deposits, reducing the value of their oil in the ground (BBC News, February 12, 2003).
Bertrand Game Models situations where firms choose prices rather than quantities.
Assume two firms produce identical goods which are perfect substitutes from the consumers’ perspective (consumers will buy from the producer who charges the lowest price). If the firms charge the same price, they will split the market evenly. There are no fixed costs of production and the marginal costs are constant. As in the Cournot Game, the firms act simultaneously. Therefore, when the costs and the products are identical, there exists a unique equilibrium in which all output is sold at the price equal to the marginal cost. Thus, the Bertrand Game suggests that when firms compete on price, and the costs are symmetric, we obtain a perfectly competitive market even in a duopoly situation. However, in real life, customers do not choose based on price alone. For example, Wendy’s fast food chain decided to stay out of the Burger King and McDonald’s price war (for a while) by aiming to gain market share by offering high quality food.
Stackelberg Game In most business situations, firms choose their actions sequentially rather
than simultaneously. In price wars, one firm responds after it observes another firm’s actions. For our discussion, consider that firm 1 moves first and firm 2 responds. We call firm 1 the Stackelberg “leader,” and the “follower” is firm 2.
3.3 Game Theory in Inventory Optimization
In time-dependent multi-period games, the players’ payoff in each period depends on the actions in the previous, as well as, current periods. The payoff structure may not change from period to period (so called stationary payoffs). This resembles multi-period inventory models in which time periods are connected through the transfer of inventories and backlogs. Due
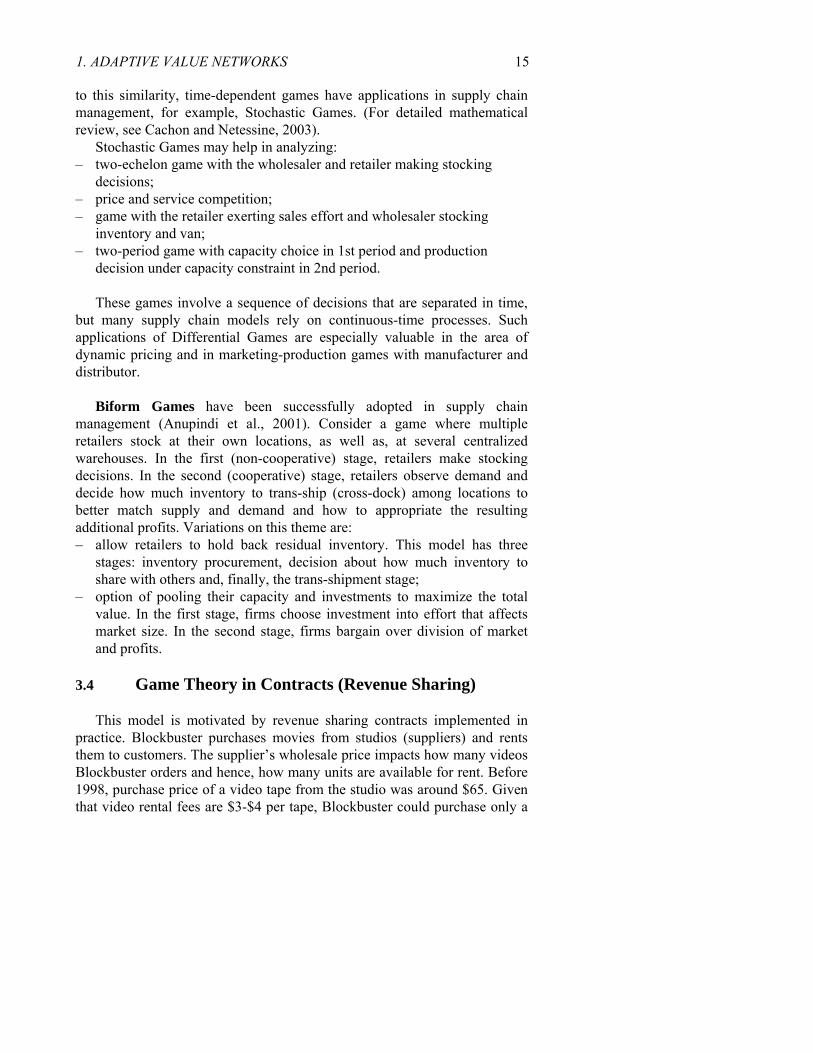
1. ADAPTIVE VALUE NETWORKS 15 to this similarity, time-dependent games have applications in supply chain management, for example, Stochastic Games. (For detailed mathematical review, see Cachon and Netessine, 2003).
Stochastic Games may help in analyzing: – two-echelon game with the wholesaler and retailer making stocking
decisions; – price and service competition; – game with the retailer exerting sales effort and wholesaler stocking
inventory and van; – two-period game with capacity choice in 1st period and production
decision under capacity constraint in 2nd period. These games involve a sequence of decisions that are separated in time,
but many supply chain models rely on continuous-time processes. Such applications of Differential Games are especially valuable in the area of dynamic pricing and in marketing-production games with manufacturer and distributor.
Biform Games have been successfully adopted in supply chain
management (Anupindi et al., 2001). Consider a game where multiple retailers stock at their own locations, as well as, at several centralized warehouses. In the first (non-cooperative) stage, retailers make stocking decisions. In the second (cooperative) stage, retailers observe demand and decide how much inventory to trans-ship (cross-dock) among locations to better match supply and demand and how to appropriate the resulting additional profits. Variations on this theme are: – allow retailers to hold back residual inventory. This model has three
stages: inventory procurement, decision about how much inventory to share with others and, finally, the trans-shipment stage;
– option of pooling their capacity and investments to maximize the total value. In the first stage, firms choose investment into effort that affects market size. In the second stage, firms bargain over division of market and profits.
3.4 Game Theory in Contracts (Revenue Sharing)
This model is motivated by revenue sharing contracts implemented in practice. Blockbuster purchases movies from studios (suppliers) and rents them to customers. The supplier’s wholesale price impacts how many videos Blockbuster orders and hence, how many units are available for rent. Before 1998, purchase price of a video tape from the studio was around $65. Given that video rental fees are $3-$4 per tape, Blockbuster could purchase only a
16 Chapter 1 limited number of videos and suffered lost demand during the initial release period (peak demand <10 weeks). About 20% of customers could not find the desired tape to rent. The studio’s high wholesale price impacted on the quantity purchased by Blockbuster and in turn, revenues and profitability of both firms. Thus, Blockbuster and the studios crafted a revenue sharing agreement such that Blockbuster pays only $8 per tape initially but then gives a portion (30 to 45%) of rental revenues to the studio (supplier). Since this agreement reduced Blockbuster’s initial investment, it could order more tapes to meet peak demand and generate more revenues even with contracted revenue sharing with the studio (supplier). Blockbuster increased its overall market share from 25% to 31% and improved its cash flow by 61% (CNet News.com, October 18, 2000).
3.5 Games with Incomplete Information (Game Theory and Information Asymmetry)
Ubiquitous knowledge about players and decisions or payoffs is rarely a reality in real world supply chains. It is common that one firm may have a better demand forecast than another or a firm may possess superior information regarding its own costs and operating procedures. If a firm knows that another firm may have better information, it may choose actions that take this into account. Game Theory provides tools to study cases with information asymmetry with increasing analytical complexity.
Signaling Game In its simplest form, a Signaling Game has two players, one of which has
better information than the other. The player with the better information makes the first move. For example, a supplier must build capacity for a key component for a manufacturer’s product. The manufacturer has a better demand forecast than the supplier. In an ideal world, the manufacturer may truthfully share his or her demand forecast with the supplier so that the supplier could build the appropriate capacity. But the manufacturer benefits from a larger capacity at the supplier in case of higher demand. Hence, the manufacturer has an incentive to inflate his or her forecast. However, the supplier will bear the cost of building capacity if it believes the manufacturer’s (inflated) forecast. The manufacturer hopes the supplier believes the (inflated) forecast and builds capacity. Fortunately, the supplier is aware of the manufacturer’s “game” to inflate (distort) forecast. What move (signal) from the manufacturer may induce the supplier to believe the forecast is credible? Consider the example below (from Ozalp Ozer of Stanford University).
1. ADAPTIVE VALUE NETWORKS 17
S announces:(wa,w)
Timeє realizedS updates belief about ξ
and builds capacity K
M places advance order y at price wa
M orders (D-y)+
at price w
Signaling Game
εξμ ++=DWhere,
S announces:(wa,w)
Timeє realizedS updates belief about ξ
and builds capacity K
M places advance order y at price wa
M orders (D-y)+
at price w
Signaling Game
εξμ ++=D εξμ ++=DWhere,
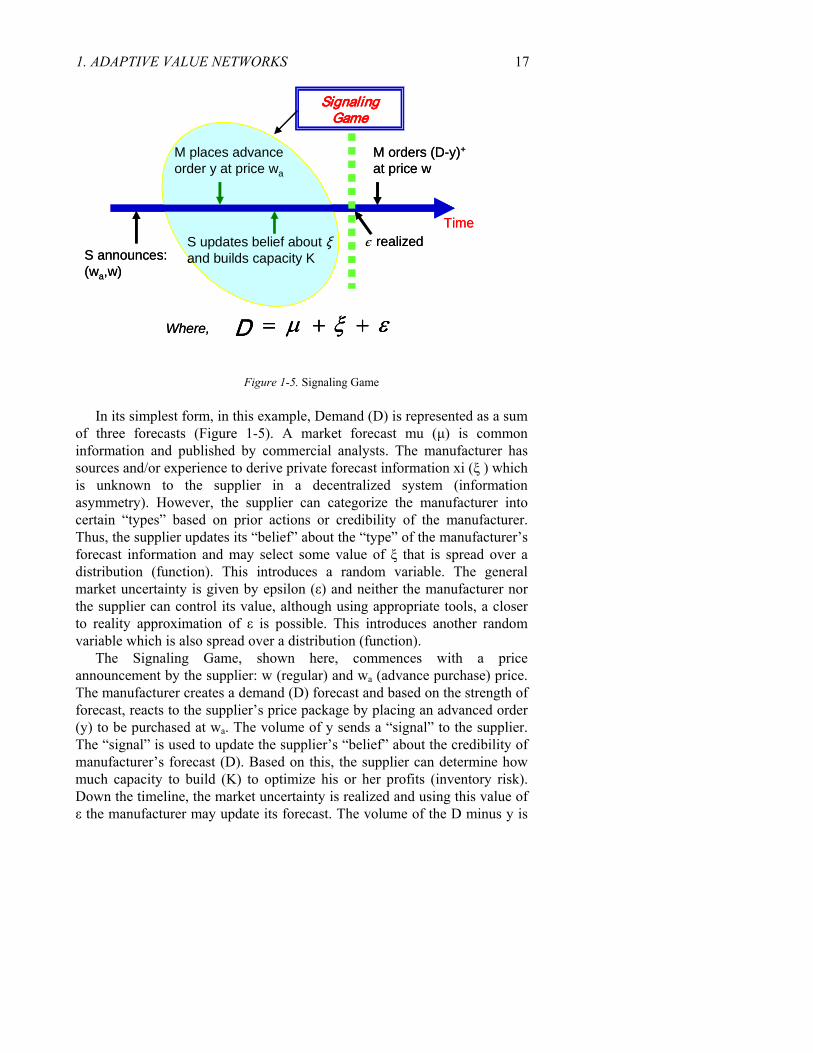
Figure 1-5. Signaling Game In its simplest form, in this example, Demand (D) is represented as a sum
of three forecasts (Figure 1-5). A market forecast mu (μ) is common information and published by commercial analysts. The manufacturer has sources and/or experience to derive private forecast information xi (ξ ) which is unknown to the supplier in a decentralized system (information asymmetry). However, the supplier can categorize the manufacturer into certain “types” based on prior actions or credibility of the manufacturer. Thus, the supplier updates its “belief” about the “type” of the manufacturer’s forecast information and may select some value of ξ that is spread over a distribution (function). This introduces a random variable. The general market uncertainty is given by epsilon (ε) and neither the manufacturer nor the supplier can control its value, although using appropriate tools, a closer to reality approximation of ε is possible. This introduces another random variable which is also spread over a distribution (function).
The Signaling Game, shown here, commences with a price announcement by the supplier: w (regular) and wa (advance purchase) price. The manufacturer creates a demand (D) forecast and based on the strength of forecast, reacts to the supplier’s price package by placing an advanced order (y) to be purchased at wa. The volume of y sends a “signal” to the supplier. The “signal” is used to update the supplier’s “belief” about the credibility of manufacturer’s forecast (D). Based on this, the supplier can determine how much capacity to build (K) to optimize his or her profits (inventory risk). Down the timeline, the market uncertainty is realized and using this value of ε the manufacturer may update its forecast. The volume of the D minus y is
18 Chapter 1 the remaining volume the manufacturer orders from the supplier at a price w. While optimization based on Signaling Games may increase profits for manufacturer and supplier, it will still remain vulnerable to the value chosen for the variables ξ and ε. But, this may be further reduced using near real-time data (from automatic identification technologies, as we shall discuss in a later section), which offers greater adaptability to demand.
If signaling favors optimization of the supplier’s capacity planning, then what is the manufacturer’s incentive to signal? Does the manufacturer incur a cost to signal? Is the manufacturer’s expected profit in the signaling equilibrium lower than what it would be if the manufacturer’s type were known to the supplier to update his or her “belief” with certainty?
An ideal action for a high demand manufacturer is one that sends the signal of his or her high demand forecast at no cost. If a costless signal does not exist, then the goal is to seek the lowest cost to signal. Whether or not a costless signal exists depends upon what commitments the manufacturer can impose on the supplier. Suppose the manufacturer dictates (contractually) to the supplier a particular capacity level and the supplier accepts the terms. By accepting the contract, the supplier has essentially no choice but to build that level of capacity (severe penalty for non-compliance). This is referred to as “forced compliance” and in this case many costless signals exist for the manufacturer. However, if the supplier could potentially deviate without penalty, referred to as voluntary compliance, then the manufacturer’s signaling task becomes more complex. One solution for a high demand manufacturer is to give a sufficiently large advance payment to the supplier. Since the high demand manufacturer’s profit is higher than the low demand manufacturer’s profit, only a high demand manufacturer could offer such an advance payment. This is referred to as signaling by “burning money” (who can afford to burn money?). A better signal is a contract that is costless to a high demand manufacturer, but expensive to a low demand manufacturer. An example of such a signal is a minimum commitment. The latter is costly only if realized demand is lower than the commitment and the manufacturer is forced by contract to purchase excess inventory. That scenario is less likely for a high demand manufacturer but a minimum commitment may be costly for a low demand manufacturer. Should a manufacturer agree to a minimum commitment if it possesses perfect information? Likely, because these contracts could be used solely for the purpose of signaling information.
Screening Game In this game the player who lacks information makes the first move. For
example, a supplier offers a menu of contracts with the intention of getting the manufacturer to reveal his or her type via the contract selected (in
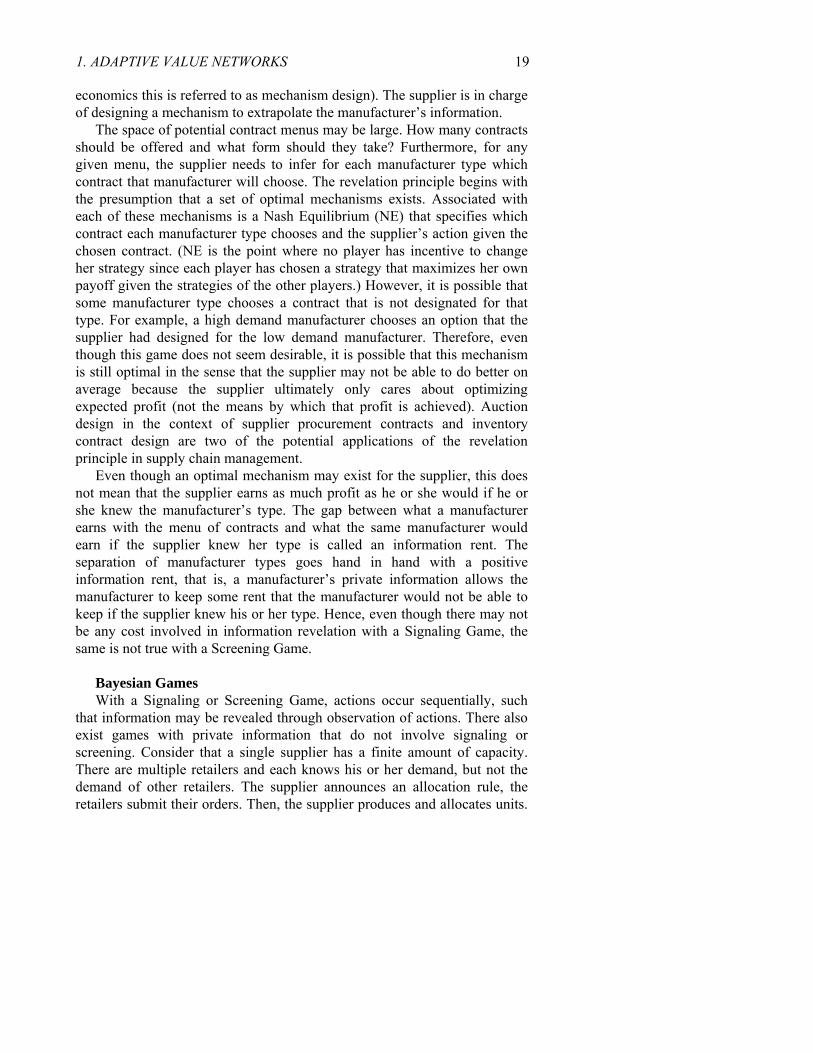
1. ADAPTIVE VALUE NETWORKS 19 economics this is referred to as mechanism design). The supplier is in charge of designing a mechanism to extrapolate the manufacturer’s information.
The space of potential contract menus may be large. How many contracts should be offered and what form should they take? Furthermore, for any given menu, the supplier needs to infer for each manufacturer type which contract that manufacturer will choose. The revelation principle begins with the presumption that a set of optimal mechanisms exists. Associated with each of these mechanisms is a Nash Equilibrium (NE) that specifies which contract each manufacturer type chooses and the supplier’s action given the chosen contract. (NE is the point where no player has incentive to change her strategy since each player has chosen a strategy that maximizes her own payoff given the strategies of the other players.) However, it is possible that some manufacturer type chooses a contract that is not designated for that type. For example, a high demand manufacturer chooses an option that the supplier had designed for the low demand manufacturer. Therefore, even though this game does not seem desirable, it is possible that this mechanism is still optimal in the sense that the supplier may not be able to do better on average because the supplier ultimately only cares about optimizing expected profit (not the means by which that profit is achieved). Auction design in the context of supplier procurement contracts and inventory contract design are two of the potential applications of the revelation principle in supply chain management.
Even though an optimal mechanism may exist for the supplier, this does not mean that the supplier earns as much profit as he or she would if he or she knew the manufacturer’s type. The gap between what a manufacturer earns with the menu of contracts and what the same manufacturer would earn if the supplier knew her type is called an information rent. The separation of manufacturer types goes hand in hand with a positive information rent, that is, a manufacturer’s private information allows the manufacturer to keep some rent that the manufacturer would not be able to keep if the supplier knew his or her type. Hence, even though there may not be any cost involved in information revelation with a Signaling Game, the same is not true with a Screening Game.
Bayesian Games With a Signaling or Screening Game, actions occur sequentially, such
that information may be revealed through observation of actions. There also exist games with private information that do not involve signaling or screening. Consider that a single supplier has a finite amount of capacity. There are multiple retailers and each knows his or her demand, but not the demand of other retailers. The supplier announces an allocation rule, the retailers submit their orders. Then, the supplier produces and allocates units.
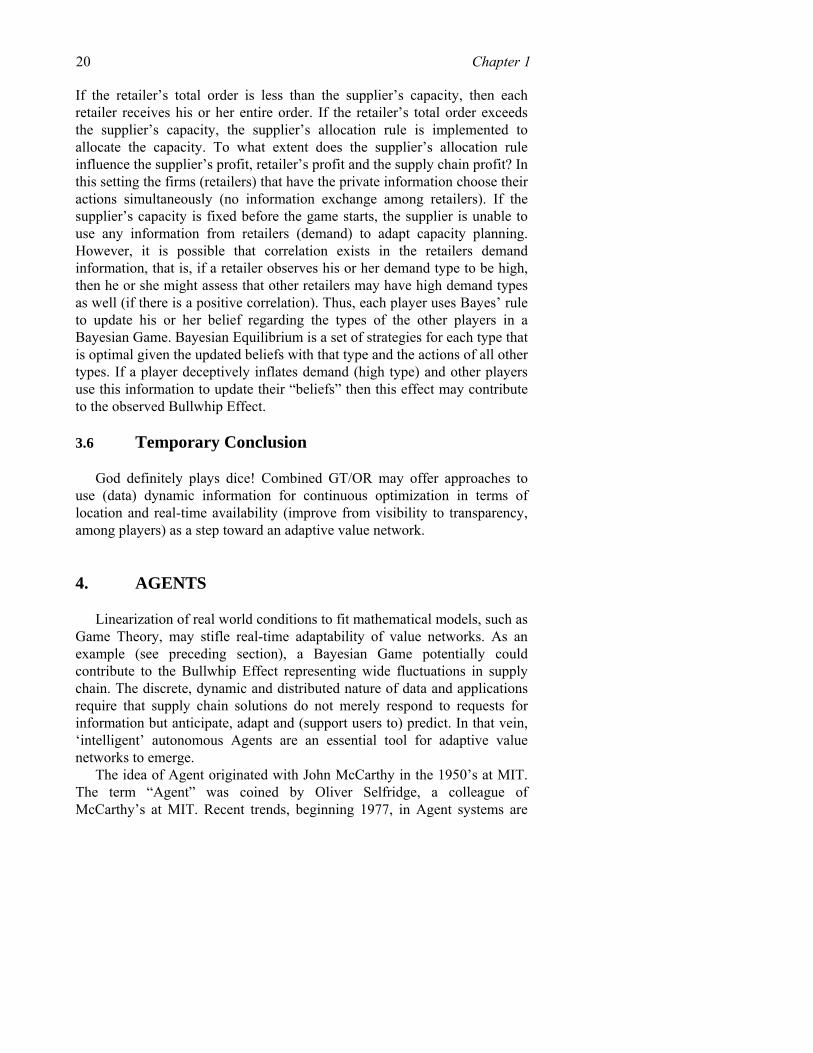
20 Chapter 1 If the retailer’s total order is less than the supplier’s capacity, then each retailer receives his or her entire order. If the retailer’s total order exceeds the supplier’s capacity, the supplier’s allocation rule is implemented to allocate the capacity. To what extent does the supplier’s allocation rule influence the supplier’s profit, retailer’s profit and the supply chain profit? In this setting the firms (retailers) that have the private information choose their actions simultaneously (no information exchange among retailers). If the supplier’s capacity is fixed before the game starts, the supplier is unable to use any information from retailers (demand) to adapt capacity planning. However, it is possible that correlation exists in the retailers demand information, that is, if a retailer observes his or her demand type to be high, then he or she might assess that other retailers may have high demand types as well (if there is a positive correlation). Thus, each player uses Bayes’ rule to update his or her belief regarding the types of the other players in a Bayesian Game. Bayesian Equilibrium is a set of strategies for each type that is optimal given the updated beliefs with that type and the actions of all other types. If a player deceptively inflates demand (high type) and other players use this information to update their “beliefs” then this effect may contribute to the observed Bullwhip Effect.
3.6 Temporary Conclusion
God definitely plays dice! Combined GT/OR may offer approaches to use (data) dynamic information for continuous optimization in terms of location and real-time availability (improve from visibility to transparency, among players) as a step toward an adaptive value network.
4. AGENTS
Linearization of real world conditions to fit mathematical models, such as Game Theory, may stifle real-time adaptability of value networks. As an example (see preceding section), a Bayesian Game potentially could contribute to the Bullwhip Effect representing wide fluctuations in supply chain. The discrete, dynamic and distributed nature of data and applications require that supply chain solutions do not merely respond to requests for information but anticipate, adapt and (support users to) predict. In that vein, ‘intelligent’ autonomous Agents are an essential tool for adaptive value networks to emerge.
The idea of Agent originated with John McCarthy in the 1950’s at MIT. The term “Agent” was coined by Oliver Selfridge, a colleague of McCarthy’s at MIT. Recent trends, beginning 1977, in Agent systems are
1. ADAPTIVE VALUE NETWORKS 21 based on research in distributed artificial intelligence. Research from MIT, DARPA, Carnegie-Mellon University and University of Michigan at Ann Arbor has made significant contributions.
We define an autonomous Agent as a software entity that functions continuously in an environment, often inhabited by other Agents. Continuity and autonomy empower Agents to (plan) execute processes in response to changes in the environment without requiring constant human guidance, intervention or top-down control from a system operator. Thus, Agents offer the ability to rapidly adapt. An Agent that functions continuously in an environment over a period of time also learns from experience (patterns). In addition, Agents that inhabit an environment with other Agents in a Multi-Agent System (MAS) are able to communicate, cooperate and are mobile between environments. Agents work best for clearly discernible tasks or processes, such as, to monitor data from, for example, automatic identification technologies (radio frequency identification or RFID), ultrawideband (UWB) transponders, global positioning system (GPS), WiFi and sensors. Data Agents can share this data with high level Information Agents and offer real-time information to Process Agents (Inventory Agent, Purchasing Agent). The emergence of Multi-Agent Systems (MAS) may be slow to take-off unless the Semantic Web sufficiently permeates the environment for ubiquitous deployment of Agents.
Design of Agent-Based Modeling (ABM) draws clues from natural behavior of biological communities. Although it still remains a paradox, it is increasingly undeniable that simple individual behaviors of bugs like ants and wasps, collectively, may offer intelligent models of complicated overall behavior. In fact, this may have been known for centuries. One ancient observer, King Solomon, knew from his father, David, of the elaborate court organizations of oriental kings and preparations needed for military campaigns. He marveled that insects could accomplish both these tasks without any central control. Thinking of the complex systems needed to maintain the palace commissary, he wrote, “Go to the ant, consider her ways and be wise. Having no guide, overseer or ruler, she prepares her bread in summer and gathers her food at harvest time.” He knew the complexity of a military organization and was impressed that “locusts have no king, yet all of them go forth by companies.” Nearly 3000 years later, a participant in the NCMS Virtual Enterprise Workshop (1994) commented, “we used to think that bugs were the problem. Now we suspect they may be the solution!” (Parunak 1997)
Adaptability in biological systems is a fundamental characteristic of nature, and thus, models based on and inspired by such superior systems can contribute significantly to reduce key inefficiencies (and stem the loss of profit) between centralized and decentralized supply chains. Most software
22 Chapter 1 is based on equations that link rates and flows (consumption, production). Variables (cost, rebates, transportation time, and out-of-stock) evaluate or integrate sets of ordinary differential equations (ODE) or partial differential equations (PDE) relating these variables. Operations research provides the framework to optimize for the “best” result. What if the “best” result is not necessarily the optimal “best” for that situation? Shortest lead time could plan a route through an area with a high probability of flash flood due to a brewing storm or threat of sniper attack on a portion of the highway. Planning software (today) fails to, or is incapable of, modeling such random events that may have profound implications for business, at that time. Thus, the “best” solution may not be adaptive to supply chain events at hand.
Even excluding random events or decisions that require integration with other models (weather, road construction), what is the half-life of ‘best’ solution in a fickle economy or high “clockspeed” industry? Compared to ABMs, a significant shortcoming of such Equation-based (ODE, PDE) models (EBM) is that EBM based software processes assume that these parameters are linear in nature and relevant data is available (for optimization). In the real world, events are non-linear, actions are discrete, information about data is distributed (CRM, PLM, SCM data silos) and data is corrupted with “noise” (according to a study by Ananth Raman of Harvard Business School and Nicole DeHoratius of the University of Chicago, for a global retailer, in some cases, 65% of SKUs (bar coded) were found to be inaccurately represented between system data, back-store and availability on store shelf, see Dehoratius, 2002).
Virtually all computer-based modeling, up to this point has used system dynamics, an EBM approach. But the struggle to adapt and respond in real-time will eventually and collectively fuel a paradigm shift that will make it imperative to model business software based both with Agents and equations. The question is no longer whether to select one or the other approach, but to establish a business-wise mix of both and develop criteria for selecting composition of software-based on one or the other approach that can offer valuable combinatorial solutions. The “balance” is subject to dynamic change (seek analogy with Screening Games). For traditionalists in supply chain management, the situation is analogous to a “push-pull” strategy where the dynamic push-pull boundary shifts with changing demand (pull).
ABM and EBM, both simulate the system by constructing a model and executing it on a computer. The differences are in the form of the model and how it is executed. In ABM, the model consists of a set of Agents that encapsulate the behaviors of the various individuals that make up the system, and execution consists of emulating these behaviors, which is essentially dynamic. In Equation-Based Modeling (EBM), the model is a set of
1. ADAPTIVE VALUE NETWORKS 23 equations (pre-determined, static) and execution consists of evaluating them. Thus “simulation” is a generic term that applies to both methods, which are distinguished as Agent-based emulation and equation-based evaluation.
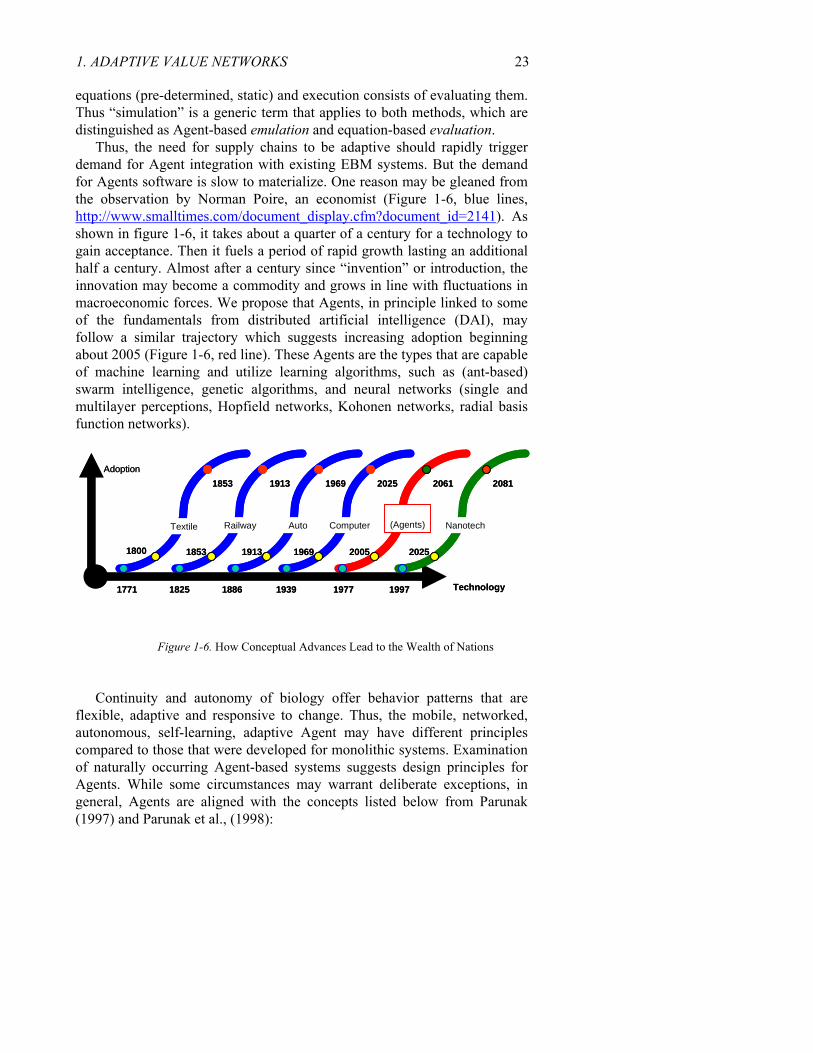
Thus, the need for supply chains to be adaptive should rapidly trigger demand for Agent integration with existing EBM systems. But the demand for Agents software is slow to materialize. One reason may be gleaned from the observation by Norman Poire, an economist (Figure 1-6, blue lines, http://www.smalltimes.com/document_display.cfm?document_id=2141). As shown in figure 1-6, it takes about a quarter of a century for a technology to gain acceptance. Then it fuels a period of rapid growth lasting an additional half a century. Almost after a century since “invention” or introduction, the innovation may become a commodity and grows in line with fluctuations in macroeconomic forces. We propose that Agents, in principle linked to some of the fundamentals from distributed artificial intelligence (DAI), may follow a similar trajectory which suggests increasing adoption beginning about 2005 (Figure 1-6, red line). These Agents are the types that are capable of machine learning and utilize learning algorithms, such as (ant-based) swarm intelligence, genetic algorithms, and neural networks (single and multilayer perceptions, Hopfield networks, Kohonen networks, radial basis function networks).
1771 1825 1886 1939 1977 1997
1800 1853 1913 1969 2005 2025
Technology
1853 1913 1969 2025 2061 2081
Textile Railway Auto Computer (Agents) Nanotech
Adoption
1771 1825 1886 1939 1977 1997
1800 1853 1913 1969 2005 2025
Technology
1853 1913 1969 2025 2061 2081
Textile Railway Auto Computer (Agents) Nanotech
Adoption
Figure 1-6. How Conceptual Advances Lead to the Wealth of Nations
Continuity and autonomy of biology offer behavior patterns that are
flexible, adaptive and responsive to change. Thus, the mobile, networked, autonomous, self-learning, adaptive Agent may have different principles compared to those that were developed for monolithic systems. Examination of naturally occurring Agent-based systems suggests design principles for Agents. While some circumstances may warrant deliberate exceptions, in general, Agents are aligned with the concepts listed below from Parunak (1997) and Parunak et al., (1998):
24 Chapter 1 1. Agents should correspond to “things” in the problem domain rather than
to abstract functions; 2. Agents should be small in mass, time (able to forget), and scope (avoid
global knowledge action); 3. Multi-Agent Systems should be decentralized (no single point of
control/failure); 4. Agents should be neither homogeneous nor incompatible but diverse; 5. Agent communities should include a dissipative mechanism (entropy
leak); 6. Agents should have ways of caching and sharing what they learn about
their environment; 7. Agents should plan and execute concurrently rather than sequentially.
4.1 Agents versus Equations: Conceptual and Practical Considerations
The difference in representational focus between ABM and EBM has consequences for how models are modularized. EBM represents the system as a set of equations that relate observables to one another. The basic unit of the model, the equation, typically relates observables whose values are affected by the actions of multiple individuals. ABM represents the internal behavior of each individual. An Agent’s behavior may depend on observables generated by other (Agents) individuals, but does not directly access the representation of those individual behaviors, thus, maintains boundaries among individuals. This fundamental difference in model structure gives ABM a key advantage in commercial applications such as an adaptable value network where partners may interact over an e-marketplace.
First, in an ABM, each firm has its own set of Agents. An Agent’s internal behaviors are not required to be visible to the rest of the system, so firms can maintain proprietary information about their internal operations. Groups of firms can conduct joint modeling exercises (Public MarketPlaces) while keeping their individual Agents on their own computers, maintaining whatever controls are needed. Construction of EBM requires disclosure of the relationships that each firm maintains on observables so that the equations can be formulated and evaluated. Distributed execution of EBM is not impossible, but does not naturally respect commercially important boundaries (why the early wave of e-MarketPlaces failed to survive).
Second, in many cases, simulation of a system is part of a larger project whose desired outcome is a control scheme that more or less automatically regulates the behavior of the entire system. Agent systems may correspond 1-to-1 with the individuals (firms or divisions) in the system being modeled, and the behaviors are analogs of real behaviors. These characteristics make

1. ADAPTIVE VALUE NETWORKS 25 Agents a natural locus for the application of adaptive techniques that can modify their behaviors as the Agents execute, so as to control the emergent behavior of the system. Migration from simulation model to adaptive control model is more straightforward in ABM than in EBM. One can imagine a member of adaptable business network using its simulation Agent as the basis for an automated control Agent that handles routine interactions with trading partners. It is unlikely that such a firm would submit aspects of its operation to an external “equation manager” that maintains specified relationships among observables from several firms.
EBM most naturally represents the process being analyzed as a set of flow rates and levels. ABM most naturally represents the process as a set of behaviors, which may include features difficult to represent as rates and levels, such as step-by-step processes and conditional decisions. ODEs are well-suited to represent purely physical processes. However, business processes are dominated by non-linear, discrete decision-making.
Both ABMs and EBMs can be validated at the system level by comparing model output with real system behavior. In addition, ABM’s can be validated at the individual level, since the behaviors encoded for each Agent can be compared with local observations on the actual behavior of the domain individuals. ABMs support direct experimentation. Managers playing ‘what-if’ games with the model can think directly in terms of business processes, rather than translate them into equations relating observables. A purpose of what-if experiments is to identify improved business practices that can be implemented. If the model is expressed and modified in terms of behaviors, implementation of its recommendations is a matter of transcribing the modified behaviors of Agents into task descriptions for the underlying physical entities in the real world.
In many domains, ABM gives more realistic results than EBM, for manageable levels of representational detail. The qualification about the level of detail is important. Since PDEs are computationally complete, in principle, one can construct a set of PDEs that completely mimics the behavior of any ABM (thus produce the same results). However, the PDE model may be much too complex for reasonable manipulation and comprehension (for example what we observe in repetitive Stochastic Games with incomplete information). EBMs (like system dynamics) based on simpler formalisms than PDEs may yield less realistic results regardless of the level of detail in the representation. For example, the dynamics of traffic networks achieved more realistic results from traffic models that emulate the behaviors of individual drivers and vehicles, compared with the previous generation of models that simulate traffic as flow of a fluid through a network. The latter example bears strong similarities to the flow-and-stock approach to supply chain simulation.
26 Chapter 1
The disadvantages of EBM in this and other examples result largely from the use of averages of critical system variables over time and space. EBM assumes homogeneity among individuals but individuals in real systems are often highly heterogeneous. When the dynamics are non-linear, local variations from the averages can lead to significant deviations in overall system behavior (outcome). Refer back to the section on Game Theory and in light of ABM vs. EBM, re-consider the example of the Signaling Game: the choice of values (of ξ and ε from the distribution) can significantly impact capacity planning (inventory risk) and profit optimization (price risk). In such business applications, driven by “if-then” decisions, non-linearity is the rule. Because ABM’s are inherently local and can adapt to changes, it is beneficial to let each Agent monitor the value of system variables locally (for example, real-time data for ε, in the Signaling Game), without averaging over time and space.
Ant-based algorithms based on naturally occurring systems, enables the Agent to forget (ant pheromones evaporate and obsolete paths leading to depleted food sources disappear rather than misleading members of the colony). The mechanism of forgetting is an important supplement to the emphasis in conventional artificial intelligence (AI) systems on mechanisms for learning. In a discrete-event system, forgetting can be as complex as learning since both represent discrete state transitions. In a time-based system, forgetting can take place “automatically” through the attenuation of a state variable that is not explicitly reinforced. The Agents ability to “forget” is a boon to real-world adaptable business networks. EBM based demand forecasting generally uses a weighted-average of past consumption data. If there was a marked variation (for example, spike in sales, 20 weeks ago) the planning algorithm continues to consider that value because equation-based modeling cannot “forget” facts, although the weight will decrease successively in each planning cycle unless manual intervention or program insertion specifies a “forget” rule. The forecasting engine, therefore, may continue to reflect the effect in its subsequent forecast for weeks or months. Consider the cumulative error from such events, if aggregated over geographies prior to generating a global forecast that may guide procurement or production. Such events produce the Bullwhip Effect. Agents can improve forecasting and with real-time data, accuracy may be further enhanced. As a result, for example, the manufacturer may adjust production to manage inventory better and reduce waste. Reduced inventory decreases working capital charges which improves return on assets because manufacturing the cash cycle gets shorter.
In a traditional system, forecast determines production planning and subsequently, execution of the plan. Some manufacturers develop a schedule each night that optimizes manufacturing the next day, a process not much
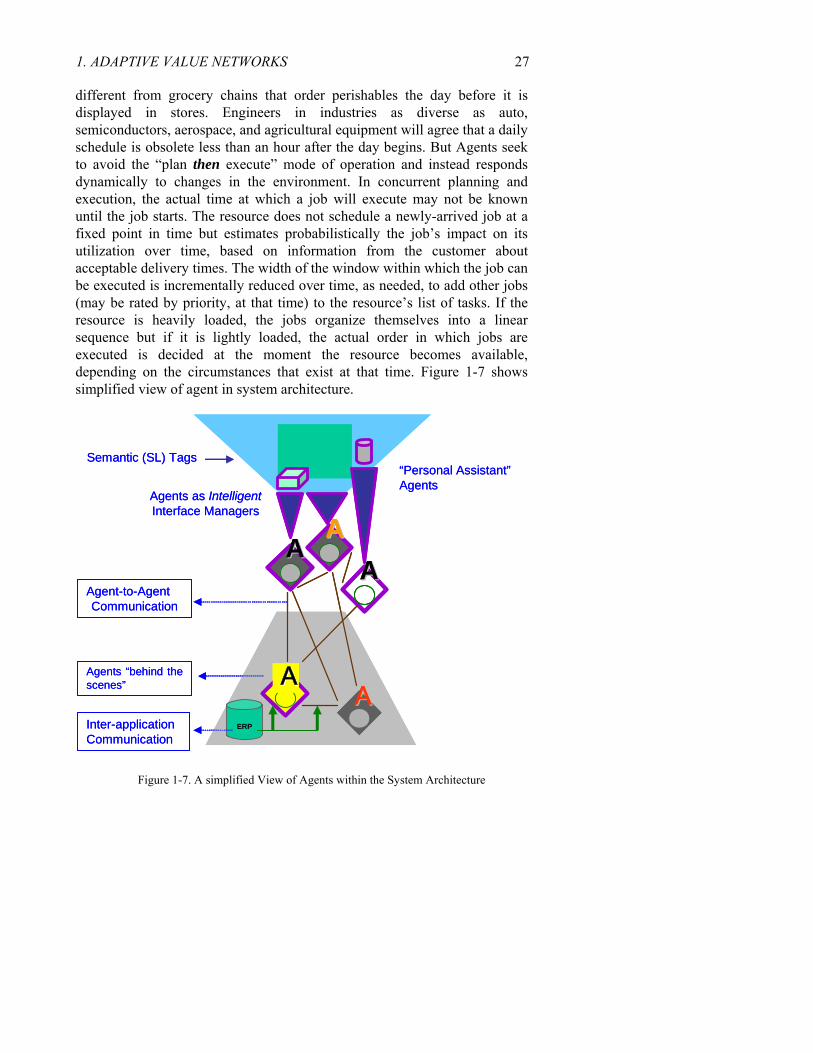
1. ADAPTIVE VALUE NETWORKS 27 different from grocery chains that order perishables the day before it is displayed in stores. Engineers in industries as diverse as auto, semiconductors, aerospace, and agricultural equipment will agree that a daily schedule is obsolete less than an hour after the day begins. But Agents seek to avoid the “plan then execute” mode of operation and instead responds dynamically to changes in the environment. In concurrent planning and execution, the actual time at which a job will execute may not be known until the job starts. The resource does not schedule a newly-arrived job at a fixed point in time but estimates probabilistically the job’s impact on its utilization over time, based on information from the customer about acceptable delivery times. The width of the window within which the job can be executed is incrementally reduced over time, as needed, to add other jobs (may be rated by priority, at that time) to the resource’s list of tasks. If the resource is heavily loaded, the jobs organize themselves into a linear sequence but if it is lightly loaded, the actual order in which jobs are executed is decided at the moment the resource becomes available, depending on the circumstances that exist at that time. Figure 1-7 shows simplified view of agent in system architecture.
AAAA
AA
AAAA
ERP
“Personal Assistant”Agents
Agents as IntelligentInterface Managers
Agent-to-AgentCommunication
Agents “behind the scenes”
Inter-applicationCommunication
Semantic (SL) Tags
AAAAAAAA
AAAA
AAAAAAAA
ERP
“Personal Assistant”Agents
Agents as IntelligentInterface Managers
Agent-to-AgentCommunication
Agents “behind the scenes”
Inter-applicationCommunication
Semantic (SL) Tags
Figure 1-7. A simplified View of Agents within the System Architecture
28 Chapter 1 4.2 Agents in Maintenance (US Air Force Case Study)
This example of a multi-Agent framework (and this case study) was developed by Shehory, Sycara and Sukthankar in 1999 (Agent aided aircraft maintenance) at the Carnegie-Mellon University, Pittsburgh (Shehory et al., 1999). It provides information retrieval and analysis in support of decision making for aircraft maintenance and repair for the US Air Force (USAF). Although the solution was developed for a specific type of aircraft, the Agents and interactions were designed to apply to a range of similar maintenance scenarios.
Aircraft maintenance in the USAF is performed at different levels. Basic and intermediate levels are usually performed at the base where the aircraft is deployed, whereas periodic, comprehensive maintenance is performed at special depots. Initially, mechanics inspect the aircraft for discrepancies (and may also receive such information from pilots). For each discrepancy, the mechanic consults the technical manuals for a standard repair procedure. In case such a repair procedure is found and the resources (parts) are available, the mechanic proceeds with the repair. In cases where parts are not available or they are too expensive or require too much time and additional machinery for replacement or in cases where a procedure is not provided in the technical manual, a mechanic needs to consult an expert engineer. The engineer, in turn, may consult external sources of information. These include manuals, historical maintenance data and may even include consultation with experts.
Inventory of parts is based on traditional data input from goods received. Locating spares, therefore, could be a time consuming and arduous undertaking that can be automated to a significant extent by use of automatic identification technologies (UWB, RFID) and to link inventory object related data with service/maintenance processes to offer transparency of the spares supply chain.
Until recently, no automation was introduced to the consultation processes, either, of this information-rich environment. Hard-copy repair manuals are used by mechanics and engineers. Search for relevant information may be time consuming and incomplete. Historical data (records of previous similar repairs) is scarcely used, since it is stored in paper format with no search mechanisms and usually only kept for short periods (distributed along remotely located service centers). Expert engineers may be located remotely and their advice is available by voice or fax messages, usually delayed for hours or days. All of these factors contribute to a slow, inefficient maintenance that compromises readiness.
The inspection, consultation and repair process consists of the following steps:

1. ADAPTIVE VALUE NETWORKS 29 1. Aircraft arrives at a maintenance center, either at its home base or depot
(depending on the type of maintenance required). In both cases, the maintenance procedures must be completed within a limited time period. This period varies. Basic and intermediate maintenance must be completed within hours or a few days, whereas depot maintenance may be scheduled for several weeks (depends on aircraft).
2. Mechanics inspect the aircraft and locate discrepancies. For each discrepancy a mechanic performs the following:
a) browse the technical manual for repair procedures; b) in case an appropriate procedure is located, mechanic needs to verify
whether it can be completed given limitations on repair time and parts availability. Mechanic may also need to consider the price of repair. For example, the technical manual may require replacing a whole wing if a crack in the wing is greater than some given threshold. This may take too long and become too expensive thereby causing delay or compromise operational activity or readiness;
c) if the procedure found can be performed, the mechanic performs it. If not, mechanic proceeds to fill out form 202a, standard USAF form for reporting aircraft discrepancies and requesting advice. The mechanic may attach supporting information. The mechanic may consult Illustrated Part Breakdown (IPB) technical manuals and possibly other experienced mechanics. Form 202a is sent for advice and authorization for non-standard repair.
3. An engineer, upon receipt of a Form 202a, proceeds to: a) use experience, historical repair information and manuals to design
appropriate repair; b) fill in a Form 202b, standard US Air Force form for discrepancy repair
instructions. To this form the engineer may attach graphical illustration to clarify required repair procedure;
c) file 202a and 202b for future use as historical repair information. 4. When a standard repair procedure is found or on receipt of Form 202b
from engineer, the mechanic performs the repair as instructed. The current inspection, consultation and repair processes, as described above, have several problems. The multi-Agent system (MAS) implementation reported here attempts to address these problems. The majority of the information, both historical repair information and technical manuals, is found in hard-copy format as well as hand-written pieces. Mechanics and engineers spend precious time on:
a) Browsing manuals and searching for historical repair information; b) Drawing graphical discrepancy and repair illustrations; c) Mechanics are idle, waiting for Form 202b to arrive from engineers in
reply to their Form 202a;

30 Chapter 1 d) Historical information is unused when stored remotely or local hard-copy
is difficult to browse. For information needs of mechanics, using manuals during inspection for
diagnosis is inefficient and at times impossible due to the physical constraints of the inspection environment. Scribbled information both from historical forms and the current Form 202 may have limited comprehensibility. The problem intensifies due to deterioration in the quality of such information when it is transmitted via fax or photo-copied. Historical forms are kept only for two years. Time and effort spent on paperwork and filing should be used instead for diagnosis and repair. Technical manuals (IPB) are not consistently updated.
The problem consists of decision support in a physically distributed, dynamically changing environment, rich in multi-modal information, where users have diverse (varying over time) information needs. This is the type of problem for which RETSINA (REusable Task-based System of Intelligent Networked Agents) is a solution. It is a multi-Agent infrastructure that was developed for information gathering and integration from web-based sources and decision support tasks. It includes a distributed MAS organization, protocols for inter-Agent interaction as well as collaboration and a reusable set of software components for constructing Agents. Each Agent in RETSINA specializes in a special class of tasks. When Agents execute tasks or plan for task execution, they organize themselves to avoid processing bottlenecks and form teams to deal with dynamic changes in information, tasks, number of Agents and their capabilities.
In RETSINA, the Agents are distributed and execute on different machines. Based on models of users, an Agents and tasks, the Agents decide how to decompose tasks, whether to pass them to others, what information is needed at each decision point, and when to cooperate with other Agents. The Agents communicate with each other to delegate tasks, request or provide information, find information sources, filter or integrate information, negotiate to resolve inconsistencies in information and task models. The RETSINA infrastructure consists, by convention, of 3 broad types of Agents: – Interface Agents; – Task Agents; – Information Agents.
In the RETSINA multi-Agent infrastructure, Interface Agents interact with users receiving specifications and delivering results. They acquire, model and utilize user preferences. The Interface Agents hide the underlying structural complexity of the Agent system. Main functions of an Interface Agent include:
1. ADAPTIVE VALUE NETWORKS 31 – collecting relevant information from the user to initiate a task; – presenting relevant intermediate and final results; – requesting additional information during task execution;
Task Agents formulate and execute plans. They have knowledge of the
task domain and which other Task Agents or Information Agents are relevant for performing various parts of a task. Task Agents have strategies for resolving conflicts and fusing information retrieved by Information Agents. A Task Agent: – receives user delegated task specifications from an Interface Agent; – interprets the specifications and extracts problem-solving goals; – forms plans to satisfy these goals; – identifies information-seeking sub-goals that are present in its plans; – decomposes plans and cooperates with appropriate Task Agents or
Information Agents for planning, execution, monitoring and results compilation. Information agents provide intelligent access to heterogeneous collection
of information sources. They have models of information resources and strategies for source selection, information access, conflict resolution, and information fusion. Information Agents can actively monitor information sources.
Middle agents collect and provide information about the location, availability and capabilities of other Agents (possibly additional information about them). They may also serve as mediators, hiding the identities of either service requester Agents or service provider Agents or both. Middle Agents (Matchmakers) provide RETSINA-based MAS with openness. That is, Agents may leave and enter the system dynamically. When an Agent appears, it advertises itself with a Middle Agent. When it leaves, it informs the Middle Agent, as well. Agent disappearance as a result of Agent or network failure is detected by a Middle Agent via a pinging mechanism. The RETSINA internal Agent architecture is based on a multi-module, multi-thread design. It consists of two component types: functional units and data stores. Given its properties, we found the RETSINA infrastructure appropriate to solve the USAF maintenance problem. By developing and using Agent architecture, we gain the following advantages: 1. The RETSINA architecture can be used to wrap legacy software systems
by equipping them with a Communicator module. Thus the resulting system remains backwardly compatible with the older systems, without restricting future software development to an obsolete model. For instance, in 1999 the Warner Robins Air Force Base (AFB) engineers were experimenting with entering some of the data into an Access
32 Chapter 1
database format, as a temporary measure while waiting for (the ITL-ALC) another system to become available. With this design, separate Information Agents can easily be designed to accommodate both data sources. Since the maintenance personnel only interact with Interface Agents, they are shielded from internal data discontinuities;
2. The information required by the maintenance engineers is likely to be distributed among several computers in different geographic locations. RETSINA architecture provides built-in networking support useful for developing distributed systems, in the form of the Communicator. The Agent Name Sever (Matchmaker) allows service requesters to locate service providers. Although the current focus is on handling the repair operations described in Form 202A, which are performed locally in Warner Robins AFB, additional Agents can be added to the system to access collections of Form 00-107 (immediate repair requests), which can be filed from multiple locations. These Agents would be located on computers at the local Air Force base performing the repair and would communicate to agents at the central F-15 repair location (Warner Robins AFB);
3. The Warner-Robins Air Force Base is in a transitional phase of reorganizing their data and also training personnel. Rapid prototyping of a group of Agents are underway to address the current situation and slowly add to the “Agent population" as new information sources become available electronically. Since the Interface Agent is decoupled from the Information Agents, it is possible to replace older Information Agents without disruptions or disturbance to the users.
4.3 Agents in Manufacturing
Commercial aerospace industry makes fewer products and sells to a different set of customers than the retail industry (Figure 1-8 shows typical aerospace supply chains). Some (modular) parts and components are shared between different models (variants) of aircraft. Significant profit in this (and the automobile industry) is derived from the aftermarket sale of parts and service. The companies therefore have access to a large amount of usage data. Premature failure of two hydraulic pumps in different corners of the world prompts an Agent to explore the pattern. Both pumps came from the same manufacturing lot. The Agent prompts maintenance technicians to perform non-routine vibration analysis. Results indicated that the manufacturing lot had a defect. If vibration analyses data from manufacturer’s test results were available to the Agent in this value network, a pattern may have emerged even before a single pump failed. Comparative
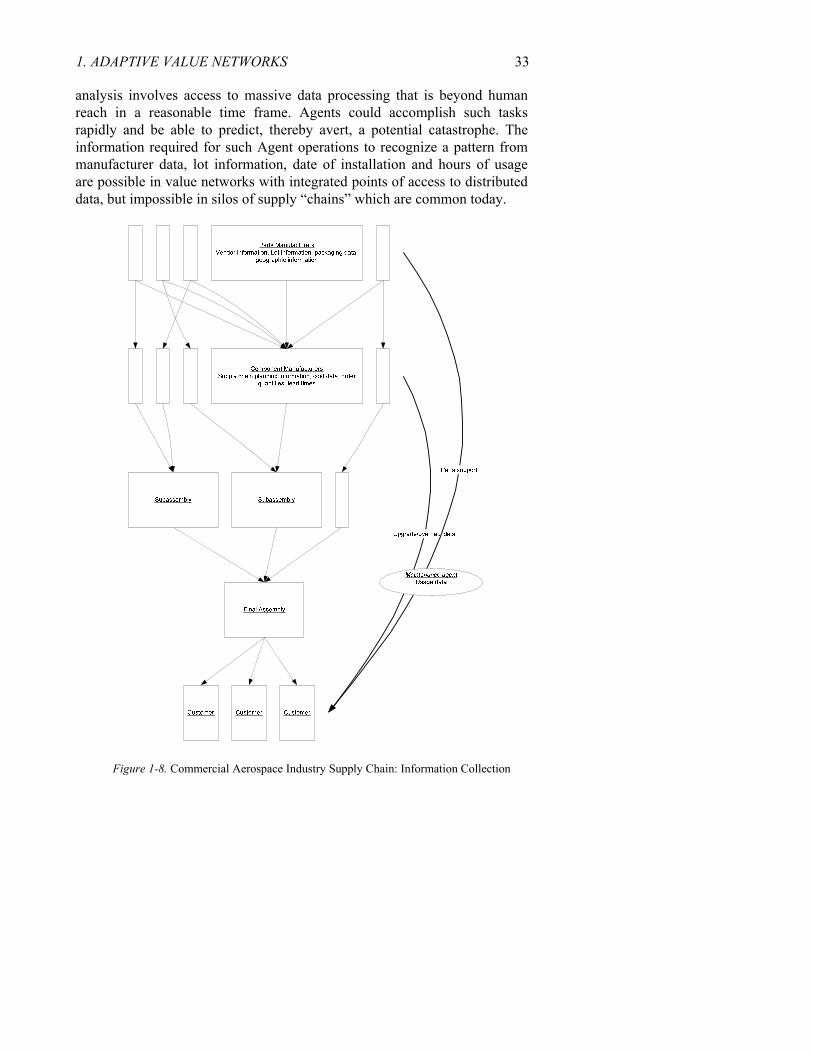
1. ADAPTIVE VALUE NETWORKS 33 analysis involves access to massive data processing that is beyond human reach in a reasonable time frame. Agents could accomplish such tasks rapidly and be able to predict, thereby avert, a potential catastrophe. The information required for such Agent operations to recognize a pattern from manufacturer data, lot information, date of installation and hours of usage are possible in value networks with integrated points of access to distributed data, but impossible in silos of supply “chains” which are common today.
Figure 1-8. Commercial Aerospace Industry Supply Chain: Information Collection

34 Chapter 1 4.4 Future Agents at Work?
Transistor Titikaka Promethium (TTP), a small electronics retailer, starts selling a digital camera (named, CELC) and soon runs out of inventory due to the popularity of the new product. TTP places another order. A week later some customers returned the cameras and others call with questions. TTP is unable to determine the cause and loses time and revenues. Think different.
You are Must-See-Borgium Corporation, the bleeding-edge retailing
behemoth. You started selling CELC and soon your return center in Moose Jaw is flooded with CELC from unhappy customers. Fortunately, your ex-VP (exiled to Timbuktu) had created a liaison with a tiny institute around Boston. She quietly integrated a system called MY-CAH that offered no satisfactory ROI to your bean counters. Within a week of mounting CELC returns to Moose Jaw, Must-See-Borgium’s MY-CAH Agent sends an e-mail alert (cc you) to N. E. Shee in Urawa (manufacturer’s headquarter) that many US customers who returned CELC to Moose Jaw also bought a certain brand of BELL notebooks with Dumb-Bell Mobile Bambino. In your in-box you also find a response from Shee-san that the camera’s software is incompatible with systems installed with Dumb-Bell Mobile Bambino without a special patch from MacroHard that can be downloaded from www.bosonic-hadrons.net and the CELC website will soon upload the link for customers. MY-CAH Agents already posted an update on the corporate website, informed Moose Jaw Center, CELC customers who registered or returned their products, sent e-mail to only those customers who bought CELC with Must-Have-Borgium credit-loyalty card and printed out an exact number of stickers (per inventory) with instructions to be affixed to CELC boxes in all your local mega-stores. You find a note of gratitude from Miss Fermionic Baryons at TTP who saw the notice about CELC on your website and could inform TTP’s customers by phone. You had no problem getting out of a mess and a bad PR wrap because MY-CAH actually works! Didn’t you vociferously object to the VP’s proposal to sponsor research at that tiny institute around Boston? Anyway, you solved the problem.
What really happened? Your store was running an Agent system that
analyses data for trends. The Agent was able to identify this trend in minimal time. The missing patch could have been identified without the use of an Agent, but it would have taken much longer and resulted in many more unhappy customers, which would generate bad publicity. Why did an Agent work in this situation? Data and information derived from data is the key enabler for decision systems to be agile. In this example, the Agents were autonomously collecting product, customer, and service related information.
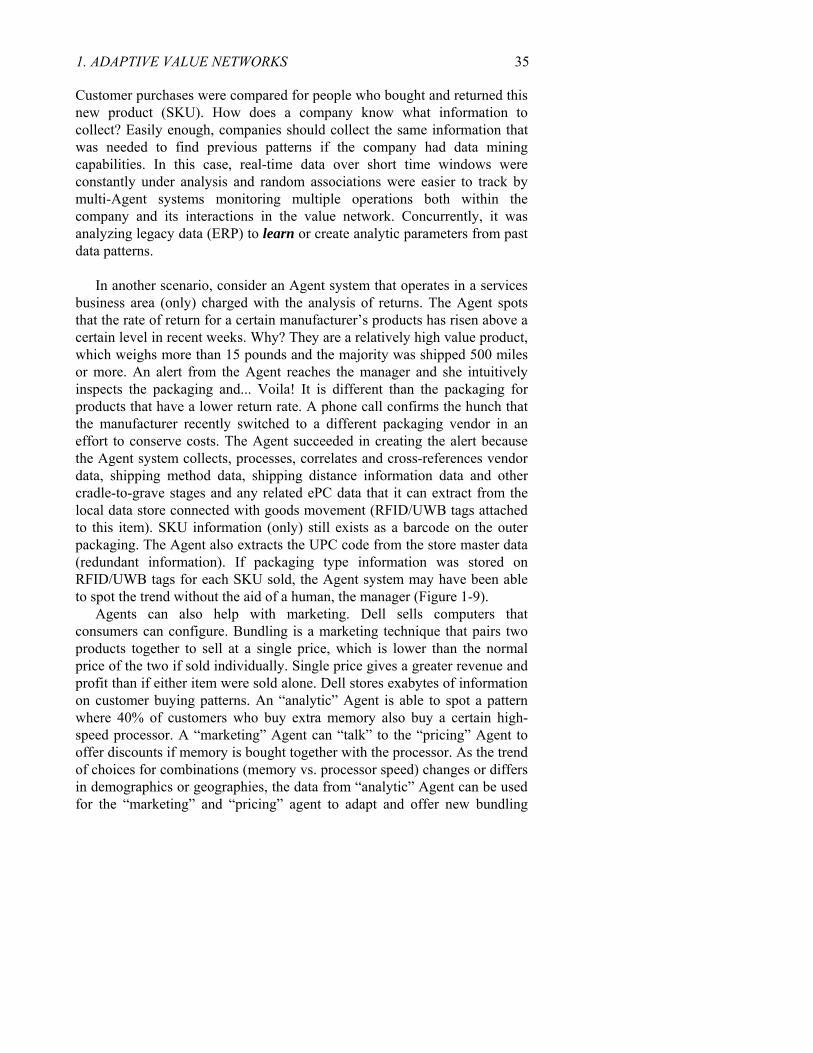
1. ADAPTIVE VALUE NETWORKS 35 Customer purchases were compared for people who bought and returned this new product (SKU). How does a company know what information to collect? Easily enough, companies should collect the same information that was needed to find previous patterns if the company had data mining capabilities. In this case, real-time data over short time windows were constantly under analysis and random associations were easier to track by multi-Agent systems monitoring multiple operations both within the company and its interactions in the value network. Concurrently, it was analyzing legacy data (ERP) to learn or create analytic parameters from past data patterns.
In another scenario, consider an Agent system that operates in a services
business area (only) charged with the analysis of returns. The Agent spots that the rate of return for a certain manufacturer’s products has risen above a certain level in recent weeks. Why? They are a relatively high value product, which weighs more than 15 pounds and the majority was shipped 500 miles or more. An alert from the Agent reaches the manager and she intuitively inspects the packaging and... Voila! It is different than the packaging for products that have a lower return rate. A phone call confirms the hunch that the manufacturer recently switched to a different packaging vendor in an effort to conserve costs. The Agent succeeded in creating the alert because the Agent system collects, processes, correlates and cross-references vendor data, shipping method data, shipping distance information data and other cradle-to-grave stages and any related ePC data that it can extract from the local data store connected with goods movement (RFID/UWB tags attached to this item). SKU information (only) still exists as a barcode on the outer packaging. The Agent also extracts the UPC code from the store master data (redundant information). If packaging type information was stored on RFID/UWB tags for each SKU sold, the Agent system may have been able to spot the trend without the aid of a human, the manager (Figure 1-9).
Agents can also help with marketing. Dell sells computers that consumers can configure. Bundling is a marketing technique that pairs two products together to sell at a single price, which is lower than the normal price of the two if sold individually. Single price gives a greater revenue and profit than if either item were sold alone. Dell stores exabytes of information on customer buying patterns. An “analytic” Agent is able to spot a pattern where 40% of customers who buy extra memory also buy a certain high-speed processor. A “marketing” Agent can “talk” to the “pricing” Agent to offer discounts if memory is bought together with the processor. As the trend of choices for combinations (memory vs. processor speed) changes or differs in demographics or geographies, the data from “analytic” Agent can be used for the “marketing” and “pricing” agent to adapt and offer new bundling
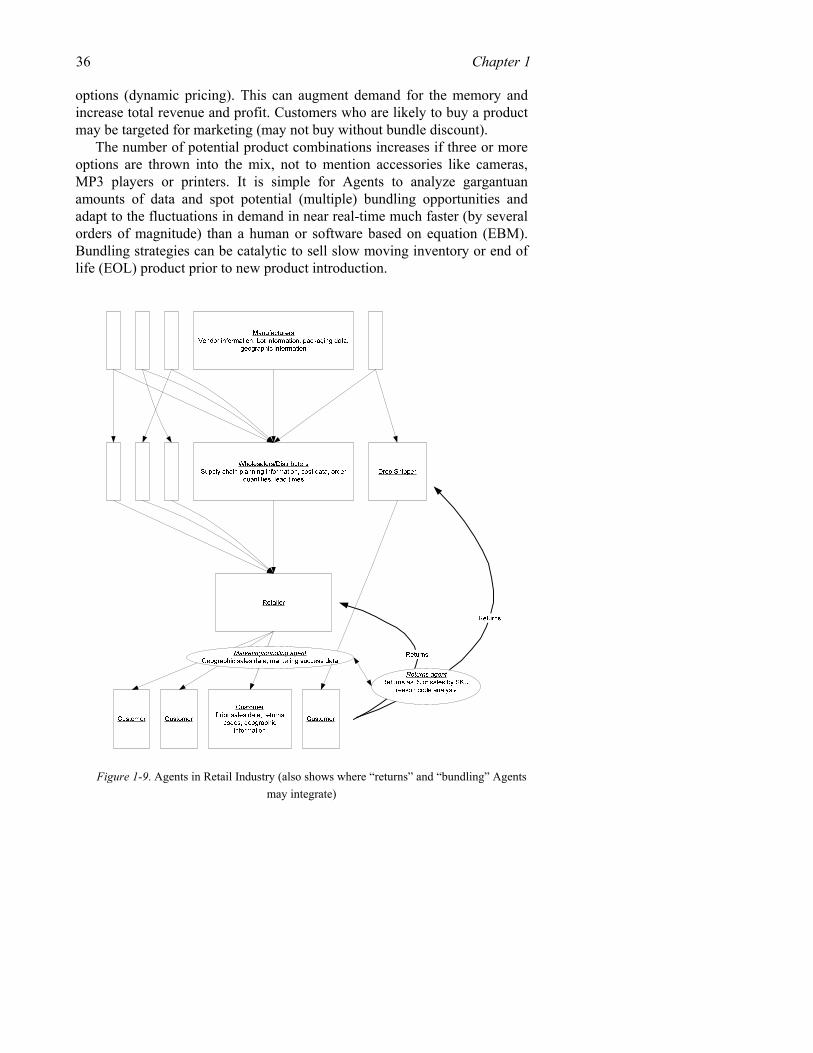
36 Chapter 1 options (dynamic pricing). This can augment demand for the memory and increase total revenue and profit. Customers who are likely to buy a product may be targeted for marketing (may not buy without bundle discount).
The number of potential product combinations increases if three or more options are thrown into the mix, not to mention accessories like cameras, MP3 players or printers. It is simple for Agents to analyze gargantuan amounts of data and spot potential (multiple) bundling opportunities and adapt to the fluctuations in demand in near real-time much faster (by several orders of magnitude) than a human or software based on equation (EBM). Bundling strategies can be catalytic to sell slow moving inventory or end of life (EOL) product prior to new product introduction.
Figure 1-9. Agents in Retail Industry (also shows where “returns” and “bundling” Agents may integrate)
1. ADAPTIVE VALUE NETWORKS 37
When I want to go out to the movies, rather than read reviews, I ask my sister-in-law. We all have an equivalent who is both an expert on movies and an expert on us. What we need to build is a digital sister-in-law (“Less Is More: Interface Agents as Digital Butlers” by Nicholas Negroponte, 1994).
4.5 WHY THINK DIFFERENTLY?
The approach to system design and management with Agents in the software landscape is at odds with the centralized top-down tradition in systems engineering. The question usually arises in terms of the contrast between local and global optimization. Decision-makers fear that by turning control of a system over to locally autonomous Agents without a central decision-making body, they will lose value that could have been captured by an integrated (enterprise) global approach.
Benefits of Agent-based architecture versus centralized ones are conditional, not absolute. In a stable environment, a centralized approach can be optimized to out-perform the efforts of an opportunistic distributed system of Agents. If the system has appropriate learning capabilities, it will eventually become as efficient. The appropriate comparison for systems designers of enterprise software is not between local and global optima but between static versus adaptable systems. Thus, evaluate the competing options (in any particular case) theoretically, strategically, tactically and practically.
Theoretically, there are decentralized mechanisms that can achieve global coordination. For example, economists have long studied how local decisions can yield globally reasonable effects. Recently these insights have been applied to a number of domains that were not traditionally considered as economic, such as network management, manufacturing scheduling and pollution control.
Strategically, managers must weigh the value of a system that is robust under continual change against one that can achieve a theoretical optimum in a steady-state equilibrium (that may never be realized). A company that anticipates a stable environment may well choose centralized optimization. One that also incorporates Agent-based software does so because it cannot afford to be taken by surprise.
Tactically, the life-cycle software costs may be lower for Agent-based systems than for centralized enterprise software. Agents can be modified and maintained individually at a fraction of the cost of opening up a complex enterprise software system. In systems that must be modified frequently, losses due to sub-optimal performance can be recovered in reduced system maintenance expenses.
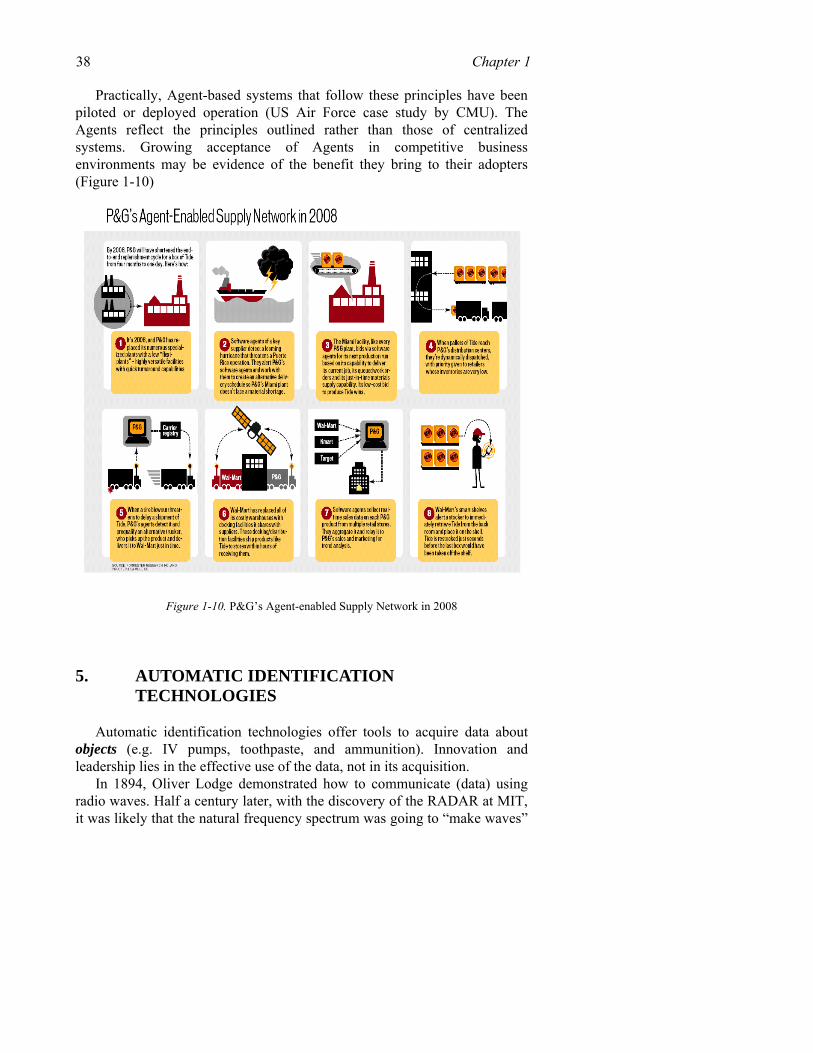
38 Chapter 1
Practically, Agent-based systems that follow these principles have been piloted or deployed operation (US Air Force case study by CMU). The Agents reflect the principles outlined rather than those of centralized systems. Growing acceptance of Agents in competitive business environments may be evidence of the benefit they bring to their adopters (Figure 1-10)
Figure 1-10. P&G’s Agent-enabled Supply Network in 2008
5. AUTOMATIC IDENTIFICATION TECHNOLOGIES
Automatic identification technologies offer tools to acquire data about objects (e.g. IV pumps, toothpaste, and ammunition). Innovation and leadership lies in the effective use of the data, not in its acquisition.
In 1894, Oliver Lodge demonstrated how to communicate (data) using radio waves. Half a century later, with the discovery of the RADAR at MIT, it was likely that the natural frequency spectrum was going to “make waves”
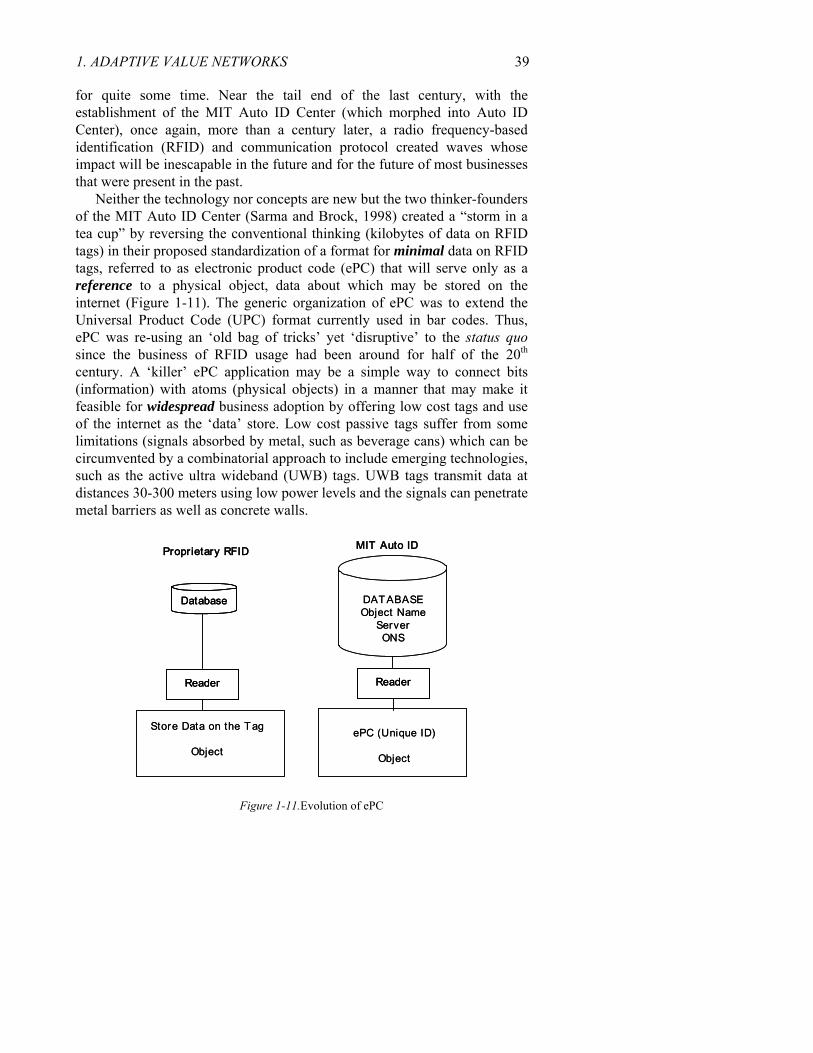
1. ADAPTIVE VALUE NETWORKS 39 for quite some time. Near the tail end of the last century, with the establishment of the MIT Auto ID Center (which morphed into Auto ID Center), once again, more than a century later, a radio frequency-based identification (RFID) and communication protocol created waves whose impact will be inescapable in the future and for the future of most businesses that were present in the past.
Neither the technology nor concepts are new but the two thinker-founders of the MIT Auto ID Center (Sarma and Brock, 1998) created a “storm in a tea cup” by reversing the conventional thinking (kilobytes of data on RFID tags) in their proposed standardization of a format for minimal data on RFID tags, referred to as electronic product code (ePC) that will serve only as a reference to a physical object, data about which may be stored on the internet (Figure 1-11). The generic organization of ePC was to extend the Universal Product Code (UPC) format currently used in bar codes. Thus, ePC was re-using an ‘old bag of tricks’ yet ‘disruptive’ to the status quo since the business of RFID usage had been around for half of the 20th century. A ‘killer’ ePC application may be a simple way to connect bits (information) with atoms (physical objects) in a manner that may make it feasible for widespread business adoption by offering low cost tags and use of the internet as the ‘data’ store. Low cost passive tags suffer from some limitations (signals absorbed by metal, such as beverage cans) which can be circumvented by a combinatorial approach to include emerging technologies, such as the active ultra wideband (UWB) tags. UWB tags transmit data at distances 30-300 meters using low power levels and the signals can penetrate metal barriers as well as concrete walls.
Store Data on the Tag
Object
Reader
Database DAT ABASEObject Name
ServerONS
Propr ietary RFID MIT Auto ID
Reader
ePC (Unique ID)
Object
Store Data on the Tag
Object
ReaderReader
DatabaseDatabase DAT ABASEObject Name
ServerONS
Propr ietary RFID MIT Auto ID
ReaderReader
ePC (Unique ID)
Object
Figure 1-11.Evolution of ePC
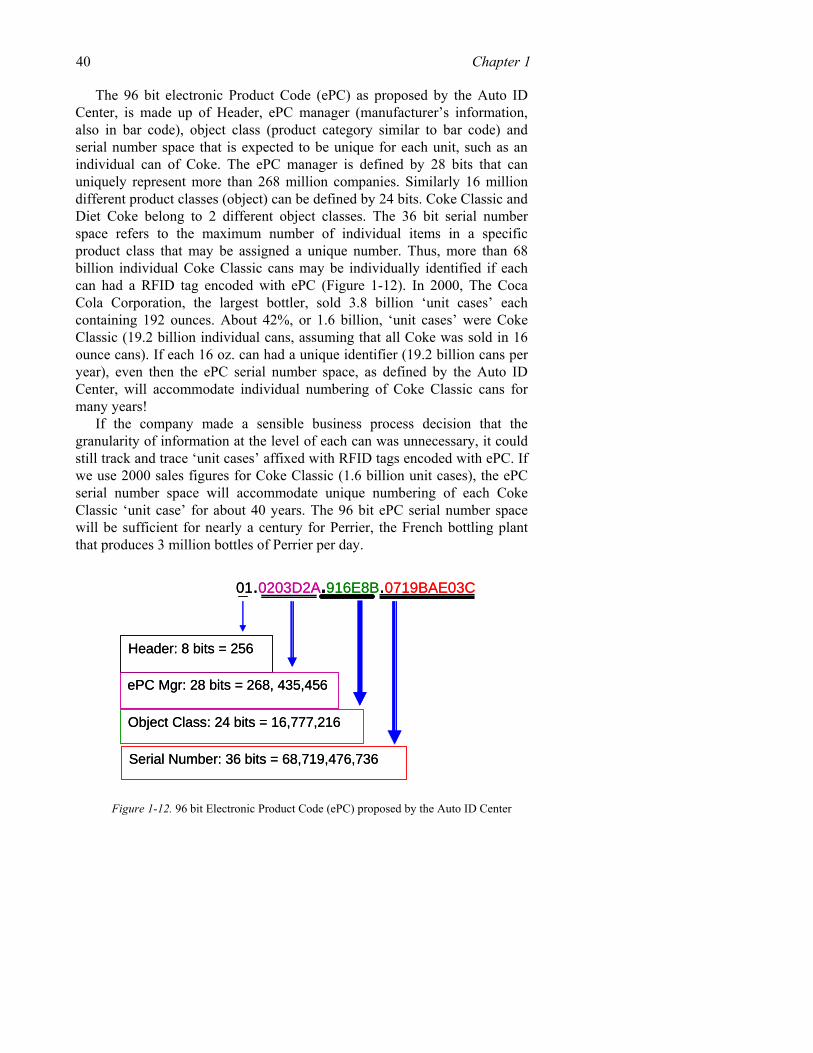
40 Chapter 1
The 96 bit electronic Product Code (ePC) as proposed by the Auto ID Center, is made up of Header, ePC manager (manufacturer’s information, also in bar code), object class (product category similar to bar code) and serial number space that is expected to be unique for each unit, such as an individual can of Coke. The ePC manager is defined by 28 bits that can uniquely represent more than 268 million companies. Similarly 16 million different product classes (object) can be defined by 24 bits. Coke Classic and Diet Coke belong to 2 different object classes. The 36 bit serial number space refers to the maximum number of individual items in a specific product class that may be assigned a unique number. Thus, more than 68 billion individual Coke Classic cans may be individually identified if each can had a RFID tag encoded with ePC (Figure 1-12). In 2000, The Coca Cola Corporation, the largest bottler, sold 3.8 billion ‘unit cases’ each containing 192 ounces. About 42%, or 1.6 billion, ‘unit cases’ were Coke Classic (19.2 billion individual cans, assuming that all Coke was sold in 16 ounce cans). If each 16 oz. can had a unique identifier (19.2 billion cans per year), even then the ePC serial number space, as defined by the Auto ID Center, will accommodate individual numbering of Coke Classic cans for many years!
If the company made a sensible business process decision that the granularity of information at the level of each can was unnecessary, it could still track and trace ‘unit cases’ affixed with RFID tags encoded with ePC. If we use 2000 sales figures for Coke Classic (1.6 billion unit cases), the ePC serial number space will accommodate unique numbering of each Coke Classic ‘unit case’ for about 40 years. The 96 bit ePC serial number space will be sufficient for nearly a century for Perrier, the French bottling plant that produces 3 million bottles of Perrier per day.
01.0203D2A.916E8B.0719BAE03C
Header: 8 bits = 256
ePC Mgr: 28 bits = 268, 435,456
Object Class: 24 bits = 16,777,216
Serial Number: 36 bits = 68,719,476,736
01.0203D2A.916E8B.0719BAE03C
Header: 8 bits = 256
ePC Mgr: 28 bits = 268, 435,456
Object Class: 24 bits = 16,777,216
Serial Number: 36 bits = 68,719,476,736
Figure 1-12. 96 bit Electronic Product Code (ePC) proposed by the Auto ID Center
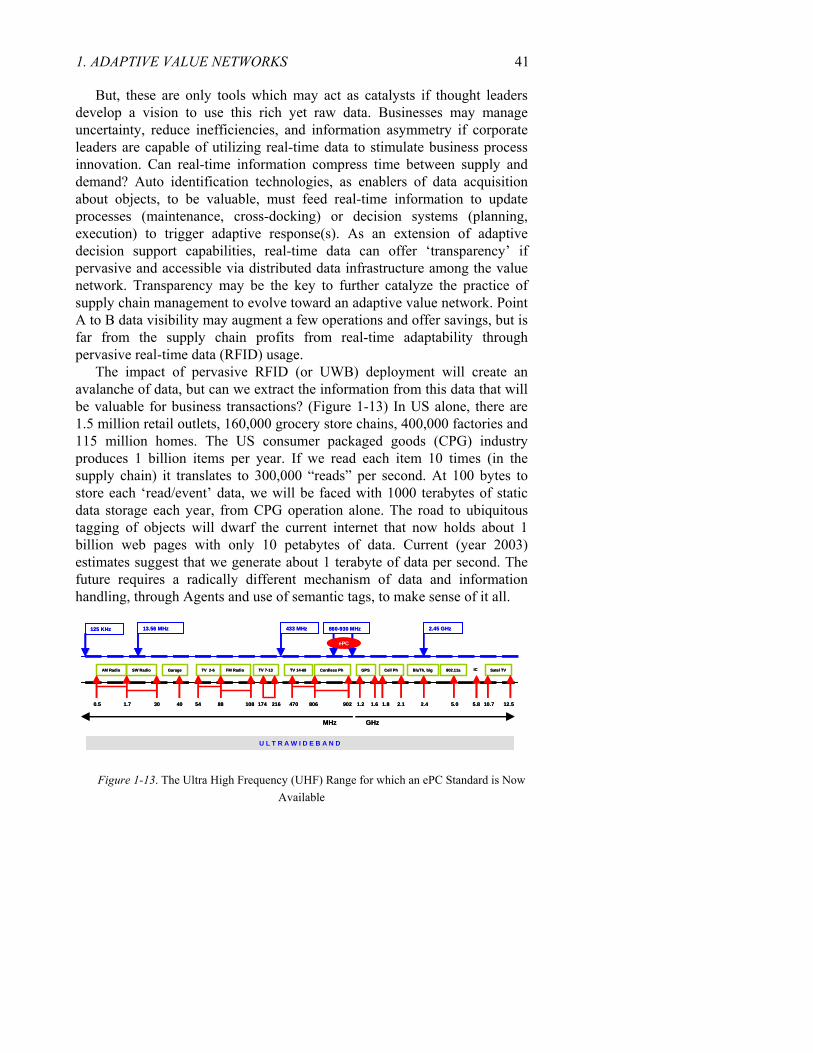
1. ADAPTIVE VALUE NETWORKS 41
But, these are only tools which may act as catalysts if thought leaders develop a vision to use this rich yet raw data. Businesses may manage uncertainty, reduce inefficiencies, and information asymmetry if corporate leaders are capable of utilizing real-time data to stimulate business process innovation. Can real-time information compress time between supply and demand? Auto identification technologies, as enablers of data acquisition about objects, to be valuable, must feed real-time information to update processes (maintenance, cross-docking) or decision systems (planning, execution) to trigger adaptive response(s). As an extension of adaptive decision support capabilities, real-time data can offer ‘transparency’ if pervasive and accessible via distributed data infrastructure among the value network. Transparency may be the key to further catalyze the practice of supply chain management to evolve toward an adaptive value network. Point A to B data visibility may augment a few operations and offer savings, but is far from the supply chain profits from real-time adaptability through pervasive real-time data (RFID) usage.
The impact of pervasive RFID (or UWB) deployment will create an avalanche of data, but can we extract the information from this data that will be valuable for business transactions? (Figure 1-13) In US alone, there are 1.5 million retail outlets, 160,000 grocery store chains, 400,000 factories and 115 million homes. The US consumer packaged goods (CPG) industry produces 1 billion items per year. If we read each item 10 times (in the supply chain) it translates to 300,000 “reads” per second. At 100 bytes to store each ‘read/event’ data, we will be faced with 1000 terabytes of static data storage each year, from CPG operation alone. The road to ubiquitous tagging of objects will dwarf the current internet that now holds about 1 billion web pages with only 10 petabytes of data. Current (year 2003) estimates suggest that we generate about 1 terabyte of data per second. The future requires a radically different mechanism of data and information handling, through Agents and use of semantic tags, to make sense of it all.
AM Radio SW Radio Garage TV 2-6 FM Radio TV 7-13 TV 14-69 Cordless Ph
0.5 1.7 30 40 54 88 108 174 216 470 806 902
GPS Cell Ph BluTh, b/g 802.11a Satel TV
1.61.2 1.8 2.1 2.4
IC
5.0 5.8 10.7 12.5
MHz GHz
125 KHz 433 MHz 860-930 MHz 2.45 GHz13.56 MHz
U L T R A W I D E B A N D
ePC
AM Radio SW Radio Garage TV 2-6 FM Radio TV 7-13 TV 14-69 Cordless Ph
0.5 1.7 30 40 54 88 108 174 216 470 806 902
GPS Cell Ph BluTh, b/g 802.11a Satel TV
1.61.2 1.8 2.1 2.4
IC
5.0 5.8 10.7 12.5
MHz GHz
125 KHz 433 MHz 860-930 MHz 2.45 GHz13.56 MHz
U L T R A W I D E B A N D
ePC
Figure 1-13. The Ultra High Frequency (UHF) Range for which an ePC Standard is Now Available
42 Chapter 1
Given the potential impact, the ‘RFID’ market is, naturally, in quagmire, in part, spawned by unrealistic claims by some proponents of RFID who are focused on cost. Others discuss supply chain but understand less of its implication in terms of transparency in a value network. Still other contributors include vendors pushing products and consultants pushing services to offer you awe-inspiring ROI. Both groups want to “make hay while the sun shines.” Nay-sayers (with other commercial interests) are eager to point out shaky ROI because their methods still cannot prove the value. Another component has emerged in the form of individuals or groups (in search of media attention) who are quite vociferous about privacy of information but offers little substance to explain what constitutes violation of privacy in the context of an ePC alphanumeric string serving as a reference for Jiffy Peanut Butter or Wrigley’s Chewing Gum.
More than 5 billion bar codes are scanned each day, worldwide, but its potential for ubiquity may be cut short by the up-start ePC, but not anytime very soon. The inventors of the first linear bar code system were, naturally, decades ahead of their time. Bernard Silver and Norman Joseph Woodland applied to patent the system in 1949 and their patent was granted in 1952. Both were graduate students at the then Drexel Institute of Technology in Philadelphia and the idea was triggered by over-hearing a conversation in 1948 between the President of a grocery chain store imploring the Dean at DIT to develop an automated checkout system. Woodland took a job at IBM after graduation but IBM expressed limited interest in this work for bar codes. Disappointed, the duo sold their patent to Philco. Bernard Silver died in 1962. In the late 1960’s when their patent expired, several new technologies converged to make product scanning commercially feasible. In 1970, ten grocery companies formed a committee to choose a standard for encoding product data (the present day universal product code, UPC, the predecessor to ePC). By then IBM wanted “in” on the action and brought in Norman Woodland, still an employee at IBM, to help launch the bar code research effort. In 1973, Woodland’s leadership may have persuaded the standards committee to choose IBM’s symbol over six other competitors. On 26 June 1974, in a Marsh Supermarket in Troy, Ohio (USA) a package of Wrigley’s Chewing Gum was the first item scanned using the (universal product code) bar code (Scanlon, 2003).
“ In contrast, at highly successful firms such as McKinsey and Company […] Hundreds of new MBAs join the firm every year and almost as many leave. But the company is able to crank out high-quality work year after year because its core capabilities are rooted in its processes and values rather than in its resources (vision). I sense, however, that these
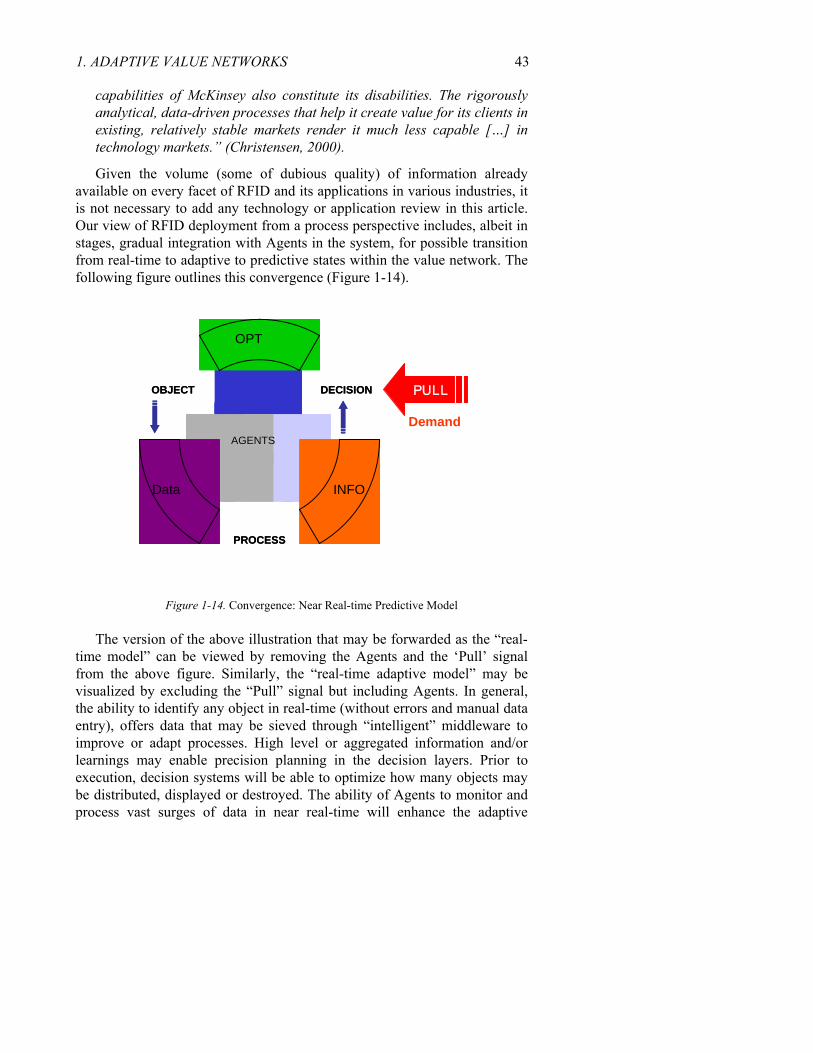
1. ADAPTIVE VALUE NETWORKS 43
capabilities of McKinsey also constitute its disabilities. The rigorously analytical, data-driven processes that help it create value for its clients in existing, relatively stable markets render it much less capable […] in technology markets.” (Christensen, 2000).
Given the volume (some of dubious quality) of information already available on every facet of RFID and its applications in various industries, it is not necessary to add any technology or application review in this article. Our view of RFID deployment from a process perspective includes, albeit in stages, gradual integration with Agents in the system, for possible transition from real-time to adaptive to predictive states within the value network. The following figure outlines this convergence (Figure 1-14).
DATA
AGENTSAGENTS
DATA
AGENTSAGENTS
DECISION
PROCESS
OBJECT
Data INFO
DECISION
PROCESS
OBJECT
Data INFO
OPT
PULL
Demand
Figure 1-14. Convergence: Near Real-time Predictive Model The version of the above illustration that may be forwarded as the “real-
time model” can be viewed by removing the Agents and the ‘Pull’ signal from the above figure. Similarly, the “real-time adaptive model” may be visualized by excluding the “Pull” signal but including Agents. In general, the ability to identify any object in real-time (without errors and manual data entry), offers data that may be sieved through “intelligent” middleware to improve or adapt processes. High level or aggregated information and/or learnings may enable precision planning in the decision layers. Prior to execution, decision systems will be able to optimize how many objects may be distributed, displayed or destroyed. The ability of Agents to monitor and process vast surges of data in near real-time will enhance the adaptive
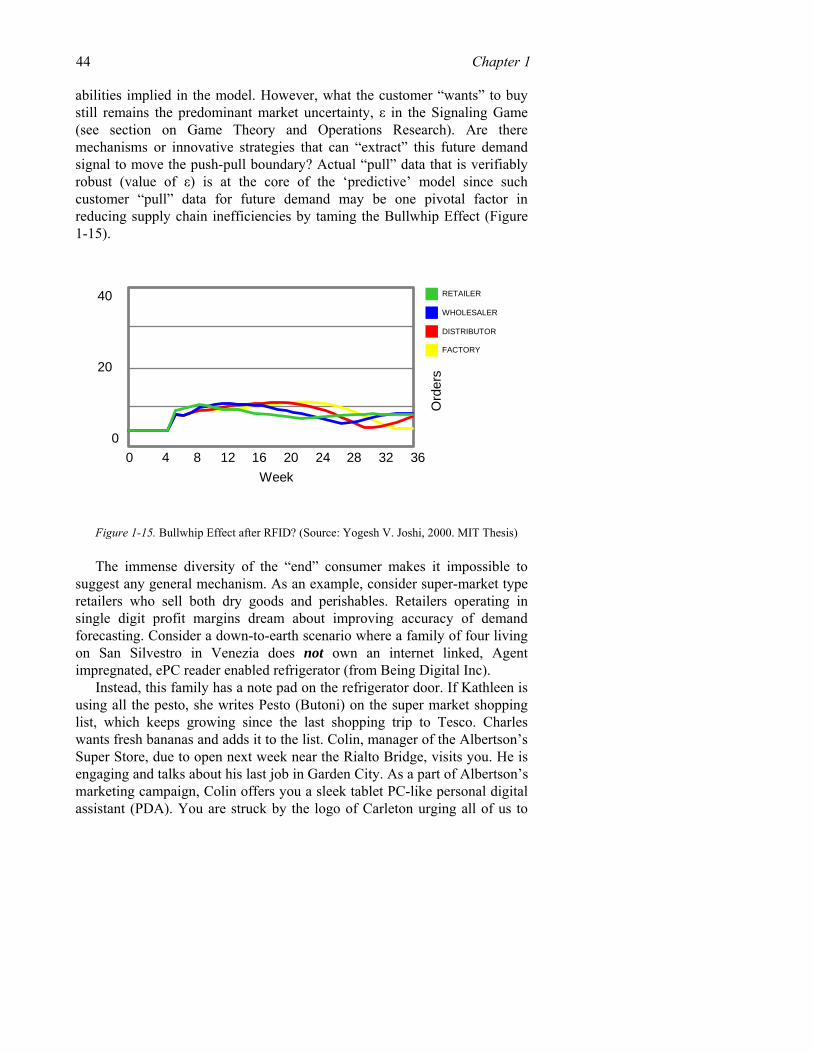
44 Chapter 1 abilities implied in the model. However, what the customer “wants” to buy still remains the predominant market uncertainty, ε in the Signaling Game (see section on Game Theory and Operations Research). Are there mechanisms or innovative strategies that can “extract” this future demand signal to move the push-pull boundary? Actual “pull” data that is verifiably robust (value of ε) is at the core of the ‘predictive’ model since such customer “pull” data for future demand may be one pivotal factor in reducing supply chain inefficiencies by taming the Bullwhip Effect (Figure 1-15).
RETAILER40
20
00 4 8 12 16 20 24 28 32 36
Week
Ord
ers
WHOLESALER
DISTRIBUTOR
FACTORY
RETAILER40
20
00 4 8 12 16 20 24 28 32 36
Week
Ord
ers
WHOLESALER
DISTRIBUTOR
FACTORY
Figure 1-15. Bullwhip Effect after RFID? (Source: Yogesh V. Joshi, 2000. MIT Thesis) The immense diversity of the “end” consumer makes it impossible to
suggest any general mechanism. As an example, consider super-market type retailers who sell both dry goods and perishables. Retailers operating in single digit profit margins dream about improving accuracy of demand forecasting. Consider a down-to-earth scenario where a family of four living on San Silvestro in Venezia does not own an internet linked, Agent impregnated, ePC reader enabled refrigerator (from Being Digital Inc).
Instead, this family has a note pad on the refrigerator door. If Kathleen is using all the pesto, she writes Pesto (Butoni) on the super market shopping list, which keeps growing since the last shopping trip to Tesco. Charles wants fresh bananas and adds it to the list. Colin, manager of the Albertson’s Super Store, due to open next week near the Rialto Bridge, visits you. He is engaging and talks about his last job in Garden City. As a part of Albertson’s marketing campaign, Colin offers you a sleek tablet PC-like personal digital assistant (PDA). You are struck by the logo of Carleton urging all of us to

1. ADAPTIVE VALUE NETWORKS 45 “invent” and it inspires you to think different. Colin explains that Albertson’s has teamed up with Moore Inc who bought Boingo Wireless from Sky Dayton. Colin is very convincing and you realize that this is not “a pie in the sky” scheme. You just may be on the road when the future arrives. The PDA is wireless internet accessible. You can use it at a T-Mobile “Hot Spot” such as one in the McDonald’s in San Marco. However, Colin would like you to use the magnetic holder of the PDA and slip it on the refrigerator door. Every time Matt is close to emptying the shampoo or Elaine finishes the Barilla tortellini, they should add these to the shopping list, as usual, but on the PDA with the sensor pen. What’s that to Albertson’s? Well, if you wrote down Barilla Pasta and bought Barilla Pasta the next time you shopped at Albertson’s with your Club Card, you shall receive a 2% discount, which also applies to all the items you scribbled on the PDA, if you actually bought those items at the store. What happens if you shopped online at Albertson’s virtual store, A_Pea_in_the_Pod.com? Colin explains that the PDA is still going to save you money. If you can plan ahead such that you can wait 24 hours before home delivery, then you get a discount. If you wait 48 hours, you receive 2.5% off your total bill. What if I can wait for 5 days? Colin explains that any wait longer than 48 hours is rewarded with a massive discount of 3%. But if you did go to the store with your PDA, it will wirelessly guide you to find things on your list and offer other tips or alert you to manufacturers or competitors e-coupons for things on your list. The first 100 people to sign up for Albertson’s offer also gets an autographed copy of the book of poetry "Moy Sand and Gravel," by the Pulitzer Prize winning author Paul Muldoon of Princeton University. Kathleen loves “Daffodils” and you want “in” on the action. Does it matter if Albertson’s gets to know today what I want tomorrow?
Convergence of falling prices on PDAs, low cost wireless/wired access and some “intelligent” software is the infrastructure a retailer may need to capture the “pull” demand directly from some customers, as illustrated in the near real-time predictive model. Can this data from customers reduce your waste of perishables by 10% or adapt forecasting to reduce your purchasing capital by 1%? Real-time POS data from RFID tagged (ePC encoded) objects and the data flow from customers’ pre-shopping lists may be combined for accurate forecasting and planning, particularly in procurement of perishables with short half-lives. In case of the latter, a final purchase order is sent only 36-24 hours prior to expected store delivery from producers (farmers, poultry, dairy). You can model the metrics in this scenario and claim that there may not be sufficient ROI to justify investment in this “pull” signal. How do you model the behavior of customers, say, in an area where more than 50% of the adults are internet users?

46 Chapter 1
In 1959, GE recruited the reputable consulting firm of Arthur D. Little Inc. in Boston to conduct a study to determine whether there was a market for portable TV sets that GE could now build using solid state transistors. Several months later in 1959, after spending a staggering amount of money (millions) in focus groups and discussions, Arthur D. Little Inc. sent their analysis to GE suggesting that they do not believe there is any market for such TV sets. GE management pushed aside the project proposed by its engineers. Just before Christmas in 1959, Sony introduced a small B&W television in the US market. Sony sold more than 4 million television sets within months (Tellis and Golder, 1996).
5.1 ULTRAWIDEBAND: THE NEXT GENERATION RFID?
Instead of the customer’s pre-shopping list in the retail scenario, what if that list was for spare parts at the Warner Robbins US Air Force Base (Agents case study) or US Army Aviation and Missile Command in Huntsville, Alabama? Can MRO (maintenance, repair and overhaul) improve its efficiency if the mechanics had visibility of the inventories of approved spare parts? In these and several other scenarios, it is likely that the benefits of using active ultrawideband tags will exceed low cost RFID tag usage. Only a brief overview of UWB is provided below since there is a mountain of original work in this area, especially from Dr. Gerry Ross and Dr. Robert Fontana (www.aetherwire.com/CDROM/Welcome.html).
The origin of ultra wideband technology stems from work in time-domain electromagnetics that began in 1962. At the Sperry Research Center, then part of the Sperry Rand Corporation, Dr. Gerry Ross, the father of baseband technology, applied these techniques to various applications in radar and communications. The experimental phases of these studies were aided by the development of the sampling oscilloscope by Dr. Bernard Oliver of the Hewlett-Packard Corporation (1962). In April 1973, Sperry Research Center was awarded the first UWB communications patent, due to Dr. Gerry Ross. Through the late 1980's, this technology was alternately referred to as baseband, carrier-free or impulse. The term "ultra wideband" was first applied by the US Department of Defense in 1989. By 1989, Sperry Research Center had been awarded over 50 patents including UWB applications such as communications, radar, collision avoidance, positioning systems, liquid level sensing and altimetry.
One recent application of UWB communications technology is the development of highly mobile, multi-node, ad hoc wireless communications networks for the US Department of Defense. The system is designed to be secure with low probability of intercept and detection. UWB ad hoc wireless
1. ADAPTIVE VALUE NETWORKS 47 network supports encrypted voice/data (128 kbps) and high-speed video (1.544 mbps). A parallel effort, funded by the Office of Naval Research, under the Dual Use Science and Technology (DUST) program is developing a state-of-the-art, mobile ad hoc network (MANET) based upon Internet Protocol (IP) suite to provide a connectionless, multihop, packet switching solution for survivable communications in a high link failure environment. The thrust of DUST is toward commercialization of UWB technology for applications to high-speed (>20 mbps) wireless applications for the home office. The Hummingbird collision avoidance UWB sensor (originated from a US Marine Corps project) was created for an electronic license plate commissioned by the US National Academy of Science (Transportation Research Board). The UWB Electronic License Plate provides a dual function capability for both automobile collision avoidance and (RF) tagging for vehicle to roadside communications.
Therefore, UWB usage in tagging is a proven technology. A comparative analysis of RFID versus UWB shows that UHF RFID has a spatial capacity of 1 kbpspm2 (grouper.ieee.org/groups/802). Spatial capacity of UWB is 1000 kbpspm2 or 1000-fold more than RFID. Spatial capacity focuses not only on bit rates for data transfer but on bit rates available in confined spaces (retail stores) defined by short transmission ranges. Measured in bits per second per square meter, spatial capacity is a gauge of "data intensity" that is analogous to the way lumens per square meter determine illumination intensity. Growing demand for greater wireless data capacity and crowding of regulated radio frequency may increasingly favor usage of spectrum that will offer appreciable bit rates that will function despite noise, multi-path interference and corruption when concentrated in smaller physical areas (grocery stores and warehouses). Spatial capacity limits may clog (like cholesterol in arteriosclerosis) "interrogation" systems when and if item level tags are a reality and readers in smart shelves continually emit electromagnetic signals to solicit tag data from objects. Part of this reasoning is evident in independent efforts by Hitachi and Sony who are exploring BlueTooth options with spatial capacity of 30 kbpspm2 and others in asset management (Rockwell Automation) are exploring 802.11a compliant 5GHz with spatial capacity of 55 kbpspm2 (spare parts). Unfortunately, 802.11a is non-compliant with 802.11b but 802.11g is compliant with both (.11a and b).
In the past couple decades, several companies have engaged in commercializing UWB. As implied by its name, UWB spans several gigahertz of spectrum at low power levels below the noise floor of existing signaling environment. Conventional narrow band technology relies on a base "carrier" wave modulated to embody a coded bit stream. Carrier waves are modified to incorporate digital data through amplitude, frequency or phase shift key modulation. These mechanisms are, therefore, susceptible to
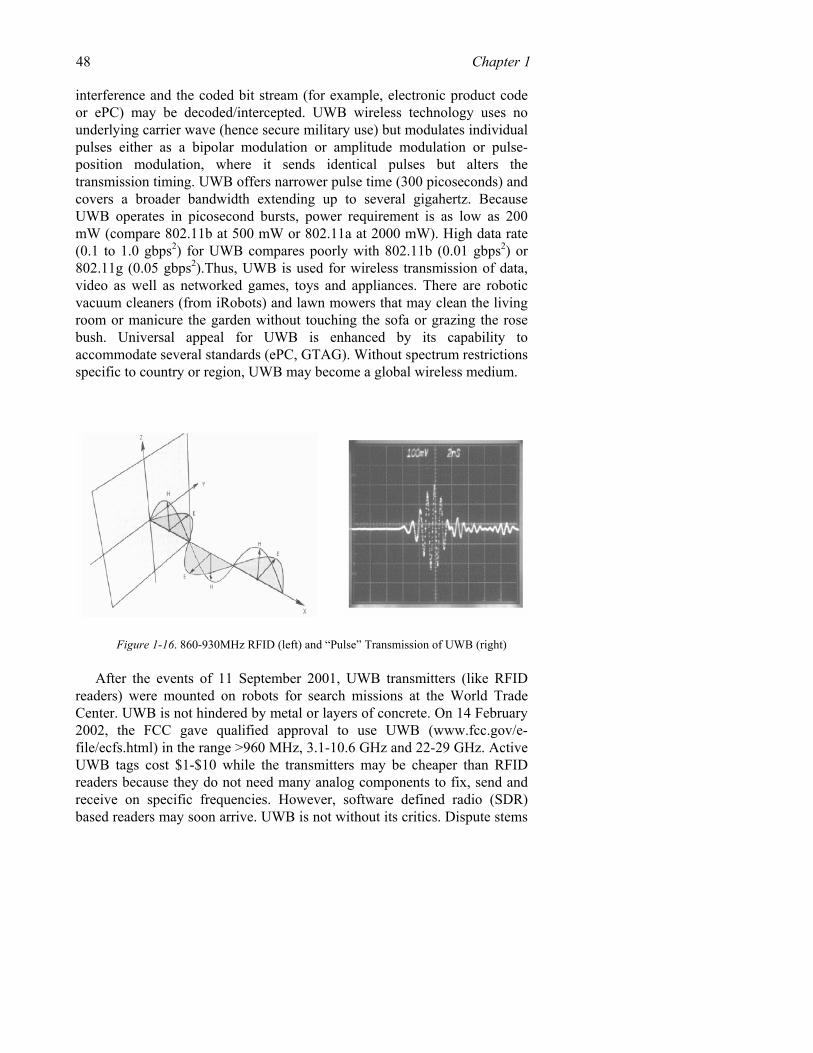
48 Chapter 1 interference and the coded bit stream (for example, electronic product code or ePC) may be decoded/intercepted. UWB wireless technology uses no underlying carrier wave (hence secure military use) but modulates individual pulses either as a bipolar modulation or amplitude modulation or pulse-position modulation, where it sends identical pulses but alters the transmission timing. UWB offers narrower pulse time (300 picoseconds) and covers a broader bandwidth extending up to several gigahertz. Because UWB operates in picosecond bursts, power requirement is as low as 200 mW (compare 802.11b at 500 mW or 802.11a at 2000 mW). High data rate (0.1 to 1.0 gbps2) for UWB compares poorly with 802.11b (0.01 gbps2) or 802.11g (0.05 gbps2).Thus, UWB is used for wireless transmission of data, video as well as networked games, toys and appliances. There are robotic vacuum cleaners (from iRobots) and lawn mowers that may clean the living room or manicure the garden without touching the sofa or grazing the rose bush. Universal appeal for UWB is enhanced by its capability to accommodate several standards (ePC, GTAG). Without spectrum restrictions specific to country or region, UWB may become a global wireless medium.
Figure 1-16. 860-930MHz RFID (left) and “Pulse” Transmission of UWB (right) After the events of 11 September 2001, UWB transmitters (like RFID
readers) were mounted on robots for search missions at the World Trade Center. UWB is not hindered by metal or layers of concrete. On 14 February 2002, the FCC gave qualified approval to use UWB (www.fcc.gov/e-file/ecfs.html) in the range >960 MHz, 3.1-10.6 GHz and 22-29 GHz. Active UWB tags cost $1-$10 while the transmitters may be cheaper than RFID readers because they do not need many analog components to fix, send and receive on specific frequencies. However, software defined radio (SDR) based readers may soon arrive. UWB is not without its critics. Dispute stems
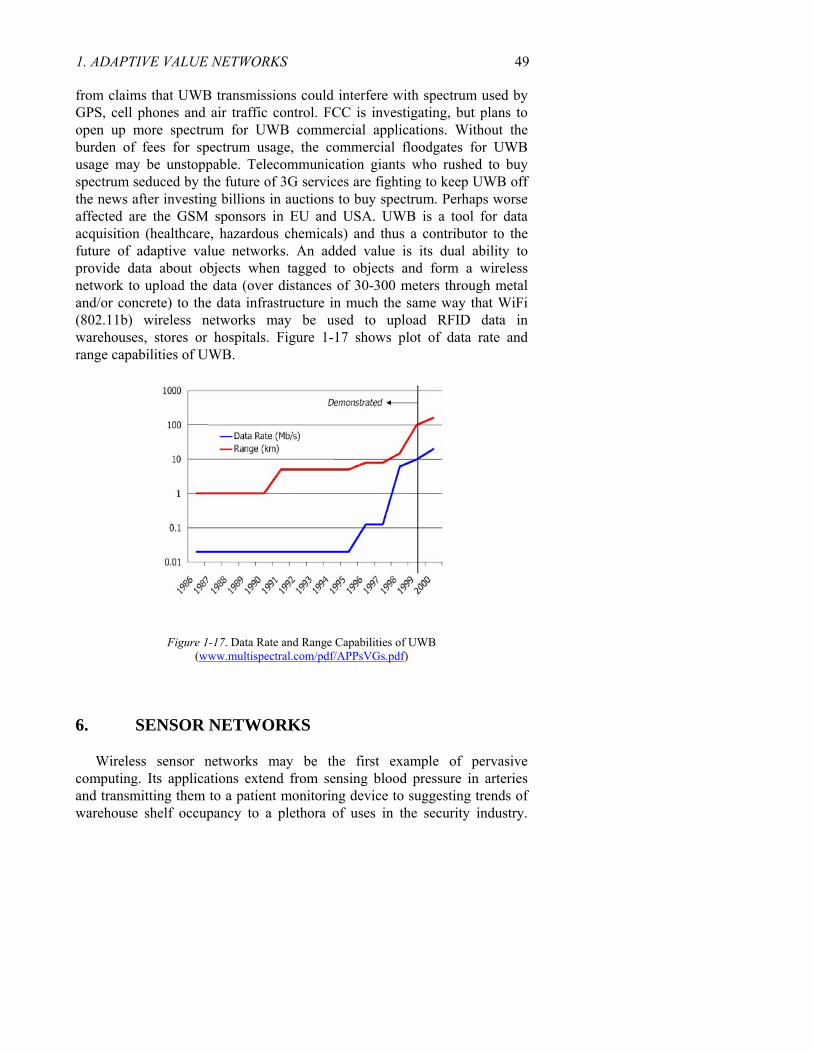
1. ADAPTIVE VALUE NETWORKS 49 from claims that UWB transmissions could interfere with spectrum used by GPS, cell phones and air traffic control. FCC is investigating, but plans to open up more spectrum for UWB commercial applications. Without the burden of fees for spectrum usage, the commercial floodgates for UWB usage may be unstoppable. Telecommunication giants who rushed to buy spectrum seduced by the future of 3G services are fighting to keep UWB off the news after investing billions in auctions to buy spectrum. Perhaps worse affected are the GSM sponsors in EU and USA. UWB is a tool for data acquisition (healthcare, hazardous chemicals) and thus a contributor to the future of adaptive value networks. An added value is its dual ability to provide data about objects when tagged to objects and form a wireless network to upload the data (over distances of 30-300 meters through metal and/or concrete) to the data infrastructure in much the same way that WiFi (802.11b) wireless networks may be used to upload RFID data in warehouses, stores or hospitals. Figure 1-17 shows plot of data rate and range capabilities of UWB.
Figure 1-17. Data Rate and Range Capabilities of UWB (www.multispectral.com/pdf/APPsVGs.pdf)
6. SENSOR NETWORKS
Wireless sensor networks may be the first example of pervasive computing. Its applications extend from sensing blood pressure in arteries and transmitting them to a patient monitoring device to suggesting trends of warehouse shelf occupancy to a plethora of uses in the security industry.
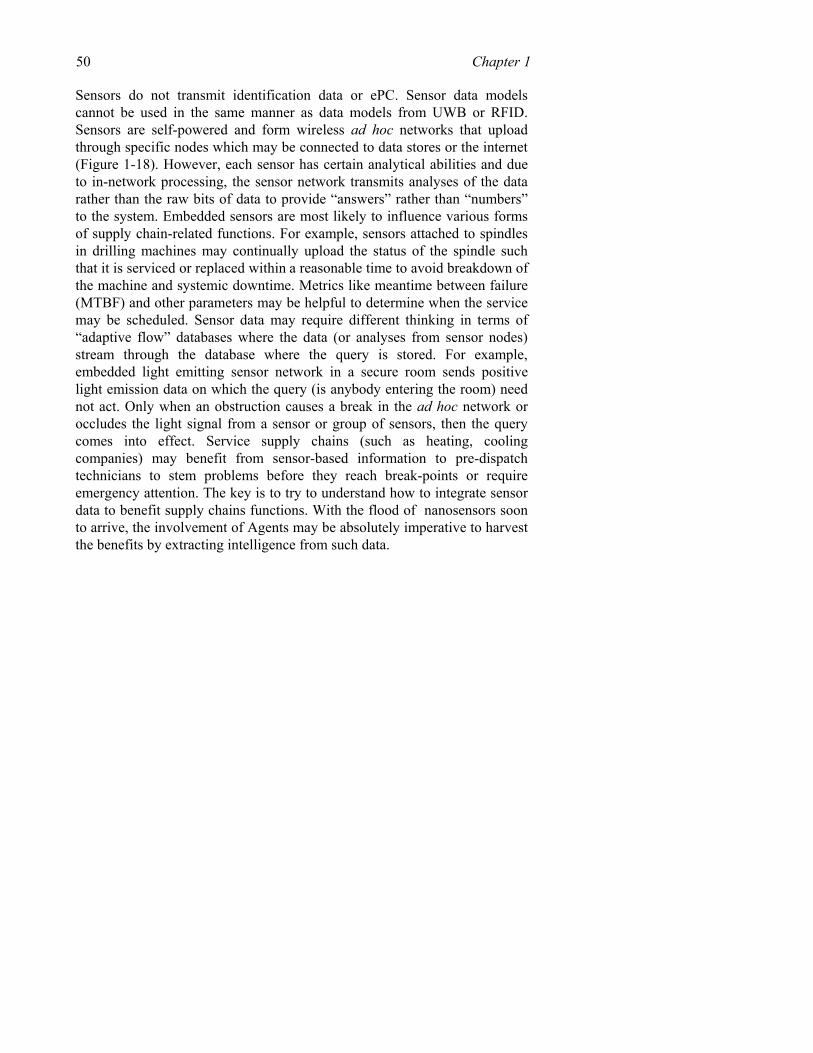
50 Chapter 1 Sensors do not transmit identification data or ePC. Sensor data models cannot be used in the same manner as data models from UWB or RFID. Sensors are self-powered and form wireless ad hoc networks that upload through specific nodes which may be connected to data stores or the internet (Figure 1-18). However, each sensor has certain analytical abilities and due to in-network processing, the sensor network transmits analyses of the data rather than the raw bits of data to provide “answers” rather than “numbers” to the system. Embedded sensors are most likely to influence various forms of supply chain-related functions. For example, sensors attached to spindles in drilling machines may continually upload the status of the spindle such that it is serviced or replaced within a reasonable time to avoid breakdown of the machine and systemic downtime. Metrics like meantime between failure (MTBF) and other parameters may be helpful to determine when the service may be scheduled. Sensor data may require different thinking in terms of “adaptive flow” databases where the data (or analyses from sensor nodes) stream through the database where the query is stored. For example, embedded light emitting sensor network in a secure room sends positive light emission data on which the query (is anybody entering the room) need not act. Only when an obstruction causes a break in the ad hoc network or occludes the light signal from a sensor or group of sensors, then the query comes into effect. Service supply chains (such as heating, cooling companies) may benefit from sensor-based information to pre-dispatch technicians to stem problems before they reach break-points or require emergency attention. The key is to try to understand how to integrate sensor data to benefit supply chains functions. With the flood of nanosensors soon to arrive, the involvement of Agents may be absolutely imperative to harvest the benefits by extracting intelligence from such data.
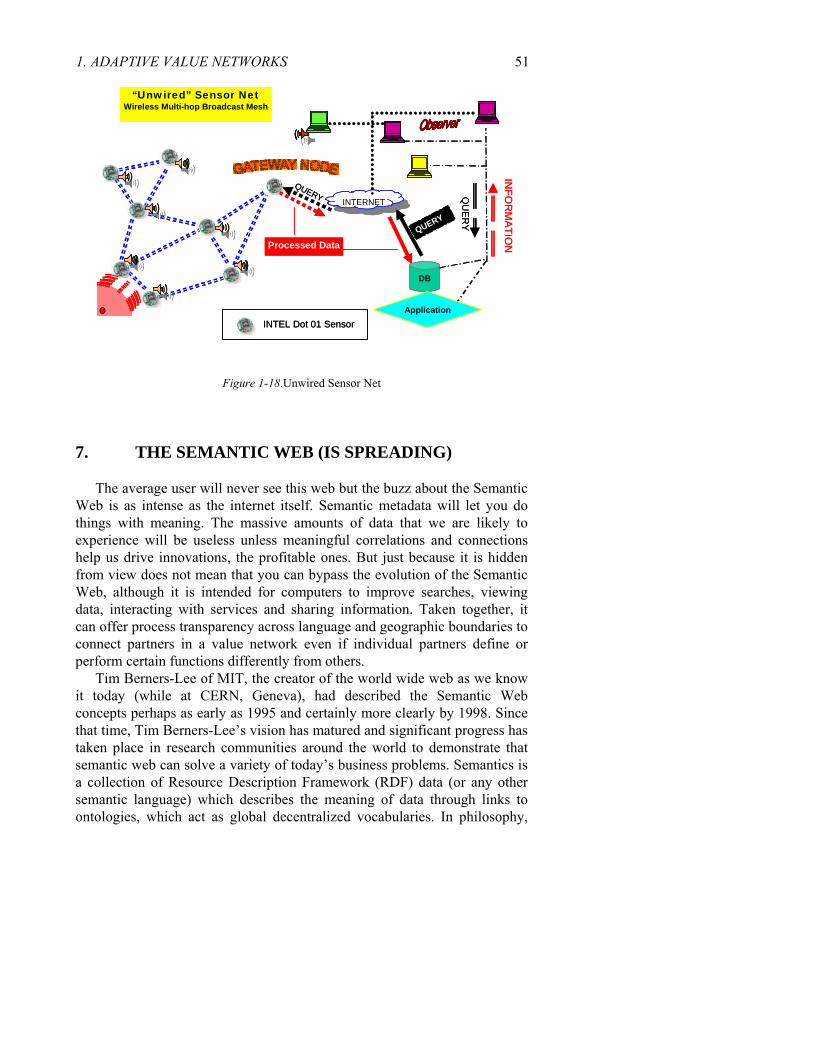
1. ADAPTIVE VALUE NETWORKS 51
INTERNETINTERNET
DB
Processed DataQUERY
“Unwired” Sensor NetWireless Multi-hop Broadcast Mesh
ApplicationIN
FOR
MATIO
N
QUERY QU
ER
Y
INTEL Dot 01 Sensor
INTERNETINTERNET
DB
Processed DataQUERY
“Unwired” Sensor NetWireless Multi-hop Broadcast Mesh
ApplicationIN
FOR
MATIO
N
QUERY QU
ER
Y
INTEL Dot 01 Sensor
Figure 1-18.Unwired Sensor Net
7. THE SEMANTIC WEB (IS SPREADING)
The average user will never see this web but the buzz about the Semantic Web is as intense as the internet itself. Semantic metadata will let you do things with meaning. The massive amounts of data that we are likely to experience will be useless unless meaningful correlations and connections help us drive innovations, the profitable ones. But just because it is hidden from view does not mean that you can bypass the evolution of the Semantic Web, although it is intended for computers to improve searches, viewing data, interacting with services and sharing information. Taken together, it can offer process transparency across language and geographic boundaries to connect partners in a value network even if individual partners define or perform certain functions differently from others.
Tim Berners-Lee of MIT, the creator of the world wide web as we know it today (while at CERN, Geneva), had described the Semantic Web concepts perhaps as early as 1995 and certainly more clearly by 1998. Since that time, Tim Berners-Lee’s vision has matured and significant progress has taken place in research communities around the world to demonstrate that semantic web can solve a variety of today’s business problems. Semantics is a collection of Resource Description Framework (RDF) data (or any other semantic language) which describes the meaning of data through links to ontologies, which act as global decentralized vocabularies. In philosophy,

52 Chapter 1 ontology is a theory about the nature of existence (of what types of things exist). Ontology as a discipline studies such theories. Artificial intelligence and semantic web researchers have co-opted the term to indicate a document or file that formally defines the relations among terms. Computers, empowered with this metadata, will be far more “meaningful” in their understanding of the data without human intervention provided data is in machine readable format.
Michael Dertouzos of MIT and James Hendler of the University of Maryland have authored books and articles which are excellent resources to understanding the concepts of semantic web (Dertouzos 2002). Human language thrives when using the same term to mean somewhat different things, but automation does not. The authors provide this example: Imagine that I hire a clown messenger to deliver balloons to my customers on their birthdays. Unfortunately, the service transfers the addresses from my database to its database, not knowing that the "addresses" in mine are where bills are sent and that many of them are post office boxes. My hired clowns end up entertaining a number of postal workers, not necessarily a bad thing, but certainly not the intention. An address that is a mailing address can be distinguished from one that is a street address and both can be distinguished from an address that is a speech, with the tools from the Semantic Web.
This is not the end of the story, because two databases may use different identifiers for what is, in fact, the same concept, such as zip code. A program that wants to compare or combine information across the two databases has to know that these two terms are being used to mean the same thing. Ideally, the program needs to discover such common meanings for whatever databases it encounters. For example, an address may be defined as a type of location and city codes may be defined to apply only to locations. Classes, subclasses and relations among entities are a very powerful tool for web use. We can express a large number of relations among entities by assigning properties to classes and allowing subclasses to inherit such properties. If city codes must be of type city and cities generally have web sites, we can discuss the web site associated with a city code even if no database links a city code directly to a web site.
Inference rules in ontologies supply further power. Ontology may express the rule "if a city code is associated with a state code, and an address uses that city code, then that address has the associated state code." A program could then readily deduce, for instance, that a Cornell University address, being in Ithaca, must be in New York State, which is in the US and therefore should be formatted to US standards. The computer doesn't truly "understand" any of this information, but it can now manipulate the terms much more effectively in ways that are useful and meaningful to the human user.

1. ADAPTIVE VALUE NETWORKS 53
The real power of the Semantic Web will be realized when Agents collect web content from diverse sources (stock quotes from Bloomberg), process the information (in relation to your business) and exchange the results with other programs or data (demographic data from the US Census Bureau). The effectiveness of such Agents will increase exponentially as more machine-readable web content and automated information services (such as, real time-data) become available. The Semantic Web promotes the synergy between Agents that were not expressly designed to work together but can now transfer data among themselves if data comes with semantics (which levels the playing field in terms of the meaning of data, such as, your purchase order is the supplier’s sales order).
With ontology pages on the Web, solutions to terminology (and other) problems begin to emerge. The meaning of terms or XML codes used on a web page can be defined by pointers from the page to ontology. Of course, the same problems as before now arise if you point to an ontology that defines addresses as containing a zip code and one that uses postal code. This kind of confusion can be resolved if ontologies (or other web services) provide equivalence relations: one or both of our ontologies may contain the information that a zip code is equivalent to a postal code.
The scheme for sending in the clowns to entertain customers is partially solved when the two databases point to different definitions of address. The program, using distinct URIs (universal resource indicators) for different concepts of address, will not confuse them and in fact will need to discover that the concepts are related at all. The program could then use a service that takes a list of postal addresses (defined in the first ontology) and converts it into a list of physical addresses (the second ontology) by recognizing and removing post office boxes and other unsuitable addresses. The structure and semantics provided by ontologies makes it easier to provide such a service and can make its use completely transparent.
Ontologies can enhance the functioning of the web in many ways. They can be used in a simple fashion to improve the accuracy of web searches. Advanced applications will use ontologies to relate the information on a page to the associated knowledge structures and inference rules. An example of a page marked up for such use is www.cs.umd.edu/~hendler. If you send your Web browser to that page, you will see the normal web page entitled "Dr. James A. Hendler." As a human, you can readily find the link to a short biographical note and read there that James Hendler received his PhD from Brown University. A computer program trying to find such information, however, would have to be very complex to guess that this information might be in a biography and to understand the English.
For computers, the page is linked to an ontology page that defines information about computer science departments. For instance, professors

54 Chapter 1 work at universities and they generally have doctorates. Further markup on the page (not displayed by the typical web browser) uses the ontology's concepts to specify that James Hendler received his PhD from the entity described at the URI http://www.brown.edu (the web page for Brown University in Rhode Island). Computers can also find that James Hendler is a member of a particular research project, has a particular e-mail address. All that information is readily processed by a computer and may be used to answer queries (where did Dr. Hendler receive his degree?) that currently would require a human to sift through the content turned up by a search engine.
In addition, this markup makes it much easier to develop programs that can tackle complicated questions whose answers do not reside on a single Web page. Suppose you wish to find the Miss Cook you met at a trade conference last year. You do not remember her first name, but you remember that she worked for one of your clients and that her son was a student at your alma mater. An intelligent search program can sift through all the pages of people whose name is "Cook" (sidestepping all the pages relating to cooks, cooking, the Cook Islands and so forth), find the ones that mention working for a company that's on your list of clients and follow links to Web pages of their children to track down if any are in school at the right place.
An important facet of (Agent) functioning will be exchange of "proofs" written in the Semantic Web's unifying language using rules and information such as those specified by ontologies. For example, suppose Miss Cook's contact information was located by an online service which places her in Johannesburg. Naturally, you want to check this, so your computer asks the service for a proof of its answer, which it promptly provides by translating its internal reasoning into the Semantic Web's unifying language. An inference engine in your computer readily verifies that this Miss Cook indeed matches the one you were seeking and it can show you the relevant Web pages if you still have doubts. Although they are still far from plumbing the depths of the Semantic Web's potential, some programs can already exchange proofs in this way, using the preliminary versions of the unifying language. Figure 1-20 shows Tim Berners-Lee’s Semantic Web layers.
1. ADAPTIVE VALUE NETWORKS 55
Figure 1-20. Semantic Web layers (http://www.csail.mit.edu/research/abstracts/abstracts03/web/02berners-lee.pdf)
Many automated web services already exist commercially without
semantics and their claims may be doubtful. Even if these services had Agents, at present Agents have no way to locate a service that will perform a specific function. This process, called service discovery, can happen only when there is a common language to describe a service in a way that lets other Agents "understand" both the function offered and how to take advantage of it. Services and Agents can advertise their function by, for example, depositing such descriptions in directories analogous to the Yellow Pages. Some low-level service-discovery schemes are currently available, such as Microsoft's Universal Plug and Play, which focuses on connecting different types of devices. Sun Microsystems's Jini aims to connect services. These initiatives, however, attack the problem at a structural or syntactic level and rely heavily on standardization of a predetermined set of functionality descriptions. Standardization can only go so far because we cannot anticipate all possible future needs.
The Semantic Web, in contrast, is more flexible. The consumer and producer Agents can reach a shared understanding by exchanging ontologies, which provide the vocabulary needed for discussion. Agents can even "bootstrap" (learn) new reasoning capabilities when they discover new ontologies. Semantics also makes it easier to take advantage of a service that only partially matches a request. A typical process will involve the creation of a "value chain" in which sub-assemblies of information are passed from one Agent to another, each one "adding value" to construct the final product requested by the end user. To create complicated value chains automatically on demand, Agents will increasingly exploit more and more artificial

56 Chapter 1 intelligence technologies in addition to the Semantic Web. But the Semantic Web will provide the foundations and the framework to make such technologies more feasible.
8. CONCLUSION
Scientists use models to represent the basic nature of the universe. Businesses use models to optimize profits, products and services. Models may even predict future action. But, as ubiquitous as models are, they are, for the most part, isolated from one another. In other words, a model from one domain, such as weather forecasting, does not interact with another, such as purchasing or customer behavior. Can we harness the power of multiple individual data models into larger aggregates? What if we could make predictions based on not a few parameters in an equation based model but billions of diverse facts and functions that Agent based models might be able to accommodate? The latter may result in an unprecedented increase in productivity through the optimal use of resources, ability to adapt and prepare for change according to prediction. We may dramatically reduce the cost of goods and services through the elimination of inefficiencies.
To build these models, individually and then test them in combinations may be a worthy endeavor for generations of engineering and business students, supported by businesses. However, the business community may wish to embrace the key elements (tools and technologies) mentioned in this paper and seek ways to bring about the convergence, repeatedly mentioned throughout this article. Principles from Game Theory empowered by real-time data from automatic id technologies may enhance your profit optimization. Reducing information asymmetry with partners in your value chain through secure Agents-based systems may exponentially eliminate inefficiencies. Deriving more meaning from data through the Semantic Web will allow you to enhance inter-operability between diverse environments of the partners in a value network. Convergence will determine, in part, the pace of your ability to adapt.
Translating convergence to create a merger between bits and atoms is an evolution and is underway. The ability to use it in your business processes to innovate or invent is only limited by your imagination. You cannot visualize the future if your imagination is out of focus.
1. ADAPTIVE VALUE NETWORKS 57
The payoff from information technology is in making transactions and
processes more effective and efficient, it’s not about creating a new economy or creating new models of industry. It is about taking a tool, powerful tool, and saying, “How can I make my supply chain more effective and efficient?” (Lou Gerstner, CEO, IBM, The New York Times, 10 March 2002).
ACKNOWLEDGEMENTS
For discussions, information and material in this article, the author wishes to gratefully acknowledge the contributors and help from:
Benson Adams, US Army David Brock, MIT Gerard Cachon, University of Pennsylvania Nicole DeHoratius, University of Chicago H. van Dyke Parunak, Altarum Charles Fine, MIT Gerry Frizelle, University of Cambridge Neil Gershenfeld, MIT Henry Lieberman, MIT Grace Lin, IBM Serguei Netessine, University of Pennsylvania Ozalp Ozer, Stanford University Greg Parlier, University of Alabama Ananth Raman, Harvard Business School Sanjay Sarma, MIT David Simchi-Levi, MIT Katia Sycara, Carnegie-Mellon University Artificial Intelligence Laboratory, MIT Support for the MIT Forum for Supply Chain Innovation provided by: General Electric General Motors Intel Corporation Michelin Corporation MIT School of Engineering MIT Sloan School of Management SAP

58 Chapter 1
Timogen Systems Inc US Department of Defense Xerox Corporation
The physicist Leo Szilard once announced to his friend Hans Bethe that he was thinking of keeping a diary: “I don’t intend to publish. I am merely going to record the facts for the information of God.” “Don’t you think God knows the facts?” Bethe asked. “Yes,” said Szilard. “He knows the facts, but He does not know this version of the facts.”
Hans Christian von Baeyer in Taming the Atom

1. ADAPTIVE VALUE NETWORKS 59
APPENDIX
CLUES FOR BUSINESS PROCESS RELATED INNOVATION TO USHER IN ADAPTIVE SCM:
This article deals with the ideas and concepts that may converge for the future of adaptive value networks. Often the key question is where to get started. We have made the point that process is the key and technology is a catalyst. Here are some clues with respect to processes that may offer room for innovation (Simchi-Levi et al, 2002).
Table 1-3. What’s Good for Your Business: Optimize or adapt?
Optimize? Adapt? Global Optimization Managing Uncertainty
Distribution to Customer Assignment Distribution Logistics Strategies Distribution Network Configuration Production-Distribution Schedule Inventory Control by SKU and Nodes Vendor Managed Inventory Supply Contracts Outsourcing & Procurement Strategic Partnerships Product Design and Differentiation Plant-Product Assignment Customer Value/Profitability Decision Support Systems Information Technology
Table 1-4. SCM Models and Parameters SCM : Model Simple, Think Complex Paradigm or Parameters Deterministic analytical models Variables are known and specified Stochastic analytical models At least one variable is unknown and follows a
probability distribution Economic models Game Theory models of buyer-supplier Cost-based simulation CBS for material Order quantities, response times, cost data CBS of production control Lot size, lead time, material response time CBS of finished goods stockpile EOQ, demand data, production lead times CBS of distribution Ordering policies, transportation time
requirements, demand & cost data, fill rate Model sources of uncertainty (with certainty theory, Bayesian updating, fuzzy sets):
– Customer demand (Bullwhip Effect or “Hog-Cycle” Effect); – Supply deliveries; – External markets.
Quick Wins from Logistics Network Configuration:
– Storage at manufacturing plants (raw material, WIP, finished goods);

60 Chapter 1 – Pick, load, ship to warehouse or DC; – Unload and store at warehouse or DC; – Pick, load and ship for delivery to next node (customer);
Savings may be possible from analytical optimization of (Table 1-5): Table 1-5. Process and Impact of Real Time Data
Process Impact of Real-Time Data Value from RFID Dock receiving capabilities Storage capabilities Receiving methodologies Order-generation capabilities
Delivery time constraints Pricing and Promotions Merchandising requirements
Data Collection based on model:
– Group products and/or product families (demand per product per customer); – Group accounts by customer value and/or geography (zone) plus delivery frequency; – Product shipment mapped by source warehouse vs. customer/zone; – Demand by SKU per product (family) per zone; – Production capacity (annual) at each plant; – SKU storage capacity in warehouses (BOM for delayed differentiation products); – Transportation mode, rates (TL/LTL by SKU) and cost (product/mile) between nodes; – Service level (observed vs. expected vs. promised vs. industry best); – Inventory carrying cost for safety stock to reach service level; – Delivery time by customer/zone (map locations vs. transportation distances); – Order processing cost (labor) and fixed operating cost (by nodes); – Return and warranties (service cost); – Wastage and shrinkage (costs).
Estimate/quantify time lag between processes (consider total system benefit):
– point of origin of data/information and data upload/update/accessibility; – systems visibility of data from any single point of contact; – data/information usage in systems (disruption management delay); – information application/use to improve (adapt) decision support system (DSS).
One Outcome: Industry “clockspeed” vs. “lag” may suggest process innovations for real-time adaptive
SCM. Quick Wins from Inventory Management (Raw Material, WIP, Finished Product) The source of system-wide savings forecast can be based on near-actual customer demand
or “pull” strategies, such as buy-back or revenue-sharing contracts. Inventory carrying cost is
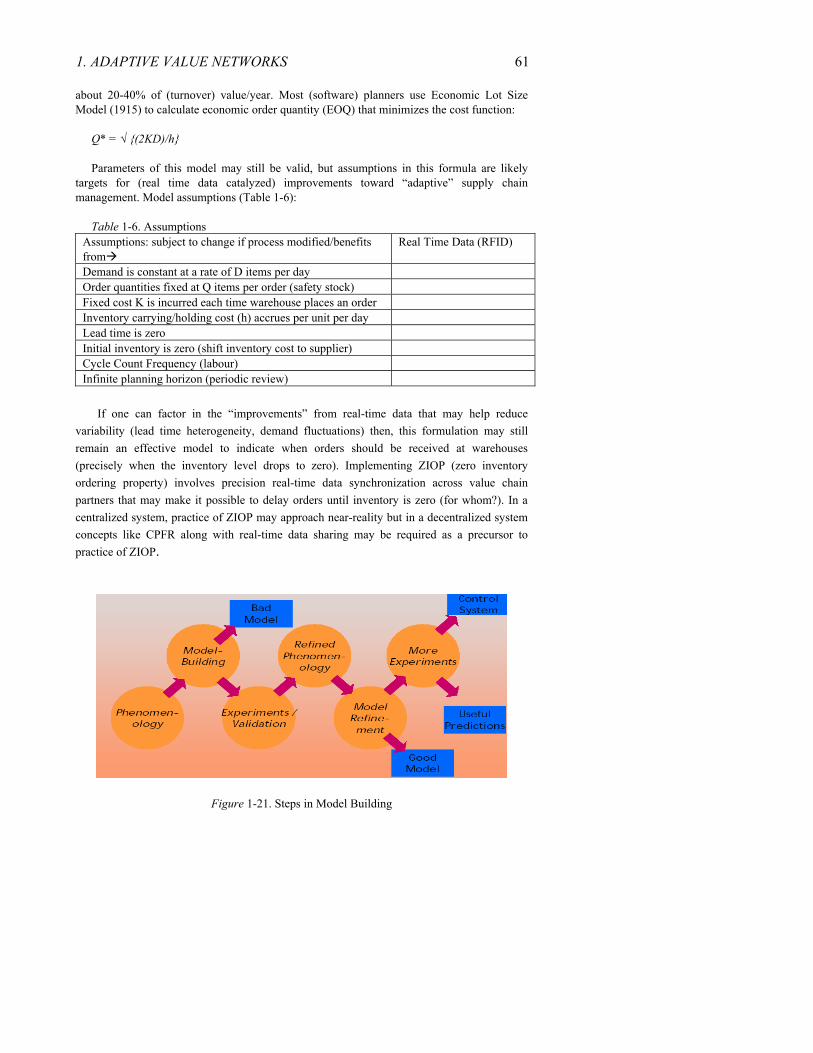
1. ADAPTIVE VALUE NETWORKS 61 about 20-40% of (turnover) value/year. Most (software) planners use Economic Lot Size Model (1915) to calculate economic order quantity (EOQ) that minimizes the cost function:
Q* = √ {(2KD)/h} Parameters of this model may still be valid, but assumptions in this formula are likely
targets for (real time data catalyzed) improvements toward “adaptive” supply chain management. Model assumptions (Table 1-6):
Table 1-6. Assumptions
Assumptions: subject to change if process modified/benefits from
Real Time Data (RFID)
Demand is constant at a rate of D items per day Order quantities fixed at Q items per order (safety stock) Fixed cost K is incurred each time warehouse places an order Inventory carrying/holding cost (h) accrues per unit per day Lead time is zero Initial inventory is zero (shift inventory cost to supplier) Cycle Count Frequency (labour) Infinite planning horizon (periodic review)
If one can factor in the “improvements” from real-time data that may help reduce
variability (lead time heterogeneity, demand fluctuations) then, this formulation may still remain an effective model to indicate when orders should be received at warehouses (precisely when the inventory level drops to zero). Implementing ZIOP (zero inventory ordering property) involves precision real-time data synchronization across value chain partners that may make it possible to delay orders until inventory is zero (for whom?). In a centralized system, practice of ZIOP may approach near-reality but in a decentralized system concepts like CPFR along with real-time data sharing may be required as a precursor to practice of ZIOP.
Figure 1-21. Steps in Model Building

62 Chapter 1
Traditional SCOR Model based on “Push” System: Is it still relevant for your need? (Table 1-7)
Table 1-7. Perspectives, Metrics and Measures
Perspectives Metrics Measure Real-Time Data
On-time delivery Percentage Order fulfillment lead time
Days
Fill Rate Percentage
Supply Chain Reliability
Perfect order fulfillment Percentage Supply chain response time
Days Flexibility & Responsiveness
Upside production flexibility
Days
SCM cost Percentage Warranty as % of revenue
Percentage Expenses
Value added per employee
USD/EUR
Total inventory days of supply
Days
Cash-to-cash cycle time Days
Asset / Utilization
Net asset turns Turns
(One solution fits all?) SCM Software: Can it help with strategic effects? Top Line Revenue Growth:
– Reduced time from concept to production; – Minimize engineering change orders after production release; – Increased rate of innovation; – Better on-time delivery (fewer canceled orders; fewer late penalties); – Higher quality (fewer returns).
Reduced Requirements for Working Capital
– Raw material, WIP and finished goods inventory; – Inventory obsolescence;
Higher Return on Fixed Assets Higher Margins
– Lower shipping cost; – Lower manufacturing costs; – Lower wastage; – Improved product mix; – Reduced inventory carrying cost.
Above measures/metrics may be driven by the following applications:
1. ADAPTIVE VALUE NETWORKS 63 – Collaborative Product Design; – Collaborative Planning and Forecasting; – Optimized Manufacturing Planning; – Inventory Planning and Optimization; – Synchronized Planning; – Detailed Scheduling; – Accurate Order Promising; – Optimized Transportation Routing.
Strategic “quick wins” categories likely to benefit from real-time information/data (RFID):
– Reduced requirements for working capital; – Higher margins;
NOTES
1. Information Asymmetry is a concept borrowed from economics. In 1776, in The Wealth of Nations, Adam Smith put forward the idea that markets by themselves lead to efficient outcomes. The mathematical proof specifying the conditions under which it was true, was provided in 1954 by Gerard Debreu (Nobel Prize 1983) of the University of California at Berkeley and Kenneth Arrow (Nobel Prize 1972) of Stanford University (Arrow, K. and G. Debreu (Existence of an equilibrium for a competitive economy. Econometrica 3 265–290). However, the latter result showing that when information is imperfect (information asymmetry) or markets are incomplete, competitive equilibrium is not efficient is due to B. Greenwald and J. Stiglitz in 1986 (Globalization and Its Discontents by Joseph E. Stiglitz).
2. Value Networks refers to concepts by Clayton Christensen (Harvard Business School) which builds on the concepts of Giovanni Dosi and Richard Rosenbloom (The Innovator’s Dilemma, 1997, Harvard Business School Press). We may often use supply chain management and value networks interchangeably.
3. It is beyond the scope of this chapter to delve into even a moderate level of discussion of Operations Research and Game Theory. Our intent is to offer some simple descriptions and indications about the possibilities of Game Theory applications in SCM. Game Theory applications, per se, are unlikely to make SCM more adaptive but these models can help the current processes by providing deeper insights. It is not uncommon to find businesses that are severely under-optimized in their current SCM practices. In such cases, it is speculative whether real-time information or efforts to be adaptive will meet with success. Optimization, including game theoretic tools, may be necessary to “tune the engine” before adaptive SCM can offer value.
4. Prisoner’s Dilemma was authored by A. W. Tucker of Princeton University [PhD advisor of John Nash]. Al Tucker was on leave at Stanford in the Spring of 1950 and, because of the shortage of offices, he was housed in the Psychology Department. One day a psychologist knocked on his door and asked what he was doing. Tucker replied: “I’m working on game theory,” and the psychologist asked if he would give a seminar on his work. For that seminar, Al Tucker authored the Prisoner’s Dilemma.
(www.nobel.se/economics/laureates/1994/nash-lecture.pdf)
64 Chapter 1
REFERENCES
1. Albeniz, V. and Simchi-Levi, D. Competition in the Supply Option Market. Working paper, MIT, 2003
2. Anupindi, R. Bassok Y. and Zemel. E. A General Framework for the Study of Decentralized Distribution Systems. Manufacturing and Service Operations Management 2001; 3: 349-368
3. Aumann, R., Acceptable points in general cooperative n-person games. Volume IV, Contributions to the Theory of Games. Princeton University Press, 1959.
4. Cachon, G. P. and Netessine, S., “Game Theory in Supply Chain Analysis.” to appear In Supply Chain Analysis in the eBusiness Era, Simchi-Levi, D., Wu D., and Shen, Z., to be published by Kluwer Academic Publisher, 2003.
5. Christensen, C., The Innovators Dilemma: When New Technologies Cause Great Firms to Fail, Chapter 8, 168-169, 2000
6. Cohen, M, Ho, T. Ren J., Terwiesch, C., Measuring imputed cost in the semiconductor equipment supply chain, Working Papers, Operations and Information Management Department, the Wharton School, University of Pennsylvania, 2003
7. DeHoratius, N.(2003), First Measure, Then Manage, Capital Ideas, 4: 1: summer, 2002. Retrieved October 2003 from:
http://gsbwww.uchicago.edu/news/capideas/summer02/measuremanage.html 8. Dertouzos, M., The Unfinished Revolution, Harper Collins, 2002. 9. Gell-Mann, M., The Quark and The Jaguar, by W. H. Freeman and Company, New York,
1994. 10. Heinrich, C. and Betts, B., Adapt or Die: Transforming Your Supply Chain into an
Adaptive Business Network. John Wiley and Sons, 2003 11. Forrester, J., Industrial Dynamics, MIT Press, 1961. 12. Joshi, Y. V. Information visibility and its effect on supply chain dynamics MS.c. Thesis,
MIT, 2000. 13. Kuhn, H. W. “Extensive games and the problem of information”. In Contributions to the
Theory of Games II, Kuhn, H.W. and Tucker, A. W. ed, Princeton: Princeton University Press, pp. 193-216, 1953.
14. Lee, H., Padmanabhan, P., and Whang, S. The bullwhip effect in supply chains. Sloan Management Review 1997; 38: 93-102
15. Nash, J. F., Equilibrium points in N-Person Games, Proceedings of NAS, 1950. 16.Negroponte, N., Less Is More: Interface Agents as Digital Butlers, Wired Columns, Issue
2.06 June 1994, Retrieved October 2003 from: http://web.media.mit.edu/~nicholas/Wired/WIRED2-06.html, WIRED Ventures Ltd,
1994. 17. Neumann, J. V., and Morgenstern, O., Theory of Games and Economic Behavior,
Princeton: Princeton University Press, 1947. 18. Norman Poire, Retrieved October 2003 from : http://www.smalltimes.com/document_display.cfm?document_id=2141 19. Parunak, H., ”Go to the Ant”: Engineering Principles from Natural Multi-Agent Systems,
Annals of Operations Research, 1997;75: 69-101. 20.Parunak, H., Savit, R., Riolo, R. Agent-Based Modeling versus Equation-Based Modeling
in the Proceedings of Multi-agent systems and Agent-based Simulation, 1998 21. Sarma, S., Brock. D., The Internet of Things, White paper, Auto-ID center. MIT, 1998. 22. Scanlon, L., Behind Bars, Technology Review, April 2003, Retrieved April 2003 from: http://ww.technologyreview.com
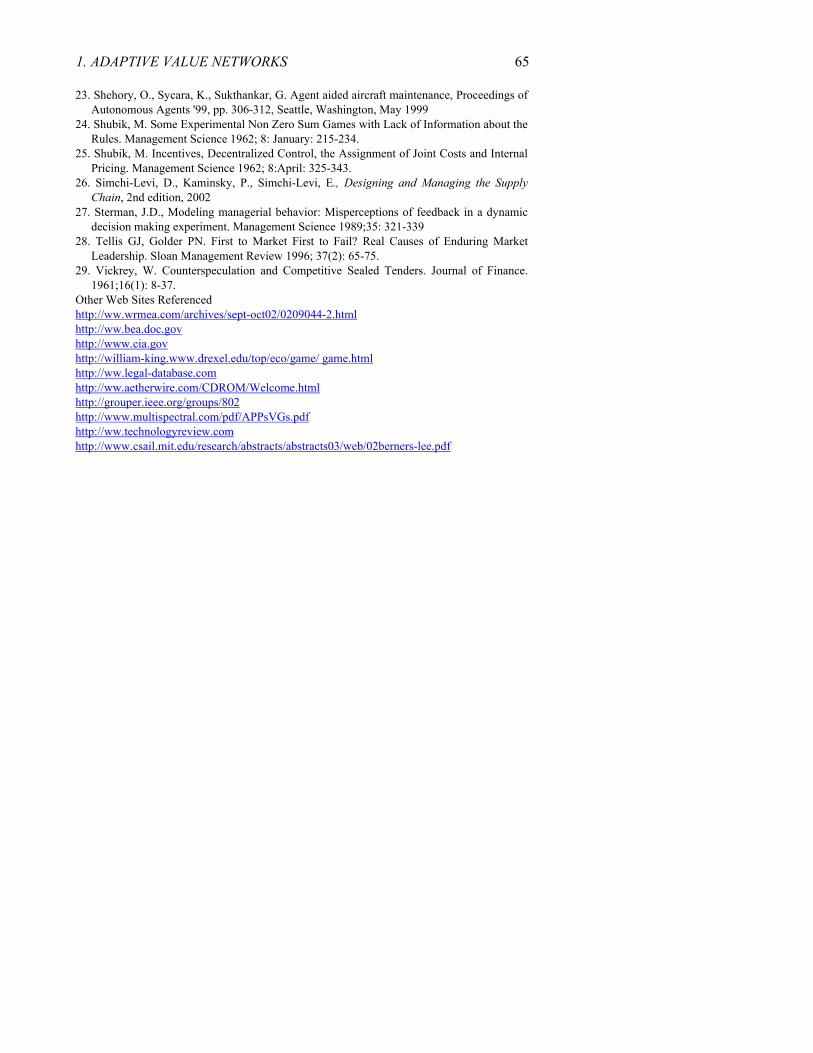
1. ADAPTIVE VALUE NETWORKS 65 23. Shehory, O., Sycara, K., Sukthankar, G. Agent aided aircraft maintenance, Proceedings of
Autonomous Agents '99, pp. 306-312, Seattle, Washington, May 1999 24. Shubik, M. Some Experimental Non Zero Sum Games with Lack of Information about the
Rules. Management Science 1962; 8: January: 215-234. 25. Shubik, M. Incentives, Decentralized Control, the Assignment of Joint Costs and Internal
Pricing. Management Science 1962; 8:April: 325-343. 26. Simchi-Levi, D., Kaminsky, P., Simchi-Levi, E., Designing and Managing the Supply
Chain, 2nd edition, 2002 27. Sterman, J.D., Modeling managerial behavior: Misperceptions of feedback in a dynamic
decision making experiment. Management Science 1989;35: 321-339 28. Tellis GJ, Golder PN. First to Market First to Fail? Real Causes of Enduring Market
Leadership. Sloan Management Review 1996; 37(2): 65-75. 29. Vickrey, W. Counterspeculation and Competitive Sealed Tenders. Journal of Finance.
1961;16(1): 8-37. Other Web Sites Referenced http://ww.wrmea.com/archives/sept-oct02/0209044-2.html http://ww.bea.doc.gov http://www.cia.gov http://william-king.www.drexel.edu/top/eco/game/ game.html http://ww.legal-database.com http://ww.aetherwire.com/CDROM/Welcome.html http://grouper.ieee.org/groups/802 http://www.multispectral.com/pdf/APPsVGs.pdf http://ww.technologyreview.com http://www.csail.mit.edu/research/abstracts/abstracts03/web/02berners-lee.pdf