Embed Size (px)
Citation preview
106 MASSACHUSETTS 2007 CENSUS OF AGRICULTURE - STATE DATA USDA, National Agricultural Statistics Service
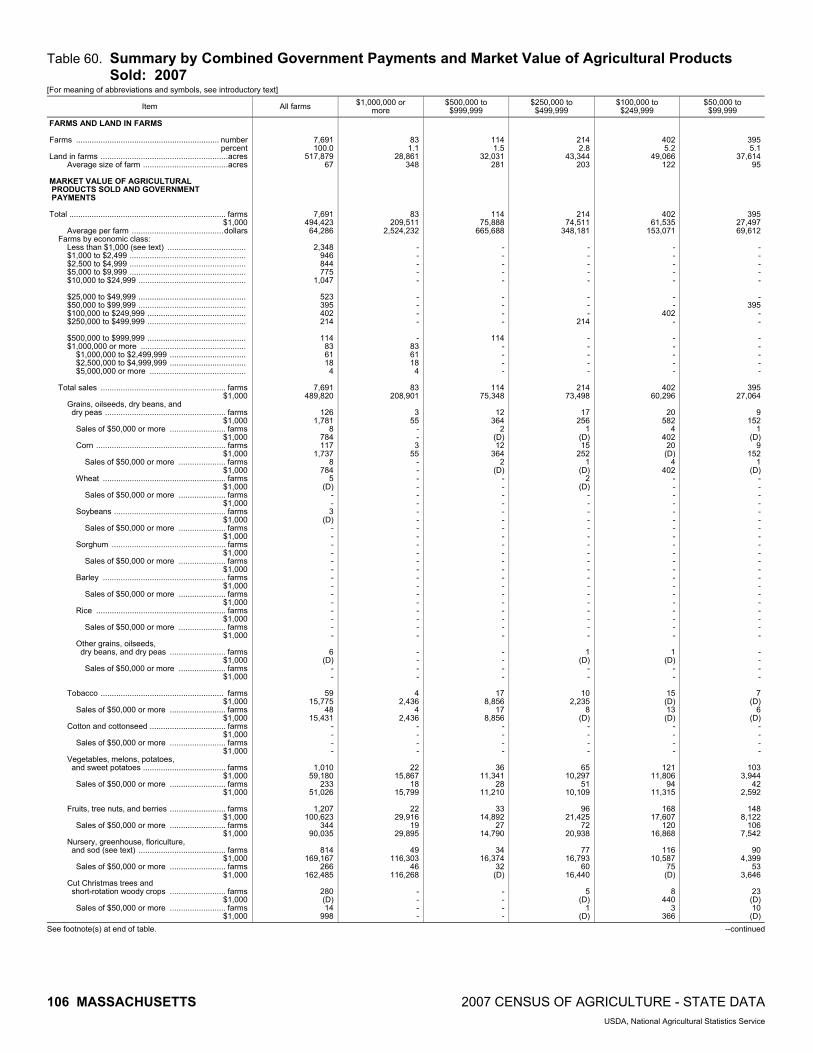
Table 60. Summary by Combined Government Payments and Market Value of Agricultural Products Sold: 2007
[For meaning of abbreviations and symbols, see introductory text]
Item All farms $1,000,000 or more
$500,000 to $999,999
$250,000 to $499,999
$100,000 to $249,999
$50,000 to $99,999
FARMS AND LAND IN FARMS Farms ................................................................ number percent Land in farms .........................................................acres Average size of farm ......................................acres MARKET VALUE OF AGRICULTURAL PRODUCTS SOLD AND GOVERNMENT PAYMENTS Total ...................................................................... farms $1,000 Average per farm .........................................dollars Farms by economic class: Less than $1,000 (see text) ................................... $1,000 to $2,499 .................................................... $2,500 to $4,999 .................................................... $5,000 to $9,999 .................................................... $10,000 to $24,999 ................................................ $25,000 to $49,999 ................................................ $50,000 to $99,999 ................................................ $100,000 to $249,999 ............................................ $250,000 to $499,999 ............................................ $500,000 to $999,999 ............................................ $1,000,000 or more ............................................... $1,000,000 to $2,499,999 .................................. $2,500,000 to $4,999,999 .................................. $5,000,000 or more ........................................... Total sales ........................................................ farms $1,000 Grains, oilseeds, dry beans, and dry peas ...................................................... farms $1,000 Sales of $50,000 or more ......................... farms $1,000 Corn .......................................................... farms $1,000 Sales of $50,000 or more ..................... farms $1,000 Wheat ....................................................... farms $1,000 Sales of $50,000 or more ..................... farms $1,000 Soybeans .................................................. farms $1,000 Sales of $50,000 or more ..................... farms $1,000 Sorghum ................................................... farms $1,000 Sales of $50,000 or more ..................... farms $1,000 Barley ....................................................... farms $1,000 Sales of $50,000 or more ..................... farms $1,000 Rice .......................................................... farms $1,000 Sales of $50,000 or more ..................... farms $1,000 Other grains, oilseeds, dry beans, and dry peas ......................... farms $1,000 Sales of $50,000 or more ..................... farms $1,000 Tobacco ....................................................... farms $1,000 Sales of $50,000 or more ......................... farms $1,000 Cotton and cottonseed .................................. farms $1,000 Sales of $50,000 or more ......................... farms $1,000 Vegetables, melons, potatoes, and sweet potatoes ..................................... farms $1,000 Sales of $50,000 or more ......................... farms $1,000 Fruits, tree nuts, and berries ......................... farms $1,000 Sales of $50,000 or more ......................... farms $1,000 Nursery, greenhouse, floriculture, and sod (see text) ....................................... farms $1,000 Sales of $50,000 or more ......................... farms $1,000 Cut Christmas trees and short-rotation woody crops ......................... farms $1,000 Sales of $50,000 or more ......................... farms $1,000
7,691 100.0
517,879 67
7,691 494,423 64,286
2,348
946 844 775
1,047
523 395 402 214
114
83 61 18
4
7,691 489,820
126
1,781 8
784 117
1,737 8
784 5
(D)- - 3
(D)- - - - - - - - - - - - - -
6 (D)
- -
59 15,775
48 15,431
- - - -
1,010 59,180
233 51,026
1,207
100,623 344
90,035
814 169,167
266 162,485
280 (D)14
998
83 1.1
28,861 348
83 209,511
2,524,232
-----
----
-83 61 18
4
83 208,901
355
--3
55 ----------------------
----
42,436
42,436
----
22 15,867
18 15,799
22 29,916
19 29,895
49 116,303
46 116,268
----
114 1.5
32,031 281
114 75,888
665,688
- - - - -
- - - -
114 - - - -
114 75,348
12
364 2
(D)12
364 2
(D)- - - - - - - - - - - - - - - - - - - -
- - - -
17 8,856
17 8,856
- - - -
36 11,341
28 11,210
33
14,892 27
14,790
34 16,374
32 (D)
- - - -
214 2.8
43,344 203
214 74,511
348,181
- - - - -
- - -
214
- - - - -
214 73,498
17
256 1
(D) 15
252 1
(D) 2
(D) - - - - - - - - - - - - - - - - - -
1 (D)
- -
10 2,235
8 (D)
- - - -
65 10,297
51 10,109
96
21,425 72
20,938
77 16,793
60 16,440
5
(D) 1
(D)
402 5.2
49,066 122
402 61,535
153,071
- - - - -
- -
402 -
- - - - -
402 60,296
20
582 4
402 20 (D)
4 402
- - - - - - - - - - - - - - - - - - - -
1 (D)
- -
15 (D)13 (D)
- - - -
121 11,806
94 11,315
168
17,607 120
16,868
116 10,587
75 (D)
8
440 3
366
395 5.1
37,614 95
395 27,497 69,612
- - - - -
- 395
- -
- - - - -
395 27,064
9
152 1
(D)9
152 1
(D)- - - - - - - - - - - - - - - - - - - -
- - - -
7 (D)
6 (D)
- - - -
103 3,944
42 2,592
148
8,122 106
7,542
90 4,399
53 3,646
23 (D)10 (D)
See footnote(s) at end of table. --continued

2007 CENSUS OF AGRICULTURE - STATE DATA MASSACHUSETTS 107 USDA, National Agricultural Statistics Service
Table 60. Summary by Combined Government Payments and Market Value of Agricultural Products Sold: 2007 - Con.
[For meaning of abbreviations and symbols, see introductory text]
Item $25,000 to $49,999
$10,000 to $24,999
$5,000 to $9,999
$2,500 to $4,999
$1,000 to $2,499
Less than $1,000
FARMS AND LAND IN FARMS Farms .................................................................number percent Land in farms ........................................................ acres Average size of farm ..................................... acres MARKET VALUE OF AGRICULTURAL PRODUCTS SOLD AND GOVERNMENT PAYMENTS Total ......................................................................farms $1,000 Average per farm ........................................ dollars Farms by economic class: Less than $1,000 (see text) .................................... $1,000 to $2,499 .................................................... $2,500 to $4,999 .................................................... $5,000 to $9,999 .................................................... $10,000 to $24,999 ................................................ $25,000 to $49,999 ................................................ $50,000 to $99,999 ................................................ $100,000 to $249,999 ............................................ $250,000 to $499,999 ............................................ $500,000 to $999,999 ............................................ $1,000,000 or more ................................................ $1,000,000 to $2,499,999 .................................. $2,500,000 to $4,999,999 .................................. $5,000,000 or more ............................................ Total sales .........................................................farms $1,000 Grains, oilseeds, dry beans, and dry peas ......................................................farms $1,000 Sales of $50,000 or more ..........................farms $1,000 Corn ..........................................................farms $1,000 Sales of $50,000 or more ......................farms $1,000 Wheat ........................................................farms $1,000 Sales of $50,000 or more ......................farms $1,000 Soybeans ..................................................farms $1,000 Sales of $50,000 or more ......................farms $1,000 Sorghum ....................................................farms $1,000 Sales of $50,000 or more ......................farms $1,000 Barley ........................................................farms $1,000 Sales of $50,000 or more ......................farms $1,000 Rice ...........................................................farms $1,000 Sales of $50,000 or more ......................farms $1,000 Other grains, oilseeds, dry beans, and dry peas ..........................farms $1,000 Sales of $50,000 or more ......................farms $1,000 Tobacco ....................................................... farms $1,000 Sales of $50,000 or more ..........................farms $1,000 Cotton and cottonseed ..................................farms $1,000 Sales of $50,000 or more ..........................farms $1,000 Vegetables, melons, potatoes, and sweet potatoes .....................................farms $1,000 Sales of $50,000 or more ..........................farms $1,000 Fruits, tree nuts, and berries .........................farms $1,000 Sales of $50,000 or more ..........................farms $1,000 Nursery, greenhouse, floriculture, and sod (see text) ........................................farms $1,000 Sales of $50,000 or more ..........................farms $1,000 Cut Christmas trees and short-rotation woody crops ..........................farms $1,000 Sales of $50,000 or more ..........................farms $1,000
523 6.8
48,185 92
523 18,654 35,667
- - - - -
523 - - -
- - - - -
523 18,349
25 (D)
- -
23 213
- - 1
(D)- - 2
(D)- - - - - - - - - - - - - -
1 (D)
- -
2 (D)
- - - - - -
96 2,155
- -
167 4,747
- -
80 2,215
- -
25 632
- -
1,047 13.6
60,332 58
1,047 16,451 15,713
----
1,047
----
-----
1,047 16,206
19 113
--
18 (D)
------1
(D)--------------
1(D)
--
472
------
263 2,794
--
260 2,938
--
154 1,721
--
45 463
--
775 10.1
49,475 64
775 5,362 6,919
- - -
775 -
- - - -
- - - - -
775 (D)
9
(D)- - 8 8 - - - - - - - - - - - - - - - - - - - - - -
1 (D)
- -
- - - - - - - -
122 621
- -
140 655
- -
90 485
- -
45 225
- -
844 11.0
43,568 52
844 3,038 3,599
- -
844 - -
- - - -
- - - - -
844 2,984
6 7 - - 5
(D) - - - - - - - - - - - - - - - - - - - - - -
1 (D)
- -
- - - - - - - -
96 266
- -
79 217
- -
75 234
- -
45 121
- -
946 12.3
39,258 41
946 1,543 1,631
-
946 - - -
- - - -
- - - - -
946 1,517
4
(D)- - 4
(D)- - - - - - - - - - - - - - - - - - - - - -
- - - -
- - - - - - - -
65 79
- -
74 94
- -
36 47
- -
29 (D)
- -
2,348 30.5
86,145 37
2,348 433 184
2,348
- - - -
- - - -
- - - - -
2,348 (D)
2
(D)- - - - - - 2
(D)- - - - - - - - - - - - - - - - - -
- - - -
- - - - - - - -
21 10
- -
20 10
- -
13 8 - -
55 22
- -
See footnote(s) at end of table. --continued

108 MASSACHUSETTS 2007 CENSUS OF AGRICULTURE - STATE DATA USDA, National Agricultural Statistics Service
Table 60. Summary by Combined Government Payments and Market Value of Agricultural Products Sold: 2007 - Con.
[For meaning of abbreviations and symbols, see introductory text]
Item All farms $1,000,000 or more
$500,000 to $999,999
$250,000 to $499,999
$100,000 to $249,999
$50,000 to $99,999
MARKET VALUE OF AGRICULTURAL PRODUCTS SOLD AND GOVERNMENT PAYMENTS - Con. Total - Con. Total sales - Con. Other crops and hay (see text) ..................... farms $1,000 Sales of $50,000 or more ......................... farms $1,000 Cattle and calves .......................................... farms $1,000 Sales of $50,000 or more ......................... farms $1,000 Milk and other dairy products from cows ........................................................... farms $1,000 Sales of $50,000 or more ......................... farms $1,000 Hogs and pigs ............................................... farms $1,000 Sales of $50,000 or more ......................... farms $1,000 Sheep, goats, and their products .................. farms $1,000 Sales of $50,000 or more ......................... farms $1,000 Horses, ponies, mules, burros, and donkeys ...................................................... farms $1,000 Sales of $50,000 or more ......................... farms $1,000 Poultry and eggs ........................................... farms $1,000 Sales of $50,000 or more ......................... farms $1,000 Aquaculture (see text) ................................... farms $1,000 Sales of $50,000 or more ......................... farms $1,000 Other animals and other animal products (see text) ...................................... farms $1,000 Sales of $50,000 or more ......................... farms $1,000 Value of- Government payments ..................................... farms $1,000 Landlord's share of total sales (see text) ............................................... farms $1,000 Agricultural products sold directly to individuals for human consumption (see text) ................................... farms $1,000 FARM PRODUCTION EXPENSES Total farm production expenses ........................... farms $1,000 Average per farm .........................................dollars Fertilizer, lime, and soil conditioners purchased ................................... farms $1,000 Farms with expenses of- $1 to $4,999 ....................................................... $5,000 to $24,999 .............................................. $25,000 to $49,999 ............................................ $50,000 or more ................................................ Chemicals purchased ....................................... farms $1,000 Farms with expenses of- $1 to $4,999 ....................................................... $5,000 to $24,999 .............................................. $25,000 to $49,999 ............................................ $50,000 or more ................................................ Seeds, plants, vines, and trees ......................... farms $1,000 Farms with expenses of- $1 to $999 .......................................................... $1,000 to $4,999 ................................................ $5,000 to $24,999 .............................................. $25,000 to $49,999 ............................................ $50,000 or more ................................................
1,906 (D)45
3,597
1,066 12,444
50 6,548
310
50,485 148
48,488 350
2,108 8
1,207 697 (D)
6 678
348 5,703
25 3,277 1,269
13,207 22
11,635 273
18,548 62
15,795
449 (D)14 (D)
593 4,603
71 1,105
1,659 42,065
7,691 461,483 60,003
3,964 14,788
3,385
463 70 46
2,272
12,490
1,803 354
72 43
2,439
24,634
1,356 556 372
65 90
755
--
12 (D)
5738
9(D)
9(D)
32--1
(D)--
----5
8,678 3
(D)4
6,369 3
(D)
4(D)
3(D)
23 610
2(D)
15 7,730
83 148,408
1,788,053
72 3,929
13 18 16 25
71 4,074
15 21
728
61 11,098
22
15 11 31
22 (D)
2 (D)
34
2,785 12
2,209
28 16,423
28 16,423
4 (D)
1 (D)
5 (D)
4 (D)
2 (D)
- - 7
1,451 3
1,418 2
(D)2
(D)
3 (D)
1 (D)
38 540
- -
29 6,624
114 53,193
466,608
106 2,496
21 54 15 16
97
1,836
25 49 16
7
83 3,346
1
12 43 10 17
27 360
2 (D)
54
1,579 5
763
48 14,387
47 (D)
6 (D)
1 (D)
2 (D)
1 (D)
4 (D)
4 (D) 13
572 3
562 13
3,398 10
3,384
9 602
2 (D)
73 1,013
6 214
54 9,509
214 54,840
256,262
185 2,280
64 94 23
4
175 2,365
72 61 39
3
153 3,503
8
39 69 17 20
76 2,105
16 1,751
82
2,532 15
1,954
55 6,334
45 6,031
19 246
2 (D)19 (D)
- -
19 1,737
14 1,723
43 461
3 (D)28
3,481 24
3,451
17 629
4 579
110 1,238
16 343
119 9,135
402 49,071
122,066
326 1,957
191 122
12 1
312
1,908
188 114
8 2
237
2,911
35 86 90 12 14
81 2,135
25 1,599
75
1,635 13
883
36 (D)19 (D)34
292 4
(D)24
261 1
(D)
12 571
7 (D)61
818 10
623 25 (D)23 (D)
25 (D)
4 243
81 433
6 37
114 3,301
395 22,049 55,820
322 978
263
58 1 -
250 844
183
65 2 -
208 1,478
67 76 49 10
6See footnote(s) at end of table. --continued

2007 CENSUS OF AGRICULTURE - STATE DATA MASSACHUSETTS 109 USDA, National Agricultural Statistics Service
Table 60. Summary by Combined Government Payments and Market Value of Agricultural Products Sold: 2007 - Con.
[For meaning of abbreviations and symbols, see introductory text]
Item $25,000 to $49,999
$10,000 to $24,999
$5,000 to $9,999
$2,500 to $4,999
$1,000 to $2,499
Less than $1,000
MARKET VALUE OF AGRICULTURAL PRODUCTS SOLD AND GOVERNMENT PAYMENTS - Con. Total - Con. Total sales - Con. Other crops and hay (see text) ......................farms $1,000 Sales of $50,000 or more ..........................farms $1,000 Cattle and calves ...........................................farms $1,000 Sales of $50,000 or more ..........................farms $1,000 Milk and other dairy products from cows ............................................................farms $1,000 Sales of $50,000 or more ..........................farms $1,000 Hogs and pigs ...............................................farms $1,000 Sales of $50,000 or more ..........................farms $1,000 Sheep, goats, and their products ..................farms $1,000 Sales of $50,000 or more ..........................farms $1,000 Horses, ponies, mules, burros, and donkeys .......................................................farms $1,000 Sales of $50,000 or more ..........................farms $1,000 Poultry and eggs ...........................................farms $1,000 Sales of $50,000 or more ..........................farms $1,000 Aquaculture (see text) ...................................farms $1,000 Sales of $50,000 or more ..........................farms $1,000 Other animals and other animal products (see text) .......................................farms $1,000 Sales of $50,000 or more ..........................farms $1,000 Value of- Government payments ......................................farms $1,000 Landlord's share of total sales (see text) ................................................farms $1,000 Agricultural products sold directly to individuals for human consumption (see text) ....................................farms $1,000 FARM PRODUCTION EXPENSES Total farm production expenses ............................farms $1,000 Average per farm ........................................ dollars Fertilizer, lime, and soil conditioners purchased ...................................farms $1,000 Farms with expenses of- $1 to $4,999 ....................................................... $5,000 to $24,999 .............................................. $25,000 to $49,999 ............................................ $50,000 or more ................................................. Chemicals purchased ........................................farms $1,000 Farms with expenses of- $1 to $4,999 ....................................................... $5,000 to $24,999 .............................................. $25,000 to $49,999 ............................................ $50,000 or more ................................................. Seeds, plants, vines, and trees .........................farms $1,000 Farms with expenses of- $1 to $999 .......................................................... $1,000 to $4,999 ................................................ $5,000 to $24,999 .............................................. $25,000 to $49,999 ............................................ $50,000 or more .................................................
181 4,189
- -
70 817
- -
23 530
- -
16 (D)
- -
24 337
- -
21 570
- -
56 376
- -
35 1,264
- -
31 (D)
- -
70 305
15 94
126 2,027
523 17,753 33,944
365 836
310
54 1 -
236 747
209
24 - 3
242 762
116
87 35
4 -
339 3,270
--
161 936
--
41 428
--
71 282
--
119 518
--
78 1,037
--
169 262
--
68 1,024
--
84 345
--
84 246
9(D)
361 2,449
1,047 23,222 22,179
699 1,032
658 39
2-
342 350
332 10
--
493 738
327 124
42 --
276 1,386
- -
141 505
- -
34 163
- -
71 175
- -
79 (D)
- -
59 350
- -
133 (D)
- -
36 212
- -
45 91
- -
51 (D)
8 5
222 607
775 13,291 17,150
440 377
430
10 - -
237 120
234
3 - -
294 421
217
64 11
- 2
309 817
- -
167 434
- -
33 117
- -
68 81
- -
104 168
- -
64 184
- -
183 163
- -
35 106
- -
49 68
- -
35 54
5 2
208 386
844 11,742 13,912
415 282
410
5 - -
166 53
166
- - -
241 189
198
29 14
- -
329 450
- -
211 (D)
- -
3 2 - -
39 26
- -
125 116
- -
71 (D)
- -
232 (D)
- -
27 34
- -
80 78
- -
24 27
3 (Z)
230 245
946 10,864 11,484
370 199
366
4 - -
151 76
149
2 - -
186 95
168
15 2 1 -
259 128
- -
59 36
- -
- - - -
19 (D)
- -
195 (D)
- -
18 11
- -
367 132
- - - - - -
102 28
- -
4 (D)
1 (D)
181 53
2,348 57,051 24,298
664 420
659
5 - -
235 117
230
5 - -
241 91
217
22 2 - -
See footnote(s) at end of table. --continued

110 MASSACHUSETTS 2007 CENSUS OF AGRICULTURE - STATE DATA USDA, National Agricultural Statistics Service
Table 60. Summary by Combined Government Payments and Market Value of Agricultural Products Sold: 2007 - Con.
[For meaning of abbreviations and symbols, see introductory text]
Item All farms $1,000,000 or more
$500,000 to $999,999
$250,000 to $499,999
$100,000 to $249,999
$50,000 to $99,999
FARM PRODUCTION EXPENSES - Con. Total farm production expenses - Con. Livestock and poultry purchased or leased (see text) ............................................. farms $1,000 Farms with expenses of- $1 to $4,999 ....................................................... $5,000 to $24,999 .............................................. $25,000 to $99,999 ............................................ $100,000 to $249,999 ........................................ $250,000 or more .............................................. Breeding livestock purchased or leased (see text) ......................................... farms $1,000 Other livestock and poultry purchased or leased (see text) ................... farms $1,000 Feed purchased ................................................ farms $1,000 Farms with expenses of- $1 to $4,999 ....................................................... $5,000 to $24,999 .............................................. $25,000 to $99,999 ............................................ $100,000 to $249,999 ........................................ $250,000 or more .............................................. Gasoline, fuels, and oils .................................... farms $1,000 Farms with expenses of- $1 to $4,999 ....................................................... $5,000 to $24,999 .............................................. $25,000 to $49,999 ............................................ $50,000 or more ................................................ Utilities (see text) .............................................. farms $1,000 Farms with expenses of- $1 to $999 .......................................................... $1,000 to $4,999 ................................................ $5,000 to $24,999 .............................................. $25,000 to $49,999 ............................................ $50,000 or more ................................................ Supplies, repairs, and maintenance ................. farms $1,000 Farms with expenses of- $1 to $4,999 ....................................................... $5,000 to $24,999 .............................................. $25,000 to $49,999 ............................................ $50,000 or more ................................................ Hired farm labor ................................................ farms $1,000 Farms with expenses of- $1 to $4,999 ....................................................... $5,000 to $24,999 .............................................. $25,000 to $99,999 ............................................ $100,000 to $249,999 ........................................ $250,000 or more .............................................. Contract labor ................................................... farms $1,000 Farms with expenses of- $1 to $999 .......................................................... $1,000 to $4,999 ................................................ $5,000 to $24,999 .............................................. $25,000 to $49,999 ............................................ $50,000 or more ................................................ Customwork and custom hauling ...................... farms $1,000 Farms with expenses of- $1 to $999 .......................................................... $1,000 to $4,999 ................................................ $5,000 to $24,999 .............................................. $25,000 to $49,999 ............................................ $50,000 or more ................................................ Cash rent for land, buildings, and grazing fees ............................................. farms $1,000 Farms with expenses of- $1 to $4,999 ....................................................... $5,000 to $9,999 ................................................ $10,000 to $24,999 ............................................ $25,000 or more ................................................
1,450 5,819
1,240
161 40
8 1
556 1,776
1,064 4,043
3,821
45,134
2,290 1,193
262 64 12
7,382
31,070
6,215 970 107
90
4,027 16,599
1,936 1,388
598 70 35
6,754
46,053
5,078 1,310
225 141
1,972
118,224
688 525 502 163
94
801 12,889
175 275 220
77 54
623
6,698
235 221 130
17 20
1,136 10,138
798 112 123 103
9393
2331-
5134
7259
20 (D)
12269
83 8,468
713 13 50
75 4,607
-5
20 25 25
81 11,131
117 15 48
80 52,053
--7
10 63
32 4,030
2-74
19
15 3,397
--519
46 2,651
61
10 29
20 645
7 5 7 1 -
10 137
13
508
38 4,974
4 3 6
22 3
114
4,127
9 45 42 18
108
2,328
2 18 65 16
7
114 4,599
12 30 36 36
104
16,501
1 12 35 32 24
31 (D)
- 3
12 9 7
34
894
2 6
17 3 6
70 1,273
25
8 18 19
35 1,101
18
7 5 4 1
21 203
19
898
66 4,752
11
5 24 26
-
214 3,967
34
139 26 15
202
2,081
7 38
143 12
2
214 5,321
32
115 43 24
195
15,333
6 37 89 57
6
60 1,595
2 9
27 11 11
38
413
3 8
24 3 -
99 1,819
39 19 22 19
66 849
42 11 11
2 -
27 206
53
643
120 3,101
38 29 50
3 -
399 3,215
169 214
11 5
355
2,083
37 189 117
11 1
384
5,107
128 192
52 12
313
13,346
35 94
154 30
-
95 1,914
7
19 45 14 10
90
580
16 44 23
5 2
142 1,289
75 25 29 13
84 620
55 19 10
- -
27 216
65
403
120 1,333
53 55 12
- -
388 1,963
236 149
3 -
319 1,091
69
183 65
2 -
366 2,777
165 184
15 2
195
4,137
63 79 47
6 -
83 (D)
9
28 35 11
-
55 589
11 24 16
1 3
114 429
92 11
9 2
See footnote(s) at end of table. --continued

2007 CENSUS OF AGRICULTURE - STATE DATA MASSACHUSETTS 111 USDA, National Agricultural Statistics Service
Table 60. Summary by Combined Government Payments and Market Value of Agricultural Products Sold: 2007 - Con.
[For meaning of abbreviations and symbols, see introductory text]
Item $25,000 to $49,999
$10,000 to $24,999
$5,000 to $9,999
$2,500 to $4,999
$1,000 to $2,499
Less than $1,000
FARM PRODUCTION EXPENSES - Con. Total farm production expenses - Con. Livestock and poultry purchased or leased (see text) ..............................................farms $1,000 Farms with expenses of- $1 to $4,999 ....................................................... $5,000 to $24,999 .............................................. $25,000 to $99,999 ............................................ $100,000 to $249,999 ........................................ $250,000 or more ............................................... Breeding livestock purchased or leased (see text) ..........................................farms $1,000 Other livestock and poultry purchased or leased (see text) ....................farms $1,000 Feed purchased ................................................farms $1,000 Farms with expenses of- $1 to $4,999 ....................................................... $5,000 to $24,999 .............................................. $25,000 to $99,999 ............................................ $100,000 to $249,999 ........................................ $250,000 or more ............................................... Gasoline, fuels, and oils ....................................farms $1,000 Farms with expenses of- $1 to $4,999 ....................................................... $5,000 to $24,999 .............................................. $25,000 to $49,999 ............................................ $50,000 or more ................................................. Utilities (see text) ...............................................farms $1,000 Farms with expenses of- $1 to $999 .......................................................... $1,000 to $4,999 ................................................ $5,000 to $24,999 .............................................. $25,000 to $49,999 ............................................ $50,000 or more ................................................. Supplies, repairs, and maintenance ..................farms $1,000 Farms with expenses of- $1 to $4,999 ....................................................... $5,000 to $24,999 .............................................. $25,000 to $49,999 ............................................ $50,000 or more ................................................. Hired farm labor ................................................farms $1,000 Farms with expenses of- $1 to $4,999 ....................................................... $5,000 to $24,999 .............................................. $25,000 to $99,999 ............................................ $100,000 to $249,999 ........................................ $250,000 or more ............................................... Contract labor ....................................................farms $1,000 Farms with expenses of- $1 to $999 .......................................................... $1,000 to $4,999 ................................................ $5,000 to $24,999 .............................................. $25,000 to $49,999 ............................................ $50,000 or more ................................................. Customwork and custom hauling ......................farms $1,000 Farms with expenses of- $1 to $999 .......................................................... $1,000 to $4,999 ................................................ $5,000 to $24,999 .............................................. $25,000 to $49,999 ............................................ $50,000 or more ................................................. Cash rent for land, buildings, and grazing fees ..............................................farms $1,000 Farms with expenses of- $1 to $4,999 ....................................................... $5,000 to $9,999 ................................................ $10,000 to $24,999 ............................................ $25,000 or more .................................................
92 286
76 13
3 - -
36 81
63
205
138 1,023
85 45
8 - -
514 1,607
403 107
4 -
369 730
159 182
26 2 -
488 2,416
338 138
9 3
161
2,810
78 57 19
6 1
91
674
16 42 25
7 1
63
174
28 24
9 2 -
141 522
121
10 6 4
205 453
179 25
1--
101 221
151 232
407 2,376
269 120
18 --
1,031 1,809
944 86
1-
631 861
392 209
30 --
921 3,149
763 145
76
259 3,501
138 89 25
7-
110 457
25 60 24
-1
66 125
30 29
7--
171 944
146 9
10 6
171 230
161
10 - - -
66 108
121 122
337
1,570
237 91
9 - -
756 961
722
34 - -
421 357
316
99 6 - -
696 2,044
620
67 7 2
148
1,632
95 36 14
3 -
65 286
21 37
3 1 3
37 85
26
4 7 - -
93 348
84
2 2 5
212 251
199
13 - - -
78 85
155 166
416 (D)
297 106
13 - -
815 874
793
20 - 2
371 363
282
76 13
- -
742 1,275
694
46 2 -
113 1,864
74 15 22
2 -
39 (D)
18 15
2 4 -
44 57
26 16
2 - -
86 81
83
2 1 -
229 262
219
10 - - -
78 146
171 116
549
1,914
446 97
6 - -
888 706
875
13 - -
362 353
258
92 12
- -
814 1,546
743
66 5 -
94 790
69 11 14
- -
47 115
27 14
6 - -
48 34
31 17
- - -
55 130
47
4 3 1
327 730
282
45 - - -
107 238
246 492
1,610
13,917
849 640 114
7 -
2,180 3,373
2,023
150 7 -
814 1,745
414 297 101
2 -
1,934 6,688
1,582
310 34
8
310 6,257
129
95 76 10
-
148 1,181
48 48 34 16
2
133 349
62 49 20
2 -
119 652
80 21 13
5See footnote(s) at end of table. --continued

112 MASSACHUSETTS 2007 CENSUS OF AGRICULTURE - STATE DATA USDA, National Agricultural Statistics Service
Table 60. Summary by Combined Government Payments and Market Value of Agricultural Products Sold: 2007 - Con.
[For meaning of abbreviations and symbols, see introductory text]
Item All farms $1,000,000 or more
$500,000 to $999,999
$250,000 to $499,999
$100,000 to $249,999
$50,000 to $99,999
FARM PRODUCTION EXPENSES - Con. Total farm production expenses - Con. Rent and lease expenses for machinery, equipment, and farm share of vehicles ........... farms $1,000 Farms with expenses of- $1 to $999 .......................................................... $1,000 to $4,999 ................................................ $5,000 to $24,999 .............................................. $25,000 to $49,999 ............................................ $50,000 or more ................................................ Interest expense ............................................... farms $1,000 Farms with expenses of- $1 to $4,999 ....................................................... $5,000 to $24,999 .............................................. $25,000 to $99,999 ............................................ $100,000 or more .............................................. Secured by real estate .................................. farms $1,000 Farms with expenses of- $1 to $999 ...................................................... $1,000 to $4,999 ............................................ $5,000 to $24,999 .......................................... $25,000 to $49,999 ........................................ $50,000 or more ............................................ Not secured by real estate ............................ farms $1,000 Farms with expenses of- $1 to $999 ...................................................... $1,000 to $4,999 ............................................ $5,000 to $24,999 .......................................... $25,000 to $49,999 ........................................ $50,000 or more ............................................ Property taxes paid ........................................... farms $1,000 Farms with expenses of- $1 to $4,999 ....................................................... $5,000 to $9,999 ................................................ $10,000 to $24,999 ............................................ $25,000 or more ................................................ All other production expenses (see text) ........................................ farms $1,000 Farms with expenses of- $1 to $4,999 ....................................................... $5,000 to $24,999 .............................................. $25,000 to $49,999 ............................................ $50,000 to $99,999 ............................................ $100,000 or more .............................................. Production expenses paid by landlords 1 ........................................................... farms $1,000 Depreciation expenses claimed (see text) ............................................... farms $1,000 NET CASH FARM INCOME (SEE TEXT) Net cash farm income of operations (see text) ........................................... farms $1,000 Average per farm .........................................dollars Farms with net gains 2 ................................... number Average net gain ......................................dollars Gain of- Less than $1,000 ............................................... $1,000 to $4,999 ................................................ $5,000 to $9,999 ................................................ $10,000 to $24,999 ............................................ $25,000 to $49,999 ............................................ $50,000 or more ................................................ Farms with net losses .................................... number Average net loss ......................................dollars Loss of- Less than $1,000 ............................................... $1,000 to $4,999 ................................................ $5,000 to $9,999 ................................................ $10,000 to $24,999 ............................................ $25,000 to $49,999 ............................................ $50,000 or more ................................................
306 2,445
116
81 96
3 10
1,531
19,171
712 624 181
14
1,185 15,623
154 342 520
98 71
925
3,548
376 378 150
14 7
6,761
32,509
4,687 1,366
574 134
3,921 62,823
2,622
890 206 121
82
53 631
2,626 37,569
7,691 96,266 12,517
2,950
63,627
246 626 407 589 385 697
4,741
19,286
357 1,215 1,119 1,209
435 406
18 (D)
11727
55 2,492
921 16
9
36 1,780
3-
14 4
15
32 712
46
12 46
79 (D)
26 17 17 19
79 29,387
110
415 49
2(D)
63 7,862
83 65,326
787,062
75 924,474
-1-1-
73
8501,170
----17
23 384
4 7
10 - 2
58
1,435
12 30 13
3
38 955
1 1
24 5 7
31
480
5 9
12 4 1
106 (D)
36 29 31 10
112 5,764
16 37 16 26 17
2 (D)
92 3,782
114 26,033
228,360
94 302,316
1 1 1 1 3
87
20 119,235
- - 2 4 3
11
26 246
7 8
10 - 1
103
1,931
24 57 21
1
79 1,616
7
10 43
9 10
60
315
9 31 19
1 -
192 1,815
71 53 57 11
210 6,318
28 87 47 47
1
7 81
166 5,347
214 25,585
119,555
186 145,858
- 2 - 6
17 161
28
55,174
- 1 3 2
11 11
35 182
4
17 14
- -
161 1,756
71 76 13
1
116 1,407
5
41 56
9 5
98
349
21 55 22
- -
354 2,334
201
85 55 13
386 6,537
115 191
64 12
4
4 41
242 3,459
402 18,438 45,867
326
71,907
4 2
11 32 72
205
76 65,830
1 3 9
13 17 33
40 (D)
12 11 17
- -
145 1,199
78 58
9 -
112 1,012
17 38 48
8 1
81
187
30 40 11
- -
351 1,472
242
84 20
5
279 2,072
166 100
10 2 1
4 11
213 2,274
395 9,233
23,375
314 41,543
1 8
15 57
142 91
81
47,052
1 14
9 18 14 25
See footnote(s) at end of table. --continued
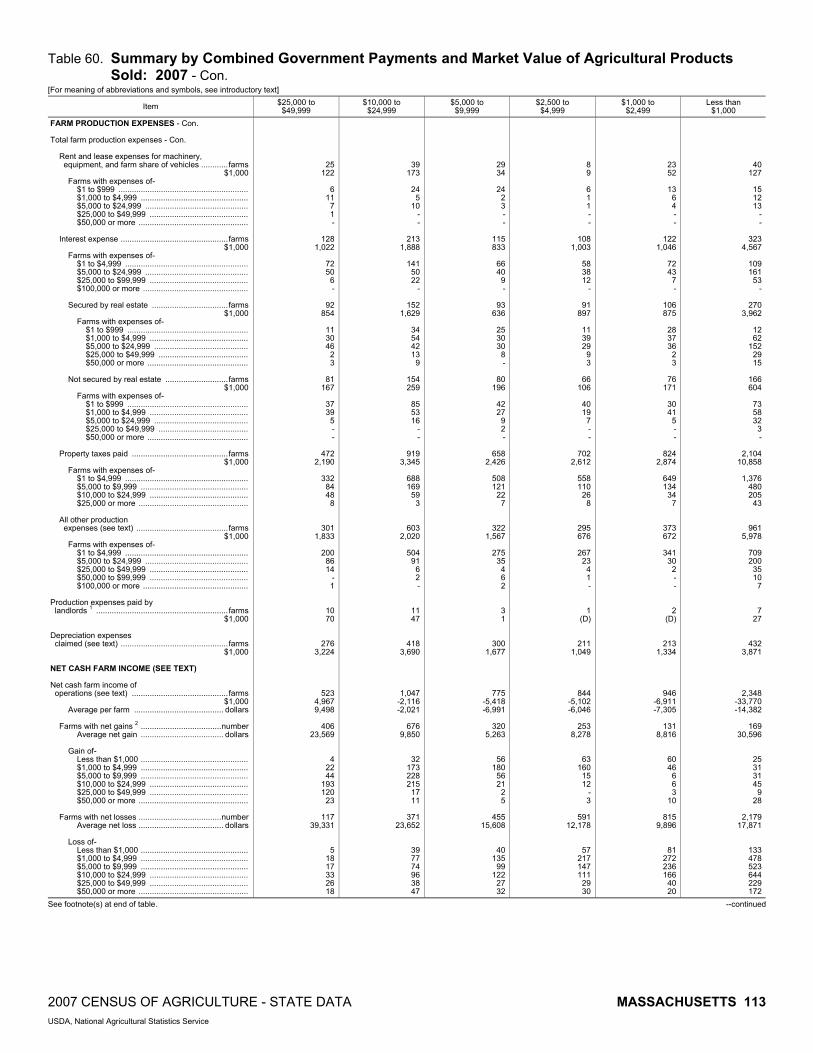
2007 CENSUS OF AGRICULTURE - STATE DATA MASSACHUSETTS 113 USDA, National Agricultural Statistics Service
Table 60. Summary by Combined Government Payments and Market Value of Agricultural Products Sold: 2007 - Con.
[For meaning of abbreviations and symbols, see introductory text]
Item $25,000 to $49,999
$10,000 to $24,999
$5,000 to $9,999
$2,500 to $4,999
$1,000 to $2,499
Less than $1,000
FARM PRODUCTION EXPENSES - Con. Total farm production expenses - Con. Rent and lease expenses for machinery, equipment, and farm share of vehicles ............farms $1,000 Farms with expenses of- $1 to $999 .......................................................... $1,000 to $4,999 ................................................ $5,000 to $24,999 .............................................. $25,000 to $49,999 ............................................ $50,000 or more ................................................. Interest expense ................................................farms $1,000 Farms with expenses of- $1 to $4,999 ....................................................... $5,000 to $24,999 .............................................. $25,000 to $99,999 ............................................ $100,000 or more ............................................... Secured by real estate ..................................farms $1,000 Farms with expenses of- $1 to $999 ...................................................... $1,000 to $4,999 ............................................ $5,000 to $24,999 .......................................... $25,000 to $49,999 ........................................ $50,000 or more ............................................. Not secured by real estate ............................farms $1,000 Farms with expenses of- $1 to $999 ...................................................... $1,000 to $4,999 ............................................ $5,000 to $24,999 .......................................... $25,000 to $49,999 ........................................ $50,000 or more ............................................. Property taxes paid ...........................................farms $1,000 Farms with expenses of- $1 to $4,999 ....................................................... $5,000 to $9,999 ................................................ $10,000 to $24,999 ............................................ $25,000 or more ................................................. All other production expenses (see text) .........................................farms $1,000 Farms with expenses of- $1 to $4,999 ....................................................... $5,000 to $24,999 .............................................. $25,000 to $49,999 ............................................ $50,000 to $99,999 ............................................ $100,000 or more ............................................... Production expenses paid by landlords 1 ...........................................................farms $1,000 Depreciation expenses claimed (see text) ................................................farms $1,000 NET CASH FARM INCOME (SEE TEXT) Net cash farm income of operations (see text) ...........................................farms $1,000 Average per farm ........................................ dollars Farms with net gains 2 ....................................number Average net gain ..................................... dollars Gain of- Less than $1,000 ................................................ $1,000 to $4,999 ................................................ $5,000 to $9,999 ................................................ $10,000 to $24,999 ............................................ $25,000 to $49,999 ............................................ $50,000 or more ................................................. Farms with net losses .....................................number Average net loss ...................................... dollars Loss of- Less than $1,000 ................................................ $1,000 to $4,999 ................................................ $5,000 to $9,999 ................................................ $10,000 to $24,999 ............................................ $25,000 to $49,999 ............................................ $50,000 or more .................................................
25 122
6
11 7 1 -
128 1,022
72 50
6 -
92 854
11 30 46
2 3
81
167
37 39
5 - -
472 2,190
332
84 48
8
301 1,833
200
86 14
- 1
10 70
276 3,224
523 4,967 9,498
406
23,569
4 22 44
193 120
23
117 39,331
5 18 17 33 26 18
39 173
24 5
10 --
213 1,888
141 50 22
-
152 1,629
34 54 42 13
9
154 259
85 53 16
--
919 3,345
688 169
59 3
603 2,020
504 91
62-
11 47
418 3,690
1,047 -2,116 -2,021
676 9,850
32 173 228 215
17 11
371 23,652
39 77 74 96 38 47
29 34
24
2 3 - -
115 833
66 40
9 -
93 636
25 30 30
8 -
80 196
42 27
9 2 -
658 2,426
508 121
22 7
322 1,567
275
35 4 6 2
3 1
300 1,677
775 -5,418 -6,991
320
5,263
56 180
56 21
2 5
455
15,608
40 135
99 122
27 32
8 9
6 1 1 - -
108 1,003
58 38 12
-
91 897
11 39 29
9 3
66
106
40 19
7 - -
702 2,612
558 110
26 8
295 676
267
23 4 1 -
1 (D)
211 1,049
844 -5,102 -6,046
253
8,278
63 160
15 12
- 3
591
12,178
57 217 147 111
29 30
23 52
13
6 4 - -
122 1,046
72 43
7 -
106 875
28 37 36
2 3
76
171
30 41
5 - -
824 2,874
649 134
34 7
373 672
341
30 2 - -
2 (D)
213 1,334
946 -6,911 -7,305
131
8,816
60 46
6 6 3
10
815 9,896
81 272 236 166
40 20
40 127
15 12 13
- -
323 4,567
109 161
53 -
270 3,962
12 62
152 29 15
166 604
73 58 32
3 -
2,104 10,858
1,376
480 205
43
961 5,978
709 200
35 10
7
7 27
432 3,871
2,348 -33,770 -14,382
169
30,596
25 31 31 45
9 28
2,179
17,871
133 478 523 644 229 172
See footnote(s) at end of table. --continued

114 MASSACHUSETTS 2007 CENSUS OF AGRICULTURE - STATE DATA USDA, National Agricultural Statistics Service
Table 60. Summary by Combined Government Payments and Market Value of Agricultural Products Sold: 2007 - Con.
[For meaning of abbreviations and symbols, see introductory text]
Item All farms $1,000,000 or more
$500,000 to $999,999
$250,000 to $499,999
$100,000 to $249,999
$50,000 to $99,999
NET CASH FARM INCOME (SEE TEXT) - Con. Net cash farm income of operators (see text) ............................................. farms $1,000 Average per farm .........................................dollars Operators reporting net gains 2 ......................... farms Average net gain ......................................dollars Gain of- Less than $1,000 ............................................... $1,000 to $4,999 ................................................ $5,000 to $9,999 ................................................ $10,000 to $24,999 ............................................ $25,000 to $49,999 ............................................ $50,000 or more ................................................ Operators reporting net losses ......................... farms Average net loss ......................................dollars Loss of- Less than $1,000 ............................................... $1,000 to $4,999 ................................................ $5,000 to $9,999 ................................................ $10,000 to $24,999 ............................................ $25,000 to $49,999 ............................................ $50,000 or more ................................................ COMMODITY CREDIT CORPORATION LOANS (SEE TEXT) Total ...................................................................... farms $1,000 INCOME FROM FARM-RELATED SOURCES Total income from farm-related sources, gross before taxes and expenses (see text) ................. farms $1,000 Customwork and other agricultural services .......................................................... farms $1,000 Gross cash rent or share payments .................. farms $1,000 Sales of forest products, excluding Christmas trees, short rotation woody crops, and maple products ............................. farms $1,000 Agri-tourism and recreational services (see text) ......................................................... farms $1,000 Patronage dividends and refunds from cooperatives ........................................... farms $1,000 Crop and livestock insurance payments received (see text) .......................... farms $1,000 Amount from state and local government agricultural program payments (see text) ......................................................... farms $1,000 Other farm-related income sources (see text) ........................................... farms $1,000 LAND USE Total cropland ....................................................... farms acres Harvested cropland ........................................... farms acres Farms by acres harvested: 1 to 49 acres ...................................................... 50 to 99 acres .................................................... 100 to 199 acres ................................................ 200 to 499 acres ................................................ 500 to 999 acres ................................................ 1,000 to 1,999 acres .......................................... 2,000 acres or more ........................................... Cropland- For pasture or grazing only ........................... farms acres On which all crops failed or were abandoned ......................................... farms acres Idle or used for cover crops or soil improvement, but not harvested and not pastured or grazed ................................ farms acres In cultivated summer fallow .......................... farms acres
7,691 95,807 12,457
2,947
63,560
249 625 402 591 384 696
4,744
19,288
357 1,215 1,120 1,212
432 408
4 342
2,087 63,327
318
3,677
246 902
482 2,401
154
5,306
407 9,534
89
1,423
115 1,951
766
38,133
5,508 187,406
4,792 153,993
3,956
466 241 113
14 2 -
1,184 16,219
264
2,452
812 13,305
167 1,437
83 64,981
782,898
75 919,865
-1-1-
73
8501,170
----17
--
34 4,223
599
1(D)
1(D)
5(D)
26 2,925
3(D)
4(D)
6(D)
75 17,307
74 15,716
30 5
13 18
62-
7291
6(D)
22 1,166
3(D)
114 26,343
231,079
95 302,072
1 1 1 1 3
88
19 123,887
- - 2 4 2
11
1 (D)
54 3,338
12
565
3 (D)
6 (D)
3
87
40 1,711
2
(D)
11 430
3
(D)
109 17,241
109 15,740
29 23 26 26
5 - -
10 622
8
(D)
24 683
3 (D)
214 25,452
118,933
185 146,078
- 2 - 6
17 160
29
54,236
- 1 3 4 9
12
1 (D)
90 5,914
16
1,147
6 15
18 118
12
876
45 2,322
11
401
23 479
13
556
197 19,515
194 17,351
79 53 36 25
1 - -
29 1,002
11
162
45 836
14 164
402 18,148 45,144
325
71,421
4 2
13 30 73
203
77 65,765
1 3 9
13 17 34
2 (D)
152 5,974
22
169
16 88
16 100
18
621
79 1,187
9
164
28 387
36
3,259
362 23,313
352 20,865
236
51 44 19
2 - -
53 1,126
28
239
61 900
23 183
395 9,208
23,311
313 41,593
1 8
13 60
139 92
82
46,472
2 14
9 18 14 25
- -
145 3,786
21
372
14 (D)
25 205
16
246
56 946
4
(D)
14 133
34
1,762
354 16,137
344 14,129
255
43 34 12
- - -
45 1,042
25
215
55 669
16 82
See footnote(s) at end of table. --continued
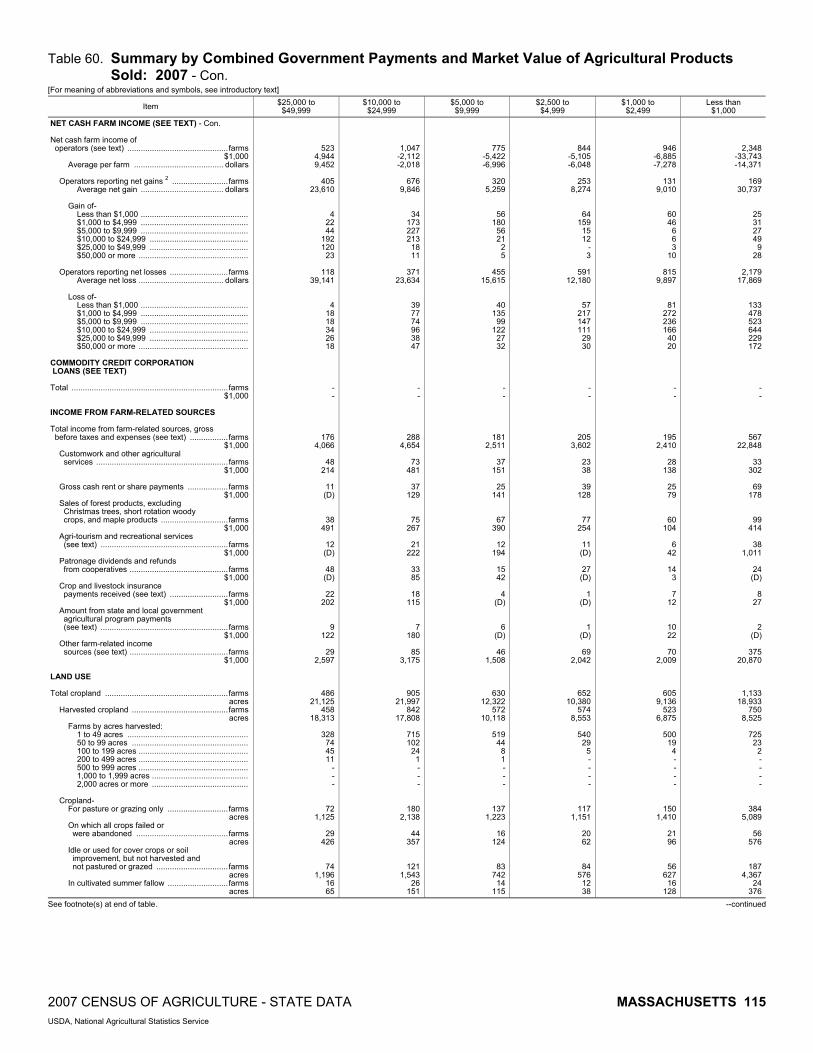
2007 CENSUS OF AGRICULTURE - STATE DATA MASSACHUSETTS 115 USDA, National Agricultural Statistics Service
Table 60. Summary by Combined Government Payments and Market Value of Agricultural Products Sold: 2007 - Con.
[For meaning of abbreviations and symbols, see introductory text]
Item $25,000 to $49,999
$10,000 to $24,999
$5,000 to $9,999
$2,500 to $4,999
$1,000 to $2,499
Less than $1,000
NET CASH FARM INCOME (SEE TEXT) - Con. Net cash farm income of operators (see text) .............................................farms $1,000 Average per farm ........................................ dollars Operators reporting net gains 2 .........................farms Average net gain ..................................... dollars Gain of- Less than $1,000 ................................................ $1,000 to $4,999 ................................................ $5,000 to $9,999 ................................................ $10,000 to $24,999 ............................................ $25,000 to $49,999 ............................................ $50,000 or more ................................................. Operators reporting net losses ..........................farms Average net loss ...................................... dollars Loss of- Less than $1,000 ................................................ $1,000 to $4,999 ................................................ $5,000 to $9,999 ................................................ $10,000 to $24,999 ............................................ $25,000 to $49,999 ............................................ $50,000 or more ................................................. COMMODITY CREDIT CORPORATION LOANS (SEE TEXT) Total ......................................................................farms $1,000 INCOME FROM FARM-RELATED SOURCES Total income from farm-related sources, gross before taxes and expenses (see text) .................farms $1,000 Customwork and other agricultural services ...........................................................farms $1,000 Gross cash rent or share payments ..................farms $1,000 Sales of forest products, excluding Christmas trees, short rotation woody crops, and maple products ..............................farms $1,000 Agri-tourism and recreational services (see text) .........................................................farms $1,000 Patronage dividends and refunds from cooperatives ............................................farms $1,000 Crop and livestock insurance payments received (see text) ..........................farms $1,000 Amount from state and local government agricultural program payments (see text) .........................................................farms $1,000 Other farm-related income sources (see text) ............................................farms $1,000 LAND USE Total cropland .......................................................farms acres Harvested cropland ...........................................farms acres Farms by acres harvested: 1 to 49 acres ...................................................... 50 to 99 acres .................................................... 100 to 199 acres ................................................. 200 to 499 acres ................................................. 500 to 999 acres ................................................. 1,000 to 1,999 acres ........................................... 2,000 acres or more ........................................... Cropland- For pasture or grazing only ...........................farms acres On which all crops failed or were abandoned .........................................farms acres Idle or used for cover crops or soil improvement, but not harvested and not pastured or grazed ................................farms acres In cultivated summer fallow ...........................farms acres
523 4,944 9,452
405
23,610
4 22 44
192 120
23
118 39,141
4 18 18 34 26 18
- -
176 4,066
48
214
11 (D)
38 491
12 (D)
48 (D)
22
202
9 122
29
2,597
486 21,125
458 18,313
328
74 45 11
- - -
72 1,125
29
426
74 1,196
16 65
1,047 -2,112 -2,018
676 9,846
34 173 227 213
18 11
371 23,634
39 77 74 96 38 47
--
288 4,654
73 481
37 129
75 267
21 222
33 85
18 115
7180
85 3,175
905 21,997
842 17,808
715 102
24 1---
180 2,138
44 357
121 1,543
26 151
775 -5,422 -6,996
320
5,259
56 180
56 21
2 5
455
15,615
40 135
99 122
27 32
- -
181 2,511
37
151
25 141
67 390
12
194
15 42
4
(D)
6 (D)
46
1,508
630 12,322
572 10,118
519
44 8 1 - - -
137 1,223
16
124
83 742
14 115
844 -5,105 -6,048
253
8,274
64 159
15 12
- 3
591
12,180
57 217 147 111
29 30
- -
205 3,602
23 38
39
128
77 254
11 (D)
27 (D)
1
(D)
1 (D)
69
2,042
652 10,380
574 8,553
540
29 5 - - - -
117 1,151
20 62
84 576
12 38
946 -6,885 -7,278
131
9,010
60 46
6 6 3
10
815 9,897
81 272 236 166
40 20
- -
195 2,410
28
138
25 79
60 104
6
42
14 3
7
12
10 22
70
2,009
605 9,136
523 6,875
500
19 4 - - - -
150 1,410
21 96
56 627
16 128
2,348 -33,743 -14,371
169
30,737
25 31 27 49
9 28
2,179
17,869
133 478 523 644 229 172
- -
567 22,848
33
302
69 178
99 414
38
1,011
24 (D)
8
27
2 (D)
375
20,870
1,133 18,933
750 8,525
725
23 2 - - - -
384 5,089
56
576
187 4,367
24 376
See footnote(s) at end of table. --continued

116 MASSACHUSETTS 2007 CENSUS OF AGRICULTURE - STATE DATA USDA, National Agricultural Statistics Service
Table 60. Summary by Combined Government Payments and Market Value of Agricultural Products Sold: 2007 - Con.
[For meaning of abbreviations and symbols, see introductory text]
Item All farms $1,000,000 or more
$500,000 to $999,999
$250,000 to $499,999
$100,000 to $249,999
$50,000 to $99,999
LAND USE - Con. Total woodland ..................................................... farms acres Woodland pastured ........................................... farms acres Woodland not pastured ..................................... farms acres Permanent pastureland and rangeland, other than cropland and woodland pastured (see text) .............................................. farms acres Land in house lots, ponds, roads, wasteland, etc. .................................................... farms acres Irrigated land ......................................................... farms acres Harvested cropland ........................................... farms acres Pastureland and other land ............................... farms acres CONSERVATION PRACTICES AND CROP INSURANCE Land enrolled in Conservation Reserve, Wetlands Reserve, Farmable Wetlands, or Conservation Reserve Enhancement Programs (see text) ............................................ farms acres Land enrolled in crop insurance programs (see text) ............................................. farms acres ORGANIC AGRICULTURE Land used for organic production (see text) ............................................................. farms acres Total organic product sales (see text) ................... farms $1,000 VALUE OF LAND AND BUILDINGS Estimated market value of land and buildings ............................................................. farms $1,000 Average per farm .........................................dollars Average per acre .........................................dollars Farms by value group: $1 to $49,999 ......................................................... $50,000 to $99,999 ................................................ $100,000 to $199,999 ............................................ $200,000 to $499,999 ............................................ $500,000 to $999,999 ............................................ $1,000,000 to $1,999,999 ...................................... $2,000,000 to $4,999,999 ...................................... $5,000,000 to $9,999,999 ...................................... $10,000,000 or more ............................................. VALUE OF MACHINERY AND EQUIPMENT Estimated market value of all machinery and equipment .................................................... farms $1,000 Farms by value group: $1 to $4,999 ........................................................... $5,000 to $9,999 .................................................... $10,000 to $19,999 ................................................ $20,000 to $49,999 ................................................ $50,000 to $99,999 ................................................ $100,000 to $199,999 ............................................ $200,000 to $499,999 ............................................ $500,000 or more .................................................. SELECTED MACHINERY AND EQUIPMENT Trucks, including pickups (see text) ...................... farms number Tractors ................................................................ farms number Less than 40 horsepower (PTO) ....................... farms number 40 to 99 horsepower (PTO) .............................. farms number 100 horsepower (PTO) or more ........................ farms number Grain and bean combines, self-propelled ............. farms number
4,259 212,539
1,160 21,853
3,670 190,686
3,359 48,120
5,005 69,814
1,630
23,133 1,543
22,662 112 471
30 580
722 32,811
319 7,326
295 17,515
7,691 6,376,531
829,090 12,313
537 372 675
2,237 2,068
1,082
606 85 29
7,690 433,507
878 830
1,298 2,167 1,233
841 374
69
5,781 11,282
5,876
13,534 4,074 6,639 3,387 5,963
662 932
25 28
29 5,316
7284
27 5,032
19 583
63 5,655
63 (D)63 (D)
1(D)
--
34 9,073
8(D)
810,211
83 325,599
3,922,877 11,282
-1358
18 29 10
9
83 32,898
-1467
19 22 24
81 639
72 397
44 134
57 194
29 69
35
69 9,089
14 953
62 8,136
42 2,579
89 3,122
66
2,880 66 (D)
1 (D)
2 (D)
56 6,287
4 (D)
4 1,519
114 282,491
2,477,992 8,819
2 3 6 8
15
30 34 13
3
114 30,191
1 - -
11 15 25 45 17
113 561
97
496 67
171 80
242 41 83
4
(D)
131 15,837
28 1,524
122 14,313
56 2,281
168 5,711
139 (D)
139 (D)
3 (D)
1 (D)
93 6,509
7 (D)
7 1,641
214 366,947
1,714,705 8,466
4 4
12 32 31
64 54 11
2
214 37,582
1 2 5
23 37 67 65 14
203 759
182 772 110 250 155 414
71 108
4
(D)
191 16,168
43 1,056
173 15,112
112 2,352
302 7,233
225
3,546 224 (D)
5 (D)
5 (D)
140 5,592
21 518
20 1,809
402 487,211
1,211,969 9,930
14 25 14 74
112
91 62
9 1
402 43,764
4 14 21 73
111 120
53 6
365 1,082
332
1,275 220 489 278 668
75 118
6
(D)
190 12,829
41 873 171
11,956
117 2,996
300 5,652
217
1,865 213
1,831 6
34
2 (D)
99 1,960
22 411
21 849
395 417,048
1,055,818 11,088
28 19 37 79
105
78 38
6 5
395 32,082
15 24 29
100 103
97 26
1
319 792
309 952 201 367 221 481
82 104
1
(D)See footnote(s) at end of table. --continued

2007 CENSUS OF AGRICULTURE - STATE DATA MASSACHUSETTS 117 USDA, National Agricultural Statistics Service
Table 60. Summary by Combined Government Payments and Market Value of Agricultural Products Sold: 2007 - Con.
[For meaning of abbreviations and symbols, see introductory text]
Item $25,000 to $49,999
$10,000 to $24,999
$5,000 to $9,999
$2,500 to $4,999
$1,000 to $2,499
Less than $1,000
LAND USE - Con. Total woodland ......................................................farms acres Woodland pastured ...........................................farms acres Woodland not pastured .....................................farms acres Permanent pastureland and rangeland, other than cropland and woodland pastured (see text) ..............................................farms acres Land in house lots, ponds, roads, wasteland, etc. ....................................................farms acres Irrigated land .........................................................farms acres Harvested cropland ...........................................farms acres Pastureland and other land ...............................farms acres CONSERVATION PRACTICES AND CROP INSURANCE Land enrolled in Conservation Reserve, Wetlands Reserve, Farmable Wetlands, or Conservation Reserve Enhancement Programs (see text) .............................................farms acres Land enrolled in crop insurance programs (see text) .............................................farms acres ORGANIC AGRICULTURE Land used for organic production (see text) .............................................................farms acres Total organic product sales (see text) ...................farms $1,000 VALUE OF LAND AND BUILDINGS Estimated market value of land and buildings ..............................................................farms $1,000 Average per farm ........................................ dollars Average per acre ......................................... dollars Farms by value group: $1 to $49,999 ......................................................... $50,000 to $99,999 ................................................ $100,000 to $199,999 ............................................ $200,000 to $499,999 ............................................ $500,000 to $999,999 ............................................ $1,000,000 to $1,999,999 ...................................... $2,000,000 to $4,999,999 ...................................... $5,000,000 to $9,999,999 ...................................... $10,000,000 or more .............................................. VALUE OF MACHINERY AND EQUIPMENT Estimated market value of all machinery and equipment ....................................................farms $1,000 Farms by value group: $1 to $4,999 ........................................................... $5,000 to $9,999 .................................................... $10,000 to $19,999 ................................................ $20,000 to $49,999 ................................................ $50,000 to $99,999 ................................................ $100,000 to $199,999 ............................................ $200,000 to $499,999 ............................................ $500,000 or more ................................................... SELECTED MACHINERY AND EQUIPMENT Trucks, including pickups (see text) ......................farms number Tractors .................................................................farms number Less than 40 horsepower (PTO) .......................farms number 40 to 99 horsepower (PTO) ...............................farms number 100 horsepower (PTO) or more ........................farms number Grain and bean combines, self-propelled ..............farms number
264 18,039
51 1,536
235 16,503
145 2,890
326 6,131
202 (D)
200 (D)
6 (D)
2 (D)
87 1,190
25 1,142
25 478
523 565,707
1,081,658 11,740
33 23 49
116 131
92 66 10
3
523 35,351
24 26 58
155 121 114
24 1
442 857
423
1,117 269 474 302 559
65 84
4 4
562 25,701
154 3,080
491 22,621
375 6,275
673 6,359
311 926 299 858
17 68
6(D)
93 925
72 1,024
70 628
1,047 731,648 698,804 12,127
103 68 92
299 248
166 65
6-
1,047 52,134
96 96
159 370 167 116
41 2
810 1,396
815 1,873
556 896 507 880
77 97
1(D)
457 25,983
140 4,252
384 21,731
307 4,111
497 7,059
158 394 147 358
14 36
6 (D)
39 258
53 1,479
51 221
775 556,879 718,554 11,256
66 36 61
251 225
78 48
8 2
775 30,267
106 64
159 241 129
58 18
-
574 936
591
1,245 433 667 329 509
50 69
- -
500 22,163
121 1,405
439 20,758
376 4,833
527 6,192
98
180 93
153 5
27
3 (D)
24 218
55 387
49 122
844 521,624 618,038 11,973
81 58 89
268 206
97 43
1 1
844 27,452
133 106 165 279
96 53 10
2
619 942
638
1,259 460 692 347 544
20 23
2
(D)
564 20,002
179 2,733
465 17,269
480 5,000
577 5,120
77 (D)61 (D)18 (D)
2 (D)
16 68
31 (D)26 34
946 553,253 584,834 14,093
76 45
113 350 224
98 36
4 -
946 26,808
173 134 201 272 120
33 13
-
651 962
690
1,324 502 792 372 502
30 30
- -
1,302 41,412
382 4,157 1,101
37,255
1,330 14,220
1,483 11,580
74
234 38
110 36
124
1 (D)
41 731
21 126
14 4
2,348 1,568,123
667,855 18,203
130 90
199 755 763
270 131
7 3
2,347 84,979
325 363 497 637 327 139
57 2
1,604 2,356
1,727 2,824 1,212 1,707
739 970 122 147
- -
See footnote(s) at end of table. --continued

118 MASSACHUSETTS 2007 CENSUS OF AGRICULTURE - STATE DATA USDA, National Agricultural Statistics Service
Table 60. Summary by Combined Government Payments and Market Value of Agricultural Products Sold: 2007 - Con.
[For meaning of abbreviations and symbols, see introductory text]
Item All farms $1,000,000 or more
$500,000 to $999,999
$250,000 to $499,999
$100,000 to $249,999
$50,000 to $99,999
SELECTED MACHINERY AND EQUIPMENT - Con. Cotton pickers and strippers, self-propelled ...................................................... farms number Forage harvesters, self-propelled ......................... farms number Hay balers ............................................................ farms number FERTILIZERS AND CHEMICALS Commercial fertilizer, lime, and soil conditioners ........................................................ farms acres treated Manure ................................................................. farms acres treated Acres treated with chemicals to control- Insects .............................................................. farms acres Weeds, grass, or brush ..................................... farms acres Nematodes ....................................................... farms acres Diseases in crops and orchards ....................... farms acres Chemicals used to control growth, thin fruit, ripen, or defoliate ................................. farms acres treated TENURE Full owners ........................................................... farms Part owners .......................................................... farms Tenants ................................................................. farms OWNED AND RENTED LAND Land owned .......................................................... farms acres Owned land in farms ......................................... farms acres Land rented or leased from others ........................ farms acres Rented or leased land in farms ......................... farms acres Land rented or leased to others ............................ farms acres NUMBER OF OPERATORS Total operators .................................................. number Farms by number of operators: 1 operator .............................................................. 2 operators ............................................................ 3 operators ............................................................ 4 operators ............................................................ 5 or more operators ............................................... Total women operators .................................. number Farms by number of women operators: 1 operator .......................................................... 2 operators ........................................................ 3 operators ........................................................ 4 operators ........................................................ 5 or more operators ........................................... PRINCIPAL OPERATOR CHARACTERISTICS Sex of operator: Male ........................................................................... Female ....................................................................... Primary occupation: Farming ..................................................................... Other .......................................................................... Place of residence: On farm operated ...................................................... Not on farm operated ................................................. Days worked off farm: None .......................................................................... Any ............................................................................ 1 to 49 days ........................................................... 50 to 99 days ......................................................... 100 to 199 days ..................................................... 200 days or more ................................................... Years on present farm: 2 years or less ........................................................... 3 or 4 years ................................................................ 5 to 9 years ................................................................
- -
95 99
1,838 2,197
3,330 98,188
1,301 32,236
1,441 41,176
1,326 41,313
103 1,921
720 16,675
216
3,865
5,647 1,373
671
7,022 423,332
7,020 413,661
2,049
105,399 2,044
104,218
402 10,852
12,265
4,075 2,940
480 158
38
4,834
3,888 378
41 13
2
5,465 2,226
3,688 4,003
6,093 1,598
2,418 5,273
799 437 780
3,257
326 442
1,249
--56
15 19
68 12,986
14 (D)
61 10,158
50 10,863
9215
33 3,954
9375
37 35 11
72 17,981
72 17,901
46 10,986
46 10,960
3(D)
237
18 30 21
59
49
17 6211
80 3
65 18
25 58
59 24
121
20
337
- -
11 11 28 38
103 13,937
41 4,456
72 6,549
73 6,817
13 (D)46
2,994
9 352
43 57 14
100 21,058
100 20,787
72
11,408 71
11,244
6 435
238
41 41 18
9 5
50
36
5 - 1 -
108 6
95 19
68 46
82 32
3 1 3
25
4 2 8
- -
10 13 47 66
176 14,104
56 5,402
141 8,028
121 7,601
12 380
70 3,197
33
1,369
99 92 23
191 31,794
191 31,725
115
11,619 115
11,619
8 (D)
401
79 92 34
9 -
94
86 4 - - -
201 13
194 20
141 73
141 73 12
5 6
50
4 7
25
- -
13 13 96
124
293 15,174
91 4,222
253 8,784
216 7,414
20 320 130
3,568
47 1,043
195 147
60
342 35,009
342 34,334
207
14,918 207
14,732
31 861
707
189 147
44 18
4
205
167 16
2 - -
358 44
330 72
279 123
208 194
34 11 29
120
14 20 31
- -
13 13
106 143
288 8,899
70 2,236
191 3,202
170 3,575
8 101 103
1,451
27 376
221 117
57
338 27,218
338 26,836
174
11,508 174
10,778
29 1,112
666
179 170
37 9 -
212
172 16
- 2 -
330 65
273 122
264 131
144 251
50 17 48
136
13 14 43
See footnote(s) at end of table. --continued

2007 CENSUS OF AGRICULTURE - STATE DATA MASSACHUSETTS 119 USDA, National Agricultural Statistics Service
Table 60. Summary by Combined Government Payments and Market Value of Agricultural Products Sold: 2007 - Con.
[For meaning of abbreviations and symbols, see introductory text]
Item $25,000 to $49,999
$10,000 to $24,999
$5,000 to $9,999
$2,500 to $4,999
$1,000 to $2,499
Less than $1,000
SELECTED MACHINERY AND EQUIPMENT - Con. Cotton pickers and strippers, self-propelled .......................................................farms number Forage harvesters, self-propelled ..........................farms number Hay balers .............................................................farms number FERTILIZERS AND CHEMICALS Commercial fertilizer, lime, and soil conditioners .........................................................farms acres treated Manure ..................................................................farms acres treated Acres treated with chemicals to control- Insects ...............................................................farms acres Weeds, grass, or brush .....................................farms acres Nematodes ........................................................farms acres Diseases in crops and orchards ........................farms acres Chemicals used to control growth, thin fruit, ripen, or defoliate ..................................farms acres treated TENURE Full owners ............................................................farms Part owners ...........................................................farms Tenants .................................................................farms OWNED AND RENTED LAND Land owned ...........................................................farms acres Owned land in farms .........................................farms acres Land rented or leased from others ........................farms acres Rented or leased land in farms .........................farms acres Land rented or leased to others ............................farms acres NUMBER OF OPERATORS Total operators ...................................................number Farms by number of operators: 1 operator ............................................................... 2 operators ............................................................. 3 operators ............................................................. 4 operators ............................................................. 5 or more operators ................................................ Total women operators ...................................number Farms by number of women operators: 1 operator ........................................................... 2 operators ......................................................... 3 operators ......................................................... 4 operators ......................................................... 5 or more operators ............................................ PRINCIPAL OPERATOR CHARACTERISTICS Sex of operator: Male ........................................................................... Female ....................................................................... Primary occupation: Farming ...................................................................... Other .......................................................................... Place of residence: On farm operated ....................................................... Not on farm operated ................................................. Days worked off farm: None ........................................................................... Any ............................................................................. 1 to 49 days ............................................................ 50 to 99 days .......................................................... 100 to 199 days ...................................................... 200 days or more ................................................... Years on present farm: 2 years or less ............................................................ 3 or 4 years ................................................................ 5 to 9 years ................................................................
- - 9 9
170 220
337 8,944
98 2,144
160 1,690
162 1,906
9 69 70
601
19 121
314 147
62
461 36,978
461 36,427
209
11,766 209
11,758
23 559
798
321 151
36 9 6
231
164
26 5 - -
437 86
313 210
384 139
176 347
56 45 65
181
9 16 64
--
11 11
294 351
582 9,305
203 3,151
230 1,313
200 1,448
21 101 128 533
34 130
692 220 135
912 51,695
912 50,250
357 10,088
355 10,082
63 1,451
1,632
577 392
58 16
4
596
490 46
3-1
780 267
561 486
782 265
305 742 109
91 155 387
56 45
200
- - 6 6
217 259
343 4,050
140 1,518
126 582 120 709
5 (D)61
187
21 62
576 126
73
704 43,880
702 42,754
199
6,750 199
6,721
44 1,155
1,246
392 318
44 19
2
480
386 35
8 - -
581 194
323 452
597 178
196 579
76 54 97
352
18 43
118
- - 6 6
242 285
324 3,224
160 1,268
85 212
68 240
- -
33 101
6
13
631 128
85
759 39,202
759 37,940
213
5,638 213
5,628
55 1,272
1,265
491 300
42 9 2
490
420
32 2 - -
617 227
325 519
699 145
214 630 105
67 92
366
38 65
128
- - 6 6
278 304
287 2,625
150 (D)
61 260
51 210
2 (D)33 64
7
10
762 121
63
883 35,161
883 34,595
186
4,685 184
4,663
34 588
1,448
521 366
43 14
2
585
490 36
5 2 -
658 288
342 604
783 163
200 746 112
58 119 457
62 51
170
- - 5 5
345 388
529 4,940
278 2,811
61 398
95 530
4 4
13 25
4
14
2,077 183
88
2,260 83,356
2,260 80,112
271
6,033 271
6,033
106 3,244
3,627
1,267 933 103
41 4
1,842
1,460
156 14
7 -
1,315 1,033
867 1,481
2,071 277
693 1,655
241 86
165 1,163
105 176 455
See footnote(s) at end of table. --continued

120 MASSACHUSETTS 2007 CENSUS OF AGRICULTURE - STATE DATA USDA, National Agricultural Statistics Service
Table 60. Summary by Combined Government Payments and Market Value of Agricultural Products Sold: 2007 - Con.
[For meaning of abbreviations and symbols, see introductory text]
Item All farms $1,000,000 or more
$500,000 to $999,999
$250,000 to $499,999
$100,000 to $249,999
$50,000 to $99,999
PRINCIPAL OPERATOR CHARACTERISTICS - Con. Years on present farm - Con. 10 years or more ....................................................... Average years on present farm ................................. Age group: Under 25 years .......................................................... 25 to 34 years ............................................................ 35 to 44 years ............................................................ 45 to 49 years ............................................................ 50 to 54 years ............................................................ 55 to 59 years ............................................................ 60 to 64 years ............................................................ 65 to 69 years ............................................................ 70 years and over ...................................................... Average age .............................................................. Spanish, Hispanic, or Latino origin (see text) ................ Race: American Indian or Alaska Native .............................. Asian .......................................................................... Black or African American ......................................... Native Hawaiian or Other Pacific Islander ................. White ......................................................................... More than one race reported ..................................... Farms by number of persons living in operator's household: 1 person ..................................................................... 2 people ..................................................................... 3 people ..................................................................... 4 people ..................................................................... 5 or more people ....................................................... Percent of operator's total household income from farming: Less than 25 percent ................................................. 25 to 49 percent ......................................................... 50 to 74 percent ......................................................... 75 to 99 percent ......................................................... 100 percent ................................................................ Operator is a hired manager ................................. farms acres Farms with- Internet access .......................................................... High-speed internet access ....................................... Farms by number of households sharing in net income of farm: 1 household ............................................................... 2 households ............................................................. 3 households ............................................................. 4 households ............................................................. 5 households or more ................................................ FARMS BY TYPE OF ORGANIZATION Family or individual .............................................. farms acres Partnership ........................................................... farms acres Registered under state law ............................... farms acres Corporation ........................................................... farms acres Family held ....................................................... farms acres More than 10 stockholders ........................... farms 10 or less stockholders ................................. farms Other than family held ....................................... farms acres More than 10 stockholders ........................... farms 10 or less stockholders ................................. farms Other-cooperative, estate or trust, institutional, etc ...................................... farms acres HIRED FARM LABOR Hired farm labor .................................................... farms workers Workers by days worked: 150 days or more .......................................... farms workers Less than 150 days ....................................... farms workers
5,674
21.2
49 292 972 986
1,251 1,164 1,063
767 1,147
56.3
120
11 56 32
3 7,569
20
955 3,215 1,331 1,297
893
5,727 537 645 390 392
362
58,009
5,162 3,834
6,507 878 181
67 58
6,318 349,617
574 69,149
384 57,641
641
76,884 566
68,774 6
560
75 8,110
2 73
158 22,229
1,972 13,039
1,086 4,736 1,510 8,303
70
25.2
-2
10 6
14 15 16 10 10
56.8
-
----
83 -
540 13 15 10
17 7
16 23 20
25 9,432
79 64
35 23
815
2
92,768
12 7,028
12 7,028
54 16,700
39 10,667
-39
15 6,033
213
82,365
80 2,842
77 1,579
55 1,263
100
29.3
- 7
11 13 17 14 16 13 23
57.7
3
- 1 - -
113 -
8 58 18 25
5
18 15 30 19 32
21
7,306
83 69
58 28 14 11
3
38 7,282
28 (D)22
7,835
46 14,949
43 (D)
2 41
3
(D)- 3
2 (D)
104 1,720
92
613 79
1,107
178
23.9
- 18 38 33 35 22 31 17 20
52.5
8
- - - -
213 1
25 82 37 32 38
42 16 45 47 64
37
9,414
167 136
124 62 16
3 9
108 16,648
36 12,273
30 10,387
57
8,625 57
8,625 -
57
- - - -
13 5,798
195 1,642
156 635 141
1,007
337
24.1
- 12 53 56 78 85 35 38 45
55.2
6
1 1 4 -
396 -
54 153
66 77 52
88 51 98 86 79
37
5,350
282 215
288 79 20
8 7
246 29,450
48 9,494
40 9,040
93
7,788 86
7,398 2
84
7 390
- 7
15 2,334
313 2,193
198 620 246
1,573
325
22.9
2 31 38 51 61 64 53 41 54
55.3
-
- - 1 -
393 1
53 174
49 73 46
134 67 94 52 48
36
4,028
273 212
315 64 11
1 4
284 24,733
43 5,740
29 4,817
57
4,460 52
4,394 -
52
5 66
- 5
11 2,681
195 1,001
88
220 160 781
See footnote(s) at end of table. --continued
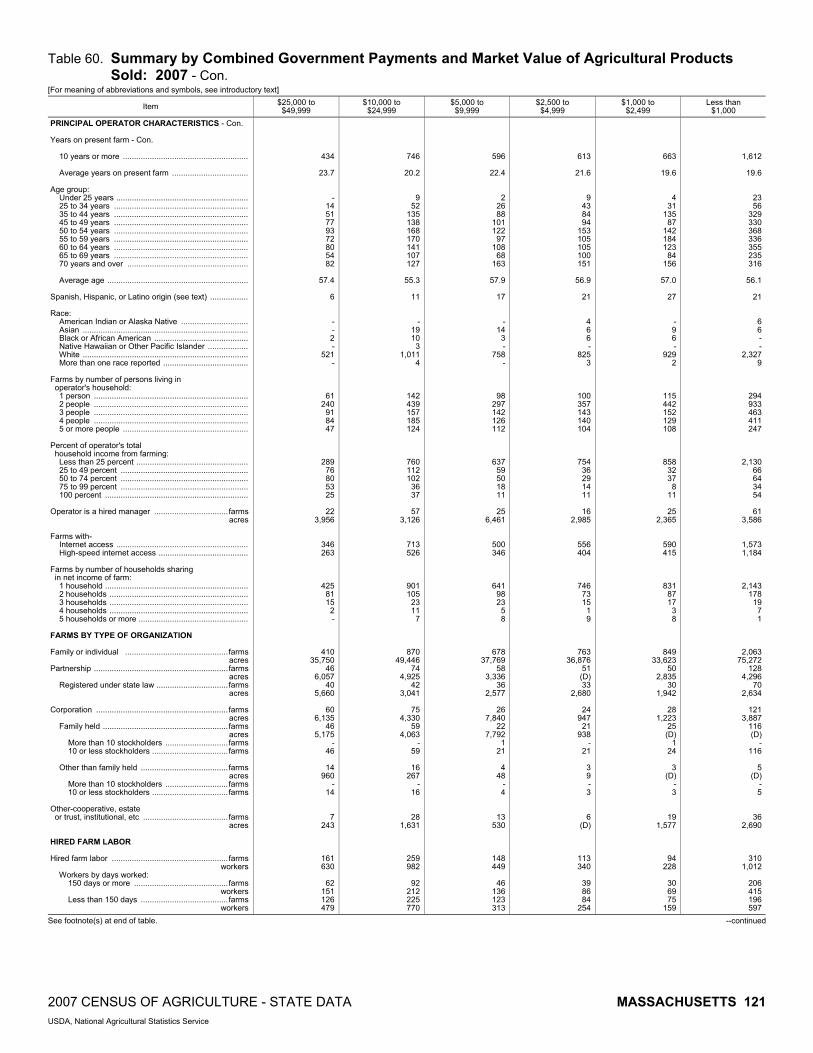
2007 CENSUS OF AGRICULTURE - STATE DATA MASSACHUSETTS 121 USDA, National Agricultural Statistics Service
Table 60. Summary by Combined Government Payments and Market Value of Agricultural Products Sold: 2007 - Con.
[For meaning of abbreviations and symbols, see introductory text]
Item $25,000 to $49,999
$10,000 to $24,999
$5,000 to $9,999
$2,500 to $4,999
$1,000 to $2,499
Less than $1,000
PRINCIPAL OPERATOR CHARACTERISTICS - Con. Years on present farm - Con. 10 years or more ........................................................ Average years on present farm .................................. Age group: Under 25 years ........................................................... 25 to 34 years ............................................................ 35 to 44 years ............................................................ 45 to 49 years ............................................................ 50 to 54 years ............................................................ 55 to 59 years ............................................................ 60 to 64 years ............................................................ 65 to 69 years ............................................................ 70 years and over ...................................................... Average age ............................................................... Spanish, Hispanic, or Latino origin (see text) ................. Race: American Indian or Alaska Native .............................. Asian .......................................................................... Black or African American .......................................... Native Hawaiian or Other Pacific Islander .................. White .......................................................................... More than one race reported ...................................... Farms by number of persons living in operator's household: 1 person ..................................................................... 2 people ..................................................................... 3 people ..................................................................... 4 people ..................................................................... 5 or more people ........................................................ Percent of operator's total household income from farming: Less than 25 percent .................................................. 25 to 49 percent ......................................................... 50 to 74 percent ......................................................... 75 to 99 percent ......................................................... 100 percent ................................................................ Operator is a hired manager .................................farms acres Farms with- Internet access ........................................................... High-speed internet access ........................................ Farms by number of households sharing in net income of farm: 1 household ................................................................ 2 households .............................................................. 3 households .............................................................. 4 households .............................................................. 5 households or more ................................................. FARMS BY TYPE OF ORGANIZATION Family or individual ..............................................farms acres Partnership ............................................................farms acres Registered under state law ................................farms acres Corporation ...........................................................farms acres Family held ........................................................farms acres More than 10 stockholders ............................farms 10 or less stockholders ..................................farms Other than family held .......................................farms acres More than 10 stockholders ............................farms 10 or less stockholders ..................................farms Other-cooperative, estate or trust, institutional, etc ......................................farms acres HIRED FARM LABOR Hired farm labor ....................................................farms workers Workers by days worked: 150 days or more ..........................................farms workers Less than 150 days .......................................farms workers
434
23.7
- 14 51 77 93 72 80 54 82
57.4
6
- - 2 -
521 -
61 240
91 84 47
289 76 80 53 25
22
3,956
346 263
425 81 15
2 -
410 35,750
46 6,057
40 5,660
60
6,135 46
5,175 -
46
14 960
- 14
7 243
161 630
62
151 126 479
746
20.2
952
135 138 168 170 141 107 127
55.3
11
-19 10
31,011
4
142 439 157 185 124
760 112 102
36 37
57 3,126
713 526
901 105
23 11
7
870 49,446
74 4,925
42 3,041
75 4,330
59 4,063
-59
16 267
-16
28 1,631
259 982
92 212 225 770
596
22.4
2 26 88
101 122
97 108
68 163
57.9
17
- 14
3 -
758 -
98 297 142 126 112
637 59 50 18 11
25
6,461
500 346
641 98 23
5 8
678 37,769
58 3,336
36 2,577
26
7,840 22
7,792 1
21
4 48
- 4
13 530
148 449
46
136 123 313
613
21.6
9 43 84 94
153 105 105 100 151
56.9
21
4 6 6 -
825 3
100 357 143 140 104
754 36 29 14 11
16
2,985
556 404
746 73 15
1 9
763 36,876
51 (D) 33
2,680
24 947
21 938
- 21
3 9 - 3
6 (D)
113 340
39 86 84
254
663
19.6
4 31
135 87
142 184 123
84 156
57.0
27
- 9 6 -
929 2
115 442 152 129 108
858 32 37
8 11
25
2,365
590 415
831 87 17
3 8
849 33,623
50 2,835
30 1,942
28
1,223 25 (D)
1 24
3
(D)- 3
19 1,577
94 228
30 69 75
159
1,612
19.6
23 56
329 330 368 336 355 235 316
56.1
21
6 6 - -
2,327 9
294 933 463 411 247
2,130 66 64 34 54
61
3,586
1,573 1,184
2,143 178
19 7 1
2,063 75,272
128 4,296
70 2,634
121
3,887 116 (D)
- 116
5
(D)- 5
36 2,690
310 1,012
206 415 196 597
See footnote(s) at end of table. --continued
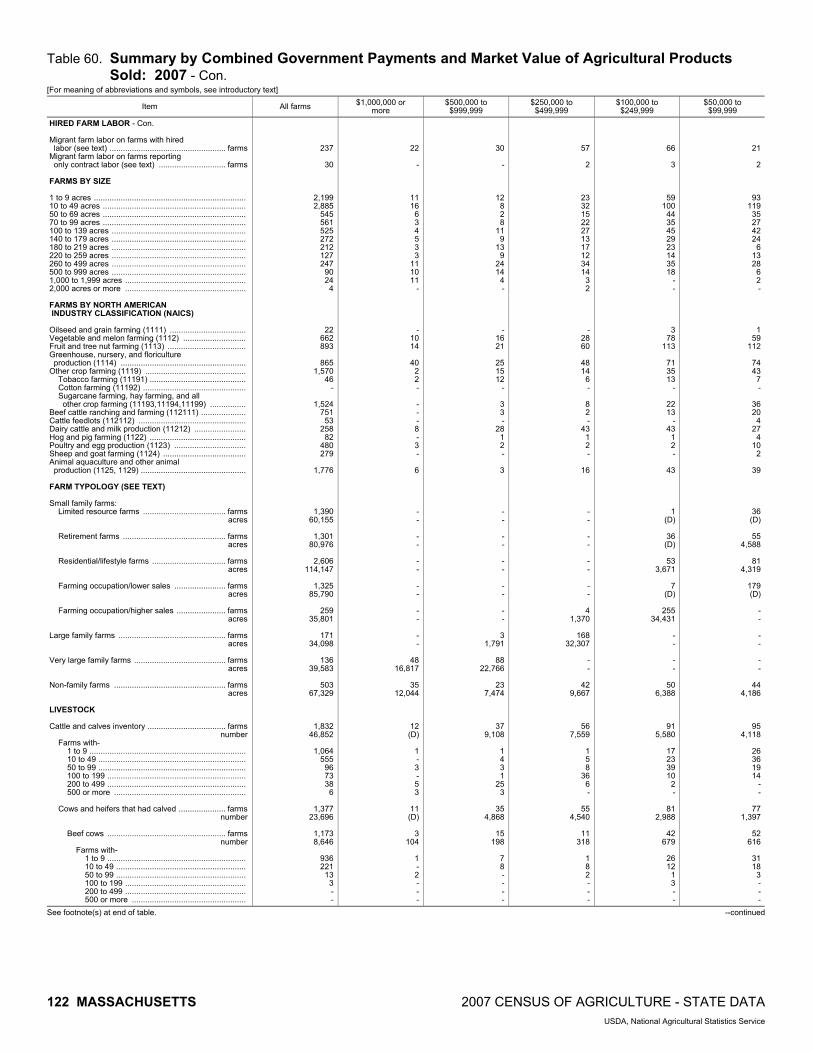
122 MASSACHUSETTS 2007 CENSUS OF AGRICULTURE - STATE DATA USDA, National Agricultural Statistics Service
Table 60. Summary by Combined Government Payments and Market Value of Agricultural Products Sold: 2007 - Con.
[For meaning of abbreviations and symbols, see introductory text]
Item All farms $1,000,000 or more
$500,000 to $999,999
$250,000 to $499,999
$100,000 to $249,999
$50,000 to $99,999
HIRED FARM LABOR - Con. Migrant farm labor on farms with hired labor (see text) .................................................... farms Migrant farm labor on farms reporting only contract labor (see text) .............................. farms FARMS BY SIZE 1 to 9 acres .................................................................... 10 to 49 acres ................................................................ 50 to 69 acres ................................................................ 70 to 99 acres ................................................................ 100 to 139 acres ............................................................ 140 to 179 acres ............................................................ 180 to 219 acres ............................................................ 220 to 259 acres ............................................................ 260 to 499 acres ............................................................ 500 to 999 acres ............................................................ 1,000 to 1,999 acres ...................................................... 2,000 acres or more ...................................................... FARMS BY NORTH AMERICAN INDUSTRY CLASSIFICATION (NAICS) Oilseed and grain farming (1111) .................................. Vegetable and melon farming (1112) ............................ Fruit and tree nut farming (1113) ................................... Greenhouse, nursery, and floriculture production (1114) ........................................................ Other crop farming (1119) ............................................. Tobacco farming (11191) ........................................... Cotton farming (11192) .............................................. Sugarcane farming, hay farming, and all other crop farming (11193,11194,11199) ................ Beef cattle ranching and farming (112111) .................... Cattle feedlots (112112) ................................................ Dairy cattle and milk production (11212) ....................... Hog and pig farming (1122) ........................................... Poultry and egg production (1123) ................................ Sheep and goat farming (1124) ..................................... Animal aquaculture and other animal production (1125, 1129) ............................................... FARM TYPOLOGY (SEE TEXT) Small family farms: Limited resource farms ..................................... farms acres Retirement farms .............................................. farms acres Residential/lifestyle farms ................................. farms acres Farming occupation/lower sales ....................... farms acres Farming occupation/higher sales ...................... farms acres Large family farms ................................................ farms acres Very large family farms ......................................... farms acres Non-family farms .................................................. farms acres LIVESTOCK Cattle and calves inventory ................................... farms number Farms with- 1 to 9 ...................................................................... 10 to 49 .................................................................. 50 to 99 .................................................................. 100 to 199 .............................................................. 200 to 499 .............................................................. 500 or more ........................................................... Cows and heifers that had calved ..................... farms number Beef cows ..................................................... farms number Farms with- 1 to 9 .............................................................. 10 to 49 .......................................................... 50 to 99 .......................................................... 100 to 199 ...................................................... 200 to 499 ...................................................... 500 or more ...................................................
237
30
2,199 2,885
545 561 525 272 212 127 247
90 24
4
22 662 893
865
1,570 46
-
1,524 751
53 258
82 480 279
1,776
1,390 60,155
1,301
80,976
2,606 114,147
1,325
85,790
259 35,801
171
34,098
136 39,583
503
67,329
1,832 46,852
1,064
555 96 73 38
6
1,377 23,696
1,173 8,646
936 221
13 3 - -
22
-
11 16
634533
11 10 11
-
-10 14
40 22-
---8-3-
6
--
--
--
--
--
--
48 16,817
35 12,044
12 (D)
1-3-53
11 (D)
3104
1-2---
30
-
12 8 2 8
11 9
13 9
24 14
4 -
- 16 21
25 15 12
-
3 3 -
28 1 2 -
3
- -
- -
- -
- -
- -
3 1,791
88
22,766
23 7,474
37 9,108
1 4 3 1
25 3
35
4,868
15 198
7 8 - - - -
57
2
23 32 15 22 27 13 17 12 34 14
3 2
- 28 60
48 14
6 -
8 2 -
43 1 2 -
16
- -
- -
- -
- -
4 1,370
168
32,307
- -
42 9,667
56 7,559
1 5 8
36 6 -
55 4,540
11
318
1 8 2 - - -
66
3
59 100
44 35 45 29 23 14 35 18
- -
3 78
113
71 35 13
-
22 13
- 43
1 2 -
43
1 (D)
36 (D)
53
3,671
7 (D)
255
34,431
- -
- -
50 6,388
91 5,580
17 23 39 10
2 -
81 2,988
42
679
26 12
1 3 - -
21
2
93 119
35 27 42 24
6 13 28
6 2 -
1 59
112
74 43
7 -
36 20
4 27
4 10
2
39
36 (D)
55
4,588
81 4,319
179 (D)
- -
- -
- -
44 4,186
95 4,118
26 36 19 14
- -
77 1,397
52
616
31 18
3 - - -
See footnote(s) at end of table. --continued

2007 CENSUS OF AGRICULTURE - STATE DATA MASSACHUSETTS 123 USDA, National Agricultural Statistics Service
Table 60. Summary by Combined Government Payments and Market Value of Agricultural Products Sold: 2007 - Con.
[For meaning of abbreviations and symbols, see introductory text]
Item $25,000 to $49,999
$10,000 to $24,999
$5,000 to $9,999
$2,500 to $4,999
$1,000 to $2,499
Less than $1,000
HIRED FARM LABOR - Con. Migrant farm labor on farms with hired labor (see text) ....................................................farms Migrant farm labor on farms reporting only contract labor (see text) ...............................farms FARMS BY SIZE 1 to 9 acres .................................................................... 10 to 49 acres ................................................................ 50 to 69 acres ................................................................ 70 to 99 acres ................................................................ 100 to 139 acres ............................................................ 140 to 179 acres ............................................................ 180 to 219 acres ............................................................ 220 to 259 acres ............................................................ 260 to 499 acres ............................................................ 500 to 999 acres ............................................................ 1,000 to 1,999 acres ...................................................... 2,000 acres or more ....................................................... FARMS BY NORTH AMERICAN INDUSTRY CLASSIFICATION (NAICS) Oilseed and grain farming (1111) ................................... Vegetable and melon farming (1112) ............................. Fruit and tree nut farming (1113) .................................... Greenhouse, nursery, and floriculture production (1114) ......................................................... Other crop farming (1119) .............................................. Tobacco farming (11191) ........................................... Cotton farming (11192) .............................................. Sugarcane farming, hay farming, and all other crop farming (11193,11194,11199) ................. Beef cattle ranching and farming (112111) .................... Cattle feedlots (112112) ................................................. Dairy cattle and milk production (11212) ........................ Hog and pig farming (1122) ............................................ Poultry and egg production (1123) ................................. Sheep and goat farming (1124) ...................................... Animal aquaculture and other animal production (1125, 1129) ............................................... FARM TYPOLOGY (SEE TEXT) Small family farms: Limited resource farms ......................................farms acres Retirement farms ...............................................farms acres Residential/lifestyle farms ..................................farms acres Farming occupation/lower sales ........................farms acres Farming occupation/higher sales ......................farms acres Large family farms .................................................farms acres Very large family farms ..........................................farms acres Non-family farms ...................................................farms acres LIVESTOCK Cattle and calves inventory ...................................farms number Farms with- 1 to 9 ...................................................................... 10 to 49 .................................................................. 50 to 99 .................................................................. 100 to 199 .............................................................. 200 to 499 .............................................................. 500 or more ............................................................ Cows and heifers that had calved .....................farms number Beef cows ......................................................farms number Farms with- 1 to 9 .............................................................. 10 to 49 .......................................................... 50 to 99 .......................................................... 100 to 199 ...................................................... 200 to 499 ...................................................... 500 or more ....................................................
9
5
110 174
32 56 40 15 34 22 30
8 1 1
6 60
137
81 132
2 -
130 17
3 13
2 8 9
55
61 (D)
95 (D)
138
11,969
192 16,742
- -
- -
- -
37 4,469
92 2,242
27 54
7 4 - -
71 987
58
788
30 27
1 - - -
8
3
293 374
66 95
112 40 28 17 16
6--
8177 186
138 233
4-
229 49
232 14
920
179
214 12,525
187 10,985
329 17,889
237 15,071
--
--
--
80 3,862
210 3,507
93 102
13 2--
155 1,499
131 1,328
92 35
4---
6
5
227 287
68 59 37 39 24
9 18
5 1 1
1 93 92
106 225
- -
225 52
8 28 18 12 23
117
162 6,487
141
11,595
313 15,781
127
8,860
- -
- -
- -
32 6,752
169 1,991
93 76
- - - -
129 860
118 814
89 29
- - - -
5
3
261 294
85 59 67 38 17 10 12
- 1 -
3 76 61
98
242 - -
242 105
10 33 19 30 44
123
179 8,754
173
10,331
352 16,205
118
5,141
- -
- -
- -
22 3,137
216 1,764
143
72 1 - - -
159 929
142 894
120
22 - - - -
2
2
310 400
65 61 53 24 18
3 10
1 1 -
- 48 51
53
296 - -
296 171
23 3
10 83 68
140
203 6,104
182
9,044
396 16,753
123
4,246
- -
- -
- -
42 3,111
289 (D)
207
82 - - - -
230 (D)
227
1,079
197 30
- - - -
11
5
800 1,081
127 136
87 36 29 15 29
8 - -
- 17 46
131 333
- -
333 319
3 -
12 319 113
1,055
534 15,158
432
24,091
944 27,560
342
13,097
- -
- -
- -
96 6,239
565 4,013
455 101
3 6 - -
374 1,828
374
1,828
342 32
- - - -
See footnote(s) at end of table. --continued

124 MASSACHUSETTS 2007 CENSUS OF AGRICULTURE - STATE DATA USDA, National Agricultural Statistics Service
Table 60. Summary by Combined Government Payments and Market Value of Agricultural Products Sold: 2007 - Con.
[For meaning of abbreviations and symbols, see introductory text]
Item All farms $1,000,000 or more
$500,000 to $999,999
$250,000 to $499,999
$100,000 to $249,999
$50,000 to $99,999
LIVESTOCK - Con. Cattle and calves inventory - Con. Cows and heifers that had calved - Con. Milk cows ...................................................... farms number Farms with- 1 to 9 .............................................................. 10 to 49 .......................................................... 50 to 99 .......................................................... 100 to 199 ...................................................... 200 to 499 ...................................................... 500 or more ................................................... Other cattle (see text) ....................................... farms number Cattle and calves sold ........................................... farms number $1,000 Calves weighing less than 500 pounds ............. farms number Cattle, including calves weighing 500 pounds or more ........................................ farms number Cattle on feed (see text) ............................... farms number Hogs and pigs inventory ....................................... farms number Farms with- 1 to 24 .................................................................... 25 to 49 .................................................................. 50 to 99 .................................................................. 100 to 199 .............................................................. 200 to 499 .............................................................. 500 or more ........................................................... Used or to be used for breeding ....................... farms number Other hogs and pigs ......................................... farms number Hogs and pigs sold ............................................... farms number $1,000 Sheep and lambs inventory .................................. farms number Ewes 1 year old or older ................................... farms number Sheep and lambs sold .......................................... farms number Horses and ponies inventory ................................ farms number Owned .............................................................. farms number Horses and ponies sold ........................................ farms number Owned .............................................................. farms number Goats, all inventory ............................................... farms number Goats sold ............................................................ farms number POULTRY Layers inventory (see text) ................................... farms number Farms with- 1 to 399 .................................................................. 400 to 3,199 ........................................................... 3,200 to 9,999 ........................................................ 10,000 to 19,999 .................................................... 20,000 to 49,999 .................................................... 50,000 to 99,999 .................................................... 100,000 or more .................................................... Pullets for laying flock replacement inventory ............................................................. farms number Layers sold ........................................................... farms number Pullets for laying flock replacement sold (see text) ..................................................... farms number
310 15,050
142
65 46 43 12
2
1,304 23,156
1,066
20,405 12,444
474 8,416
916 11,989
121 948
453
11,553
368 34 31 11
6 3
212
2,163 402
9,390
350 17,955
2,108
734 11,787
615 7,537
348 8,182
2,369
20,580 2,100
12,938 477
3,009 327
1,233
808 8,226
197 3,411
1,354 139,764
1,339
11 2 1 - 1 -
182 (D)
224 (D)
20 (D)
9(D)
--1-71
12 (D)
12 (D)(D)11 (D)
11 (D)
--
433
4-----
2(D)
4(D)
314
2
1(D)
1(D)
1(D)
314
314
----
4(D)
1(D)
2(D)
1----1-
--
3(D)
1(D)
28 4,670
- - -
22 5 1
33
4,240
34 5,181 2,785
30 2,724
33 2,457
1 (D)
2
(D)
1 - - - - 1
1
(D)2
(D)
4 (D)(D)
6
826 5
495 4
1,915
4 33
4 32
2 (D)
2 (D)
7
(D)4
(D)
4 (D)
1 1 1 1 - - -
- -
3 (D)
- -
48 4,222
1 2
28 17
- -
51 3,019
54
2,553 1,579
47 1,581
49 972
4 (D)
7
(D)
7 - - - - -
1 (D)
7 (D)
6
(D) (D)
8
(D) 5
(D) 2
(D)
13 89 11 41
4 (D)
4 (D)
7
29 1
(D)
9 707
8 1 - - - - -
- -
5 41
- -
51 2,309
3
28 16
4 - -
78 2,592
82
4,260 2,532
57 1,449
70 2,811
5 39
18
1,804
11 2 3 - 1 1
7
274 18
1,530
19 2,545
246
18 326
16 198
11 217
44
507 33
237 17
256 17
223
16 136
3 (D)
43 5,293
41
2 - - - - -
8 (D)
13
2,944
1 (D)
37 781
9
27 1 - - -
83 2,721
75 (D)
1,635 40 (D)
70 (D)
6 128
31
1,310
15 8 6 1 1 -
18 287
30 1,023
34
1,588 292
23
885 22
620 19 (D)
44
569 31
427 12
115 12
107
19 304
11 135
65 (D)
61
3 1 - - - -
11 750
10
2,649
1 (D)
See footnote(s) at end of table. --continued

2007 CENSUS OF AGRICULTURE - STATE DATA MASSACHUSETTS 125 USDA, National Agricultural Statistics Service
Table 60. Summary by Combined Government Payments and Market Value of Agricultural Products Sold: 2007 - Con.
[For meaning of abbreviations and symbols, see introductory text]
Item $25,000 to $49,999
$10,000 to $24,999
$5,000 to $9,999
$2,500 to $4,999
$1,000 to $2,499
Less than $1,000
LIVESTOCK - Con. Cattle and calves inventory - Con. Cows and heifers that had calved - Con. Milk cows .......................................................farms number Farms with- 1 to 9 .............................................................. 10 to 49 .......................................................... 50 to 99 .......................................................... 100 to 199 ...................................................... 200 to 499 ...................................................... 500 or more .................................................... Other cattle (see text) ........................................farms number Cattle and calves sold ...........................................farms number $1,000 Calves weighing less than 500 pounds .............farms number Cattle, including calves weighing 500 pounds or more ........................................farms number Cattle on feed (see text) ................................farms number Hogs and pigs inventory ........................................farms number Farms with- 1 to 24 .................................................................... 25 to 49 .................................................................. 50 to 99 .................................................................. 100 to 199 .............................................................. 200 to 499 .............................................................. 500 or more ............................................................ Used or to be used for breeding ........................farms number Other hogs and pigs ..........................................farms number Hogs and pigs sold ................................................farms number $1,000 Sheep and lambs inventory ...................................farms number Ewes 1 year old or older ....................................farms number Sheep and lambs sold ...........................................farms number Horses and ponies inventory .................................farms number Owned ...............................................................farms number Horses and ponies sold .........................................farms number Owned ...............................................................farms number Goats, all inventory ...............................................farms number Goats sold .............................................................farms number POULTRY Layers inventory (see text) ....................................farms number Farms with- 1 to 399 .................................................................. 400 to 3,199 ........................................................... 3,200 to 9,999 ........................................................ 10,000 to 19,999 .................................................... 20,000 to 49,999 .................................................... 50,000 to 99,999 .................................................... 100,000 or more ..................................................... Pullets for laying flock replacement inventory ..............................................................farms number Layers sold ............................................................farms number Pullets for laying flock replacement sold (see text) ......................................................farms number
23 199
17
6 - - - -
75 1,255
70
904 817
21 122
64 782
9 197
14 (D)
7 1 3 1 2 -
10 (D)14 (D)
16 (D)(D)
31
1,106 29
697 19
506
58 602
50 393
23 216
20 211
25
234 6
(D)
43 4,966
40
3 - - - - -
10 (D)
12
1,503
3 (D)
43 171
41 2----
160 2,008
161 1,436
936 52
280
141 1,156
18 134
74 2,216
52 7762-
45 469
63 1,747
71 3,065
282
95 1,989
79 1,353
65 1,442
210 1,595
175 1,062
84 268
76 206
118 1,454
47 775
167 6,762
166 1-----
16 1,042
39 1,466
3100
34 46
34
- - - - -
120 1,131
141 717 505
62 220
120 497
32 114
71
1,752
53 4
12 2 - -
43 242
61 1,510
71
2,021 175
60
982 50
716 42
791
176 1,120
157 702
70 171
59 142
80
734 30
321
125 3,594
125
- - - - - -
13 596
29
899
1 (D)
34 35
34
- - - - -
165 835
167 718 434
60 204
147 514
16 (D)
88
1,537
79 7 - 1 - 1
30
233 82
1,304
68 1,222
81
94 1,485
78 993
65 825
231
1,627 191 956
70 220
60 171
96
660 34
222
178 5,742
178
- - - - - -
48 729
30 (D)
5 408
3 (D)
3 - - - - -
184 (D)
211 494 (D)65
151
171 343
27 48
55
431
50 5 - - - -
24 128
46 303
39
327 26
105
1,503 84
894 66
604
245 1,703
211 1,096
69 184
59 110
129 951
45 265
236 6,393
236
- - - - - -
28 358
37
512
3 22
- -
- - - - - -
343 2,185
59 94 36 29 40
40 54
3 6
89
284
89 - - - - -
31 92 75
192
19 43 (D)
293
2,595 246
1,515 54
239
1,341 12,721
1,234 7,978
126 1,539
18 23
307
1,619 15
105
482 6,816
482
- - - - - -
48 530
43
1,111
2 (D)
See footnote(s) at end of table. --continued

126 MASSACHUSETTS 2007 CENSUS OF AGRICULTURE - STATE DATA USDA, National Agricultural Statistics Service
Table 60. Summary by Combined Government Payments and Market Value of Agricultural Products Sold: 2007 - Con.
[For meaning of abbreviations and symbols, see introductory text]
Item All farms $1,000,000 or more
$500,000 to $999,999
$250,000 to $499,999
$100,000 to $249,999
$50,000 to $99,999
POULTRY - Con. Broilers and other meat-type chickens sold ..................................................................... farms number Farms with- 1 to 1,999 ............................................................... 2,000 to 59,999 ...................................................... 60,000 to 99,999 .................................................... 100,000 or more .................................................... Turkeys inventory (see text) ................................. farms number Turkeys sold (see text) ......................................... farms number CROPS HARVESTED Corn for grain ........................................................ farms acres bushels Irrigated ............................................................ farms acres Farms by acres harvested: 1 to 24 acres .......................................................... 25 to 99 acres ........................................................ 100 to 249 acres .................................................... 250 to 499 acres .................................................... 500 acres or more .................................................. Corn for silage or greenchop ................................ farms acres tons Irrigated ............................................................ farms acres Farms by acres harvested: 1 to 24 acres .......................................................... 25 to 99 acres ........................................................ 100 to 249 acres .................................................... 250 to 499 acres .................................................... 500 acres or more .................................................. Dry edible beans, excluding limas ........................ farms acres cwt Irrigated ............................................................ farms acres Farms by acres harvested: 1 to 24 acres .......................................................... 25 to 99 acres ........................................................ 100 to 249 acres .................................................... 250 to 499 acres .................................................... 500 acres or more .................................................. Oats for grain ........................................................ farms acres bushels Irrigated ............................................................ farms acres Farms by acres harvested: 1 to 24 acres .......................................................... 25 to 99 acres ........................................................ 100 to 249 acres .................................................... 250 to 499 acres .................................................... 500 acres or more .................................................. Soybeans for beans .............................................. farms acres bushels Irrigated ............................................................ farms acres Farms by acres harvested: 1 to 24 acres .......................................................... 25 to 99 acres ........................................................ 100 to 249 acres .................................................... 250 to 499 acres .................................................... 500 acres or more .................................................. Sunflower seed, all ............................................... farms acres pounds Irrigated ............................................................ farms acres Farms by acres harvested: 1 to 24 acres .......................................................... 25 to 99 acres ........................................................ 100 to 249 acres .................................................... 250 to 499 acres .................................................... 500 acres or more .................................................. Tobacco ................................................................ farms acres pounds Irrigated ............................................................ farms acres
94 17,330
94
- - -
198 17,501
125 62,243
50 2,432
372,853 2
(D)
34 9 4 3 -
230 13,895
275,194 7
(D)
100 83 41
5 1
1
(D)(D)
- -
1 - - - -
2 (D)(D)
- -
2 - - - -
5 247
10,530 - -
1 3 1 - -
1 (D)(D)
- -
- 1 - - -
60 1,324
2,328,982 18
310
--
----
1(D)
1(D)
1(D)(D)
--
--1--
10 (D)
59,656 --
2-341
-----
-----
-----
-----
-----
-----
-----
-----
4216
375,396 2
(D)
2 (D)
2 - - -
2 (D)
3 (D)
6 911
159,480 1
(D)
1 3 - 2 -
28 3,428
68,959 1
(D)
1 9
17 1 -
- - - - -
- - - - -
1 (D)(D)
- -
1 - - - -
1 (D)(D)
- -
- - 1 - -
- - - - -
- - - - -
17 718
1,261,811 7
129
1 (D)
1 - - -
3 (D)
2 (D)
8 264
36,840 1
(D)
6 1 1 - -
43 3,578
69,496 - -
3 25 15
- -
- - - - -
- - - - -
- - - - -
- - - - -
1 (D) (D)
- -
- 1 - - -
- - - - -
- - - - -
10 179
313,714 6
71
3 (D)
3 - - -
12 6,350
5 (D)
7 763
110,300 - -
1 3 2 1 -
46 1,970
40,874 3 3
22 20
4 - -
- - - - -
- - - - -
- - - - -
- - - - -
- - - - -
- - - - -
- - - - -
- - - - -
15 159
279,840 - -
9 4,940
9 - - -
15 2,520
14 7,650
2 (D)(D)
- -
2 - - - -
21 934
17,484 2
(D)
7 12
2 - -
- - - - -
- - - - -
1 (D)(D)
- -
1 - - - -
- - - - -
- - - - -
- - - - -
- - - - -
7 39
73,085 1
(D)See footnote(s) at end of table. --continued

2007 CENSUS OF AGRICULTURE - STATE DATA MASSACHUSETTS 127 USDA, National Agricultural Statistics Service
Table 60. Summary by Combined Government Payments and Market Value of Agricultural Products Sold: 2007 - Con.
[For meaning of abbreviations and symbols, see introductory text]
Item $25,000 to $49,999
$10,000 to $24,999
$5,000 to $9,999
$2,500 to $4,999
$1,000 to $2,499
Less than $1,000
POULTRY - Con. Broilers and other meat-type chickens sold .....................................................................farms number Farms with- 1 to 1,999 ............................................................... 2,000 to 59,999 ...................................................... 60,000 to 99,999 .................................................... 100,000 or more ..................................................... Turkeys inventory (see text) ..................................farms number Turkeys sold (see text) ..........................................farms number CROPS HARVESTED Corn for grain ........................................................farms acres bushels Irrigated .............................................................farms acres Farms by acres harvested: 1 to 24 acres .......................................................... 25 to 99 acres ........................................................ 100 to 249 acres .................................................... 250 to 499 acres .................................................... 500 acres or more .................................................. Corn for silage or greenchop .................................farms acres tons Irrigated .............................................................farms acres Farms by acres harvested: 1 to 24 acres .......................................................... 25 to 99 acres ........................................................ 100 to 249 acres .................................................... 250 to 499 acres .................................................... 500 acres or more .................................................. Dry edible beans, excluding limas .........................farms acres cwt Irrigated .............................................................farms acres Farms by acres harvested: 1 to 24 acres .......................................................... 25 to 99 acres ........................................................ 100 to 249 acres .................................................... 250 to 499 acres .................................................... 500 acres or more .................................................. Oats for grain ........................................................farms acres bushels Irrigated .............................................................farms acres Farms by acres harvested: 1 to 24 acres .......................................................... 25 to 99 acres ........................................................ 100 to 249 acres .................................................... 250 to 499 acres .................................................... 500 acres or more .................................................. Soybeans for beans ..............................................farms acres bushels Irrigated .............................................................farms acres Farms by acres harvested: 1 to 24 acres .......................................................... 25 to 99 acres ........................................................ 100 to 249 acres .................................................... 250 to 499 acres .................................................... 500 acres or more .................................................. Sunflower seed, all ................................................farms acres pounds Irrigated .............................................................farms acres Farms by acres harvested: 1 to 24 acres .......................................................... 25 to 99 acres ........................................................ 100 to 249 acres .................................................... 250 to 499 acres .................................................... 500 acres or more .................................................. Tobacco ................................................................farms acres pounds Irrigated .............................................................farms acres
3 1,219
3 - - -
11 579
8 5,509
9 (D)(D)
- -
8 1 - - -
26 604
10,040 - -
16 10
- - -
- - - - -
- - - - -
- - - - -
- - - - -
2 (D)(D)
- -
- 2 - - -
1 (D)(D)
- -
- 1 - - -
2 (D)(D)
- -
15 2,478
15 ---
19 341
12 (D)
330
3,108 --
3----
30 476
6,340 --
24 6---
1(D)(D)
--
1----
-----
-----
1(D)(D)
--
1----
-----
-----
4(D)(D)
2(D)
15 1,868
15
- - -
23 498
12 698
5 25
2,020 - -
5 - - - -
4 44
624 - -
3 1 - - -
- - - - -
- - - - -
- - - - -
- - - - -
- - - - -
- - - - -
- - - - -
- - - - -
- - - - -
18 4,275
18
- - -
40 464
22 670
2 (D) (D)
- -
1 1 - - -
6 40 (D)
1 (D)
6 - - - -
- - - - -
- - - - -
- - - - -
- - - - -
- - - - -
- - - - -
- - - - -
- - - - -
1 (D) (D)
- -
11 (D)
11
- - -
27 368
23 489
- - - - -
- - - - -
3 (D)(D)
- -
3 - - - -
- - - - -
- - - - -
- - - - -
- - - - -
- - - - -
- - - - -
- - - - -
- - - - -
- - - - -
17 356
17
- - -
45 440
23 237
7 (D)(D)
- -
7 - - - -
13 46
989 - -
13 - - - -
- - - - -
- - - - -
- - - - -
- - - - -
- - - - -
- - - - -
- - - - -
- - - - -
- - - - -
See footnote(s) at end of table. --continued

128 MASSACHUSETTS 2007 CENSUS OF AGRICULTURE - STATE DATA USDA, National Agricultural Statistics Service
Table 60. Summary by Combined Government Payments and Market Value of Agricultural Products Sold: 2007 - Con.
[For meaning of abbreviations and symbols, see introductory text]
Item All farms $1,000,000 or more
$500,000 to $999,999
$250,000 to $499,999
$100,000 to $249,999
$50,000 to $99,999
CROPS HARVESTED - Con. Tobacco - Con. Farms by acres harvested: 0.1 to 0.9 acres ...................................................... 1.0 to 1.9 acres ...................................................... 2.0 to 2.9 acres ...................................................... 3.0 to 4.9 acres ...................................................... 5.0 to 9.9 acres ...................................................... 10.0 to 24.9 acres .................................................. 25.0 acres or more ................................................. Wheat for grain, all ............................................... farms acres bushels Irrigated ............................................................ farms acres Farms by acres harvested: 1 to 24 acres .......................................................... 25 to 99 acres ........................................................ 100 to 249 acres .................................................... 250 to 499 acres .................................................... 500 acres or more .................................................. Forage-land used for all hay and haylage, grass silage, and greenchop (see text) ............... farms acres tons, dry Irrigated ............................................................ farms acres Farms by acres harvested: 1 to 24 acres .......................................................... 25 to 99 acres ........................................................ 100 to 249 acres .................................................... 250 to 499 acres .................................................... 500 acres or more .................................................. Alfalfa hay ......................................................... farms acres tons, dry Irrigated ........................................................ farms acres Other tame hay ................................................. farms acres tons, dry Irrigated ........................................................ farms acres Land in vegetables (see text) ................................ farms acres Irrigated ............................................................ farms acres Farms by acres harvested: 0.1 to 4.9 acres ...................................................... 5.0 to 24.9 acres .................................................... 25.0 to 99.9 acres .................................................. 100.0 to 249.9 acres .............................................. 250.0 acres or more ............................................... Snap beans ...................................................... farms acres Harvested for processing .............................. farms acres Peas, green ...................................................... farms acres Harvested for processing .............................. farms acres Potatoes ........................................................... farms acres Harvested for processing .............................. farms acres Farms by acres harvested: 0.1 to 4.9 acres .................................................. 5.0 to 24.9 acres ................................................ 25.0 to 99.9 acres .............................................. 100.0 to 249.9 acres .......................................... 250.0 acres or more ........................................... Sweet corn ........................................................ farms acres Harvested for processing .............................. farms acres Sweet potatoes ................................................. farms acres Harvested for processing .............................. farms acres Tomatoes in the open ....................................... farms acres Harvested for processing .............................. farms acres
1 3 1 7
13 16 19
7
(D)(D)
2 (D)
6 1 - - -
2,424 93,811
198,593 12 83
1,378
807 204
32 3
406
9,921 22,537
1 (D)
1,492
55,125 102,687
9 (D)
1,001
15,560 380
5,004
635 221 110
28 7
336 394
- -
56 50
- -
205 2,616
7 (D)
186 12
3 - 4
372
5,248 - - 9 2 - -
539 577
10 3
------4
-----
-----
14 (D)
10,959 --
31532
2(D)(D)
--
61,100 1,918
--
22 (D)17
1,195
-7474
4(D)
--
1(D)
--5
1,702 2
(D)
11--3
7389
------
636
--
- - - - 1 4
12
- - - - -
- - - - -
37 (D)
17,036 - -
7 11 13
5 1
12
423 (D)
- -
27 1,952 3,884
- -
36 3,083
22 901
6 4
12 12
2
12 103
- -
5 8 - - 4
(D)- -
2 1 1 - -
21 1,082
- - - - - -
16 46
- -
- - - 1 2 4 3
2
(D) (D)
- -
1 1 - - -
62 6,212
17,779 - -
9 22 29
2 -
14 588
2,016 - -
41 3,132 7,757
- -
65 2,360
36 1,193
9
23 29
4 -
30 80
- -
10 15
- -
15 98
- -
12 2 1 - -
43 1,115
- - - - - -
43 107
- -
- - - 2 5 8 -
1 (D)(D)
- -
1 - - - -
108 9,936
25,144 - -
31 32 38
7 -
31 1,072 3,117
- -
63 6,236
14,187 - -
120 3,963
56 1,186
20 50 44
5 1
54 97
- -
13 8 - -
32 (D)
- -
29 1 1 - 1
76
1,637 - - 4
(D)- -
81 156
- -
- - - 2 5 - -
- - - - -
- - - - -
113 9,541
22,409 2
(D)
31 42 33
7 -
29 1,271 3,802
- -
67 4,854
12,066 1
(D)
103 1,138
43 165
48 41 14
- -
35 33
- -
5 1 - -
22 29
- -
19 3 - - -
42 446
- - - - - -
60 71
1 (D)
See footnote(s) at end of table. --continued

2007 CENSUS OF AGRICULTURE - STATE DATA MASSACHUSETTS 129 USDA, National Agricultural Statistics Service
Table 60. Summary by Combined Government Payments and Market Value of Agricultural Products Sold: 2007 - Con.
[For meaning of abbreviations and symbols, see introductory text]
Item $25,000 to $49,999
$10,000 to $24,999
$5,000 to $9,999
$2,500 to $4,999
$1,000 to $2,499
Less than $1,000
CROPS HARVESTED - Con. Tobacco - Con. Farms by acres harvested: 0.1 to 0.9 acres ...................................................... 1.0 to 1.9 acres ...................................................... 2.0 to 2.9 acres ...................................................... 3.0 to 4.9 acres ...................................................... 5.0 to 9.9 acres ...................................................... 10.0 to 24.9 acres .................................................. 25.0 acres or more ................................................. Wheat for grain, all ................................................farms acres bushels Irrigated .............................................................farms acres Farms by acres harvested: 1 to 24 acres .......................................................... 25 to 99 acres ........................................................ 100 to 249 acres .................................................... 250 to 499 acres .................................................... 500 acres or more .................................................. Forage-land used for all hay and haylage, grass silage, and greenchop (see text) ...............farms acres tons, dry Irrigated .............................................................farms acres Farms by acres harvested: 1 to 24 acres .......................................................... 25 to 99 acres ........................................................ 100 to 249 acres .................................................... 250 to 499 acres .................................................... 500 acres or more .................................................. Alfalfa hay .........................................................farms acres tons, dry Irrigated .........................................................farms acres Other tame hay .................................................farms acres tons, dry Irrigated .........................................................farms acres Land in vegetables (see text) ................................farms acres Irrigated .............................................................farms acres Farms by acres harvested: 0.1 to 4.9 acres ...................................................... 5.0 to 24.9 acres .................................................... 25.0 to 99.9 acres .................................................. 100.0 to 249.9 acres ............................................... 250.0 acres or more ............................................... Snap beans .......................................................farms acres Harvested for processing ..............................farms acres Peas, green .......................................................farms acres Harvested for processing ..............................farms acres Potatoes ............................................................farms acres Harvested for processing ..............................farms acres Farms by acres harvested: 0.1 to 4.9 acres .................................................. 5.0 to 24.9 acres ................................................. 25.0 to 99.9 acres ............................................... 100.0 to 249.9 acres ........................................... 250.0 acres or more ........................................... Sweet corn ........................................................farms acres Harvested for processing ..............................farms acres Sweet potatoes .................................................farms acres Harvested for processing ..............................farms acres Tomatoes in the open ........................................farms acres Harvested for processing ..............................farms acres
- - - 2 - - -
1 (D)(D)
- -
1 - - - -
191 14,948 31,994
- -
35 104
45 7 -
44 1,927 4,421
- -
144 10,978 22,424
- -
96 587
32 88
59 31
6 - -
32 22
- -
2 (D)
- -
22 42
- -
20 2 - - -
40 251
- - - - - -
53 39
- -
-31----
1(D)(D)
--
1----
380 14,712 29,842
1(D)
146 211
23 --
65 1,659 3,799
--
247 9,599
18,162 1
(D)
252 826
85 165
200 52
---
103 28
--
73--
52 34
4(Z)
50 2---
81 235
--2
(D)--
134 78
--
- - - - - - -
- - - - -
- - - - -
283 8,908
14,130 2
(D)
129 145
8 1 -
53 818
1,538 1
(D)
181 5,506 8,001
- -
122 220
36 42
113
9 - - -
30 5 - -
5 (D)
- -
25 (D)
- -
25 - - - -
29 46
- - 1
(D)- -
67 18
1 (D)
1 - - - - - -
- - - - -
- - - - -
345 7,761
12,228 2
(D)
226 115
4 - -
50 768 856
- -
224 4,684 6,618
2 (D)
95
114 25 33
91
4 - - -
17 6 - -
3 (D)
- -
12 3 1
(D)
12 - - - -
11 6 - - - - - -
38 16
5 2
- - - - - - -
- - - - -
- - - - -
368 6,355 8,301
2 (D)
303
61 4 - -
41 (D)(D)
- -
230 3,602 4,045
2 (D)
68 89 22 34
67
- 1 - -
12 3 - -
3 (D)
- -
11 3 - -
11 - - - -
19 40
- - 2
(D)- -
27 7 1
(D)
- - - - - - -
2 (D)(D)
2 (D)
2 - - - -
523 7,226 8,772
3 (D)
458
63 2 - -
65 523 828
- -
262 3,482 3,625
3 6
22 (D)
6 5
22
- - - -
7 (D)
- -
2 (D)
- - 5 1 - -
5 - - - -
3 1 - - - - - -
14 3 2
(D)See footnote(s) at end of table. --continued

130 MASSACHUSETTS 2007 CENSUS OF AGRICULTURE - STATE DATA USDA, National Agricultural Statistics Service
Table 60. Summary by Combined Government Payments and Market Value of Agricultural Products Sold: 2007 - Con.
[For meaning of abbreviations and symbols, see introductory text]
Item All farms $1,000,000 or more
$500,000 to $999,999
$250,000 to $499,999
$100,000 to $249,999
$50,000 to $99,999
CROPS HARVESTED - Con. Land in orchards ................................................... farms acres Irrigated ............................................................ farms acres Farms by bearing and nonbearing acres: 0.1 to 4.9 acres ...................................................... 5.0 to 24.9 acres .................................................... 25.0 to 99.9 acres .................................................. 100.0 to 249.9 acres .............................................. 250.0 acres or more ............................................... Apples ............................................................... farms bearing and nonbearing acres Grapes .............................................................. farms bearing and nonbearing acres Peaches, all ...................................................... farms bearing and nonbearing acres Almonds ............................................................ farms bearing and nonbearing acres Walnuts, English ............................................... farms bearing and nonbearing acres Land in berries (see text) ...................................... farms acres
458 5,416
86 766
279 121
49 9 -
369 4,287
76
182
206 498
3
(Z)
8 4
1,027
14,804
7351
2(D)
3112-
4232
1(D)
431
--
--
19 4,624
13 461
6 119
3 5 4 1 -
12 387
1
(D)
12 52
- -
- -
31 1,709
39 1,600
15 316
5
12 18
4 -
37 1,300
3
(D)
27 136
- -
- -
81 2,658
54 1,617
12 64
7
22 23
2 -
51 1,270
5
(D)
41 150
- -
- -
143 2,149
35 481
7 46
12 20
3 - -
34 433
4 1
17 30
- -
1 (D)
129
1,433See footnote(s) at end of table. --continued

2007 CENSUS OF AGRICULTURE - STATE DATA MASSACHUSETTS 131 USDA, National Agricultural Statistics Service
Table 60. Summary by Combined Government Payments and Market Value of Agricultural Products Sold: 2007 - Con.
[For meaning of abbreviations and symbols, see introductory text]
Item $25,000 to $49,999
$10,000 to $24,999
$5,000 to $9,999
$2,500 to $4,999
$1,000 to $2,499
Less than $1,000
CROPS HARVESTED - Con. Land in orchards ...................................................farms acres Irrigated .............................................................farms acres Farms by bearing and nonbearing acres: 0.1 to 4.9 acres ...................................................... 5.0 to 24.9 acres .................................................... 25.0 to 99.9 acres .................................................. 100.0 to 249.9 acres ............................................... 250.0 acres or more ............................................... Apples ...............................................................farms bearing and nonbearing acres Grapes ..............................................................farms bearing and nonbearing acres Peaches, all .......................................................farms bearing and nonbearing acres Almonds ............................................................farms bearing and nonbearing acres Walnuts, English ...............................................farms bearing and nonbearing acres Land in berries (see text) .......................................farms acres
51 356
8 9
21 30
- - -
45 276
10
2
34 56
3
(Z)
5 1
145 966
87 210
11 (D)
76 11
---
59 139
16 27
34 28
--
--
215 740
48 130
6 15
39
9 - - -
32 84
10 32
8 4
- -
1 (D)
113 174
44 65 10 11
43
1 - - -
37 48
7 6
9 5
- -
1 (D)
57 65
45 64
5 7
39
6 - - -
28 42
15
9
9 5
- -
- -
50 103
35 82
4 8
31
4 - - -
30 75
4 1
11
2
- -
- -
44 185
1 Landlord production expenses are included with total farm production expenses. 2 Farms with a zero net cash income are included as farms with net gains of less than $1,000.


![Agri-A4a Information AGRI Oh! e O Oh! SERIES]](https://img.pdfslide.us/doc/110x75/5acab7477f8b9a42358e1546/agri-a4a-information-agri-oh-e-o-oh-series-agri-800mm-d-w-oomm-h-agri-800mm.jpg)