Embed Size (px)
Citation preview

CHAPTER -v
ORGANISATIONAL FACTORS CAUSING
ABSENTEEISM IN CPCL
This chapter completely explores the factors directly incidental over CPCL
employees causing absenteeism. The stress creating factors at the work environment,
different inter- personal relationship among different levels of employees and nature
of work are playing vital role in this chapter. To ascertain the real causes of
absenteeism among the employees the nature of work and inter-personal relationships
create awartion and uninteresting approaches among the employees, the behavioural
aspects of top level management people and the behaviour of middle level employees
to execute the comments of the top level management create enormous amount of
stress among the lower level executives. In fact this leads to high rate of absenteeism
among the lower level executives. This chapter also explores the external factors like
family commitment and various health problem and their respective impact over
absenteeism
Factor Analysis by principle component analysis method is applied on the
level variables of interpersonal relationship among top, middle and lower level
executives.
The following variables are considered for the analysis in this study:
• Do you get on well with your co-workers?
• Do you let others know how you are feelings?
• Do you get jealous of your co-workers?
• Do you often get angry with others?
135

. Do you avoid social contacts in the recent past?
• Do you have difficulty saying 'no' to others?
• Do you have time for your hobbies, pastime?
• Do you confide your personal matters to your friends?
• Do you avoid people whose ideas are different from yours?
• Do you react defensively to constructive criticism?
. Do you look to others to make things happen to you?
The following results are obtained through factor analysis
Table 5.1
Factors of absenteeism due to inter-personal relationship
Rotation Sums of SquaredInitial Eigen values
ComponentLoadings
% of Cumulative Total% of Cumulative
Total
Variance Variance
1 3.788 34.439 34.439 2.798 25.440 25.440
ff
1.424 12.943 47.381 2.053 18.663 44.102
1.251 11.377 58.758 1.612 14.656 58.758
.937 8.522 67.279
5 .886 8.055 75.335
6 .718 6.529 81.863
7 .591 5.375 87.238
8 .487 4.431 91.669
9 .454 4.125 95.794
10 .262 2.378 98.172
11 .201 1.828 100.000
Extraction Mettioa: inncipai imiwiJ
From the above Table, it is found that the eleven variables are converted into
three major factors. These eleven variables explain 58.75% of the total variance.
Table presents the variable loadings of each factor.
- 136
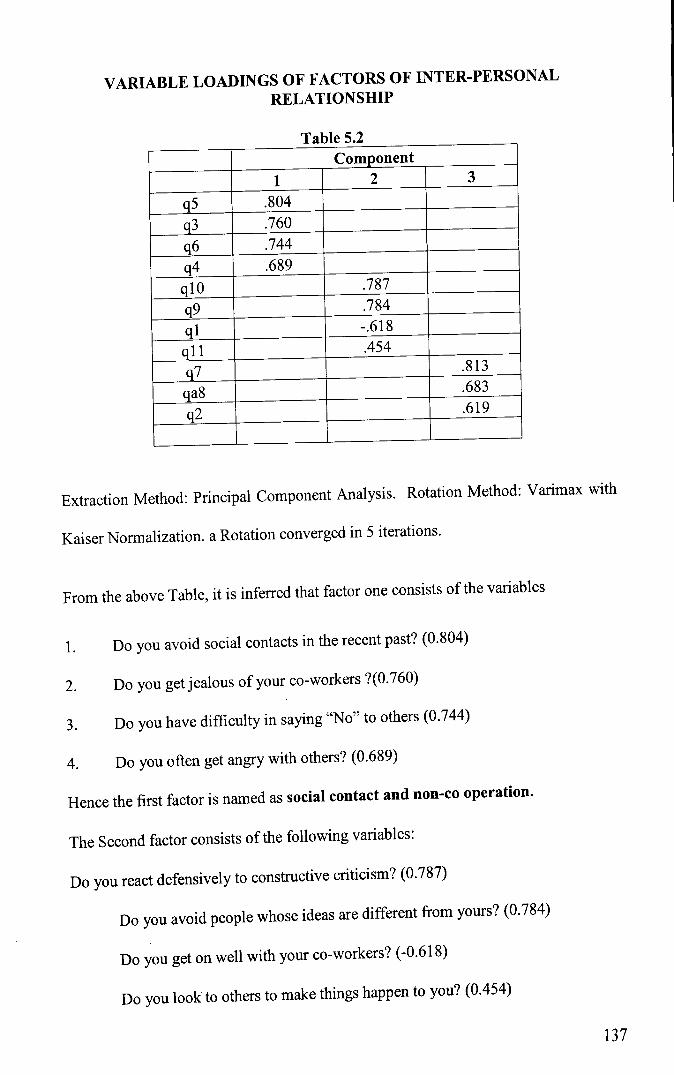
VARIABLE LOADINGS OF FACTORS OF INTER-PERSONALRELATIONSHIP
Tih1e 5.2Component
1 2 3
q5 .804
q3 .760
q6 .744
q4 .689
qlO .787
q9 .784
qi -.618
qil .454
q7 .813
qa8 .683
q2 .619
Extraction Method: Principal Component Analysis. Rotation Method: Varimax with
Kaiser Normalization, a Rotation converged in 5 iterations.
From the above Table, it is inferred that factor one consists of the variables
1. Do you avoid social contacts in the recent past? (0.804)
2. Do you get jealous of your co-workers ?(0.760)
3. Do you have difficulty in saying "No" to others (0.744)
4. Do you often get angry with others? (0.689)
Hence the first factor is named as social contact and non-co operation.
The Second factor consists of the following variables:
Do you react defensively to constructive criticism? (0.787)
Do you avoid people whose ideas are different from yours? (0.784)
Do you get on well with your co-workers? (-0.618)
Do you look to others to make things happen to you? (0.454)
137

Therefore the second factor can be suitably named as (Cordial) relationships and
openness.
The Third factor emerges from the variables
Do you have time for your hobbies? (0.813)
Do you confide personal matters to your friends? (0.683)
Do you let others know your feelings? (0.619)
Therefore this factor can be called as leisure time and sharing the views.
So, it is concluded that CPCL, the absenteeism due to interpersonal
relationships is evolved in the form of factors; lack of social contacts and non-co
operation", "cordial relationships and openness" and "leisure time and sharing of
views".
THE PREDOMINANT FACTORS OF INTER-PERSONAL RELATIONSHIP
CAUSING STRESS:
Factor analysis extracted three factors of interpersonal relationships among the
employees of the CPCL namely:
. Social contacts and non co-operation (SCNON)
Cordial relationships and openness (OPCOR)
. Leisure time and sharing of views (LTS HARE)
The one sample "t" test with test value 3 is applied on eleven variables of
absenteeism due to interpersonal relationships and the following results are obtained.
138

Table 5.3
One-Sample Statistics for variables of absenteeism due to inter-personalrelationship
Table 5.4
One-Sample Test for variables of absenteeism due to inter-personal relationship
Test Value = 395% Confidence
t Df Sig. (2-tailed) Mean Difference Interval of the Difference
Lower Upper
qi 7.391 599 .000 .80000 .5852 1.0148
q2 4.075 599 .000 .45000 .2309 .6691
q3 -3.562 599 .001 -.51000 -.7941 -.2259
q4 -2.730 599 .008 -.35000 -.6044 -.0956
q5 -2.394 599 .019 -.33000 -.6035 -.0565
q6 .152 599 .880 .02000 -.2415 ;2815
q7 -.527 599 .599 -.07000 -.3334 .1934
qa8 -.414 599 .680 -.05000 -.2899 .1899
j
-2.478 599 .015 -.34000 -.6123 -.0677
-1.205 599 .231 -.13000 -.3441 .0841
.386 599 .701 .21000 -.8703 1.2903
The value 4.3 revealed that the mean values of variables of absenteeism due to
inter-personal relationship range from 2.49 - 3.80.
139

The 't' test significance is displayed in Table 5.4 This shows that the
employees in the CPCL agree with absenteeism due to cordial relationship with co-
workers, understanding others feelings and maintaining a smooth relationship to
achieve things at work. The employees remain undecided to express their opinion in
difficulty in saying "No" to others, confiding the personal matters and having time for
their hobbies. They disagree with absenteeism due to jealousy of co-workers, getting
angry with others, avoiding social contacts, avoiding ideas from others and reaction to
constructive criticism. One sample "t" test is applied on the above-mentioned three
factors and the following results are obtained.
Table 5.5
One-Sample Statistics for factors of inter-personal relationship
Factors N Mean Std. Deviation Std. Error Mean
SCNON 600 2.7075 1.06307 .10631
OPCOR 600 3.1875 1.49468 .14947
LTSHARE 600 3.1200 .88321 .08832
Table 5.6
One-Sample Test for factors of inter-personal relationship
Test Value 3
Sig. (2- Meantailed' Difference
-2.751 599 .007 -.29250
1.254 599 .213 .18750
1.359 599 .177 .12000
95% Confidence Intervalof the Difference
Lower Upper
-.5034 -.0816
-.1091 .4841
-.0552 .2952
Factors
SCNONOPCORLTSHARE
t I df
140

Table revealed that the mean value of factors ranging are from 2.71 - 3.18.
The "t" test value used for these mean values and the test value 3 show that the
employees CPCL disagree with the absenteeism due to social contacts and non-
cooperation from the employees. In the case of other factors like "openness and
cordial relationships" and "leisure time and sharing view" the employees are not able
to decide absenteeism due to openness and sharing of views. So, it is concluded that
CPCL absenteeism due to interpersonal relationships is not significant among the
employees.
ABSENTEEISM AND WORK ENVIRONMENT
Work environment is one of the crucial factors for stress, many public and
private sector organizations acknowledge the un-acceptance costs of absenteeism and
have resorted to providing a better place of work. There are many macro and micro
factors at work, which leads to stress. They are: (a) Organisational culture: Building a
supportive and open climate and culture and ensuring that the style of management is
compatible with the goals and aims which are important in reduction of stress. It means
developing a culture that encourages staff to be more supportive of each other. This will
facilitate team working and good inter-personal relationships in the work place. b) Work
overload: A high work overload leads to long hours of working either as paid to as paid
or unpaid overtime. Re-analysis of staffing levels, task redesign helps reduce work
overload. (c) Safety: physical and psychological safety is a basic human need and having
a predictable and non-threatening environment is fundamental to this need. (d)The
absenteeism can be associated with uncertainty and ambiguity about the future and
career potential. (e) Absenteeism can be caused if there is no participative decision-
making which need to be a part of their job. (f) Absenteeism if there is discrimination on
141

the basis of race, colour, sex or creed (g) Absenteeism from work could be in the form
of pay and associated fringe benefits, allowances if they are lesser than what the
employee actually deserves or expects (h) The constructs of role conflict are also
acknowledged as a potent source of absenteeism in work environment that has negative
attitudinal and behavioral outcomes (i) the nature of leadership, the policies and
procedures of organization, job insecurity, organisational change and uncertainty, targets
and deadlines, authoritarian culture and poor work relationship are some major causes of
absenteeism of work.
These when increased further in magnitude will alleviate the problems associated
such as low work motivation and job dissatisfaction. Thus employees are more attached
to organization with good policies and family friendly atmosphere which causes job
enrichment and reduction in stress, and greater turnover.
Factor analysis is applied on the twenty-eight variables on absenteeism due to
work environment and the following results are obtained
142

Table 5.7
Factors of absenteeism due to work environment
Corn- Initial EigenvaluesRotation Sums of Squared
ponent ____________ Loadin u,,s
Total% of Cumulative Total
% of Cumulative.
Variance % Variance %
1 14.337 51.203 51.203 6.074 21.693 21.693
2 2.147 7.668 58.871 6.049 21.603 43.296
3 1.778 6.350 65.221 5.934 21.193 64.489
4 1.578 5.635 70.856 1.704 6.085 70.574
5 1.312 4.686 75.542 1.391 4.968 75.542
6 .984 3.513 79.055
7 .845 3.018 82.073
8 .694 2.477 84.551
9 .632 2.258 86.809
10 .545 1.946 88.755
11 .472 1.684 90.439
12 .443 1.583 92.022
13 .417 1.488 93.509
14 .320 1.143 94.652
15 .263 .939 95.591
16 .216 .770 96.361
17 .173 .619 96.980
18 .137 .490 97.470
19 .127 .453 97.923
20 .117 .419 9 8.3 42
21 .093 .333 98.674
22 .081 .289 98.963
23 .068 .244 99.207
24 .061 .217 99.424
25 .050 .179 99.603
26 .045 .162 99.765
27 .037 .131 99.896
28 .029 .104 100.000
Extraction Method: I-'rinclpal component i-uLu1y1.
From the above Table, it is found that the twenty eight variables are converted
into five major factors with 75.542 per cent of total variance, the variable loadings of
each factor is presented in the Table 4.11
143

Table 5.8
Variable loadings of factors of absenteeism due to work environment
1 2 3 4 5
q27 .783
q21 .767
q20 .723
q29 .697
q22 .693
q26 .692
q28 .657
q30 -.578
q25 .553
q35 .836
q32 .823
q33 .803
q36 .796
q37 - .775
q40 - -.700
q34 .595
q31 - .581
q18 .877
q13 .840
q14 .830
q17 .828
q15__ .809
q12 .710
q16 _________ _________ .654
q39 ________ .769 ________
q38 .702
_________ ___________________ .739q24 q19
Extraction Method: Principal Component Analysis. Rotation
Method: Varimax with Kaiser Normalization, a Rotation converged in 21 iterations.
From the above Table it is derived that factor one consists of the variables
27. I receive additional allowances and facilities besides my salary (0.783)
144

21. I have job security (0.767)
20. The demands of my job does not interfere with my family (0.723)
29. The management takes personal interest in my well being (0.697)
22. Conditions on my job allow me to be as productive I can be (0.693)
26. Promotions are handled fairly at work (0.692)
28. I keep learning new things at work (0.657)
30. In the past 12 months I have had pain in hands, arms, shoulders, wrist, back (-
0.578)
25. There is no age, race, gender discrimination at work (0.553)
Hence the first factor is called management policy.
The second factor consists of the following variables:
35. I do not feel I am always under pressure (0.836)
32. I am able to meet deadlines (appointments, chores, promises) (0.823)
33. I do not have conflicts and disagreements with peer's, superior's often (0.803)
36. I do not have difficulty in concentrating at work (0.796)
37. All in all I am satisfied at work (0.775).
40. I feel tired at the beginning of the day (-.400).
34. I do not feel I am always under pressure (0.595).
31. My main satisfaction in life comes from work (0.58 1).
Therefore the second factor is suitably called as work performance.
The Third factor consists of the following variables.
18. I have sufficient time to get the work done (0.877).
145

13. My job lets me use the best of my abilities and skills (0.840).
14. Management has taken necessary steps to ensure safety at work (0.830).
17. I receive necessary equipments to get my work done (0.828).
15. I have enough people or staff to get all the work done (0.809).
6. I know what is expected of me at work (0.710).
16. The chances of promotion are good at work (0.654).
Therefore the third factor is named as promotion and facilities.
The Fourth factor consists of the following variables.
39. My fringe benefits are good (0.769).
38. I feel lonely (0.702).
Hence the fourth factor is suitably called as benefits and seclusiveness.
The fifth factor consists of the following variables.
24. I have too much work to do everything well (0.739).
19. My job requires me to do lifting, pulling, pushing, bending (0.448)
So this factor is called work load.
Hence it is concluded that in the CPCL the absenteeism due to work environment is
evolved in the form of
1. Management policy (MP)
2. Work performance (WP)
3. Promotion and facilities (PROFACT)
4. Benefits and seclusiveness (BFSECLUS)
5. Work load (WL)
One sample "t" test is applied on the above-mentioned five factors and the
following results are obtained.
146
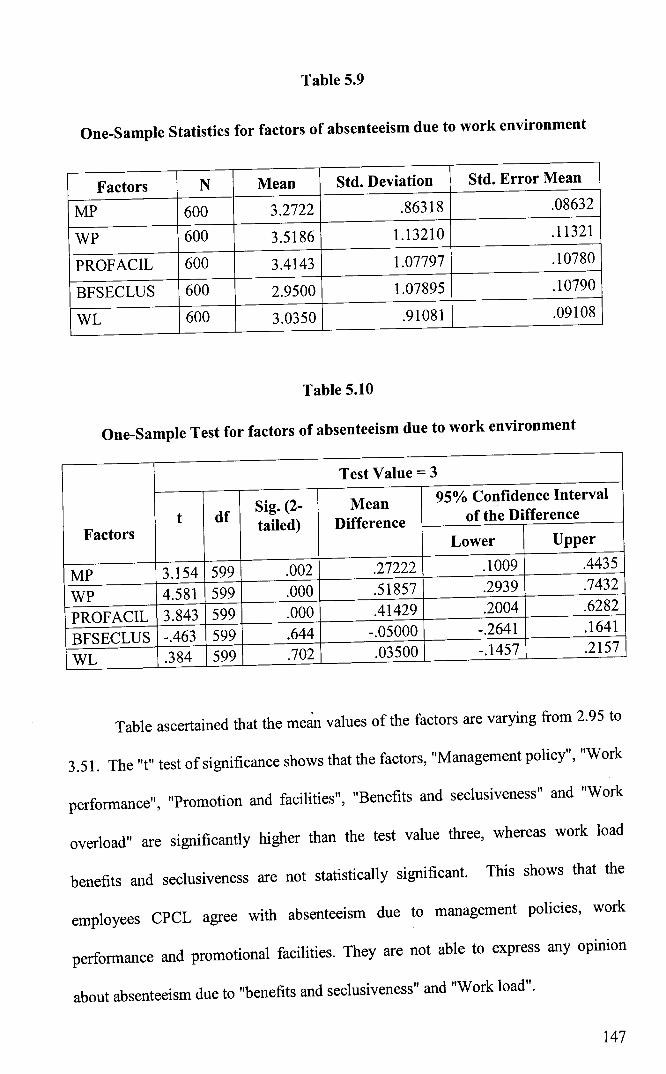
Table 5.9
One-Sample Statistics for factors of absenteeism due to work environment
Factors N Mean Std. Deviation Std. Error Mean JMP 600 3.2722 .86318 .08632
TWP 600 3.5186 1.13210 .113211
[IOFACIL 600 3.4143 1.07797 .107
[BFSECLUS 600 2.9500 1.07895 .107
WL 600 3.0350 .91081 .091
Table 5.10
One-Sample Test for factors of absenteeism due to work environment
Test Value = 3
t I dfFactors
MP 3.154 599WP 4.581 599
PROFACIL 3.843 599BFSECLUS -.463 599WL .384 599
Sig. (2-tailed)
.002
.000
.000
.644
.702
MeanDifference
.27222
.51857
.41429-.05000.03500
95% Confidence Intervalof the Difference
Lower Upper
.1009 .4435
.2939 .7432
.2004 .6282
-.2641 .1641
-.1457 .2157
Table ascertained that the mean values of the factors are varying from 2.95 to
3.51. The "t" test of significance shows that the factors, "Management policy", "Work
performance", "Promotion and facilities", "Benefits and seclusiveness" and "Work
overload" are significantly higher than the test value three, whereas work load
benefits and seclusiveness are not statistically significant. This shows that the
employees CPCL agree with absenteeism due to management policies, work
performance and promotional facilities. They are not able to express any opinion
about absenteeism due to "benefits and seclusiveness" and "Work load".
147

ABSENTEEISM AND HEALTH
Absenteeism can cause a toll on health prolonged periods of stress, where body
does not return to a homeostatic state, can result in chronic exhaustion and illness.
Under such constant stress, the body continues to manufacture increased quantities of
absenteeism chemicals, which depresses the immune system.
When absenteeism occurs, the signs and its effects on body are increased heart
rate, high blood pressure, difficulty in breathing, difficulty in swallowing, feelings of
nausea, hyperventilation, contracted muscles, backache, hot and cold t'lushes, blushing,
sweating, skin dryness, rashes, numbness, stinging, sensation, increased blood sugar
levels, dilation of pupils, dry mouth and frequent urination; these are caused when there
is an imbalance between the demands of everyday life and the ability of cope.
The effects are broadly categorized into behavior, thoughts, emotions, and
health. Behavior difficulty sleeping, loss of appetite, avoidance of particular situations,
inactivity. Thoughts difficulty in concentrating, in making decisions, forgetfuliness,
distorted ideas, emotions anxiety, moodiness, apathy, fatigue, tension, panic, phobias,
nervousness and health stomach ulcers, migraine, diarrhoea, skin rashes, strokes and
coronary heart diseases. Physical exercise can boost the immune system and increase the
activity of the body. The ability to cope absenteeism depends on how the balance
between demands in life, operates everyday.
Thus it can be seen that absenteeism and health are closely linked. The life skills
such as assertiveness and rational thinking can equip an individual to cope with the
demands of everyday life.
148

I find myself confused or restless, jittery, nervous
1. I lack fulfillment, joy, and peace in life
2. Ineglect my diet
3. I neglect my network of friends.
4. I have difficulty maintaining a healthy weight.
5. I spend a lot of time thinking about the past.
6. I feel my leave turnover has been increasing in the recent past.
7. I have difficulty in remembering things.
Therefore this factor can be called as physiological Psychological changes
(PPFACTO).
Factor analysis revealed that the employees in CPCL have classified the
absenteeism due to health as psychological and physiological features. One sample
"t" test is applied on this factor and the following results are obtained.
Table 5.11
One-Sample Statistics for absenteeism due to health
Factor N Mean Std. Deviation Std. Error Mean
PPFACTO 600 2.8170 1.20270 .12027
Table 5.12
One-Sample Test for absenteeism due to health
Test Value = 3
Factor Tdf Sig. (2- Mean 95% Confidence Interval
tailed) Difference of the Difference
Lower Upper
-.18300 -.4216 .0556PPFACTO
149

From the Table it is known that the mean values of the effect of absenteeism
are 2.81, which is not, statistically significant w.r.t the test value three. This shows
that the employees in the CPCL are not able to express their opinion about
physiological and psychological changes due to absenteeism in their organisation
significantly.
One-way analysis of variance for absenteeism due to interpersonal relationship
with respect to Age
One-way analysis of variance is applied for three factors of interpersonal
relationship namely "non-cooperation", "Openness and cordial relationship", "leisure
time and sharing of views" with respect to the age groups 18-30, 31-40 and 40-50,
respectively.
Table 5.13
ANOVA for factors absenteeism due to inter-personal relationship with respect
to AGE
From the above Table it is found that the factor social contact and non-co
operation differ significantly with respect to age. The report Table 4.19 revealed that
150

the employees in the age group 18-30 are in an undecided mood about absenteeism
due to social contact and non - co operation, followed by the age group 40-50 and 31-
40.
One-way analysis of variance for absenteeism due to interpersonal relationship
with respect to gender
One-way analysis of variance is applied for three factors of inter-personal
relationship namely " non-cooperation and social contacts" "Openness and Cordial
Relationship", "leisure time and sharing of views" with respect to gender male and
female.
Table 5.14
ANOVA for factors absenteeism due to inter-personal relationship with respect
to GENDER
Factors Sources Sum of Squares Mean Square F Sig.
[SCNON Between Groups .272 .272 .239
Within Groups 111.610 1.139
L Total 111.882
LOPCOR Between Groups 2.010 2.010 .899 .345
Within Groups 219.162 2.236
Total 221.172
SHARE Between Groups 1.807 1.807 2.348 .129
Within Groups 75.420 .770
Total 77.227
From the above Table it is found that none of the factors of inter-personal
relationship differ significantly with respect to gender. So it is concluded that both
male and female employees CPCL are the same in their opinion about absenteeism
due to interpersonal relationship.
151

One-way analysis of variance for absenteeism due to interpersonal relationship
with respect to job status.
One-way analysis of variance is applied for three factors of interpersonal relationship
namely "Social contacts and non-co-operation", "Openness and Cordial relationship",
"leisure time and sharing of views" with respect to job status lower, middle, top level
respectively.
Table 5.15
ANOVA for factors absenteeism due to inter-personal relationship with respect
to JOB
Factors Sources Sum of Squares Mean Square F Sig.
SCNON Between Groups 53.456 26.728 44.374 .000
Within Groups 58.426 .602
Total 111.882
OPCOR Between Groups 12.390 6.195 2.878 .061
Within Groups 208.782 2.152
Total 221.172 ______
LTSHARE Between Groups 11.451 5.725 8.443 .000
Within Groups 65.776 .678 ____
Total 77.227
From the above Table it is found that the factors "social contact and non-
cooperation", and "leisure time and sharing of views" differ significantly with respect
to job status.
The report Table revealed that the employees in the job status of lower level
and middle level are in an undecided mood about absenteeism due to "social contact
and non-co-operation" and "leisure time and sharing of views", followed by the job
status of employees who are at a higher level.
152

One-way analysis of variance for absenteeism due to interpersonal relationship
with respect to salary.
One-way analysis of variance is applied for three factors of interpersonal
relationship namely "social contacts and non-co-operation", "openness and cordial
relationship", "leisure time and sharing of views" with respect to salary 3000-5000,
5000-10000, and above 10,000.
Table 5.16
ANOVA for factors absenteeism due to inter-personal relationship with respectto SALARY
Factors SourcesSum of Mean Square F Sig. I
L Squares
çNON Between Groups 50.277 25.138 39.582 .0001
Within Groups 61.605 .635
Total 111.882
LQCOR Between Groups 13.830 6.915 3.235 .044
Within Groups 207.342 2.138
L Total 221.172
JJSHARE Between Groups 13.235 6.618 10.031 .000
Within Groups 63.991 .660
Total 77.227
From the above Table it is found that the factors "social contact and non-
cooperation", "Openness and cordial relationships" and "leisure time and sharing of
views" differ significantly with respect to salary.
The report Table revealed that the employees whose salaries are in between
3000-5000 are in an undecided mood about absenteeism due to "social contacts and
non-cooperation", followed by employees whose salaries are between 5000-10,000
and above 10,000.
153

One-way analysis of variance for absenteeism due to interpersonal relationship
with respect to experience
One-way analysis of variance is applied to three factors of interpersonal
relationship namely "social contacts and non-co-operation", "openness and cordial
relationship", "leisure time and sharing of views" with respect to experience of 1-5, 5-
10 and above 10 years.
Table 5.17
ANOVA for factors absenteeism due to inter-personal relationship with respect
to EXPERIENCE
Factors Sources Sum of Squares Mean Square F Sig.
SCNON Between Groups 31.484 15.742 18.993 .000
Within Groups 80.398 .829
Total 111.882
OPCOR Between Groups 6.070 3.035 1.369 .259
Within Groups 215.102 2.218
Total 221.172 ______
LTSHARE Between Groups 5.650 2.825 3.829 .025
Within Groups 71.576 .738
Total 77.227 I
From the above Table it is found that the factors "social contacts and non-co-
operation", "leisure time and sharing of views", differ significantly with respect to
experience.
The report Table revealed that the employees in the experience of 7-5 years
are in an undecided mood about absenteeism due to "social contacts and non co-
operation", "leisure time and sharing of views", followed by employees whose
experience are 5-10 and above 10 years.
154

Analysis of variance for absenteeism due to work environment
The five factors of work environment namely management policy, work
performance, promotion and facilities, benefits and seclusiveness and work load are
subject analysis of variance with respect to the demographic variables age, gender,
education and job status and the results are discussed here under:
01. Analysis of variance for absenteeism due to work environment with
respect to age:
Table 5.18
ANOVA for absenteeism due to work environment with respect to AGE
Factors Sources Sum of Squares Mean Square F Sig.
MP Between Groups 2.976 1.488 2.039 .136
Within Groups 70.786 .730
Total 73.762
WP Between Groups 5.499 2.750 2.197 .117
Within Groups 121.385 1.251
Total 126.884
PROFACIL Between Groups 1.346 .673 .574 .565
Within Groups 113.695 1.172
Total 115.041
BFSECLUS Between Groups 1.003. .502 .426 .654
Within Groups 114.247 1.178
Total 115.250
WL Between Groups 4.739 2.369 2.970 .056
Within Groups 77.389 .798
Total 82.128
From the above Table it is found that there is no significant difference in the
factors of absenteeism due to work environment with respect to age. The employees
155

in different age group CPCL expressed the same opinion about absenteeism due to
work environment.
2. Analysis of variance for absenteeism due to work environment with
respect to gender:
Table 5.19
ANOVA for absenteeism due to work environment with respect to GENDER
Factors Sources Sum of Squares Mean Square F Sig.
MP Between Groups 1.007 1.007 1.357 .247
Within Groups 72.755 .742
Total 73.762
WP Between Groups .146 .146 .113 .738
Within Groups 126.738 1.293 _
Total 126.884
PROFACIL Between Groups .176 .176 .151 .699
Within Groups 114.864 1.172
Total 115.041
BFSECLUS Between Groups .397 .397 .339 .562
Within Groups 114.853 1.172
______ Total 115.250 _____
WL Between Groups 3.288 3.288 4.087 .046
Within Groups 78.839 .804
82.127
From the above Table it is found that there exists significant difference in the
factors work load with respect to gender, other factors do not differ significantly. The
arithmetic mean analysis revealed that the female employees CPCL are very much
affected by absenteeism due to work load than male employees.
156

3. Analysis of variance for absenteeism due to work environment with
respect to job status:
Table 5.20
ANOVA for absenteeism due to work environment with respect to
JOB STATUS
Factors SourcesSum of Mean Square F Sig.Squares
MP Between Groups 12.179 6.089 9.591 .000
Within Groups 61.584 .635
Total 73.762 _
WP Between Groups 33.603 16.802 17.472 .000
Within Groups 93.281 .962
Total 126.884
PROFACIL Between Groups 35.727 17.863 21.847 .000
Within Groups 79.314 .818
--Total 115.041 ______
BFSECLUS Between Groups 4.028 2.014 1.757 .178
Within Groups 111.222 1.147
Total 115.250
WL Between Groups 4.715 2.357 2.954 .057
Within Groups 77.413 .798
From the above Table, it is found that the factors management policy, work
performance, promotion and facilities differ significantly with respect to job status.
The mean analysis explained that the lower level executives are affected by
absenteeism due to management policies, work performance, promotion and facilities,
followed by middle level executives and top-level executives. So it is concluded that
absenteeism prevails more among lower level executives.
157

4. Analysis of variance for absenteeism due to work environment with
respect to salary:
Table 5.21
ANOVA for absenteeism due to work environment with respect to SALARY
Sum of MeanPFactors Sources F Sig.
Squares Square
Between Groups 11.808 5.904 9.243 .000
Within Groups 61.955 .639
Total 73.762
WP Between Groups 35.283 17.642 18.681 .000
Within Groups 91.601 .944
Total 126.884
PROFACIL Between Groups 35.622 17.811 21.754 .000
Within Groups 79.419 .819
Total 115.041
BFSECLUS Between Groups 2.799 1.400 1.207 .303
Within Groups 112.451 1.159
Total 115.250
WL Between Groups 6.388 3.194 4.090 .020
Within Groups 75.740 .781
Total 82.128
From the above Table it is found that the factors of absenteeism due to work
environment namely management policy, work performance, promotion and facilities
and work load differ significantly at 5 percent level of significance. The mean
analysis ascertained that the employees in the income group above 10,000 are affected
by the absenteeism due to management policies, work performance, promotion and
facilities. But in the case of workload, the employees with salary less than 5000 are
affected by absenteeism more than others.
158

5. Analysis of variance for absenteeism due to work environment with respect to
experience:
Table 5.22
ANOVA for absenteeism due to work environment with respect to
EXPERIENCE
Factors
Sum of Mean Square F Sig.Squares
MP Between Groups 6.332 3.166 4.555 .013
Within Groups 67.430 .695
Total 73.762 _______ ______
WP Between Groups 22.853 11.426 10.654 .000
Within Groups 104.031 1.072
Total 126.884
PROFACIL Between Groups 24.819 12.410 13.342 .000
Within Groups 90.222 .930
Total 115.041 ______
BFSECLUS Between Groups 5.319 2.659 2.347 .101
Within Groups 109.931 1.133
______ Total 115.250
WL Between Groups 5.422 2.711 3.428 .036
Within Groups 76.705 .791 ____
82.128 __ ____ ^
From the above Table, it is inferred that the employees in the CPCL differ
significantly in their opinion about absenteeism due to management policies, work
performance, promotion facilities and work load. Based on their experience, the
arithmetic mean analysis revealed that the absenteeism due to management policies,
work performance, promotion facilities affect the employees with more than 10 years
of experience. As far as the work load is concerned, the employees with experience
5-10 years are very much affected by the work load than others.
159

Analysis of variance for absenteeism due to health:
The factors analysis on the variables of absenteeism due to health revealed the
existence of a unique major factor. Now One-way analysis of variance is applied on
the factor with respect to all the demographic variables.
01. Analysis of variance of absenteeism due to health factor with respect to
Age:
Table 5.23
ANOVA For absenteeism due to health factor with respect to AGE:
Sum of Squares Mean Square F Sig.
LIL 16.463 8.231 6.300 .003
s 126.738 1.307
143.201
Sources
BetweenWithin (Total
From the above Table it is inferred that the employees in the CPCL differ
significantly in their opinion about absenteeism due to health factor based on their
age. The employees in the age group between 30-40 are affected by absenteeism due
to health whereas others are not affected by the health stress.
02. Analysis of variance of absenteeism due to health factor with respect to
Gender:
Table 5.24
ANOVA For absenteeism due to health factor with respect to GENDER
Sources Sum of Squares Mean Square F Sig.
Between Lps 4.951 4.951 3.509 .064
Within (
138.250 1.411
Total
143.201
160

From the above Table, it is found that there is no significant difference
between male and female employees in the CPCL in the opinion of absenteeism due
to health. It is concluded that both of them are equally affected by absenteeism due to
health.
03. Analysis of variance of absenteeism due to health factor with respect to
job status:
Table 5.25
ANOVA for absenteeism due to health factor with respect to JOB STATUS
Sources Sum of Squares Mean Square F Sig.
Between Groups 23.618 11.809 9.579 .000
Within Groups 119.583 1.233
Total 143.201
From the above table, it is ascertained that the employees of the CPCL differ
in their opinion about health absenteeism with respect to their status. The mean
analysis revealed that the top-level executives are very much affected by absenteeism
due to health whereas others are not at all affected by health stress.
161
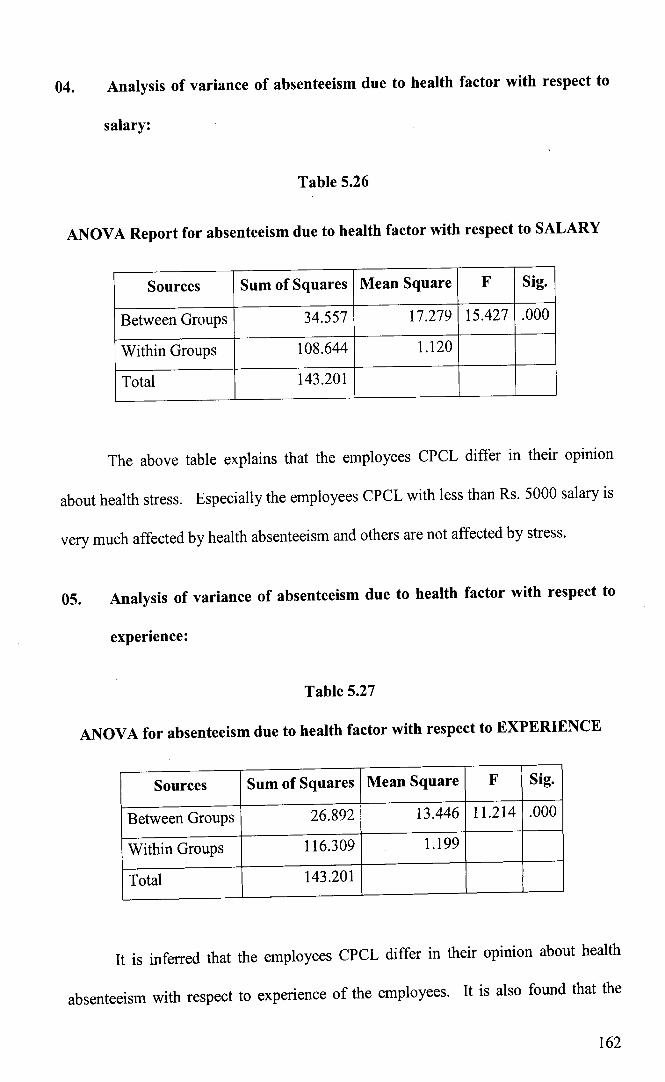
04. Analysis of variance of absenteeism due to health factor with respect to
salary:
Table 5.26
ANOVA Report for absenteeism due to health factor with respect to SALARY
Sources Sum of Squares Mean Square F Sig.
Between Groups 34.557 17.279 15.427 .000
Within Groups 108.644 1.120
Total 143.201
The above table explains that the employees CPCL differ in their opinion
about health stress. Especially the employees CPCL with less than Rs. 5000 salary is
very much affected by health absenteeism and others are not affected by stress.
05. Analysis of variance of absenteeism due to health factor with respect to
experience:
Table 5.27
ANOVA for absenteeism due to health factor with respect to EXPERIENCE
Sources Sum of Squares Mean Square F Sig.
Between Groups 26.892 13.446 11.214 .000
Within Groups 116.309 1.199
Total 143.201
It is inferred that the employees CPCL differ in their opinion about health
absenteeism with respect to experience of the employees. It is also found that the
162

employees CPCL with experience 10-15 years are very much affected by health
absenteeism followed by employees with less than 5 years.
FACTORS OF EMPLOYEES ABSENTEEISM AND ITS INFLUENCE ON
CPCL EMPLOYEES AND THEIR ORGANISATION
In a competitive and global business environment, converting challenges into
business opportunities needs a high degree of integration of resources and
competencies. It is essential to empower the people involved in converting the
opportunities with unstinted devotion. An absenteeism practice at all levels is
considered as a powerful tool to achieve the adequate outputs. The absenteeism
process for both men and employees in every organisation is congruent to
absenteeism practices and its implementation of its subsistence'. The outcomes and
their effectiveness of absenteeism emerge in the form of improvement in the
individual efficiency, organisational efficiency, productivity and creation of optimistic
atmosphere. One of the most successful strategies is employee absenteeism. As a HR
strategy, it indicates the tremendous faith reposed by the organisation in the abilities
of an employee to deliver the value chain2 . Recognition and respect for the
individual's potential is the very essence of absenteeism.
In this chapter the employee's absenteeism factors of organisation and external
influence are going to be found out microscopically. T-test is applied to study the
opinion of the CPCL Employees about various processes in the organisation. Factor
analysis is a multivariate tool applied to reduce the numerous number of variables
used in the study into major factors.
163

ABSENTEEISM RELATED FACTORS
Absenteeism related factors play a conscious and effective role in CPCL
Employees and their absenteeism. To be successful in today's business environment,
companies need the knowledge, ideas, energy, and creativity of every employee, from
front line workers to the top-level managers in the executive suite. Absenteeism
practices are implemented with the hopes of building employee commitment,
overcoming worker dissatisfaction, and reducing absenteeism, turnover, poor quality
work, and sabotage. Reservations are given more priorities in case of public sector.
Whereas the policies of the private and MNC the main concern is on improvement of
employees in the organisation. Accordingly, absenteeism related factors in all the
sectors prominence is on the employee's role in the organization.
In this study Absenteeism related factors on absenteeism of CPCL Employees
are identified through 5 statements (see appendix) regarding the prominent role of
absenteeism related factors in the organization. One Sample T-test is applied on five
variables of Absenteeism related factors on CPCL Employees. This test is performed
with the test value 3 and the following results are obtained.
Table: 5.28
One-Sample Statistics for Absenteeism related factors
N Mean Std. Deviation Std. Error Mean
SRF1 600 3.9475 .99252 .04461
SRF2 600 3.9515 .94036 .04227
SRF3 600 3.6424 .97510 .04383
SRF4 600 3.8364 .80954 .03639
SRF5 600 3.8081 .96996 I .04360
Source: Computed Data
164

From the above Table it is found that all the mean values are greater than 3 in
particular ranging from 3.64 to 3.95 with their respective standard deviation it is
observed that the standard deviation of these five variables are strictly less than 1, this
implies the consistency of the opinions of CPCL Employees
TABLE: 5.29
One-Sample Test for Absenteeism related factors
Test Value = 3
t dfSig. (2- Mean 95% Confidence Interval of
tailed) Difference the Difference
Lower Upper
SRF1 21.239 599 .000 .94747 .8598 1.0351
SRF2 22.512 599 .000 .95152 .8685 1.0346
SRF3 14.658 599 .000 .64242 .5563 .7285
SRF4 22.986 599 .000 .83636 .7649 .9079
SRF5 18.535 599 .000 .80808 .7224 .8937
Source: Computed Data
From the above Table it is found that t-test values are significantly greater
than the test value 3 at 5% level of significance. So CPCL Employees agree with the
aggressive behaviour and extraction of best of service in the form of increased work
load. They profoundly believe that adoption of target reaching and offering long
working hours is the main strategy of the management to create absenteeism among
the employees. CPCL Employees also agree that, potentiality and emphasis on regular
breaks are the indication of absenteeism formation.
PHYSICAL RESPONSE TO STRESS
The influence of absenteeism on physical and psychological well being is well
documented. Absenteeism has been implicated in heart disease, eating disorders,
165

stroke, insomnia, ulcers, accident proneness, cancer, decreased immunity, chronic
headaches, diabetes, depression, substance abuse, chronic pain, irritable bowel
syndrome and chronic fatigue. In fact, estimates are that 50 to 80 percent of all
physical disorders have psychosomatic or absenteeism related origins. CPCL
Employees report high absenteeism are three times more likely than employees
reporting low absenteeism to suffer from frequent illness. In this study 9 statements
are (see appendix) prepared to identify the physical response to stress. One Sample T -
test is applied on these nine variables and the Table infers the following results.
Table: 5.30
One-Sample Statistics for Development of physical response to stress
N Mean Std. Deviation Std. Error Mean
PR1 600 4.0263 .87087 .03914
iR2 600 3.8808 .82222 .03696
[TR33 600 3.8162 .84685 .03806
r PR4 600 3.7596 .79011 .03551
PiR5 600 3.8263 2.04754 .09203
riR6 600 3.8990 1.25410 .05637
r PR7 600 3.5596 .96915 .04356
rR8 600 3.8364 .79440 .03571
600 3.7737 .82553 .03710
Source: Computed Data
It is ascertained from the above Table that all the mean values are greater than
3 in ranging from 3.55 to 4.02 with their respective standard deviation. It is observed
that the standard deviation of eight variables out of nine variables are strictly less than
1, this implies the uniformity of the opinions of CPCL Employees .so the CPCL
Employees widely oscillate in their opinion about the variables of physical responses
to absenteeism and withstanding the future challenges.

Table 5.31
One-Sample Test for physical response to stress
Test Value = 3
t Df Sig. (2-tailed) Mean Difference95% Confidence
Interval of the Difference
Lower Upper
PR1 26.218 599 .000 1.02626 .9509 1.1032
PR2 23.834 599 .000 .88081 .8082 .9534
PR3 21.442 599 .000 .81616 .7414 .8909
PR4 21.389 599 .000 .75960 .6898 .8294
PR5 8.978 599 .000 .82626 .6454 1.0071
PR6 15.949 599 .000 .89899 .7882 1.0097
PR7 12.847 599 .000 .55960 .4740 .6452
PR8 23.424 599 .000 .83636 .7662 .9065
PR9 20.853 599 .000 .77374 .7008 .8466
Source: Computed Data
From the above Table it is observed that t-test values are significantly greater
than the test value 3 at 5% level of significance. It is found that the CPCL Employees
agree with the effects of head aches and stomach ache. They get these aches due to
heavy work load and stressful climate. They often get backache and stiffness in the
shoulder, high blood pressure. The CPCL Employees rarely get palpitations and rapid
breath. The employees sometimes encounter with problem of diabetes and dizziness.
BEHAVIOURAL RESPONSE TO STRESS
Once the existence of absenteeism has been recognized and the stressors
identified, action to deal with absenteeism should be taken. Absenteeism is a misfit
between the demands of the environment and the individual's abilities, the imbalance
may be corrected, according to the situation, either by adjusting external demands to
fit the individual or by strengthening the individual's ability to cope, or both. One
167

Sample T-test is applied on nine variables (see appendix) of behavioral response of
employees to absenteeism and the following results are obtained.
TABLE: 5.32
One-Sample Statistics for Organization Development and Employees
Absenteeism
N Mean Std. Deviation Std. Error Mean
BR! 600 3.7455 1.01997 .04584
BR2 600 3.6768 .88199 .03964
BR3 600 3.7899 .93531 .04204
BR4 600 3.7919 .79671 .03581
BR5 600 3.8202 .80861 .03634
BR6 600 3.7131 .93651 .04209
BR7 600 3.8707 .86979 .03909
BR8 600 3.7111 .96044 .04317
BR9 600 3.8242 .83897 .03771
Source: Computed Data
The above Table infers that all the mean values are greater than 3 in particular
ranging from 3.67 to 3.87 with their respective standard deviation. It is observed that
the standard deviation of 9 variables of Organisation Development and employees
Absenteeism are less than 1 implying the uniformity of the opinion of CPCL
Employees in these 9 variables. But the standard deviation of the variable consist of
changes done in favour of employees are found to be more than 1, this connotes that
CPCL Employees differ enormously in their opinion about the behavioral response to
stress.
168

Table 5.33
One-Sample Test for Organization Development and Employees Absenteeism
Test Value = 3
95% Confidence Interval of the
t dfSig. (2- Mean Differencetailed) Difference
Lower Upper
BR1 16.261 599 .000 .74545 .6554 .8355
BR2 17.072 599 .000 .67677 .5989 .7547
BR3 18.790 599 .000 .78990 .7073 .8725
BR4 22.115 599 .000 .79192 .7216 .8623
BR5 22.568 599 .000 .82020 .7488 .8916
BR6 16.942 599 .000 .71313 .6304 .7958
BR7 22.272 599 .000 .87071 .7939 .9475
BR8 16.473 599 .000 .71111 .6263 .7959
BR9 21.858 599 .000 .82424 .7502 .8983
Source: Computed Data
The CPCL Employees agree with the compulsive food and smoking for
relaxation. They also strongly agree with alcohol consumption to create a situation
free from stress. They often grind their teeth; clench their fist to remove absenteeism
from their mind. Over work load for CPCL Employees often create the sleepless
nights and forces to show resentment on others and colleagues. The CPCL employees
agreed that they always possess to attention disorder.
EMOTIONAL RESPONSE TO STRESS.
The harmful physical and emotional responses always occur when the
requirements of the job do not match the capabilities, resources, or needs of the
worker. Job absenteeism can lead to poor health and even injury." It simply means
that workplace absenteeism generally arises when there is a mismatch between the
nature and magnitude of the job to be done and the employee's desire and capabilities.
169

Std. Deviation.89530.93478.95907.76108
Std. Error Mean.04024.04202.04311.03421
The following results are achieved on the four variables (see appendix) of goal
achieving on applying the one sample t-test.
Table 5.34
One-Sample Statistics for emotional response
N Mean
LiR1 600 4.0081
ER2 600 3.8869
ER3 600 3.7960
ER4 600 3.9010Source: Computed Data
The table above reveals that it is found that all the mean values are greater
than 3 ranging from 3.79 to 4.00 with their respective standard deviation. It is
observed that the standard deviations of these four variables are less than 1. This
implies the consistency of the opinion of the CPCL Employees.
Table 5.35
One-Sample Test for emotional response to stress
LIITest Value = 3
95% Confidence Interval of the
t dfSig. (2- Mean Differencetailed) Difference Lower Upper
ER1 25.051 599 .000 1.00808 .9290 1.0871
ER2 21.108 599 .000 .88687 .8043 .9694
ER3 18.465 599 .000 .79596 .7113 .8807
ER4 26.339 599 .000 .90101 .8338 .9682
Source: Computect uata
From the above table it is found that t-test values are significantly greater than
the test value 3 at 5% level of significance. So the CPCL Employees strongly feel the
depressed situations in their mind and sense of accomplishment. The CPCL
170

Employees sometimes share their feelings about the work environment with friends
and relatives. They often brood over incidents as the indication of emotional response
to stress. Thus it can be said that the organisation policies helps the CPCL Employees
in achieving their stressful domain.
ABSENTEEISM PREVENTION PROCESS
The job absenteeism prevention process does not end with evaluation. Rather,
job absenteeism prevention should be seen as a continuous process that uses
evaluation data to refine or redirect the intervention strategy. The following lines
provide examples of actions some organizations have taken to help prevent
absenteeism in their workplaces.
1. Behavioral Rehearsal
2. Cognitive Restructuring/Reframing
3. Absenteeism Inoculation
4. Systematic Desensitization
5. Anger Management
6. Thought Stopping Techniques
7. Control and Perception of Control
8. Self-Esteem Enhancement
9. Goal Setting
10. Active (Reflective) Listening
11. Strategies for Coping with Derivational Absenteeism (Lack of Stimulation and
Challenge)
12. Modification of Life-style (Nutrition, Sleep, etc.)
171

COPING WITH STRESS: REMEDIAL ACTIONS
Remedial action to control absenteeism falls into three categories:
1. Change your thinking
2. Change your behavior
3. Change your lifestyle
Change Your Thinking
Reframing
Positive thinking
Change Your Behavior
Be Assertive
Get Organized! Time Management
Ventilation
Humor
Diversion and Distraction
Change Your Lifestyle
Diet
Exercise
Drink Water
Pet Therapy
Meditation
Deep Breathing
Nature Walks and Imagery
Hydrotherapy: A Warm, Hot Bath
172

Music Therapy
Sleep
Leisure
Pacing
One sample t-test is applied on 6 variables (see appendix) of rewards and
facilities and the following results are obtained.
Table 5.36
One-Sample Statistics for Absenteeism
N Mean Std. Deviation Std. Error Mean
SM! 600 3.6525 1.13843 .05117
SM2 600 3.5475 1.08601 .04881
SM3 600 3.4202 1.15289 .05182
SM4 600 3.8465 .91139 .04096
SM5 600 3.6525 .96522 .04338
SM6 600 3.6283 2.57817 .11588
Source: Computed Data
From the above Table it is found that all the mean values are greater than 3
ranging from 3.42 to3.84 with their respective standard deviation. It is observed that
the standard deviation of the 2 variables such as attending parties and Suitable
relaxation are less than 1. This implies that the opinions of the CPCL Employees with
regard to these variables are consistent. But the standard deviation of the other 4
variables is more than 1. Implying that in the opinion of CPCL Employees these
variables differ enormously.
173
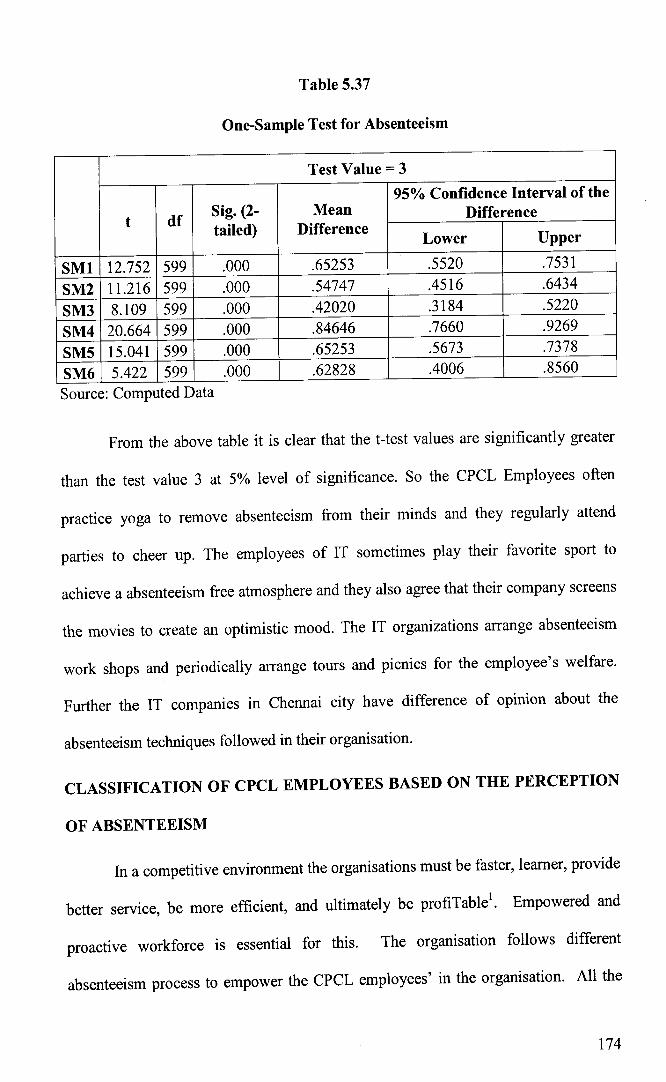
Table 5.37
One-Sample Test for Absenteeism
Test Value = 3
95% Confidence Interval of the
t dfSig. (2- Mean Differencetailed) Difference
Lower Upper
SM1 12.752 599 .000 .65253 .5520 .7531
SM2 11.216 599 .000 .54747 .4516 .6434
5M3 8.109 599 .000 .42020 .3184 .5220
SM4 20.664 599 .000 .84646 .7660 .9269
SM5 15.041 599 .000 .65253 .5673 .7378
SM6 5.422 599 .000 .62828 .4006 .8560
Source: Computed Data
From the above table it is clear that the t-test values are significantly greater
than the test value 3 at 5% level of significance. So the CPCL Employees often
practice yoga to remove absenteeism from their minds and they regularly attend
parties to cheer up. The employees of IT sometimes play their favorite sport to
achieve a absenteeism free atmosphere and they also agree that their company screens
the movies to create an optimistic mood. The IT organizations arrange absenteeism
work shops and periodically arrange tours and picnics for the employee's welfare.
Further the IT companies in Chennai city have difference of opinion about the
absenteeism techniques followed in their organisation.
CLASSIFICATION OF CPCL EMPLOYEES BASED ON THE PERCEPTION
OF ABSENTEEISM
In a competitive environment the organisations must be faster, learner, provide
better service, be more efficient, and ultimately be profiTable 1 . Empowered and
proactive workforce is essential for this. The organisation follows different
absenteeism process to empower the CPCL employees' in the organisation. All the
174

CPCL employees do not perceive these processes in the same way. Perception is the
process of acquiring, interpreting, selecting, and organizing information. The
percepts shift on acquiring of new information. As the CPCL employees perceived
notions are influenced by their culture and academic background. Absenteeism is
understood as taking a greater responsibility and authority in the decision-making
process'. But some may feel threatened by absenteeism as they feel that it will expose
their vulnerabilities. The absenteeism process followed by various organisations
ranging from manufacturing to service sector inclusive of software companies, police
machinery and educational institutions is also not similar and varies according to the
organisation or institutions. So the CPCL employees opinion about the absenteeism
process within the organisation and among the organisations will differ according to
their own perception.
CLASSIFICATION OF CPCL EMPLOYEES BASED ON THEIR
PERCEPTION OF ORGANISATIONAL ABSENTEEISM
The CPCL employees have different perception level in understanding the
absenteeism policies of the organisation. The organisations expedite their absenteeism
process through rigorous absenteeism practices. The factor analysis in this study
revealed 13 factors namely trust and openness strategy, developmental policies,
persistent assessment, prospective enhancement, innovative climate, optimistic team
management, goal achieving, rewards and facilities, role of employees, performance
of CPCL employees, career development, versatile training measures and
technological training, are the major determinants in estimating the organisational
absenteeism of CPCL employees. The multivariate tool cluster analysis is applied on
these 13 factors of the organisational absenteeism and the following results are
obtained.
175

Table 5.38
Final Cluster Centers for Factors of Organisation Absenteeism
Clusters2 3
TAO 3.21 3.34 3.62
DP 2.58 3.54 4.16
PA 3.14 3.86 4.39
PE 2.45 3.20 3.85
IC 2.28 3.04 3.82
OTM 2.54 3.37 3.95
GA 3.27 3.61 4.19
RAF 2.88 3.24 3.91
ROW 3.51 3.73 4.16
PWE 3.86 3.49 3.42
CD 2.17 3.03 3.80
VTM 2.97 3.47 3.95
TT 2.54 3.22 3.80
Source: Computed Data
From the above final cluster center Table it is found that these exist 3 types of
CPCL employees based on their perception of organisational absenteeism.
Table: 5.39
Classification of Executives based on their opinion of Factors of OrganisationAbsenteeism
176

The first cluster strong in performance of CPCL employees so it is called as
performance oriented cluster. The second cluster of CPCL employees is strong in
persistent assessment so it is known as assessment oriented cluster. The third cluster is
strong in trust and openness strategy, development policies, goal achieving, and role
of employees. Hence this cluster is named as development oriented cluster. The
frequency distribution of each cluster is presented below in Table.
Table 5.40
Number of Cases in each Cluster for Organisation Absenteeism
L 1 66.000
Clusters 2 214.000I 3 230.000 1
Valid 510.000
Source: Computed Data
From the frequency distribution of the clusters it is ascertained that the first
cluster comprises of 1 2.92%of CPCL employees. These CPCL employees profoundly
believe that their absenteeism can be measured through their knowledge and skills in
performing their jobs.
The second cluster comprises 42.02% of CPCL employees. They have the
opinion that their performance appraisal system and assessment modules in their
organisation must exactly determine their performance in their work.
The third cluster with 45.05 % of CPCL employees with developmental
oriented views and this group of CPCL employees formidably believes that their
absenteeism is directly correlated to the development process in their organisation.
177

CLUSTER CLASSIFICATION AND FACTORS DISCRIMINATING THE
CLUSTERS
The classification of three groups of CPCL employees discriminate the 13
factors of employees absenteeism. The multivariate discriminate analysis by stepwise
approach is applied on three types of cluster and 13 independent factors of
organisational absenteeism. The results are stated as follows.
Table 5.41
Tests of Equality of Group Means for Factors of Organisation Absenteeism
Wilks' Lambda F dfl df2 Sig.
TAO .944 14.642 2 507 .000
DP .525 222.679 2 507 .000
PA .678 117.079 2 507 .000
PE .563 191.326 2 507 .000
IC .451 299.750 2 507 .000
OTM .534 214.260 2 507 .000
GA .703 103.877 2 507 .000
RAF .617 152.798 2 507 .000
ROW .723 94.017 2 507 .000
PWE .975 6.268 2 507 .002
CD .451 298.859 2 507 .000
VTM .744 84.445 2 507 .000
TT .560 193.290 2 507 .000 j
Source: Computed Data
From the above Table it is ascertained that 13 factors of organisational
absenteeism perfectly discriminates the classification of CPCL employees. Among
these 13 factors 6 factors are being identified in the following Table that perfectly
predicts their absenteeism of CPCL employees and classification of them.
178

Table 5.42
Variables Entered/Removed for Factors of Organisation Absenteeism
I Entered Wilks' LambdaStatistic dli df2 d13 Exact F
Step - _______ Statistic dfl d12 Sig.
1 IC .451 1 2 507.000 299.750 2 507.000 .0002 507.000 184.394 4 982.000 .0002 CD .326 2 2 507.000 157.068 6 980.000 .0003 DP .260 3
4 RAF .241 4 2 507.000 126.871 8 978.000 .000
5 PWE .229 5 2 507.000 106.317 10 976.000 .000
6 OTM .223 6 2 507.000 90.821 12 974.000 00
7 PE .218 7 2 507.000 79.181 14 972.000 .000
8 PA .214 8 2 507.000 70.423 16 970.000 .000
Source: Computed Data
From the Table, it is inferred that 8 factors innovative climate, career
development, development policies, rewards and facilities, performance of CPCL
employees, optimistic team management, prospective enhancement, and persistent
assessment are considered as important factors those predict the absenteeism of CPCL
employees. The predicted 8 factors have a Canonical Correlation with three groups
of CPCL employees. The significance of canonical correlation coefficient is presented
in Eigenvalues Table and Wilk' s lamda Table.
Table 5.43
Eigenvalues for Factors of Organisation Absenteeism
Function Eigenvalue %of Variance Cumulative % Canonical Correlation
1 3.411
98.3 98.3 .879
2 .059
1.7 100.0 .237
Source: Computed Data
179

Table 5.44
Wilks' Lambda for Factors of Organisation Absenteeism
Test of Function(s) Wilks' Lambda Chi-square df Sig.
lthrough2 .214 753.126 16 .000
2 .944 28.164 7 .000
Source: Computed Data
From the above Table it can be noted that Canonical Correlation between
groups of CPCL employees and the factors of organisational absenteeism and the
factors of organisational absenteeism are established by two discriminant functions
with Eigenvalues 3.411 and 0.059 respectively. The canonical correlation coefficient
for the discriminant function 0.879 and 0.237 are highly significant.
Table 5.45
Structure Matrix for Factors of Organisation Absenteeism
Source: Computed Data
180

The full structured matrix identified key variables of employees absenteeism
in the organisations in two domains. The first domain consists of career development,
innovative climate, development policies, optimistic team management, prospective
enhancement, technological training, persistent assessment, and role of employees,
versatile training measures and trust and openness strategy.
The second domain comprises only three factors namely rewards and
facilities, goal achieving, and performance of CPCL employees. It is inferred that the
organisation concentrate on these two blocks of employees absenteeism process.
So the 8 factors namely innovative climate, career development, development
policies, rewards and facilities, performance of CPCL employees, optimistic team
management, prospective enhancement, and persistent assessment perfectly
discriminates the 3 groups of CPCL employees. The organisational employee's
absenteeism is highly effective when there is an innovative work climate in every
organisation, the CPCL employees and their career development plays a vital role in
the organisational absenteeism process. The proper commendations and facilities
along with the development policies of the employees in the organisations emerge as
a powerful absenteeism centers. When the CPCL employees are taught to perform
extraordinary and optimistic approaches always give a balanced approach towards
absenteeism. The organisational absenteeism is determined through prospective
infrastructure and management policies to assess the potentiality of CPCL employees.
181

CLASSIFICATION OF CPCL EMPLOYEES BASED ON THEIR
PERCEPTION OF 'IMPACT OF ABSENTEEISM' ON THEM
The multivariate tool cluster analysis is applied on the 14 variables (see
appendix) of impact on individuals specifically self-confidence, capacity of hard
work, ability to communicate effectively, problem solving ability, organized way of
working, capacity for risk bearing, foresight and presence of mind, motivation,
determination, tenacity of purpose, knowledge about work area, innovative creativity,
honesty and emotional stability. The consequence of cluster analysis is presented
below in the Table
Table 5.46
Final Cluster Centers for the Variables of Impact on Individuals
Source: Computed Data
From the above Table it is ascertained that two groups of CPCL employees
exists due to the variables of absenteeism impact on the individuals. The above Table
clearly presents the CPCL employees in the first cluster are moderate and in the
182

second cluster are strong in their opinion about the impact of absenteeism on them.
The frequency distribution of each cluster is presented in Table as follows.
Table 5.47
Number of Cases in each Cluster for Impact on Individuals
Cluster 1 252.000
I 2 258.000
IValid 510.000
Source: Computed Data
From the Table the frequency distribution of the clusters it is ascertained that
the first clusters comprises of 49.49 % of CPCL employees. These CPCL employees
believe moderately that the organisational absenteeism and external factors have an
impact on them. The second cluster comprises of 50.51 % of CPCL employees
strongly believing that the factors of absenteeism make deep inroads on their
personality development. This shows that 50.51 % of CPCL employees profoundly
believe that the organisations are empowering them through absenteeism practices to
replete inward potentiality to accomplish the goals.
CLASSIFICATION OF CPCL EMPLOYEES BASED ON THEIR
PERCEPTION OF 'IMPACT OF ABSENTEEISM' ON ORGANISATION
The multivariate tool cluster analysis is also applied on the 11 variables (see
appendix) of impact on organisation mainly Increase in Reputation Of Organisation,
Increased Productivity, Organisational Efficiency, Appreciable Customer Relation,
Increased Facilities, Flourished Inter-departmental Relationship, Job Involvement,
Constructive Inter Personal Relationship, And Achievement Of Organisational Goals.
The consequence of cluster analysis is presented below in the Table.
183

Table 5.48
Final Cluster Centers for the Variables and Impact on Organisation
Cluster
1 2
10098 3.57 4.32
10099 3.25 4.45
100100 3.24 4.51
00101 3.32 4.42
100102 3.20 4.47
00103 3.32 4.38
100104 3.15 4.43
100105 3.37 4.35
100106 3.44 4.54
100107 3.45 4.49
100108 3.54 4.49
Source: Computed Data
From the above Table it is ascertained that two groups of CPCL employees
exists due to the variables of absenteeism impact on the organisation. The above
• Table clearly presents the CPCL employees in the first cluster are moderate and in the
second cluster are strong in their opinion about the absenteeism impact on
organisation. The frequency distribution of each cluster is presented in Table as
follows.
184

Table 5.49
Number of Cases in each Cluster for Impact on Organisation
Cluster 1 189.000
2 321.000
Valid 510.000
Source: Computed Data
From the Table the frequency distribution of the clusters it is ascertained that
the first clusters comprises of 36.97 % of CPCL employees. These CPCL employees
believe moderately that the organisational absenteeism and external factors have an
impact on organisation. The second cluster comprises of 63.03 % of CPCL
employees strongly believing that the factors of absenteeism have an impact on
organisation.
ASSOCIATION BETWEEN ABSENTEEISM OF CPCL EMPLOYEES IN
THE ORGANISATIONS AND ITS IMPACT ON INDIVIDUALS
Cluster analysis has classified the absenteeism of CPCL employees in
organisations into three clusters and impact on individual CPCL employees into two
clusters as shown in the Table. So in this section correspondence analysis is used to
find the association between these two clusters reveals the following results.
Null Hypothesis: There is no association between clusters of organisation and
clusters of individual impact.
185

Table 5.50
Correspondence analysis for Organization absenteeism and Individual Impact
Value df Asymp. Sig. (2-sided)
Pearson Chi-Square 4.493 2 .106
Likelihood Ratio 4.535 2 .104
Linear-by-Linear Association 3.462 1 .063
of Valid Cases 510
From the above chi-square Table it is found that chi-square value is 4.493 and
P value is 0.106 with 2 degree of freedom. This implies that the probability value is
insignificant. So the null hypothesis is accepted at 5% level of significance and
concluded that there is no association between organisational absenteeism of CPCL
employees and its direct impact on CPCL employees. This shows that organisations
are practicing absenteeism only for the benefit of their organisation and not focus on
the absenteeism of the individual CPCL employees.
ASSOCIATION BETWEEN THE CLUSTERS OF ORGANISATION
ABSENTEEISM AND CLUSTERS OF ORGANISATION IMPACT
Cluster analysis has classified the absenteeism of CPCL employees in
organisations into three clusters and its impact on organisation into two clusters as
shown in the Table. The following results are obtained as a consequence by applying
the correspondence analysis to find the association between these two clusters. Null
Hypothesis: There is no association between clusters of organisation absenteeism of
CPCL employees and cluster of organisational impact.
186

Table 5.51
Chi-Square Tests for Organization Absenteeism and Organization Impact
Asymp. Sig.Value df
(2-sided)
Pearson Chi-Square 5.034 2 .041
Likelihood Ratio 5.259 2 .072
Linear-by-Linear Association 4.204 1 .040
of Valid Cases 510
Source: Computed Data
From the above chi-square Table it is found that chi-square value is 5.034 and
P value is 0.041 with 2 degree of freedom. This implies that the probability value is
significant. So the null hypothesis is rejected at 5% level of significance. It is
concluded that there is association between organisational absenteeism clusters and its
impact on organisation. This shows that organisational absenteeism is primarily aimed
at improving the organisational efficiency and its productivity. In this chapter on the
basis of the factors of absenteeism process in the organisation and external influence
the CPCL employees are clustered into three groups. And two groups of CPCL
employees are grouped on the basis of absenteeism impact on individuals and
organisations. Microscopic analysis was done for testing the association between
these clusters. In the next chapter the major findings of the study will be summarized
with conclusion and suggestion.
187