Embed Size (px)
Citation preview
83
CHAPTER-V
Investors’ Perception and Rural Postal Investments - An Analysis
The problems regarding the rural investors’ perception and Postal
Investment were considered and the objectives were presented in the first chapter.
The important concepts used in the study were reviewed and presented in the
second chapter. The profile of the study area Dharmapuri District and its post
Office was presented in the Third chapter. The methodology of the study was
presented in the fourth chapter. The present chapter deals with the results of the
Primary data collected on the rural Investors’ Perception and their discussion. It
also deals with information sources used by the rural investors. The sixth chapter
deals with information sources used, demographic factors, number of investment
considered and Postal Investment, role of investors’ Perception. The final chapter
describes the results, findings, suggestions and Conclusion.
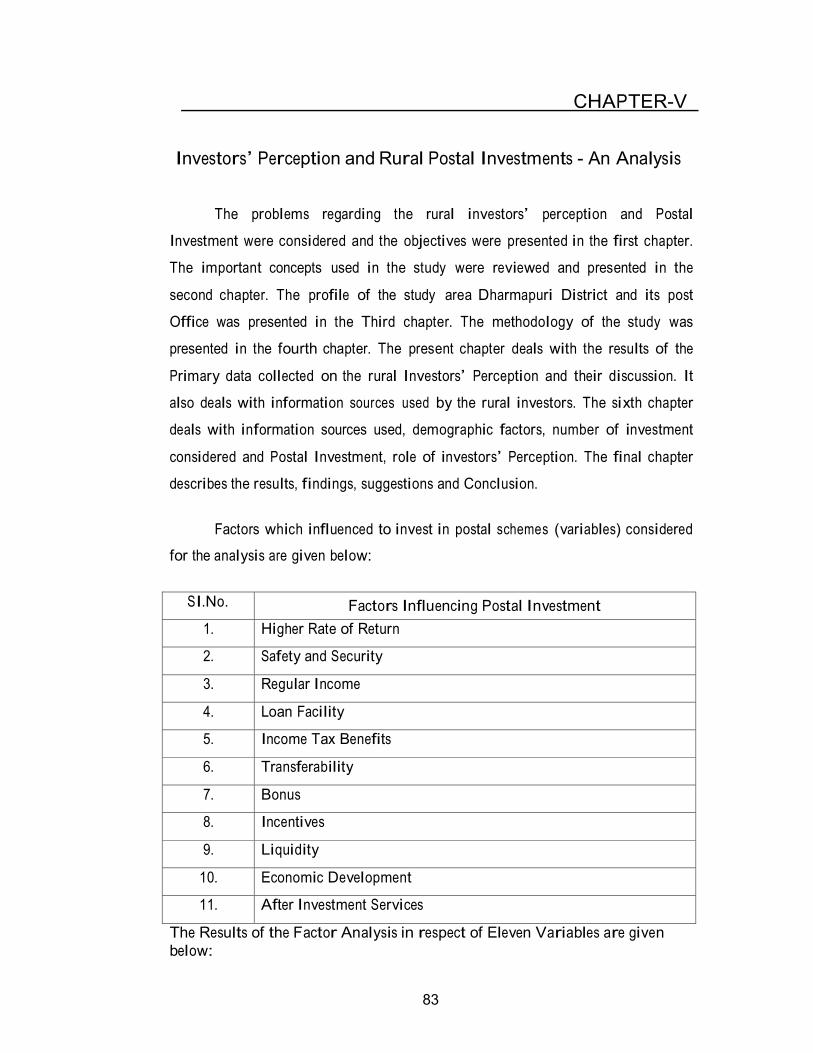
Factors which influenced to invest in postal schemes (variables) considered
for the analysis are given below:
SI.No. Factors Influencing Postal Investment
1. Higher Rate of Return
2. Safety and Security
3. Regular Income
4. Loan Facility
5. Income Tax Benefits
6. Transferability
7. Bonus
8. Incentives
9. Liquidity
10. Economic Development
11. After Investment Services
The Results of the Factor Analysis in respect of Eleven Variables are given
below:

84
Kaiser-Meyer-Olkin Measure of Sampling Adequacy 0.607
Bartlett's Test of Sphericity
Approx. Chi-Square 1665.466
Degree of freedom 55
Significance 0.001
5.1 Post Office Time Deposits
The KMO (Kaiser-Meyer-Olkin) and Barlett’s Test has been used to
find the suitability of the factor analysis for factor reduction. KMO test is a
measure showing the sample adequacy to examine the appropriateness of the
factor analysis. As the KMO (Kaiser-Meyer Olkin) value 0.607 is close to 1 and
Bartlett’s test value is 0.001 which is less than 0.05, it is concluded that the factor
analysis is suitable. The following table shows that the factors suitability test.
Table.5.1.1
Factor Suitability Test
After testing suitability of the Factor Analysis, the explainable variables are
processed to find the principle factors. The results of the analysis are given below
in table 2.12
Table.5.1.2
Total Variance and Factors
C
om
pon
ent
Initial Eigen Values Extraction Sums of
Squared Loadings Rotation Sums of
Squared Loadings
Total
% o
f
Vari
an
ce
Cum
ula
tiv
e
%
Total
% o
f
Vari
an
ce
Cum
ula
tiv
e
%
Total
% o
f
Vari
an
ce
Cum
ula
tiv
e
%
1 3.451 31.376 31.376 3.451 31.376 31.376 3.256 29.604 29.604 2 2.470 22.458 53.834 2.470 22.458 53.834 2.341 21.278 50.882 3 2.049 18.628 72.462 2.049 18.628 72.462 2.063 18.757 69.639 4 1.230 11.179 83.641 1.230 11.179 83.641 1.540 14.002 83.641
5 0.575 5.230 88.871
6 0.395 3.591 92.463 7 0.334 3.034 95.496 8 0.191 1.736 97.232 9 0.167 1.516 98.748
10 0.126 1.147 99.895 11 0.012 0.105 100.000
Extraction Method: Principal Component Analysis.
85
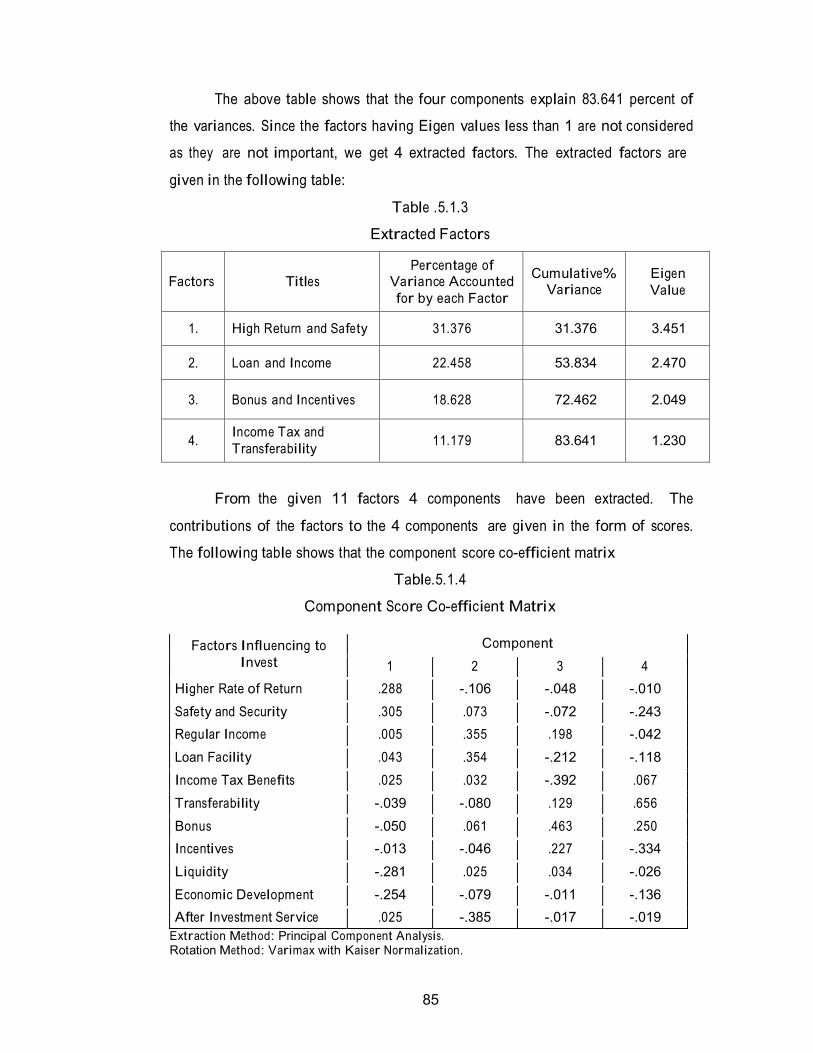
The above table shows that the four components explain 83.641 percent of
the variances. Since the factors having Eigen values less than 1 are not considered
as they are not important, we get 4 extracted factors. The extracted factors are
given in the following table:
Table .5.1.3
Extracted Factors
Factors
Titles Percentage of
Variance Accounted
for by each Factor
Cumulative% Variance
Eigen
Value
1.
High Return and Safety
31.376
31.376
3.451
2.
Loan and Income
22.458
53.834
2.470
3.
Bonus and Incentives
18.628
72.462
2.049
4. Income Tax and
Transferability
11.179
83.641
1.230
From the given 11 factors 4 components have been extracted. The
contributions of the factors to the 4 components are given in the form of scores.
The following table shows that the component score co-efficient matrix
Table.5.1.4
Component Score Co-efficient Matrix
Factors Influencing to
Invest
Component
1 2 3 4
Higher Rate of Return .288 -.106 -.048 -.010
Safety and Security .305 .073 -.072 -.243
Regular Income .005 .355 .198 -.042
Loan Facility .043 .354 -.212 -.118
Income Tax Benefits .025 .032 -.392 .067
Transferability -.039 -.080 .129 .656
Bonus -.050 .061 .463 .250
Incentives -.013 -.046 .227 -.334
Liquidity -.281 .025 .034 -.026
Economic Development -.254 -.079 -.011 -.136
After Investment Service .025 -.385 -.017 -.019
Extraction Method: Principal Component Analysis. Rotation Method: Varimax with Kaiser Normalization.
86
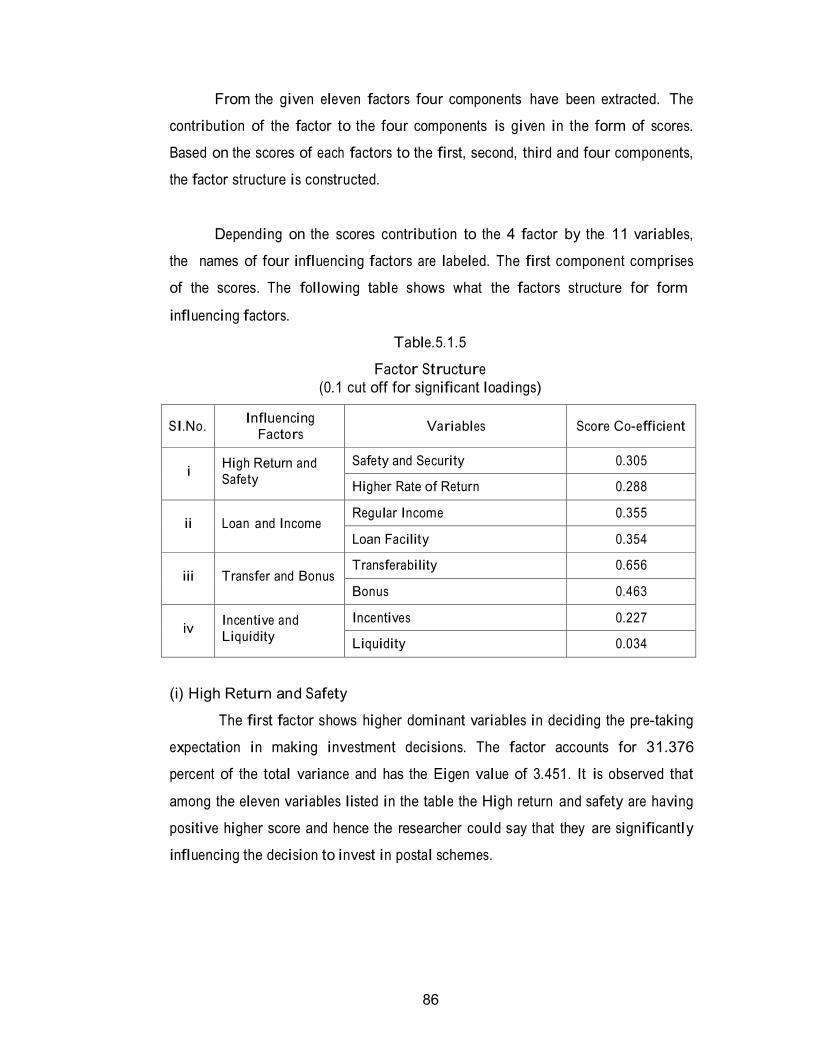
From the given eleven factors four components have been extracted. The
contribution of the factor to the four components is given in the form of scores.
Based on the scores of each factors to the first, second, third and four components,
the factor structure is constructed.
Depending on the scores contribution to the 4 factor by the 11 variables,
the names of four influencing factors are labeled. The first component comprises
of the scores. The following table shows what the factors structure for form
influencing factors.
Table.5.1.5
Factor Structure
(0.1 cut off for significant loadings)
SI.No. Influencing
Factors
Variables
Score Co-efficient
i
High Return and Safety
Safety and Security 0.305
Higher Rate of Return 0.288
ii
Loan and Income
Regular Income 0.355
Loan Facility 0.354
iii
Transfer and Bonus
Transferability 0.656
Bonus 0.463
iv
Incentive and Liquidity
Incentives 0.227
Liquidity 0.034
(i) High Return and Safety
The first factor shows higher dominant variables in deciding the pre-taking
expectation in making investment decisions. The factor accounts for 31.376
percent of the total variance and has the Eigen value of 3.451. It is observed that
among the eleven variables listed in the table the High return and safety are having
positive higher score and hence the researcher could say that they are significantly
influencing the decision to invest in postal schemes.
87
(ii) Loan and Income
The second factor which influences the decision to invest in postal schemes
is loan and Income. This factor accounts for 22.458 percent of the total variance
and has the Eigen value of 2.470. It is observed that the Loan and income are
having positive higher score and hence the researcher could say that they are
significantly influencing the investment decisions.
(iii) Bonus and Incentives
The third factor which influences decision to invest in postal schemes is
Bonus and Incentives. This factor accounts for 18.628 percent of the total variance
and has the Eigen value of 2.049. It is observed that Incentives and Bonus are
having positive higher score and hence the researcher could say that they are
significantly influencing the investment decisions.
(iv) Income Tax and Transferability
The fourth factor which influences decision to invest in postal Schemes is
Incom Tax and Transferability. This factor accounts for 11.179 percent of the total
variance and has the Eigen value of 1.230. It is observed that Income Tax and
Transferability is having positive higher score and hence the researcher could say
that they are significantly influencing the investment decisions.
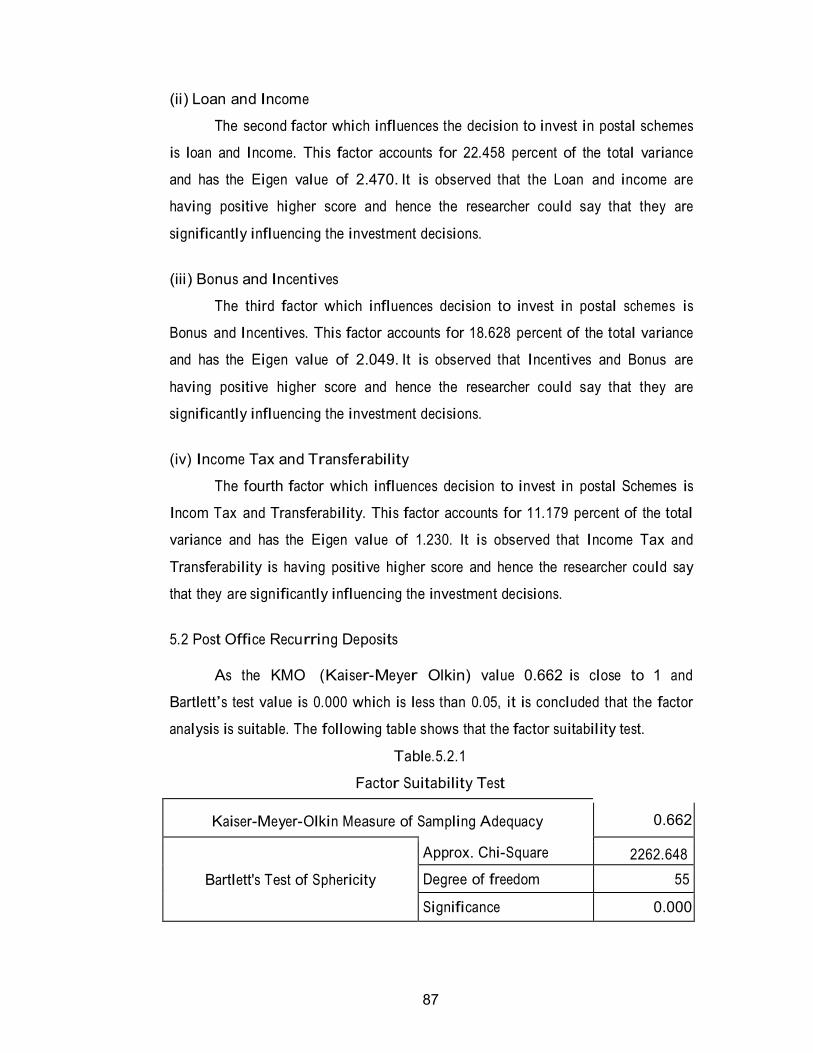
5.2 Post Office Recurring Deposits
As the KMO (Kaiser-Meyer Olkin) value 0.662 is close to 1 and
Bartlett’s test value is 0.000 which is less than 0.05, it is concluded that the factor
analysis is suitable. The following table shows that the factor suitability test.
Table.5.2.1
Factor Suitability Test
Kaiser-Meyer-Olkin Measure of Sampling Adequacy
0.662
Bartlett's Test of Sphericity
Approx. Chi-Square 2262.648
Degree of freedom 55
Significance 0.000
88
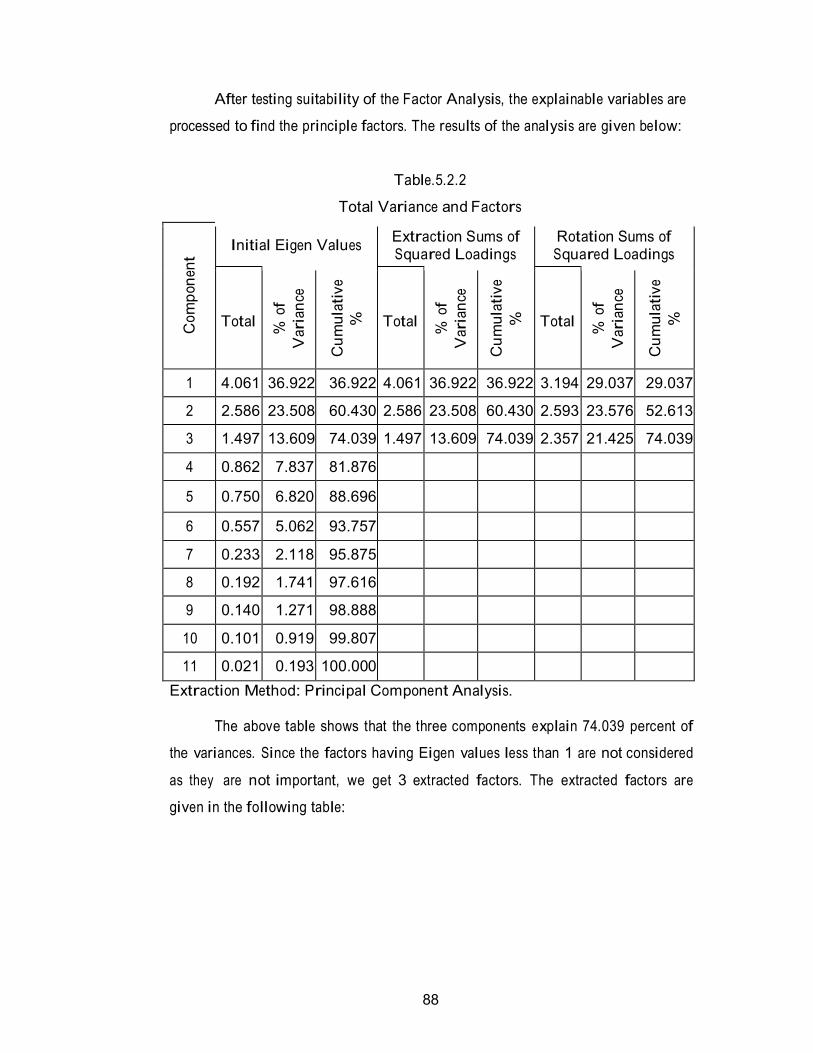
After testing suitability of the Factor Analysis, the explainable variables are
processed to find the principle factors. The results of the analysis are given below:
Table.5.2.2
Total Variance and Factors
C
om
pon
ent
Initial Eigen Values Extraction Sums of Squared Loadings
Rotation Sums of Squared Loadings
Total
% o
f
Var
ian
ce
Cu
mula
tiv
e
%
Total
% o
f
Var
ian
ce
Cu
mula
tiv
e
%
Total
% o
f
Var
ian
ce
Cu
mula
tiv
e
%
1 4.061 36.922 36.922 4.061 36.922 36.922 3.194 29.037 29.037
2 2.586 23.508 60.430 2.586 23.508 60.430 2.593 23.576 52.613
3 1.497 13.609 74.039 1.497 13.609 74.039 2.357 21.425 74.039
4 0.862 7.837 81.876
5 0.750 6.820 88.696
6 0.557 5.062 93.757
7 0.233 2.118 95.875
8 0.192 1.741 97.616
9 0.140 1.271 98.888
10 0.101 0.919 99.807
11 0.021 0.193 100.000
Extraction Method: Principal Component Analysis.
The above table shows that the three components explain 74.039 percent of
the variances. Since the factors having Eigen values less than 1 are not considered
as they are not important, we get 3 extracted factors. The extracted factors are
given in the following table:
89
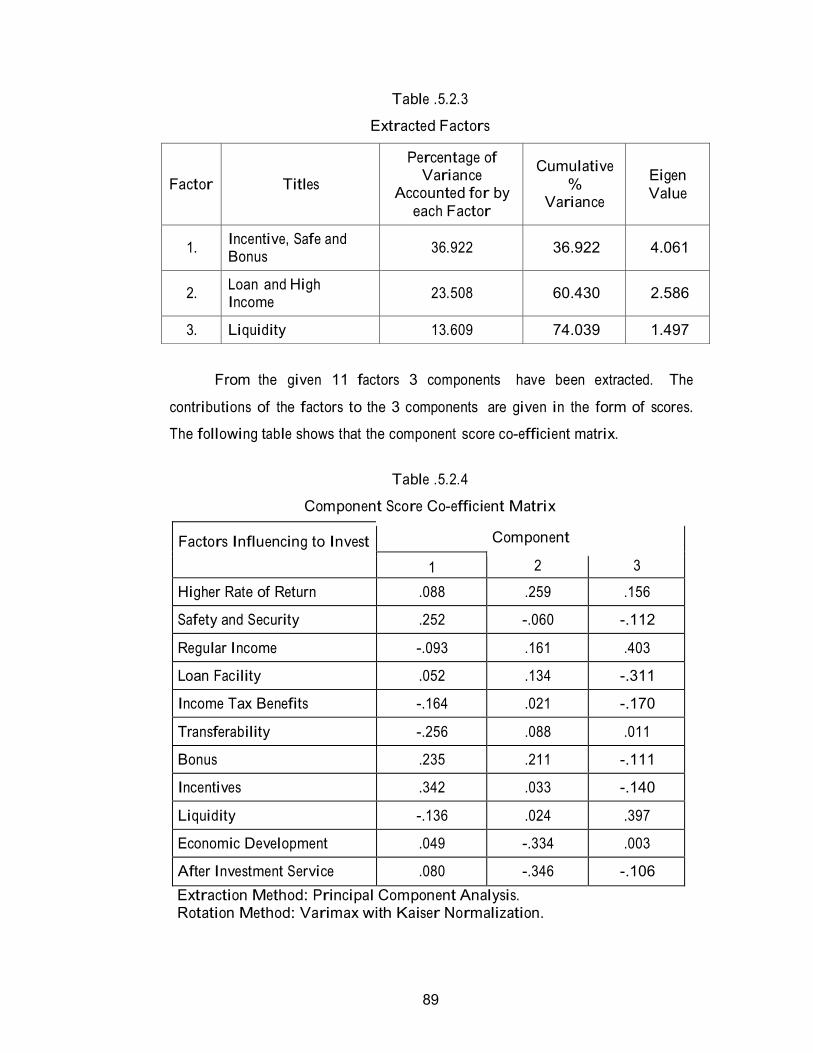
Table .5.2.3
Extracted Factors
Factor
Titles
Percentage of Variance
Accounted for by
each Factor
Cumulative
% Variance
Eigen
Value
1. Incentive, Safe and Bonus
36.922
36.922
4.061
2. Loan and High Income
23.508
60.430
2.586
3. Liquidity 13.609 74.039 1.497
From the given 11 factors 3 components have been extracted. The
contributions of the factors to the 3 components are given in the form of scores.
The following table shows that the component score co-efficient matrix.
Table .5.2.4
Component Score Co-efficient Matrix
Factors Influencing to Invest Component
1 2 3
Higher Rate of Return .088 .259 .156
Safety and Security .252 -.060 -.112
Regular Income -.093 .161 .403
Loan Facility .052 .134 -.311
Income Tax Benefits -.164 .021 -.170
Transferability -.256 .088 .011
Bonus .235 .211 -.111
Incentives .342 .033 -.140
Liquidity -.136 .024 .397
Economic Development .049 -.334 .003
After Investment Service .080 -.346 -.106
Extraction Method: Principal Component Analysis. Rotation Method: Varimax with Kaiser Normalization.
90
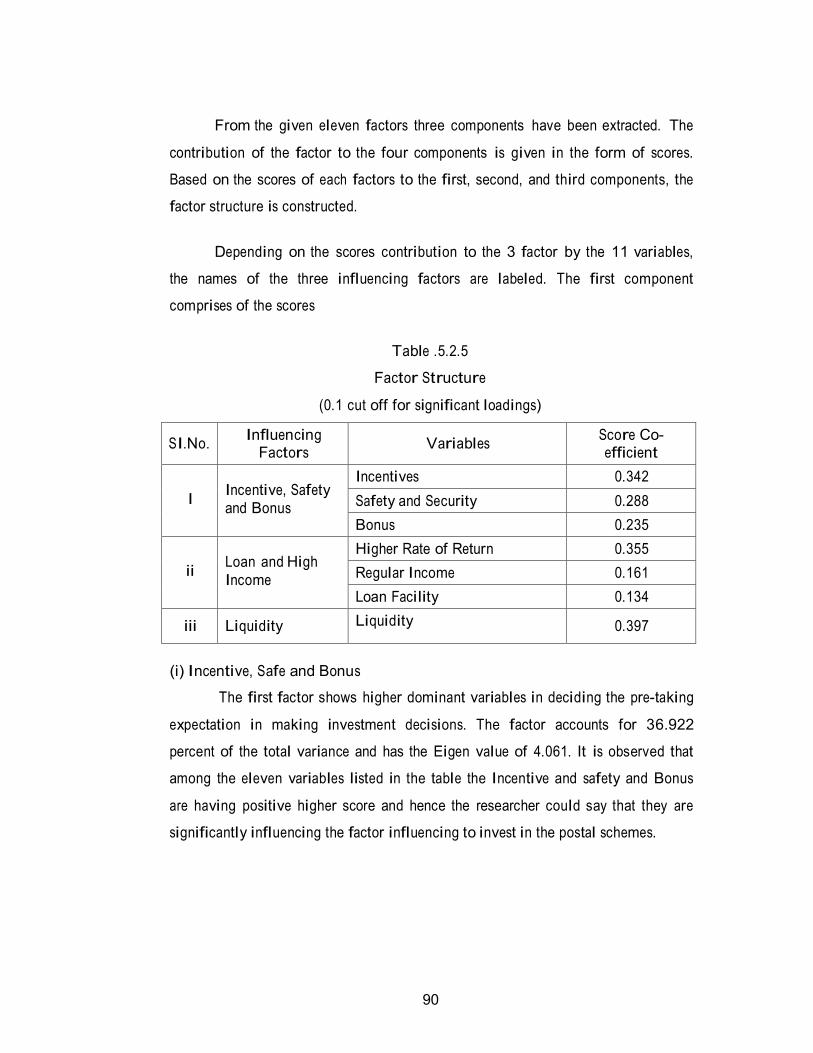
From the given eleven factors three components have been extracted. The
contribution of the factor to the four components is given in the form of scores.
Based on the scores of each factors to the first, second, and third components, the
factor structure is constructed.
Depending on the scores contribution to the 3 factor by the 11 variables,
the names of the three influencing factors are labeled. The first component
comprises of the scores
Table .5.2.5
Factor Structure
(0.1 cut off for significant loadings)
SI.No. Influencing
Factors
Variables Score Co- efficient
I
Incentive, Safety
and Bonus
Incentives 0.342
Safety and Security 0.288
Bonus 0.235
ii
Loan and High
Income
Higher Rate of Return 0.355
Regular Income 0.161
Loan Facility 0.134
iii
Liquidity Liquidity
0.397
(i) Incentive, Safe and Bonus
The first factor shows higher dominant variables in deciding the pre-taking
expectation in making investment decisions. The factor accounts for 36.922
percent of the total variance and has the Eigen value of 4.061. It is observed that
among the eleven variables listed in the table the Incentive and safety and Bonus
are having positive higher score and hence the researcher could say that they are
significantly influencing the factor influencing to invest in the postal schemes.
91
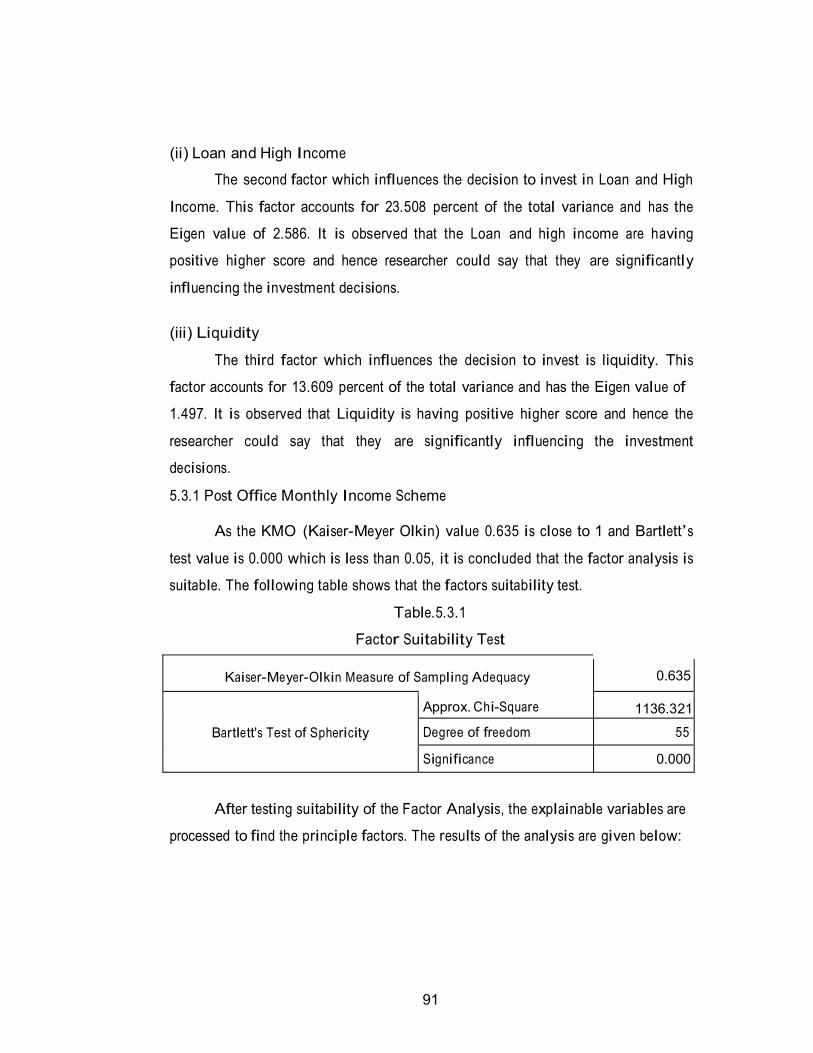
(ii) Loan and High Income
The second factor which influences the decision to invest in Loan and High
Income. This factor accounts for 23.508 percent of the total variance and has the
Eigen value of 2.586. It is observed that the Loan and high income are having
positive higher score and hence researcher could say that they are significantly
influencing the investment decisions.
(iii) Liquidity
The third factor which influences the decision to invest is liquidity. This
factor accounts for 13.609 percent of the total variance and has the Eigen value of
1.497. It is observed that Liquidity is having positive higher score and hence the
researcher could say that they are significantly influencing the investment
decisions.
5.3.1 Post Office Monthly Income Scheme
As the KMO (Kaiser-Meyer Olkin) value 0.635 is close to 1 and Bartlett’s
test value is 0.000 which is less than 0.05, it is concluded that the factor analysis is
suitable. The following table shows that the factors suitability test.
Table.5.3.1
Factor Suitability Test
Kaiser-Meyer-Olkin Measure of Sampling Adequacy
0.635
Bartlett's Test of Sphericity
Approx. Chi-Square 1136.321
Degree of freedom 55
Significance 0.000
After testing suitability of the Factor Analysis, the explainable variables are
processed to find the principle factors. The results of the analysis are given below:
92
Table.5.3.2
Total Variance and Factors
C
om
pon
ent
Initial Eigen Values Extraction Sums of
Squared Loadings Rotation Sums of
Squared Loadings
Total
% o
f
Vari
an
ce
Cum
ula
tiv
e
%
Total
% o
f
Vari
an
ce
Cum
ula
tiv
e
%
Total
% o
f
Vari
an
ce
Cum
ula
tiv
e
%
1 2.849 25.897 25.897 2.849 25.897 25.897 2.312 21.017 21.017
2 2.203 20.024 45.921 2.203 20.024 45.921 2.085 18.957 39.974
3 1.644 14.947 60.868 1.644 14.947 60.868 1.978 17.984 57.959
4 1.405 12.773 73.641 1.405 12.773 73.641 1.574 14.306 72.265
5 1.295 11.777 85.418 1.295 11.777 85.418 1.447 13.153 85.418
6 0.503 4.569 89.987
7 0.461 4.192 94.179
8 0.327 2.974 97.153
9 0.200 1.822 98.975
10 0.085 0.775 99.749
11 0.028 0.251 100.000 Extraction Method: Principal Component Analysis.
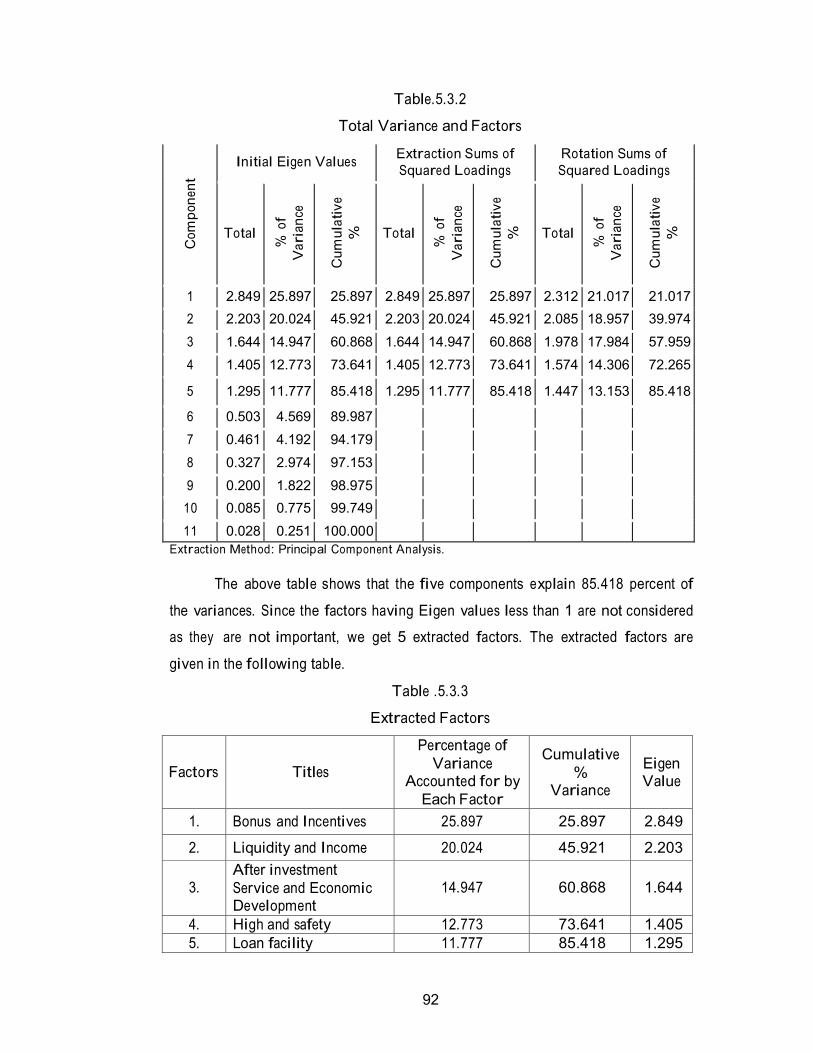
The above table shows that the five components explain 85.418 percent of
the variances. Since the factors having Eigen values less than 1 are not considered
as they are not important, we get 5 extracted factors. The extracted factors are
given in the following table.
Table .5.3.3
Extracted Factors
Factors
Titles
Percentage of
Variance Accounted for by
Each Factor
Cumulative
% Variance
Eigen Value
1. Bonus and Incentives 25.897 25.897 2.849
2. Liquidity and Income 20.024 45.921 2.203
3.
After investment
Service and Economic Development
14.947
60.868
1.644
4. High and safety 12.773 73.641 1.405
5. Loan facility 11.777 85.418 1.295
93
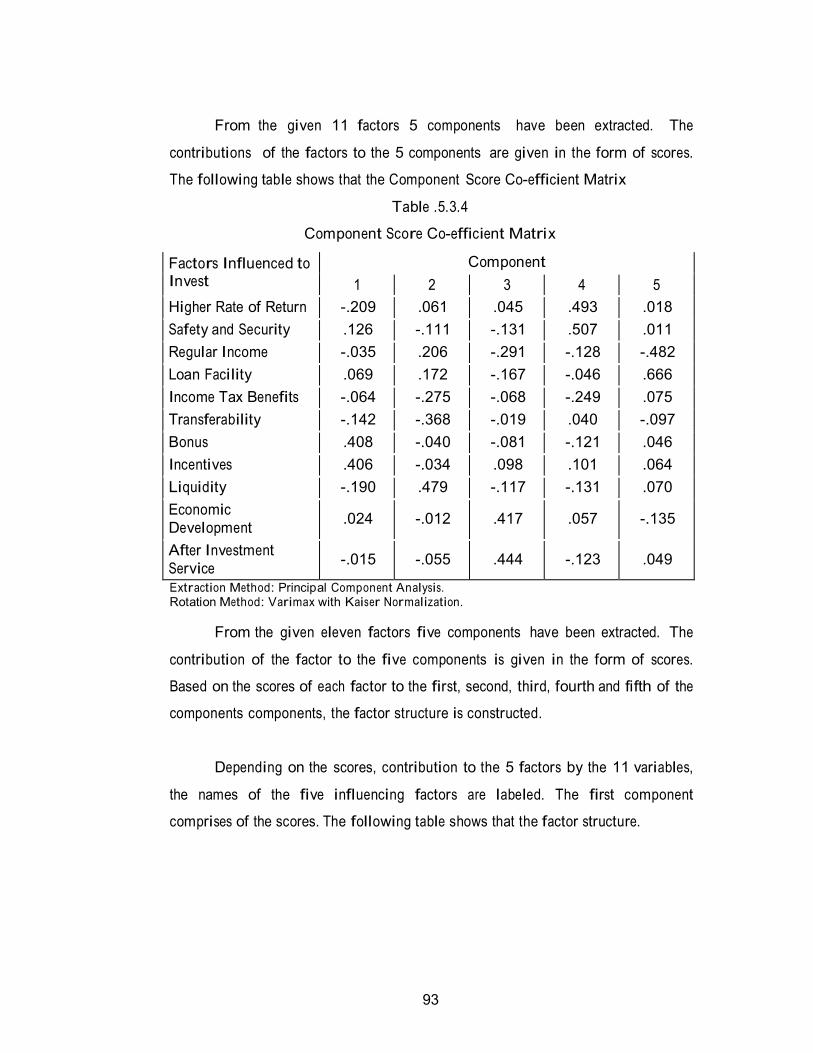
From the given 11 factors 5 components have been extracted. The
contributions of the factors to the 5 components are given in the form of scores.
The following table shows that the Component Score Co-efficient Matrix
Table .5.3.4
Component Score Co-efficient Matrix
Factors Influenced to Invest
Component
1 2 3 4 5
Higher Rate of Return -.209 .061 .045 .493 .018
Safety and Security .126 -.111 -.131 .507 .011
Regular Income -.035 .206 -.291 -.128 -.482
Loan Facility .069 .172 -.167 -.046 .666
Income Tax Benefits -.064 -.275 -.068 -.249 .075
Transferability -.142 -.368 -.019 .040 -.097
Bonus .408 -.040 -.081 -.121 .046
Incentives .406 -.034 .098 .101 .064
Liquidity -.190 .479 -.117 -.131 .070
Economic
Development
.024
-.012
.417
.057
-.135
After Investment
Service
-.015
-.055
.444
-.123
.049
Extraction Method: Principal Component Analysis. Rotation Method: Varimax with Kaiser Normalization.
From the given eleven factors five components have been extracted. The
contribution of the factor to the five components is given in the form of scores.
Based on the scores of each factor to the first, second, third, fourth and fifth of the
components components, the factor structure is constructed.
Depending on the scores, contribution to the 5 factors by the 11 variables,
the names of the five influencing factors are labeled. The first component
comprises of the scores. The following table shows that the factor structure.
94
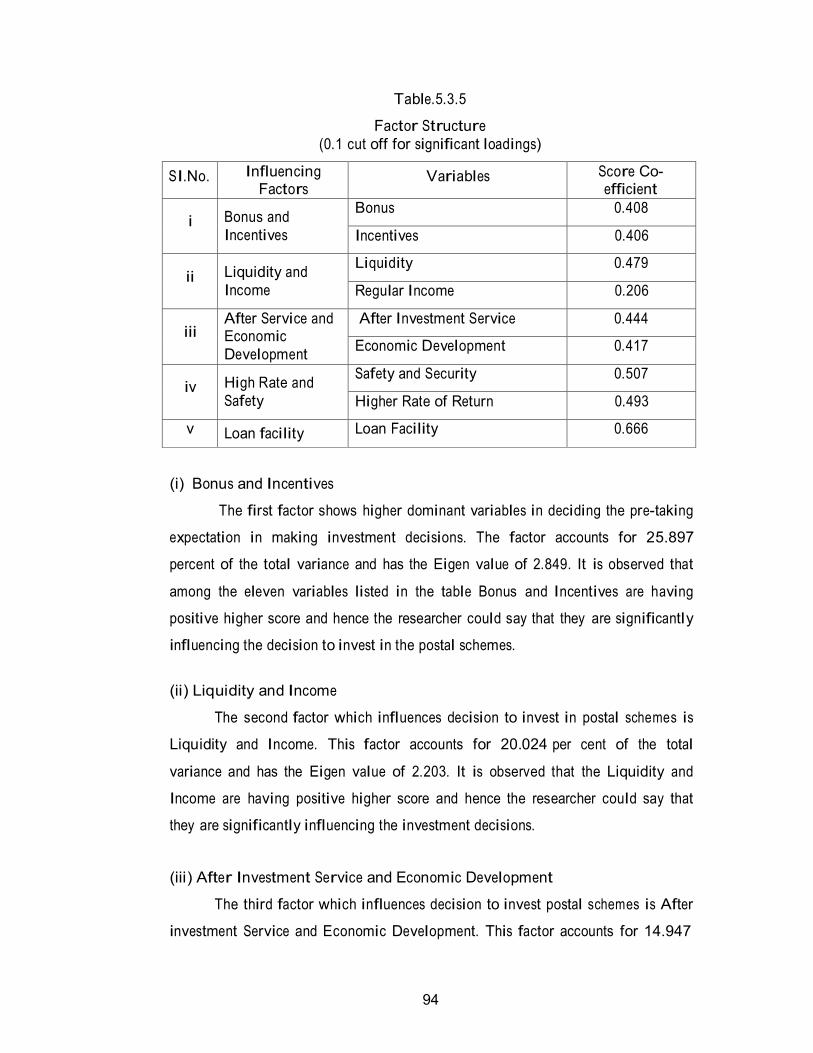
Table.5.3.5
Factor Structure
(0.1 cut off for significant loadings)
SI.No. Influencing Factors
Variables Score Co- efficient
i
Bonus and
Incentives
Bonus 0.408
Incentives 0.406
ii
Liquidity and
Income
Liquidity 0.479
Regular Income 0.206
iii After Service and Economic
Development
After Investment Service 0.444
Economic Development 0.417
iv
High Rate and
Safety
Safety and Security 0.507
Higher Rate of Return 0.493
v Loan facility Loan Facility 0.666
(i) Bonus and Incentives
The first factor shows higher dominant variables in deciding the pre-taking
expectation in making investment decisions. The factor accounts for 25.897
percent of the total variance and has the Eigen value of 2.849. It is observed that
among the eleven variables listed in the table Bonus and Incentives are having
positive higher score and hence the researcher could say that they are significantly
influencing the decision to invest in the postal schemes.
(ii) Liquidity and Income
The second factor which influences decision to invest in postal schemes is
Liquidity and Income. This factor accounts for 20.024 per cent of the total
variance and has the Eigen value of 2.203. It is observed that the Liquidity and
Income are having positive higher score and hence the researcher could say that
they are significantly influencing the investment decisions.
(iii) After Investment Service and Economic Development
The third factor which influences decision to invest postal schemes is After
investment Service and Economic Development. This factor accounts for 14.947
95
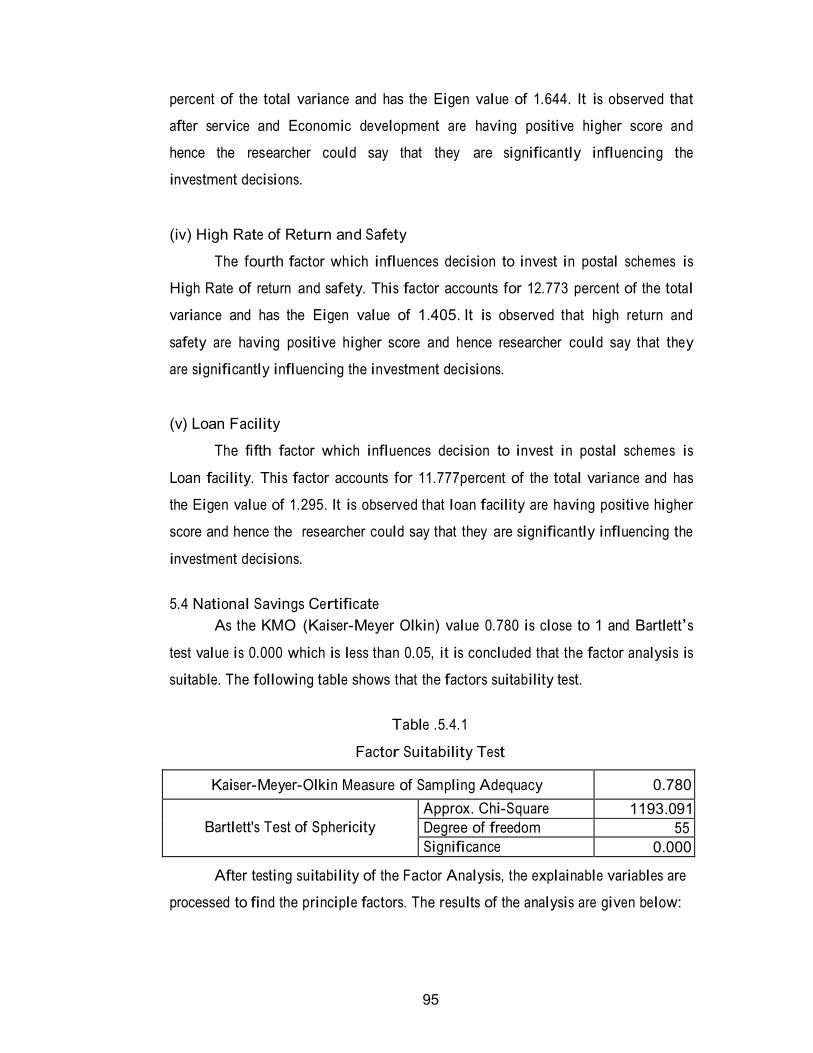
percent of the total variance and has the Eigen value of 1.644. It is observed that
after service and Economic development are having positive higher score and
hence the researcher could say that they are significantly influencing the
investment decisions.
(iv) High Rate of Return and Safety
The fourth factor which influences decision to invest in postal schemes is
High Rate of return and safety. This factor accounts for 12.773 percent of the total
variance and has the Eigen value of 1.405. It is observed that high return and
safety are having positive higher score and hence researcher could say that they
are significantly influencing the investment decisions.
(v) Loan Facility
The fifth factor which influences decision to invest in postal schemes is
Loan facility. This factor accounts for 11.777percent of the total variance and has
the Eigen value of 1.295. It is observed that loan facility are having positive higher
score and hence the researcher could say that they are significantly influencing the
investment decisions.
5.4 National Savings Certificate
As the KMO (Kaiser-Meyer Olkin) value 0.780 is close to 1 and Bartlett’s
test value is 0.000 which is less than 0.05, it is concluded that the factor analysis is
suitable. The following table shows that the factors suitability test.
Table .5.4.1
Factor Suitability Test
Kaiser-Meyer-Olkin Measure of Sampling Adequacy 0.780
Bartlett's Test of Sphericity
Approx. Chi-Square 1193.091
Degree of freedom 55
Significance 0.000
After testing suitability of the Factor Analysis, the explainable variables are
processed to find the principle factors. The results of the analysis are given below:
96
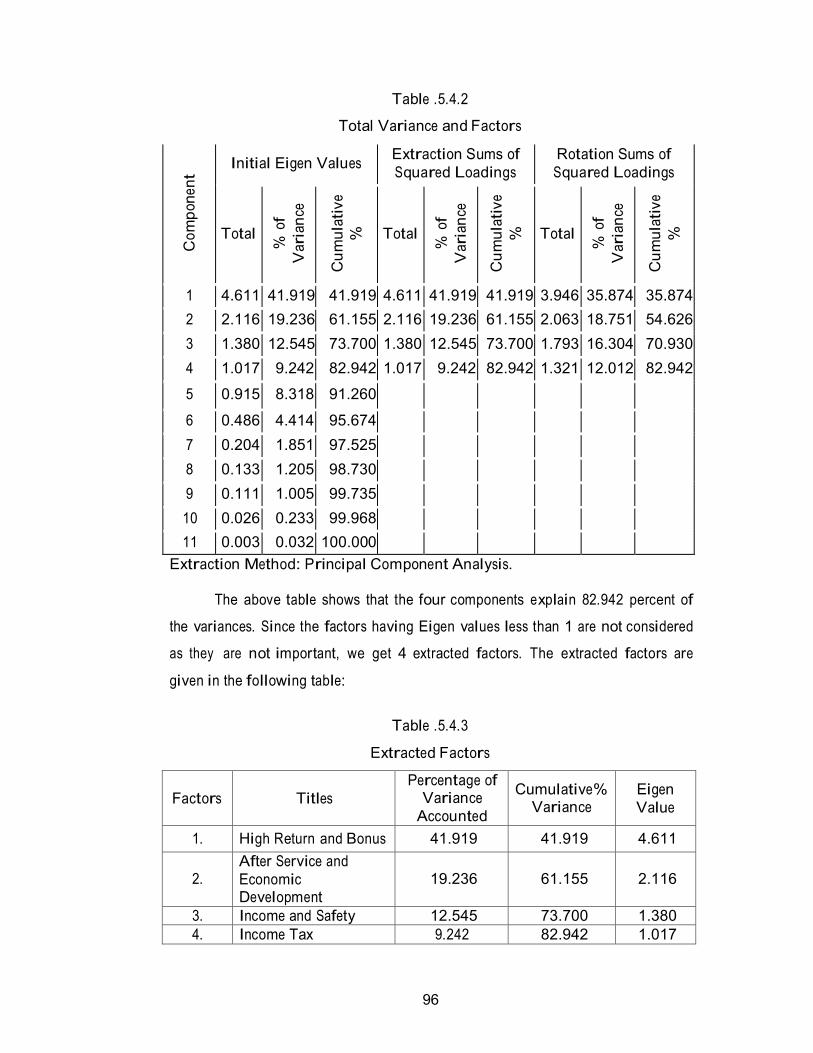
Table .5.4.2
Total Variance and Factors
C
om
pon
ent
Initial Eigen Values Extraction Sums of
Squared Loadings
Rotation Sums of
Squared Loadings
Total
% o
f
Var
ian
ce
Cu
mula
tiv
e
%
Total
% o
f
Var
ian
ce
Cu
mula
tiv
e
%
Total
% o
f
Var
ian
ce
Cu
mula
tiv
e
%
1 4.611 41.919 41.919 4.611 41.919 41.919 3.946 35.874 35.874
2 2.116 19.236 61.155 2.116 19.236 61.155 2.063 18.751 54.626
3 1.380 12.545 73.700 1.380 12.545 73.700 1.793 16.304 70.930
4 1.017 9.242 82.942 1.017 9.242 82.942 1.321 12.012 82.942
5 0.915 8.318 91.260
6 0.486 4.414 95.674
7 0.204 1.851 97.525
8 0.133 1.205 98.730
9 0.111 1.005 99.735
10 0.026 0.233 99.968
11 0.003 0.032 100.000
Extraction Method: Principal Component Analysis.
The above table shows that the four components explain 82.942 percent of
the variances. Since the factors having Eigen values less than 1 are not considered
as they are not important, we get 4 extracted factors. The extracted factors are
given in the following table:
Table .5.4.3
Extracted Factors
Factors
Titles
Percentage of Variance
Accounted
Cumulative% Variance
Eigen
Value
1. High Return and Bonus 41.919 41.919 4.611
2.
After Service and
Economic Development
19.236
61.155
2.116
3. Income and Safety 12.545 73.700 1.380
4. Income Tax 9.242 82.942 1.017
97
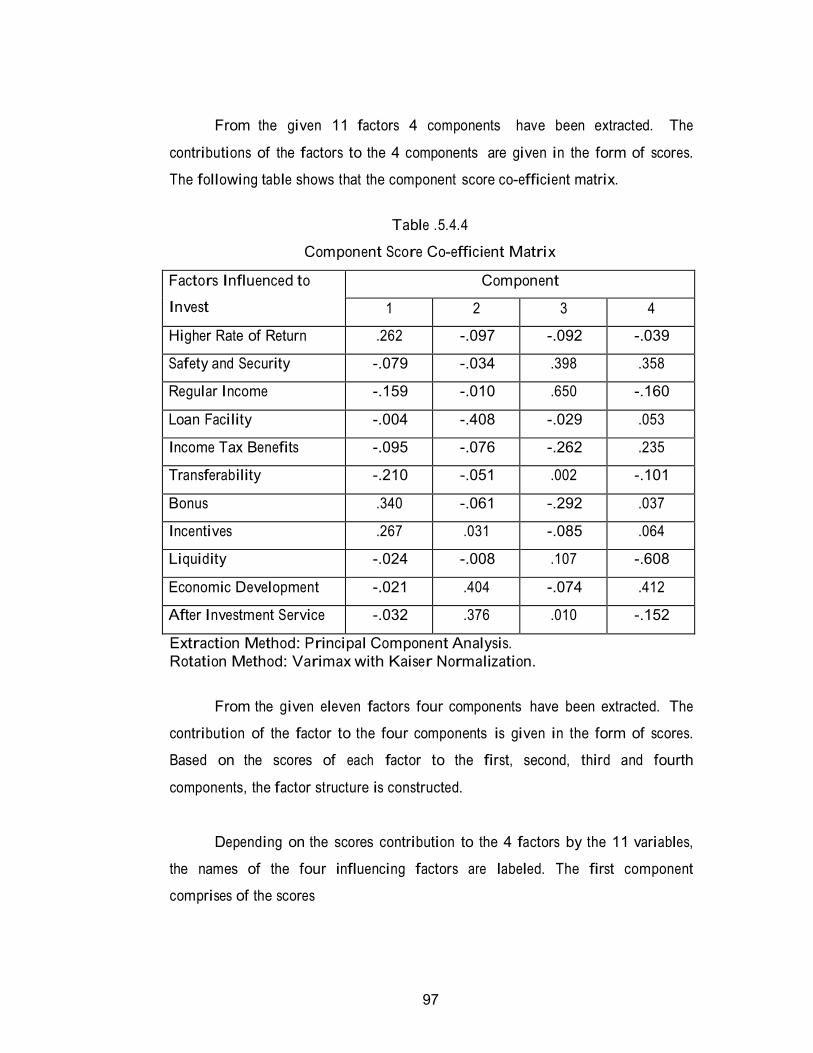
From the given 11 factors 4 components have been extracted. The
contributions of the factors to the 4 components are given in the form of scores.
The following table shows that the component score co-efficient matrix.
Table .5.4.4
Component Score Co-efficient Matrix
Factors Influenced to
Invest
Component
1 2 3 4
Higher Rate of Return .262 -.097 -.092 -.039
Safety and Security -.079 -.034 .398 .358
Regular Income -.159 -.010 .650 -.160
Loan Facility -.004 -.408 -.029 .053
Income Tax Benefits -.095 -.076 -.262 .235
Transferability -.210 -.051 .002 -.101
Bonus .340 -.061 -.292 .037
Incentives .267 .031 -.085 .064
Liquidity -.024 -.008 .107 -.608
Economic Development -.021 .404 -.074 .412
After Investment Service -.032 .376 .010 -.152
Extraction Method: Principal Component Analysis.
Rotation Method: Varimax with Kaiser Normalization.
From the given eleven factors four components have been extracted. The
contribution of the factor to the four components is given in the form of scores.
Based on the scores of each factor to the first, second, third and fourth
components, the factor structure is constructed.
Depending on the scores contribution to the 4 factors by the 11 variables,
the names of the four influencing factors are labeled. The first component
comprises of the scores
98
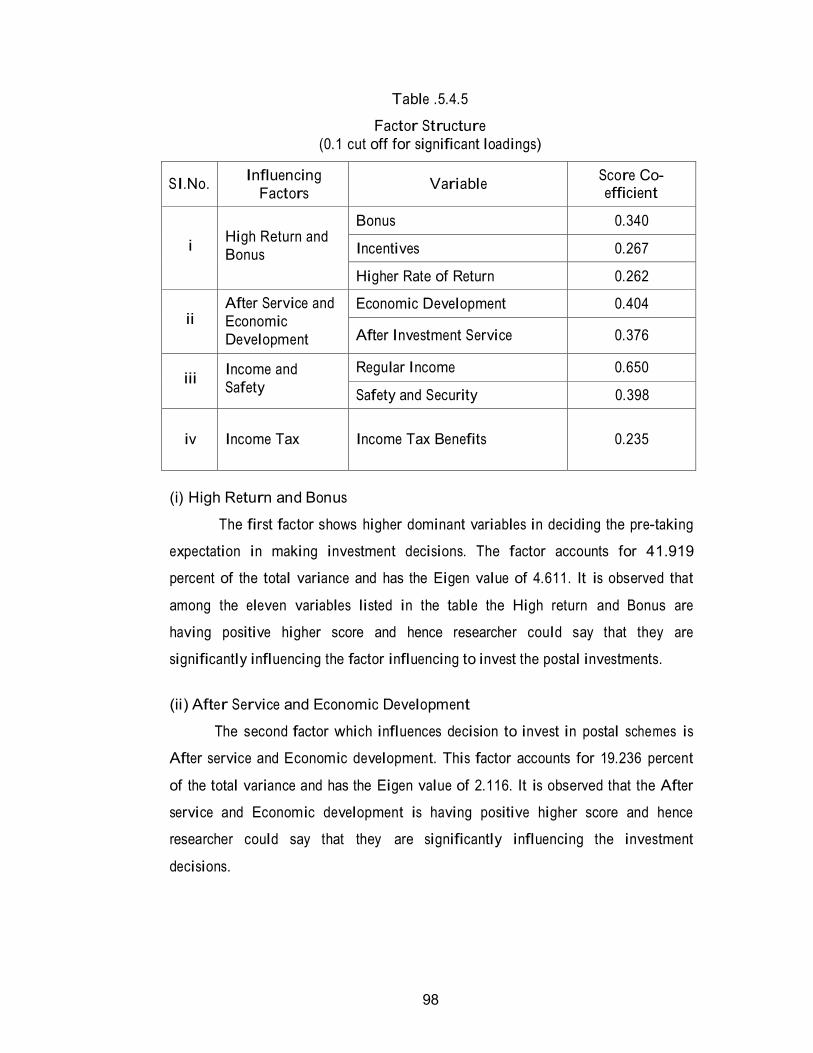
Table .5.4.5
Factor Structure
(0.1 cut off for significant loadings)
SI.No. Influencing
Factors
Variable Score Co- efficient
i
High Return and
Bonus
Bonus 0.340
Incentives 0.267
Higher Rate of Return 0.262
ii
After Service and
Economic
Development
Economic Development 0.404
After Investment Service
0.376
iii
Income and
Safety
Regular Income 0.650
Safety and Security 0.398
iv
Income Tax
Income Tax Benefits
0.235
(i) High Return and Bonus
The first factor shows higher dominant variables in deciding the pre-taking
expectation in making investment decisions. The factor accounts for 41.919
percent of the total variance and has the Eigen value of 4.611. It is observed that
among the eleven variables listed in the table the High return and Bonus are
having positive higher score and hence researcher could say that they are
significantly influencing the factor influencing to invest the postal investments.
(ii) After Service and Economic Development
The second factor which influences decision to invest in postal schemes is
After service and Economic development. This factor accounts for 19.236 percent
of the total variance and has the Eigen value of 2.116. It is observed that the After
service and Economic development is having positive higher score and hence
researcher could say that they are significantly influencing the investment
decisions.
99
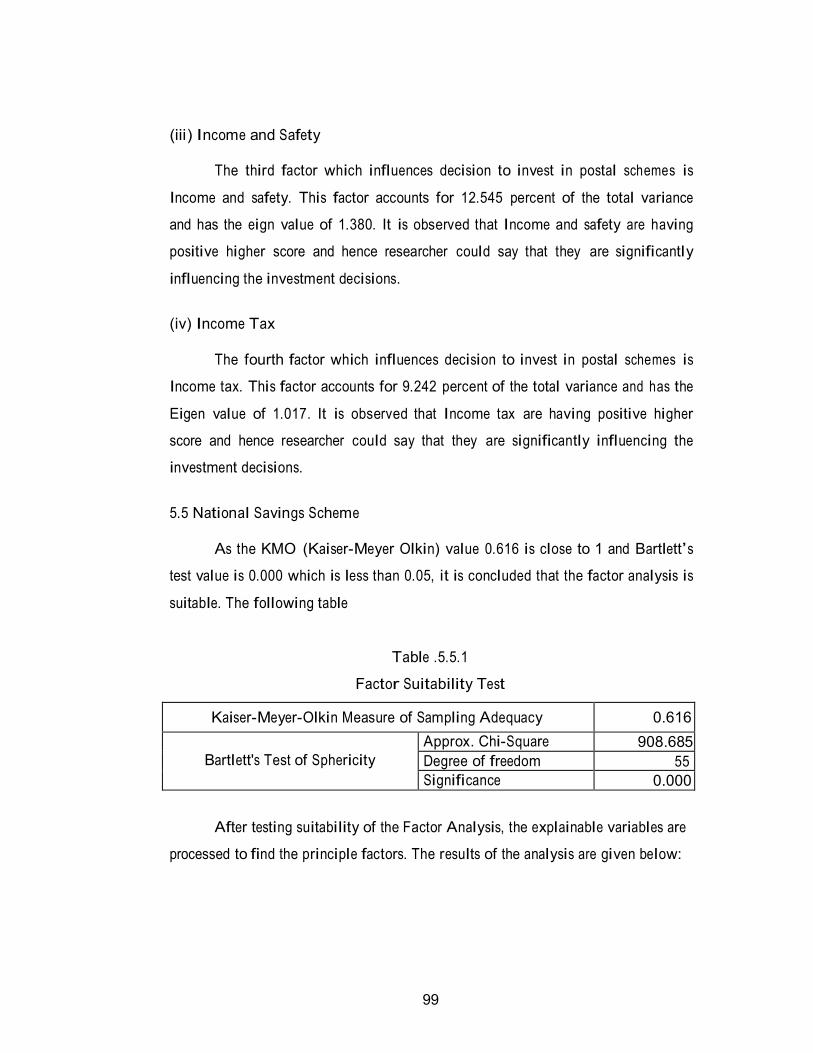
(iii) Income and Safety
The third factor which influences decision to invest in postal schemes is
Income and safety. This factor accounts for 12.545 percent of the total variance
and has the eign value of 1.380. It is observed that Income and safety are having
positive higher score and hence researcher could say that they are significantly
influencing the investment decisions.
(iv) Income Tax
The fourth factor which influences decision to invest in postal schemes is
Income tax. This factor accounts for 9.242 percent of the total variance and has the
Eigen value of 1.017. It is observed that Income tax are having positive higher
score and hence researcher could say that they are significantly influencing the
investment decisions.
5.5 National Savings Scheme
As the KMO (Kaiser-Meyer Olkin) value 0.616 is close to 1 and Bartlett’s
test value is 0.000 which is less than 0.05, it is concluded that the factor analysis is
suitable. The following table
Table .5.5.1
Factor Suitability Test
Kaiser-Meyer-Olkin Measure of Sampling Adequacy 0.616
Bartlett's Test of Sphericity
Approx. Chi-Square 908.685
Degree of freedom 55
Significance 0.000
After testing suitability of the Factor Analysis, the explainable variables are
processed to find the principle factors. The results of the analysis are given below:
100
Table .5.5.2
Total Variance and Factors
C
om
pon
ent
Initial Eigen Values Extraction Sums of Squared Loadings
Rotation Sums of Squared Loadings
Total
% o
f
Var
ian
ce
Cu
mula
tiv
e
%
Total
% o
f
Var
ian
ce
Cu
mula
tiv
e
%
Total
% o
f
Var
ian
ce
Cu
mula
tiv
e
%
1 3.996 36.326 36.326 3.996 36.326 36.326 2.655 24.137 24.137
2 2.417 21.969 58.294 2.417 21.969 58.294 2.514 22.855 46.992
3 1.609 14.625 72.919 1.609 14.625 72.919 2.388 21.706 68.698
4 1.291 11.736 84.655 1.291 11.736 84.655 1.755 15.958 84.655
5 0.791 7.194 91.849
6 0.431 3.917 95.766
7 0.250 2.272 98.039
8 0.141 1.283 99.321
9 0.052 0.475 99.796
10 0.019 0.176 99.972
11 0.003 0.028 100.000
Extraction Method: Principal Component Analysis.
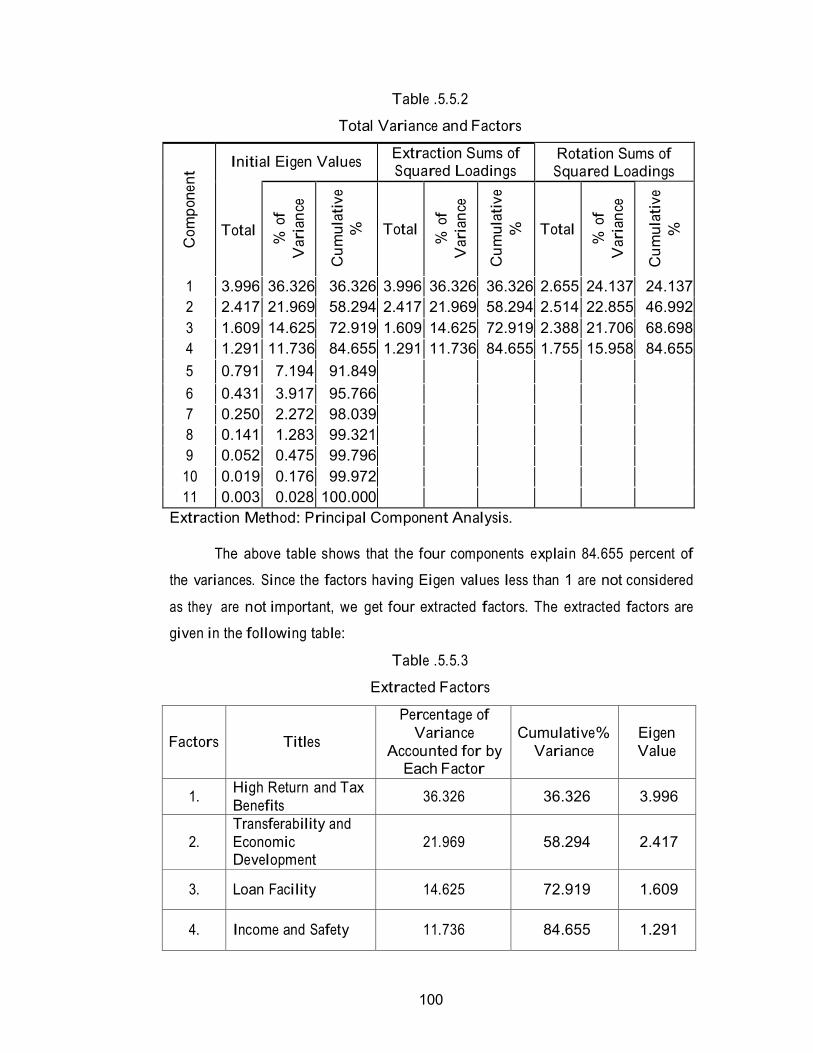
The above table shows that the four components explain 84.655 percent of
the variances. Since the factors having Eigen values less than 1 are not considered
as they are not important, we get four extracted factors. The extracted factors are
given in the following table:
Table .5.5.3
Extracted Factors
Factors
Titles
Percentage of
Variance
Accounted for by Each Factor
Cumulative%
Variance
Eigen
Value
1. High Return and Tax
Benefits
36.326
36.326
3.996
2.
Transferability and
Economic Development
21.969
58.294
2.417
3.
Loan Facility
14.625
72.919
1.609
4.
Income and Safety
11.736
84.655
1.291
101
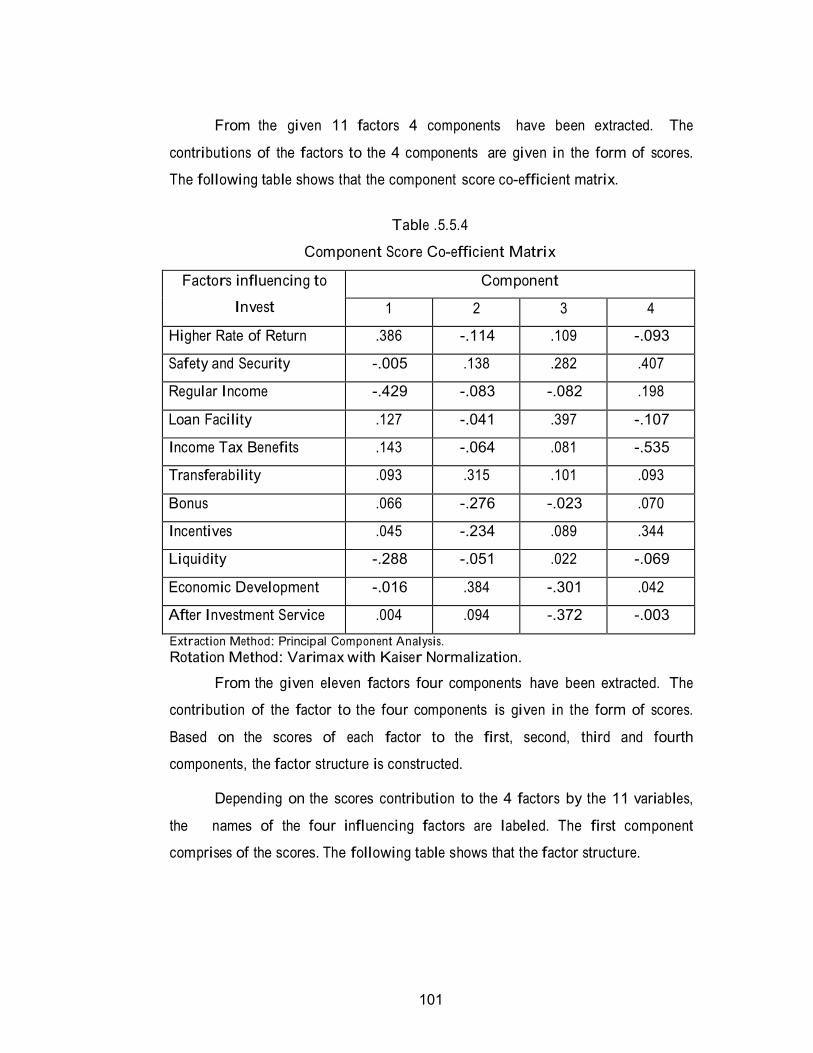
From the given 11 factors 4 components have been extracted. The
contributions of the factors to the 4 components are given in the form of scores.
The following table shows that the component score co-efficient matrix.
Table .5.5.4
Component Score Co-efficient Matrix
Factors influencing to
Invest
Component
1 2 3 4
Higher Rate of Return .386 -.114 .109 -.093
Safety and Security -.005 .138 .282 .407
Regular Income -.429 -.083 -.082 .198
Loan Facility .127 -.041 .397 -.107
Income Tax Benefits .143 -.064 .081 -.535
Transferability .093 .315 .101 .093
Bonus .066 -.276 -.023 .070
Incentives .045 -.234 .089 .344
Liquidity -.288 -.051 .022 -.069
Economic Development -.016 .384 -.301 .042
After Investment Service .004 .094 -.372 -.003
Extraction Method: Principal Component Analysis.
Rotation Method: Varimax with Kaiser Normalization.
From the given eleven factors four components have been extracted. The
contribution of the factor to the four components is given in the form of scores.
Based on the scores of each factor to the first, second, third and fourth
components, the factor structure is constructed.
Depending on the scores contribution to the 4 factors by the 11 variables,
the names of the four influencing factors are labeled. The first component
comprises of the scores. The following table shows that the factor structure.
102
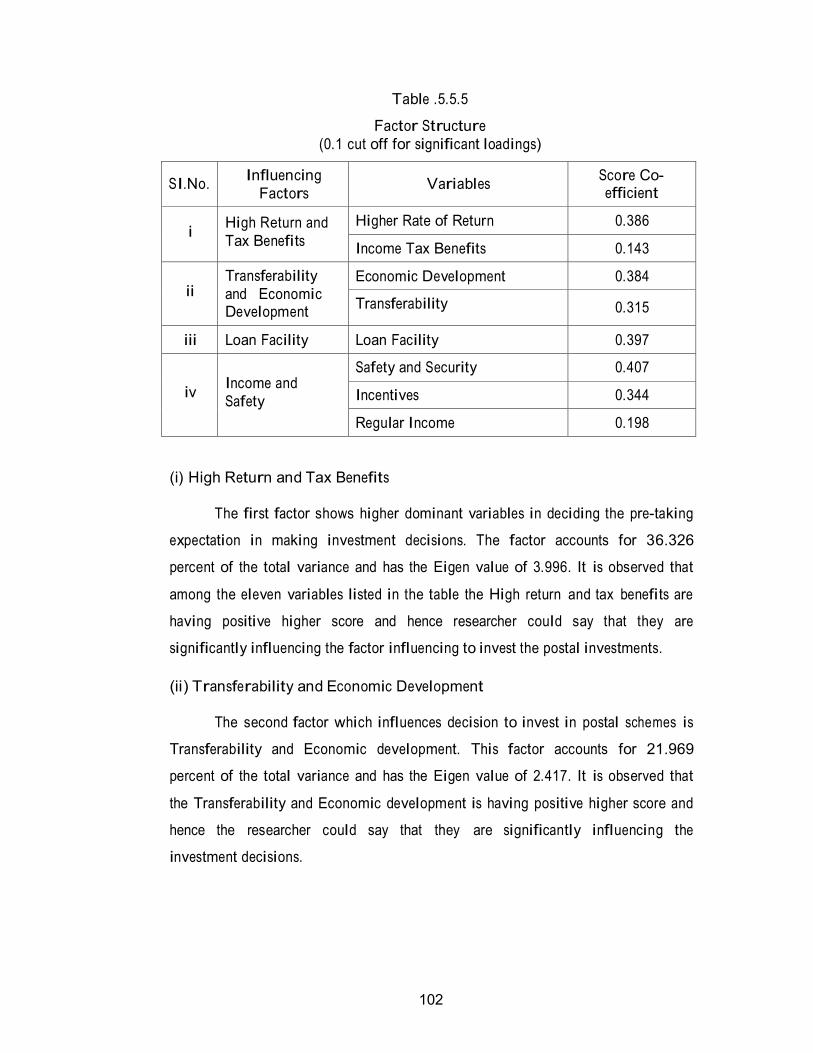
Table .5.5.5
Factor Structure
(0.1 cut off for significant loadings)
SI.No. Influencing
Factors
Variables Score Co- efficient
i
High Return and
Tax Benefits
Higher Rate of Return 0.386
Income Tax Benefits 0.143
ii
Transferability
and Economic Development
Economic Development 0.384
Transferability
0.315
iii Loan Facility Loan Facility 0.397
iv
Income and
Safety
Safety and Security 0.407
Incentives 0.344
Regular Income 0.198
(i) High Return and Tax Benefits
The first factor shows higher dominant variables in deciding the pre-taking
expectation in making investment decisions. The factor accounts for 36.326
percent of the total variance and has the Eigen value of 3.996. It is observed that
among the eleven variables listed in the table the High return and tax benefits are
having positive higher score and hence researcher could say that they are
significantly influencing the factor influencing to invest the postal investments.
(ii) Transferability and Economic Development
The second factor which influences decision to invest in postal schemes is
Transferability and Economic development. This factor accounts for 21.969
percent of the total variance and has the Eigen value of 2.417. It is observed that
the Transferability and Economic development is having positive higher score and
hence the researcher could say that they are significantly influencing the
investment decisions.
103
(iii) Loan Facility
The third factor which influences decision to invest in postal schemes is
Loan facility. This factor accounts for 14.625 percent of the total variance and has
the eign value of 1.609. It is observed that loan facility are having positive higher
score and hence researcher could say that they are significantly influencing the
investment decisions.
(iv) Income and Safety
The fourth factor which influences decision to invest in postal schemes is
Oncom and Safety. This factor accounts for 11.736 percent of the total variance
and has the eign value of 1.291. It is observed that Income and safety are having
positive higher score and hence researcher could say that they are significantly
influencing the investment decisions.
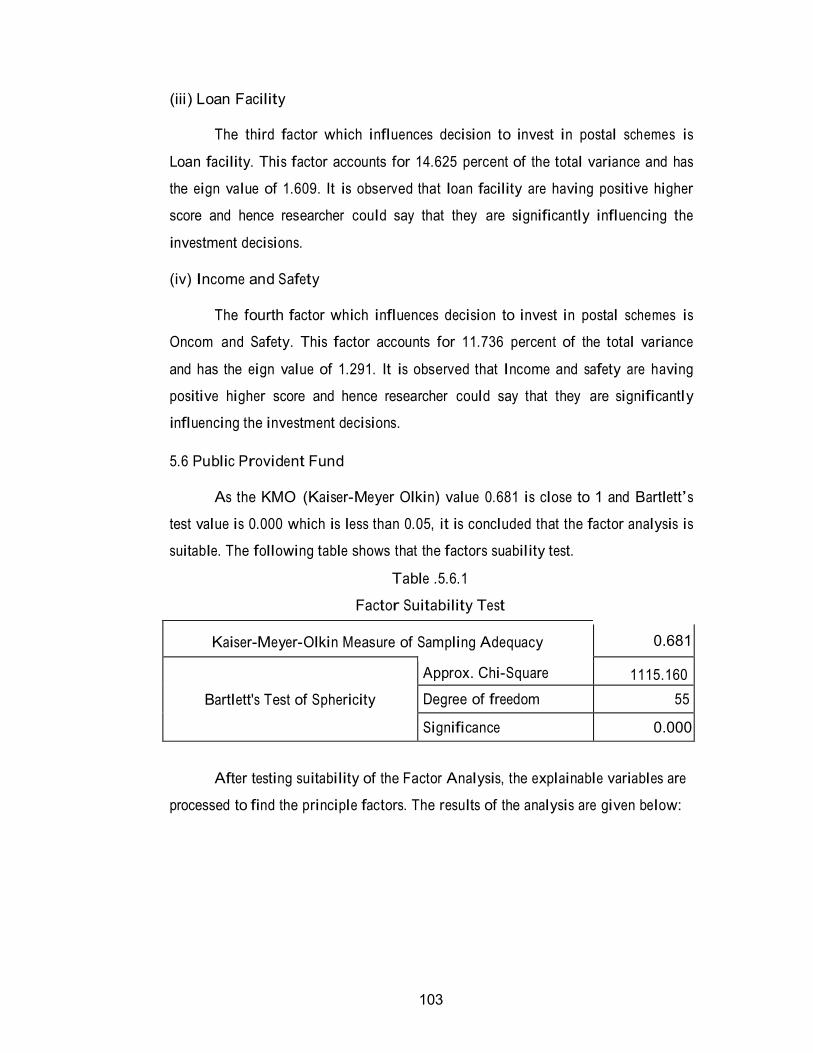
5.6 Public Provident Fund
As the KMO (Kaiser-Meyer Olkin) value 0.681 is close to 1 and Bartlett’s
test value is 0.000 which is less than 0.05, it is concluded that the factor analysis is
suitable. The following table shows that the factors suability test.
Table .5.6.1
Factor Suitability Test
Kaiser-Meyer-Olkin Measure of Sampling Adequacy
0.681
Bartlett's Test of Sphericity
Approx. Chi-Square 1115.160
Degree of freedom 55
Significance 0.000
After testing suitability of the Factor Analysis, the explainable variables are
processed to find the principle factors. The results of the analysis are given below:
104
Table .5.6.2
Total Variance and Factors
C
om
pon
ent
Initial Eigen Values Extraction Sums of
Squared Loadings
Rotation Sums of
Squared Loadings
Total
% o
f
Var
ian
ce
Cu
mula
tiv
e
%
Total
% o
f
Var
ian
ce
Cu
mula
tiv
e
%
Total
% o
f
Var
ian
ce
Cu
mula
tiv
e
%
1 3.864 35.127 35.127 3.864 35.127 35.127 3.700 33.635 33.635
2 2.789 25.351 60.478 2.789 25.351 60.478 2.846 25.870 59.506
3 1.474 13.403 73.881 1.474 13.403 73.881 1.581 14.375 73.881
4 0.919 8.358 82.239
5 0.773 7.026 89.265
6 0.611 5.553 94.818
7 0.269 2.444 97.263
8 0.136 1.239 98.501
9 0.118 1.075 99.577
10 0.044 0.403 99.980
11 0.002 0.020 100.000
Extraction Method: Principal Component Analysis.
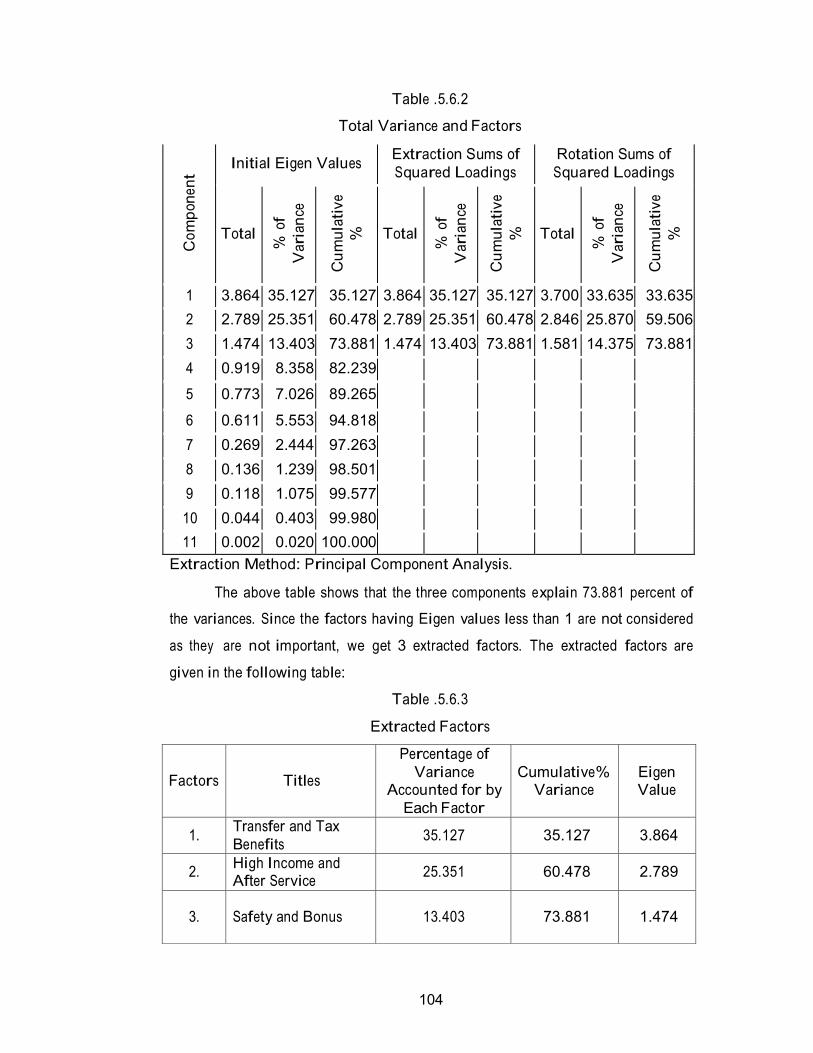
The above table shows that the three components explain 73.881 percent of
the variances. Since the factors having Eigen values less than 1 are not considered
as they are not important, we get 3 extracted factors. The extracted factors are
given in the following table:
Table .5.6.3
Extracted Factors
Factors
Titles
Percentage of
Variance Accounted for by
Each Factor
Cumulative%
Variance
Eigen Value
1. Transfer and Tax
Benefits
35.127
35.127
3.864
2. High Income and After Service
25.351
60.478
2.789
3.
Safety and Bonus
13.403
73.881
1.474
105
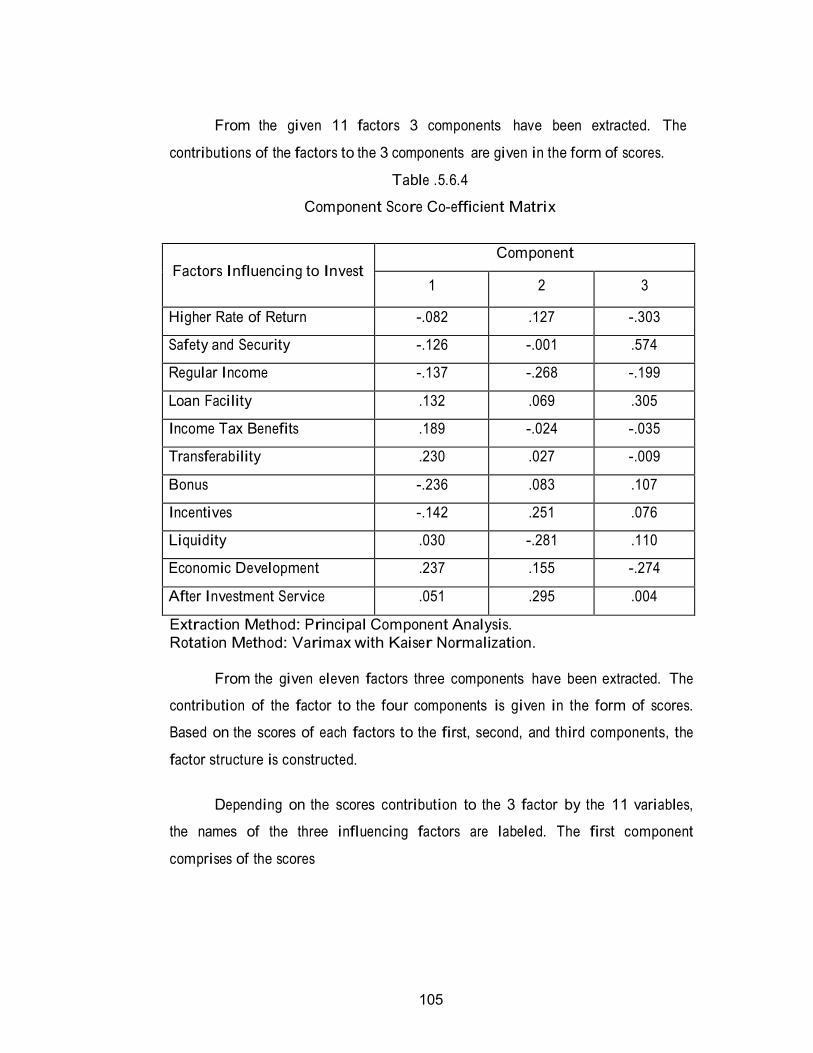
From the given 11 factors 3 components have been extracted. The
contributions of the factors to the 3 components are given in the form of scores.
Table .5.6.4
Component Score Co-efficient Matrix
Factors Influencing to Invest
Component
1 2 3
Higher Rate of Return -.082 .127 -.303
Safety and Security -.126 -.001 .574
Regular Income -.137 -.268 -.199
Loan Facility .132 .069 .305
Income Tax Benefits .189 -.024 -.035
Transferability .230 .027 -.009
Bonus -.236 .083 .107
Incentives -.142 .251 .076
Liquidity .030 -.281 .110
Economic Development .237 .155 -.274
After Investment Service .051 .295 .004
Extraction Method: Principal Component Analysis.
Rotation Method: Varimax with Kaiser Normalization.
From the given eleven factors three components have been extracted. The
contribution of the factor to the four components is given in the form of scores.
Based on the scores of each factors to the first, second, and third components, the
factor structure is constructed.
Depending on the scores contribution to the 3 factor by the 11 variables,
the names of the three influencing factors are labeled. The first component
comprises of the scores
106
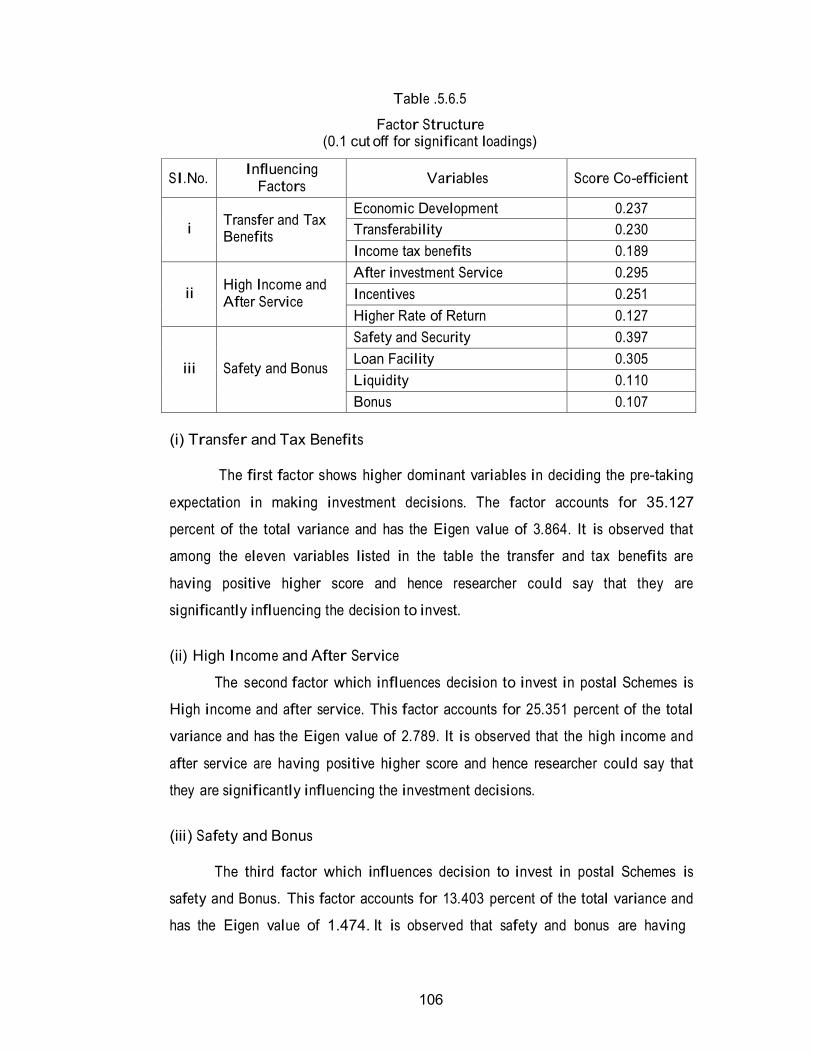
Table .5.6.5
Factor Structure (0.1 cut off for significant loadings)
SI.No. Influencing
Factors
Variables
Score Co-efficient
i
Transfer and Tax Benefits
Economic Development 0.237
Transferability 0.230
Income tax benefits 0.189
ii
High Income and After Service
After investment Service 0.295
Incentives 0.251
Higher Rate of Return 0.127
iii
Safety and Bonus
Safety and Security 0.397
Loan Facility 0.305
Liquidity 0.110
Bonus 0.107
(i) Transfer and Tax Benefits
The first factor shows higher dominant variables in deciding the pre-taking
expectation in making investment decisions. The factor accounts for 35.127
percent of the total variance and has the Eigen value of 3.864. It is observed that
among the eleven variables listed in the table the transfer and tax benefits are
having positive higher score and hence researcher could say that they are
significantly influencing the decision to invest.
(ii) High Income and After Service
The second factor which influences decision to invest in postal Schemes is
High income and after service. This factor accounts for 25.351 percent of the total
variance and has the Eigen value of 2.789. It is observed that the high income and
after service are having positive higher score and hence researcher could say that
they are significantly influencing the investment decisions.
(iii) Safety and Bonus
The third factor which influences decision to invest in postal Schemes is
safety and Bonus. This factor accounts for 13.403 percent of the total variance and
has the Eigen value of 1.474. It is observed that safety and bonus are having
107
positive higher score and hence researcher could say that they are significantly
influencing the investment decisions.
5.7 Deposit Scheme for Retiring Government Employees of Public Sector
Companies
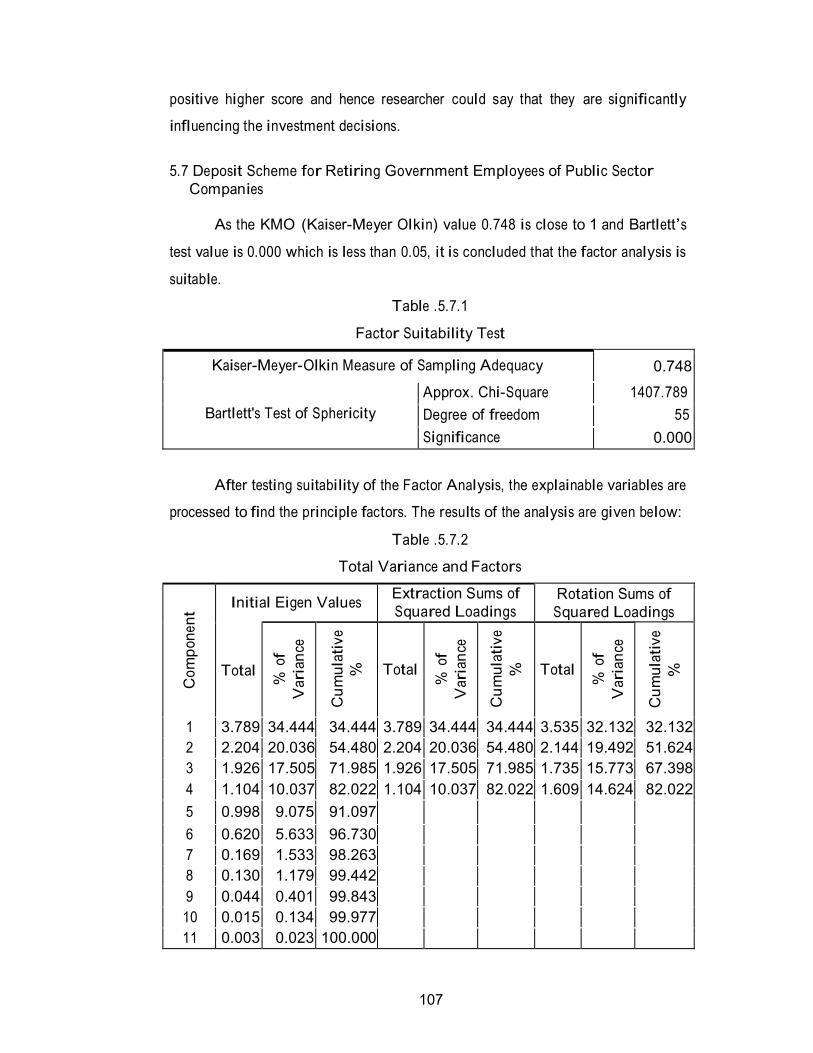
As the KMO (Kaiser-Meyer Olkin) value 0.748 is close to 1 and Bartlett’s
test value is 0.000 which is less than 0.05, it is concluded that the factor analysis is
suitable.
Table .5.7.1
Factor Suitability Test
Kaiser-Meyer-Olkin Measure of Sampling Adequacy 0.748
Bartlett's Test of Sphericity
Approx. Chi-Square 1407.789
Degree of freedom 55
Significance 0.000
After testing suitability of the Factor Analysis, the explainable variables are
processed to find the principle factors. The results of the analysis are given below:
Table .5.7.2
Total Variance and Factors
C
om
pon
ent
Initial Eigen Values Extraction Sums of
Squared Loadings Rotation Sums of
Squared Loadings
Total
% o
f
Var
ian
ce
Cu
mula
tiv
e
%
Total
% o
f
Var
ian
ce
Cu
mula
tiv
e
%
Total
% o
f
Var
ian
ce
Cu
mula
tiv
e
%
1 3.789 34.444 34.444 3.789 34.444 34.444 3.535 32.132 32.132
2 2.204 20.036 54.480 2.204 20.036 54.480 2.144 19.492 51.624
3 1.926 17.505 71.985 1.926 17.505 71.985 1.735 15.773 67.398
4 1.104 10.037 82.022 1.104 10.037 82.022 1.609 14.624 82.022
5 0.998 9.075 91.097
6 0.620 5.633 96.730
7 0.169 1.533 98.263
8 0.130 1.179 99.442
9 0.044 0.401 99.843
10 0.015 0.134 99.977
11 0.003 0.023 100.000
108
Extraction Method: Principal Component Analysis.
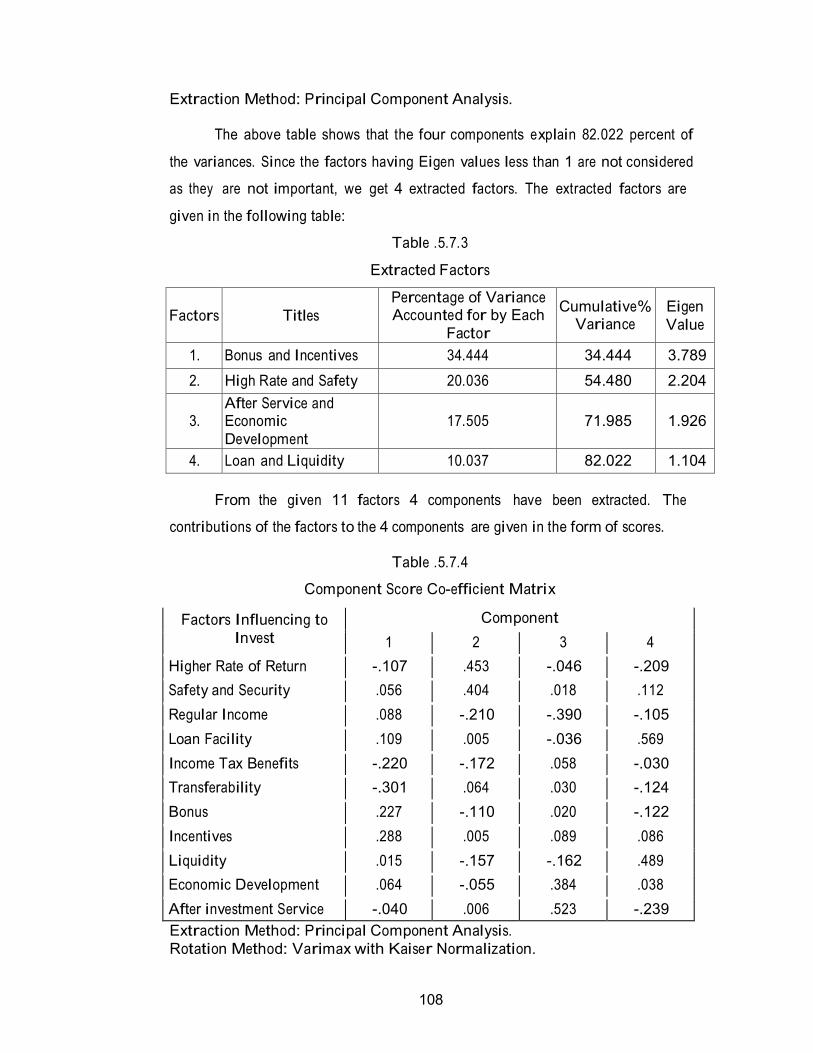
The above table shows that the four components explain 82.022 percent of
the variances. Since the factors having Eigen values less than 1 are not considered
as they are not important, we get 4 extracted factors. The extracted factors are
given in the following table:
Table .5.7.3
Extracted Factors
Factors
Titles
Percentage of Variance Accounted for by Each
Factor
Cumulative% Variance
Eigen
Value
1. Bonus and Incentives 34.444 34.444 3.789
2. High Rate and Safety 20.036 54.480 2.204
3.
After Service and Economic
Development
17.505
71.985
1.926
4. Loan and Liquidity 10.037 82.022 1.104
From the given 11 factors 4 components have been extracted. The
contributions of the factors to the 4 components are given in the form of scores.
Table .5.7.4
Component Score Co-efficient Matrix
Factors Influencing to
Invest
Component
1 2 3 4
Higher Rate of Return -.107 .453 -.046 -.209
Safety and Security .056 .404 .018 .112
Regular Income .088 -.210 -.390 -.105
Loan Facility .109 .005 -.036 .569
Income Tax Benefits -.220 -.172 .058 -.030
Transferability -.301 .064 .030 -.124
Bonus .227 -.110 .020 -.122
Incentives .288 .005 .089 .086
Liquidity .015 -.157 -.162 .489
Economic Development .064 -.055 .384 .038
After investment Service -.040 .006 .523 -.239
Extraction Method: Principal Component Analysis.
Rotation Method: Varimax with Kaiser Normalization.
109
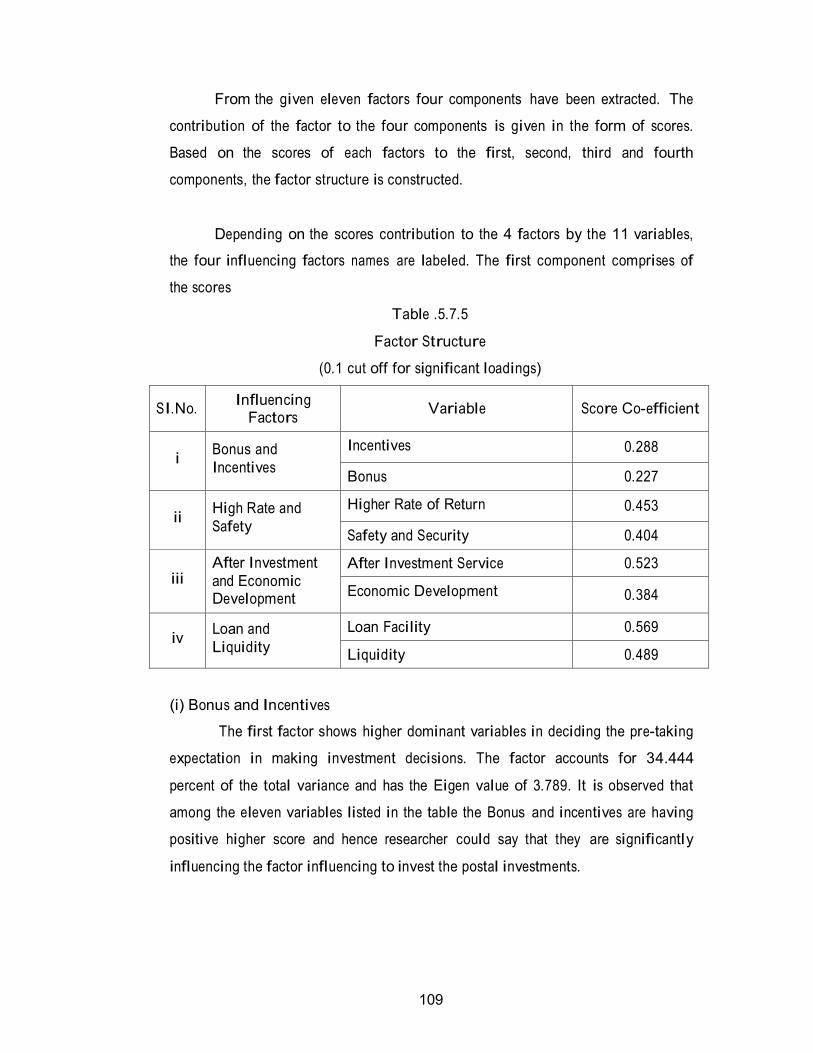
From the given eleven factors four components have been extracted. The
contribution of the factor to the four components is given in the form of scores.
Based on the scores of each factors to the first, second, third and fourth
components, the factor structure is constructed.
Depending on the scores contribution to the 4 factors by the 11 variables,
the four influencing factors names are labeled. The first component comprises of
the scores
Table .5.7.5
Factor Structure
(0.1 cut off for significant loadings)
SI.No. Influencing
Factors
Variable
Score Co-efficient
i
Bonus and
Incentives
Incentives 0.288
Bonus 0.227
ii
High Rate and
Safety
Higher Rate of Return 0.453
Safety and Security 0.404
iii
After Investment
and Economic Development
After Investment Service 0.523
Economic Development
0.384
iv
Loan and
Liquidity
Loan Facility 0.569
Liquidity 0.489
(i) Bonus and Incentives
The first factor shows higher dominant variables in deciding the pre-taking
expectation in making investment decisions. The factor accounts for 34.444
percent of the total variance and has the Eigen value of 3.789. It is observed that
among the eleven variables listed in the table the Bonus and incentives are having
positive higher score and hence researcher could say that they are significantly
influencing the factor influencing to invest the postal investments.
110
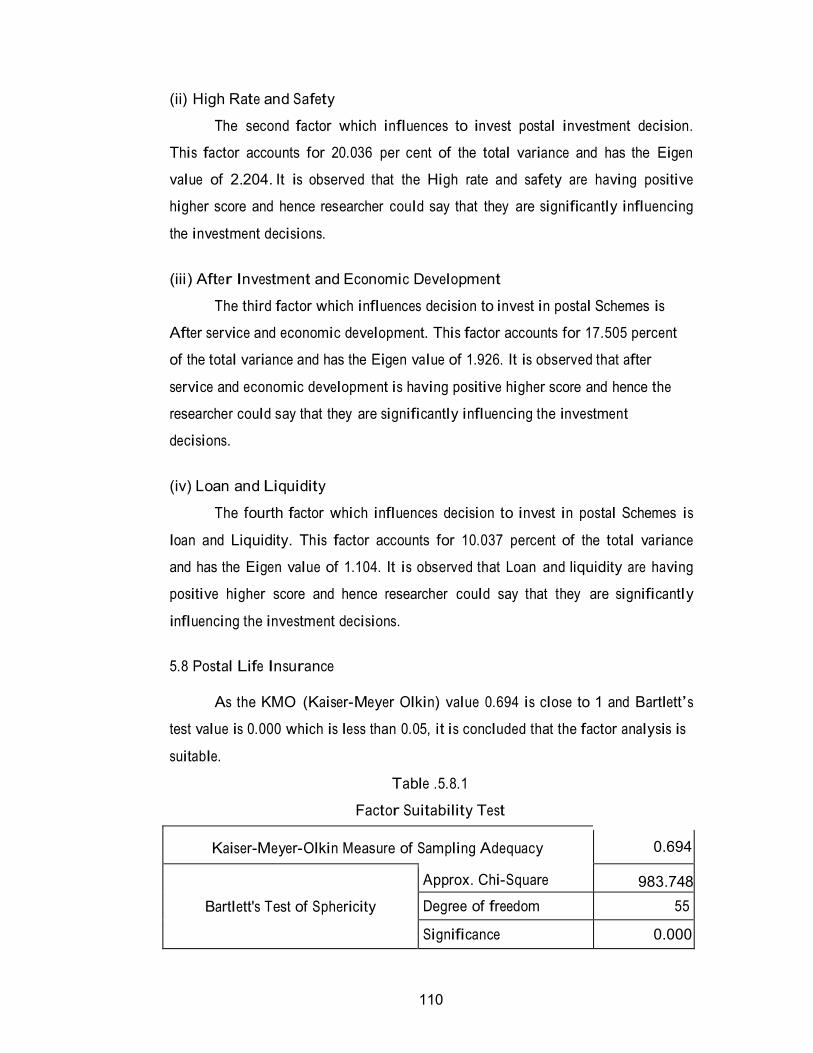
(ii) High Rate and Safety
The second factor which influences to invest postal investment decision.
This factor accounts for 20.036 per cent of the total variance and has the Eigen
value of 2.204. It is observed that the High rate and safety are having positive
higher score and hence researcher could say that they are significantly influencing
the investment decisions.
(iii) After Investment and Economic Development
The third factor which influences decision to invest in postal Schemes is
After service and economic development. This factor accounts for 17.505 percent
of the total variance and has the Eigen value of 1.926. It is observed that after
service and economic development is having positive higher score and hence the
researcher could say that they are significantly influencing the investment
decisions.
(iv) Loan and Liquidity
The fourth factor which influences decision to invest in postal Schemes is
loan and Liquidity. This factor accounts for 10.037 percent of the total variance
and has the Eigen value of 1.104. It is observed that Loan and liquidity are having
positive higher score and hence researcher could say that they are significantly
influencing the investment decisions.
5.8 Postal Life Insurance
As the KMO (Kaiser-Meyer Olkin) value 0.694 is close to 1 and Bartlett’s
test value is 0.000 which is less than 0.05, it is concluded that the factor analysis is
suitable.
Table .5.8.1
Factor Suitability Test
Kaiser-Meyer-Olkin Measure of Sampling Adequacy
0.694
Bartlett's Test of Sphericity
Approx. Chi-Square 983.748
Degree of freedom 55
Significance 0.000
111
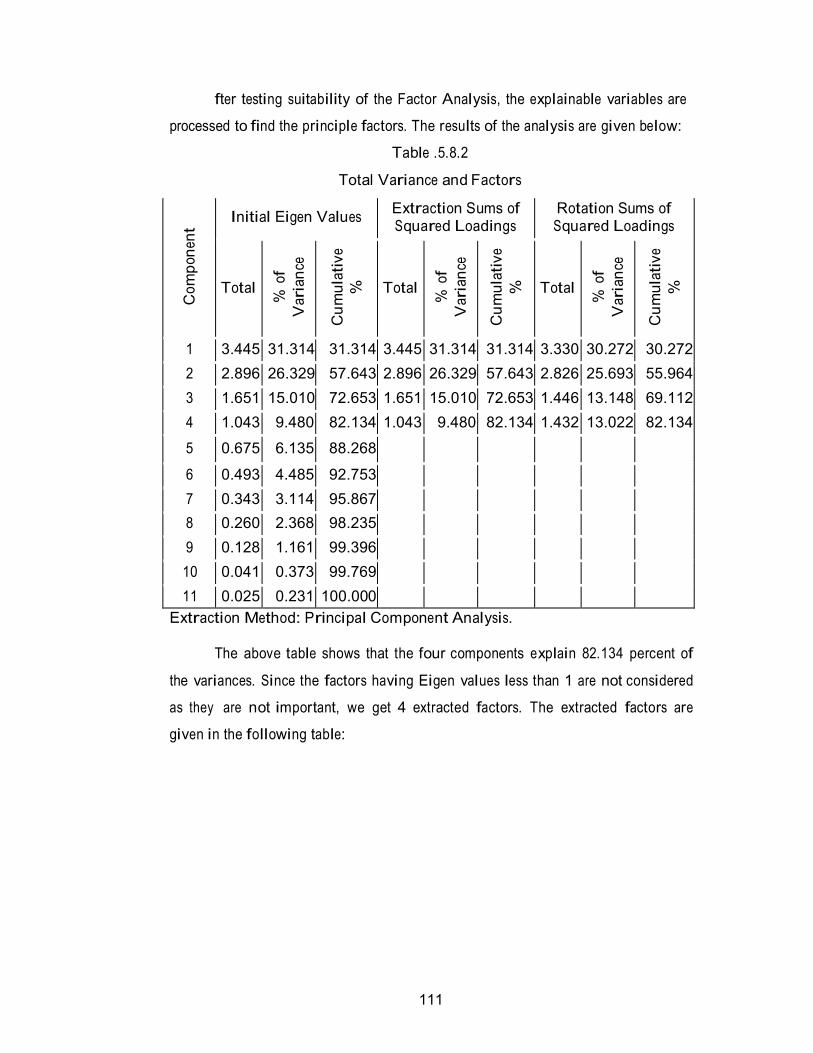
fter testing suitability of the Factor Analysis, the explainable variables are
processed to find the principle factors. The results of the analysis are given below:
Table .5.8.2
Total Variance and Factors
C
om
pon
ent
Initial Eigen Values Extraction Sums of Squared Loadings
Rotation Sums of Squared Loadings
Total
% o
f
Var
ian
ce
Cu
mula
tiv
e
%
Total
% o
f
Var
ian
ce
Cu
mula
tiv
e
%
Total
% o
f
Var
ian
ce
Cu
mula
tiv
e
%
1 3.445 31.314 31.314 3.445 31.314 31.314 3.330 30.272 30.272
2 2.896 26.329 57.643 2.896 26.329 57.643 2.826 25.693 55.964
3 1.651 15.010 72.653 1.651 15.010 72.653 1.446 13.148 69.112
4 1.043 9.480 82.134 1.043 9.480 82.134 1.432 13.022 82.134
5 0.675 6.135 88.268
6 0.493 4.485 92.753
7 0.343 3.114 95.867
8 0.260 2.368 98.235
9 0.128 1.161 99.396
10 0.041 0.373 99.769
11 0.025 0.231 100.000
Extraction Method: Principal Component Analysis.
The above table shows that the four components explain 82.134 percent of
the variances. Since the factors having Eigen values less than 1 are not considered
as they are not important, we get 4 extracted factors. The extracted factors are
given in the following table:
112
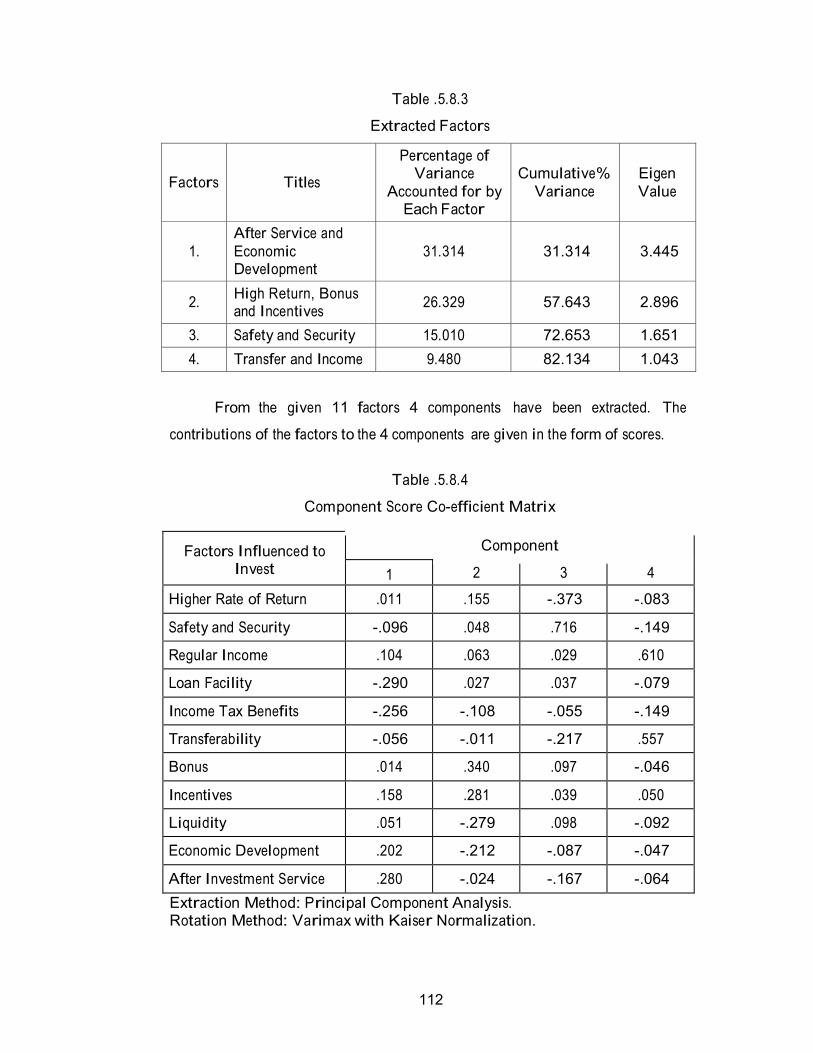
Table .5.8.3
Extracted Factors
Factors
Titles
Percentage of Variance
Accounted for by Each Factor
Cumulative%
Variance
Eigen
Value
1.
After Service and
Economic Development
31.314
31.314
3.445
2. High Return, Bonus and Incentives
26.329
57.643
2.896
3. Safety and Security 15.010 72.653 1.651
4. Transfer and Income 9.480 82.134 1.043
From the given 11 factors 4 components have been extracted. The
contributions of the factors to the 4 components are given in the form of scores.
Table .5.8.4
Component Score Co-efficient Matrix
Factors Influenced to Invest
Component
1 2 3 4
Higher Rate of Return .011 .155 -.373 -.083
Safety and Security -.096 .048 .716 -.149
Regular Income .104 .063 .029 .610
Loan Facility -.290 .027 .037 -.079
Income Tax Benefits -.256 -.108 -.055 -.149
Transferability -.056 -.011 -.217 .557
Bonus .014 .340 .097 -.046
Incentives .158 .281 .039 .050
Liquidity .051 -.279 .098 -.092
Economic Development .202 -.212 -.087 -.047
After Investment Service .280 -.024 -.167 -.064
Extraction Method: Principal Component Analysis. Rotation Method: Varimax with Kaiser Normalization.

113
From the given eleven factors four components have been extracted. The
contribution of the factor to the four components is given in the form of scores.
Based on the scores of each factors to the first, second, third and fourth
components, the factor structure is constructed.
Depending on the scores contribution to the 4 factors by the 11 variables,
the names of the four influencing factors are labeled. The first component
comprises of the scores.
Table .5.8.5
Factor Structure
(0.1 cut off for significant loadings)
SI.No. Influencing
Factors
Variable Score Co-
efficient
i
After Service and
Economic Development
After Investment Service 0.280
Economic Development
0.202
ii
High Return,
Bonus and Incentives
Bonus 0.340
Incentives 0.281
Higher Rate of Return 0.155
iii Safety and Security
Safety and Security
0.716
iv
Transfer and
Income
Regular Income
0.610
Transferability 0.557
(i) After Service and Economic Development
The first factor shows higher dominant variables in deciding the pre-taking
expectation in making investment decisions. The factor accounts for 31.314
percent of the total variance and has the Eigen value of 3.445. It is observed that
among the eleven variables listed in the table the after service and economic
development are having positive higher score and hence researcher could say that
they are significantly influencing the factor influencing to invest the postal
investments.
114
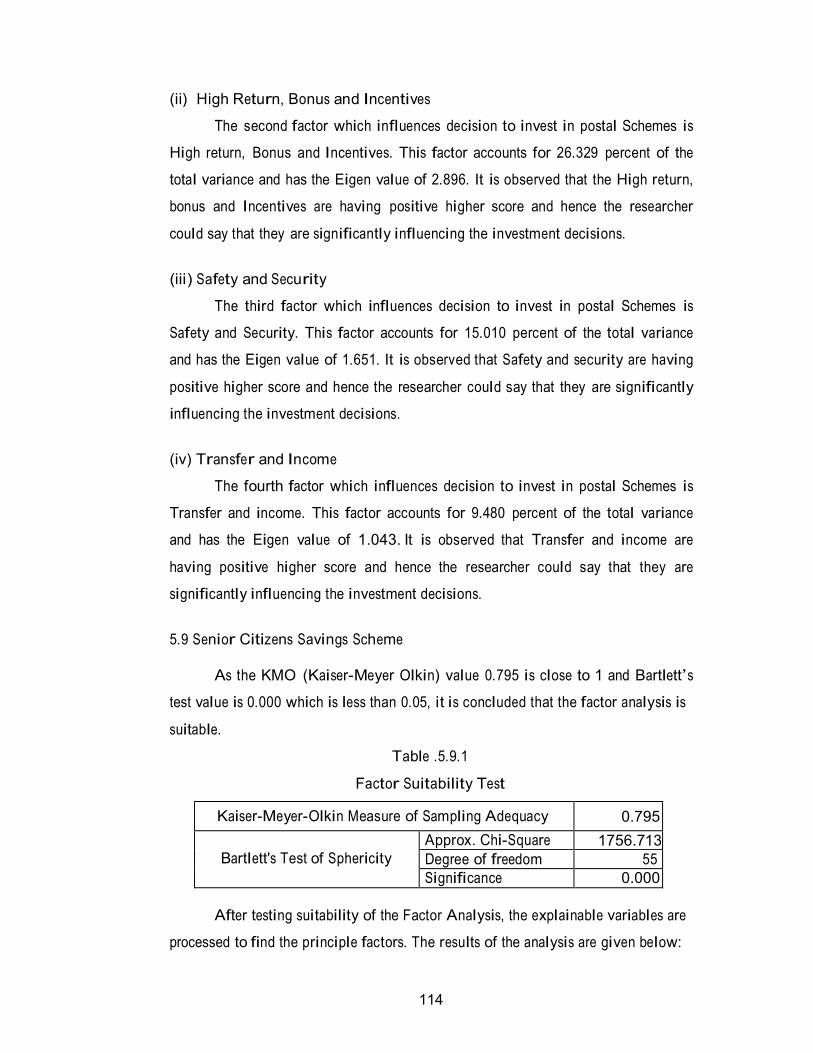
(ii) High Return, Bonus and Incentives
The second factor which influences decision to invest in postal Schemes is
High return, Bonus and Incentives. This factor accounts for 26.329 percent of the
total variance and has the Eigen value of 2.896. It is observed that the High return,
bonus and Incentives are having positive higher score and hence the researcher
could say that they are significantly influencing the investment decisions.
(iii) Safety and Security
The third factor which influences decision to invest in postal Schemes is
Safety and Security. This factor accounts for 15.010 percent of the total variance
and has the Eigen value of 1.651. It is observed that Safety and security are having
positive higher score and hence the researcher could say that they are significantly
influencing the investment decisions.
(iv) Transfer and Income
The fourth factor which influences decision to invest in postal Schemes is
Transfer and income. This factor accounts for 9.480 percent of the total variance
and has the Eigen value of 1.043. It is observed that Transfer and income are
having positive higher score and hence the researcher could say that they are
significantly influencing the investment decisions.
5.9 Senior Citizens Savings Scheme
As the KMO (Kaiser-Meyer Olkin) value 0.795 is close to 1 and Bartlett’s
test value is 0.000 which is less than 0.05, it is concluded that the factor analysis is
suitable.
Table .5.9.1
Factor Suitability Test
Kaiser-Meyer-Olkin Measure of Sampling Adequacy 0.795
Bartlett's Test of Sphericity
Approx. Chi-Square 1756.713
Degree of freedom 55
Significance 0.000
After testing suitability of the Factor Analysis, the explainable variables are
processed to find the principle factors. The results of the analysis are given below:
115
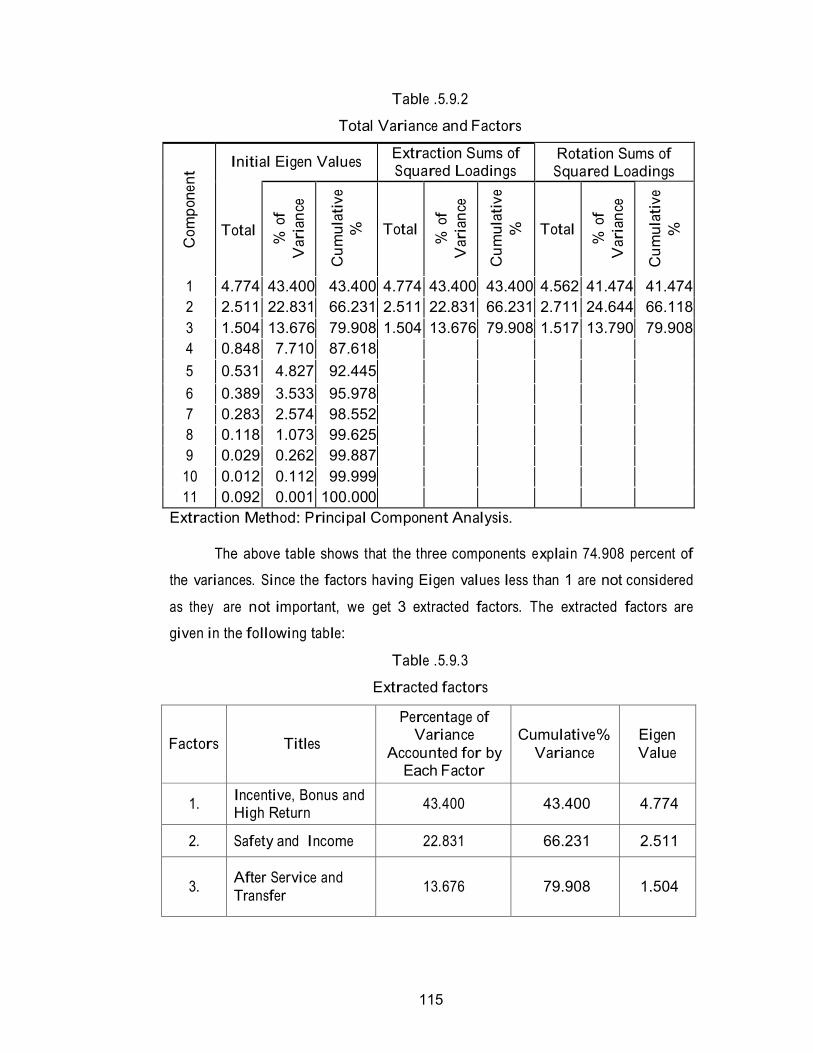
Table .5.9.2
Total Variance and Factors
C
om
pon
ent
Initial Eigen Values Extraction Sums of Squared Loadings
Rotation Sums of Squared Loadings
Total
% o
f
Var
ian
ce
Cu
mula
tiv
e
%
Total
% o
f
Var
ian
ce
Cu
mula
tiv
e
%
Total
% o
f
Var
ian
ce
Cu
mula
tiv
e
%
1 4.774 43.400 43.400 4.774 43.400 43.400 4.562 41.474 41.474
2 2.511 22.831 66.231 2.511 22.831 66.231 2.711 24.644 66.118
3 1.504 13.676 79.908 1.504 13.676 79.908 1.517 13.790 79.908
4 0.848 7.710 87.618
5 0.531 4.827 92.445
6 0.389 3.533 95.978
7 0.283 2.574 98.552
8 0.118 1.073 99.625
9 0.029 0.262 99.887
10 0.012 0.112 99.999
11 0.092 0.001 100.000
Extraction Method: Principal Component Analysis.
The above table shows that the three components explain 74.908 percent of
the variances. Since the factors having Eigen values less than 1 are not considered
as they are not important, we get 3 extracted factors. The extracted factors are
given in the following table:
Table .5.9.3
Extracted factors
Factors
Titles
Percentage of Variance
Accounted for by Each Factor
Cumulative%
Variance
Eigen
Value
1. Incentive, Bonus and High Return
43.400
43.400
4.774
2.
Safety and Income
22.831
66.231
2.511
3.
After Service and
Transfer
13.676
79.908
1.504
116
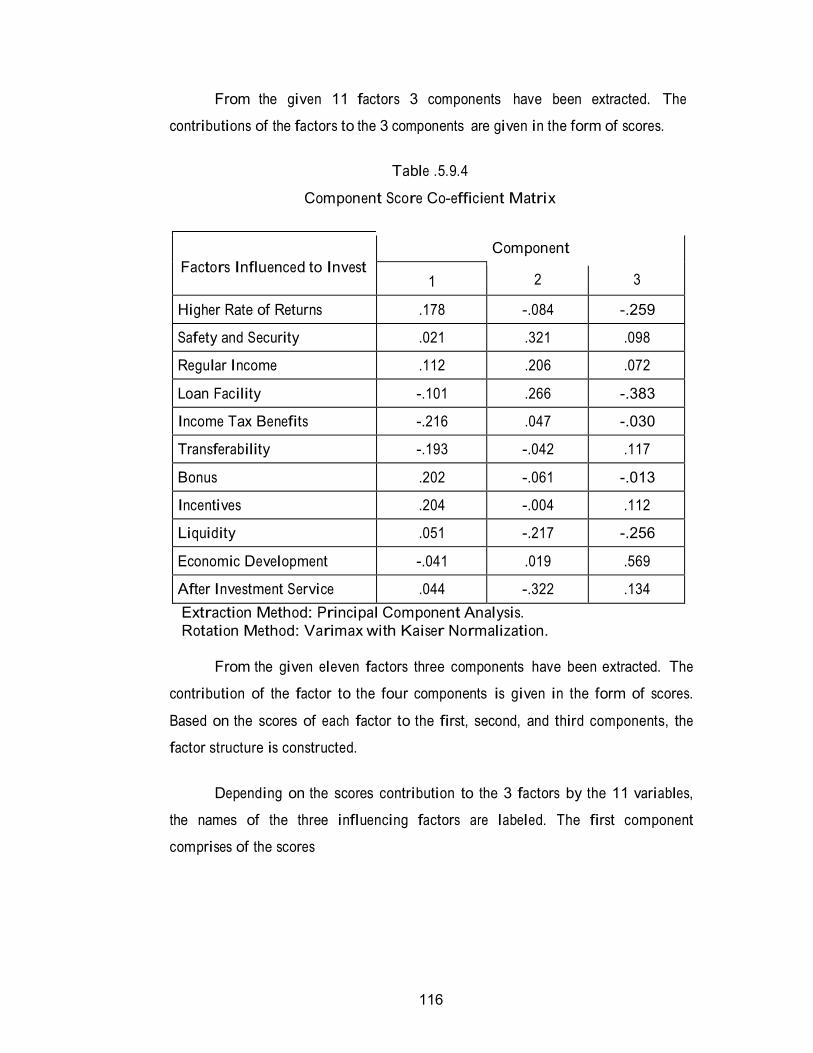
From the given 11 factors 3 components have been extracted. The
contributions of the factors to the 3 components are given in the form of scores.
Table .5.9.4
Component Score Co-efficient Matrix
Factors Influenced to Invest
Component
1 2 3
Higher Rate of Returns .178 -.084 -.259
Safety and Security .021 .321 .098
Regular Income .112 .206 .072
Loan Facility -.101 .266 -.383
Income Tax Benefits -.216 .047 -.030
Transferability -.193 -.042 .117
Bonus .202 -.061 -.013
Incentives .204 -.004 .112
Liquidity .051 -.217 -.256
Economic Development -.041 .019 .569
After Investment Service .044 -.322 .134
Extraction Method: Principal Component Analysis.
Rotation Method: Varimax with Kaiser Normalization.
From the given eleven factors three components have been extracted. The
contribution of the factor to the four components is given in the form of scores.
Based on the scores of each factor to the first, second, and third components, the
factor structure is constructed.
Depending on the scores contribution to the 3 factors by the 11 variables,
the names of the three influencing factors are labeled. The first component
comprises of the scores
117
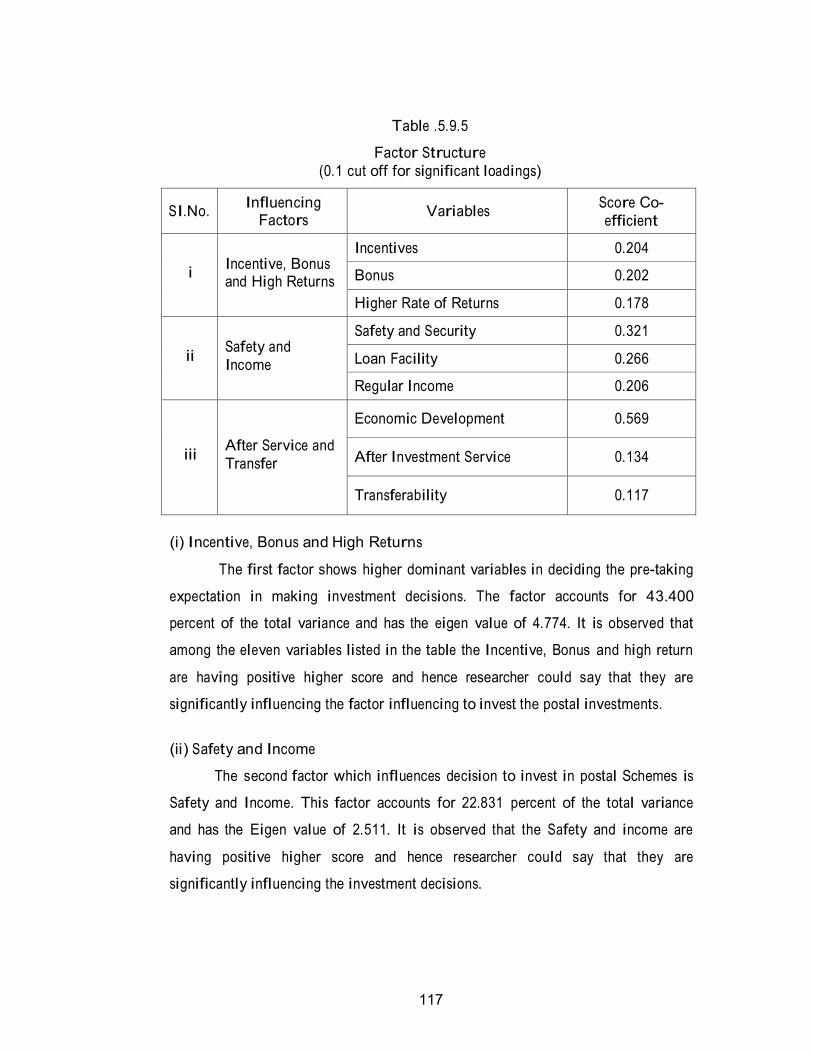
Table .5.9.5
Factor Structure
(0.1 cut off for significant loadings)
SI.No. Influencing
Factors
Variables Score Co-
efficient
i
Incentive, Bonus and High Returns
Incentives 0.204
Bonus 0.202
Higher Rate of Returns 0.178
ii
Safety and
Income
Safety and Security 0.321
Loan Facility 0.266
Regular Income 0.206
iii
After Service and
Transfer
Economic Development
0.569
After Investment Service
0.134
Transferability
0.117
(i) Incentive, Bonus and High Returns
The first factor shows higher dominant variables in deciding the pre-taking
expectation in making investment decisions. The factor accounts for 43.400
percent of the total variance and has the eigen value of 4.774. It is observed that
among the eleven variables listed in the table the Incentive, Bonus and high return
are having positive higher score and hence researcher could say that they are
significantly influencing the factor influencing to invest the postal investments.
(ii) Safety and Income
The second factor which influences decision to invest in postal Schemes is
Safety and Income. This factor accounts for 22.831 percent of the total variance
and has the Eigen value of 2.511. It is observed that the Safety and income are
having positive higher score and hence researcher could say that they are
significantly influencing the investment decisions.

118
(iii) After Service and Transfer
The third factor which influences decision to invest in postal Schemes is
After service and transfer. This factor accounts for 13.676 percent of the total
variance and has the Eigen value of 1.504. It is observed that after service and
transfer are having positive higher score and hence researcher could say that they
are significantly influencing the investment decisions.
5.10 Analysis of Variance (ANOVA)
5.10.1 Age and Maturity Period of Postal Investments
Null Hypothesis Ho: There is no significant difference among mean scores
of the maturity period of postal investments and different age group of
respondents. The following table shows that the Age Group of Respondents and
Maturity period Postal Investment.
Table .5.10.1 Panel (a)
Test of Hypothesis: Age Group of Respondents and Maturity Period Postal
Investment
Sl.No.
Age
N
Mean Std.
Deviation
1. Up to 30 206 2.17 1.141
2. 31-45 156 1.94 0.759
3. 46-55 126 2.92 1.269
4. 56 and above 112 1.94 1.180
Total 600 2.22 1.153
Panel (a)
Sl.No. Source of
Variation
Sum of
Squares
df Mean
Square
F Value Level of
Significance
1. Between Groups
83.892
3
27.964
23.402
0.000
2. Within Groups
712.181
596
1.195
Total 796.073 599
119
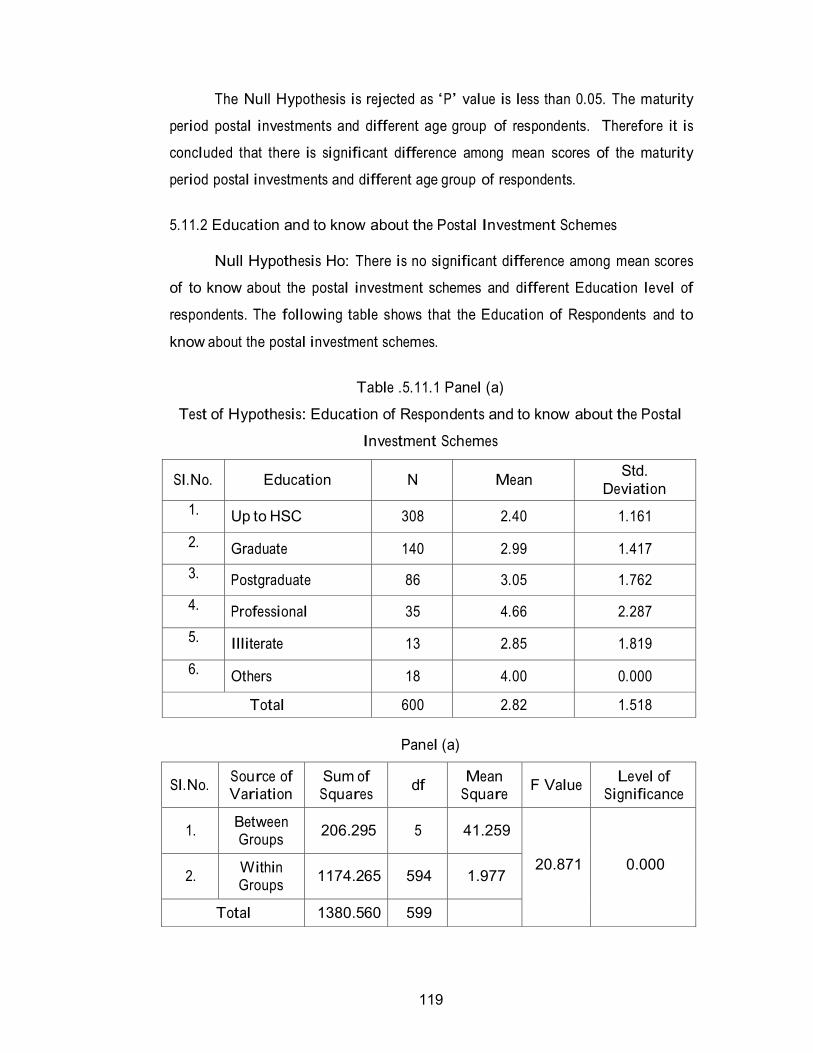
The Null Hypothesis is rejected as ‘P’ value is less than 0.05. The maturity
period postal investments and different age group of respondents. Therefore it is
concluded that there is significant difference among mean scores of the maturity
period postal investments and different age group of respondents.
5.11.2 Education and to know about the Postal Investment Schemes
Null Hypothesis Ho: There is no significant difference among mean scores
of to know about the postal investment schemes and different Education level of
respondents. The following table shows that the Education of Respondents and to
know about the postal investment schemes.
Table .5.11.1 Panel (a)
Test of Hypothesis: Education of Respondents and to know about the Postal
Investment Schemes
Sl.No.
Education
N
Mean Std.
Deviation
1.
Up to HSC
308
2.40
1.161
2. Graduate 140 2.99 1.417
3. Postgraduate 86 3.05 1.762
4.
Professional
35
4.66
2.287
5.
Illiterate
13
2.85
1.819
6.
Others
18
4.00
0.000
Total 600 2.82 1.518
Panel (a)
Sl.No. Source of Variation
Sum of Squares
df Mean
Square
F Value Level of
Significance
1. Between Groups
206.295
5
41.259
20.871
0.000
2. Within Groups
1174.265
594
1.977
Total 1380.560 599
120
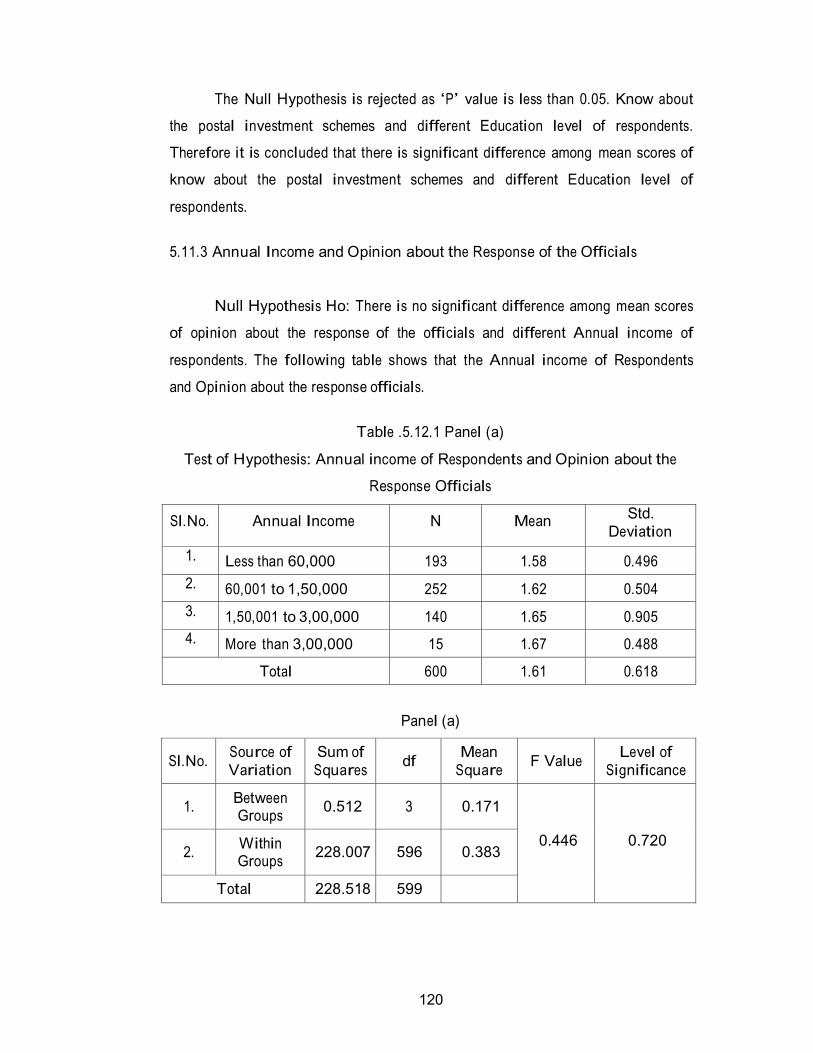
The Null Hypothesis is rejected as ‘P’ value is less than 0.05. Know about
the postal investment schemes and different Education level of respondents.
Therefore it is concluded that there is significant difference among mean scores of
know about the postal investment schemes and different Education level of
respondents.
5.11.3 Annual Income and Opinion about the Response of the Officials
Null Hypothesis Ho: There is no significant difference among mean scores
of opinion about the response of the officials and different Annual income of
respondents. The following table shows that the Annual income of Respondents
and Opinion about the response officials.
Table .5.12.1 Panel (a)
Test of Hypothesis: Annual income of Respondents and Opinion about the
Response Officials
Sl.No.
Annual Income
N
Mean Std.
Deviation
1. Less than 60,000 193 1.58 0.496
2. 60,001 to 1,50,000 252 1.62 0.504
3. 1,50,001 to 3,00,000 140 1.65 0.905
4. More than 3,00,000 15 1.67 0.488
Total 600 1.61 0.618
Panel (a)
Sl.No. Source of
Variation
Sum of
Squares
df Mean
Square
F Value Level of
Significance
1. Between Groups
0.512
3
0.171
0.446
0.720
2. Within Groups
228.007
596
0.383
Total 228.518 599
121
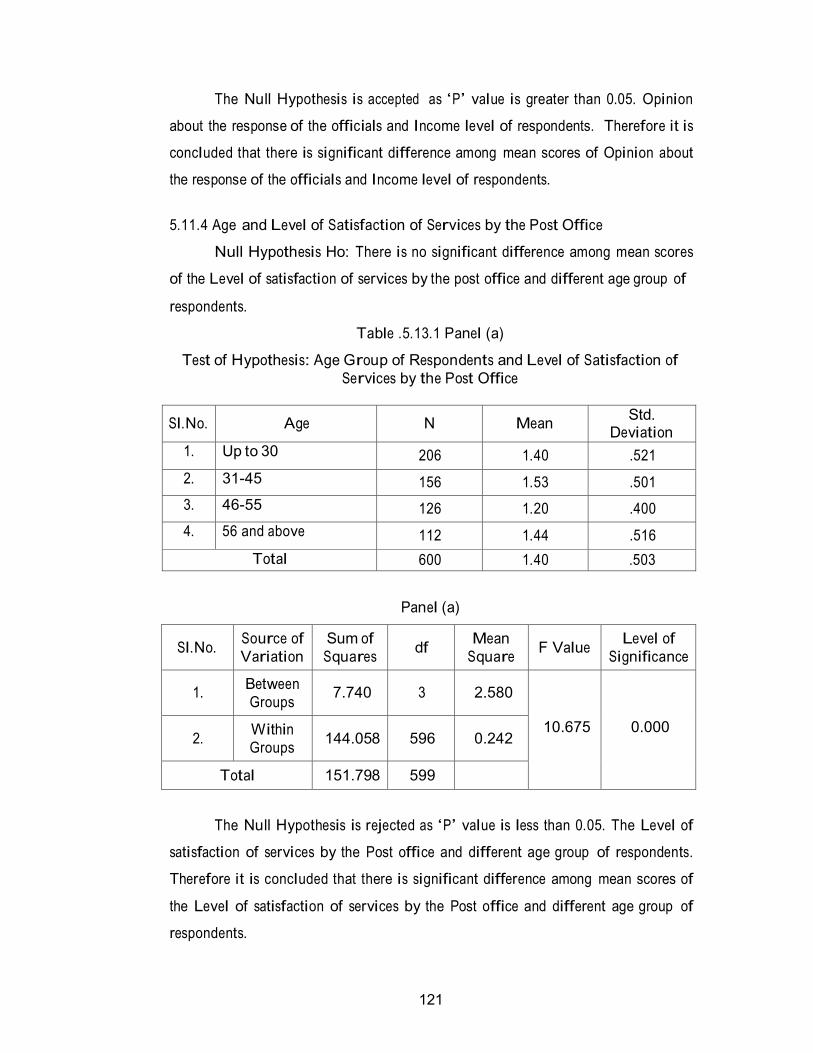
The Null Hypothesis is accepted as ‘P’ value is greater than 0.05. Opinion
about the response of the officials and Income level of respondents. Therefore it is
concluded that there is significant difference among mean scores of Opinion about
the response of the officials and Income level of respondents.
5.11.4 Age and Level of Satisfaction of Services by the Post Office
Null Hypothesis Ho: There is no significant difference among mean scores
of the Level of satisfaction of services by the post office and different age group of
respondents.
Table .5.13.1 Panel (a)
Test of Hypothesis: Age Group of Respondents and Level of Satisfaction of
Services by the Post Office
Sl.No.
Age
N
Mean Std.
Deviation
1. Up to 30 206 1.40 .521
2. 31-45 156 1.53 .501
3. 46-55 126 1.20 .400
4. 56 and above 112 1.44 .516
Total 600 1.40 .503
Panel (a)
Sl.No. Source of
Variation
Sum of
Squares
df Mean
Square
F Value Level of
Significance
1. Between
Groups
7.740
3
2.580
10.675
0.000
2. Within
Groups
144.058
596
0.242
Total 151.798 599
The Null Hypothesis is rejected as ‘P’ value is less than 0.05. The Level of
satisfaction of services by the Post office and different age group of respondents.
Therefore it is concluded that there is significant difference among mean scores of
the Level of satisfaction of services by the Post office and different age group of
respondents.
122
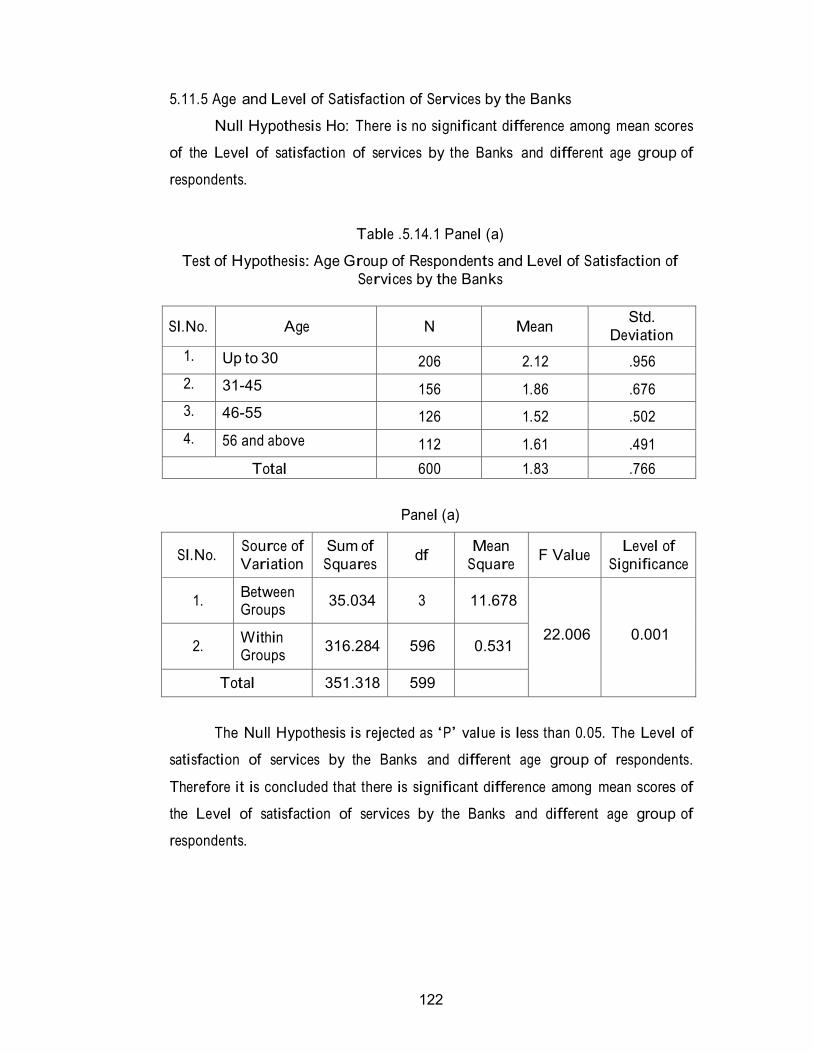
5.11.5 Age and Level of Satisfaction of Services by the Banks
Null Hypothesis Ho: There is no significant difference among mean scores
of the Level of satisfaction of services by the Banks and different age group of
respondents.
Table .5.14.1 Panel (a)
Test of Hypothesis: Age Group of Respondents and Level of Satisfaction of
Services by the Banks
Sl.No.
Age
N
Mean Std.
Deviation
1. Up to 30 206 2.12 .956
2. 31-45 156 1.86 .676
3. 46-55 126 1.52 .502
4. 56 and above 112 1.61 .491
Total 600 1.83 .766
Panel (a)
Sl.No. Source of
Variation
Sum of
Squares
df Mean
Square
F Value Level of
Significance
1. Between Groups
35.034
3
11.678
22.006
0.001
2. Within Groups
316.284
596
0.531
Total 351.318 599
The Null Hypothesis is rejected as ‘P’ value is less than 0.05. The Level of
satisfaction of services by the Banks and different age group of respondents.
Therefore it is concluded that there is significant difference among mean scores of
the Level of satisfaction of services by the Banks and different age group of
respondents.
123
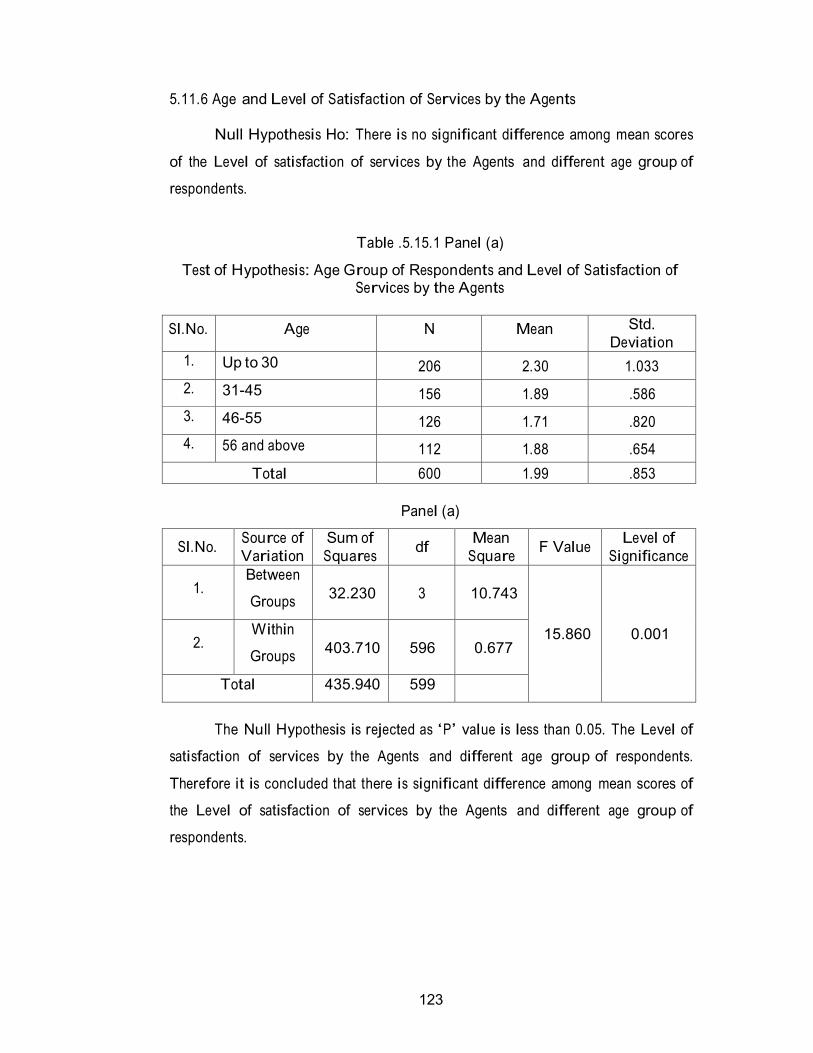
5.11.6 Age and Level of Satisfaction of Services by the Agents
Null Hypothesis Ho: There is no significant difference among mean scores
of the Level of satisfaction of services by the Agents and different age group of
respondents.
Table .5.15.1 Panel (a)
Test of Hypothesis: Age Group of Respondents and Level of Satisfaction of Services by the Agents
Sl.No. Age N Mean Std.
Deviation
1. Up to 30 206 2.30 1.033
2. 31-45 156 1.89 .586
3. 46-55 126 1.71 .820
4. 56 and above 112 1.88 .654
Total 600 1.99 .853
Panel (a)
Sl.No. Source of
Variation
Sum of
Squares
df Mean
Square
F Value Level of
Significance
1. Between
Groups
32.230
3
10.743
15.860
0.001
2. Within
Groups
403.710
596
0.677
Total 435.940 599
The Null Hypothesis is rejected as ‘P’ value is less than 0.05. The Level of
satisfaction of services by the Agents and different age group of respondents.
Therefore it is concluded that there is significant difference among mean scores of
the Level of satisfaction of services by the Agents and different age group of
respondents.
124
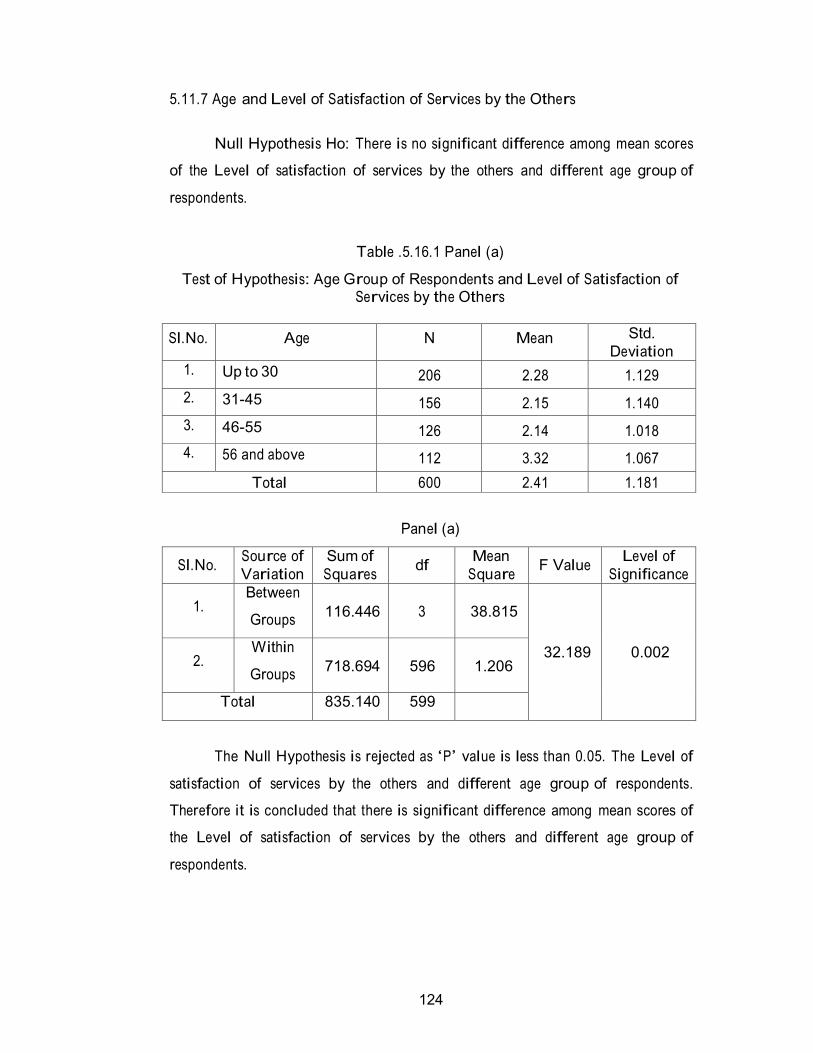
5.11.7 Age and Level of Satisfaction of Services by the Others
Null Hypothesis Ho: There is no significant difference among mean scores
of the Level of satisfaction of services by the others and different age group of
respondents.
Table .5.16.1 Panel (a)
Test of Hypothesis: Age Group of Respondents and Level of Satisfaction of Services by the Others
Sl.No. Age N Mean Std.
Deviation
1. Up to 30 206 2.28 1.129
2. 31-45 156 2.15 1.140
3. 46-55 126 2.14 1.018
4. 56 and above 112 3.32 1.067
Total 600 2.41 1.181
Panel (a)
Sl.No. Source of
Variation
Sum of
Squares
df Mean
Square
F Value Level of
Significance
1. Between
Groups
116.446
3
38.815
32.189
0.002
2. Within
Groups
718.694
596
1.206
Total 835.140 599
The Null Hypothesis is rejected as ‘P’ value is less than 0.05. The Level of
satisfaction of services by the others and different age group of respondents.
Therefore it is concluded that there is significant difference among mean scores of
the Level of satisfaction of services by the others and different age group of
respondents.
125
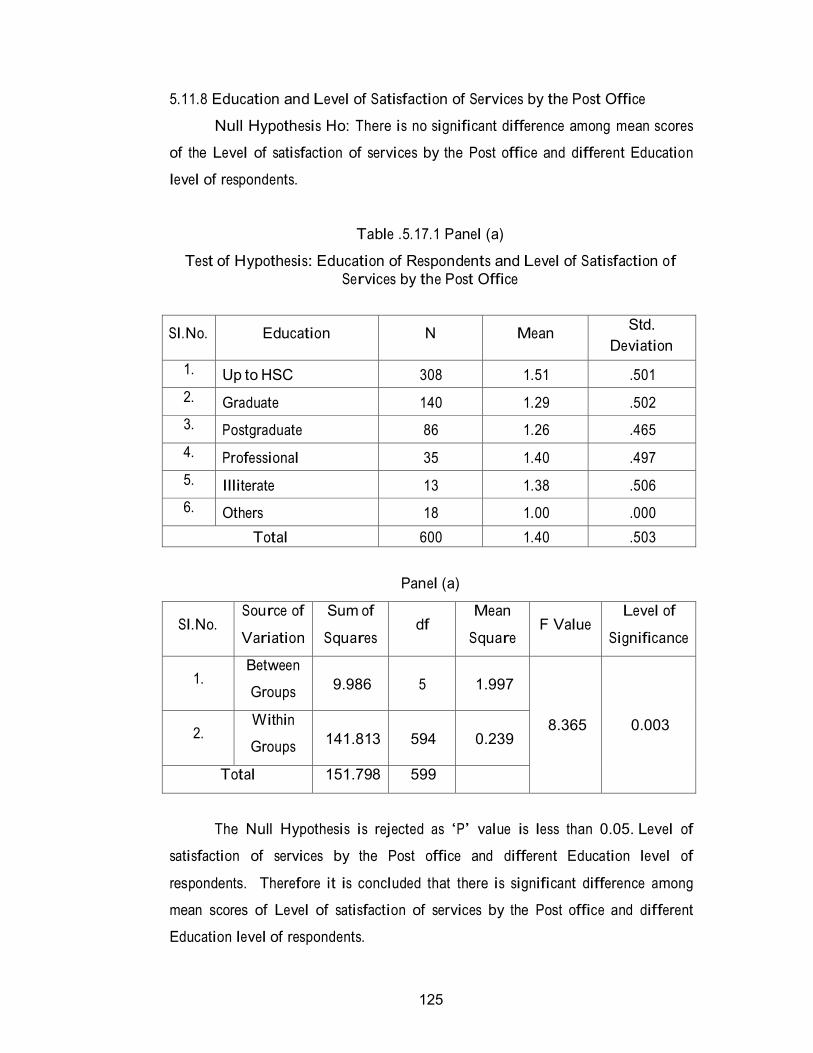
5.11.8 Education and Level of Satisfaction of Services by the Post Office
Null Hypothesis Ho: There is no significant difference among mean scores
of the Level of satisfaction of services by the Post office and different Education
level of respondents.
Table .5.17.1 Panel (a)
Test of Hypothesis: Education of Respondents and Level of Satisfaction of
Services by the Post Office
Sl.No.
Education
N
Mean Std.
Deviation
1. Up to HSC 308 1.51 .501
2. Graduate 140 1.29 .502
3. Postgraduate 86 1.26 .465
4. Professional 35 1.40 .497
5. Illiterate 13 1.38 .506
6. Others 18 1.00 .000
Total 600 1.40 .503
Panel (a)
Sl.No. Source of
Variation
Sum of
Squares
df Mean
Square
F Value Level of
Significance
1. Between
Groups
9.986
5
1.997
8.365
0.003
2. Within
Groups
141.813
594
0.239
Total 151.798 599
The Null Hypothesis is rejected as ‘P’ value is less than 0.05. Level of
satisfaction of services by the Post office and different Education level of
respondents. Therefore it is concluded that there is significant difference among
mean scores of Level of satisfaction of services by the Post office and different
Education level of respondents.
126
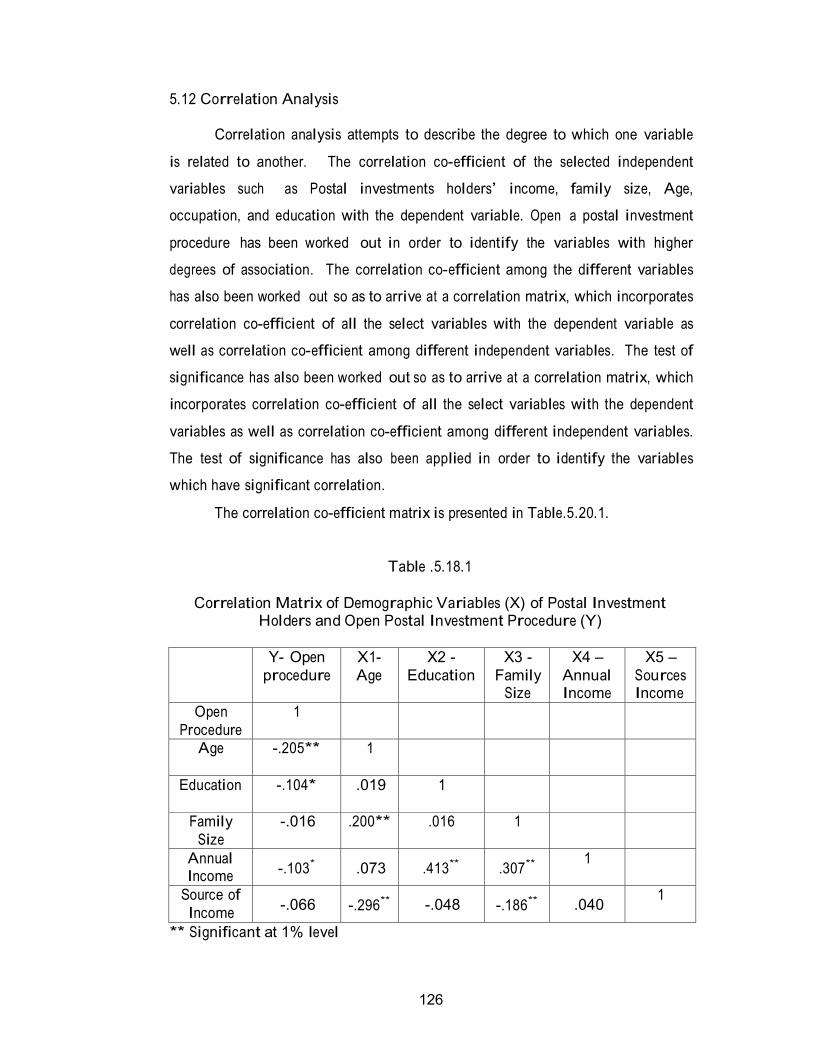
5.12 Correlation Analysis
Correlation analysis attempts to describe the degree to which one variable
is related to another. The correlation co-efficient of the selected independent
variables such as Postal investments holders’ income, family size, Age,
occupation, and education with the dependent variable. Open a postal investment
procedure has been worked out in order to identify the variables with higher
degrees of association. The correlation co-efficient among the different variables
has also been worked out so as to arrive at a correlation matrix, which incorporates
correlation co-efficient of all the select variables with the dependent variable as
well as correlation co-efficient among different independent variables. The test of
significance has also been worked out so as to arrive at a correlation matrix, which
incorporates correlation co-efficient of all the select variables with the dependent
variables as well as correlation co-efficient among different independent variables.
The test of significance has also been applied in order to identify the variables
which have significant correlation.
The correlation co-efficient matrix is presented in Table.5.20.1.
Table .5.18.1
Correlation Matrix of Demographic Variables (X) of Postal Investment
Holders and Open Postal Investment Procedure (Y)
Y- Open
procedure
X1-
Age
X2 -
Education
X3 -
Family Size
X4 –
Annual Income
X5 –
Sources Income
Open
Procedure
1
Age -.205** 1
Education -.104* .019 1
Family
Size
-.016 .200** .016 1
Annual Income
-.103*
.073
.413**
.307** 1
Source of
Income
-.066
-.296**
-.048
-.186**
.040 1
** Significant at 1% level

127
Table.5.20.1 shows the inter-correlation between demographic
characteristics of postal investment holders and open postal investment procedure.
The open postal investment is significantly and positively correlated with Annual
income of the Postal investment holders, their family size, and Source of income.
This in turn indicates that higher the income, the family size, and the Source
income, the open postal investment procedure is independent of the postal
investment holders’ occupation as well as education since the correlation
coefficient between them is non-significant. A few independent variables are
significantly correlated with each other. Family income has significant correlation
with family size and source of income. Family size and occupation of postal
investment holder and education have significant positive correlation.
Section Summary
An overview of the details presented in this chapter shows that most of the
sample investors in any category expect to have safety and security on their
investment.
This chapter has presented an analysis of the several factors that motivated
and influenced the investors in their investment and their expected safety and
security on their investment. The next chapter deals with the attitude of the
investors towards postal investment.