Embed Size (px)
Citation preview
52
CHAPTER V
CONCLUSION
5.1. Introduction
This chapter covered up the whole study, which included the general
finding of the study. The conclusion was made based on the hypothesis result and
what were their implications academically and managerially. Moreover, this
chapter also discussed the limitation and suggestion for the future research.
5.2. Conclusion
This study was a modified replication study from Jamal Abdul Nassir
Shaari, Muhammad Khalique, Nurul Izza Abdul Malek in 2013 titled, “Halal
Restaurant: Lifestyle of Muslims in Penang”, not all of the case is the same with
the previous study. This research is to conducted to find whether there is a
positive influence of devoutness, awareness and lifestyle towards the confidence
level in choosing restaurant. Some hypotheses were added to see some differences
between the gender, living place, income and university towards the confidence
level in choosing the restaurant and the result comes out with:
1) The result from Indonesia’s Muslim and Malaysia’s Muslim is
different. We can see that the devoutness and awareness in Malaysia
do not influence the confidence level in choosing the restaurant while
in Indonesia it is.
2) The environment of the Muslim gives an impact to the devoutness,
awareness and lifestyle of the Muslim students, it can be seen from the
53
result of ANOVA test between the Muslim based university students
and Non-Muslim based university students.
3) Gender, living place and income do not give differences in people’s
confidence level in choosing a restaurant.
The conclusion is the different demography might give a different result of
study. Malaysia and Indonesia have some similarity such as most of the people’s
religion is Islam. But the culture and the other thing still different from one to
another. How the people take the globalization impact also different from one to
another. In Indonesia, although globalization is very strong, but they still hold
their belief strongly. Nevertheless, different to Malaysia, lifestyle might change
their attitude or behaviour.
5.3. Managerial Implications
Once the model is developed and conducted research needs to be
developed managerial policy that is expected. Some implications Managerial
based on the results of the study are as followed:
1) The businessman and the entrepreneur need to concern more about
the Halal branding since the student as the potential buyer in
Yogyakarta really care about their food.
2) To prevent the issue in 1988 about the Halal rumors, the
governments also need to take care the company that do not use the
Halal ingredients and also convince them to use the Halal ingredients
if their target market is Muslim people.
54
3) Since devoutness, awareness and the lifestyle of Muslim people in
Indonesia affecting their confidence level in choosing restaurant, so
the business can take this information as an advantages for example
can make an event that is related to the devoutness and awareness of
people to make people aware about the business or company.
4) Since lifestyle also give an impact to the confidence level, the
entrepreneur or the businessman can make a business that is still
maintain the belief of the Muslim people nowadays. For example,
the lifestyle of fast food. The fast food businesses also need to
consider about the Halal brand logo. Moreover, this is already
conducted by some Indonesia franchise company like McDonalds
and KFC.
5.4. Limitations of Research
1) There is bias during the survey process which is the researcher waited
for the repondents and stand beside them while the respondents filled the
questionnaires. That become a bias for the survey because it makes the
respondent tend to ask a question while the researcher was around them.
The researcher should leave the respondent alone to fill the questionnaire
because it is stated also that in the prestest there is no questions were
asked.
2) In this study, the researcher should concern more to the Muslim
students’ belief. But in this research, the researcher only judges the
Muslims based on the University status, in fact the we can not measure

55
how strong the belief and the devoutness of people by their university
status. So what should the researcher see is the Muslims’ characteristic not
the University status since this study is more about their belief and
behavior.
5.5. Suggestions for Future Research
There are some suggestions regarding to the future research. First, future
researcher can add more hypotheses such as the comparison between the Muslim
students in Catholic based university (such as UAJY) and Muslim students in
Muslim based university, so people will get more information of Muslim
behaviour in this research. The researcher also would like to suggest that the
questionnaire was distributed in hardcopy because it is easier to control or monitor
rather than using the softcopy such as internet based questionnaire because it is
hard to control and monitor.
The future research should not be based on the University status but using
the belief of the Muslim student itself. The last, the researcher suggests that in
distributing the questionnaires, the researcher should not stand beside or around
the respondents, it is better to monitor in a distance.
REFERENCES
Shaari, J. A., Khalique, M., & Malek, N. I. (2013). Halal Restaurant : Lifestyle of
Muslims in Penang. International Journal of Global Business, 6(2), 1-15.
Talib, M. S., & Hamid, A. B. (2014). Halal logistics in Malaysia: a SWOT
analysis. Journal of Islamic Marketing, pp. 322-343.
Wilson, J. (2011). The challenges of Islamic branding: navigating emotions and
halal. Journal of Islamic Marketing, pp. 28-42.
Berry, D. (2000), ‘What is Halal?’ Dairy Foods, 101(4), 36.
Shaari, J.A.N. and Mohd Arifin, N.S. (2010), “Dimension of Halal Purchase
Intention: A Preliminary Study”, International Review of Business
Research Papers, Vol. 6 No. 4, pp. 444-456.
Shafie, S., & Othman, M. N. (2006, September). “Halal certification: an
international marketing issues and challenges”. In Proceeding at the
International IFSAM VIIIth World Congress (pp. 28-30).International
Journal of Global Business, 6 (2), 1-15, December 2013 13
Soesilowati, E. S. (2011). “Business opportunities for halal products in the global
market: Muslim consumer behaviour and halal food consumption”.
Journal of Indonesian Social Sciences and Humanities, 3, 151-160.
Vedi R. Hadiz and Khoo Boo Teik (2011). “Approaching Islam and politics from
political economy: a comparative study of Indonesia and Malaysia”. The
Pacific Review, Vol. 24 No. 4 September 2011: 463–485.
Frederick M. J. Lichacz (2009). “Calibrating Situation Awareness and Confidence
Within a Multinational Coalition Operation”. Military Psychology,
21:412–426, 2009.
Rhenald Kasali (1998). “Using Communication Strategies to Design Food
Marketing Strategies, The Pork Fat Rumor in Indonesia”. KELOLA,
19/VIII/1998.
Zaim Uchrowi and Bir-biro (1988) “BABI ATAU BUKAN”. Tempo, 70-73,1988.

Syafiq Basri, A.T., M. Baharun (1988) “Bisnis pun Tergelincir Lemak”. Tempo,
76-77, 1988.
Islamic Council of Victoria brochure (2014), “What is Halal - A Guide for Non-
Muslims”http://www.icv.org.au/index.php/publications/what-is-halal
(accessed on 16 June 2015).
Agus Dwianto (2015), “uji anova satu faktor dengan spss.”,
http//www.sangpengajar.com/2015/03/ uji anova satu faktor dengan spss
(accessed on 21 April 2016).

APPENDICES

KUISIONER
Anda dipersilahkan untuk menjawab dengan memberi tanda silang (X) atau cek
list (√ ) pada salah satu alternatif jawaban yang telah disediakan
1) Jenis kelamin :
a) Pria
b) Wanita
2) Anda tinggal di :
a) Kos
b) Rumah orangtua
c) Rumah saudara
3) Rata-rata uang saku dalam satu bulan :
a) Dibawah Rp.1500.000,-
b) Rp.1500.000 hingga Rp.3000.000,-
c) Diatas Rp.3000.000,-
4) Universitas :
a) UII
b) UIN Sunan Kalijaga
c) UGM
d) UMY
e) STIE YKPN
f) UAJY
g) Dll…………………..
Anda dipersilahkan untuk menjawab dengan memberi tanda silang (X) atau cek
list (√ ) pada salah satu alternatif jawaban yang telah disediakan
Keterangan:
STS : Sangat tidak setuju
TS : Tidak Setuju
N : Netral
S : Setuju
SS : Sangat Setuju
No Pertanyaan untuk item devoutness
(keyakinan)
STS TS N S SS
1 Saya sangat teliti dalam memilih restoran
Halal
2 Saya sadar bahwa permasalahan Halal
sangatlah penting dalam pemilihan restoran
yang akan saya tujui
3 Saya percaya bahwa apa yang saya makan
akan berpengaruh dalam hidup saya.
4 Saya memilih restoran yang memiliki
sertifikat Halal agar terhindar dari Syubhat
(keragu-raguan)
5 Saya tidak mempermasalahkan isu Halal
ketika akan memilih restoran yang akan saya
kunjungi
6 Saya selalu bertanya status Halal pada
makanan apabila saya tidak melihat adanya
sertifikat Halal di restoran tersebut.
7 Saya selalu memilih restoran yang Halal
walaupun harganya jauh lebih mahal
8 Saya selalu memastikan keluarga saya
mengonsumsi makanan yang Halal
9 Saya menyarankan keluarga saya untuk
selalu dan hanya makan di restoran yang
Halal
10 Saya menyarankan teman teman saya untuk
makan di restoran yang Halal
No Pertanyaan untuk item Awareness STS TS N S SS
1 Saya mengerti konsep Halal
2 Halal tercangkup dari berbagai aspek, dari
bahan mentahnya, persiapannya sampai
dengan cara penyajian makanan.
3 Hukum dalam Islam mengajarkan mengapa
penting untuk mengonsumsi makanan Halal
4 Saya sadar akan prosedur yang sangat ketat
untuk mendapatkan sertifikasi Halal
5 Saya dapat membedakan mana yang
merupakan sertifikat halal yang asli dan
mana yang palsu
6 Saya sadar bahwa beberapa restoran
menampilkan sertifikat halal yang palsu
7 Saya menyadari bahwa ada inisiatif dari
instansi pemerintah untuk mempromosikan
Halal
8 Saya sadar bahwa ada beberapa pemilik
restoran memanipulasi logo Halal untuk
mendapatkan keuntungan yang lebih.
9 Saya percaya bahwa makanan Halal
membantu saya mempertahankan kondisi
dan kesehatan yang baik untuk saya.
10 Saya percaya bahwa makanan yang terdapat
di restoran Halal lebih aman untuk
dikonsumsi
11 Keamanan pangan dalam Islam tidak
terbatas pada masalah Halal dan Haram
tetapi juga mencakup kebersihan
12 Restoran yang bersertifikasi Halal
mempunyai arti bahwa restoran tersebut
bersih
No Pertanyaan untuk item Lifestyle STS TS N S SS
1 Saya hanya makan di restoran yang
memiliki sertifikat Halal
2 Saya hanya makan bersama umat Muslim
3 Saya hanya makan di restoran dengan
pelayan (waiters) Muslim
4 Saya hanya makan di restoran yang
didalamnya ada pelanggan Muslim
5 Menurut saya restoran yang Halal adalah
restoran yang memiliki sertifikasi Halal
6 Saya sangat berhati-hati dalam memilih
restoran dengan sertifikasi Halal
7 Saya tidak akan makan di restoran yang ada
anjing ditempat tersebut.
8 Saya tidak akan makan di restoran yang juga
menyajikan makanan Non-Halal
9 Saya tidak akan makan di restoran yang ada
binatang ataupun toko binatang di
sebelahnya
10 Saya tidak akan makan direstoran yang
menyajikan minuman beralkohol di tempat
tersebut
11 Saya tidak akan makan direstoran apabila
pekerjanya mengonsumsi alkohol
12 Saya tidak akan makan di tempat yang
memiliki campuran Halal dan Non-Halal

No Pertanyaan untuk item Confidence STS TS N S SS
1 Tekad saya atau keyakinan saya untuk
mengunjungi restoran meningkat ketika saya
melihat adanya logo Halal di restoran
tersebut
2 Saya akan sangat yakin memilih restoran
tersebut apabila saya tahu bahwa restoran itu
merupakan restoran Halal
3 Saya akan merekomendasikan pada orang
lain ketika saya yakin bahwa Restoran
tersebut Halal
4 Saya merasa sangat nyaman ketika makan di
restoran yang Halal
5 Saya akan membeli makanan dengan yakin
untuk orangtuaku apabila saya tahu restoran
tersebut Halal
6 Pikiran saya damai dan tenang ketika makan
di restoran Halal
7 Saya akan membeli makanan dengan yakin
untuk teman ku apabila saya tahu restoran
tersebut Halal
8 Saya akan makan dengan yakin (mantap)
ketika saya tahu restoran tersebut Halal
Terima Kasih Atas bantuannya. Have a nice day
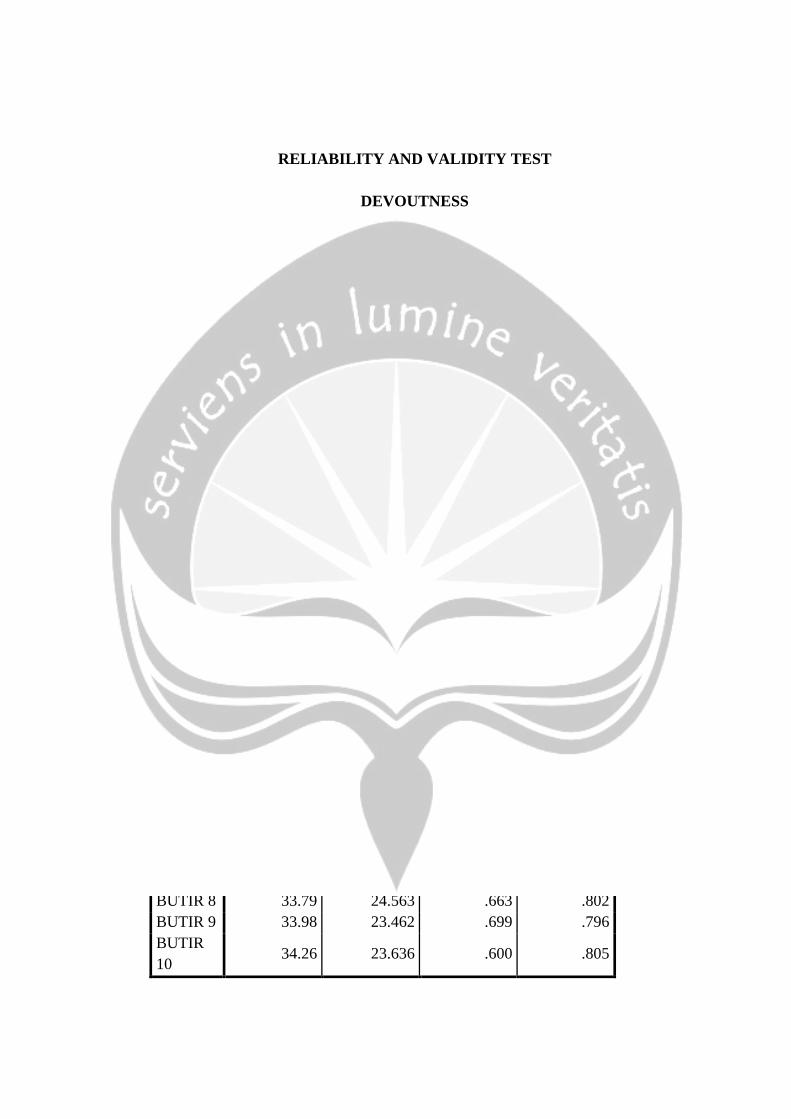
RELIABILITY AND VALIDITY TEST
DEVOUTNESS
BEFORE REVERSE THE ITEM 5
Case Processing Summary
N %
Cases Valid 252 100.0
Excludeda 0 .0
Total 252 100.0
a. Listwise deletion based on all
variables in the procedure.
Reliability Statistics
Cronbach's
Alpha N of Items
.830 10
Item-Total Statistics
Scale Mean
if Item
Deleted
Scale
Variance if
Item Deleted
Corrected
Item-Total
Correlation
Cronbach's
Alpha if Item
Deleted
BUTIR 1 33.88 23.959 .617 .804
BUTIR 2 33.62 24.404 .700 .799
BUTIR 3 33.83 24.618 .577 .809
BUTIR 4 34.11 23.730 .667 .799
BUTIR 5 35.26 30.614 -.144 .887
BUTIR 6 34.83 25.494 .466 .819
BUTIR 7 34.29 23.512 .636 .801
BUTIR 8 33.79 24.563 .663 .802
BUTIR 9 33.98 23.462 .699 .796
BUTIR
10 34.26 23.636 .600 .805
Correlations
BU
TIR
1
BU
TIR
2
BU
TIR
3
BU
TIR
4
BU
TIR
5
BU
TIR
6
BU
TIR
7
BU
TIR
8
BU
TIR
9
BU
TIR
10
TOT
AL
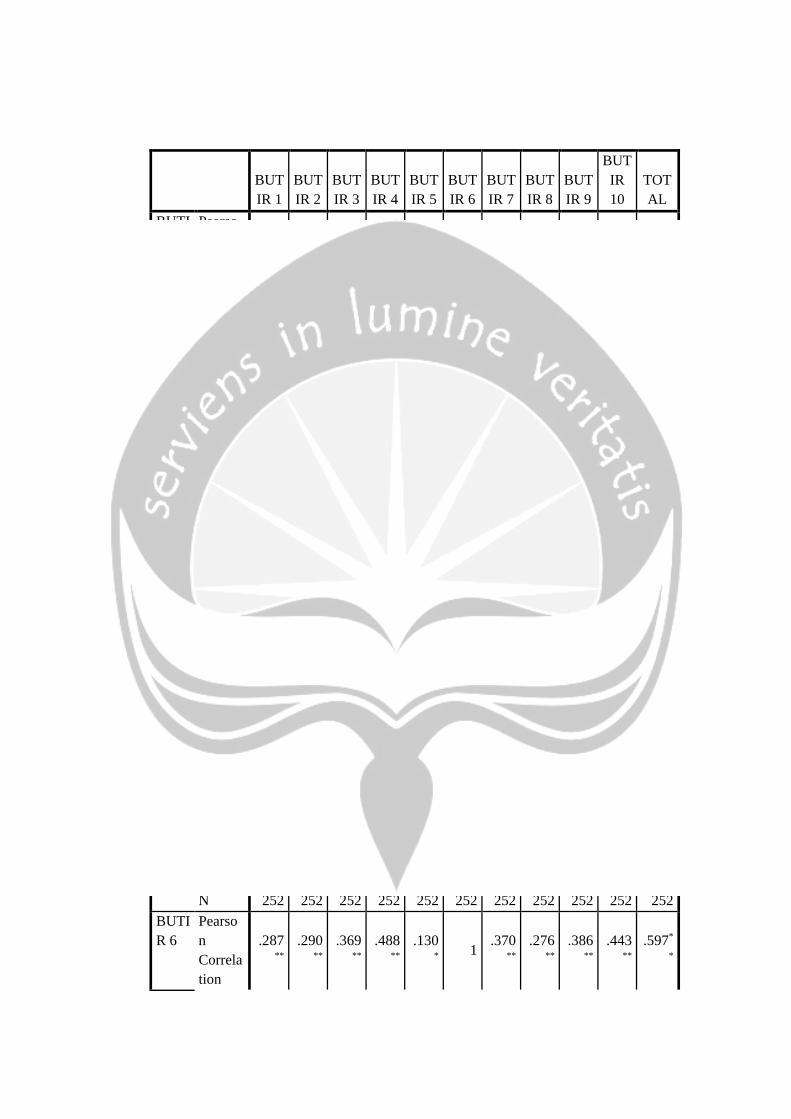
BUT
IR 1
Pearso
n
Correl
ation
1 .638
**
.477**
.427**
-
.026
.287**
.518**
.448**
.456**
.392**
.711**
Sig.
(2-
tailed)
.000 .000 .000 .680 .000 .000 .000 .000 .000 .000
N 252 252 252 252 252 252 252 252 252 252 252
BUT
IR 2
Pearso
n
Correl
ation
.638**
1 .627
**
.581**
-
.121
.290**
.468**
.573**
.561**
.449**
.766**
Sig.
(2-
tailed)
.000 .000 .000 .056 .000 .000 .000 .000 .000 .000
N 252 252 252 252 252 252 252 252 252 252 252
BUT
IR 3
Pearso
n
Correl
ation
.477**
.627**
1 .541
**
-
.124*
.369**
.331**
.422**
.439**
.364**
.673**
Sig.
(2-
tailed)
.000 .000 .000 .049 .000 .000 .000 .000 .000 .000
N 252 252 252 252 252 252 252 252 252 252 252
BUT
IR 4
Pearso
n
Correl
ation
.427**
.581**
.541**
1
-
.128*
.488**
.492**
.507**
.538**
.458**
.749**
Sig.
(2-
tailed)
.000 .000 .000 .042 .000 .000 .000 .000 .000 .000
N 252 252 252 252 252 252 252 252 252 252 252
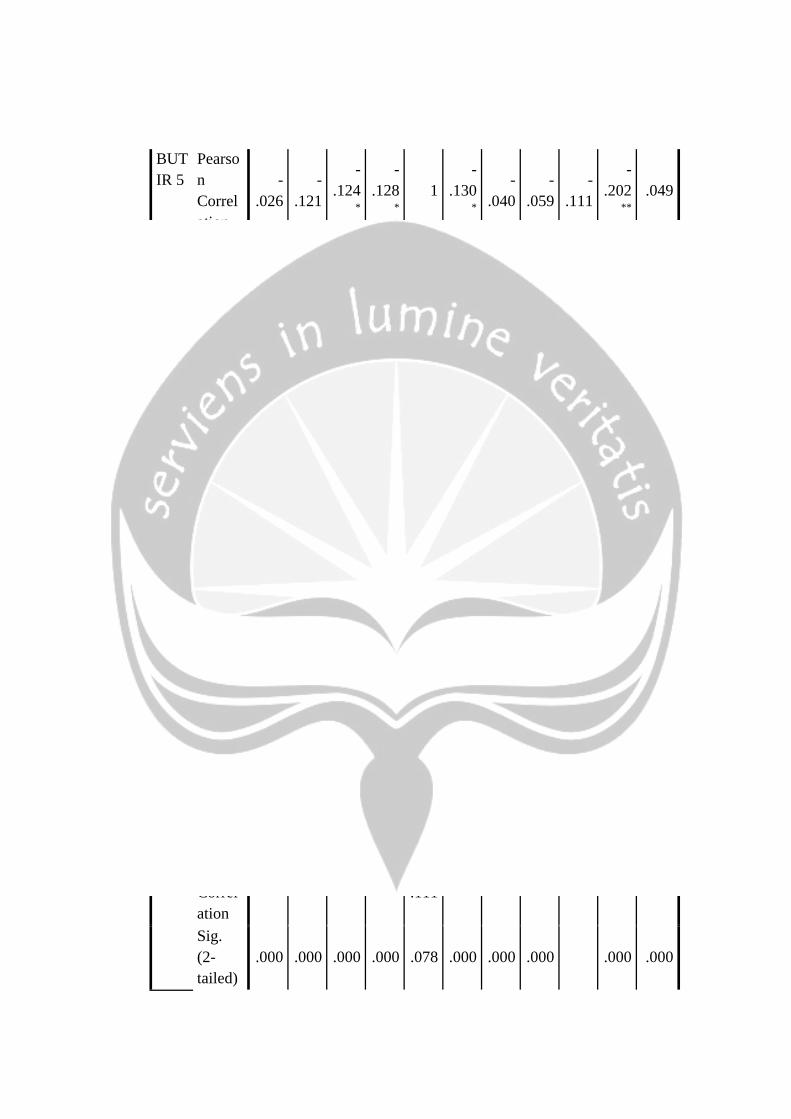
BUT
IR 5
Pearso
n
Correl
ation
-
.026
-
.121
-
.124*
-
.128*
1
-
.130*
-
.040
-
.059
-
.111
-
.202**
.049
Sig.
(2-
tailed)
.680 .056 .049 .042 .040 .530 .350 .078 .001 .439
N 252 252 252 252 252 252 252 252 252 252 252
BUT
IR 6
Pearso
n
Correl
ation
.287**
.290**
.369**
.488**
-
.130*
1 .370
**
.276**
.386**
.443**
.579**
Sig.
(2-
tailed)
.000 .000 .000 .000 .040 .000 .000 .000 .000 .000
N 252 252 252 252 252 252 252 252 252 252 252
BUT
IR 7
Pearso
n
Correl
ation
.518**
.468**
.331**
.492**
-
.040
.370**
1 .522
**
.543**
.493**
.731**
Sig.
(2-
tailed)
.000 .000 .000 .000 .530 .000 .000 .000 .000 .000
N 252 252 252 252 252 252 252 252 252 252 252
BUT
IR 8
Pearso
n
Correl
ation
.448**
.573**
.422**
.507**
-
.059
.276**
.522**
1 .609
**
.542**
.736**
Sig.
(2-
tailed)
.000 .000 .000 .000 .350 .000 .000 .000 .000 .000
N 252 252 252 252 252 252 252 252 252 252 252
BUT
IR 9
Pearso
n
Correl
ation
.456**
.561**
.439**
.538**
-
.111
.386**
.543**
.609**
1 .621
**
.775**
Sig.
(2-
tailed)
.000 .000 .000 .000 .078 .000 .000 .000 .000 .000

N 252 252 252 252 252 252 252 252 252 252 252
BUT
IR
10
Pearso
n
Correl
ation
.392**
.449**
.364**
.458**
-
.202**
.443**
.493**
.542**
.621**
1 .705
**
Sig.
(2-
tailed)
.000 .000 .000 .000 .001 .000 .000 .000 .000 .000
N 252 252 252 252 252 252 252 252 252 252 252
TOT
AL
Pearso
n
Correl
ation
.711**
.766**
.673**
.749**
.049 .579
**
.731**
.736**
.775**
.705**
1
Sig.
(2-
tailed)
.000 .000 .000 .000 .439 .000 .000 .000 .000 .000
N 252 252 252 252 252 252 252 252 252 252 252

AFTER REVERSE THE ITEM 5
Case Processing Summary
N %
Cases Valid 252 100.0
Excludeda 0 .0
Total 252 100.0
a. Listwise deletion based on all variables in the procedure.
Reliability Statistics
Cronbach's
Alpha N of Items
.858 10
Item-Total Statistics
Scale Mean if
Item Deleted
Scale Variance
if Item Deleted
Corrected Item-
Total
Correlation
Cronbach's
Alpha if Item
Deleted
butir1 34.43 27.274 .589 .843
butir2 34.17 27.438 .709 .835
butir3 34.38 27.591 .596 .843
butir4 34.65 26.673 .682 .835
butir5 35.26 30.614 .144 .887
butir6 35.38 28.452 .493 .851
butir7 34.83 26.769 .613 .841
butir8 34.34 27.787 .647 .840
butir9 34.53 26.465 .704 .833
butir10 34.81 26.234 .654 .837
BUT
IR 1
BUT
IR 2
BUT
IR 3
BUT
IR 4
BUT
IR 5
BUT
IR 6
BUT
IR 7
BUT
IR 8
BUT
IR 9
BUT
IR
10
TOT
AL
BUTI
R 1
Pearso
n
Correla
tion
1 .638
**
.477**
.427** .026
.287**
.518**
.448**
.456**
.392**
.684*
*
Sig. (2-
tailed) .000 .000 .000 .680 .000 .000 .000 .000 .000 .000
N 252 252 252 252 252 252 252 252 252 252 252
BUTI
R 2
Pearso
n
Correla
tion
.638** 1
.627**
.581** .121
.290**
.468**
.573**
.561**
.449**
.770*
*
Sig. (2-
tailed) .000 .000 .000 .056 .000 .000 .000 .000 .000 .000
N 252 252 252 252 252 252 252 252 252 252 252
BUTI
R 3
Pearso
n
Correla
tion
.477**
.627** 1
.541**
.124*
.369**
.331**
.422**
.439**
.364**
.684*
*
Sig. (2-
tailed) .000 .000 .000 .049 .000 .000 .000 .000 .000 .000
N 252 252 252 252 252 252 252 252 252 252 252
BUTI
R 4
Pearso
n
Correla
tion
.427**
.581**
.541** 1
.128*
.488**
.492**
.507**
.538**
.458**
.757*
*
Sig. (2-
tailed) .000 .000 .000 .042 .000 .000 .000 .000 .000 .000
N 252 252 252 252 252 252 252 252 252 252 252
BUTI
R 5
Pearso
n
Correla
tion
.026 .121 .124
*
.128* 1
.130* .040 .059 .111
.202**
.323*
*
Sig. (2-
tailed) .680 .056 .049 .042 .040 .530 .350 .078 .001 .000
N 252 252 252 252 252 252 252 252 252 252 252
BUTI
R 6
Pearso
n
Correla
tion
.287**
.290**
.369**
.488**
.130* 1
.370**
.276**
.386**
.443**
.597*
*
Sig. (2-
tailed) .000 .000 .000 .000 .040 .000 .000 .000 .000 .000
N 252 252 252 252 252 252 252 252 252 252 252
BUTI
R 7
Pearso
n
Correla
tion
.518**
.468**
.331**
.492**
.040 .370
** 1
.522**
.543**
.493**
.707*
*
Sig. (2-
tailed) .000 .000 .000 .000 .530 .000 .000 .000 .000 .000
N 252 252 252 252 252 252 252 252 252 252 252
BUTI
R 8
Pearso
n
Correla
tion
.448**
.573**
.422**
.507**
.059 .276
**
.522**
1 .609
**
.542**
.719*
*
Sig. (2-
tailed) .000 .000 .000 .000 .350 .000 .000 .000 .000 .000
N 252 252 252 252 252 252 252 252 252 252 252
BUTI
R 9
Pearso
n
Correla
tion
.456**
.561**
.439**
.538**
.111 .386
**
.543**
.609**
1 .621
**
.775*
*
Sig. (2-
tailed) .000 .000 .000 .000 .078 .000 .000 .000 .000 .000
N 252 252 252 252 252 252 252 252 252 252 252
BUTI
R 10
Pearso
n
Correla
tion
.392**
.449**
.364**
.458**
.202**
.443**
.493**
.542**
.621**
1 .742*
*
Sig. (2-
tailed) .000 .000 .000 .000 .001 .000 .000 .000 .000 .000
N 252 252 252 252 252 252 252 252 252 252 252
TOT
AL
Pearso
n
Correla
tion
.684**
.770**
.684**
.757**
.323**
.597**
.707**
.719**
.775**
.742**
1
Sig. (2-
tailed) .000 .000 .000 .000 .000 .000 .000 .000 .000 .000
N 252 252 252 252 252 252 252 252 252 252 252
**. Correlation is significant at the 0.01 level (2-tailed).
*. Correlation is significant at the 0.05 level (2-tailed).
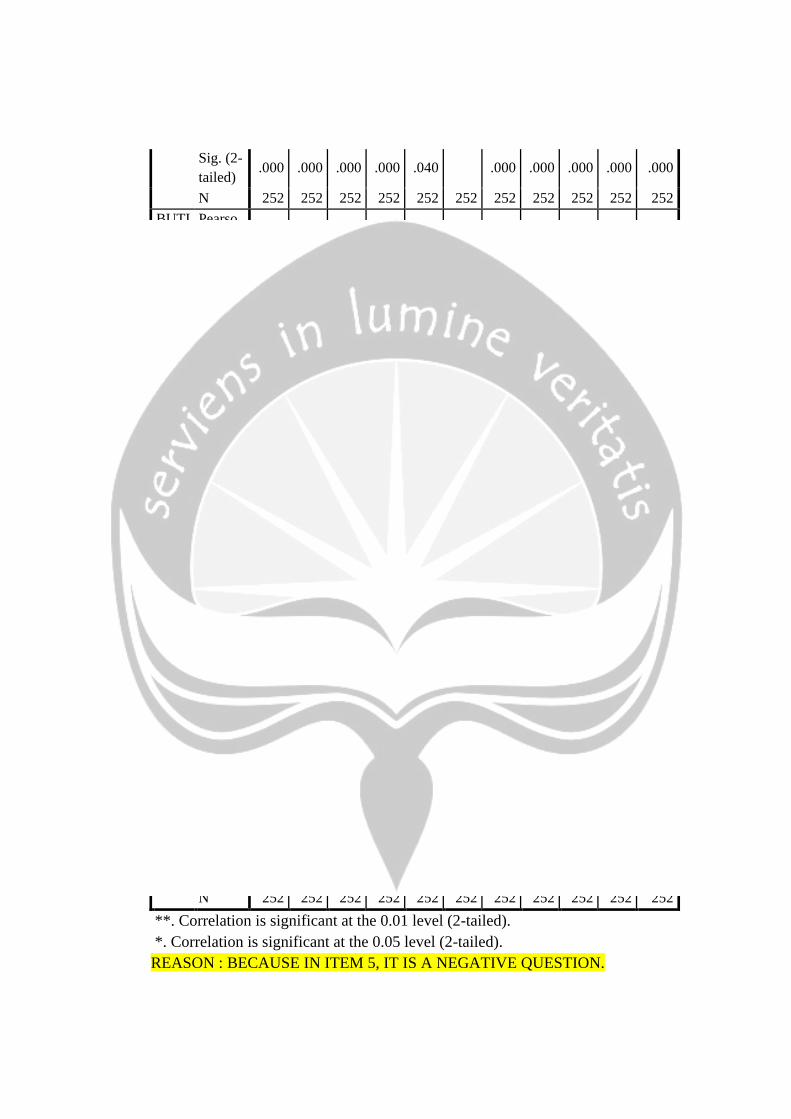
REASON : BECAUSE IN ITEM 5, IT IS A NEGATIVE QUESTION.
RELIABILITY AND VALIDITY TEST
AWARENESS
Case Processing Summary
N %
Cases Valid 251 99.6
Excludeda 1 .4
Total 252 100.0
a. Listwise deletion based on all
variables in the procedure.
Reliability Statistics
Cronbach's
Alpha N of Items
.815 12
Item-Total Statistics
Scale Mean
if Item
Deleted
Scale
Variance if
Item Deleted
Corrected
Item-Total
Correlation
Cronbach's
Alpha if Item
Deleted
BUTIR 1 42.24 25.615 .475 .801
BUTIR 2 42.08 25.790 .484 .801
BUTIR 3 41.79 25.695 .538 .797
BUTIR 4 42.22 25.110 .497 .799
BUTIR 5 43.29 26.407 .336 .813
BUTIR 6 43.02 26.392 .348 .811
BUTIR 7 42.51 26.083 .423 .805
BUTIR 8 42.79 26.613 .270 .819
BUTIR 9 42.02 24.432 .600 .790
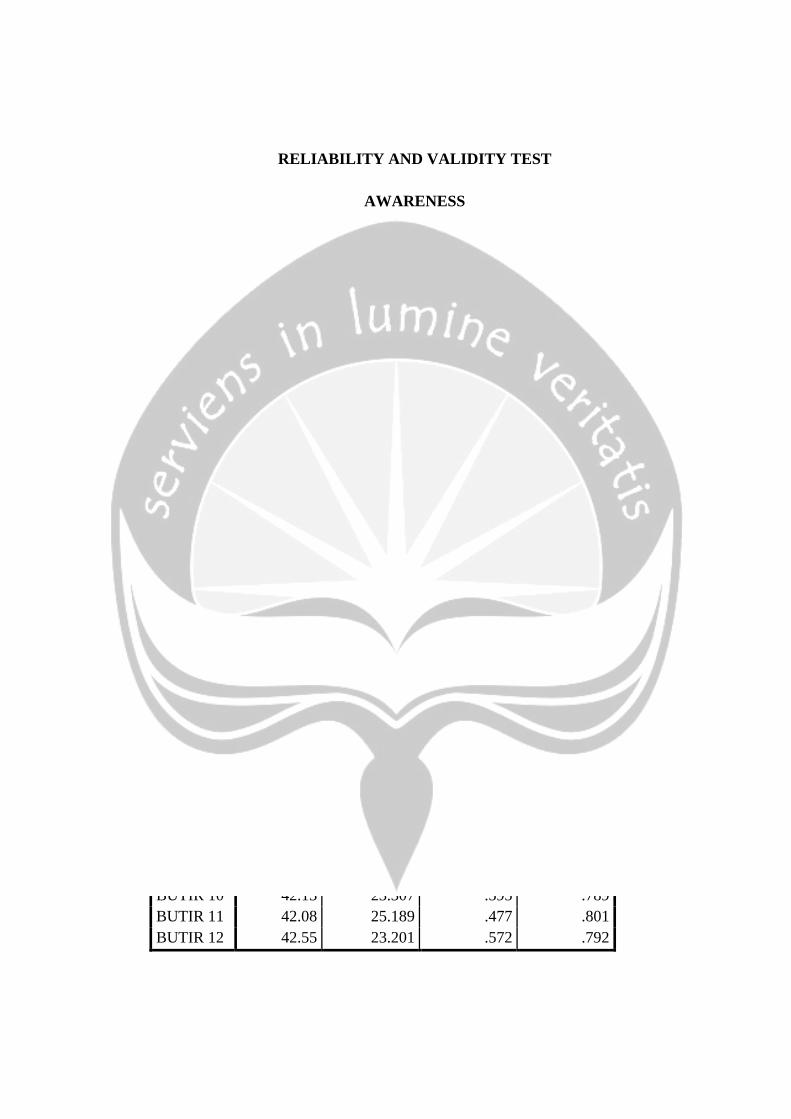
BUTIR 10 42.13 23.307 .595 .789
BUTIR 11 42.08 25.189 .477 .801
BUTIR 12 42.55 23.201 .572 .792
Correlations
BU
TI
R 1
BU
TI
R 2
BU
TI
R 3
BU
TI
R 4
BU
TI
R 5
BU
TI
R 6
BU
TI
R 7
BU
TI
R 8
BU
TI
R 9
BU
TI
R
10
BU
TI
R
11
BU
TI
R
12
TO
TA
L
BU
TIR
1
Pears
on
Corre
lation
1 .51
4**
.45
5**
.35
5**
.21
6**
.01
1
.17
7**
.03
7
.41
1**
.35
7**
.25
1**
.30
4**
.57
4**
Sig.
(2-
tailed
)
.00
0
.00
0
.00
0
.00
1
.85
9
.00
5
.55
8
.00
0
.00
0
.00
0
.00
0
.00
0
N 252 252 252 252 252 251 252 252 252 252 252 252 252
BU
TIR
2
Pears
on
Corre
lation
.51
4** 1
.49
2**
.33
8**
.00
7
.03
9
.16
9**
.04
9
.35
7**
.37
9**
.42
8**
.34
3**
.57
8**
Sig.
(2-
tailed
)
.00
0
.00
0
.00
0
.91
2
.53
5
.00
7
.43
5
.00
0
.00
0
.00
0
.00
0
.00
0
N 252 252 252 252 252 251 252 252 252 252 252 252 252
BU
TIR
3
Pears
on
Corre
lation
.45
5**
.49
2** 1
.43
0**
.13
0*
.03
7
.22
2**
.01
1
.56
3**
.40
6**
.40
8**
.29
0**
.62
0**
Sig.
(2-
tailed
)
.00
0
.00
0
.00
0
.04
0
.56
4
.00
0
.85
9
.00
0
.00
0
.00
0
.00
0
.00
0
N 252 252 252 252 252 251 252 252 252 252 252 252 252
BU
TIR
4
Pears
on
Corre
lation
.35
5**
.33
8**
.43
0** 1
.14
8*
.12
7*
.18
6**
.15
7*
.36
2**
.40
9**
.29
9**
.36
0**
.60
1**

Sig.
(2-
tailed
)
.00
0
.00
0
.00
0
.01
9
.04
5
.00
3
.01
2
.00
0
.00
0
.00
0
.00
0
.00
0
N 252 252 252 252 252 251 252 252 252 252 252 252 252
BU
TIR
5
Pears
on
Corre
lation
.21
6**
.00
7
.13
0*
.14
8* 1
.35
9**
.31
2**
.12
5*
.19
2**
.23
3**
.05
8
.35
7**
.45
8**
Sig.
(2-
tailed
)
.00
1
.91
2
.04
0
.01
9
.00
0
.00
0
.04
8
.00
2
.00
0
.36
0
.00
0
.00
0
N 252 252 252 252 252 251 252 252 252 252 252 252 252
BU
TIR
6
Pears
on
Corre
lation
.01
1
.03
9
.03
7
.12
7*
.35
9** 1
.38
7**
.50
9**
.13
5*
.14
8*
.19
1**
.26
2**
.46
6**
Sig.
(2-
tailed
)
.85
9
.53
5
.56
4
.04
5
.00
0
.00
0
.00
0
.03
3
.01
9
.00
2
.00
0
.00
0
N 251 251 251 251 251 251 251 251 251 251 251 251 251
BU
TIR
7
Pears
on
Corre
lation
.17
7**
.16
9**
.22
2**
.18
6**
.31
2**
.38
7** 1
.27
7**
.25
1**
.21
4**
.24
9**
.27
9**
.52
7**
Sig.
(2-
tailed
)
.00
5
.00
7
.00
0
.00
3
.00
0
.00
0
.00
0
.00
0
.00
1
.00
0
.00
0
.00
0
N 252 252 252 252 252 251 252 252 252 252 252 252 252
BU
TIR
8
Pears
on
Corre
lation
.03
7
.04
9
.01
1
.15
7*
.12
5*
.50
9**
.27
7** 1
.09
4
.12
3
.14
4*
.21
2**
.40
8**

Sig.
(2-
tailed
)
.55
8
.43
5
.85
9
.01
2
.04
8
.00
0
.00
0
.13
6
.05
0
.02
2
.00
1
.00
0
N 252 252 252 252 252 251 252 252 252 252 252 252 252
BU
TIR
9
Pears
on
Corre
lation
.41
1**
.35
7**
.56
3**
.36
2**
.19
2**
.13
5*
.25
1**
.09
4 1
.61
3**
.41
4**
.36
9**
.68
7**
Sig.
(2-
tailed
)
.00
0
.00
0
.00
0
.00
0
.00
2
.03
3
.00
0
.13
6
.00
0
.00
0
.00
0
.00
0
N 252 252 252 252 252 251 252 252 252 252 252 252 252
BU
TIR
10
Pears
on
Corre
lation
.35
7**
.37
9**
.40
6**
.40
9**
.23
3**
.14
8*
.21
4**
.12
3
.61
3** 1
.36
0**
.47
4**
.70
1**
Sig.
(2-
tailed
)
.00
0
.00
0
.00
0
.00
0
.00
0
.01
9
.00
1
.05
0
.00
0
.00
0
.00
0
.00
0
N 252 252 252 252 252 251 252 252 252 252 252 252 252
BU
TIR
11
Pears
on
Corre
lation
.25
1**
.42
8**
.40
8**
.29
9**
.05
8
.19
1**
.24
9**
.14
4*
.41
4**
.36
0** 1
.28
8**
.58
6**
Sig.
(2-
tailed
)
.00
0
.00
0
.00
0
.00
0
.36
0
.00
2
.00
0
.02
2
.00
0
.00
0
.00
0
.00
0
N 252 252 252 252 252 251 252 252 252 252 252 252 252
BU
TIR
12
Pears
on
Corre
lation
.30
4**
.34
3**
.29
0**
.36
0**
.35
7**
.26
2**
.27
9**
.21
2**
.36
9**
.47
4**
.28
8** 1
.68
6**

Sig.
(2-
tailed
)
.00
0
.00
0
.00
0
.00
0
.00
0
.00
0
.00
0
.00
1
.00
0
.00
0
.00
0
.00
0
N 252 252 252 252 252 251 252 252 252 252 252 252 252
TO
TA
L
Pears
on
Corre
lation
.57
4**
.57
8**
.62
0**
.60
1**
.45
8**
.46
6**
.52
7**
.40
8**
.68
7**
.70
1**
.58
6**
.68
6** 1
Sig.
(2-
tailed
)
.00
0
.00
0
.00
0
.00
0
.00
0
.00
0
.00
0
.00
0
.00
0
.00
0
.00
0
.00
0
N 252 252 252 252 252 251 252 252 252 252 252 252 252
RELIABILITY AND VALIDITY TEST
LIFESTYLE
Case Processing Summary
N %
Cases Valid 252 100.0
Excludeda 0 .0
Total 252 100.0
a. Listwise deletion based on all
variables in the procedure.
Reliability Statistics
Cronbach's
Alpha N of Items
.888 12
Item-Total Statistics
Scale Mean
if Item
Deleted
Scale
Variance if
Item Deleted
Corrected
Item-Total
Correlation
Cronbach's
Alpha if Item
Deleted
BUTIR 1 34.92 56.464 .451 .886
BUTIR 2 35.95 55.133 .557 .880
BUTIR 3 35.95 55.472 .551 .881
BUTIR 4 35.80 54.425 .589 .879
BUTIR 5 35.08 55.981 .409 .889
BUTIR 6 34.91 55.302 .593 .879
BUTIR 7 34.57 51.999 .617 .877
BUTIR 8 34.42 52.556 .615 .877
BUTIR 9 35.07 52.648 .655 .875
BUTIR
10 34.85 50.747 .757 .869
BUTIR
11 34.86 52.327 .621 .877
BUTIR
12 34.45 51.906 .687 .873
Correlations
BU
TI
R 1
BU
TI
R 2
BU
TI
R 3
BU
TI
R 4
BU
TI
R 5
BU
TI
R 6
BU
TI
R 7
BU
TI
R 8
BU
TI
R 9
BU
TI
R
10
BU
TI
R
11
BU
TI
R
12
TO
TA
L
BU
TIR
1
Pears
on
Corre
lation
1 .21
3**
.20
1**
.24
1**
.39
2**
.57
1**
.25
8**
.18
7**
.27
8**
.38
9**
.33
2**
.36
0**
.53
8**
Sig.
(2-
tailed
)
.00
1
.00
1
.00
0
.00
0
.00
0
.00
0
.00
3
.00
0
.00
0
.00
0
.00
0
.00
0
N 252 252 252 252 252 252 252 252 252 252 252 252 252
BU
TIR
2
Pears
on
Corre
lation
.21
3** 1
.81
2**
.64
3**
.24
1**
.32
1**
.33
7**
.26
1**
.31
9**
.41
8**
.32
8**
.33
8**
.63
2**

Sig.
(2-
tailed
)
.00
1
.00
0
.00
0
.00
0
.00
0
.00
0
.00
0
.00
0
.00
0
.00
0
.00
0
.00
0
N 252 252 252 252 252 252 252 252 252 252 252 252 252
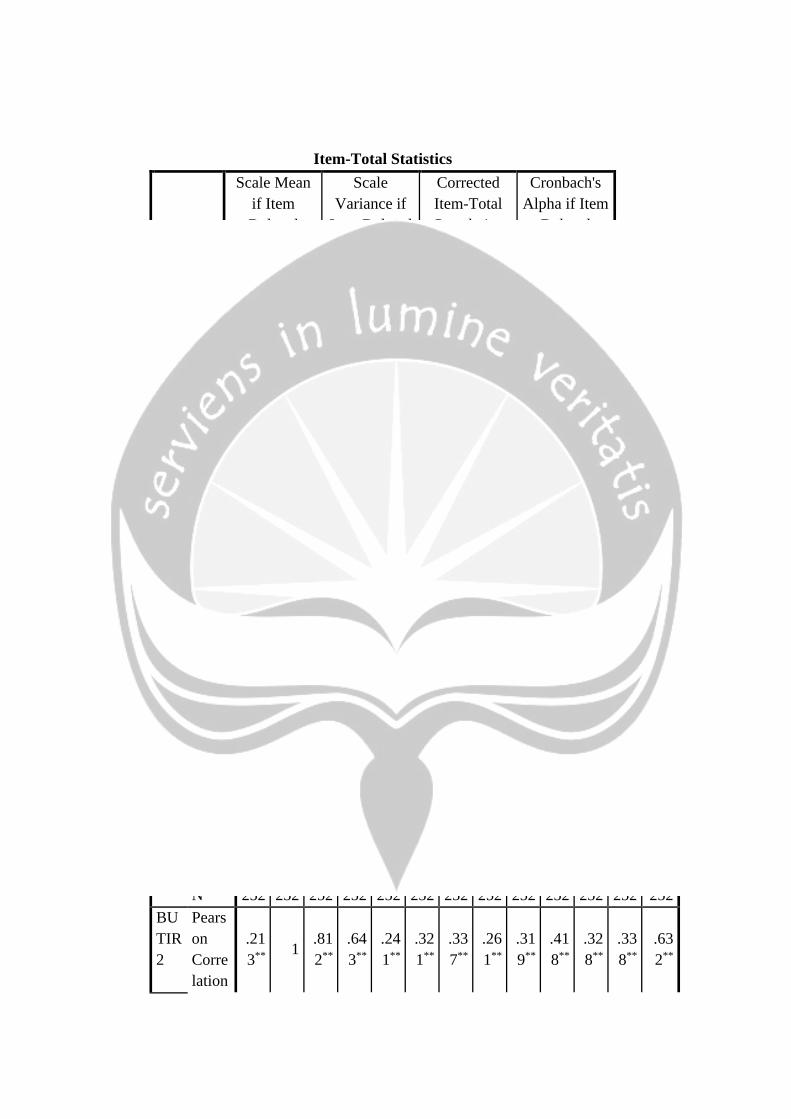
BU
TIR
3
Pears
on
Corre
lation
.20
1**
.81
2** 1
.73
6**
.22
7**
.32
8**
.32
2**
.26
0**
.31
2**
.38
6**
.30
6**
.29
9**
.62
5**
Sig.
(2-
tailed
)
.00
1
.00
0
.00
0
.00
0
.00
0
.00
0
.00
0
.00
0
.00
0
.00
0
.00
0
.00
0
N 252 252 252 252 252 252 252 252 252 252 252 252 252
BU
TIR
4
Pears
on
Corre
lation
.24
1**
.64
3**
.73
6** 1
.26
3**
.37
6**
.38
1**
.36
1**
.33
7**
.40
2**
.32
8**
.37
6**
.66
2**
Sig.
(2-
tailed
)
.00
0
.00
0
.00
0
.00
0
.00
0
.00
0
.00
0
.00
0
.00
0
.00
0
.00
0
.00
0
N 252 252 252 252 252 252 252 252 252 252 252 252 252
BU
TIR
5
Pears
on
Corre
lation
.39
2**
.24
1**
.22
7**
.26
3** 1
.45
2**
.24
6**
.20
7**
.32
1**
.35
6**
.20
5**
.24
3**
.51
4**
Sig.
(2-
tailed
)
.00
0
.00
0
.00
0
.00
0
.00
0
.00
0
.00
1
.00
0
.00
0
.00
1
.00
0
.00
0
N 252 252 252 252 252 252 252 252 252 252 252 252 252
BU
TIR
6
Pears
on
Corre
lation
.57
1**
.32
1**
.32
8**
.37
6**
.45
2** 1
.35
4**
.35
5**
.38
1**
.49
0**
.37
9**
.39
9**
.65
8**

Sig.
(2-
tailed
)
.00
0
.00
0
.00
0
.00
0
.00
0
.00
0
.00
0
.00
0
.00
0
.00
0
.00
0
.00
0
N 252 252 252 252 252 252 252 252 252 252 252 252 252
BU
TIR
7
Pears
on
Corre
lation
.25
8**
.33
7**
.32
2**
.38
1**
.24
6**
.35
4** 1
.57
7**
.54
1**
.49
4**
.48
9**
.49
1**
.70
1**
Sig.
(2-
tailed
)
.00
0
.00
0
.00
0
.00
0
.00
0
.00
0
.00
0
.00
0
.00
0
.00
0
.00
0
.00
0
N 252 252 252 252 252 252 252 252 252 252 252 252 252
BU
TIR
8
Pears
on
Corre
lation
.18
7**
.26
1**
.26
0**
.36
1**
.20
7**
.35
5**
.57
7** 1
.59
0**
.52
6**
.46
7**
.64
6**
.69
6**
Sig.
(2-
tailed
)
.00
3
.00
0
.00
0
.00
0
.00
1
.00
0
.00
0
.00
0
.00
0
.00
0
.00
0
.00
0
N 252 252 252 252 252 252 252 252 252 252 252 252 252
BU
TIR
9
Pears
on
Corre
lation
.27
8**
.31
9**
.31
2**
.33
7**
.32
1**
.38
1**
.54
1**
.59
0** 1
.61
4**
.45
2**
.57
6**
.72
5**
Sig.
(2-
tailed
)
.00
0
.00
0
.00
0
.00
0
.00
0
.00
0
.00
0
.00
0
.00
0
.00
0
.00
0
.00
0
N 252 252 252 252 252 252 252 252 252 252 252 252 252
BU
TIR
10
Pears
on
Corre
lation
.38
9**
.41
8**
.38
6**
.40
2**
.35
6**
.49
0**
.49
4**
.52
6**
.61
4** 1
.68
7**
.66
8**
.81
1**

Sig.
(2-
tailed
)
.00
0
.00
0
.00
0
.00
0
.00
0
.00
0
.00
0
.00
0
.00
0
.00
0
.00
0
.00
0
N 252 252 252 252 252 252 252 252 252 252 252 252 252
BU
TIR
11
Pears
on
Corre
lation
.33
2**
.32
8**
.30
6**
.32
8**
.20
5**
.37
9**
.48
9**
.46
7**
.45
2**
.68
7** 1
.54
7**
.70
2**
Sig.
(2-
tailed
)
.00
0
.00
0
.00
0
.00
0
.00
1
.00
0
.00
0
.00
0
.00
0
.00
0
.00
0
.00
0
N 252 252 252 252 252 252 252 252 252 252 252 252 252
BU
TIR
12
Pears
on
Corre
lation
.36
0**
.33
8**
.29
9**
.37
6**
.24
3**
.39
9**
.49
1**
.64
6**
.57
6**
.66
8**
.54
7** 1
.75
3**
Sig.
(2-
tailed
)
.00
0
.00
0
.00
0
.00
0
.00
0
.00
0
.00
0
.00
0
.00
0
.00
0
.00
0
.00
0
N 252 252 252 252 252 252 252 252 252 252 252 252 252
TO
TA
L
Pears
on
Corre
lation
.53
8**
.63
2**
.62
5**
.66
2**
.51
4**
.65
8**
.70
1**
.69
6**
.72
5**
.81
1**
.70
2**
.75
3** 1
Sig.
(2-
tailed
)
.00
0
.00
0
.00
0
.00
0
.00
0
.00
0
.00
0
.00
0
.00
0
.00
0
.00
0
.00
0
N 252 252 252 252 252 252 252 252 252 252 252 252 252

RELIABILITY AND VALIDITY TEST
CONFIDENCE
Case Processing Summary
N %
Cases Valid 252 100.0
Excludeda 0 .0
Total 252 100.0
a. Listwise deletion based on all
variables in the procedure.
Reliability Statistics
Cronbach's
Alpha N of Items
.920 8
Item-Total Statistics
Scale Mean
if Item
Deleted
Scale
Variance if
Item Deleted
Corrected
Item-Total
Correlation
Cronbach's
Alpha if Item
Deleted
BUTIR
1 28.27 21.026 .634 .917
BUTIR
2 28.09 20.247 .779 .905
BUTIR
3 28.17 20.232 .736 .909
BUTIR
4 27.86 20.983 .746 .908
BUTIR
5 27.83 21.117 .732 .909
BUTIR
6 27.90 20.496 .769 .906
BUTIR
7 28.07 19.466 .748 .908
BUTIR
8 27.82 20.524 .731 .909
Correlations
BUT
IR 1
BUT
IR 2
BUT
IR 3
BUT
IR 4
BUT
IR 5
BUT
IR 6
BUT
IR 7
BUT
IR 8
TOT
AL
BUTI
R 1
Pearson
Correlat
ion
1 .601*
*
.602*
*
.451*
*
.436*
*
.555*
*
.522*
*
.455*
* .725**
Sig. (2-
tailed) .000 .000 .000 .000 .000 .000 .000 .000
N 252 252 252 252 252 252 252 252 252
BUTI
R 2
Pearson
Correlat
ion
.601*
* 1
.662*
*
.659*
*
.643*
*
.620*
*
.581*
*
.616*
* .837**
Sig. (2-
tailed) .000 .000 .000 .000 .000 .000 .000 .000
N 252 252 252 252 252 252 252 252 252
BUTI
R 3
Pearson
Correlat
ion
.602*
*
.662*
* 1
.610*
*
.592*
*
.579*
*
.597*
*
.516*
* .806**
Sig. (2-
tailed) .000 .000 .000 .000 .000 .000 .000 .000
N 252 252 252 252 252 252 252 252 252
BUTI
R 4
Pearson
Correlat
ion
.451*
*
.659*
*
.610*
* 1
.712*
*
.611*
*
.543*
*
.644*
* .805**
Sig. (2-
tailed) .000 .000 .000 .000 .000 .000 .000 .000
N 252 252 252 252 252 252 252 252 252
BUTI
R 5
Pearson
Correlat
ion
.436*
*
.643*
*
.592*
*
.712*
* 1
.619*
*
.593*
*
.558*
* .794**
Sig. (2-
tailed) .000 .000 .000 .000 .000 .000 .000 .000
N 252 252 252 252 252 252 252 252 252
BUTI
R 6
Pearson
Correlat
ion
.555*
*
.620*
*
.579*
*
.611*
*
.619*
* 1
.683*
*
.644*
* .827**
Sig. (2-
tailed) .000 .000 .000 .000 .000 .000 .000 .000
N 252 252 252 252 252 252 252 252 252
BUTI
R 7
Pearson
Correlat
ion
.522*
*
.581*
*
.597*
*
.543*
*
.593*
*
.683*
* 1 .693*
* .823**
Sig. (2-
tailed) .000 .000 .000 .000 .000 .000 .000 .000
N 252 252 252 252 252 252 252 252 252
BUTI
R 8
Pearson
Correlat
ion
.455*
*
.616*
*
.516*
*
.644*
*
.558*
*
.644*
*
.693*
* 1 .800**
Sig. (2-
tailed) .000 .000 .000 .000 .000 .000 .000 .000
N 252 252 252 252 252 252 252 252 252
TOT
AL
Pearson
Correlat
ion
.725*
*
.837*
*
.806*
*
.805*
*
.794*
*
.827*
*
.823*
*
.800*
* 1
Sig. (2-
tailed) .000 .000 .000 .000 .000 .000 .000 .000
N 252 252 252 252 252 252 252 252 252
MULTIPLE REGRESSION
Model Summary
Model R R Square
Adjusted R
Square
Std. Error of
the Estimate
1 .801a .641 .637 3.101
a. Predictors: (Constant), LIFESTYLE, AWARENESS,
DEVOUTNESS
Coefficientsa
Model
Unstandardized
Coefficients
Standardized
Coefficients
t Sig. B Std. Error Beta
1 (Constant) -1.999 1.737 -1.151 .251
DEVOUTNE
SS .279 .048 .298 5.824 .000
AWARENES
S .366 .047 .387 7.714 .000
LIFESTYLE .169 .031 .261 5.403 .000
ANOVAa
Model
Sum of
Squares df
Mean
Square F Sig.
1 Regression 4262.564 3 1420.855 147.718 .000b
Residual 2385.436 248 9.619
Total 6648.000 251
a. Dependent Variable: CONFIDENCE
b. Predictors: (Constant), LIFESTYLE, AWARENESS, DEVOUTNESS
ANOVA TEST
MUSLIM BASED UNIVERSITY STUDENT AND NON-MUSLIM
UNIVERSITY STUDENT
Descriptives
CONFIDENCE
N Mean
Std.
Deviation
Std.
Error
95%
Confidence
Interval for
Mean
Minimum Maximum
Lower
Bound
Upper
Bound
NON
MUSLIM 126 31.08 5.397 .481 30.13 32.03 8 40
MUSLIM 126 32.92 4.727 .421 32.09 33.75 16 40
Total 252 32.00 5.146 .324 31.36 32.64 8 40
.
Test of Homogeneity of Variances
COFIDENCE
Levene
Statistic df1 df2 Sig.
.067 1 250 .796

ANOVA
CONFIDENCE
Sum of
Squares df
Mean
Square F Sig.
Between
Groups 213.587 1 213.587 8.299 .004
Within Groups 6434.413 250 25.738
Total 6648.000 251
ANOVA TEST
ANOVE TEST
BASED ON INCOME PER MONTH
Descriptives
CONFIDENCE
N Mean
Std.
Deviation
Std.
Error
95%
Confidence
Interval for
Mean
Minimum Maximum
Lower
Bound
Upper
Bound
<1.5MILLION 157 32.38 5.084 .406 31.57 33.18 8 40
1,5-
3MILLION 83 31.92 4.852 .533 30.86 32.98 14 40
>3 MILLION 12 27.67 6.301 1.819 23.66 31.67 16 32
Total 252 32.00 5.146 .324 31.36 32.64 8 40
Test of Homogeneity of Variances
CONFIDENCE
Levene
Statistic df1 df2 Sig.
2.010 2 249 .136

ANOVA
CONFIDENCE
Sum of
Squares df
Mean
Square F Sig.
Between
Groups 248.096 2 124.048 4.826 .009
Within Groups 6399.904 249 25.702
Total 6648.000 251
Multiple Comparisons
Dependent Variable: CONFIDENCE
(I) INCOME (J) INCOME
Mean
Difference
(I-J)
Std.
Error Sig.
95%
Confidence
Interval
Lower
Bound
Upper
Bound
Tukey
HSD
<1.5MILLION 1,5-
3MILLION .460 .688 .782 -1.16 2.08
>3 MILLION 4.709* 1.518 .006 1.13 8.29
1,5-
3MILLION
<1.5MILLION -.460 .688 .782 -2.08 1.16
>3 MILLION 4.249* 1.566 .019 .56 7.94
>3 MILLION <1.5MILLION -4.709* 1.518 .006 -8.29 -1.13
1,5-
3MILLION -4.249* 1.566 .019 -7.94 -.56
Bonferroni <1.5MILLION 1,5-
3MILLION .460 .688 1.000 -1.20 2.12
>3 MILLION 4.709* 1.518 .006 1.05 8.37
1,5-
3MILLION
<1.5MILLION -.460 .688 1.000 -2.12 1.20
>3 MILLION 4.249* 1.566 .021 .48 8.02
>3 MILLION <1.5MILLION -4.709* 1.518 .006 -8.37 -1.05
1,5-
3MILLION -4.249* 1.566 .021 -8.02 -.48
*. The mean difference is significant at the 0.05 level.

CONFIDENCE
INCOME N
Subset for alpha =
0.05
1 2
Tukey
HSDa,b
>3
MILLION 12 27.67
1,5-
3MILLION 83 31.92
<1.5MILLIO
N 157 32.38
Sig. 1.000 .935
Means for groups in homogeneous subsets are displayed.
a. Uses Harmonic Mean Sample Size = 29.484.
b. The group sizes are unequal. The harmonic mean of the
group sizes is used. Type I error levels are not guaranteed.
ANOVA TEST
BASED ON LIVING PLACE
Descriptives
CONFIDENCE
N Mean
Std.
Deviation
Std.
Error
95% Confidence
Interval for Mean
Minimum Maximum
Lower
Bound
Upper
Bound
KOS 164 31.99 5.079 .397 31.21 32.78 8 40
RUMAH
ORTU 67 31.75 5.292 .647 30.46 33.04 18 40
RUMAH
SAUDARA 21 32.86 5.360 1.170 30.42 35.30 16 40
Total 252 32.00 5.146 .324 31.36 32.64 8 40
Test of Homogeneity of Variances
CONFIDENCE
Levene
Statistic df1 df2 Sig.
.299 2 249 .742
ANOVA
CONFIDENCE
Sum of
Squares df
Mean
Square F Sig.
Between
Groups 19.748 2 9.874 .371 .690
Within Groups 6628.252 249 26.619
Total 6648.000 251
Multiple Comparisons
Dependent Variable: CONFIDENCE
(I)
LIVINGPLA
CE
(J)
LIVINGPLA
CE
Mean
Differen
ce (I-J)
Std.
Erro
r Sig.
95%
Confidence
Interval
Lowe
r
Boun
d
Uppe
r
Boun
d
Tukey
HSD
KOS RUMAH
ORTU .248 .748 .941 -1.52 2.01
RUMAH
SAUDARA -.863
1.19
6 .751 -3.68 1.96
RUMAH
ORTU
KOS -.248 .748 .941 -2.01 1.52
RUMAH
SAUDARA -1.111
1.29
0 .665 -4.15 1.93
RUMAH
SAUDARA
KOS .863
1.19
6 .751 -1.96 3.68
RUMAH
ORTU 1.111
1.29
0 .665 -1.93 4.15

Bonferro
ni
KOS RUMAH
ORTU .248 .748
1.00
0 -1.56 2.05
RUMAH
SAUDARA -.863
1.19
6
1.00
0 -3.75 2.02
RUMAH
ORTU
KOS -.248 .748
1.00
0 -2.05 1.56
RUMAH
SAUDARA -1.111
1.29
0
1.00
0 -4.22 2.00
RUMAH
SAUDARA
KOS .863
1.19
6
1.00
0 -2.02 3.75
RUMAH
ORTU 1.111
1.29
0
1.00
0 -2.00 4.22
CONFIDENCE
LIVINGPLACE N
Subset for
alpha = 0.05
1
Tukey
HSDa,b
RUMAH ORTU 67 31.75
KOS 164 31.99
RUMAH
SAUDARA 21 32.86
Sig. .573
Means for groups in homogeneous subsets are displayed.
a. Uses Harmonic Mean Sample Size = 43.705.
b. The group sizes are unequal. The harmonic mean of the
group sizes is used. Type I error levels are not guaranteed.
Correlations
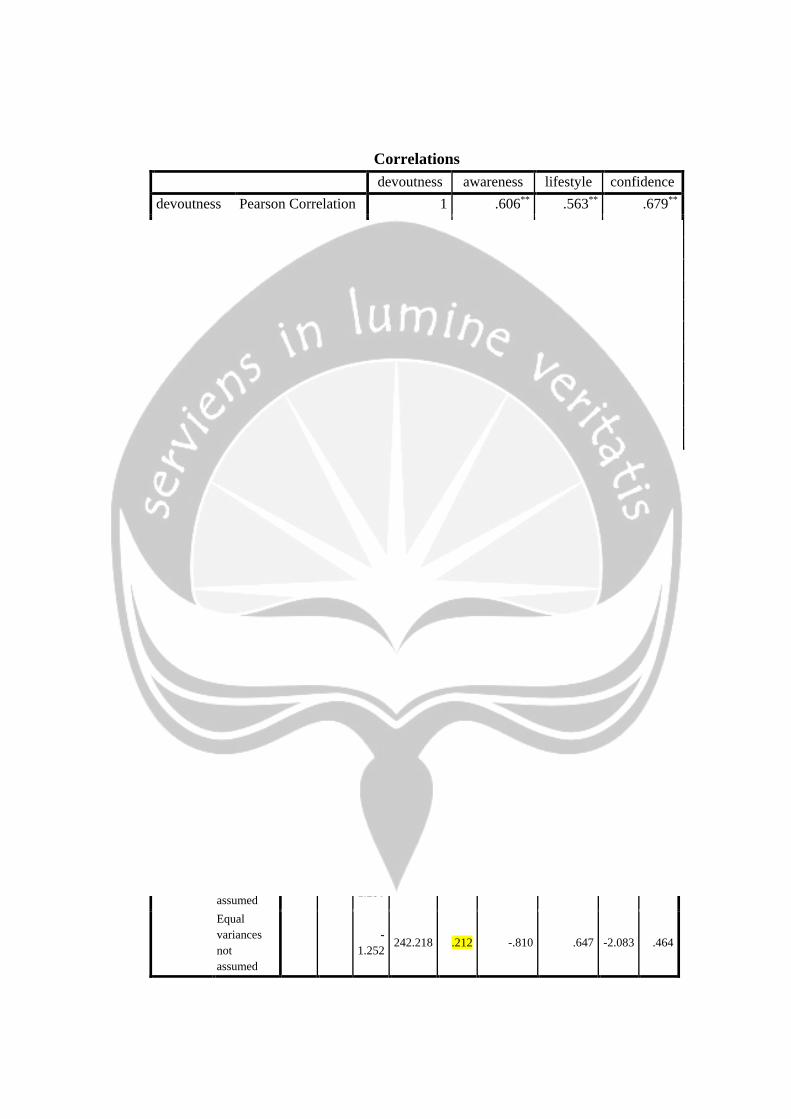
devoutness awareness lifestyle confidence
devoutness Pearson Correlation 1 .606** .563** .679**
Sig. (2-tailed) .000 .000 .000
N 252 252 252 252
awareness Pearson Correlation .606** 1 .538** .707**
Sig. (2-tailed) .000 .000 .000
N 252 252 252 252
Lifestyle Pearson Correlation .563** .538** 1 .636**
Sig. (2-tailed) .000 .000 .000
N 252 252 252 252
confidence Pearson Correlation .679** .707** .636** 1
Sig. (2-tailed) .000 .000 .000
N 252 252 252 252
Independent sample T Test
Group Statistics
gender N Mean
Std.
Deviation
Std. Error
Mean
confidence
level
male 125 31.59 4.609 .412
female 127 32.40 5.615 .498
Independent Samples Test ( male and female)
Levene's
Test for
Equality of
Variances t-test for Equality of Means
F Sig. t df
Sig.
(2-
tailed)
Mean
Difference
Std. Error
Difference
95%
Confidence
Interval of the
Difference
Lower Upper
confidence
level
Equal
variances
assumed
1.611 .206 -
1.250 250 .212 -.810 .648 -2.085 .466
Equal
variances
not
assumed
-
1.252 242.218 .212 -.810 .647 -2.083 .464

Independent sample T-test
Group Statistics
university
based N Mean
Std.
Deviation
Std. Error
Mean
confidence Muslim 126 31.08 5.397 .481
Non Muslim 126 32.92 4.727 .421
Independent Samples Test (muslim and non muslim based university) Levene's Test for Equality
of Variances t-test for Equality of Means
F Sig. t df
Sig. (2-
tailed)
Mean Differenc
e
Std. Error Differenc
e
95% Confidence
Interval of the Difference
Lower
Upper
confidence
Equal variances assumed
.067
.796
-2.88
1 250 .004 -1.841 .639
-3.100
-.582
Equal variances not assumed
-2.88
1
245.732
.004 -1.841 .639 -
3.100 -.582