Embed Size (px)
Citation preview

CHAPTER IV
ROLE OF AGRO PROCESSING INDUSTRIES IN RURAL
DEVELOPMENT
Agro industry has historically been given high priority in Indian
Policy of development programmes. The focus on agro-industry as an
agent of rural development and employment generation was present in
Mahatma Gandhi's emphasis on village-based agro-industry during
India's independence movement and is today a central component of the
national development plan. There is optimism concerning its continuing
development. The FAIDA report of the confederation of Indian Industry
(CII) and Mackinsey & company (1997) both show that there is great
potential for development of food processing and other agro-industries in
India.
However, India's agro-industry, development is today faces tough
challenges, including costly raw material, supply chain inefficiencies and
market demand constraints? There is skepticism about whether and
market multinational firms contracting small farmers will help or hurt
small farmers and local small agro-industrial firms? This debate is
generalized in developing countries. There is skepticism whether the
cooperative movement can effectively promote agro-industrial
development for small firms?
The private sector as well as government is at cross-roads in the
choice of the best models for agro-industrial development. The crucial
questions pertain to of institutional and organizational
arrangements/models which are appropriate for overcoming current
constraints, and maximizing their contribution to rural development and
safeguarding the small farmer interests?
90

4.1 Approaches To Agro-Industry Development In India
The movement for political independence up to the late 1940s under
the leadership of Mahatma Gandhi included the strategy and
encouragement of village agro-based industries. The objective was to
involve rural people in development and the independence movement
and to reduce extemal dependence. The ideology was economic, social
and political. Though the model involved the rural poor in development
action, it later failed because it became a blanket basis for nationalists to
favour less efficient techniques of production and oppose modem
industry, which did not meet consumer' needs and demands.
Between 1950 and 1980 agro-industry policy was dominated by
Prime Minister Nehru and his economic think-tank led by Mahanalobis.
They argued that India needed larger capital goods industries for the
capital goods sector, while the consumer goods sector was primarily for
small scale rural agro industries which are labour intensive and capital
saving. This was consistent with the need to reduce demands on limited
capital and savings, and to expand employment. However, such small
scale agro industries, because of old technology, inadequate
management and weak capacity to invest, often failed to meet the
expanding and changing market demands for quality goods, coming
from the rapid production and rising incomes.
Starting in 1980s, there has been a new effort for promotion of
agro industries in India with emphasis on market demand, state of the
art technology and efficient management of the supply chain. There
has been a substantial relaxation of govemment restrictions of
technology import and private foreign direct investment. However, these
current trends towards large private agro industrial units have risks of
bypassing small farmers and the rural poor.
Rudrani Bhattacharya in her paper "Agro-industry, inequality and
sectoral growth" concludes that the impact of agricultural development
on industrialization in the presence of a third sector namely, agro-
91

industry which directly interface with both agriculture and industry and ............... ,_ <"" -· - ,--- ....__
thereby provides a link between the two sectors. Rudrani also concludes
that an agricultural productivity gain promotes industrialization in a
small open economy while it may not promote industrialization in a
closed economy. We also find that in the presence of agro-industry, a
small primary exporting country can develop comparative advantage in
manufacturing through agricultural productivity increase. These are
more empirically plausible results for developing countries, which are
indeed small open economies.
Table 4.1
Importance of agro-industrial Sector in India
Percentage Share
Industries No. of Factories Employment Net Value
( 1996/ 1997) ( 199211993) ( 1996/ 1997)
Agrobased food industries 16.69 13.67 5.85
Agrobased non food industries 29.09 29.23 15.74
Total agrobased industries 45.78 42.89 21.59
Other (non-agro) industries 54.22 57.11 78.41
All Industries 100.00 100.00 100.00
Source: Annual Survey of Industnes 1994 and 1998
4.2 Characteristics of the Agro-Industrial Sector In India
Data from annual survey of industries show that 46 percent of all
factories in India are agro-industrial (Table 4.1), and they contribute 22
percent of the manufacturing value added and nearly 43 percent of
manufacturing industry employment. Table 4.1 indicates that 37 percent
of the agro industrial firms produce food and 63 percent produce
nonfood products. Table 4.2 show that 44 percent of the food related
factories are in milling (mainly grain), another 13 percent are in edible
oil, 10 percent are in sugar, and 33 percent in other foods such as
92

higher value food with higher income elasticity of demand. The "other
food" category accounts for 49 percent of total net value added and 20
percent of employment comes from grain milling.
Table 4.3 shows that only 18percent of total industrial fixed capital
is in agro-industry, compared to agro-industry's 43 percent share in
industrial employment. Thus, agro-industry continues to be relatively
labour-intensive and capital saving. The labour share of value added is
48 percent in agro-industry versus 35 percent in other industries. Agro
industry, on average, generates employment for 14 percent per
investment of Rs.100,000.
Table 4.2
Performance of agro-industry: comparing pre-reform with post-reform
periods
Indus ties Growth Of Value Added (Gdp) By Industry
1984/1985 to 1989/1990 1990/1991 to 1995/1996
Agro-based food industries 10.45 10.27
Agro-based non food industries 3.70 7.70
Total Agro-based industries 5.15 8.30
Other (non-agro) Industries 12.00 7.20
All manufacturing industries 9.23 7.60
Agriculture 5.67 2.68
Source: Annual Survey of Industnes 1994 and 1998
Currently, over a quarter of the world's population lives on less
than a dollar a day. The sustainable reduction of this number to half of
its 1990 level is the primary goal of development agencies around the
world. "Pro-Poor" development has become the current mantra of poverty
reduction, and it is this notion that it is possible to find economic and
public policy strategy which will unlock the capabilities inherent in the
poor that they might produce, process, market and trade their way out of
poverty.
93

Backed by the overwhelming evidence that education plays a
central role in sustainable poverty reduction, donors and policymakers
alike pay much attention to the development of education sectors in
developing countries. In a large number of developing countries,
education retains the greatest proportion of national budgets. The goal
of achieving universal primary education by the year 2015 has
dominated the policy debate and has narrowed the focus of policy
strategies to this area.
In addition the policy discourse on skill development has been
largely influenced by the challenges and opportunities brought about by
globalization. Inspired by the access of the East Asian "Tigers",
strategies out of poverty emphasise the importance of moving away from
traditional comparative advantages in resource based activities to new
'technological' comparative advantages in niche production, implying the
massive up grading of skill levels for advanced technology sectors.
The rapid industrialization experiences made by a few countries in
East Asia, however, are not necessarily replicable in other developing
counties, as the increasing gap in development between Asia and Africa
highlights. Rather than favoring skill strategies to move into new
technology sectors, donor and government interventions need to support
strategies to exploit the full potential of that sector in which most
developing countries have a traditional comparative advantage,
"agriculture".
Agriculture is the single most important sector in many low-income
countries, where a large number of people depending directly or
indirectly on it for their livelihoods. In about two-thirds of the low-income
countries, agriculture accounts for GDP shares of between 30 to 60
percent and about three-fourth of all poor people in the developing world
live in rural areas. Agriculture, thus, represents a key target for any
successful poverty reduction strategy. For instance, promoting
agricultural growth does not only increase farmers income, but it also
94

creates new employment opportunities in the farm and off-farm sectors
and can contribute positively to increased food security on the national
level. In addition, globalization opens up new opportunities in the sense
of providing new markets and inflows of foreign direct investments, but,
at the same time, it also poses important challenges and dangers.
4.3 Poverty and Agro-processing in India
India is a large country, which is characterized by spatially uneven
economic and social development. Poverty is still a widespread problem,
especially in rural areas. More than 44percent of the population has to
live with less than a dollar a day, 2/3 of whom are situated in rural
areas. With a human development index of 0.577, India ranks 124 out of
173 counties in the year of 2005 and in terms of human development,
India shares the same low ranks as many African states.
The data on agriculture indicates that agriculture is an important
economic sector. In 2000, it contributed a quarter of the country's GDP.
In 1998, nearly 2/3 of the population is dependent on agriculture, which
in only a moderate decrease compared to 1970 (71 percent).
Agricultural growth rates were much higher throughout the 1980s
than in the 1990's, but still positive, which is also outcome of increased
farm intensification. The importance of the agricultural sector in also
reflected in the size of agro-based industries. More than 45 percent of all
industries are agro-based, with a value added of nearly 22 percent, food
processing industries account for 16.69 percent of all industries in India.
Traditionally, Indian agriculture is largely an activity of rural areas.
Consequently, India's development efforts focus on strengthening the
village economy as an instrument to increase food security and to reduce
rural poverty and creating new employment opportunities.
In the 1980s increased attention was paid to the promotion of
agro-industries in India. The main argument was that inspite of high
poverty in India, there is an upper middle class of around 80-100 million
population with high demands for processed food products, Rs. 100,000
95
for other industries. Moreover, these figures do not include added
employment generated in agriculture and input supply through
backward linkages. Finally, agro-industry requires less fixed capital and
more working capital compared to other industries. On average, agro
industry annually generates 51 percent value added over fixed capital, as
compared to only 39percent in other industries.
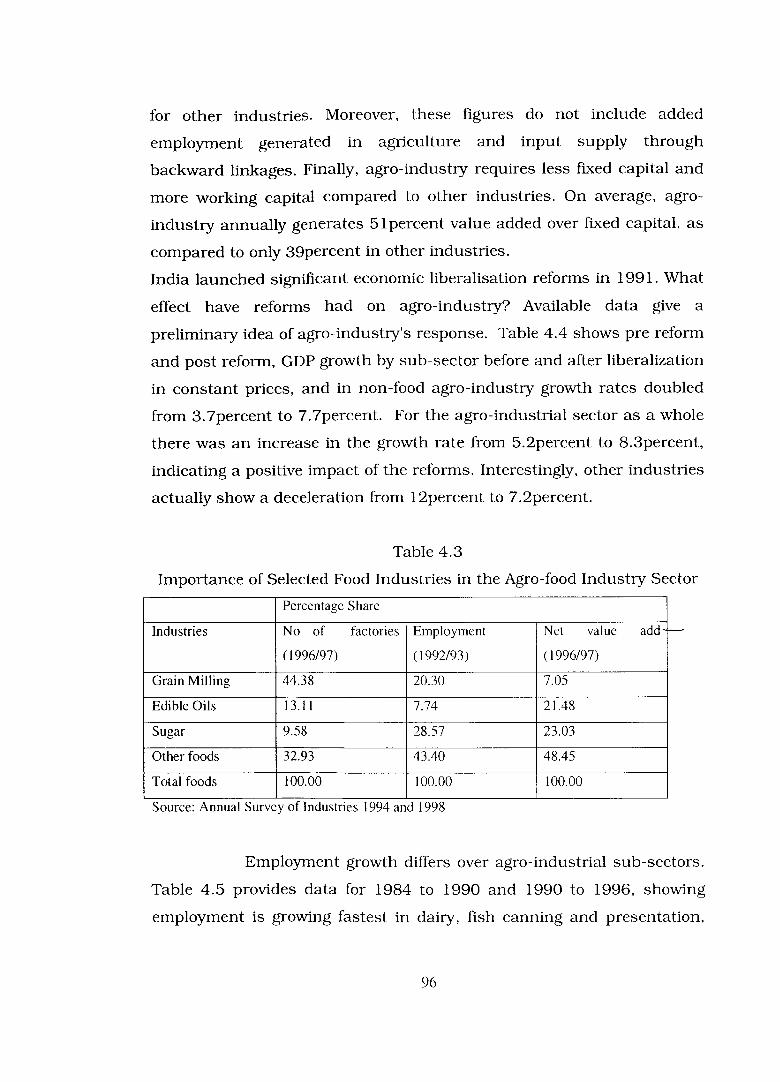
India launched significant economic liberalisation reforms in 1991. What
effect have reforms had on agro-industry? Available data give a
preliminary idea of agro-industry's response. Table 4.4 shows pre reform
and post reform, GDP growth by sub-sector before and after liberalization
in constant prices, and in non-food agro-industry growth rates doubled
from 3.7percent to 7.7percent. For the agro-industrial sector as a whole
there was an increase in the growth rate from 5.2percent to 8.3percent,
indicating a positive impact of the reforms. Interestingly, other industries
actually show a deceleration from 12percent to 7 .2percent.
Table 4.3
Importance of Selected Food Industries in the Agro-food Industry Sector
Percentage Share
Industries No of factories Employment Net value add 1-
(1996/97) (1992/93) ( 1996/97)
Grain Milling 44.38 20.30 7.05
Edible Oils 13.11 7.74 21.48
Sugar 9.58 28.57 23.03
Other foods 32.93 43.40 48.45
Total foods 100.00 100.00 100.00
Source: Annual Survey of Industnes 1994 and 1998
Employment growth differs over agro-industrial sub-sectors.
Table 4.5 provides data for 1984 to 1990 and 1990 to 1996, showing
employment is growing fastest in dairy, fish canning and presentation,
96

edible oils, chocolate, and cashew processing. In aggregate terms, with
some exceptions, a positive trend is evident for food agro-industry
employment in the recent period just before and during early
implementation of the economic reforms. Again this does not include
employment generated in the agriculture/fishery I cattle-rising sectors
through backward demand linkages, which typically adds significantly to
total employment creation in the food chain.
Table 4A
Some Structural And Financial Features Of Agro-Industry In India
Description of Share of Total fixed Emolument percent of Net value
Industry fixed persons Capital per s as a Physical Added
Capital Employed factory percent of working fixed
per (Rs. net Value capital to Capital
Factory million) added invested
( 1996/97) Capital
( 1996/97) (1992/93) (1992/97) (1996/97) (1996/93)
Agro based 4.40 55.60 8.07 45.16 57.24 54.9
Agro based non 13.15 70.82 13.82 49.13 31.30 49.5
Food industries
Total 17.55 65.14 11.73 47.75 41.01 51.3
Agrobased
Industries
Other (nonagro) 82.85 79.96 46.50 35.31 23.39 39.4
industries
All industries 100.00 72.85 30.58 38.21 27.22 41.3
Source: Annual Survey of Industnes 1994 and 1998
Also, it was judged that India had a competitive advantage for processed
foods would contribute more value added to the economy than
unprocessed raw materials. This new interest for agro-based industries
97
to

was accompanied by the gradual and controlled opening of India's
huge internal market for foreign food processors, mainly with the aim of
establishingjoint-ventures and linkages leading to spin -offs for domestic
firms.
Table 4.5
Structural And Financial Features Of Agro-Industry In India
Labour to fixed Capital ratio Materials consumed to value of output
(per Rs. I 00,000) (1996/97)
( 1992/93)
14.83 74.68
14.18 55.57
14.38 64.00
2.98 51.34
4.51 55.03
Source: Annual Survey of Industnes 1994 and 1998
India's agro-industrialization is already more advanced than in
many African countries. As a consequence, skill requirements are more
diverse and also have to take into account the challenges brought about
by the gradual opening of markets.
The role of agriculture in economic development is long debated
issue. From time immemorial there is an emphasis is the literature, on ,_.c::'
the positive linkages between agriculture and industrialization. Three
channels are recognized. First the income elasticity of demand for the
agricultural goods being less than one, an increase in the agricultural
productivity in a closed economy releases labour for manufacturing
employment and thus contributes towards }llOdemization and growth of
the manufacturing sector. Second, higher income raises the demand
for manufacturing products. Third, aggregate savings increase and
finance industrialization.
98

Moreover, these theoretical analyses of the process of development .. have viewed agriculture and industry as two separate sectors in terms of
their characteristics. Apart from the demand side, two sectors are linked
only through the labour market. There is a common pool of labor, which
is allocated between two sectors. However in more recent decades
another prominent sector in a developing economy has emerged,
namely the agro-industry, which directly interfaces with both the
agriculture and industry and thereby provides a link between the two
sectors. This industry, as the name suggest, refers to the subset of
manufacturing that processed raw materials and intermediate products
derived from the agricultural sector. For instance, it transforms products
originating from the agriculture, forestry and fisheries, and processes
them into canned food, beverages, fruit juice, meat and dairy products,
textile and clothing, leather wood and rubber products, animal feed etc.
The relative importance of the agro-industry sector compared to
manufacturing as well as overall GDP, contributes to coverage,
37.6percent of the total manufacturing value added and 30-40percent of
GDP of the developing countries for instance, agro-industries in Asia and
Pacific account for 36percent of the total manufacturing value added.
Data from the annual survey of industries show that 46 percent of all
factories in India are agro-industrial and they contribute 22 percent of
the manufacturing value added.
4.4 ORGANISED AND UNORGANISED FOOD PROCESSING IN
UTTAR PRADESH
Food processing industry has always been an important part of our
industrial set up. Two most important reason that led it to be identified
as the thrust area is its labour intensities and its strong backward
linkages with agriculture and equally important forwards linkages with
modem markets.
Food processing industry comprises of three groups:
99

1. Primary Food Processing
2. Unorganised cottage scale industries
3. Organised processed food industries
The first group was made up predominantly of industries like rice,
pulses, floor chakkies, dal mills and oil mills, beside scores of simple
small scale dehydration and processing industries in rural and semi
urban areas. The small bakeries, pasta food units, traditional food units,
poha making units, fruits, vegetable and spice processing units dominate
the unorganized sector. The organized food processing industry produces
variety of products and contributes significantly in the industrial output.
Organised food processing always formed an important component
of our industrial structure. Table 4.6 brings out the importance of food
processing industry with respect to all industries. Analyzing the table, we
find that after 1990 the share of factories in food processing industry has
come down mainly due to faster growth in the factories in other sectors
than in the F.P.I. However, in the case of proportion of fixed capital in
F.P.I., there was constant increase except in the periods 1995-96 and
1996-97 as some decline is noticed. The average fixed capital per factory
in F.P.I. in 1980s was Rs. 10.81 lakhs which increased to Rs. 22.82
lakhs during 1990s. The proportion of value of output has shown
constant increase with the exception of years 1992-93 and 1995-96. This
increase in the proportion of value of output is significant as there has
been decrease in the proportion of number of factories and increase in
the proportion of fixed capital.
This implies there is greater efficiency with which few larger
factories are operating in the food-processing sector as compared to all
other factories.
Though there has been overall increase in the number of workers
but the growth in employment always lagged behind the growth in fixed
100

capital. With the exception of the year 1996-97 which showed decrease
in number of the factories and number of workers and also low growth in
fixed capital, rest of the period recorded very high growth in the fixed
capital.
Table: 4.6
Food Processing Industry Proportion Of All Industries
Net No. of Fixed No. of No. of Value Value of
Years Factories Capital Workers Employes Added Output
1980-81 17.69 4.04 16.56 16.72 6.11 6.8 1981-82 17.48 3.82 11.5 16.74 7.66 6.53 1982-83 18.37 3.64 15.61 15.41 6.7 6.09 1983-84 18.12 3.94 13.19 12.93 7.31 6.95 1984-85 18.01 3.71 12.74 12.66 7.18 7.16 1985-86 17.55 3.63 13.06 12.8 7.1 7.14 1986-87 17.66 3.74 12.8 12.53 6.86 7.58 1987-88 17.87 3.58 13.11 12.81 6.82 8.27 1988-89 17.86 3.68 13.09 12.84 7.18 8.26 1989-90 17.91 4.35 13.65 13.31 8.43 9.43 1990-91 17.93 4.15 13.82 13.41 6.84 8.69 1991-92 17.56 4.24 13.79 13.37 7.01 8.83 1992-93 17.91 4.16 14.17 13.67 5.71 8.58 1993-94 17.67 4.35 13.98 13.65 6.73 9.85 1994-95 17.18 4.58 13.53 13.25 7.36 9.38 1995-96 17 4.55 13.25 12.8 5.82 8.79 1996-97 16.37 4.44 13.44 13.11 6.71 10.01 1997-98 16.82 5.05 13.82 13.44 6.31 10.08 1998-99 16.99 5.12 13.91 13.12 6.45 10.58 1999-00 17.01 5.23 13.98 13.01 6.87 10.96
Source: Calculated from data prov1ded by Annual Survey of Industnes
Food processing industry in the unorganized sector: It constitutes
significant part of the total food processing. According to approach paper
of Eighth Five Year Plan of Ministry of Food Processing Industry,
unorganized sector constituted about 42 percent of total enterprises in
the food processing sector.
A comparison of unorganized and organized food processing sector
in Table 4. 7 shows the dominance of unorganized sector in terms of both
the number of enterprises and number of employees. However, the
101

number of employees per enterprise in the unorganized sector is much
less as compared to organized sector.
Small number of employees per enterprise invokes some
skepticism as whether unorganized one in the employment generation
but this skepticism is removed to some extent by the fact that an over
whelming large proportion of unorganized manufacturing is concentrated
in terms of own account manufacturing which are more efficient in
generating self-employment than creating large employment.
Another important fact, which comes out from tables 4. 7 and 4.8 is
that there has been constant decrease both in number of enterprises and
number of employees over the period. This decrease in unorganized food
processing is occurring at the time when organized food processing is
growing. This indicates that organized food processing sector may be
driving out the unorganized food processing sector.
Table: 4.7
Unorganized & Organised Food Processing Sector As Percent Of Total
Food Processing Sector
Unorganized sector Organized sector No. No. No. No.
Years Enterprise Employed Enterprise Employed
1984-85 99.47 86.86 0.53 13.14 1989-90 99.25 84.1 0.75 15.9
1994-95 98.13 81.4 1.87 18.6 Source: NSS report No. 363/1, 39611 & 433
The purpose of the study is to analyze the change in food
processing industry in Uttar Pradesh over time. The analysis is on the
basis of the data provided by Annual Survey of Industries for two time
periods i.e. 1990-91 and 2000-01.
Analysing the percentage of the number of factories, fixed capital,
number of workers and the value of output of the food-processing
102

industries to total industries in the state, we find that F.P.I. forms an
important part of the 8.3 percent, indicating a positive impact of the
reforms. Interestingly, other industries actually show a deceleration from
12 percent to 7.2 percent.
0
Table: 4.8
Employees per Enterprise in Unorganized Food Processing Sector
Uttar Pradesh
Years Rural Urban Total 1984-85 2.00 0.485 0.497 1989-90 0.46 0.389 0.445 1994-95 0.437 0.376 0.424
Source: NSS report No. 363/ I, 396/ I & 433
Table: 4.9
Proportion Of Food Processing Industry In Uttar Pradesh As
Percentage Of All India
No. of Factories Fixed Capital No. of Workers Value of Output
Uttar Pradesh 1990-91 2000-01 1990-91 2000-01 1990-91 2000-01 1990-91 2000-01
22.96 22.37 6.82 6.63 26.13 23.14 19.48 15.27
India 17.96 16.97 4.14 5.16 13.85 14.35 13.57 12.77
Source: Calculated from vanous Issues of Annual Survey of Industnes
In terms of distribution of food processing industry, Uttar Pradesh
occupied first position in terms of number of workers employed during
1990-91 and second position in 2000-01 at all-India level. Decrease in
the percentage share of workers in F.P.I of Uttar Pradesh can be
attributed to the decrease in the overall importance of F.P.I in the state.
103

Table: 4.10
Distribution of Food Processing Industry In State As Percen~ Of ~llnd~
No. of Factories Fixed Capital No. of Workers Value of Output
Uttar Pradesh 1990-91 2000-01 1990-91 2000-01 1990-91 2000-01 1990-91 2000-01
12.13 10.40 18.14 13.66 18.62 12.48 14.07 10.58
India 100 100 100 100 100 100 100 100
Source: Calculated from vanous 1ssues of Annual Survey of Industnes
The capital intensity has increased from Rs. 0.343 Lakh in 1990-
91 to Rs. 0.739 lakh in 2000-01which is above the national average of
Rs. 0.352 lakh (1991) and Rs. 0.675 lakh (2001). In the post-reform
period there is tremendous increase in capital intensity. This increase in
capital intensity is accompanied by decrease in the number of workers
(Table 4.9).
Table: 4.11
Productivity In Food Processing Industry
Capital Productivity Labour Productivity (Rs Lakhs)
1990-91 2000-01 1990-91 2000-01
Uttar Pradesh 5.47 5.27 1.88 4.00
India 5.95 7.04 2.48 4.71
Source: Calculated from vanous 1ssues of Annual Survey ot Industnes
8.3percent, indicating a positive impact of the reforms. Interestingly,
other industries actually show a deceleration from 12 percent to 7.2
percent.
The labour productivity is increasing but the capital productivity is
on a decline in Uttar Pradesh while both are increasing at India level.
Increase in labour productivity is due to decrease in number of workers.
104

39%
Composition of Food Processing Sector Share of Factories of Subsectors
(1990-91 )
2% D Meat and Fish Produc ts
1% 10% 11 Fru~s and Vegetables
D Oil: Vegetable and Animal
D Dairy Products
• Grain Milling and Stare h Production
0 Animal Feeds
• Bakery Products
0 Sugar
• Cocoa and related 1% Products
11 Other Food Products
Figure: 4.1
Composition of Food Processing Sector Share of Factories of Subsectors
(2000-01)
1%
2%
53%
Figure: 4.2
105
D Meat and Fish Products
11 Fruits and Vegetables
D Oil: Vegetable and A nirra l
D Dairy Products
• Grain M lling and Starch Production
D A nirra l Feeds
• Bakery Products
D Sugar
• Cocoa and related Products
11 Other Food Products

Composition of Food Processing Sector Share of Fixed Capital of Subsectors
(1990-91)
6%
Figure: 4.3
D flfleat and Rsh Products
• Fruits and Vegetables
D Oil: Vegetable and Anirml
D Dairy Products
• Grain Mlling and Starch Production
D Anirml Feeds
• Bakery Products
D Sugar
• Cocoa and related Products
• Other Food Products
Composition of Food Processing Sector Share of Fixed Capital of Subsectors
(2000-01)
D Meat and FISh Products
• Frurts and Vegetables 10%, 6% 4% o Oil : Vegetable and
Anirml o Dairy Products
• Grain Milling and Starch Production
8% o Anirral Feeds
• Bakery Products
o Sugar
• Cocoa and related Products
3% • Other Food Products
---
Figure: 4.4
106

21%
3%
Composition of Food Processing Sector Share of Output of Sub Sectors
(1990-91 )
1%
Figure: 4.5
0 tv1eat and Fish A-oducts
II Fru~s and Vegetables
0 Oil: Vegetable and Anirral
o Dairy A-oducts
• Grain Mlling and Starch A-oduction
0 Anirral Feeds
• Bakery A-oducts
o Sugar
• Cocoa and related A-oducts
11 Other Food A-oducts
Composition of Food Processing Sector Share of Output of Sub Sectors
(2000-01)
o Meat and Rsh A-oducts
11% 4% 111 Fruits and Vegetables
o Oil: Vegetable and Animal
o Dairy Products
• Grain Mlling and Starch Production
o Animal Feeds
• Bakery Products
o Sugar 22%
• Cocoa and related Products
111 Other Food Products
Figure: 4.6
107

Composition of Food Processing Industry has undergone
significant change in the post reform period .Most of the factories in the
1990-91 were accounted by grain milling about 40 percent of total
number of factories in Food Processing Industry.Sugar and related
products accounted for about 39percent of total factories. However in
terms of fixed capital and value of output, Sugar and allied products
accounted for 65percent and 54percent of the total in Food Processing
Industry respectively. This points out the fact, that large factory
production dominated in manufacturing and refining of sugar. Vegetable
oils and fats and grain milling accounted for 13percent and 1 Opercent of
fixed capital of Food Processing Industry. In terms of Value of output
Sugar and allied product's share is 54percent and Vegetable oil and fats
account for 25percent of total value of output of Food Processing
Industry.
The composition of Food Processing Industry, as shown in Figure
4.1 and 4.2 has undergone change in post reform period, where, new
sectors increased their relative position and old sectors lost their
dominant position. Grain milling maintained its position and the share to
total Food Processing Industry increased from 40 percent to 52 percent.
Oil industry's share increased and attained the second dominant
position. Sugar industry lost its share in number of factories and
accounted for mere 4.6 percent in 2000-01. Though the absolute number
had increased but due to more increase in number of other Food
Processing Industries the share of sugar factories had declined
drastically from 39 percent and to 4 percent. Its share in fixed capital
and value of output has also declined. Similar is the case of oil industry
both in terms of fixed capital and value of output.
Agriculture in Uttar Pradesh forms the backbone of economy. The
Sugar and Oil industry in Uttar Pradesh hold important place in the
agro-industrial sector. These two agro-processing activities are area
... ~ .. 108

specific in the State. Sugar industry is setup right in the vicinity of sugar
cane fields, where as oil ghanis and spillers are set up near the mustard
growing region but the large oil mills are set up near urban areas
(market). The study area is chosen keeping in mind the setting up of
these agro-processing units.
109