Embed Size (px)
Citation preview
114
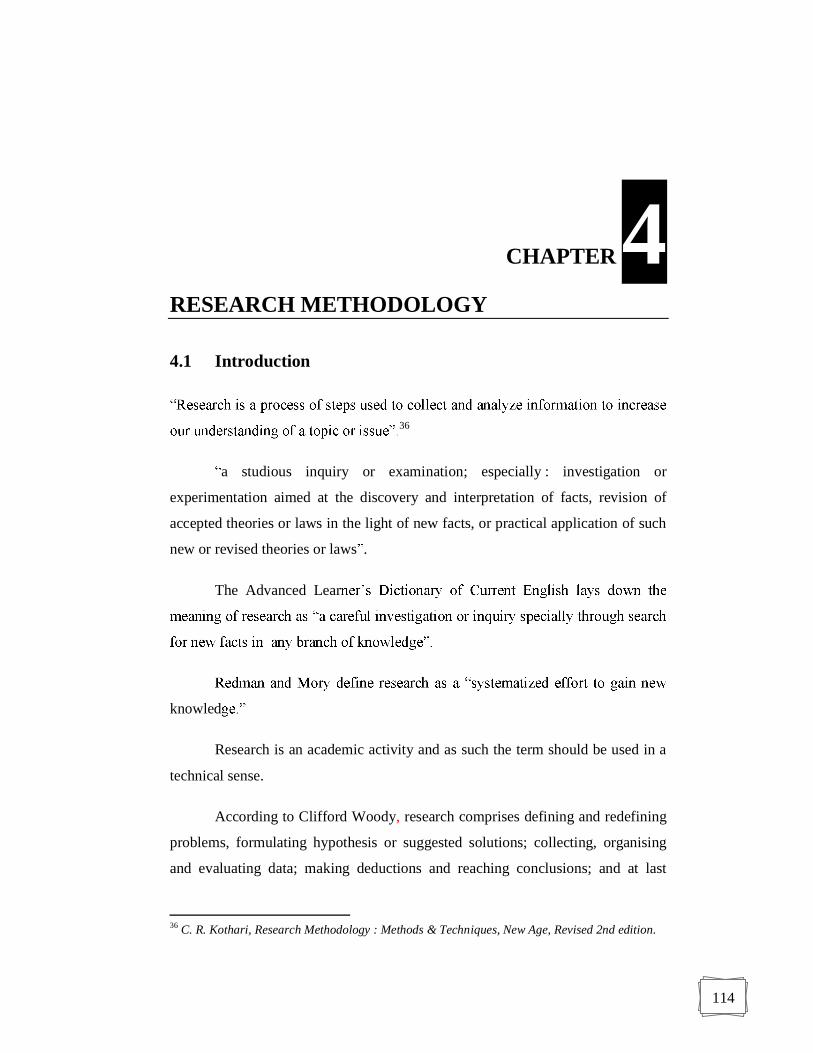
CHAPTER 4
RESEARCH METHODOLOGY
4.1 Introduction
36
a studious inquiry or examination; especially : investigation or
experimentation aimed at the discovery and interpretation of facts, revision of
accepted theories or laws in the light of new facts, or practical application of such
new or revised theories or laws .
The Advanced Lear
knowled
Research is an academic activity and as such the term should be used in a
technical sense.
According to Clifford Woody, research comprises defining and redefining
problems, formulating hypothesis or suggested solutions; collecting, organising
and evaluating data; making deductions and reaching conclusions; and at last
36 C. R. Kothari, Research Methodology : Methods & Techniques, New Age, Revised 2nd edition.
115
carefully testing the conclusions to determine whether they fit the formulating
hypothesis.
Research is, thus, an original contribution to the existing stock of
knowledge making for its advancement. It is the pursuit of truth with the help of
study, observation, comparison and experiment. In short, the search for knowledge
through objective and systematic method of finding solution to a problem is
research. The systematic approach concerning generalisation and the formulation
research
method consisting of enunciating the problem, formulating a hypothesis,
collecting the facts or data, analysing the facts and reaching certain conclusions
either in the form of solutions(s) towards the concerned problem or in certain
generalisations for some theoretical formulation.
The purpose of research is to discover answers to questions through the
application of scientific procedures. The main aim of research is to find out the
truth which is hidden and which has not been discovered as yet. Though each
research study has its own specific purpose, we may think of research objectives
as falling into a number of following broad groupings:
1. To gain familiarity with a phenomenon or to achieve new insights
into it (studies with this object in view are termed as exploratory or
formulative research studies)
2. To portray accurately the characteristics of a particular individual,
situation or a group (studies with this object in view are known as
descriptive research studies)
116
3. To determine the frequency with which something occurs or with
which it is associated with something else (studies with this object
in view are known as diagnostic research studies)
4. To test a hypothesis of a causal relationship between variables (such
studies are known as hypothesis-testing research studies).
Research Methodology is a way of solving the research problem
systematically. Research Method & Research Methodology, these are two
different terms but related terms. Research Method is a part of Research
Methodology.
According to Kotler37 - When we talk of research methodology, we not
only talk of research methods but also consider the logic behind the methods we
use in the context of our research study. We should explain why we are using a
particular method or technique and why we are not using others so that research
results are capable of being evaluated either by the researchers himself or by
others.
Research methodology defines the systematic and scientific procedures
used to arrive at the results and findings for a study against which claims for
knowledge are evaluated (Nachamias et al., 1996; Saunders et al., 2007). A
methodology is therefore shaped by the perspectives the researcher chooses to
approach a study.
37 Kothari, C.R. Research Methodology : Methods and Techniques : Edition : 2nd Reprint : Nov,
2012, New Age International (P) Ltd., Publishers.
117
4.2 Types of Research38
a) Descriptive research & Analytical Research
b) Applied Research & Fundamental Research
c) Quantitative Research & Qualitative Research
d) Conceptual Research & Empirical Research
e) Other research categories Simulative Research, Laboratory Research, Historical research, One Time Research, Longitudinal Research etc.
Descriptive Research It includes survey & fact-finding enquiries of
different kinds. In social Science and business research, quite often the term Ex
post facto research is used for descriptive research studies. The main characteristic
of this method is that the researcher has no control over the variables; researcher
can only report what has happened or what is happening. Such studies also
include attempts by researchers to discover causes even when they cannot control
the variables.
Analytical Research Such type of research uses the information already
available and analyse these to make the further critical evaluation.
Applied Research Applied research aims at finding a solution for an
immediate problem facing a society or an industrial/business organization. This
research is intended for finding some solution to the problem and aimed at certain
conclusions. Research to identify social, economic or political trends that may
affect a particular institution or marketing research or evaluation research are
examples of applied research.
38 Ranjit Kumar, Research Methodology : A Step By Step Guide For Beginners, Pearson, 2nd
edition and Kothari, C.R. Research Methodology : Methods and Techniques : Edition : 2nd Reprint : Nov, 2012, New Age International (P) Ltd., Publishers.
118
Fundamental Research - Pure research, basic research, or fundamental
research is research carried out to increase understanding of fundamental
principles. It is mainly concerned with generalizations and with the formation of a
theory. As its name indicates this type of research is made for performing the
basic or pure research. Pure research generates new ideas, principles and theories,
which may not be immediately utilized; though are the foundations of modern
progress and development in different fields.
Quantitative Research refers to the systematic empirical investigation of
social phenomenan via statistical, mathematical or computational techniques. It is
based on the measurement of some quantity or amount. Quantitative research
including surveys and customer questionnaires can help small firms to improve
their products and services by enabling them to make informed decisions.
Quantitative research is about asking people for their opinions in a structured way
so that you can produce hard facts and statistics to guide you. To get reliable
st
make sure they are a representative sample of your target market.
Qualitative Research is concerned with the quality phenomenon. It is used
to gain an understanding of underlying reasons and motivations. Qualitative
research is a method of inquiry employed in many different academic disciplines,
traditionally in the social sciences, but also in market research and further
contexts. Qualitative researchers aim to gather an in-depth understanding
of human behavior and the reasons that govern such behavior. The qualitative
method investigates the why and how of decision making, not just what, where
and when. Hence, smaller but focused samples are more often needed than large
samples.
119
Conceptual Research is related to some idea or theory or concept. It is
generally used by philosophers and thinkers to develop new concepts or to
reinterpret existing ones.
Empirical Research is data based research coming up with conclusions
which are capable of being verified by observation or experiment.
In this research the main objective is to study the impact of customer care
services on satisfaction of mobile phone subscribers of U.P. (East) circle, so the
various factors related to customer service have been included in this study and
service providers are rated by the subscribers on such factors. Based on
questionnaire and survey conducted, data analysis explains the state of affairs as it
exists with special reference to customer care services, its impact on customer
satisfaction and switching intention of the subscribers. This research not only
describes the performance of mobile service providers of U.P. (East) Circle but
also explores the the major gaps between the expectations of the customers and
actual performance of service providers. So, it is basically a combination of
descriptive and exploratory research.
4.3 Statement of the Problem
With the world economy moving towards a service economy from a product
economy, a new approach to marketing has emerged commonly referred to as
relationship marketing. The relationship marketing approach is based on the fact
that ultimate goal of marketing is not singular exchanges. Alternatively the trust of
marketing should be on exchanges that take place regularly on an ongoing basis
between concerned parties in the market. In order for mobile telecommunication
marketing environment, they need to build a mutual and long term relationship
with their subscribers after the introduction of MNP. For the players in Uttar
120
Pradesh (East) Circle, it is important to understand the need to establish a long
term relationship with customers and to formulate strategies to execute the
concept in the effective manner for their long term survival in competitive
environment.
An important consequence of customer satisfaction might be customer
retention. Firms will not be able to retain their customers without satisfying them.
In telecom industry, customer retention determines the success and survival of
mobile service providers (Wong, 2010; Mittal & Kamakura, 2001; Leelakulthanet
& Hongcharu, 2011). This might be due to fierce competition, the high cost of
attracting new customers, and the similarity of services offered by the operators
(Neslin, Gupta, Kamakura, Lu, & Mason, 2006; Kim & Yoon, 2004). In order to
secure customer satisfaction, organizations must identify the determinants of
customer satisfaction and dissatisfaction (Motley, 2003).39
This study aims to investigate the factors influencing satisfaction, status of
the satisfaction of subscribers with services offered by mobile telecommunication
service providers in U.P.(East) circle and to analyse the switching intention of the
subscribers.
The mobile communication industry, which has been the driving force
behind the development of country as a great power in the information and
communication industry, has a great influence on the domestic economy.
Therefore, this study is intended to examine factors affecting the customer
satisfaction, the relationship between the satisfaction/dissatisfaction and the
switching intention of subscribers and to evaluate the performance of service
providers in highly competitive environment in U.P.(East) circle.
39 Mohammed M. Almossawi1. Customer Satisfaction in the Mobile Telecom Industry in Bahrain:
Antecedents and Consequences, International Journal of Marketing Studies, Vol. 4, No. 6; 2012.
121
4.4 Objectives of the Study
The present study has been made keeping into consideration the following
objectives:
1. To identify the various issues related to customer service and its
quality.
2. To analyse and compare the services offered by the mobile phone
service providers.
3. To explore various complaints of the customers and to advocate
customer centric strategies for service providers.
4. To identify the gaps between expectations of the subscribers and
the performance of the service providers.
5. To study and analyse the impact of customer care services on the
customer satisfaction.
6. To identify the reasons for switching intention of mobile phone
subscribers.
4.5 Hypotheses of Study
Hypothesis is usually considered as the principal instrument in research. Decision
makers often face situations wherein they are interested in testing hypothesis on
the basis of available information and then take decisions on the basis of such
testing. In social science, where direct knowledge of population parameter(s) is
rare, hypothesis testing is often used strategy for deciding whether a sample data
offer such support for a hypothesis that generalization can be made.40
40 http://e-university.wisdomjobs.com/research-methodology/chapter-1859-355/testing-of-
hypotheses-i-parametric-or-standard-tests-of-hypotheses.html
122
For a researcher hypothesis is a formal question that he intends to resolve.
Thus a hypothesis may be defined as a proposition or a set of proposition set forth
as an explanation for the occurrence of some specified group of phenomenon
either asserted merely as a provisional conjecture to guide some investigation or
accepted as highly probable in the light of established facts.41
Considering the research objectives cited above and the review of
literature, the following null hypotheses were set:
H01: There is no impact of customer care services on overall satisfaction
of the mobile phone subscribers.
H02: There is no relationship between overall satisfaction and switching
intention of the subscribers.
H03: There is no relationship between satisfaction with effectiveness of
the network and switching intention of the mobile phone
subscribers.
H04: There is no relationship between the call charges and switching
intention of the mobile phone subscribers
H05: There is no relationship between satisfaction with multimedia/value
added services and switching intention of the mobile phone
subscribers.
4.6 Research Methodology Used
Research Methodology defines systematic and scientific procedures used to arrive
at the results and findings for a study against which claims for knowledge are
41 dictionary.reference.com/browse/hypothesis
123
evaluated. A methodology is therefore shaped by perspectives the research
chooses to approach to study.
This research is basically descriptive as well as exploratory in nature and
includes surveys and fact-finding inquiries of different kinds. The major purpose
of descriptive research is to describe the state of affairs as it exists at present. This
study describes the performance of mobile service providers of U.P. (East) circle
with special refernce to customer care services, its impact on the satisfaction of
the subscribers and the role MNP is playing in this circle.
The rationale behind exploratory research design is the objective of the
study i.e to identify customer satisfaction as well as to identify the gaps between
the expectations of the customers and actual performance of the service providers.
The researcher want to explore the amount and nature of gap (if any).
Considering the objectives of the research, a structured questionnaire was
designed which is divided into four sections. Care was taken to see that language
used was simple, scientific and easy to understand. Special care was taken to see
that no items were repeated. For the purpose of assuring the correctness of the
questionnaire a pilot study i.e. a preliminary piece of research was conducted with
a sample size of 100. Special care was taken to ensure that respondents should be
from various age/income/profession groups as mentioned in the questionnaire and
from the various locations of the four major cities of U.P. (East) circle. Few
changes in the questionnaire were made after the pilot survey and it was decided
to again conduct a pilot survey by using redesigned questionnaire. No major
difficulties were faced while collecting the data for pilot study using the new
questionnaire. The collected data were analyzed by using SPSS. It was found that
the questionnaire is reliable and it is helpful in achieving the objectives of the
research.
124
A sample design is a definite plan for obtaining a sample from a given
population.42 It refers to the technique or the procedure the researcher adopts in
selecting items for the sample. For sample selection, the researcher used non
probability sampling i.e. basically Judgemental Sampling to ensure true
representation of mobile phone subscribers of U.P. (East) Circle. Judgmental
sampling is applied considering the nature of the study and to include subscribers
of varying characteristics and availing the services of service providers of U.P.
(East) Circle . The researcher collected the primary data from the four major cities
of U.P. (East) Circle i.e. Lucknow, Kanpur, Allahabad and Varanasi. Total 600
respondents i.e. 150 mobile phone subscribers from each city participated in the
study. In order to ensure the true representaions of mobile phone subscribers, the
researcher selected the different loactions/areas in each city and then collected the
data from such locations/areas.
Considering the nature of research, it was decided to collect data from
primary as well as secondary sources. Primary Data refers to the data collected
through structured questionnaire/ personal interviews with subscribers of mobile
phone services offered by various telecom companies. Data provided by the
various Telecommunications Players, Government agencies and Regulatory body,
published material, data through websites in connection to mobile phone services
refer to secondary data.
Likert scale is used as the measurement scale. Likert Scale is a rating scale
used for measuring the strength of respondent agreement with a clear statement on
five point ratings. Customer satisfaction measurement is done in this research
using Likert scaling technique.43
42 http://www.articlesbase.com/marketing-articles/sample-design-and-criteria-of-selecting-a-
sampling-procedure-5738878.html 43 Measurement and Scaling in Marketing Research; /http://www.sagepub.com/upm-
data/4553_Smith_Chp_10.pdf
125
For this customer survey, the researcher used the five-point scale: Highly
Dissatisfied, Dissatisfied, Neutral, Satisfied, Highly Satisfied i.e., 1 for Highly
Dissatisfied, 2 for Dissatisfied, 3 for Neutral, 4 for Satisfied and 5 for Highly
Satisfied f of
the network, billing/call charges, multimedia/value added services and finally
overall satisfaction. Similarly to analyze subscribers level of satisfaction with
reference to customer care services - five-point scale was used in such a way that
1 for much worse than expected, 2 for worse than expected, 3 for equal to
expectations, 4 for better than expected and 5 for much better than expected were
used. In addition to other questions, each respondent is asked to rate each item on
some response scale.
4.7 Research Process
a) Research Design: Descriptive & Exploratory research.
b) Sources of Data: Primary and secondary sources of data are used.
Primary Data Data collected through structured questionnaire/
personal interviews with subscribers of mobile phone services in
U.P. (East) Circle. It is basically an empirical study by field survey
Method.
Secondary Data Data provided by the various
Telecommunications Players, Government agencies and
Regulatory body, published material, data through websites in
connection to mobile phone services.
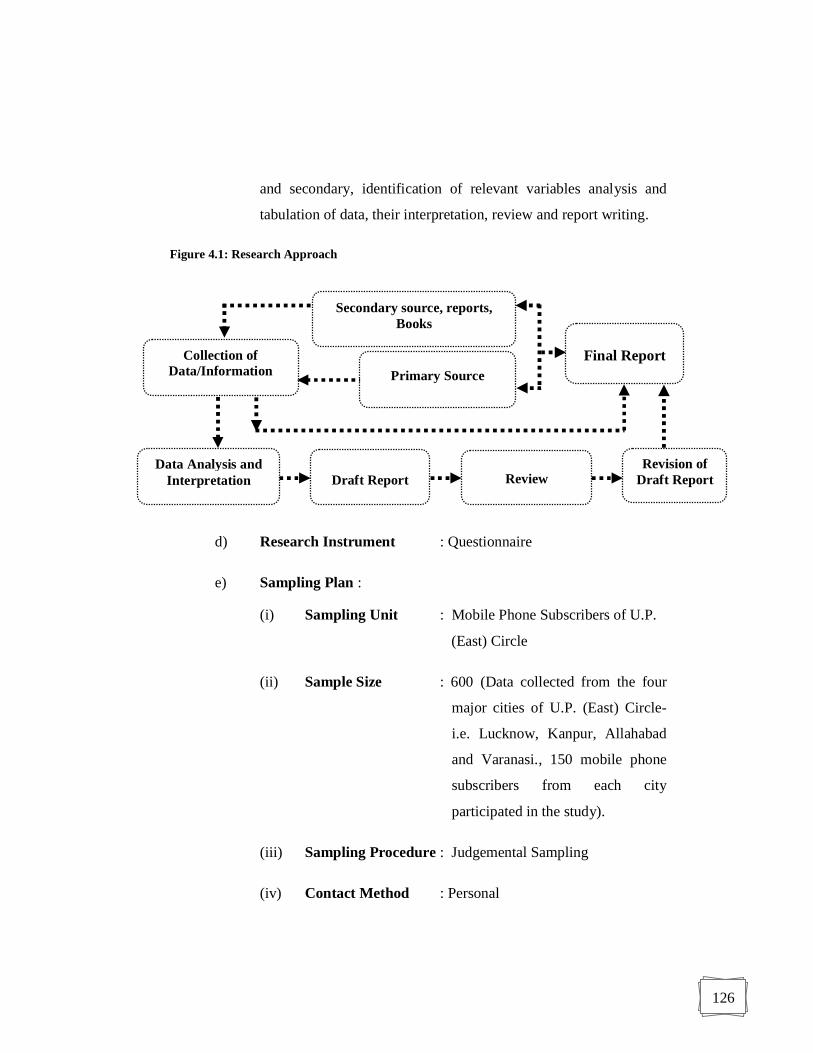
c) Research Approach :
The study design as depicted diagrammatically in below mentioned
figure 4.1 includes sources of data collection from both primary
126
and secondary, identification of relevant variables analysis and
tabulation of data, their interpretation, review and report writing.
Figure 4.1: Research Approach
d) Research Instrument : Questionnaire
e) Sampling Plan :
(i) Sampling Unit : Mobile Phone Subscribers of U.P.
(East) Circle
(ii) Sample Size : 600 (Data collected from the four
major cities of U.P. (East) Circle-
i.e. Lucknow, Kanpur, Allahabad
and Varanasi., 150 mobile phone
subscribers from each city
participated in the study).
(iii) Sampling Procedure : Judgemental Sampling
(iv) Contact Method : Personal
Secondary source, reports, Books
Primary Source Collection of
Data/Information
Data Analysis and Interpretation Draft Report
Review
Revision of Draft Report
Final Report
127
The proposed study is based on primary as well as secondary data. For the
purpose of primary data collection, we selected four major cities of Uttar Pradesh
East circle i.e. Lucknow, Varanasi, Allahabad and Kanpur. The rationale behind
selecting these cities is that these are the major cities of U.P. (East) circle and
sufficient enough to represent the whole U.P. (East) circle.
For the determination of sample size, following formula is used:
Where p represents the proportion of satisfied customers, z is the standard
normal variate with a desired level of satisfaction and E is the maximum amount
of permissible error.
We determine sample size on the basis of following assumptions:
1. The proportion of satisfied mobile phone subscribers is
approximately same as proportion of dissatisfied mobile phone
subscribers.
2. The maximum amount of permissible error is 4 per cent i.e. the
actual proportion would be lie in ± 4 per cent level of the estimated
level.
3. The confidence level is 95 per cent i.e. level of significance is 5 per
cent.
On the basis of above assumptions, the values of p and E are comes out to
be 0.50 and 0.04 respectively and with 95 per cent of confidence level, the value
of z comes out to be 1.96 (from table). The desired sample size comes out be 600.
Since we are targeting 4 major cities, the sample size for each city would be 150.
128
4.8 Tools & Techniques used for Data Analysis
It includes the various statistical tools & techniques. Statistical tools help in
analyzing the data and the data analysis is helpful in drawing conclusions.
Statistical tools are used mainly, to study the relationship between the variables
and to perform the hypothesis testing.
4.8.1 Chi-Square Test
The chi-square test is an important test amongst the several tests of significance
developed by statisticians and is used to show the relationship between categorical
data. Cross tabulation is used as a basis for performing the Chi-Square test. Chi-
Square test is a non-parametric analysis and an important test to perform the
hypothesis testing. Chi-Square test is applicable in large number of problems. Chi
square testing is used to measure the difference between what is observed and
what is expected. Advantages of using this method are that it can test for
association between two or more variables and it allows you to tell if there is a
difference between observed and expected results. The research study used
computer with software i.e., SPSS 16. SPSS is used for the cross tabulation,
factor analysis, chi-square testing, to draw several graphs & frequency distribution
tables.
To test these hypotheses, we used chi-square ( 2) distribution. In
probability theory and statistics, the chi-squared distribution (also chi- -
distribution) with k degrees of freedom is the distribution of a sum of the squares
of k independent standard normal random variables. It is one of the most widely
used probability distributions in inferential statistics. Generally, the chi-squared
distribution is used in the following three conditions:
1. Goodness of Fit of an observed distribution to a theoretical one;
129
2. The independence of two criteria of classification of qualitative
data; and
3. In confidence interval estimation for a population standard
deviation of a normal distribution from a sample standard
deviation.
Since all hypotheses come under the second condition of above mentioned
conditions, we used chi square distribution to test all the hypotheses.
4.8.2 Factor Analysis
Factor Analysis is a method of reducing data complexity by reducing the number
of variables being studied. The first stage of factor analysis involves factor
extraction where our objective is to identify how many factors will be extracted
from the data. It is a technique applicable when there is a systematic
interdependence among a set of observed or manifest variables and the researcher
is interested in finding out something more fundamental or latent which creates
this commonality. Considering its importance, in the data analysis chapter, there is
a section on factor analysis with reference to customer care services and quality
dimensions.
4.9 Key Stages in Research
Research process consists of series of actions or steps necessary to effectively
carry out research and desired sequencing of these steps. Various steps involved in
a research process are not mutually exclusive; nor are they separate and distinct.
They do not necessarily follow each other in any specific order and the researcher
has to be constantly anticipating at each step in the research process the
130
requirements of the subsequent steps. A brief description of the key stages is
mentioned below:
4.9.1 Questionnaire Design
For achieving the objectives of the research, a questionnaire was designed which
is divided into four sections i.e. Section-A, Section-B, Section- C and Section-D.
Section-A refers to identification of the mobile subscribers/respondents. It
explains the characteristics of the mobile subscribers/respondents - name, place,
gender, age, profession, monthly income, name of the service provider, duration
of services, monthly expenses on services etc.
Section-B refers to various problems faced by mobile subscribers/
respondents. It is divided into three parts.
Section-B part 1 is based on the various issues related to effectiveness of
the network/connectivity.
Section-B part 2 refers to various issues related to satisfaction level of
mobile subscribers with special reference to call charges, tariff plans/billing etc.
Section-B part 3 refers to various issues related to satisfaction level of
mobile subscribers with special reference to multimedia/value added services.
Section-C is designed to study the satisfaction level of mobile subscribers
with reference to the customer care services/quality dimensions and its overall
impact on rating of their respective service providers.
Section-D is designed to study the level of overall satisfaction of the
mobile phone subscribers with their service providers, awareness level about
MNP, their switching intention and the reasons for their switching intention and
name of the new service provider in case of switching intention.
131
4.9.2 Variables Used
A variable is an object, event, idea, feeling, time period, or any other type of
category you are trying to measure. Variable is some concept that can be
measured.
Variable is a rational unit of
that is capable of measurement and hence capable of taking on different values.
Kerlinger defined that a variable is a property that takes on different
values. Putting it redundantly, a variable is something that varies. A variable is a
symbol to which numerals or values are attached.
There are two types of variables - independent and dependent.
An independent variable is exactly what it sounds like. It is a variable that
stands alone and isn't changed by the other variables you are trying to measure.
For example, someone's age might be an independent variable. Other factors
aren t going to change a person's age. In fact, when you are looking for some kind
of relationship between variables you are trying to see if the independent variable
causes some kind of change in the other variables, or dependent variables.
Just like an independent variable, a dependent variable is exactly what it
sounds like. It is something that depends on other factors. For example, a test
score could be a dependent variable because it could change depending on several
factors such as how much you studied, how much sleep you got the night before
you took the test, or even how hungry you were when you took it. Usually when
132
you are looking for a relationship between two things you are trying to find out
what makes the dependent variable change the way it does.
(Independent variable) causes a change in (Dependent Variable) and it isn't
possible that (Dependent Variable) could cause a change in (Independent
Variable).
Variables need to be understood clearly in order to measure any concept.
This research study covers different types of variables related to service quality
parameters. These variables are classified into three broad categories:
(1) Dependent Variables
(2) Independent Variables
(3) Intervening Variables / Extraneous Variables
4.9.2.1 Dependent Variables
These are the effect variables whose value depends upon some causal
characteristics. In this study customer satisfaction and switching intention of
mobile phone subscribers are defined as the dependent variable. Dependent
variable can be measured with the help of Independent Variables & Extraneous
Variables.
4.9.2.2 Independent Variables
These are the variables, which are responsible for bringing out any changes on the
dependent variable. It is a fact that customer satisfaction is dependent on various
service attributes. The major service areas such as Customer Care, effectiveness of
133
the network, billing/call charges and multimedia/value added services are
independent variables in this study.
4.9.2.3 Intervening/Extraneous Variables
To measure the relationship of dependent variable with independent variables
many times we have to measure some independent variables, which may affect the
relationship positively or negatively. Such variables are called as intervening &
extraneous variables. When it becomes mandatory to measure such variables to
establish the relationship then they are called as intervening variables. To measure
the satisfaction with network, billing/call charges and multimedia/value added
services various variables/parameters are used. Such variables, which need to be
measured to show the relationship between dependent & independent variables,
are called as Intervening variables.
Extraneous variables are those variables, which may affect the dependent
variable. Such variables may not cause any change directly to the dependent
variable but if measured can give some effect on the dependent variable. The
customer perception is an extraneous variable which if considered may cause
changes to the customer satisfaction level for mobile services. Perception is
dynamic and changes from person to person. A demographic variable also belongs
to extraneous type of variable.
4.9.3 Pre Testing and Reliability of the Questionnaire
The following steps were also taken to ensure valid and reliable data collection
and analysis process:
Use terms that would be easily understood by the respondents
without being ambiguous.
134
Matching the measurement scale with the type of question, its
purpose and the analysis need.
Instead of starting the questionnaire straight away a brief
introduction of the study was given to ensure better participation
and involvement from the respondents.
Avoid social desirability bias.
A request tone was introduced in the questionnaire to ensure
greater willingness of the respondents.
The questions were arranged in such a manner that there was a
balance maintained between heavy and light questions
Pre-testing was carried out for the questionnaire to identify and
eliminate potential problems.
Reliability refers to whether a measurement instrument is able to yield
consistent results each time it is applied. It is the property of a measurement
device that causes it to yield similar outcome or results for similar inputs.
Statistically, reliability is defined as the percentage of the inconsistency in the
responses to the survey that is the result of differences in the respondents.
This implies that responses to a reliable survey will vary because respondents
have different opinions, not because the questionnaire items are confusing or
ambiguous.
In this study the pilot test was conducted to strengthen its reliability of the
questionnaire and the value was found 0.8 i.e., the widely
accepted limit for high reliability test.
135
4.9.4 Specifying the Data Needs and Data Collection
In order to achieve the objectives of the research, the researcher obtained the
required information through collection of primary and secondary data by
focusing on below mentioned strategy:
For collection of primary data a questionnaire was designed which is
divided into four sections as explained above. It is the data directly collected by
the researcher from the four major cities of U.P. (East) Circle- i.e. Varanasi,
Kanpur, Lucknow and Allahabad.150 mobile phone subscribers from each city
participated in the study.
Secondary source of data is defined as that data which has already been
collected by someone else, published or defined somewhere else. During the
research if the researcher is extracting the desired information from sources
considered as reliable for the purpose of study then, such sources are referred as
the secondary source of data. Researcher has referred several secondary sources
during this study which include government publication, reports of TRAI, Cellular
Operators Association in India, websites, journals, earlier research work done by
other researchers in the related area etc. It was decided that the collected data
would be analyzed both descriptively and statistically.
4.9.5 Data Analysis
Researcher used several statistical tools during the data analysis to study the
relationship between the variables and to perform the hypothesis testing.
Considering the sample size of study, objectives and other factors, the Chi Square
testing as a statistical tool is used.The research study uses: Computer with
software SPSS 16. SPSS is used for the cross tabulation, chi-square testing, factor
analysis and to draw several bar graphs & frequency distribution charts & tables.
136
4.10 Limitations of the Study
1. The research is only limited in U.P (East) Circle. Therefore the
findings of the study cannot be generalized for the whole
population of mobile phone users in India or not applicable for the
other telecom circles of India.
2. The sample size is small as compared to mobile phone subscribers
in U.P (East) Circle.
3. Considering the number of mobile phone subscribers, U.P. (East)
Circle is very large but time constraint did not also allow us to use
a larger sample from all the districts of this circle.
4. Since the study was an industry-wide study, all attributes and
characteristics of telecommunication service providers related to
customer care and customer satisfaction could not be used and
emphasized upon.
4.11 Conclusion
This chapter discussed a detailed description of the research methodology used in
the current study. It provided the blueprint for finding answers to the research
problems. Five hypotheses were developed on the basis of the literature review.
Research methodology covered all the key areas such as research design,
sampling, sample size, questionnaire design and data collection. Based on the
methodology, the procedures of data analysis and statistical techniques chosen for
the analyses were also outlined. It also discussed the approaches used and the
steps taken, as well as the enhancement of the reliability of the methods applied.
The next chapter proceeds with analysis of the collected data.