Embed Size (px)
Citation preview

1/27/2018
1
1
12Multiple Linear Regression
12-1 Multiple Linear Regression Model12-1.1 Introduction12-1.2 Least squares estimation of the
parameters12-1.3 Matrix approach to multiple linear
regression12-1.4 Properties of the least squares estimators
12-2 Hypothesis Tests in Multiple Linear Regression
12-2.1 Test for significance of regression12-2.2 Tests on individual regression coefficients
& subsets of coefficients
12-3 Confidence Intervals in Multiple Linear Regression
12-4.1 Use of t-tests12-3.2 Confidence interval on the mean response
12-4 Prediction of New Observations12-5 Model Adequacy Checking
12-5.1 Residual analysis12-5.2 Influential observations
12-6 Aspects of Multiple Regression Modeling
12-6.1 Polynomial regression models12-6.2 Categorical regressors & indicator
variables12-6.3 Selection of variables & model building12-6.4 Multicollinearity
CHAPTER OUTLINE
© John Wiley & Sons, Inc. Applied Statistics and Probability for Engineers, by Montgomery and Runger.
Learning Objectives for Chapter 12
After careful study of this chapter, you should be able to do the following:
1. Use multiple regression techniques to build empirical models to engineering and scientific data.
2. Understand how the method of least squares extends to fitting multiple regression models.
3. Assess regression model adequacy.
4. Test hypotheses and construct confidence intervals on the regression coefficients.
5. Use the regression model to estimate the mean response, and to make predictions and to construct confidence intervals and prediction intervals.
6. Build regression models with polynomial terms.
7. Use indicator variables to model categorical regressors.
8. Use stepwise regression and other model building techniques to select the appropriate set of variables for a regression model.
2

1/27/2018
2
© John Wiley & Sons, Inc. Applied Statistics and Probability for Engineers, by Montgomery and Runger.
12-1: Multiple Linear Regression Models
• Many applications of regression analysis involve
situations in which there are more than one
regressor variable.
•A regression model that contains more than one
regressor variable is called a multiple regression
model.
12-1.1 Introduction
3
© John Wiley & Sons, Inc. Applied Statistics and Probability for Engineers, by Montgomery and Runger.
12-1: Multiple Linear Regression Models
• For example, suppose that the effective life of a cutting
tool depends on the cutting speed and the tool angle. A
possible multiple regression model could be
where
Y – tool life
x1 – cutting speed
x2 – tool angle
12-1.1 Introduction
4

1/27/2018
3
© John Wiley & Sons, Inc. Applied Statistics and Probability for Engineers, by Montgomery and Runger.
12-1: Multiple Linear Regression Models
Figure 12-1 (a) The regression plane for the model E(Y) = 50 + 10x1 + 7x2. (b) The contour plot
12-1.1 Introduction
5
© John Wiley & Sons, Inc. Applied Statistics and Probability for Engineers, by Montgomery and Runger.
12-1: Multiple Linear Regression Models
12-1.1 Introduction
6

1/27/2018
4
© John Wiley & Sons, Inc. Applied Statistics and Probability for Engineers, by Montgomery and Runger.
12-1: Multiple Linear Regression Models
Figure 12-2 (a) Three-dimensional plot of the regression model E(Y) = 50 + 10x1 + 7x2 + 5x1x2. (b) The contour plot
12-1.1 Introduction
7
© John Wiley & Sons, Inc. Applied Statistics and Probability for Engineers, by Montgomery and Runger.
12-1: Multiple Linear Regression Models
Figure 12-3 (a) Three-dimensional plot of the regression model E(Y) = 800 + 10x1 + 7x2 – 8.5x1
2 – 5x22 +
4x1x2. (b) The contour plot
12-1.1 Introduction
8

1/27/2018
5
© John Wiley & Sons, Inc. Applied Statistics and Probability for Engineers, by Montgomery and Runger.
12-1: Multiple Linear Regression Models
12-1.2 Least Squares Estimation of the Parameters
9
© John Wiley & Sons, Inc. Applied Statistics and Probability for Engineers, by Montgomery and Runger.
12-1: Multiple Linear Regression Models
12-1.2 Least Squares Estimation of the Parameters
• The least squares function is given by
• The least squares estimates must satisfy
10

1/27/2018
6
© John Wiley & Sons, Inc. Applied Statistics and Probability for Engineers, by Montgomery and Runger.
12-1: Multiple Linear Regression Models
12-1.2 Least Squares Estimation of the Parameters
• The solution to the normal Equations are the least
squares estimators of the regression coefficients.
• The least squares normal Equations are
11
© John Wiley & Sons, Inc. Applied Statistics and Probability for Engineers, by Montgomery and Runger.
12-1: Multiple Linear Regression Models
Example 12-1
12

1/27/2018
7
© John Wiley & Sons, Inc. Applied Statistics and Probability for Engineers, by Montgomery and Runger.
12-1: Multiple Linear Regression Models
Example 12-1
13
© John Wiley & Sons, Inc. Applied Statistics and Probability for Engineers, by Montgomery and Runger.
12-1: Multiple Linear Regression Models
Figure 12-4 Matrix of scatter plots (from Minitab) for the wire bond pull strength data in Table 12-2.
14

1/27/2018
8
© John Wiley & Sons, Inc. Applied Statistics and Probability for Engineers, by Montgomery and Runger.
12-1: Multiple Linear Regression Models
Example 12-1
15
© John Wiley & Sons, Inc. Applied Statistics and Probability for Engineers, by Montgomery and Runger.
12-1: Multiple Linear Regression Models
Example 12-1
16

1/27/2018
9
© John Wiley & Sons, Inc. Applied Statistics and Probability for Engineers, by Montgomery and Runger.
12-1: Multiple Linear Regression Models
Example 12-1
17
© John Wiley & Sons, Inc. Applied Statistics and Probability for Engineers, by Montgomery and Runger.
12-1: Multiple Linear Regression Models
12-1.3 Matrix Approach to Multiple Linear Regression
Suppose the model relating the regressors to the
response is
In matrix notation this model can be written as
18

1/27/2018
10
© John Wiley & Sons, Inc. Applied Statistics and Probability for Engineers, by Montgomery and Runger.
12-1: Multiple Linear Regression Models
12-1.3 Matrix Approach to Multiple Linear Regression
where
19
© John Wiley & Sons, Inc. Applied Statistics and Probability for Engineers, by Montgomery and Runger.
12-1: Multiple Linear Regression Models
12-1.3 Matrix Approach to Multiple Linear Regression
We wish to find the vector of least squares
estimators that minimizes:
The resulting least squares estimate is
20

1/27/2018
11
© John Wiley & Sons, Inc. Applied Statistics and Probability for Engineers, by Montgomery and Runger.
12-1: Multiple Linear Regression Models
12-1.3 Matrix Approach to Multiple Linear Regression
21
© John Wiley & Sons, Inc. Applied Statistics and Probability for Engineers, by Montgomery and Runger.
12-1: Multiple Linear Regression Models
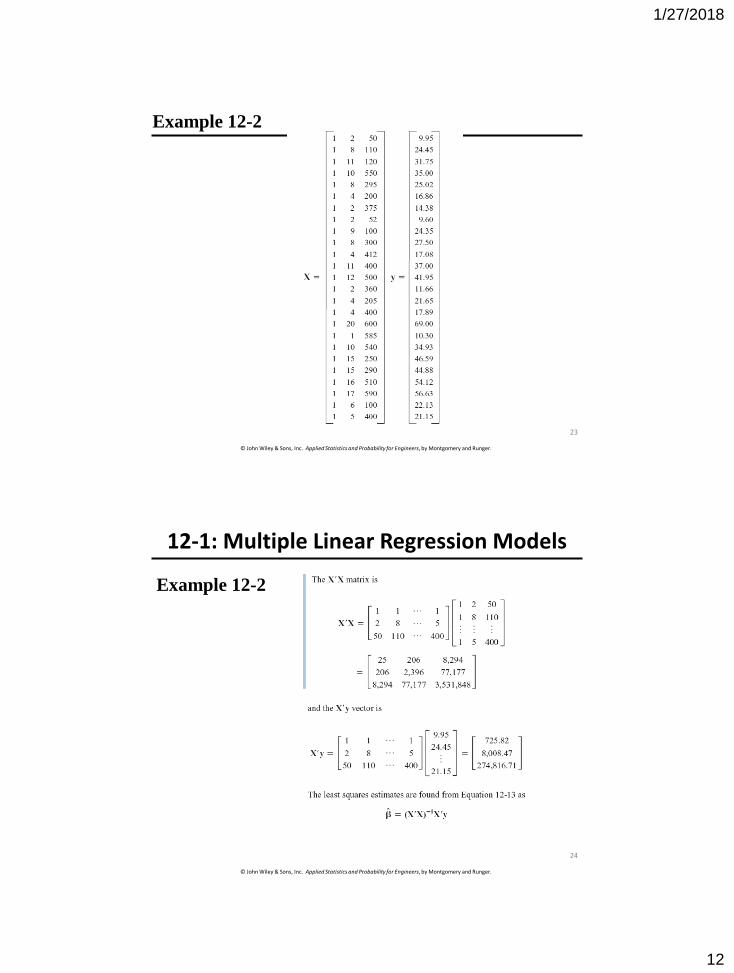
Example 12-2
22
1/27/2018
12
© John Wiley & Sons, Inc. Applied Statistics and Probability for Engineers, by Montgomery and Runger.
Example 12-2
23
© John Wiley & Sons, Inc. Applied Statistics and Probability for Engineers, by Montgomery and Runger.
12-1: Multiple Linear Regression Models
Example 12-2
24

1/27/2018
13
© John Wiley & Sons, Inc. Applied Statistics and Probability for Engineers, by Montgomery and Runger.
12-1: Multiple Linear Regression Models
Example 12-2
25
© John Wiley & Sons, Inc. Applied Statistics and Probability for Engineers, by Montgomery and Runger.
12-1: Multiple Linear Regression Models
Example 12-2
26

1/27/2018
14
© John Wiley & Sons, Inc. Applied Statistics and Probability for Engineers, by Montgomery and Runger.
12-1: Multiple Linear Regression Models
Example 12-2
27
© John Wiley & Sons, Inc. Applied Statistics and Probability for Engineers, by Montgomery and Runger.
28

1/27/2018
15
© John Wiley & Sons, Inc. Applied Statistics and Probability for Engineers, by Montgomery and Runger.
12-1: Multiple Linear Regression Models
Estimating 2
An unbiased estimator of 2 is
29
© John Wiley & Sons, Inc. Applied Statistics and Probability for Engineers, by Montgomery and Runger.
12-1: Multiple Linear Regression Models
12-1.4 Properties of the Least Squares Estimators
Unbiased estimators:
Covariance Matrix:
30

1/27/2018
16
© John Wiley & Sons, Inc. Applied Statistics and Probability for Engineers, by Montgomery and Runger.
12-1: Multiple Linear Regression Models
12-1.4 Properties of the Least Squares Estimators
Individual variances and covariances:
In general,
31
© John Wiley & Sons, Inc. Applied Statistics and Probability for Engineers, by Montgomery and Runger.
12-2: Hypothesis Tests in Multiple Linear Regression
12-2.1 Test for Significance of Regression
The appropriate hypotheses are
The test statistic is
32

1/27/2018
17
© John Wiley & Sons, Inc. Applied Statistics and Probability for Engineers, by Montgomery and Runger.
12-2: Hypothesis Tests in Multiple Linear Regression
12-2.1 Test for Significance of Regression
33
© John Wiley & Sons, Inc. Applied Statistics and Probability for Engineers, by Montgomery and Runger.
12-2: Hypothesis Tests in Multiple Linear Regression
Example 12-3
34

1/27/2018
18
© John Wiley & Sons, Inc. Applied Statistics and Probability for Engineers, by Montgomery and Runger.
12-2: Hypothesis Tests in Multiple Linear Regression
Example 12-3
35
© John Wiley & Sons, Inc. Applied Statistics and Probability for Engineers, by Montgomery and Runger.
12-2: Hypothesis Tests in Multiple Linear Regression
Example 12-3
36

1/27/2018
19
© John Wiley & Sons, Inc. Applied Statistics and Probability for Engineers, by Montgomery and Runger.
12-2: Hypothesis Tests in Multiple Linear Regression
Example 12-3
37
© John Wiley & Sons, Inc. Applied Statistics and Probability for Engineers, by Montgomery and Runger.
12-2: Hypothesis Tests in Multiple Linear Regression
R2 and Adjusted R2
The coefficient of multiple determination
• For the wire bond pull strength data, we find that R2 =
SSR/SST = 5990.7712/6105.9447 = 0.9811.
• Thus, the model accounts for about 98% of the
variability in the pull strength response.
38

1/27/2018
20
© John Wiley & Sons, Inc. Applied Statistics and Probability for Engineers, by Montgomery and Runger.
12-2: Hypothesis Tests in Multiple Linear Regression
R2 and Adjusted R2
The adjusted R2 is
• The adjusted R2 statistic penalizes the analyst for
adding terms to the model.
• It can help guard against overfitting (including
regressors that are not really useful)
39
© John Wiley & Sons, Inc. Applied Statistics and Probability for Engineers, by Montgomery and Runger.
12-2: Hypothesis Tests in Multiple Linear Regression
12-2.2 Tests on Individual Regression Coefficients and
Subsets of Coefficients
The hypotheses for testing the significance of any
individual regression coefficient:
40

1/27/2018
21
© John Wiley & Sons, Inc. Applied Statistics and Probability for Engineers, by Montgomery and Runger.
12-2: Hypothesis Tests in Multiple Linear Regression
12-2.2 Tests on Individual Regression Coefficients and
Subsets of Coefficients
The test statistic is
• Reject H0 if |t0| > t/2,n-p.
• This is called a partial or marginal test
41
© John Wiley & Sons, Inc. Applied Statistics and Probability for Engineers, by Montgomery and Runger.
12-2: Hypothesis Tests in Multiple Linear Regression
Example 12-4
42

1/27/2018
22
© John Wiley & Sons, Inc. Applied Statistics and Probability for Engineers, by Montgomery and Runger.
12-2: Hypothesis Tests in Multiple Linear Regression
Example 12-4
43
© John Wiley & Sons, Inc. Applied Statistics and Probability for Engineers, by Montgomery and Runger.
12-2: Hypothesis Tests in Multiple Linear Regression
The general regression significance test or the extra
sum of squares method:
We wish to test the hypotheses:
44

1/27/2018
23
© John Wiley & Sons, Inc. Applied Statistics and Probability for Engineers, by Montgomery and Runger.
12-2: Hypothesis Tests in Multiple Linear Regression
A general form of the model can be written:
where X1 represents the columns of X associated with
1 and X2 represents the columns of X associated with
2
45
© John Wiley & Sons, Inc. Applied Statistics and Probability for Engineers, by Montgomery and Runger.
12-2: Hypothesis Tests in Multiple Linear Regression
For the full model:
If H0 is true, the reduced model is
46

1/27/2018
24
© John Wiley & Sons, Inc. Applied Statistics and Probability for Engineers, by Montgomery and Runger.
12-2: Hypothesis Tests in Multiple Linear Regression
The test statistic is:
Reject H0 if f0 > f,r,n-p
The test in Equation (12-32) is often referred to as a
partial F-test
47
© John Wiley & Sons, Inc. Applied Statistics and Probability for Engineers, by Montgomery and Runger.
12-2: Hypothesis Tests in Multiple Linear Regression
Example 12-6
48

1/27/2018
25
© John Wiley & Sons, Inc. Applied Statistics and Probability for Engineers, by Montgomery and Runger.
12-2: Hypothesis Tests in Multiple Linear Regression
Example 12-6
49
© John Wiley & Sons, Inc. Applied Statistics and Probability for Engineers, by Montgomery and Runger.
12-2: Hypothesis Tests in Multiple Linear Regression
Example 12-6
50

1/27/2018
26
© John Wiley & Sons, Inc. Applied Statistics and Probability for Engineers, by Montgomery and Runger.
12-3: Confidence Intervals in Multiple Linear Regression
12-3.1 Confidence Intervals on Individual
Regression Coefficients
Definition
51
© John Wiley & Sons, Inc. Applied Statistics and Probability for Engineers, by Montgomery and Runger.
12-3: Confidence Intervals in Multiple Linear Regression
Example 12-7
52

1/27/2018
27
© John Wiley & Sons, Inc. Applied Statistics and Probability for Engineers, by Montgomery and Runger.
12-3: Confidence Intervals in Multiple Linear Regression
12-3.2 Confidence Interval on the Mean Response
The mean response at a point x0 is estimated by
The variance of the estimated mean response is
53
© John Wiley & Sons, Inc. Applied Statistics and Probability for Engineers, by Montgomery and Runger.
12-3: Confidence Intervals in Multiple Linear Regression
12-3.2 Confidence Interval on the Mean Response
Definition
54

1/27/2018
28
© John Wiley & Sons, Inc. Applied Statistics and Probability for Engineers, by Montgomery and Runger.
12-3: Confidence Intervals in Multiple Linear Regression
Example 12-8
55
© John Wiley & Sons, Inc. Applied Statistics and Probability for Engineers, by Montgomery and Runger.
12-3: Confidence Intervals in Multiple Linear Regression
Example 12-8
56

1/27/2018
29
© John Wiley & Sons, Inc. Applied Statistics and Probability for Engineers, by Montgomery and Runger.
12-4: Prediction of New Observations
A point estimate of the future observation Y0 is
A 100(1-)% prediction interval for this future
observation is
57
© John Wiley & Sons, Inc. Applied Statistics and Probability for Engineers, by Montgomery and Runger.
12-4: Prediction of New Observations
Figure 12-5 An example of extrapolation in multiple regression
58

1/27/2018
30
© John Wiley & Sons, Inc. Applied Statistics and Probability for Engineers, by Montgomery and Runger.
12-4: Prediction of New Observations
Example 12-9
59
© John Wiley & Sons, Inc. Applied Statistics and Probability for Engineers, by Montgomery and Runger.
12-5: Model Adequacy Checking
12-5.1 Residual Analysis
Example 12-10
Figure 12-6 Normal probability plot of residuals
60

1/27/2018
31
© John Wiley & Sons, Inc. Applied Statistics and Probability for Engineers, by Montgomery and Runger.
12-5: Model Adequacy Checking
12-5.1 Residual Analysis
Example 12-10
61
© John Wiley & Sons, Inc. Applied Statistics and Probability for Engineers, by Montgomery and Runger.
12-5: Model Adequacy Checking
12-5.1 Residual Analysis
Example 12-10
Figure 12-7 Plot of residuals
62

1/27/2018
32
© John Wiley & Sons, Inc. Applied Statistics and Probability for Engineers, by Montgomery and Runger.
12-5: Model Adequacy Checking
12-5.1 Residual Analysis
Example 12-10
Figure 12-8 Plot of residuals against x1.
63
© John Wiley & Sons, Inc. Applied Statistics and Probability for Engineers, by Montgomery and Runger.
12-5: Model Adequacy Checking
12-5.1 Residual Analysis
Example 12-10
Figure 12-9 Plot of residuals against x2.
64

1/27/2018
33
© John Wiley & Sons, Inc. Applied Statistics and Probability for Engineers, by Montgomery and Runger.
12-5: Model Adequacy Checking
12-5.1 Residual Analysis
65
© John Wiley & Sons, Inc. Applied Statistics and Probability for Engineers, by Montgomery and Runger.
12-5: Model Adequacy Checking
12-5.1 Residual Analysis
The variance of the ith residual is
66

1/27/2018
34
© John Wiley & Sons, Inc. Applied Statistics and Probability for Engineers, by Montgomery and Runger.
12-5: Model Adequacy Checking
12-5.1 Residual Analysis
67
© John Wiley & Sons, Inc. Applied Statistics and Probability for Engineers, by Montgomery and Runger.
12-5: Model Adequacy Checking
12-5.2 Influential Observations
Figure 12-10 A point that is remote in x-space.
68

1/27/2018
35
© John Wiley & Sons, Inc. Applied Statistics and Probability for Engineers, by Montgomery and Runger.
12-5: Model Adequacy Checking
12-5.2 Influential Observations
Cook’s distance measure
69
© John Wiley & Sons, Inc. Applied Statistics and Probability for Engineers, by Montgomery and Runger.
12-5: Model Adequacy Checking
Example 12-11
70

1/27/2018
36
© John Wiley & Sons, Inc. Applied Statistics and Probability for Engineers, by Montgomery and Runger.
12-5: Model Adequacy Checking
Example 12-11
71
© John Wiley & Sons, Inc. Applied Statistics and Probability for Engineers, by Montgomery and Runger.
12-6: Aspects of Multiple Regression Modeling
12-6.1 Polynomial Regression Models
72

1/27/2018
37
© John Wiley & Sons, Inc. Applied Statistics and Probability for Engineers, by Montgomery and Runger.
12-6: Aspects of Multiple Regression Modeling
Example 12-12
73
© John Wiley & Sons, Inc. Applied Statistics and Probability for Engineers, by Montgomery and Runger.
12-6: Aspects of Multiple Regression Modeling
Example 12-11
Figure 12-11 Data for Example 12-11.
74

1/27/2018
38
© John Wiley & Sons, Inc. Applied Statistics and Probability for Engineers, by Montgomery and Runger.
Example 12-12
75
© John Wiley & Sons, Inc. Applied Statistics and Probability for Engineers, by Montgomery and Runger.
12-6: Aspects of Multiple Regression Modeling
Example 12-12
76

1/27/2018
39
© John Wiley & Sons, Inc. Applied Statistics and Probability for Engineers, by Montgomery and Runger.
12-6: Aspects of Multiple Regression Modeling
12-6.2 Categorical Regressors and Indicator Variables
• Many problems may involve qualitative or
categorical variables.
• The usual method for the different levels of a
qualitative variable is to use indicator variables.
• For example, to introduce the effect of two different
operators into a regression model, we could define an
indicator variable as follows:
77
© John Wiley & Sons, Inc. Applied Statistics and Probability for Engineers, by Montgomery and Runger.
12-6: Aspects of Multiple Regression Modeling
Example 12-13
78

1/27/2018
40
© John Wiley & Sons, Inc. Applied Statistics and Probability for Engineers, by Montgomery and Runger.
12-6: Aspects of Multiple Regression Modeling
Example 12-13
79
© John Wiley & Sons, Inc. Applied Statistics and Probability for Engineers, by Montgomery and Runger.
12-6: Aspects of Multiple Regression Modeling
Example 12-13
80

1/27/2018
41
© John Wiley & Sons, Inc. Applied Statistics and Probability for Engineers, by Montgomery and Runger.
Example 12-12
81
© John Wiley & Sons, Inc. Applied Statistics and Probability for Engineers, by Montgomery and Runger.
12-6: Aspects of Multiple Regression Modeling
Example 12-13
82

1/27/2018
42
© John Wiley & Sons, Inc. Applied Statistics and Probability for Engineers, by Montgomery and Runger.
12-6: Aspects of Multiple Regression Modeling
Example 12-13
83
© John Wiley & Sons, Inc. Applied Statistics and Probability for Engineers, by Montgomery and Runger.
12-6: Aspects of Multiple Regression Modeling
12-6.3 Selection of Variables and Model Building
84

1/27/2018
43
© John Wiley & Sons, Inc. Applied Statistics and Probability for Engineers, by Montgomery and Runger.
12-6: Aspects of Multiple Regression Modeling
12-6.3 Selection of Variables and Model Building
All Possible Regressions – Example 12-14
85
© John Wiley & Sons, Inc. Applied Statistics and Probability for Engineers, by Montgomery and Runger.
12-6: Aspects of Multiple Regression Modeling
12-6.3 Selection of Variables and Model Building
All Possible Regressions – Example 12-14
86

1/27/2018
44
© John Wiley & Sons, Inc. Applied Statistics and Probability for Engineers, by Montgomery and Runger.
12-6: Aspects of Multiple Regression Modeling
12-6.3 Selection of Variables and Model Building
All Possible Regressions – Example 12-14
Figure 12-12 A matrix of Scatter plots from Minitab for the Wine Quality Data.
87
© John Wiley & Sons, Inc. Applied Statistics and Probability for Engineers, by Montgomery and Runger.
88

1/27/2018
45
© John Wiley & Sons, Inc. Applied Statistics and Probability for Engineers, by Montgomery and Runger.
12-6.3: Selection of Variables and Model Building - Stepwise Regression
89
Example 12-14
© John Wiley & Sons, Inc. Applied Statistics and Probability for Engineers, by Montgomery and Runger.
12-6.3: Selection of Variables and Model Building - Backward Regression
90
Example 12-14

1/27/2018
46
© John Wiley & Sons, Inc. Applied Statistics and Probability for Engineers, by Montgomery and Runger.
12-6: Aspects of Multiple Regression Modeling
12-6.4 Multicollinearity
Variance Inflation Factor (VIF)
91
© John Wiley & Sons, Inc. Applied Statistics and Probability for Engineers, by Montgomery and Runger.
12-6: Aspects of Multiple Regression Modeling
12-6.4 Multicollinearity
The presence of multicollinearity can be detected in several
ways. Two of the more easily understood of these are:
92

1/27/2018
47
© John Wiley & Sons, Inc. Applied Statistics and Probability for Engineers, by Montgomery and Runger.
Important Terms & Concepts of Chapter 12
All possible regressions
Analysis of variance test in multiple regression
Categorical variables
Confidence intervals on the mean response
Cp statistic
Extra sum of squares method
Hidden extrapolation
Indicator variables
Inference (test & intervals) on individual model parameters
Influential observations
Model parameters & their interpretation in multiple regression
Multicollinearity
Multiple regression
Outliers
Polynomial regression model
Prediction interval on a future observation
PRESS statistic
Residual analysis & model adequacy checking
Significance of regression
Stepwise regression & related methods
Variance Inflation Factor (VIF)
93